Innovations in Renewable Energy Finance
49
Innovations in Renewable Energy Finance Moderated by Robert Sanders, Senior Finance Advisor, Clean Energy Group August 20, 2013 Clean Energy States Alliance
Transcript of Innovations in Renewable Energy Finance

Innovations in
Renewable Energy Finance
Moderated by
Robert Sanders, Senior Finance Advisor,
Clean Energy Group
August 20, 2013
Clean Energy States Alliance

www.cleanenergystates.org 2
Housekeeping
All participants will be in listen-only mode throughout the broadcast.
You can connect to the audio portion of the webinar using VOIP and your computer’s speakers or USB-type headset. You can also connect by telephone. If by phone, please expand the Audio section of the webinar console to select “Telephone” to see and enter the PIN number shown on there onto your telephone keypad.
You can enter questions for today’s event by typing them into the “Question Box” on the webinar console. We will pose your questions, as time allows, following the presentation.
This webinar is being recorded and will be made available after the event on the CESA website at www.cleanenergystates.org/events/

www.cleanenergystates.org 3
About CESA
Clean Energy States Alliance (CESA) is a national nonprofit organization dedicated to advancing state and local efforts to implement smart clean energy policies, programs, technology innovation, and financing tools to drive increased investment and market making for clean energy technologies.

www.cleanenergystates.org 4
About CESA ITAC
• A collaborative group of state wind incentive programs and utility incentive providers working to create a national unified list of small and medium-sized wind turbines that would be eligible for program funding.
• ITAC evaluates the technical specifications, design, performance characteristics, operational history, and customer support of these turbines.
• ITAC members share best practices information.
Learn more at http://www.cleanenergystates.org/projects/ITAC/
Or email Val Stori, ITAC Project Director, [email protected]

www.cleanenergystates.org 5
Today’s Guest Speakers
• Legal Associate Nihar Shah of United Wind
• Attorney Stephen Pearlman of Inglesino, Pearlman, Wyciskala & Taylor, LLC
Moderator: Robert Sanders, Senior Finance Advisor, Clean Energy Group

6
Contact Info
Robert Sanders Senior Finance Advisor Clean Energy Group [email protected] Val Stori Project Director Clean Energy States Alliance [email protected] www.cleanenergystates.org
Steve B. Pearlman, Esq. Inglesino, Pearlman, Wyciskala & Taylor, LLC [email protected] www.iandplaw.com Nihar Shah Legal Associate United Wind, Inc. [email protected] www.unitedwind.com

Growing Small Wind – Opportunities in Leasing &
Financing
Nihar Shah Legal Associate
United Wind, Inc.
August 20th, 2013

RUSSELL TENCER CEO
TAL MAMO President
• Founder, CEO, Wind Analytics • Over 1,000 wind projects modeled • Former equity fund manager, ETG Trade
• Founder, President, Talco • Built leading US wind turbine distributor • Board Member: DWEA, SWCC
Deep Distributed Wind Energy Experience
United Wind, Inc. Founded 2013
2

Offering first-to-market, little- to no-money down leasing solution for small wind customers
Our vision: Lease a turbine to every suitable property in the United States (approximately 3.5 million)
Solutions for Small Wind
2,400,000 Homes*
700,000 Farms*
400,000 Commercial*
*Suitable US properties based on internally modeled wind speeds, energy prices, expected customer savings, return requirements, and required developer fees
3

State of the Market
4

State of the Market
Source: 2012 Market Report on Wind Technologies in Distributed Applications (DOE) 5

State of the Market
$0
$25
$50
$75
$100
$125
$150
2005 2006 2007 2008 2009 2010 2011
Small Turbine Sales
Mar
ket
Siz
e (
in m
illio
ns)
Sal
es
Pe
ak
Source: 2011 U.S. Small Wind Turbine Market Report 6

State of the Market
$0
$500
$1,000
$1,500
$2,000
$2,500
$3,000
2005 2006 2007 2008 2009 2010 2011 2012 2013(P)
Solar Leasing
Solar Purchases
US
Re
sid
en
tial
So
lar
Mar
ket
(in
Mill
ion
s)
Source: Forbes: How CA is Democratizing Solar for the 99% 7

State of the Market
Source: 2012 Market Report on Wind Technologies in Distributed Applications (DOE) 8

Federal MACRS Depreciation
Investment Tax Credit (ITC)
State Renewable Portfolio Standards
Feed in Tariffs
Sales/Property Tax Exclusions
Cash Grants
Net Metering
Utility Interconnection
Policy Incentives
Source: Power Engineering, Which States Represent the Best Markets for Small Wind?, http://www.power-eng.com/articles/print/volume-115/issue-11/features/which-states-represent-the-best-markets-for-small-wind.html
9

First ever leasing solution for small wind customers
Products include fully prepaid, partial prepaid, and no-money down, 10 to 20 year leases
Includes multiple turbine options, selected for the type of customer, and the historical usage data gathered during due diligence
WindLease™
10

WindLease™
$0.06 kWh
$0.14 kWh
Today 2032(P) 1992 Source: U.S. Energy Information Administration, http://www.eia.gov/cneaf/electricity/page/eia826.htmlhttp://www.eia.gov/cneaf/electricity/page/eia826.html
*Typical farm electricity costs over 10 years, starting year 1 with 3% price escalation
$43,000*
$103,174*
$206,349*
$0.28 kWh
11
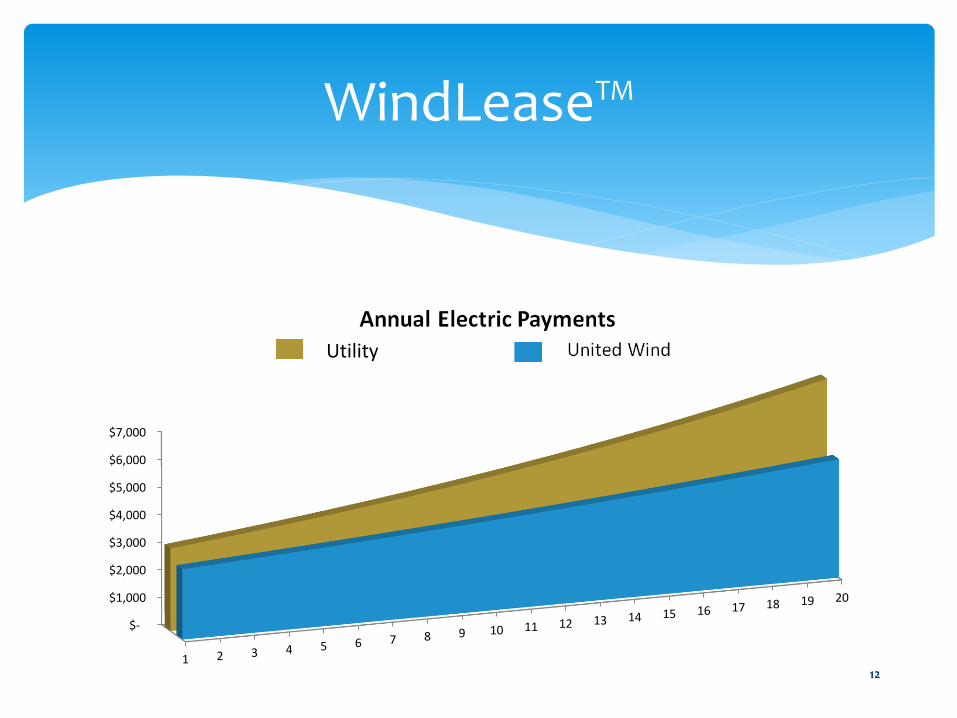
$-
$1,000
$2,000
$3,000
$4,000
$5,000
$6,000
$7,000
1 2 3 4 5 6 7 8 9 10 11 12 13 14 15 16 17 18 19 20
WindLease™
Utility
12

WindLease™
13

Leasing Structures
Third party ownership – must use a “true lease”
Operating (“True”) Lease Capital Lease
End of lease term
At least 20% of value and 20% of useful life remains in system
Ownership transferred to lessee
Purchase option
Never less than FMV at the time of purchase
Can be bargain ($1)
Ownership Lessor always remains the owner
Lessee is the owner
Risks and Benefits
Remains with Lessor (insurance, maintenance etc.)
All transferred to Lessee
14

What is Tax Equity?
IRS has determined only the subset of taxpayers with “passive” income may take advantage of federal Investment tax Credit
503(c) and governmental entities unable to claim ITC
Most developers do not have their own passive income, so they “sell” the tax credits to third parties who can claim the ITC for a reduced price (ex. $1 in real dollars for $1.20 in tax credits)
Financing Structures
15

Financing Structures
Source: Renewable Energy Project Finance in the U.S.: 2010-2013 Overview and Future Outlook, Mintz Levin Cohn Ferris Glovsky and Popeo PC
Utility Scale Sale-Leaseback Model
16

Financing Structures
WindLease™ Sale-Leaseback Model
Property Owner
Project Tax Lessor
Project Developer
Lease
Electricity
Collateral
Equipment Sale
ITC, MACRS
De
velo
pm
en
t
17

Who is providing tax equity?
Financing Small Wind – Tax Equity
Source: Woodlawn Associates, Tax Equity 101: Structures, http://www.woodlawnassociates.com/tax-equity-101/ 18

Applying the Morris Model
Financing Small Wind – Bond Strategies
Wind
19

Private Activity Bonds (PABs)
Financing Small Wind – Bond Strategies
Source: Orrick, Tax-Subsidized Financing Options for Energy Projects and Programs 20
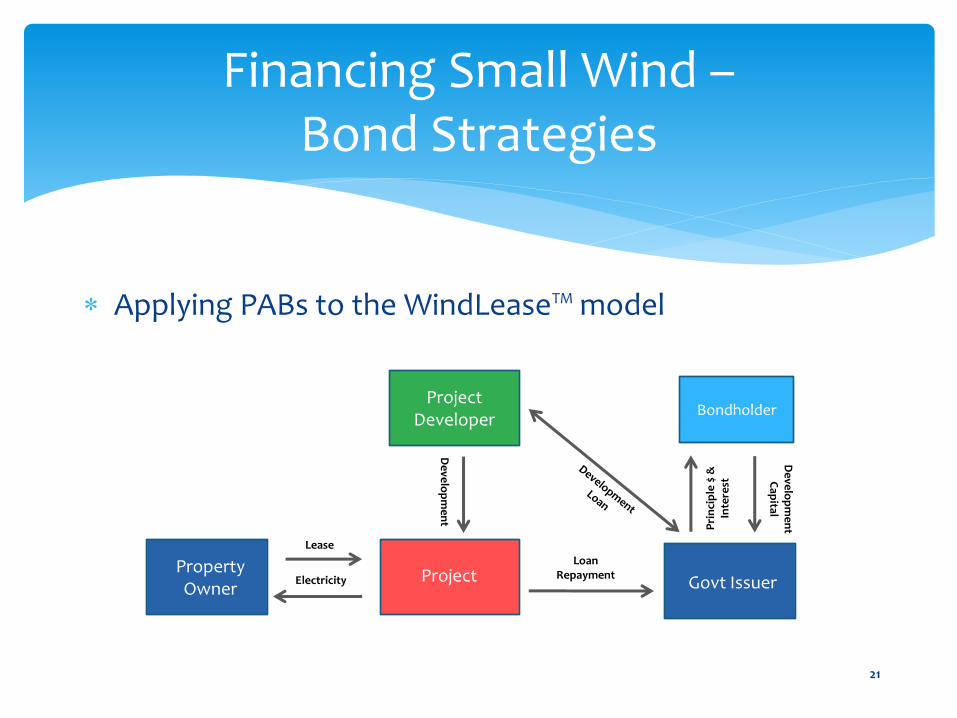
Applying PABs to the WindLease™ model
Financing Small Wind – Bond Strategies
Property Owner
Project Govt Issuer
Project Developer
Lease
Electricity
Loan Repayment
De
velo
pm
en
t
Bondholder
De
velo
pm
en
t C
apital
Pri
nci
ple
$ &
In
tere
st
21

Clean Renewable Energy Bonds (CREBs)
Financing Small Wind – A Case Study in CREBs
Bond Holder
Project
Issuer (Project Developer)
Principle ($)
Development Capital ($)
$
Federal Gov’t
Tax Credits (in lieu of interest)
22
Why didn’t it work?
Interest rates on tax credits not competitive with bond market
Size of program too limited for utility-scale, too onerous for distributed scale
Transaction costs could reach $3million for a $10million project
Award process mired with uncertainty
Financing Small Wind – A Case Study in CREBs
23

Some successful bond policies have included: State-level backup of municipalities with sub-AA credit rating
Streamlined application and interest payment process
Multi-year funding guarantee, to make the money “bankable” to project investors
Successful state policies have included: DG carve-out in state RPS
Required interconnection and permitting rules
Change to production based incentive standards (as opposed to capacity based)
Challenging the Public Market
24

Key questions for policymakers:
What types of activities, and changes, do developers need to achieve to access existing types of government-supported financing?
What areas of emphasis need to be strengthened to help policymakers decide on opening new avenues of financing?
Challenging the Public Market
25

Questions and Comments
Thank you!
Nihar Shah Legal Associate
United Wind, Inc. [email protected]
SPECIAL THANKS
Jack Murray
Kyle Andrucyk
26

SAVING WITH SOLAR:
UNDERSTANDING RETAIL SOLAR
POWER PURCHASE AGREEMENTS
August 20, 2013 WEBINAR
RENEWABLE ENERGY FINANCE

SOLAR POWER PURCHASE AGREEMENT
(PPA)
• Advantages: • Turnkey, private solar developer
• Includes Financing and O&M
• Developer tax incentives embedded in PPA Price.
• Disadvantages: • PPA pricing sub-optimal (most financing benefits to
developer)
• Potential Risks in PPA (due to gov’t action / inaction)
• FMV purchase at end of term, if term < useful life (not nominal, due to tax law)
2

PPA RISKS
• Downtime (lost PPA price + SRECs + Profit, regardless of fault)
• Security obligation on Government
• Performance Guaranty from Solar Developer?
• Higher Rated Government Payment Guaranty?
• Limitation on Real Property Options (mortgaging, lease, disposition)
• Early Termination Penalties (benefit of bargain)
3
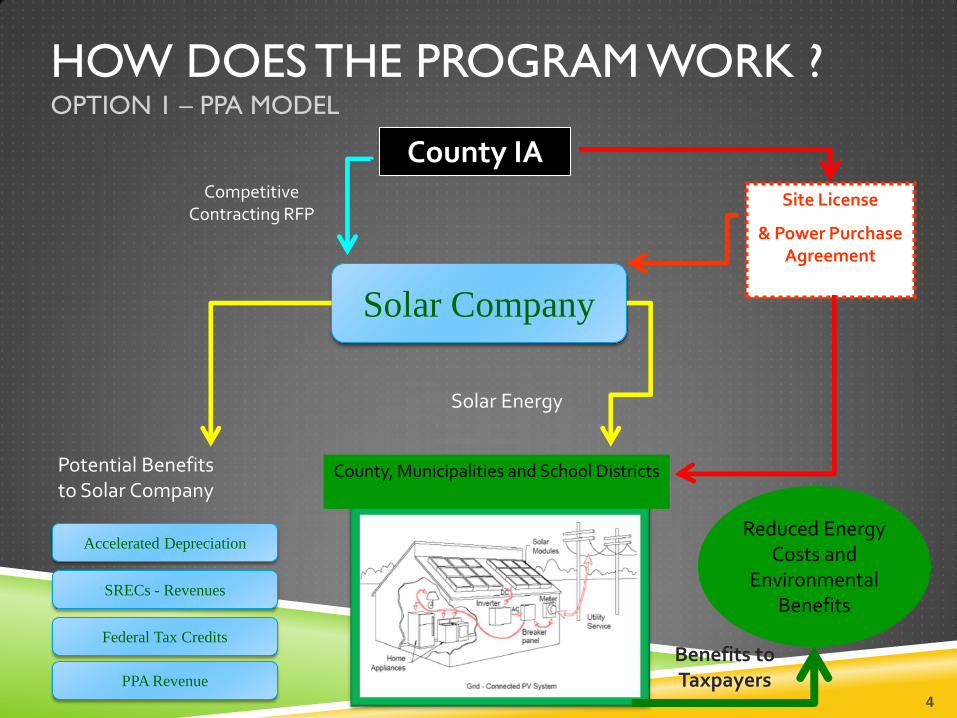
HOW DOES THE PROGRAM WORK ? OPTION 1 – PPA MODEL
County, Municipalities and School Districts
Solar Company
Accelerated Depreciation
SRECs - Revenues
Federal Tax Credits
PPA Revenue
Reduced Energy Costs and
Environmental Benefits
Potential Benefits to Solar Company
Benefits to Taxpayers
Solar Energy
Site License
& Power Purchase Agreement
Competitive Contracting RFP
County IA
4

HOW DOES THE PROGRAM WORK ? OPTIONS 2 HYBRID STRUCTURE
County
County, Municipalities and School Districts
Solar Company
Accelerated Depreciation
SRECs - Revenues
Federal Tax Credits
PPA Revenue
Reduced Energy Costs and
Environmental Benefits
Benefits to Taxpayers
Potential Benefits to Solar
Company
Guarantee Bonds
Bond Financing
Security Package To County
(eg. cash, parent company
guarantee, L/C)
or eliminate deficiency
Power Purchase
Solar Energy
Debt Service less SRECS $
less PPA $ = Unsecured debt
(aka: County Security Amount)
County IA
Lease
License
5

SAMPLE SOLAR DEVELOPER
PROCUREMENT CRITERIA
PPA Price – Economic Benefit Developer Approach to Comply with RFP Requirements, including Technical
Specs Developer Ability to Deliver Turnkey Project, including O&M Experience – Contracts of Similar Size and Scope Management – Key Personnel and Knowledge of Applicable Laws/Regs Logistics of Implementing Plan (1 year construction – multiple sites) Financial Strength (single purpose entity – guarantor) Construction Security (amount and strength) Funding of Deficiency (Developer default, left w/ PPA and SREC – amount
and strength) Material Changes to Posted Documents Proposed? Other Economic Benefits Proposed? Restoration Security Included? (option to guaranty roofs restored at end)
6

BENEFITS OF HYBRID – REGIONAL
APPROACH
Benefits of these Solar Renewable Energy Programs
• No cost of solar feasibility study to local units
• Lower cost of project installation through aggregated county-wide RFP
• Better pricing of the PPA
• Ability for smaller facilities to take part in a PPA
• Budget certainty
• Compliance with local procurement regulations
7

CASE STUDY – PILOT MORRIS COUNTY IMPROVEMENT AUTHORITY
SOLAR RENEWABLE ENERGY PROGRAM – CLOSED ON FEBRUARY 18, 2010
• 3.2 MW from 19 facilities for 7 local unit governments
• Bond Pricing with AAA County Guaranty, 4.46%
• PPA Pricing: $0.106 / kWh the first year
• 3% escalation, PPA Price in year 15 = $0.16 / kWh (approximately
today’s market price!)
• 15 year PPA
• Sharing of 35% of SRECs if value over $200 / SREC in years 11-15
• Market Price of SRECs today over $600 / SREC in spot market
• 35% Average Savings / Local Unit
8

CASE STUDY SOMERSET COUNTY IMPROVEMENT AUTHORITY
SOLAR RENEWABLE ENERGY PROGRAM – CLOSED NOVEMBER 2010
• 7.6 MW from 31 facilities for 15 local unit governments
• Low Cost Financing Bond Pricing with AAA County Guaranty,
• 3.9%, 15 year maturity
• PPA Price: $0.048 cents/kWh
• 2.75% escalation, PPA Price in year 15 = ~ $0.07(half of present rate)
• 15 year PPA
• 60% savings off of 15/16 cent/kWh utility rate
9
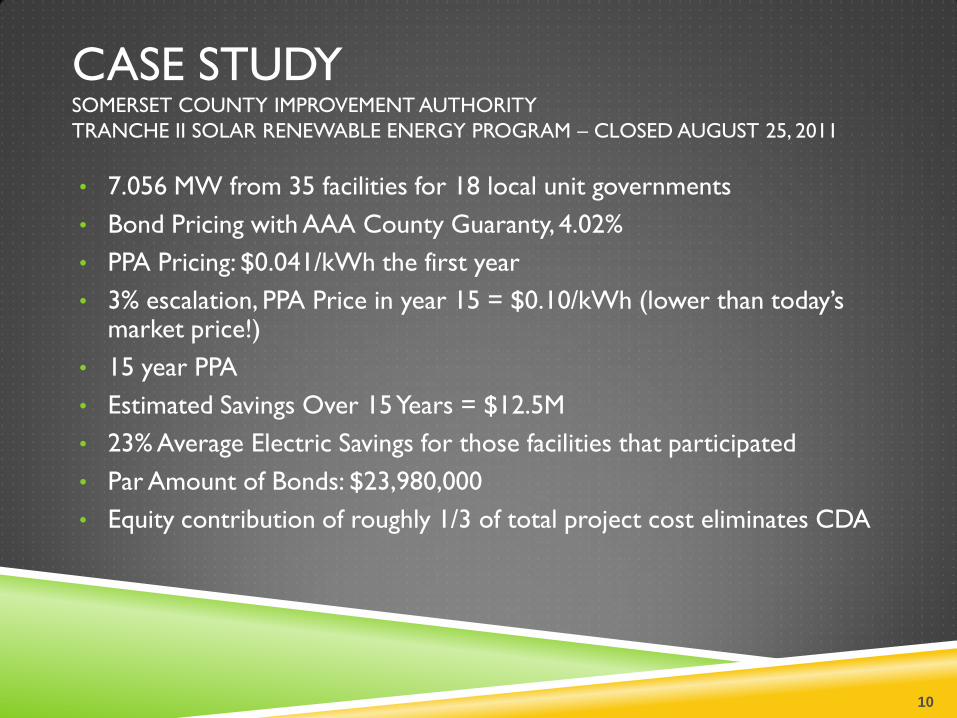
CASE STUDY SOMERSET COUNTY IMPROVEMENT AUTHORITY
TRANCHE II SOLAR RENEWABLE ENERGY PROGRAM – CLOSED AUGUST 25, 2011
• 7.056 MW from 35 facilities for 18 local unit governments
• Bond Pricing with AAA County Guaranty, 4.02%
• PPA Pricing: $0.041/kWh the first year
• 3% escalation, PPA Price in year 15 = $0.10/kWh (lower than today’s market price!)
• 15 year PPA
• Estimated Savings Over 15 Years = $12.5M
• 23% Average Electric Savings for those facilities that participated
• Par Amount of Bonds: $23,980,000
• Equity contribution of roughly 1/3 of total project cost eliminates CDA
10

CASE STUDY MORRIS COUNTY IMPROVEMENT AUTHORITY
TRANCHE II SOLAR RENEWABLE ENERGY PROGRAM – CLOSED DECEMBER 8, 2011
• 8.598 MW from 24 facilities for 10 local unit governments
• PPA Pricing: $0.075 cents/kWh the first year
• 3% escalation, PPA Price in year 15 = $0.113/kWh (lower than today’s
market PPA!)
• 15 year PPA
• Estimated Savings Over 15 Years = $7.9M
• 35% Average Electric Savings for those facilities that participated
• Equity contribution of roughly 1/3 of total project cost eliminates CDA
11

CASE STUDY MORRIS COUNTY IMPROVEMENT AUTHORITY – SUSSEX COUNTY
SOLAR RENEWABLE ENERGY PROGRAM – CLOSED DECEMBER 2011
• 6.9 MW from 20 facilities for 12 local unit governments
• PPA Pricing: $0.0935 cents/kWh the first year
• 3% escalation, PPA Price in year 15 = $0.15/kWh (lower than today’s
market PPA!)
• 15 year PPA
• Estimated Savings Over 15 Years = $5.5M
• 32% Average Electric Savings for those facilities that participated
• Equity contribution of roughly 1/3 of total project cost eliminates CDA
12

LESSONS LEARNED
• Local Unit Commitment at all Steps
• Potential Closing of Local Unit Facilities in the Future
• Roof Warranties
• System Size & Regionality
• Solar Developer Experience and Balance Sheet
• Balance Maximum Savings with Minimal County Risk
• Building Inspectors and DOE Long Range Plan Updates
• Monitor SREC benefits
13

HYBRID MODEL – OTHER STATES?
• 4 Essential Laws Required
• Energy Law (sufficient RPS – in NJ, SRECs can be 40% of subsidy)
• Bond Law (streamlined approval v. voter requirement)
• Local Public Contracts Law (multi-year contracting for 15 or more years of PPA
• Procurement Law (competitive process v. low bid v. negotiation)
• Regional Approach
• State or County
• Group purchasing power and amortize soft costs
• Deep Pocket Required
• Conduit Issuer and General Obligation Guarantor
• Dedicated Revenue Stream (e.g. sales tax)
14

FOLLOW-UP TO MORRIS MODEL
• Advantages and Disadvantages
• Target Market for Morris Model
• Replication of Morris Model
• Adoptability of Morris Model and other Clean Energy Technologies and
Market Sectors (e.g., UMTC for 501(c)(3))
• Government Issues with Guarantying Government
• Compatibility with other Financing Models (e.g. Capital Stack and in kind
equity)
15

CONTACT INFORMATION
For any further questions, please contact:
Steve B. Pearlman, Esq. Inglesino, Pearlman, Wyciskala & Taylor, LLC 600 Parsippany Road, Parsippany, NJ 07054-3715 (973) 947-7133 [email protected] www.iandplaw.com Adam L. Peterson, law clerk Inglesino, Pearlman, Wyciskala & Taylor, LLC 600 Parsippany Road, Parsippany, NJ 07054-3715 (973) 947-7111 [email protected] www.iandplaw.com
16

Thank You!
Summary and Questions
17