InnovationBG 2007
13
109 INNOVATION ION . BG . BG G pendix 1. Innovation profile of the App Bulgarian enterprises
-
Upload
hristo-hristov -
Category
Documents
-
view
212 -
download
0
description
During recent years the Bulgarian economy showed clear signs of stabilization and growth. The main macroeconomic indicators GDP, foreign direct investment and currency reserves increase at sustainable rates. Unemployment decreases and the private sector started unfolding its potential. In this situation the key future challenge for Bulgaria is the increase of economic competitiveness. The main factor for achieving higher competitiveness, at which the EU policy is also directed, are investments in innovation.
Transcript of InnovationBG 2007

109I N N OVAT I O NI N N OVAT I O N . B G. B G. B G
Appendix 1. Innovation profile of the Appendix 1. Innovation profile of the Appendix 1. Innovation profile of the Bulgarian enterprises Bulgarian enterprises Bulgarian enterprises Bulgarian enterprises
110
Innovation profile101
During recent years the Bulgarian economy showed clear signs of stabilization
and growth. The main macroeconomic indicators GDP, foreign direct investment
and currency reserves increase at sustainable rates. Unemployment decreases
and the private sector started unfolding its potential. In this situation the key
future challenge for Bulgaria is the increase of economic competitiveness. The
main factor for achieving higher competitiveness, at which the EU policy is also
directed, are investments in innovation.
For tracing out the innovative structure of the Bulgarian economy this section
outlines the innovation profile of the Bulgarian enterprises. The profile is based
primarily on the empirical data collected in 2004 and 2006 through a survey
of the enterprises following the Community Innovation Survey model. In the
process of work several variables, which characterize the current status and the
potential development of the Bulgarian national innovation system were identi-
fied. These nine variables are:
• Provision of innovative products on the market;
• Development of innovative products;
• Provision of innovative processes on the market;
• Development of innovation processes;
• Funding of the innovation activity of the companies;
• Significance of the realized innovative activities for the company;
• Governmental support for the development of the innovative activity of the
companies;
• Factors, impeding the companies’ innovative activity;
• Reasons for the lack of innovative activity.
The empirical data collected by surveys, conducted by Vitosha Research agency
under assignment by the Innovation Relay Centre in 2004 and 2006 allows the
review of the dynamics of the selected nine indicators for the past two years.
Companies, which have implemented innovative processes or products in 2006
are 19.2%102 of all enterprises in the country. The survey in 2004 revealed that
the innovative enterprises in the country develop predominantly product inno-
vations, with a smaller number of process innovations. In comparison, the data
on the EU companies reveal an opposite tendency. The prevailing part of Euro-
pean businesses supplies mixed innovations. In this respect there is also a clear
move in Bulgaria towards an increase of process innovations – 10.1% in 2004,
11.8% in 2006 of the enterprises implemented process innovations.
The innovation activity of Bulgarian companies varies depending on their size
according to number of their employees. In microfirms (less than 10 employees),
the number of product innovations is three times less than in big firms (more than
250 employees), and for the process innovations this ratio increases up to 1 to 4.
101 This analysis is an endeavor for a more complex statistical study of the innovative activity of the Bulgarian enterprises. It is based primarily on empirical data from two surveys conducted by Vitosha Research in 2004 and 2006 and commissioned by the Innovation Relay Centre at the Applied Research and Communications Fund. Since they are pilot surveys the results and the conclusions are still under discussion and they are not directly comparable with the conclusions drawn in the main body of this publication. They aim to develop the toolkit for analysis of the innovativeness of the Bulgarian enterprises, to facilitate the discussion and as a preparation for the Innovation.bg 2008 report.
102 Calculated on the basis of firms giving an answer ‘YES’ to at least one of the questions: ‘Has your firm supplied the market with innovation (new or considerably improved) products (goods or services) in 2005?’ and ‘Has your firm introduced innovation (new or considerably improved) production methods for supply or sale of goods and services, that are new for the firm or the industry in 2005?’

111I N N OVAT I O NI N N OVAT I O N . B G. B G. B G
The Bulgarian enterprises still do not perceive the business environment as
friendly for the development of innovation products and processes. Most of the
Bulgarian innovatice companies develop innovations, which they define as new
only for the firm itself, i.e. the innovation activity of the enterprises is oriented
to products already existing on the market. While this might be a symptom of
investment in effectiveness it does not bode well for the innovation potential of
the companies. The number of innovations, which are a novelty for the domestic
and/or the international market, is much smaller. The development of innovative
products and processes in the country is done primarily by the firms themselves.
The majority of Bulgarian firms with lower turnover develop their innovation
products and processes by themselves (as their size precludes them from levera-
ging outside resources), while companies with annual turnover exceeding BGN
2 000 000 are oriented towards cooperation with foreign partners.
FIGURE 87. THE INNOVATION PYRAMID OF THE BULGARIAN ENTERPRISES (%)
Source: Vitosha Research, Applied Research and Communications Fund, 2006.
25.6
10.1
25.011.8
17.2
19.2
Innovative firms (total)
Product innovators
2003
2005
Process innovators
FIGURE 88. INNOVATION RADAR OF THE BULGARIAN ENTERPRISES – 2006 (%)
Source: Vitosha Research, Applied Research and Communications Fund, 2006.
17.2
11.8
30.4
5.7
31.6
53.962.7
63.3
65.3
Innovation product developedInnovation product developedmostly by the firm
Innovation product developedInnovation product developedmostly by the firm
Own resources of the firmIncrease in the quality of goodsand services
Direct costs for innovationsDirect costs for innovationstoo high
It was unnecessary as marketIt was unnecessary as marketconditions did not require it
Development ofinnovation products
Funding of the innovationactivities of the firm
Significance of realizedinnovation activitiesfor the firm
Reasons for absence ofinnovation activity
Factors,hampering theinnovationactivity ofthe firm
Development ofinnovation processes
Product innovators
Process innovators
Government support for thedevelopment of innovation
activity in firms
112
Another variable defining the innovation profile of the Bulgarian firms is the
funding of their innovation activity. As the development of innovations in
Bulgaria is concentrated in the individual firm, not surprisingly the funding
of innovations in most of the Bulgarian companies is done mainly with own
financing. Therefore, cooperation with local and foreign organizations should
be defined as a priority area for the national innovation policy. Another area,
which badly needs attention, is the stabilization and improvement of the links
between science and business. Currently almost 70 % of the Bulgarian innovative
firms declare lack of cooperation with science organizations.
Bulgaria’s accession to the European Union imposes requirements for the
introduction of European and international quality standards by the Bulgarian
companies. Hence innovations in Bulgarian firms are often directly related to
meeting standards. Between 2004 and 2006 the number of Bulgarian companies,
which implemented standard related innovations grew by more than 10 p.p.
In 2006, 5.7% of the innovative firms in Bulgaria have received government
support for their innovative activity. The National Innovation Fund has supported
half of them. The rest of the firms have received support from various European
programs, such as the Sixth Framework Program, Eureka, etc. Government
support has reached primarily firms with a high annual turnover – over BGN
500 000, i.e. big enterprises by Bulgarian standards. Considering the fact that
more than 90% of the Bulgarian firms are micro or small, they have been left
out of the government’s support schemes. Therefore, it might be better for the
Bulgarian government to focus more funds for the development of innovation
activities in smaller companies, as enterprises with high turnover can fund their
innovation activity on the commercial market.
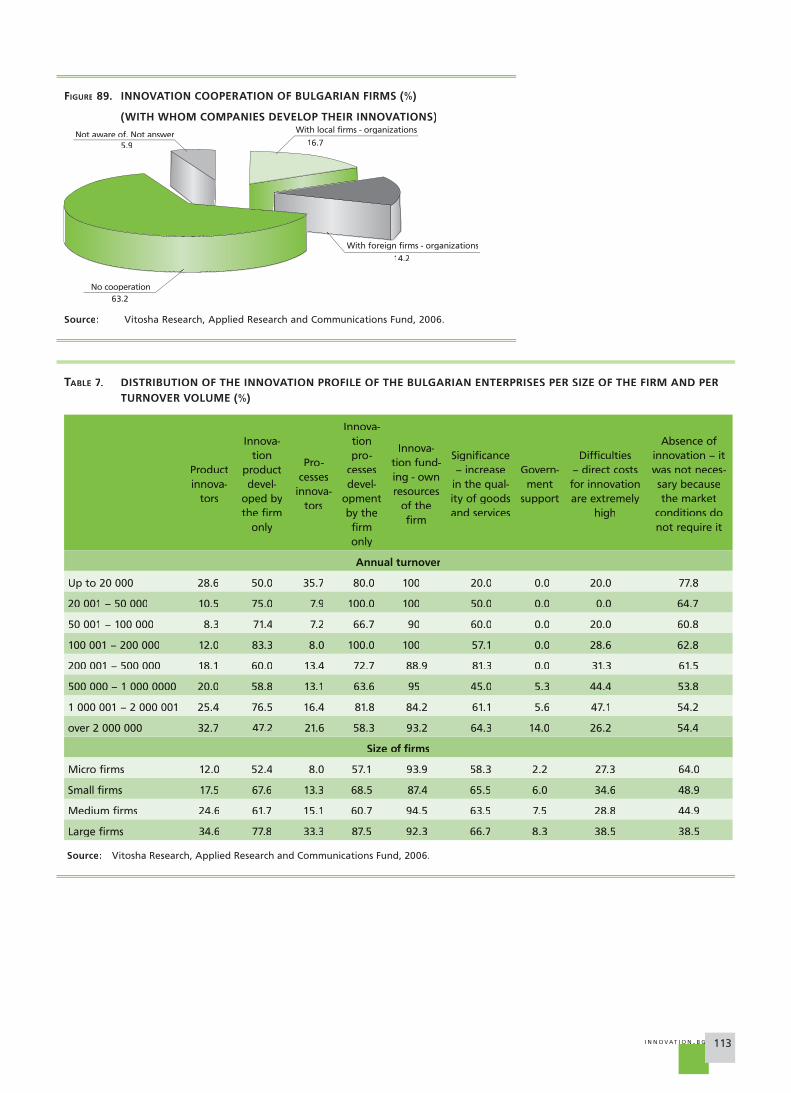
In 2006 the innovative enterprises in Bulgaria single out the too high costs of
innovation as the biggest barrier to their innovation activity. In comparison, in
2004, the factor, which hampered innovative companies to the highest degree,
was the absence of financing. In addition, many Bulgarian innovative firms
define the absence of a clear government policy in the innovation domain as
one of the leading barriers to innovation activity – 31.5%.
Non-innovative Bulgarian companies complete the picture of the innovation
activity of the firms in the country. They comprise 80% of all Bulgarian firms.
The primary reason they point out for not developing innovations is the lack
of necessity for market oriented innovations. According to the Bulgarian non-
innovative companies the market conditions in the country do not require
innovation. There is a clear innovation divide between the small and the large
firms in the country. Most of the microfirms (64%) have not introduced innovative
products or processes during the last year, while in the large firms this share is
almost twice lower (38.5%).
The EU accession and the integration of the Bulgarian economy with those of the
other Member States should be used by the Bulgarian government as a catalyst
for the development of the innovation activity of the firms in the country. The
market enlargement may prompt the break in the capsulated way of creating
market oriented new products and processes in Bulgarian companies and may
lead to an increased cooperation between organizations and scientific institutes.
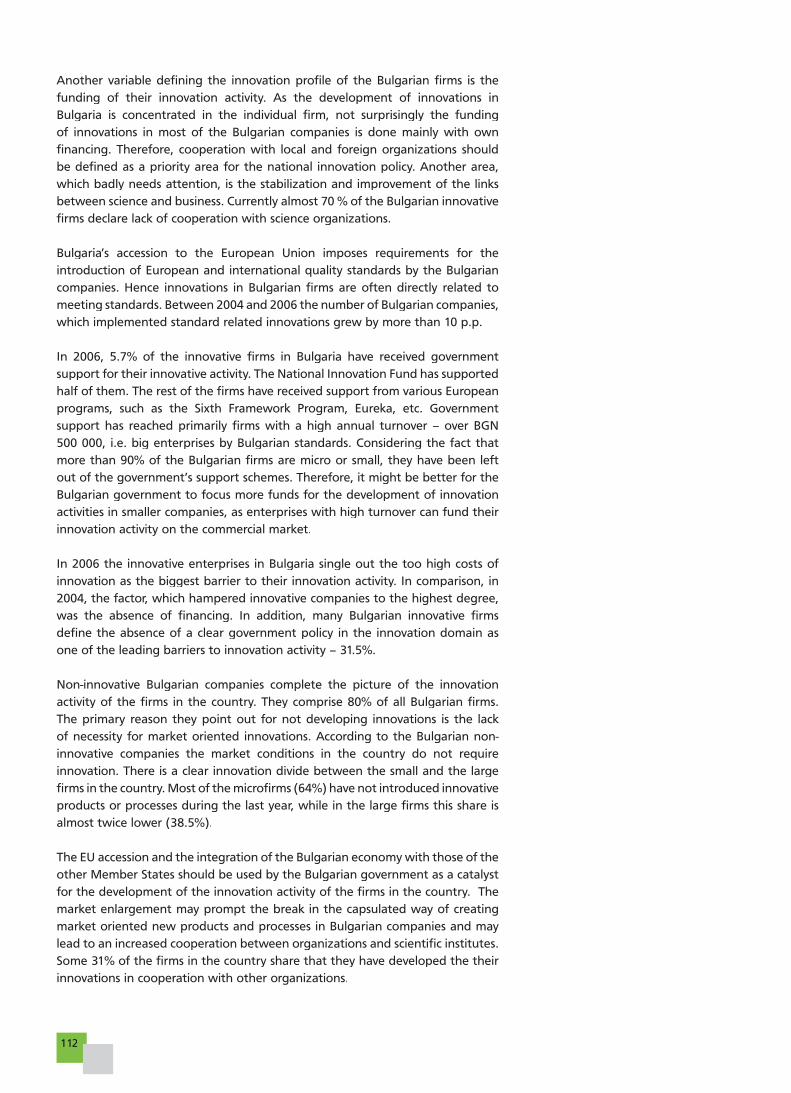
Some 31% of the firms in the country share that they have developed the their
innovations in cooperation with other organizations.
113I N N OVAT I O NI N N OVAT I O N . B G. B G. B G
FIGURE 89. INNOVATION COOPERATION OF BULGARIAN FIRMS (%)
(WITH WHOM COMPANIES DEVELOP THEIR INNOVATIONS)
Source: Vitosha Research, Applied Research and Communications Fund, 2006.
14.2
63.2
5.9 16.7
With local firms - organizations
With foreign firms - organizations
No cooperation
Not aware of. Not answer
TABLE 7. DISTRIBUTION OF THE INNOVATION PROFILE OF THE BULGARIAN ENTERPRISES PER SIZE OF THE FIRM AND PER TURNOVER VOLUME (%)
Product innova-
tors
Innova-tion
product devel-
oped by the firm
only
Pro-cesses innova-
tors
Innova-tion pro-
cesses devel-
opment by the firm only
Innova-tion fund-ing - own resources
of the firm
Significance – increase
in the qual-ity of goods and services
Govern-ment
support
Difficulties – direct costs for innovation are extremely
high
Absence of innovation – it was not neces-sary because the market
conditions do not require it
Annual turnover
Up to 20 000 28.6 50.0 35.7 80.0 100 20.0 0.0 20.0 77.8
20 001 – 50 000 10.5 75.0 7.9 100.0 100 50.0 0.0 0.0 64.7
50 001 – 100 000 8.3 71.4 7.2 66.7 90 60.0 0.0 20.0 60.8
100 001 – 200 000 12.0 83.3 8.0 100.0 100 57.1 0.0 28.6 62.8
200 001 – 500 000 18.1 60.0 13.4 72.7 88.9 81.3 0.0 31.3 61.5
500 000 – 1 000 0000 20.0 58.8 13.1 63.6 95 45.0 5.3 44.4 53.8
1 000 001 – 2 000 001 25.4 76.5 16.4 81.8 84.2 61.1 5.6 47.1 54.2
over 2 000 000 32.7 47.2 21.6 58.3 93.2 64.3 14.0 26.2 54.4
Size of firms
Micro firms 12.0 52.4 8.0 57.1 93.9 58.3 2.2 27.3 64.0
Small firms 17.5 67.6 13.3 68.5 87.4 65.5 6.0 34.6 48.9
Medium firms 24.6 61.7 15.1 60.7 94.5 63.5 7.5 28.8 44.9
Large firms 34.6 77.8 33.3 87.5 92.3 66.7 8.3 38.5 38.5
Source: Vitosha Research, Applied Research and Communications Fund, 2006.
114
Cluster analysis
The innovation development of Bulgaria depends on various economical factors
on micro and macro level. For the outline of a more complete and clear pic-
ture of the Bulgarian innovation potential, the standard statistical and empirical
indicators and analytic techniques have limited value as they study the isolated
influence of individual factors. The classification of the elements of an aggregate
on the basis of multiple indications would have a higher cognitive significance.
Therefore, for the purposes of the analysis it is appropriate to apply summarizing
multi criteria statistical methods as the cluster-analysis103.
For the purposes of the cluster analysis part of the survey variables used until
now have been replaced. The variable-factors selected for the cluster analysis
are:
FIGURE 90. FACTORS, HAMPERING THE INNOVATION ACTIVITY OF THE BULGARIAN FIRMS (%)
Source: Vitosha Research, Applied Research and Communications Fund, 2006.
2.9
3.4
4.9
4.9
7.4
11.8
17.6
18.1
21.6
31.5
11.7
11.3
9.6
13.4
12.7
25.4
34.4
38.1
33.3
31.6
39.9
30.5
13.4
19.6
0 5 10 15 20 25 30 35 40 45
Organizational obstacles in the firm
Absence information on markets
Absence information on technologies
Absence of customers interest in
new goods and services
Problems in finding partners for
innovation activity
Absence of qualified personnel
Impact of the national law
and standarts
Absence of secure protection of
intellectual property
2006
2004
Extremely high economic risk
Absence of clear government
policy in the sphere of innovations
Absence of funding resources
Direct costs for innovations
are extremely high
103 It gives the opportunity to focus the attention on a certain number of groups and to compare their development as per specific factors. In its essence the cluster analysis represents a sequence of practical calculation procedures, grouping n number of observed units or objects in k number of groups-clusters, using k number of groups-clusters, using k p number of criteria. The objects assigned to each cluster are similar to each other and differ from those, grouped in the other clusters.

115I N N OVAT I O NI N N OVAT I O N . B G. B G. B G
• Market supply of innovation products or processes;
• Expression of the innovation activity of the firm;
• Annual spending for capital investment of the firm for 2006;
• Amount of spending on innovation activity - % of turnover;
• Sources of funding of the innovation activity of firms;
• Government support in the development of innovation activity in the firms;
• Main market of firms;
• Size of firms as per number of employees;
• Main sector of activity of firms.
Due to the non-homogeneity of the observed variables and the initial stage of
development of the Bulgarian national innovation system it was necessary to
preliminarily define/assume the expected number of clusters. The variety in the
methods and means for innovation activities implies that without prior limitation
of cluster groups, a great number of clusters would be formed, containing a
small number of firms, which would hamper the analysis’ reliability. On the basis
of preliminary tests the number of clusters was determined at 6, which allowed
carrying out the analysis as completely as possible and to present accurate and
adequate data104. The higher number of groups allows for the factors chosen for
the analysis to display their diversity to a higher degree.
The cluster analysis included 89 of the surveyed firms. It divided the observed
total in three groups. Despite the small number of innovative products and
processes introduced on the market by the companies in the past year, the
innovation activity of the firms in all clusters has undergone positive develop-
ment. The second cluster is the largest. It groups most of the firms used in the
analysis. The innovation activity of companies in this cluster is characterized by
R&D provided by other firms. This observation confirms the finding that most of
the Bulgarian innovative firms adopt existing innovations in order to improve the
effectiveness of their business and do not create their own innovative products.
The amount of spending on innovation development in this cluster is between
6% and 10% of their annual turnover. This group illustrates the specifics of most
of the firms in the country and reveals that the innovation activity is dependant
on the size of the firm. Firms in this cluster self-funding their innovation acti-
vity. They belong to production and distribution, and their main market is the
national one.
A smaller number of firms are concentrated in the third cluster. Firms in this
group are similar to these in cluster 2. The specifics of this cluster are in the
high spending on investment in innovation. Most of the firms in the group have
declared that they are spending over 40% of their turnover on innovation.
Despite the smaller number of firms found in this group, it can be defined as the
most innovative in comparison with the rest.
The fifth cluster consists mainly of small firms with 11 to 50 employees and
working on regional markets (within 100 km from their facilities). This group
differs from the second and the third cluster with the investments its members
companies made in training of personnel directly related to innovations in 2006.
The defining factor for this characteristic feature can be traced down to the
main sector of operation of the companies in the cluster – tourism, in which the
quality of the personnel is most directly related to revenues.
104 This is the place to note that this particular number of clusters makes sense only for the data received from this research and in its repeated realization there is a high probability to be inadequate.

116
ÒÀB
LE8
.R
ESU
LTS
OF
TH
E C
LUSTER
AN
ALY
SIS
OF
BU
LGA
RIA
N I
NN
OV
ATIV
E FI
RM
S (F
INA
L C
LUSTER
CEN
TER
S)
Clu
ster
Fact
ors
12
34
56
Mar
ket
sup
ply
of
inn
ova
tio
n p
rod
uct
s or
pro
cess
esYe
sYe
sYe
sYe
sYe
sYe
s
Exp
ress
ion
of
the
inn
ova
tio
n a
ctiv
ity
of
the
firm
Acq
uis
itio
n o
f m
ach
ines
an
d e
qu
ipm
ent
rela
ted
to
in
nova
tio
n
R&
D p
rovi
ded
by
ano
ther
fir
mR
&D
pro
vid
ed b
y an
oth
er f
irm
Acq
uis
itio
n o
f in
tan
gib
le a
sset
s
Trai
nin
g o
f p
erso
nn
el
exp
licit
ly r
elat
ed t
o
inn
ova
tio
nM
arke
tin
g a
ctiv
itie
s
An
nual
sp
end
ing
on
cap
ital
inve
stm
ent
of
the
firm
for
2006
50
000 –
10
0 0
00
100
001
–
200 0
0150
000 –
10
0 0
00
200
001
–
500 0
0120
001
–
50 0
00
100
001
–
200 0
00
Am
ou
nt
of
spen
din
g o
n in
nova
tio
n a
ctiv
ity
- %
of
turn
ove
r31
% –
40 %
6 %
– 1
0 %
Ove
r40 %
11 %
– 2
0 %
11 %
– 2
0 %
Ove
r 4
0%
Sou
rces
of
fun
din
g o
f th
e in
nova
tio
n
acti
vity
of
firm
sO
ther
Ow
n s
ou
rces
of
the
firm
Ow
n s
ou
rces
of
the
firm
EU f
un
ds
and
p
rog
ram
sO
wn
so
urc
es o
f th
e fi
rmO
wn
so
urc
es o
f th
e fi
rm
Go
vern
men
t su
pp
ort
in t
he
dev
elo
pm
ent
of
inn
ova
tio
n a
ctiv
ity
No
No
No
Yes
No
No
Mai
n m
arke
t o
f fi
rms
Nat
ion
alN
atio
nal
Nat
ion
alReg
ion
alReg
ion
alReg
ion
al
Size
of
firm
s as
per
nu
mb
er o
f em
plo
yees
51-2
50
51-2
50
51-2
50
51-2
50
11-
50
51-2
50
Mai
n s
ecto
r o
f ac
tivi
ty o
f fi
rms
Rea
l est
ate
op
erat
ion
s,
leas
ing
act
ivit
y an
d
bu
sin
ess
serv
ices
Pro
duct
ion
an
d
dis
trib
uti
on
Pro
duct
ion
an
d
dis
trib
uti
on
Pro
cess
ing
in
du
stry
Ho
tels
an
d r
esta
ura
nts
Pro
duct
ion
an
d
dis
trib
uti
on
So
urc
e:
Vit
osh
a R
ese
arch
, A
pp
lied
Rese
arch
an
d C
om
mu
nic
ati
on
s Fu
nd
, 20
06.

117I N N OVAT I O NI N N OVAT I O N . B G. B G. B G
All but one cluster report no government support. Only less than 6% of all com-
panies have received financial help from the state in the development of their
innovations. Most of the clusters indicate that the innovation activity performed
by the companies is primarily related to the acquisition of machines and equip-
ment for the development of new market oriented products along with R&D
provided by another firm. This demonstrates that the level of development and
introduction of innovative products and processes by the Bulgarian enterprises
is still in its initial stage and may increase in the following years.
In the rest three clusters a very small number of firms are distributed, and this
is an expression of the early stage of development of the innovation system
in the country. In spite of the low share of the firms under analysis, and their
inhomogeneous structure, the data presented by the cluster method confirm
the conclusions and recommendations made both in the present and the
preceding report Innovations.bg.
Panel Survey
The analyses presented so far examine the innovation activity of Bulgarian
enterprises in the framework of the whole national economy. However, in order to
examine the inter-firm mechanisms of creating innovative processes and pro-
ducts in Bulgaria, it is necessary to use a different type of analysis. The two
surveys of 2004 and 2006 allow for the development of a panel survey, invol-
ving 9 % of the innovative firms105, which have already participated in 2004.
This analytical method provides an opportunity to observe the dynamic develop-
ment of innovative companies over time. The main conclusions obtained by this
approach comply with the ones presented in the preceding analysis.
The results of the panel survey reveal a change in the structure and a decrease
in the innovation activity of the firms in 2006 against 2004. Only half of the
105 The 2004 survey sample involved 270 innovative firms, i.e. companies which have supplied innovation products or processes in 2003. In 2006 23 of them were on the sample and allowed a panel survey.
FIGURE 91. INNOVATION ACTIVITY OF COMPANIES IN THE PANEL - % OF THE FIRMS, WHICH HAVE DEVELOPED INNOVATION PRODUCTS OR PROCESSES IN 2004 AND 2006
Source: Vitosha Research, Applied Research and Communications Fund, 2006.
65.2
21.7
39.1
52.2
0.0 10.0 20.0 30.0 40.0 50.0 60.0 70.0
Developed innovation processes
Developed innovation products that were newnot only for the firm but also for the international market
Developed innovation products that were newnot only for the firm but also for the Bulgarian market
Developed innovation products that were newonly for the firm

118
organizations in the panel, which have supplied innovation products in 2004,
have developed and introduced new ones in 2006. The strongest decrease is
observed amongst products which are new not only to the firm but to the
international market as well. This shows that innovative Bulgarian firms might
be highly vulnerable under the competitive pressure of competitors from eco-
nomically more advanced countries.
The dynamics of the factors hampering the innovation activity of the firms in the
panel provides useful information on the development of the national innova-
tion system and its bottlenecks. The only barrier which has increased its nega-
tive impact on the innovation activity of the panel firms in 2006 by almost 50
% is the absence of qualified personnel. However, it is still not the number one
barrier to innovation in the panel firms. It comes only after the financial obstacles
(absence of finance, high costs of innovation and high economic risk). The latter
are indicators of the underdeveloped general economical and innovation envi-
ronment in the country. The reduction in the hampering power of all indicators,
however, is encouraging. The improvement is a most probably a consequence of
the improved macroeconomic stability and growth in the country.
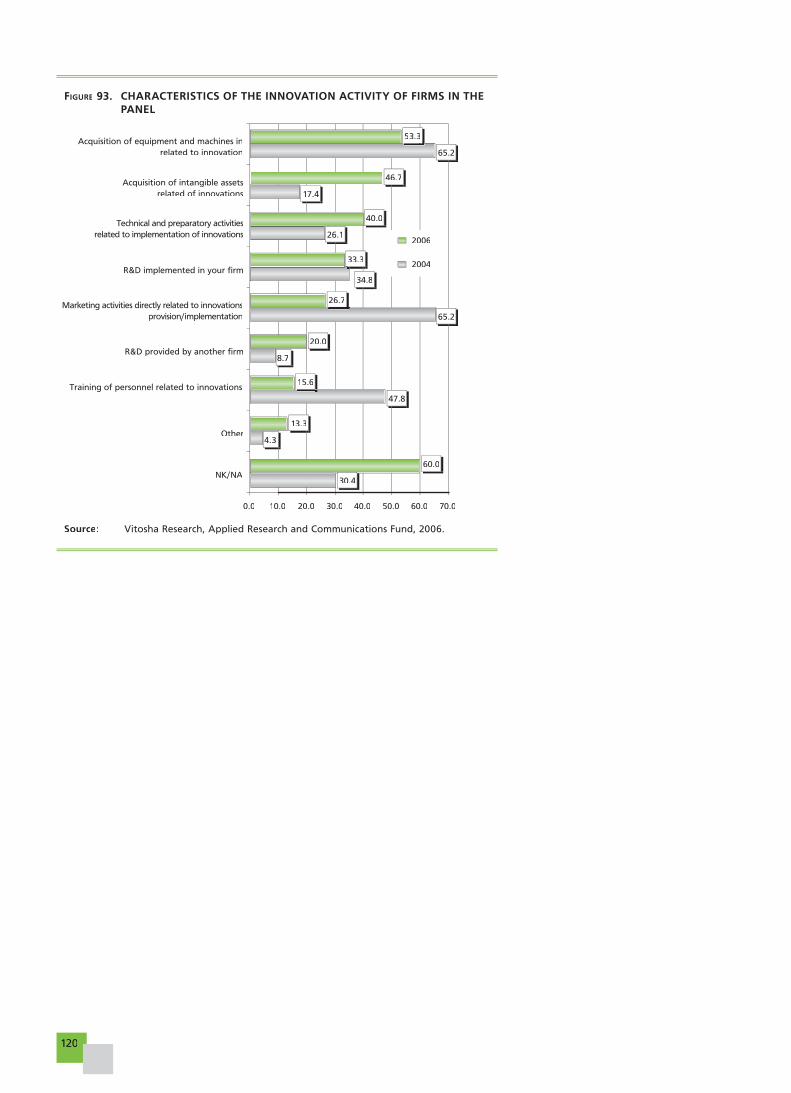
The innovation activity of firms in the panel is directed mainly to provision means
and methods for the development of new markets, i.e. market expansion. As
the cluster analysis outlines and the data from the panel survey confirms the
innovation activity of the Bulgarian innovative enterprises is concentrated in the
acquisition of machines and equipment related to innovations. This is a sign
that Bulgarian companies prepare themselves for the competitive pressure of
the European market and might soon embark on bolder projects for developing
indigenous innovation.
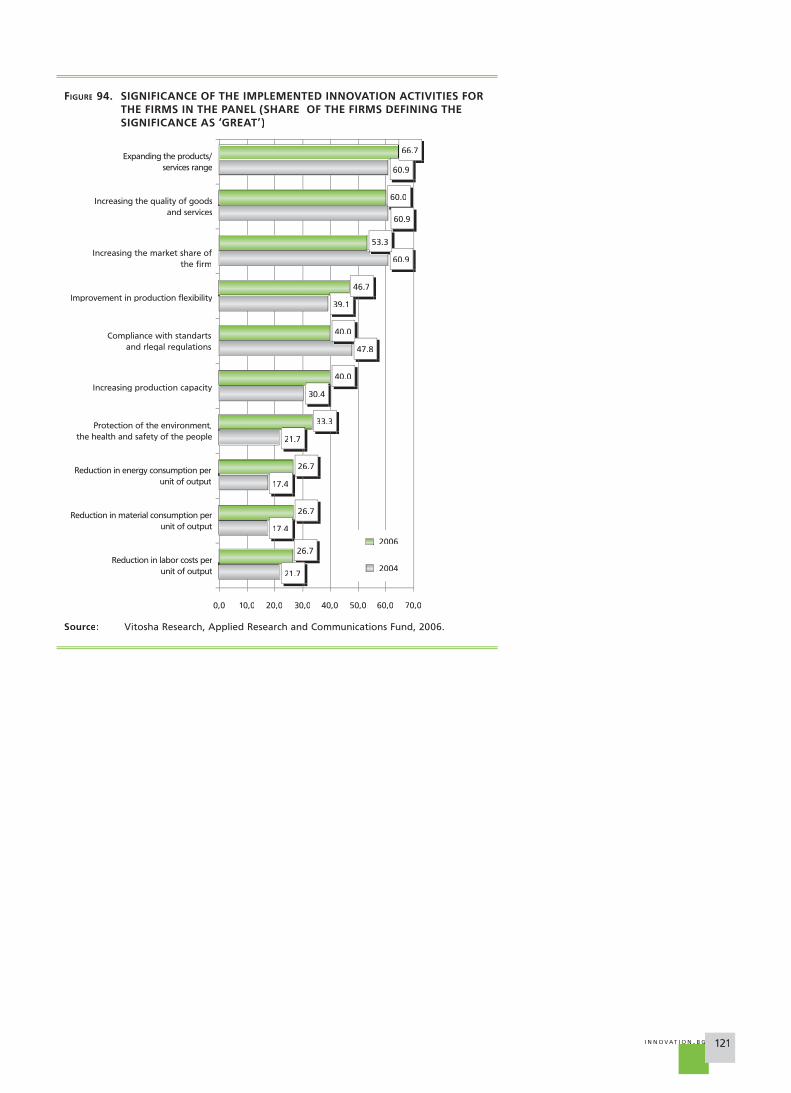
Similar to the data for the whole Bulgarian economy, the innovations created
by the firms involved in the panel are directed mainly towards expanding the
product range, increasing product/service quality, etc. This is an expression of
the preparation of the Bulgarian firms for the competition with the enterprises
in the EU. This might be one of the factors for the reduction of the supply of
innovations in the panel of firms in 2006 compared to 2004. The companies
have most probably focused their entire attention during the period to ensuring
the required investments for meeting the standards of the Internal Market of
the European Union.
All three types of analysis presented in this annex (innovation profile, cluster
analysis and panel survey) outline that the Bulgarian innovation system is still
in its infancy. The continuing equipment of companies with machines and
technologies, assisting the development of the innovation activity is a sign

119I N N OVAT I O NI N N OVAT I O N . B G. B G. B G
that the business in Bulgaria takes seriously the challenges of the country’s
EU membership. The major barrier for the innovation activity of the Bulgarian
innovative enterprises after 2007 will be the absence of qualified personnel
and the limited range and availability of financial instruments for the imple-
mentation of innovation projects. Government financial support is already
acknowledged by the Bulgarian innovative companies but it has not yet
produced any sizable effect on the innovation potential of the economy.
Despite the relatively early stage in the development of the national innova-
tion system of the country, all the prerequisites, for growth of market innova-
tions in the following two years, are present.
FIGURE 92. FACTORS HINDERING THE INNOVATION ACTIVITY OF FIRMS IN THE PANEL (SHARE OF THE FIRMS DEFINING THEIR IMPORTANCE AS ‘GREAT’)
Source: Vitosha Research, Applied Research and Communications Fund, 2006.
13.0
4.3
8.7
8.7
17.4
17.4
8.7
17.4
13.0
30.4
39.1
39.1
0.0
0.0
0.0
0.0
6.7
6.7
13.3
20.0
26.7
26.7
26.7
6.7
0.0 5.0 10.0 15.0 20.0 25.0 30.0 35.0 40.0 45.0
Absence of customers interest in newproducts and services
Absence of information on technologies
Absence of information on markets
Absence of knowledge in the sphereof innovations
Organization obstacles in the firm
Impact of national lowand standarts
Problems in finding partners forinnovation activity
Absence of protection ofintellectual property
Absence of qualified personnel
Extremely high economic risk
Direct costs for innovation areextremely high
Absence of funding resources
2006
2004
120
FIGURE 93. CHARACTERISTICS OF THE INNOVATION ACTIVITY OF FIRMS IN THE PANEL
Source: Vitosha Research, Applied Research and Communications Fund, 2006.
30.4
4.3
47.8
8.7
65.2
26.1
17.4
65.2
60.0
13.3
15.6
20.0
26.7
33.3
40.0
46.7
53.3
34.8
0.0 10.0 20.0 30.0 40.0 50.0 60.0 70.0
NK/NA
Other
Training of personnel related to innovations
R&D provided by another firm
Marketing activities directly related to innovationsprovision/implementation
R&D implemented in your firm
Technical and preparatory activities related to implementation of innovations
Acquisition of intangible assets related of innovations
Acquisition of equipment and machines inrelated to innovation
2006
2004
121I N N OVAT I O NI N N OVAT I O N . B G. B G. B G
FIGURE 94. SIGNIFICANCE OF THE IMPLEMENTED INNOVATION ACTIVITIES FOR THE FIRMS IN THE PANEL (SHARE OF THE FIRMS DEFINING THE SIGNIFICANCE AS ‘GREAT’)
Source: Vitosha Research, Applied Research and Communications Fund, 2006.
2006
200421.7
17.4
17.4
21.7
30.4
47.8
39.1
60.9
60.9
26.7
26.7
33.3
40.0
40.0
46.7
53.3
60.0
60.9
26.7
66.7
0,0 10,0 20,0 30,0 40,0 50,0 60,0 70,0
Reduction in labor costs perunit of output
Reduction in material consumption perunit of output
Reduction in energy consumption perunit of output
Protection of the environment, the health and safety of the people
Increasing production capacity
Compliance with standartsand rlegal regulations
Improvement in production flexibility
Increasing the market share ofthe firm
Increasing the quality of goodsand services
Expanding the products/services range