Innovation Through Pervasive Engineering Simulation
71
Innovation Through Pervasive Engineering Simulation Investor Presentation Q3 2020 NASDAQ: ANSS
Transcript of Innovation Through Pervasive Engineering Simulation

Innovation ThroughPervasive EngineeringSimulation
Investor Presentation
Q3 2020
NASDAQ: ANSS
Cautionary Statement Regarding Forward-Looking and Non-GAAP Financial InformationThis presentation contains forward-looking statements within the meaning of the Private Securities Litigation Reform Act of 1995. Forward-looking statements are statements that provide current expectations or
forecasts of future events based on certain assumptions. Forward-looking statements are subject to risks, uncertainties, and factors relating to our business which could cause our actual results to differ
materially from the expectations expressed in or implied by such forward-looking statements. Many of these risks, uncertainties, and factors are currently amplified by, and may continue to be amplified by, the
COVID-19 pandemic. Forward-looking statements use words such as “anticipate,” “believe,” “could,” “estimate,” “expect,” “forecast,” “intend,” “likely,” “may,” “outlook,” “plan,” “predict,” “project,” “should,”
“target,” or other words of similar meaning. Forward-looking statements include those about market opportunity, including our total addressable market. Risks, uncertainties, and factors that could cause actual
results to differ materially from those implied by these forward-looking statements include: current and potential future impacts of the COVID-19 pandemic on the global economy and our business, financial
position, results of operations and cash flows; adverse changes in global economic and/or political conditions; declines in our customers’ businesses resulting in adverse changes in customer procurement
patterns; disruptions in accounts receivable and cash flow due to customers’ liquidity challenges and commercial deterioration; uncertainties regarding demand for our products and services in the future and
our customers’ acceptance of new products, including those arising from the need of customers to utilize our products from remote locations; plans for future capital spending; delays or declines in anticipated
sales due to reduced or altered sales and marketing interactions with customers; disruptions in the global economy and financial markets that may limit or delay availability of credit under existing or new credit
facilities, or that may limit our ability to obtain credit or financing on acceptable terms or at all; investments in complementary companies, products, services and technologies; our ability to complete and
successfully integrate our acquisitions and realize the financial and business benefits of the transactions; political, economic, regulatory and public health and safety risks and uncertainties in the countries and
regions in which we operate; impacts from tariffs, trade sanctions, export license requirements or other trade barriers; the effect of changes in currency exchange rates and changes in interest rates; potential
variations in our sales forecasts compared to actual sales; the volatility of our stock price; failures or errors in our products and services; our industry’s rapidly changing technology; the quality of our products,
including the strength of features, functionality and integrated multi-physics capabilities; lease license volatility; higher than anticipated costs for research and development or slowdown in our research and
development activities; increased pricing pressure as a result of the competitive environment in which we operate; our ability to recruit and retain key personnel including any delays in recruitment caused by
restrictions on travel and in person interactions and the absence of key personnel or teams due to illness or recuperation; our ability to protect our proprietary technology; cybersecurity threats or other security
breaches, including in relation to an increased level of our activity that is occurring from remote global off-site locations; disclosure and misuse of employee or customer data whether as a result of a
cybersecurity incident or otherwise; implementation of our new IT systems; investments in global sales and marketing organizations and global business infrastructure; dependence on our channel partners for
the distribution of our products; increased volatility in our revenue due to the timing, duration and value of multi-year lease contracts; our reliance on high renewal rates for annual lease and maintenance
contracts; operational disruptions generally or specifically in connection with transitions to and from remote work environments, or the failure of our technological infrastructure; the outcome of contingencies,
including legal proceedings and government or regulatory investigations and service tax audit cases; uncertainty regarding income tax estimates in the jurisdictions in which we operate; changes in accounting
principles or standards; the effect of changes in tax laws and regulations in the jurisdictions in which we operate; the uncertainty of estimates relating to the impact on reported revenue related to the acquisition
accounting treatment of deferred revenue; and other risks and uncertainties described in our reports filed from time to time with the Securities and Exchange Commission. We caution readers not to place undue
reliance upon any such forward-looking statements, which speak only as of the date they are made. We undertake no obligation to publicly update forward-looking statements, whether as a result of new
information, future events or otherwise, except as required by law.
We include non-GAAP financial information in this presentation. Reconciliations for such financial information may be found in our presentation, in these slides including in the Appendix, in other materials on our corporate website, and in our SEC filings. This information supplements our GAAP results and should not be viewed in isolation from, or as a substitute for, GAAP results. We believe that this information and the related reconciliations may be useful to investors, analysts and others to help understand and evaluate our financial results, and with respect to adjusted metrics, because we believe they better reflect the ongoing financial results and trends of our businesses and increase comparability of period-to-period results.
2

COVID-19 Update (as of November 4, 2020)
Operational Impact
• The health and safety of our employees and their families, our partners and our broad Ansys community around the world continues to be our first responsibility. We are continuing to monitor the situation, but as of now remote access remains the primary means of work for a majority of our workforce. Additionally, we are operating under certain travel restrictions. These actions have disrupted how we operate the business.
• The purchasing process of our customers with lower levels of remote working sophistication has slowed.• We hosted our inaugural IDEAS Forum, which was a two-day virtual event featuring thought leadership keynotes and presentations from industry
leaders at Arm, TSMC, Ericsson and more, along with technology sessions and product updates. We also held the virtual Ansys Innovation Conference in China, with over 11,000 attendees, 180+ sessions and 17 keynote speakers.
Financial Impact• While the COVID-19 pandemic did have an adverse financial impact on the updated guidance we provided in May and on our actual Q3 results, the
resilience of our business contributed to our delivery of revenue, operating margin and earnings that either exceeded the mid-point or the high-end of our financial guidance.
Liquidity Impact• Our cash and cash equivalents increased during the quarter, ending with a balance of $844.7 million as of September 30, 2020. We believe that this
balance, together with cash generated from operations and access to our $500.0 million revolving credit facility, are in excess of the cash required for our ongoing operations over the next twelve months.
• Our cash flows from operations in the third quarter and YTD 2020 totaled $94.5 million and $373.5 million, respectively. The YTD cash flow growth was driven by the ability to delay certain income, employment and indirect tax payments. However, these positive cash flows were partially offset by delays in some customer payments on existing contracts and longer payment terms requested for new contracts, particularly related to larger contract commitments. These requests have increased the uncertainty of cash collections and resulted in an increase in our reserves for bad debt during 2020. However, our allowance for bad debt remained constant in Q3 2020.
• We have an unsecured term loan with an outstanding principal balance of $425.0 million as of September 30, 2020. We are compliant with our debt covenants. Our debt agreement currently requires no principal payments until 2024. Our only debt service requirements are interest payments in the current low-rate environment. We believe we will have adequate liquidity to service this debt over the next twelve months.
Information from 3Q20 Earnings
Additional information related to the impact of COVID-19 can be found in the Q3 2020 prepared remarks available at https://investors.ansys.com.
3
4
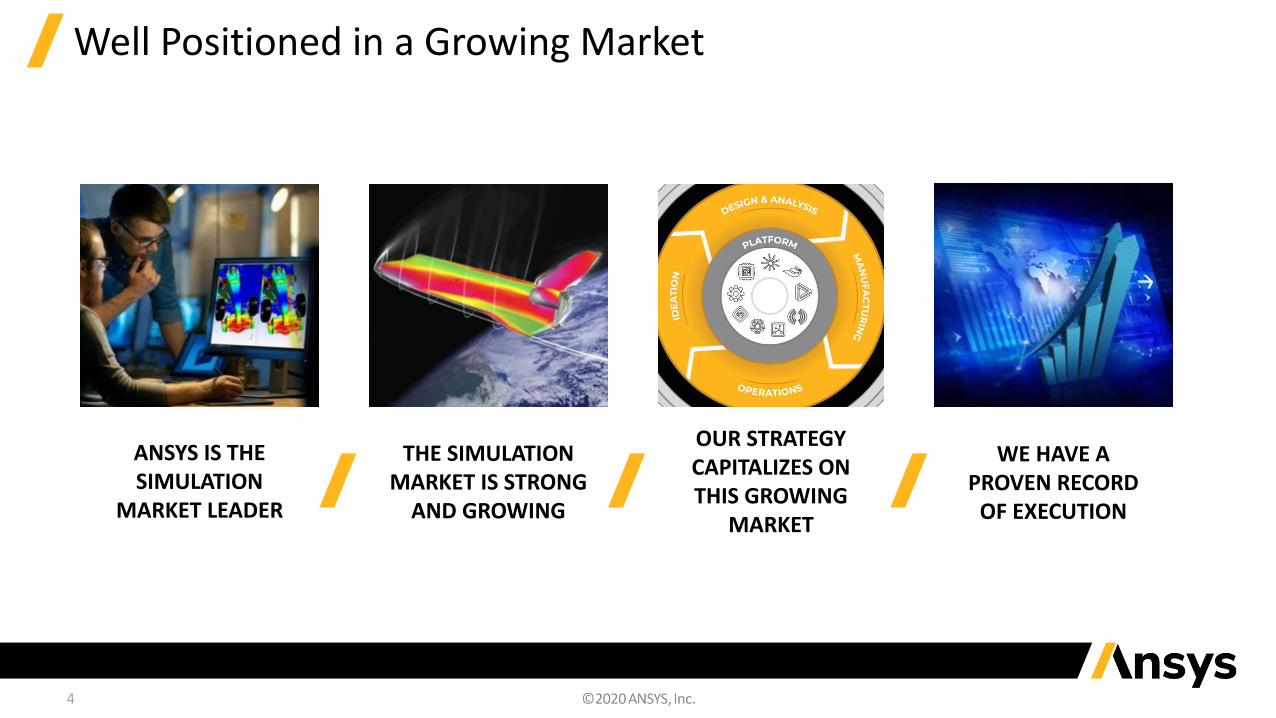
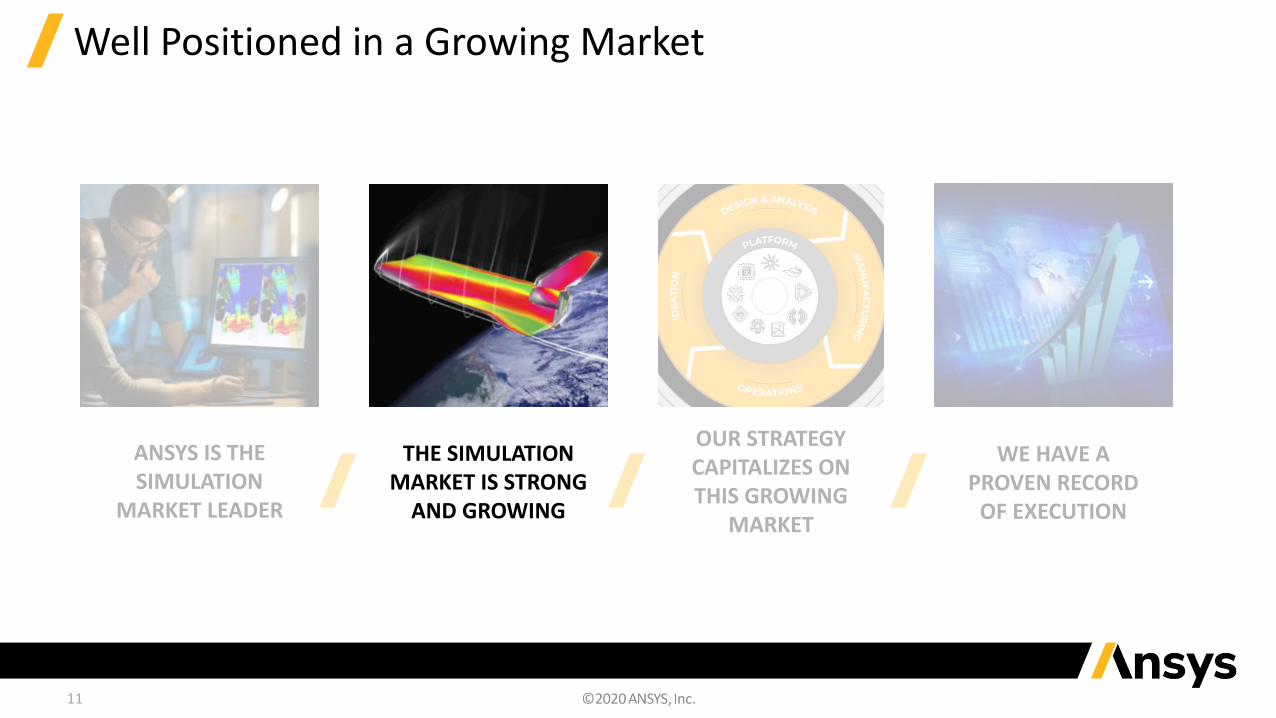
Well Positioned in a Growing Market
ANSYS IS THE SIMULATION
MARKET LEADER
THE SIMULATION MARKET IS STRONG
AND GROWING
OUR STRATEGY CAPITALIZES ON THIS GROWING
MARKET
WE HAVE A PROVEN RECORD
OF EXECUTION

5
A Leader in the Simulation Market for 50 Years
ConfirmIT source of customer satisfaction results. *Excludes MathWorks due to differences in product portfolio.
~2X(CIMdata June 2020 Report)*
THE SIZE OF OUR
NEAREST COMPETITOR
#1INSIMULATION
MEMBER OF PRESTIGIOUS
PROVEN
$26B market capitalization(as of November 2, 2020)
SIMULATION IS ALL WE DO
FOCUSED
OVERALL CUSTOMER SATISFACTION GLOBALLY (2019): 85.9%
COMMITTED4,500 EMPLOYEES GLOBALLY
CAPABLE
85 ANSYS OFFICES>150 CHANNEL PARTNERS GLOBALLY
100 Index

6
Commitment to Corporate Responsibility
By designing a tree-like wind power generator with steel branches and plastic leaves, New Wind has created an aesthetically pleasing alternative energy source for urban environments, bringing energy generation closer to people.
People Planet PracticeEnabling Our Customers’ Sustainability Goals
Awards & Recognition
Employee Engagement Score
5.6%
79%
Voluntary Employee Turnover Rate
21% Women on Senior Leadership Team
23%Women Employees
CLEAN TECHNOLOGY CONTRIBUTIONS – OUR PRODUCT HANDPRINT
Ansys solutions support our customers in their efforts in sustainability as well as improving the efficiency, performance and durability of products. This has the positive effect of reducing total material use, increasing energy efficiency, reducing greenhouse gas emission, supporting the circular economy and increasing operational performance.
Innovation is one of our eight Ansys values. Our growth and financial strength reflect our leading technology position and commitment to innovation. This commitment to innovation ensures that we continue our progress toward our goal of enabling Pervasive Engineering Simulation™.
Metrics for full-year 2019
Ansys corporate responsibility report located at https://investors.ansys.com/sustainability/default.aspx
7
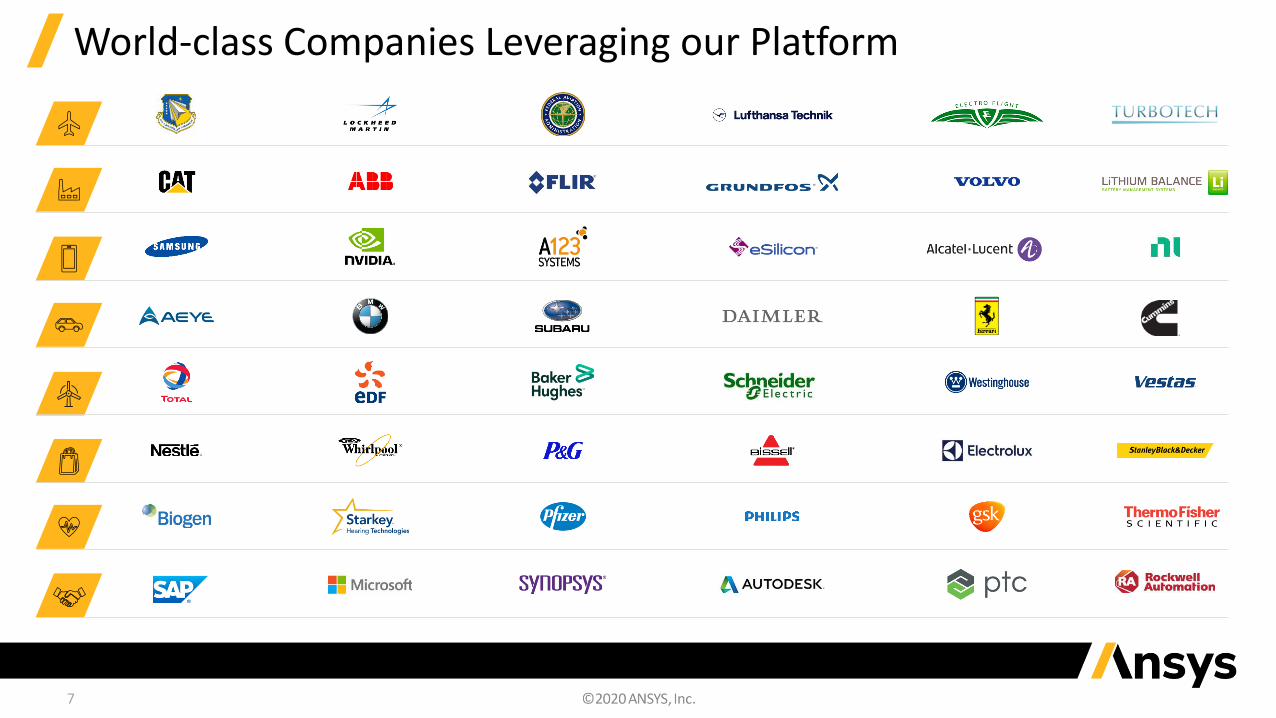
World-class Companies Leveraging our Platform
8
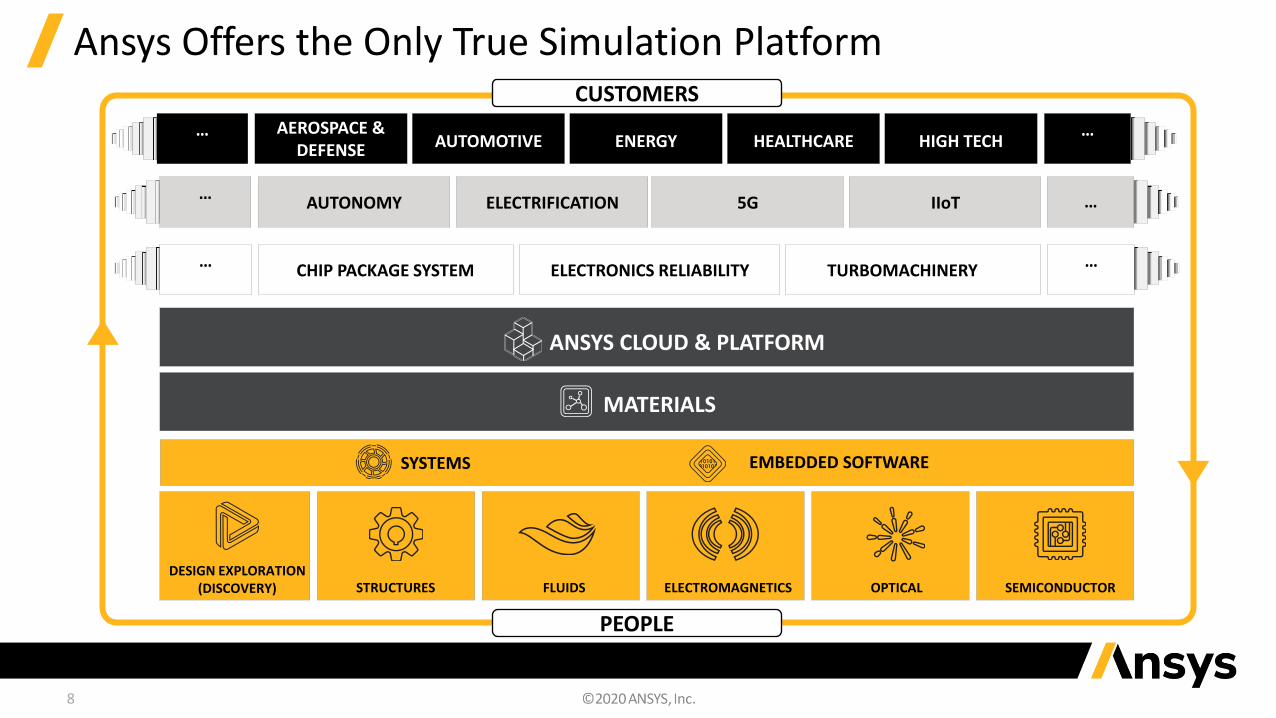
Ansys Offers the Only True Simulation Platform
CHIP PACKAGE SYSTEM ELECTRONICS RELIABILITY TURBOMACHINERY… …
ANSYS CLOUD & PLATFORM
MATERIALS
AUTONOMY ELECTRIFICATION 5G IIoT… …
DESIGN EXPLORATION (DISCOVERY) STRUCTURES FLUIDS ELECTROMAGNETICS OPTICAL SEMICONDUCTOR
EMBEDDED SOFTWARESYSTEMS
… …AEROSPACE & DEFENSE AUTOMOTIVE ENERGY HEALTHCARE HIGH TECH
CUSTOMERS
PEOPLE
9
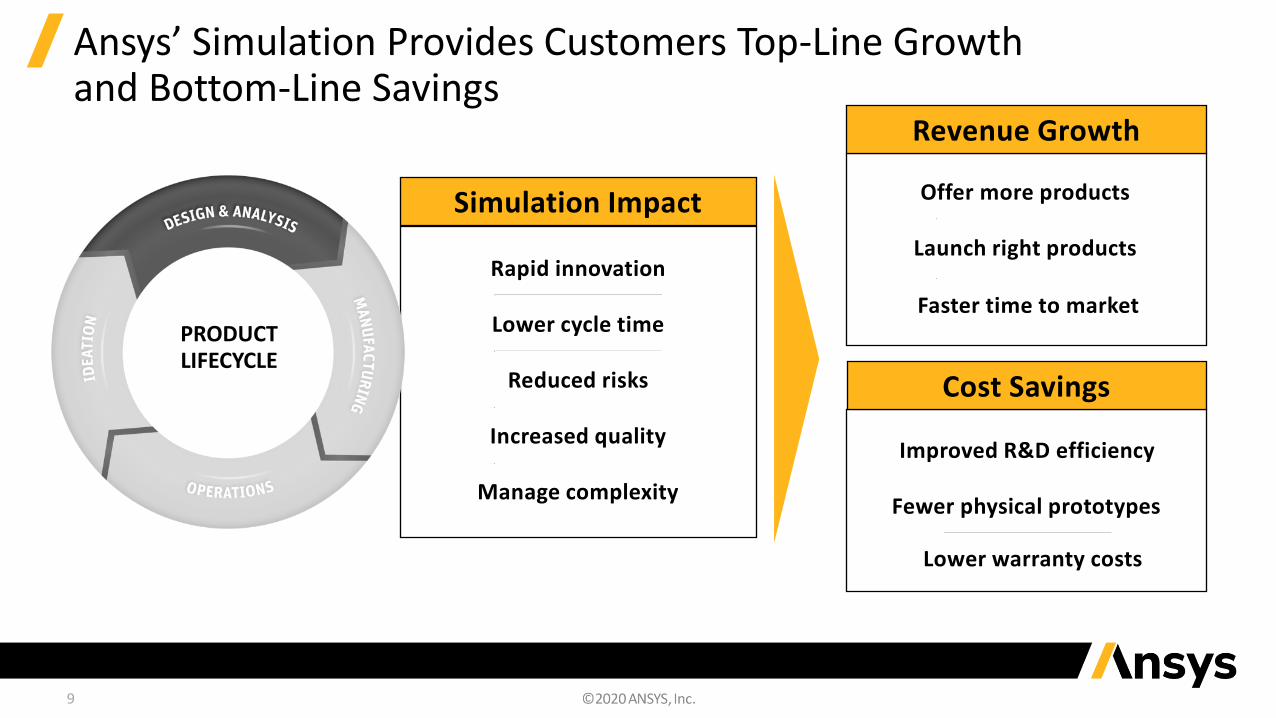
Ansys’ Simulation Provides Customers Top-Line Growth and Bottom-Line Savings
Simulation Impact
Reduced risks
Increased quality
Rapid innovation
Lower cycle time
Manage complexity
Offer more products
Launch right products
Revenue Growth
Improved R&D efficiency
Fewer physical prototypes
Cost Savings
Lower warranty costs
Faster time to marketPRODUCTLIFECYCLE
10
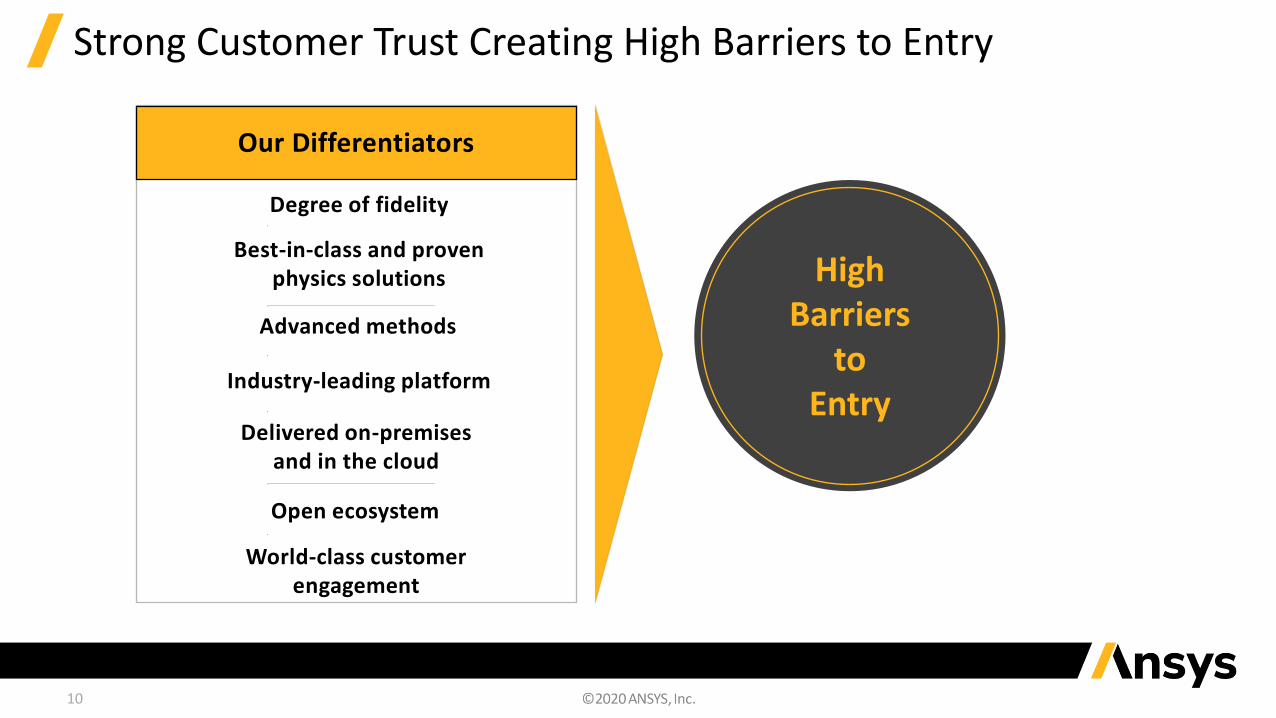
Strong Customer Trust Creating High Barriers to Entry
Industry-leading platform
Delivered on-premisesand in the cloud
Best-in-class and provenphysics solutions
Advanced methods
Open ecosystem
Our Differentiators
World-class customer engagement
Degree of fidelity
High Barriers
toEntry
ANSYS IS THE SIMULATION
MARKET LEADER
OUR STRATEGY CAPITALIZES ON THIS GROWING
MARKET
WE HAVE A PROVEN RECORD
OF EXECUTION
11
Well Positioned in a Growing Market
THE SIMULATION MARKET IS STRONG
AND GROWING

12
The Ansys Total Addressable Market for Simulation will ~Triple in the Next 7-10 Years
2018 2026 Source: Total addressable market (TAM) and compound annual growth rate (CAGR) information throughout presentation is based on third party study completed by Evaluserve Inc. in 2019 commissioned by ANSYS. Study was based on customer and industry expert interviews and review of industry analyst reports and commentaries. Refer to Cautionary Statement for a discussion of factors that could impact future financial results.
~3XNew Adjacencies
Emerging High-Growth Solutions
Foundation
8-Year CAGR to 2026
~34%
~18%
~8%
$2.7 - $5.5B
$3.8 - $5.4B
$9.3 - $9.7B
2026 TAM$15.8 – $20.6B
~$6.6B
• The foundation is the primary source of growth dollars today and in the short term.• Both the foundation and emerging high-growth solutions will contribute growth dollars in the
mid term.• In the long term, all three categories will contribute growth dollars.

13
Emerging High-Growth Solutions: Cross-Industry Trends will Accelerate Growth
ELECTRIFICATION
INDUSTRIAL IoT5G
AUTONOMY
Play to our strengths
Large – and growing –customer investment
Requires extensive use of simulation
Disruptive market opportunities
Unprecedented product complexity

14
New Adjacencies: Substantial Growth into 2026 and Major Upside Beyond
$2.7 – $5.5B
~$0.45B
2018 2026 2030
$10.0 – $30.0B
New adjacencies
~32% $2.7 – $5.5B
CAGR2026 TAM
~37% $10.0 – $30.0B
CAGR2030 TAM
15
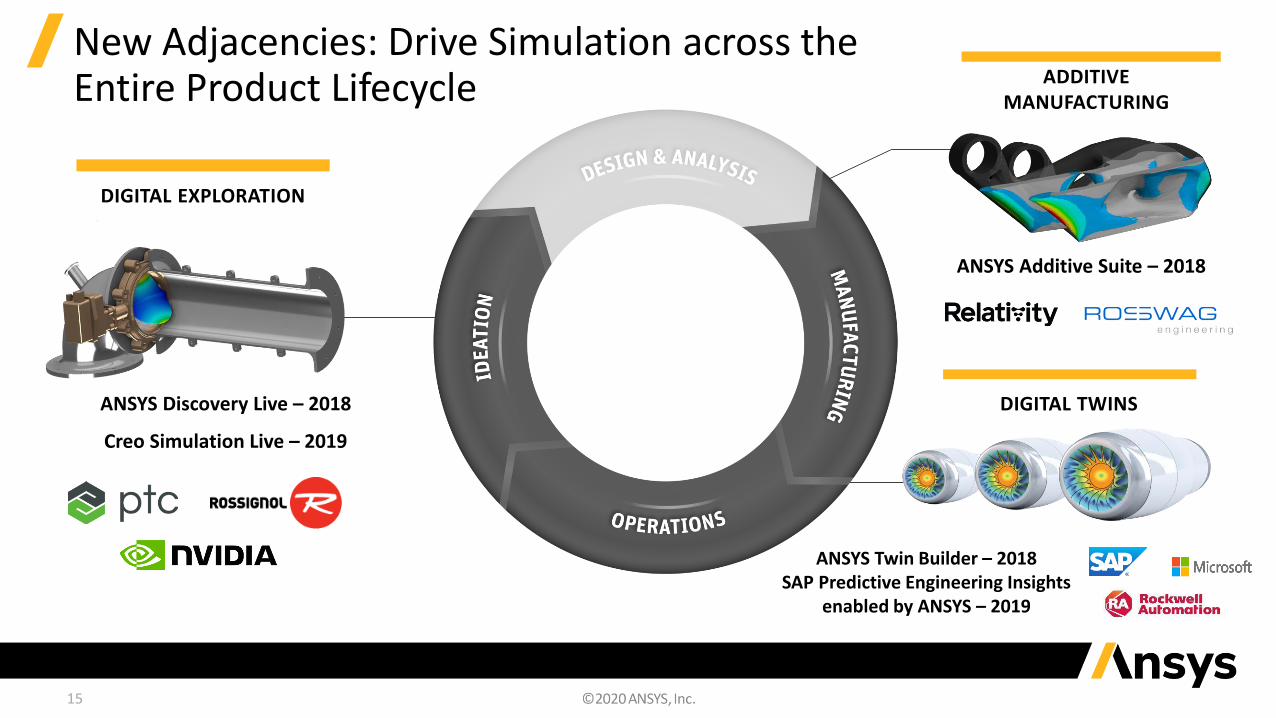
New Adjacencies: Drive Simulation across the Entire Product Lifecycle
DIGITAL EXPLORATION
DIGITAL TWINS
ADDITIVE MANUFACTURING
ANSYS Discovery Live – 2018
Creo Simulation Live – 2019
ANSYS Twin Builder – 2018SAP Predictive Engineering Insights
enabled by ANSYS – 2019
ANSYS Additive Suite – 2018
16
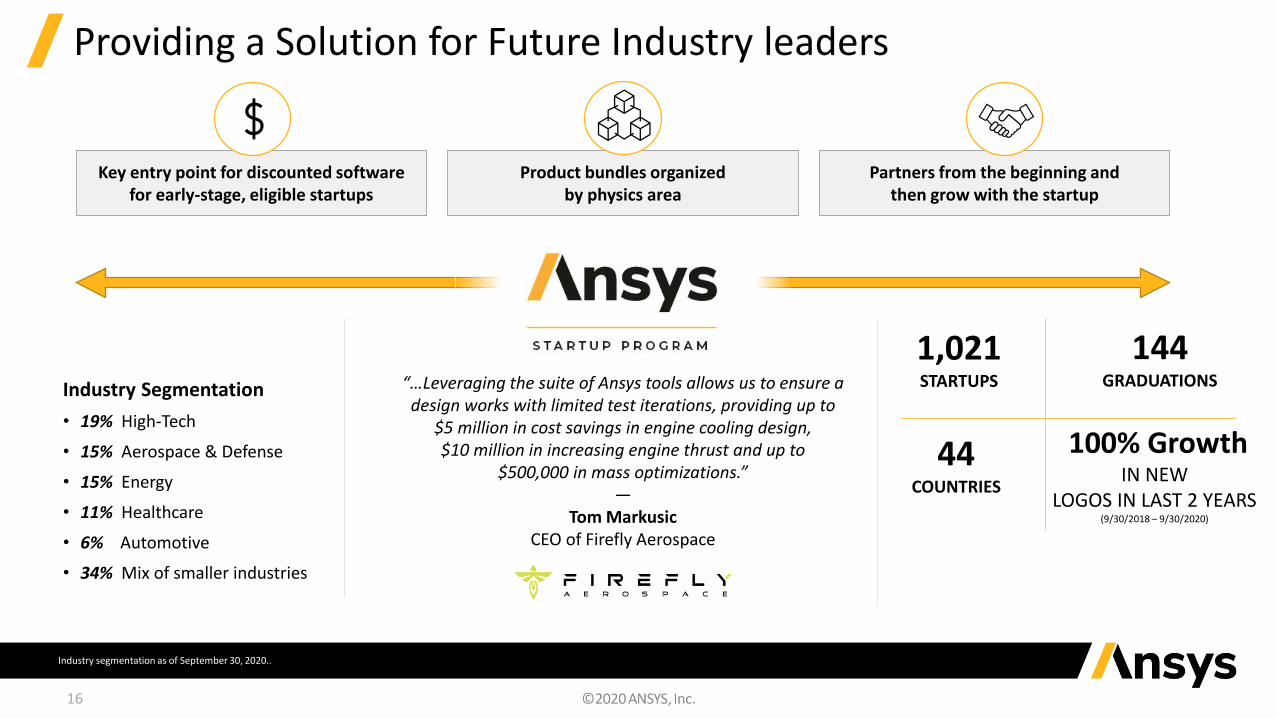
Providing a Solution for Future Industry leaders
Key entry point for discounted software for early-stage, eligible startups
Product bundles organized by physics area
Partners from the beginning and then grow with the startup
“…Leveraging the suite of Ansys tools allows us to ensure a design works with limited test iterations, providing up to
$5 million in cost savings in engine cooling design, $10 million in increasing engine thrust and up to
$500,000 in mass optimizations.”―
Tom MarkusicCEO of Firefly Aerospace
Industry Segmentation
• 19% High-Tech
• 15% Aerospace & Defense
• 15% Energy
• 11% Healthcare
• 6% Automotive
• 34% Mix of smaller industries
1,021STARTUPS
144GRADUATIONS
44COUNTRIES
100% GrowthIN NEW
LOGOS IN LAST 2 YEARS(9/30/2018 – 9/30/2020)
Industry segmentation as of September 30, 2020..

17
Strong & Growing Academic Program Seeding Future Users
Scaling Digital Learning
•1.3M Free student downloads spanning 151 countries
•150k+ Peak monthly users on Learning Forum (previously Student Community)
•20k+ Unique users since Ansys Innovation Courses launched in mid-July
‐ 50 Free courses and growing monthly
Strength in Key Partnerships
•190k Registered students for the Cornell’s Ansys edX course*
•1,775 Registered students for the Technical University of Madrid’s Ansys Online Master’s Degree
•5 Discovery courses at the University of Michigan
•1 New Key Partnership with the University of Texas at Arlington
Field Engagement
•2,750+ Universities in 92 countries using Ansys simulation for teaching & research
•1,500+ Universities using GRANTA EduPack
•635+ with Multiphysics Campus-Wide Solution access
•500+ Student teams sponsored
* https://www.edx.org/course/a-hands-on-introduction-to-engineering-simulations
# o
f C
amp
us
Solu
tio
ns
Year
Multiphysics Campus Solutions Deployed Globally
ANSYS IS THE SIMULATION
MARKET LEADER
WE HAVE A PROVEN RECORD
OF EXECUTION
THE SIMULATION MARKET IS STRONG
AND GROWING
18
Well Positioned in a Growing Market
OUR STRATEGY CAPITALIZES ON THIS GROWING
MARKET

19
Our Product Strategy is Based on Pervasive Simulation
• Integration across all physics on a single open platform
• And the injection of simulation into partner ecosystems
Pervasive Simulation is:
Our Product Strategy:
• Continuing investment to extend leading positions in all physics
• Leveraging and expanding platform to drive deeper client relationships
• Selectively targeting highest-growth market opportunities
• Accelerating opportunities and growth through world-class ecosystem
Core
• Strengthen our foundation
• Deliver offerings for emerging
high-growth solutions
• Will deliver the bulk of Ansys
growth for the next 3-5 years
Expansion
• Drive simulation across the entire
product cycle
• Embed Ansys into partners’
ecosystems
• Provides significant upside to long-
term growth
Our Strategy is Aligned with Market Growth:
20
Ansys Delivers What Matters Most to Customers
AdvancedMethods
AccuracyTrue
MultiphysicsClose Technical
Partnership

21
We are Uniquely Positioned to Make Simulation Pervasive
COMPETITOR #1 ● ● ●COMPETITOR #2 ● ● ● ● ● ●COMPETITOR #3 ● ● ● ●COMPETITOR #4 ● ● ● ●COMPETITOR #5 ● ●COMPETITOR #6 ● ●COMPETITOR #7 ●COMPETITOR #8 ●COMPETITOR #9 ● ●
#1STRUCTURES
#1 FLUIDS
#1ELECTROMAGNETICS
#1SEMICONDUCTOR
#1EMBEDDED
SOFTWARE
Source: Summary of competitor offerings based on Ansys analysis of public information and third-party market research.
Best-of-breed offering More limited offering
#1MATERIALS
INFORMATION
#1OPTICAL
22
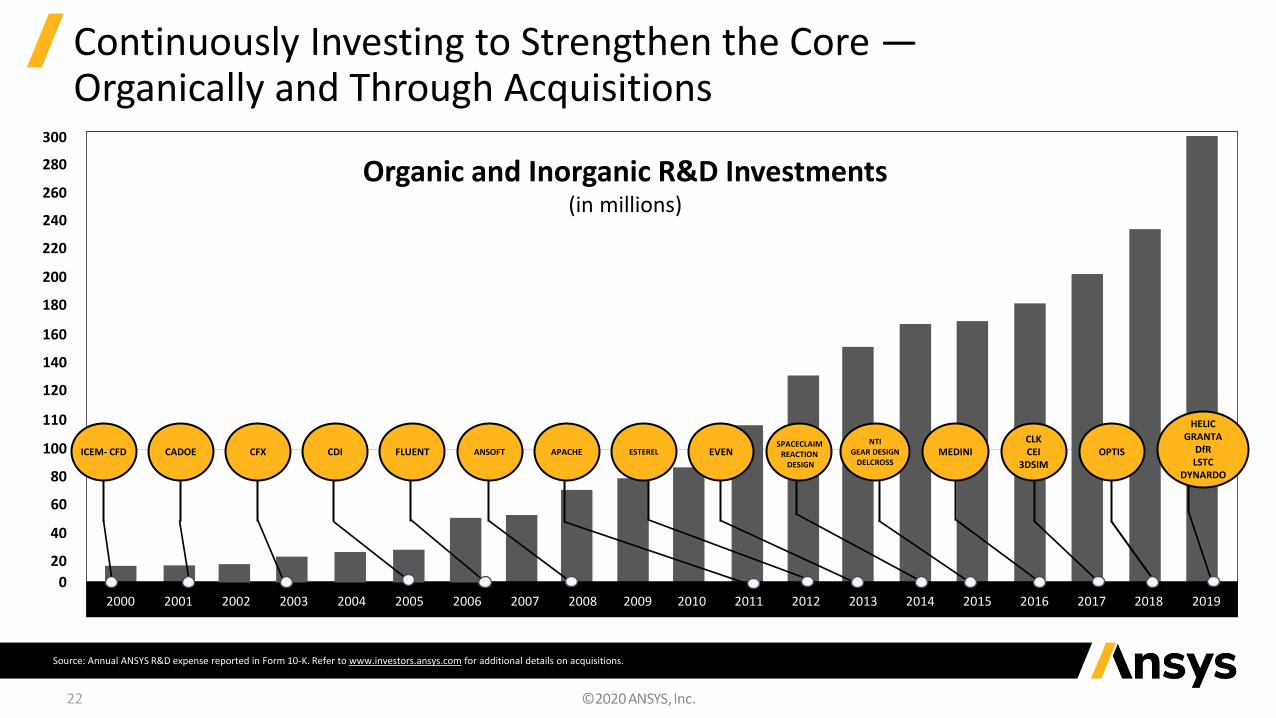
Continuously Investing to Strengthen the Core —Organically and Through Acquisitions
Source: Annual ANSYS R&D expense reported in Form 10-K. Refer to www.investors.ansys.com for additional details on acquisitions.
Organic and Inorganic R&D Investments(in millions)
OPTISICEM- CFD APACHE EVENSPACECLAIM
REACTION DESIGN
MEDINICLKCEI
3DSIMCFX CDI
HELICGRANTA
DfRLSTC
DYNARDO
2000 20192001 2002 2003 2004 2005 2006 2007 2008 2009 2010 2011 2012 2013 2014 2015 2016 2017 2018
NTIGEAR DESIGN
DELCROSSESTERELANSOFTFLUENTCADOE
0
100
110
120
140
160
180
200
220
240
260
20
40
60
80
280
300

Ansys 2020 R2 Key Updates – Released July 2020
FLUIDS ELECTROMAGNETICSSTRUCTURES
DESIGN MATERIALS
• Enhanced mechanical simulation of electronics• Improvements to speed and robustness of core solver• Further exposure of LS-DYNA technology in Workbench
INCREASED TECHNICAL BREADTH & DEPTH
• Enhanced battery simulation• New fast & accurate simulation of compressors• Improved workflows across multiple applications
IMPROVED WORKFLOWS & NEW CAPABILITIES
• Simulate bio-compatibility of 5G equipment• Enhanced electro-thermal integration• New advanced cable modeling solution
NEW STREAMLINED ELECTRONICS WORKFLOWS
• New unified Discovery application• Improved workflow and GTM with flagships• Enhanced speed and accuracy
ALL-NEW USER EXPERIENCE
• Significantly enhanced usability and enterprise integration• Further integration with Ansys portfolio, including Minerva• Updated materials datasets, including restricted substances
ENABLING A TRUE DIGITAL TRANSFORMATION
23
24
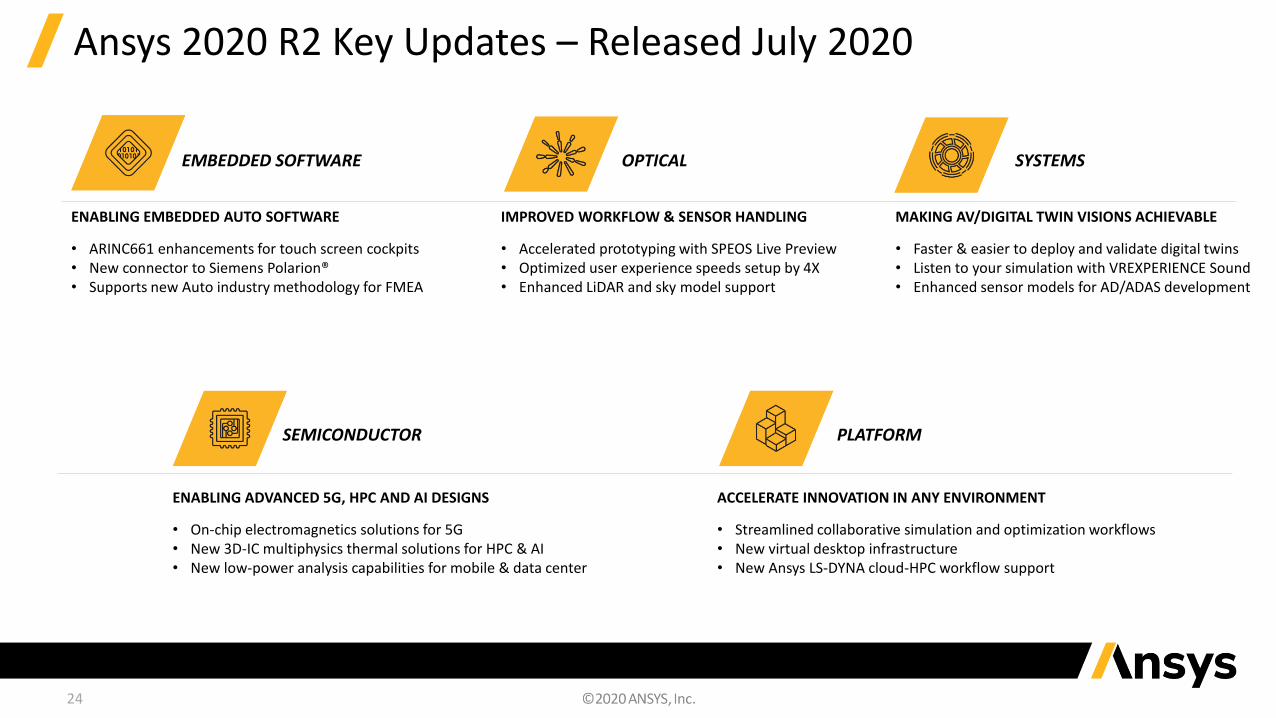
Ansys 2020 R2 Key Updates – Released July 2020
SEMICONDUCTOR
OPTICALEMBEDDED SOFTWARE
PLATFORM
SYSTEMS
• ARINC661 enhancements for touch screen cockpits• New connector to Siemens Polarion®• Supports new Auto industry methodology for FMEA
ENABLING EMBEDDED AUTO SOFTWARE
• Accelerated prototyping with SPEOS Live Preview• Optimized user experience speeds setup by 4X• Enhanced LiDAR and sky model support
IMPROVED WORKFLOW & SENSOR HANDLING
• Faster & easier to deploy and validate digital twins• Listen to your simulation with VREXPERIENCE Sound• Enhanced sensor models for AD/ADAS development
MAKING AV/DIGITAL TWIN VISIONS ACHIEVABLE
• On-chip electromagnetics solutions for 5G• New 3D-IC multiphysics thermal solutions for HPC & AI• New low-power analysis capabilities for mobile & data center
ENABLING ADVANCED 5G, HPC AND AI DESIGNS
• Streamlined collaborative simulation and optimization workflows• New virtual desktop infrastructure• New Ansys LS-DYNA cloud-HPC workflow support
ACCELERATE INNOVATION IN ANY ENVIRONMENT
25
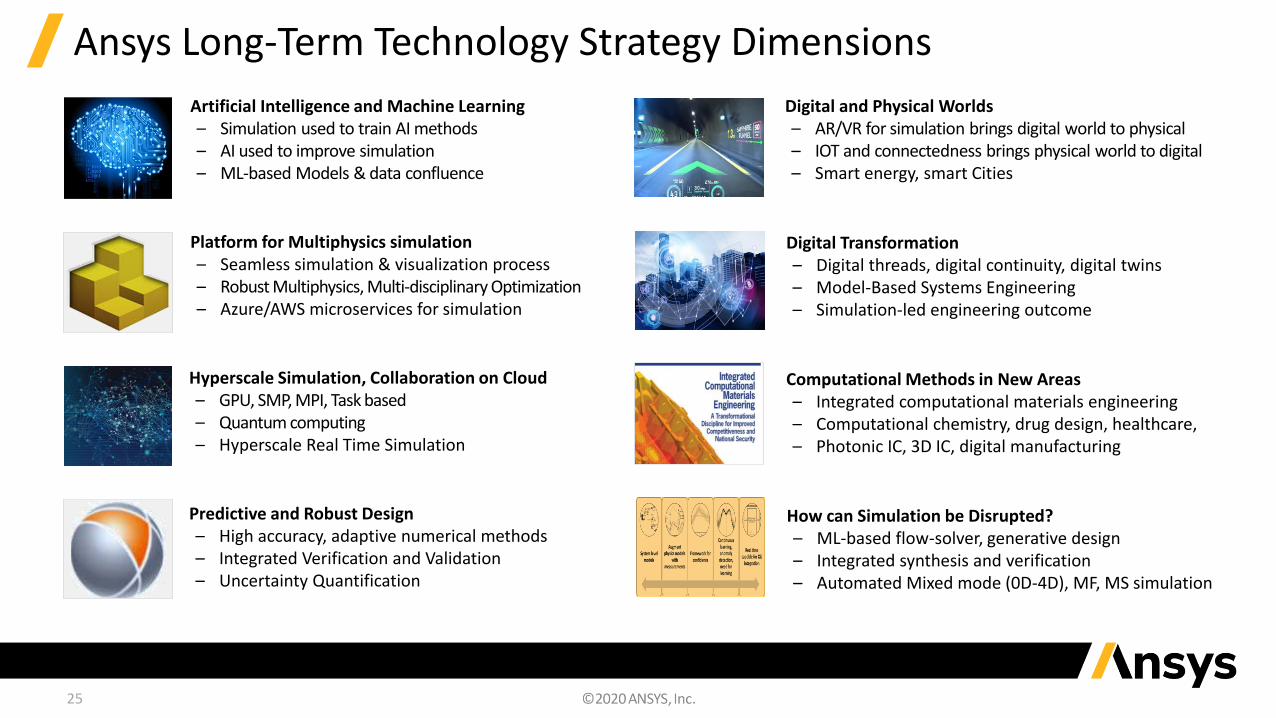
Ansys Long-Term Technology Strategy Dimensions
Artificial Intelligence and Machine Learning – Simulation used to train AI methods– AI used to improve simulation – ML-based Models & data confluence
Predictive and Robust Design– High accuracy, adaptive numerical methods– Integrated Verification and Validation– Uncertainty Quantification
Platform for Multiphysics simulation– Seamless simulation & visualization process– Robust Multiphysics, Multi-disciplinary Optimization– Azure/AWS microservices for simulation
Hyperscale Simulation, Collaboration on Cloud– GPU, SMP, MPI, Task based– Quantum computing– Hyperscale Real Time Simulation
Digital and Physical Worlds– AR/VR for simulation brings digital world to physical– IOT and connectedness brings physical world to digital– Smart energy, smart Cities
Digital Transformation– Digital threads, digital continuity, digital twins– Model-Based Systems Engineering– Simulation-led engineering outcome
Computational Methods in New Areas– Integrated computational materials engineering– Computational chemistry, drug design, healthcare, – Photonic IC, 3D IC, digital manufacturing
How can Simulation be Disrupted?– ML-based flow-solver, generative design– Integrated synthesis and verification– Automated Mixed mode (0D-4D), MF, MS simulation
26
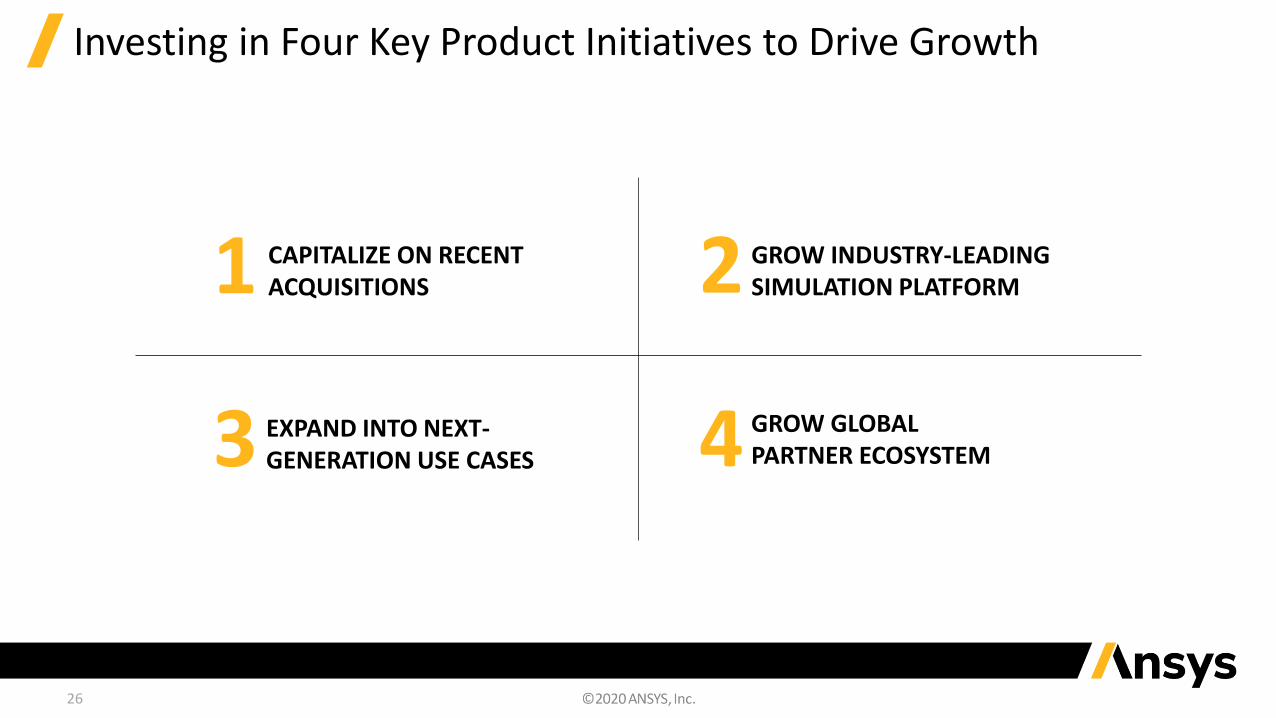
Investing in Four Key Product Initiatives to Drive Growth
CAPITALIZE ON RECENT ACQUISITIONS
EXPAND INTO NEXT-GENERATION USE CASES
1
GROW GLOBAL PARTNER ECOSYSTEM
GROW INDUSTRY-LEADING SIMULATION PLATFORM2
3 4
27
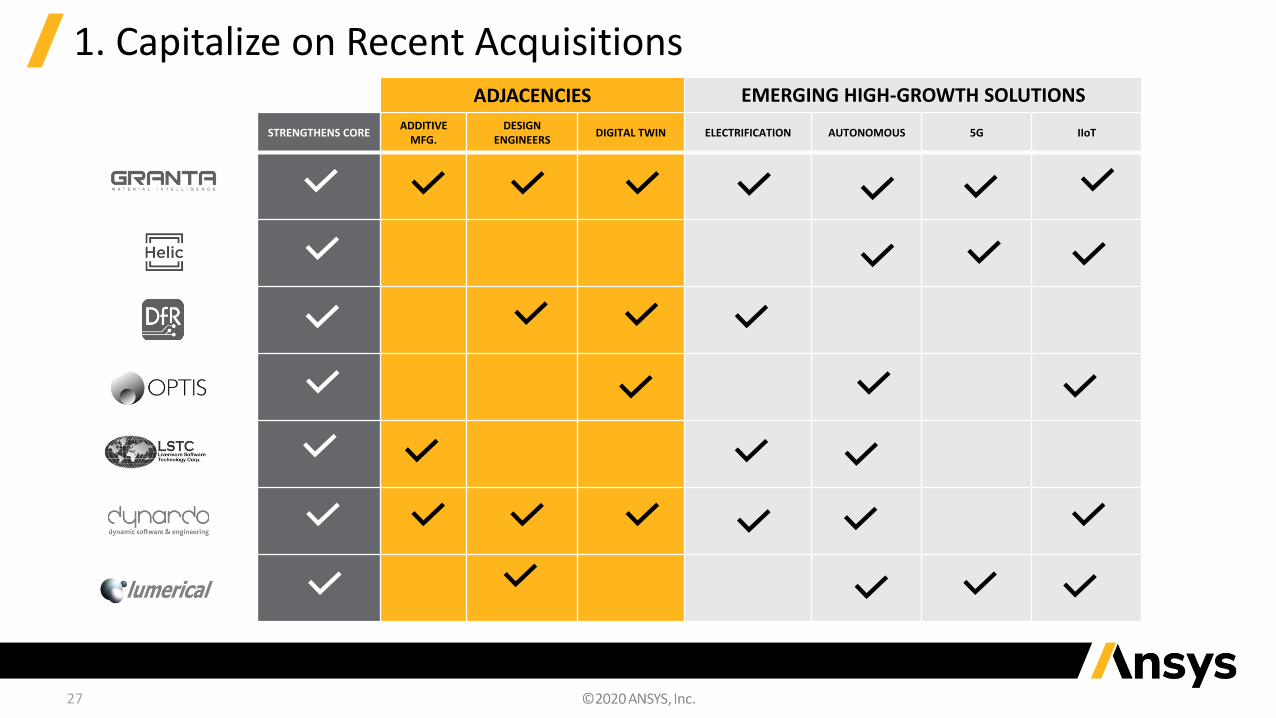
1. Capitalize on Recent Acquisitions
STRENGTHENS COREADDITIVE
MFG.DESIGN
ENGINEERSDIGITAL TWIN ELECTRIFICATION AUTONOMOUS 5G IIoT
ADJACENCIES EMERGING HIGH-GROWTH SOLUTIONS
28
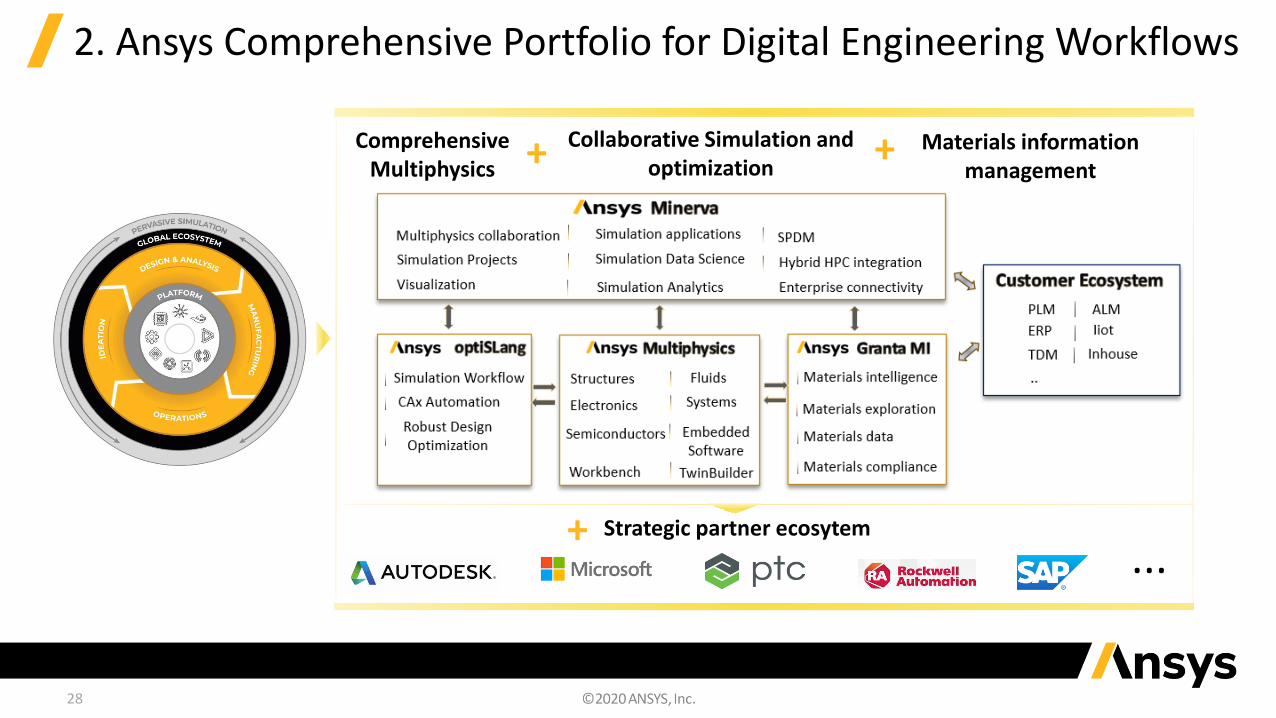
2. Ansys Comprehensive Portfolio for Digital Engineering Workflows
Comprehensive Multiphysics
++ Collaborative Simulation and optimization
Materials information management
+ Strategic partner ecosytem
...
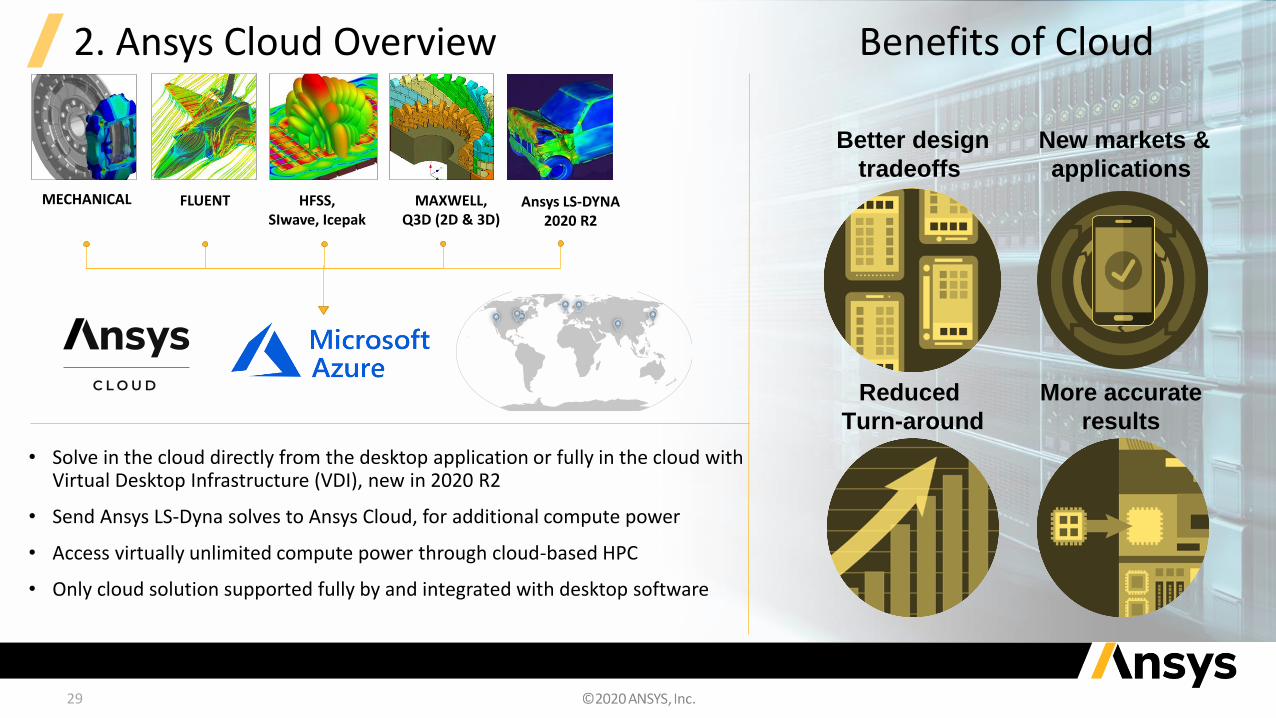
2. Ansys Cloud Overview
• Solve in the cloud directly from the desktop application or fully in the cloud with Virtual Desktop Infrastructure (VDI), new in 2020 R2
• Send Ansys LS-Dyna solves to Ansys Cloud, for additional compute power
• Access virtually unlimited compute power through cloud-based HPC
• Only cloud solution supported fully by and integrated with desktop software
29
MECHANICAL FLUENT HFSS,SIwave, Icepak
MAXWELL,Q3D (2D & 3D)
Ansys LS-DYNA2020 R2
Reduced
Turn-around
More accurate
results
Better design
tradeoffs
New markets &
applications
Benefits of Cloud
30
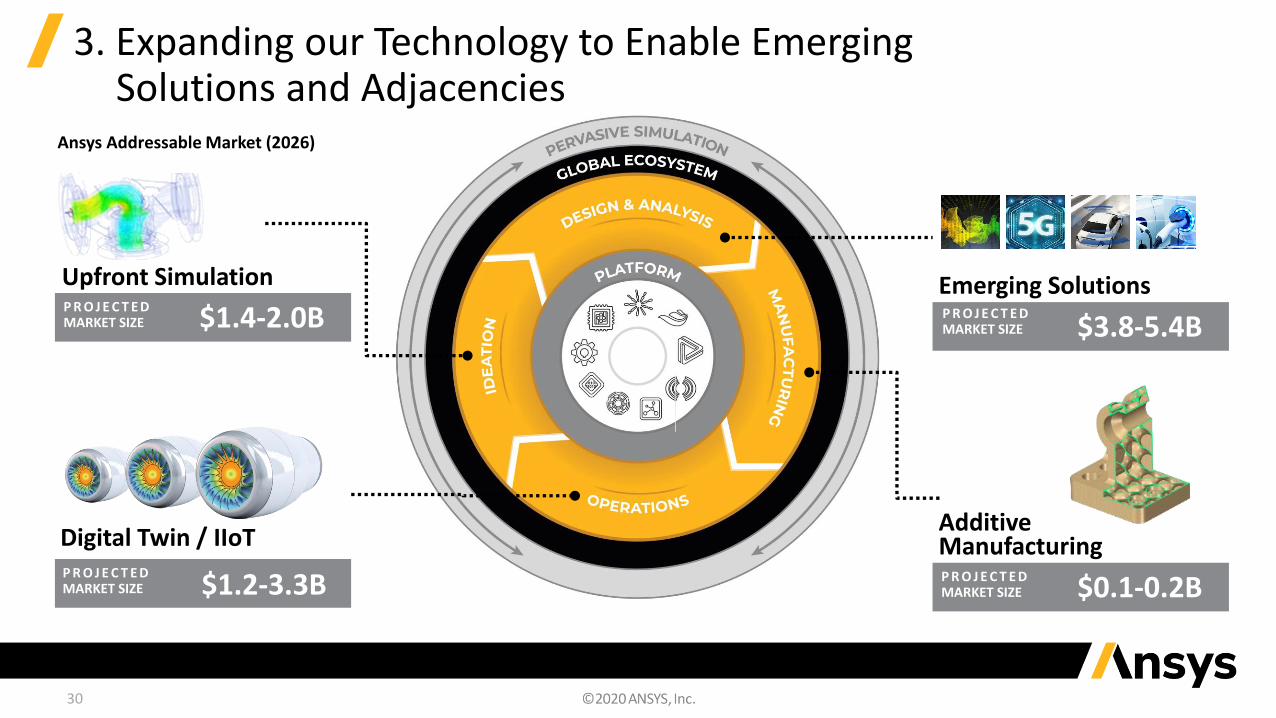
3. Expanding our Technology to Enable Emerging Solutions and Adjacencies
P R O J E C T E DMARKET SIZE $3.8-5.4B
Emerging Solutions
P R O J E C T E DMARKET SIZE $0.1-0.2B
AdditiveManufacturing
P R O J E C T E DMARKET SIZE $1.4-2.0B
Upfront Simulation
P R O J E C T E DMARKET SIZE $1.2-3.3B
Digital Twin / IIoT
Ansys Addressable Market (2026)

31
5G is Everywhere
DEVICES
AutomotiveIoTMobile
DATA CENTERS
Compute / Cloud
EDGE DEVICES & COMPUTE
Wireless
NETWORKS
32
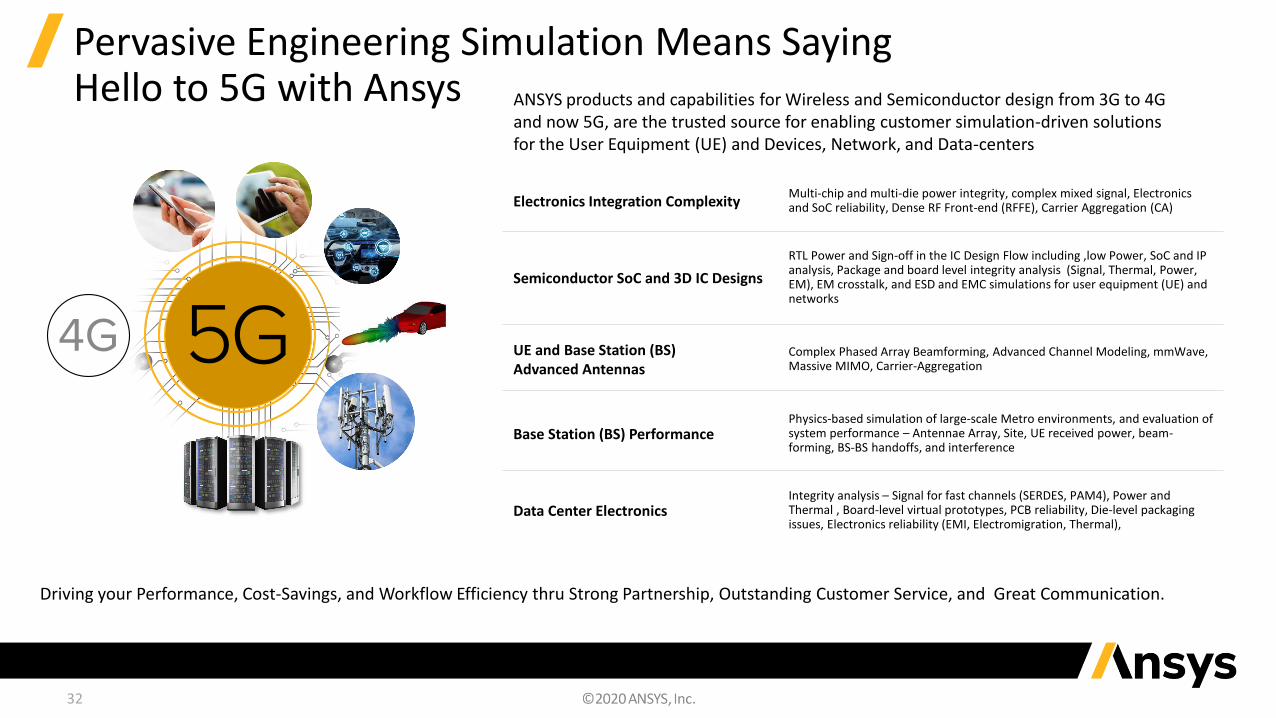
Pervasive Engineering Simulation Means Saying Hello to 5G with Ansys ANSYS products and capabilities for Wireless and Semiconductor design from 3G to 4G
and now 5G, are the trusted source for enabling customer simulation-driven solutions for the User Equipment (UE) and Devices, Network, and Data-centers
Driving your Performance, Cost-Savings, and Workflow Efficiency thru Strong Partnership, Outstanding Customer Service, and Great Communication.
Electronics Integration ComplexityMulti-chip and multi-die power integrity, complex mixed signal, Electronics and SoC reliability, Dense RF Front-end (RFFE), Carrier Aggregation (CA)
Semiconductor SoC and 3D IC Designs
RTL Power and Sign-off in the IC Design Flow including ,low Power, SoC and IP analysis, Package and board level integrity analysis (Signal, Thermal, Power, EM), EM crosstalk, and ESD and EMC simulations for user equipment (UE) and networks
UE and Base Station (BS) Advanced Antennas
Complex Phased Array Beamforming, Advanced Channel Modeling, mmWave, Massive MIMO, Carrier-Aggregation
Base Station (BS) PerformancePhysics-based simulation of large-scale Metro environments, and evaluation of system performance – Antennae Array, Site, UE received power, beam-forming, BS-BS handoffs, and interference
Data Center ElectronicsIntegrity analysis – Signal for fast channels (SERDES, PAM4), Power and Thermal , Board-level virtual prototypes, PCB reliability, Die-level packaging issues, Electronics reliability (EMI, Electromigration, Thermal),

33
3. Ansys Electrification Solutions
Four Pillars1. Battery & BMS2. Power Electronics3. Electric Machines4. Electrified Propulsion System
Leader in Electrification• 50 Years Focus on Simulation• Breadth/Depth of Multi-
Domain/Multi-Technology Solutions• Open Platform
34
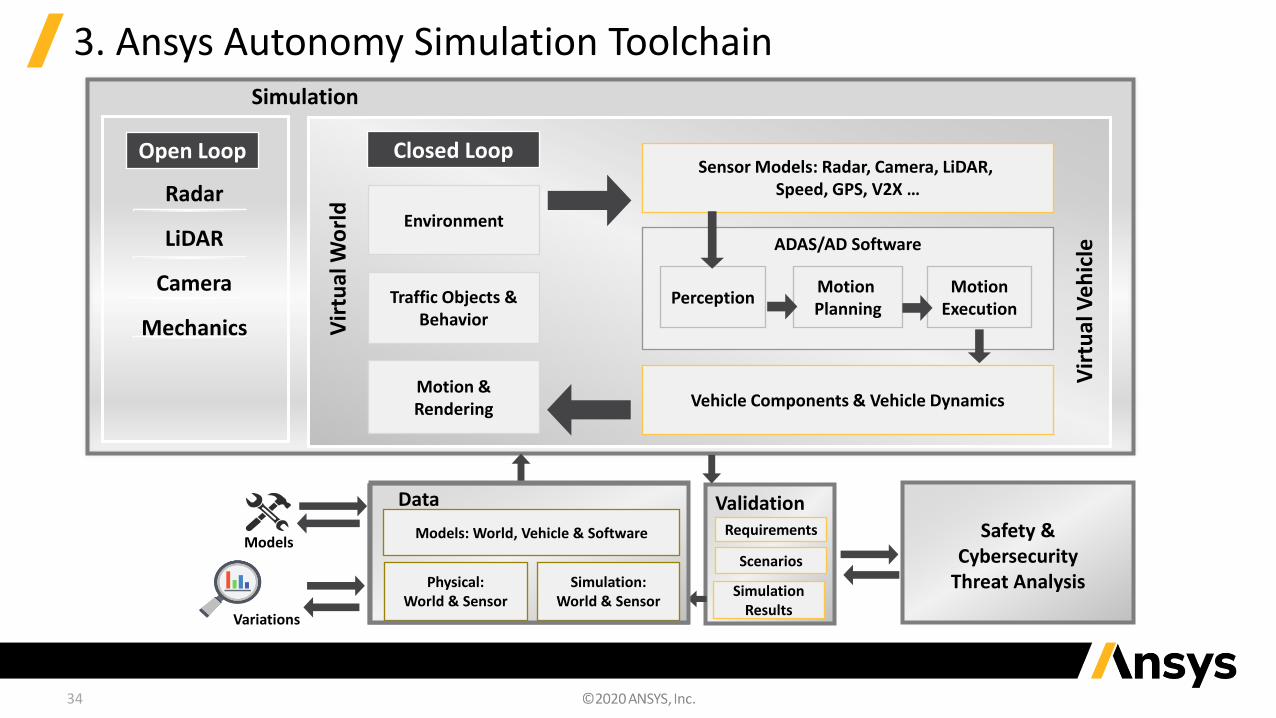
3. Ansys Autonomy Simulation ToolchainSimulation
Vir
tual
Wo
rld
Vir
tual
Ve
hic
le
Environment
Traffic Objects &Behavior
Motion &Rendering
Sensor Models: Radar, Camera, LiDAR, Speed, GPS, V2X …
ADAS/AD Software
Vehicle Components & Vehicle Dynamics
PerceptionMotion Planning
MotionExecution
Models
Data
Models: World, Vehicle & Software
Physical:World & Sensor
Simulation:World & Sensor
Validation
SimulationResults
Requirements
Scenarios
Variations
Safety & Cybersecurity
Threat Analysis
Radar
LiDAR
Camera
Mechanics
Open Loop Closed Loop
35
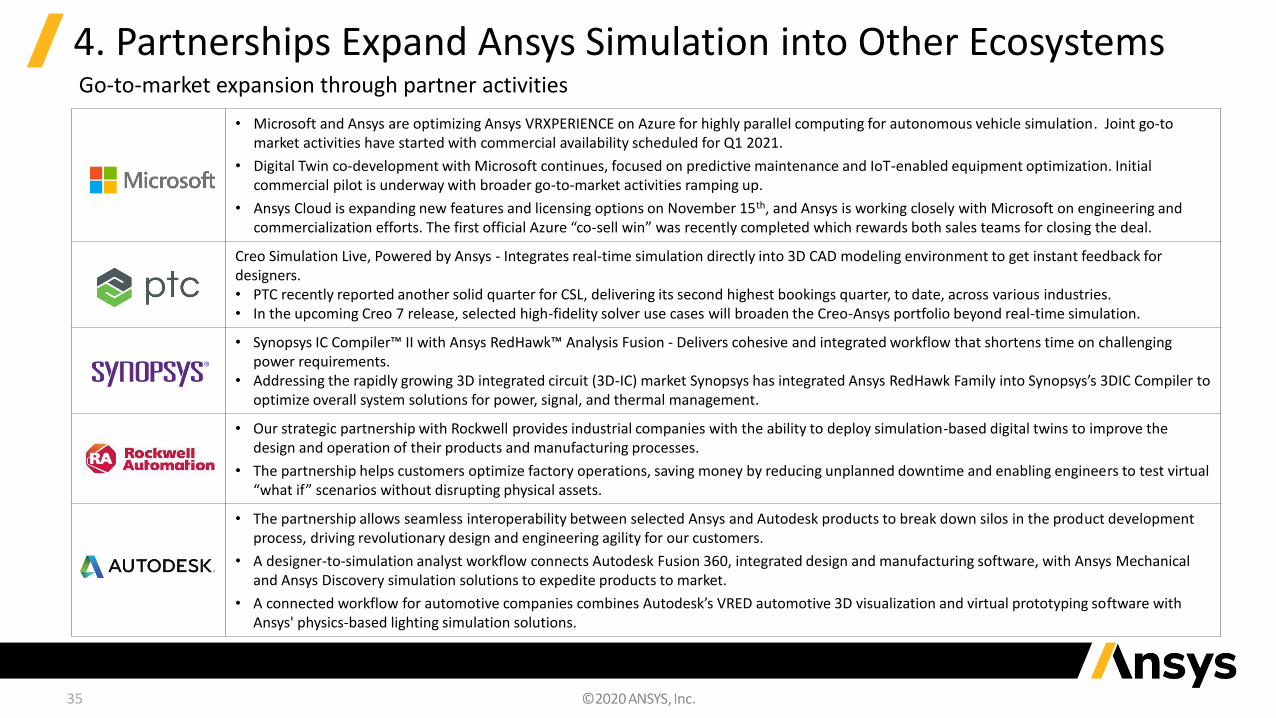
4. Partnerships Expand Ansys Simulation into Other Ecosystems
• Microsoft and Ansys are optimizing Ansys VRXPERIENCE on Azure for highly parallel computing for autonomous vehicle simulation. Joint go-to market activities have started with commercial availability scheduled for Q1 2021.
• Digital Twin co-development with Microsoft continues, focused on predictive maintenance and IoT-enabled equipment optimization. Initial commercial pilot is underway with broader go-to-market activities ramping up.
• Ansys Cloud is expanding new features and licensing options on November 15th, and Ansys is working closely with Microsoft on engineering and commercialization efforts. The first official Azure “co-sell win” was recently completed which rewards both sales teams for closing the deal.
Creo Simulation Live, Powered by Ansys - Integrates real-time simulation directly into 3D CAD modeling environment to get instant feedback for designers.• PTC recently reported another solid quarter for CSL, delivering its second highest bookings quarter, to date, across various industries.• In the upcoming Creo 7 release, selected high-fidelity solver use cases will broaden the Creo-Ansys portfolio beyond real-time simulation.
• Synopsys IC Compiler™ II with Ansys RedHawk™ Analysis Fusion - Delivers cohesive and integrated workflow that shortens time on challenging power requirements.
• Addressing the rapidly growing 3D integrated circuit (3D-IC) market Synopsys has integrated Ansys RedHawk Family into Synopsys’s 3DIC Compiler to optimize overall system solutions for power, signal, and thermal management.
• Our strategic partnership with Rockwell provides industrial companies with the ability to deploy simulation-based digital twins to improve the design and operation of their products and manufacturing processes.
• The partnership helps customers optimize factory operations, saving money by reducing unplanned downtime and enabling engineers to test virtual “what if” scenarios without disrupting physical assets.
• The partnership allows seamless interoperability between selected Ansys and Autodesk products to break down silos in the product development process, driving revolutionary design and engineering agility for our customers.
• A designer-to-simulation analyst workflow connects Autodesk Fusion 360, integrated design and manufacturing software, with Ansys Mechanical and Ansys Discovery simulation solutions to expedite products to market.
• A connected workflow for automotive companies combines Autodesk’s VRED automotive 3D visualization and virtual prototyping software with Ansys' physics-based lighting simulation solutions.
Go-to-market expansion through partner activities

36
4. Partnerships Expand Ansys Simulation into Other Ecosystems
• Ansys and SAP have extended a multi-year agreement to support Ansys runtime twins within SAP’s Enterprise Product Development (EPD) platform.
• The market focus is expanding from Operators to OEMs to align with digital transformation initiatives where equipment suppliers are offering more software and services along with their products.
• Ansys and BMW Group are partnering to create the automotive industry’s first holistic simulation tool chain for developing autonomous vehicle technologies.
• BMW Group is leveraging Ansys’ broad pervasive engineering simulation solutions and experience to speed up the development of a safety-focused solution for the validation of Autonomous Driving systems.
• Ansys and AVSimulation are partnering to speed the development of safe autonomous driving for automobile manufacturers.
• The collaboration integrates revolutionary simulation technology from AVSimulation with Ansys’ immersive autonomous driving simulation solutions, expediting vehicle design and validation by using virtual testing.
• Through a new collaboration, Ansys and Airbus plan to develop a new Ansys solution for enabling safety-critical flight controls with sophisticated artificial intelligence (AI), aiming at autonomous flight by 2030.
• The intent is to engineer an advanced Ansys SCADE® tool that links traditional model-based software development with new AI-based development flow. This certified safe AI solution will be pivotal to reducing development time and expenses.
Go-to-market expansion through partner activities
37
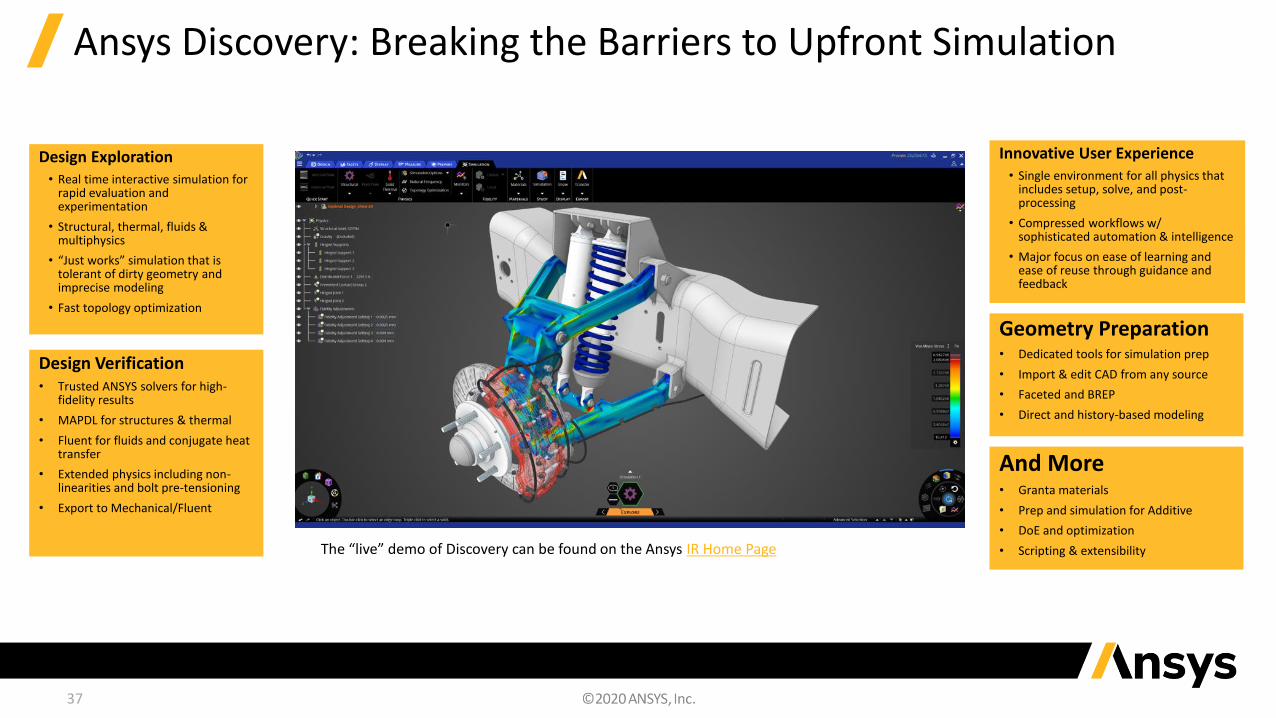
Ansys Discovery: Breaking the Barriers to Upfront Simulation
And More• Granta materials
• Prep and simulation for Additive
• DoE and optimization
• Scripting & extensibility
Design Verification• Trusted ANSYS solvers for high-
fidelity results
• MAPDL for structures & thermal
• Fluent for fluids and conjugate heat transfer
• Extended physics including non-linearities and bolt pre-tensioning
• Export to Mechanical/Fluent
Design Exploration• Real time interactive simulation for
rapid evaluation and experimentation
• Structural, thermal, fluids & multiphysics
• “Just works” simulation that is tolerant of dirty geometry and imprecise modeling
• Fast topology optimization
Geometry Preparation• Dedicated tools for simulation prep
• Import & edit CAD from any source
• Faceted and BREP
• Direct and history-based modeling
Innovative User Experience• Single environment for all physics that
includes setup, solve, and post-processing
• Compressed workflows w/ sophisticated automation & intelligence
• Major focus on ease of learning and ease of reuse through guidance and feedback
The “live” demo of Discovery can be found on the Ansys IR Home Page
Source: “Quantifying the Return on Investment in Simulation Lead Design Exploration.” Data based on third party survey completed by Mediafly, 2020 and commissioned by Ansys.
38
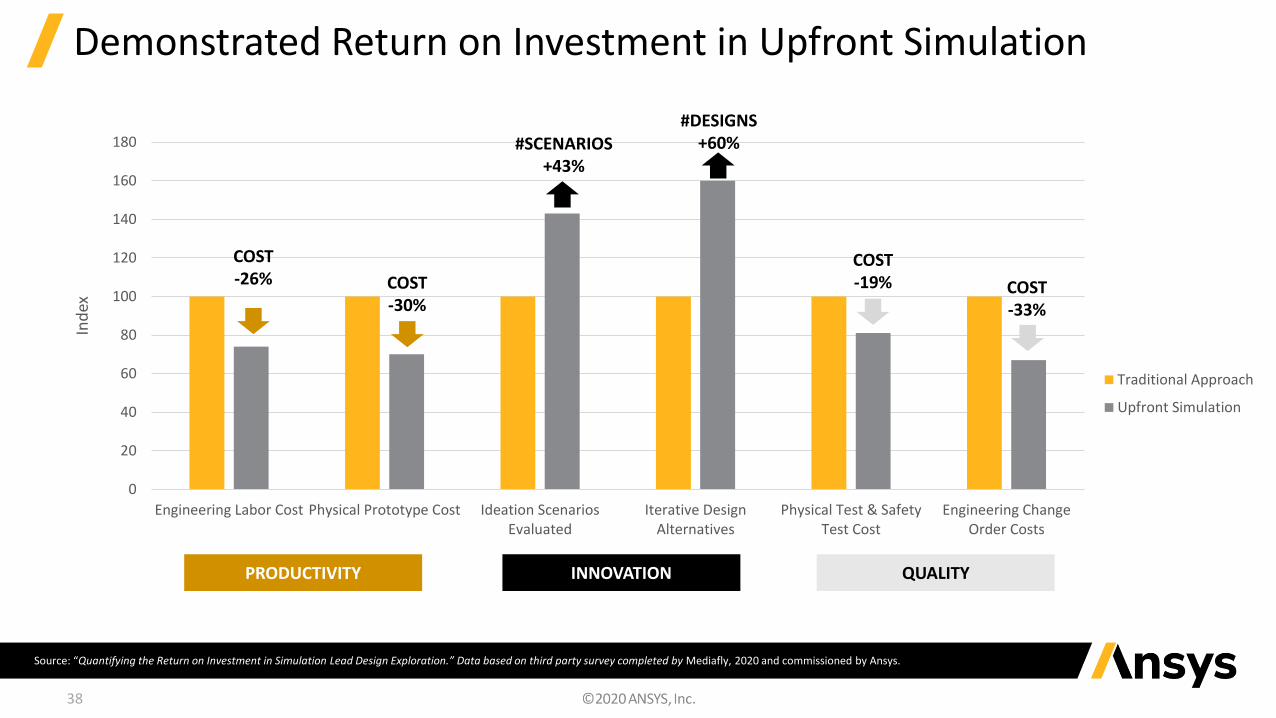
Demonstrated Return on Investment in Upfront Simulation
0
20
40
60
80
100
120
140
160
180
Engineering Labor Cost Physical Prototype Cost Ideation ScenariosEvaluated
Iterative DesignAlternatives
Physical Test & SafetyTest Cost
Engineering ChangeOrder Costs
Ind
ex
Traditional Approach
Upfront Simulation
PRODUCTIVITY INNOVATION QUALITY
COST-26% COST
-30%
#SCENARIOS+43%
#DESIGNS+60%
COST-19% COST
-33%

39
Adjacencies – Additive: Two Distinct Customer Groups – Two Products
Additional information located at www.ansys.com/products/structures/ansys-additive-print
• Designers in aerospace, defense, auto OEMs & medical
• Metal additive manufacturing machine operators
• Part manufacturing operations managers
• FEA analysts in aerospace, defense, auto OEMs & medical
• Owners of “part qualification” within OEMs
• Materials/manufacturing researchers
Ansys Additive Print Ansys Additive Suite
40
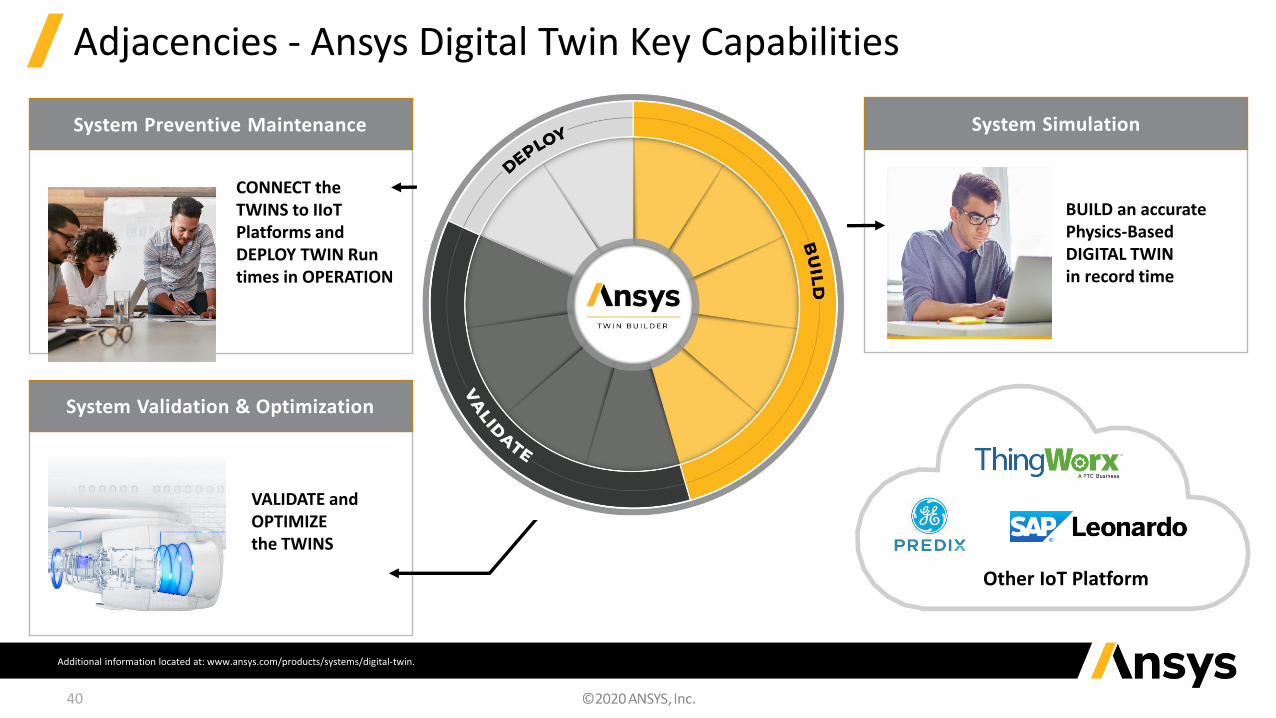
Adjacencies - Ansys Digital Twin Key Capabilities
System Preventive Maintenance
System Validation & Optimization
System Simulation
CONNECT the TWINS to IIoT Platforms and DEPLOY TWIN Run times in OPERATION
VALIDATE and OPTIMIZEthe TWINS
BUILD an accuratePhysics-BasedDIGITAL TWINin record time
Other IoT Platform
Additional information located at: www.ansys.com/products/systems/digital-twin.
ANSYS IS THE SIMULATION
MARKET LEADER
OUR STRATEGY CAPITALIZES ON THIS GROWING
MARKET
THE SIMULATION MARKET IS STRONG
AND GROWING
41
Well Positioned in a Growing Market
WE HAVE A PROVEN RECORD
OF EXECUTION
42
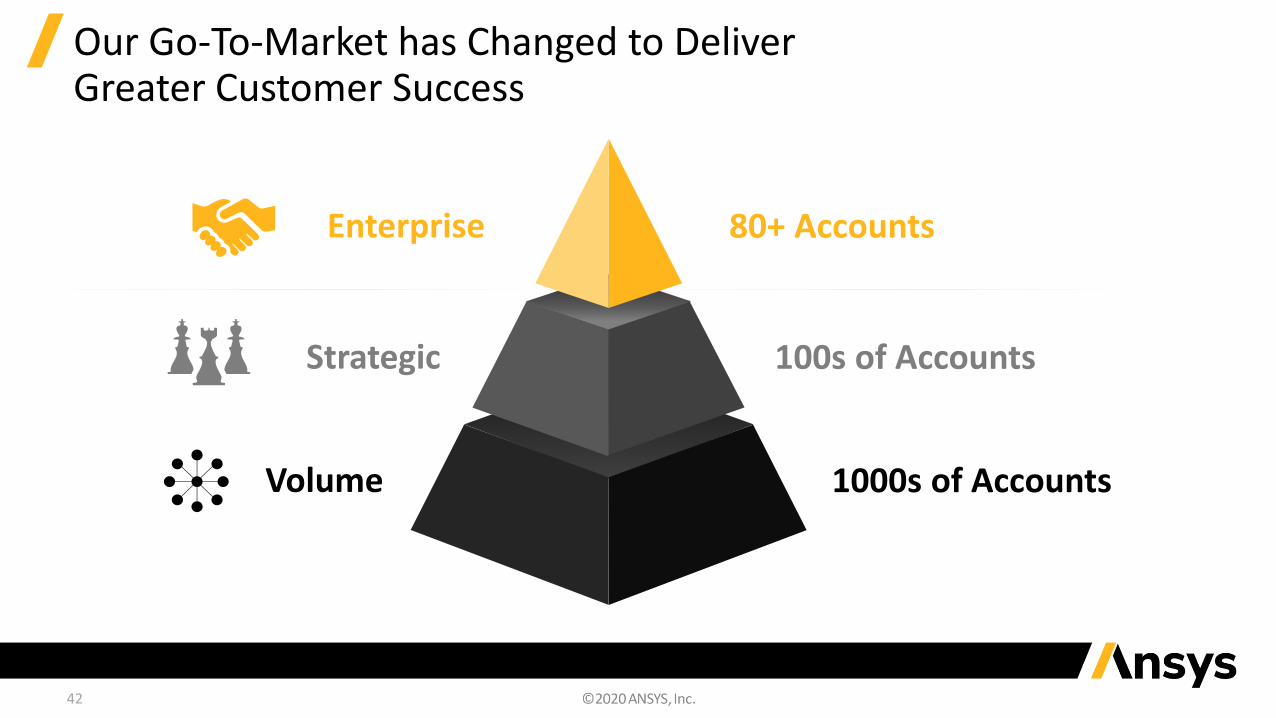
Our Go-To-Market has Changed to Deliver Greater Customer Success
Enterprise
Strategic
Volume
80+ Accounts
100s of Accounts
1000s of Accounts

43
Reinforce and Extend Leadership in the Core
• Strong growth as enterprise account
‐ Increased usage
‐ Multiphysics
• Large electrification opportunity
Each of the 80+ enterprise accounts offers strong growth opportunities
StructuresComputationalFluid Dynamics
Direct Modeling
High-Frequency Electronics and
Systems
Materials
Low-Frequency Electronics and
Systems
Electrification Functional Safety
ACCELERATED ADOPTION OF SIMULATION1995 2019 2026
U.S. Multinational Case Example
Minerva
Digital Thread
Digital Twins
~$8.6M ~$10.3M
~$16.7M
~$20.0M
Ansys Learning HubAnsys Deployment and Adoption Services Sustained ACV growth with every new contract
44
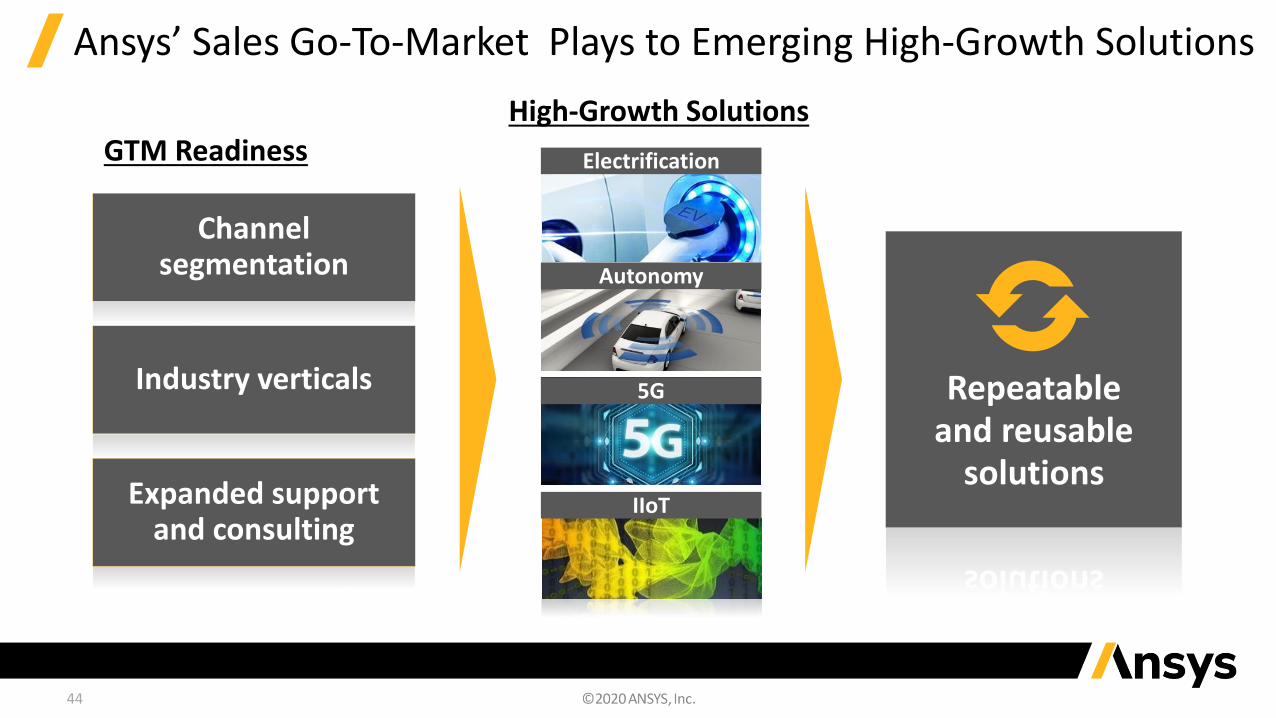
Ansys’ Sales Go-To-Market Plays to Emerging High-Growth Solutions
Channel segmentation
Industry verticals
Expanded support and consulting
Repeatableand reusable
solutions
GTM ReadinessHigh-Growth Solutions
Electrification
Autonomy
5G
IIoT
45
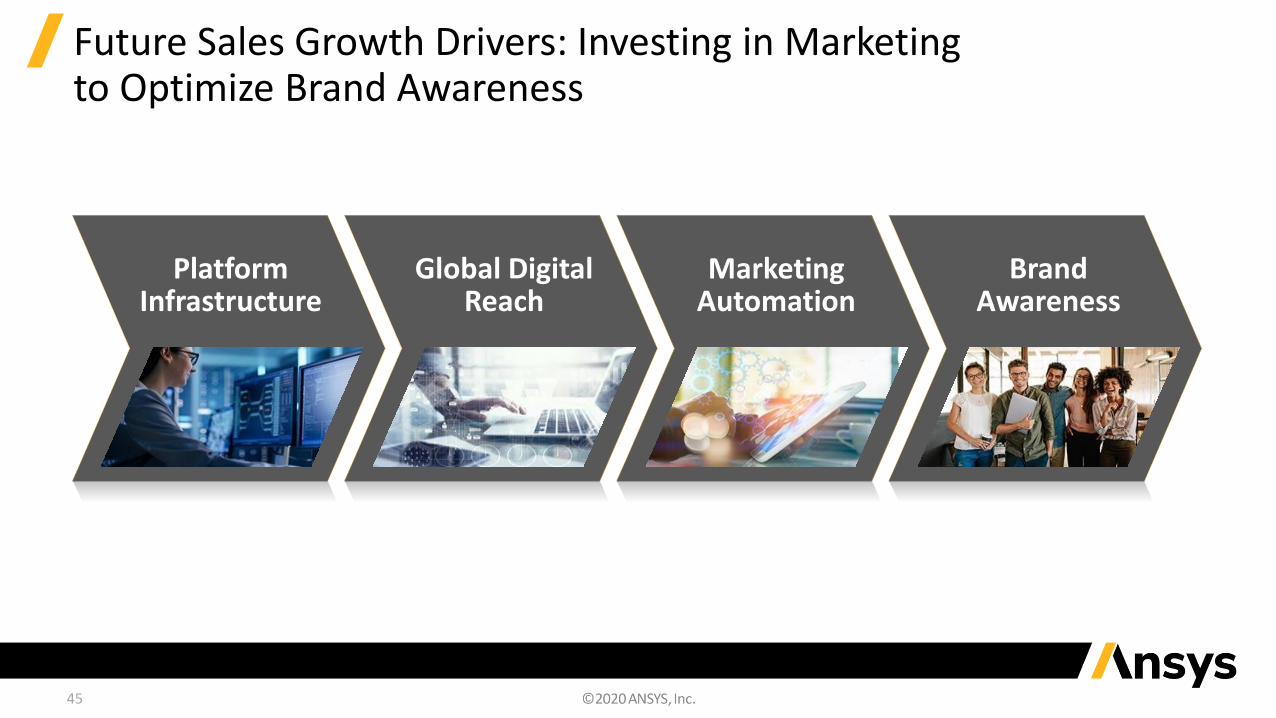
Future Sales Growth Drivers: Investing in Marketing to Optimize Brand Awareness
Global Digital Reach
Marketing Automation
BrandAwareness
PlatformInfrastructure

46
Future Sales Growth Drivers: Leveraging Acquisitions and Ecosystem
Renewal
Upsell
Cross Sell
$
Expand Customer RelationshipsWith Acquisitions
Penetrate New MarketsWith Strategic Ecosystem
Technology OEM
Supply chain Enablement
Academic
Industry Experts
47
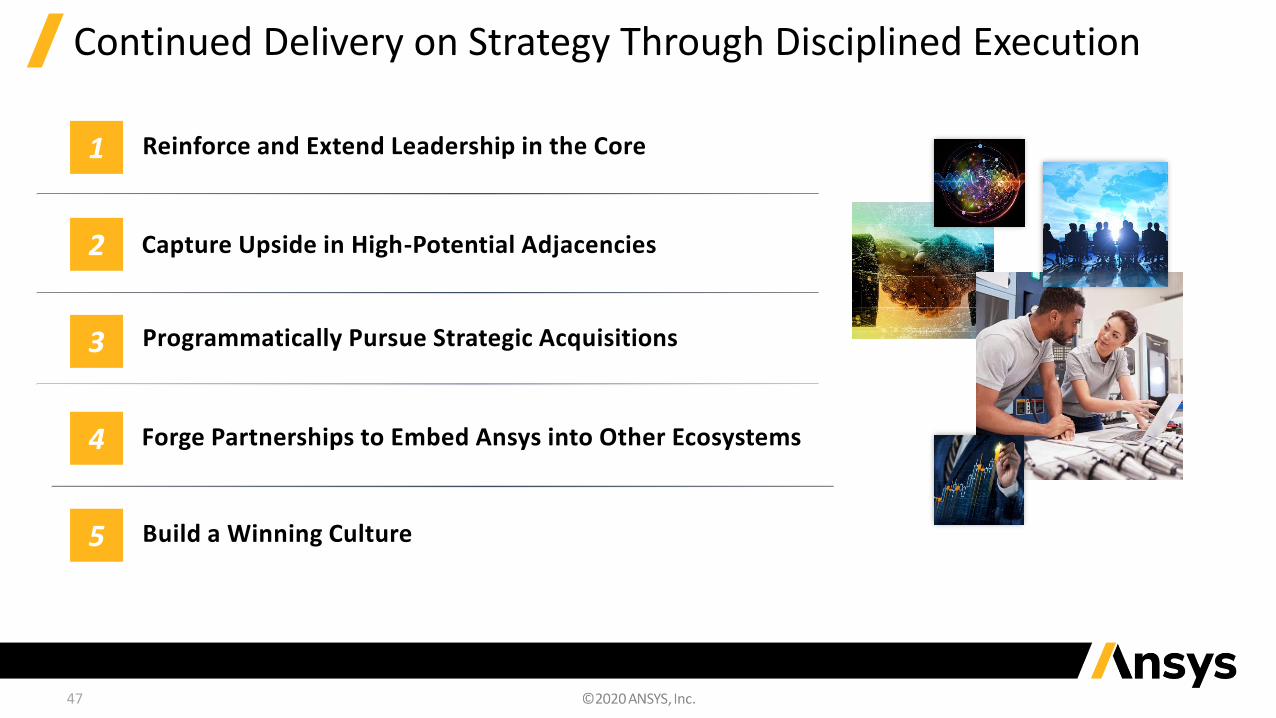
Continued Delivery on Strategy Through Disciplined Execution
Reinforce and Extend Leadership in the Core
Programmatically Pursue Strategic Acquisitions
Build a Winning Culture
Forge Partnerships to Embed Ansys into Other Ecosystems
Capture Upside in High-Potential Adjacencies
1
2
3
4
5
48
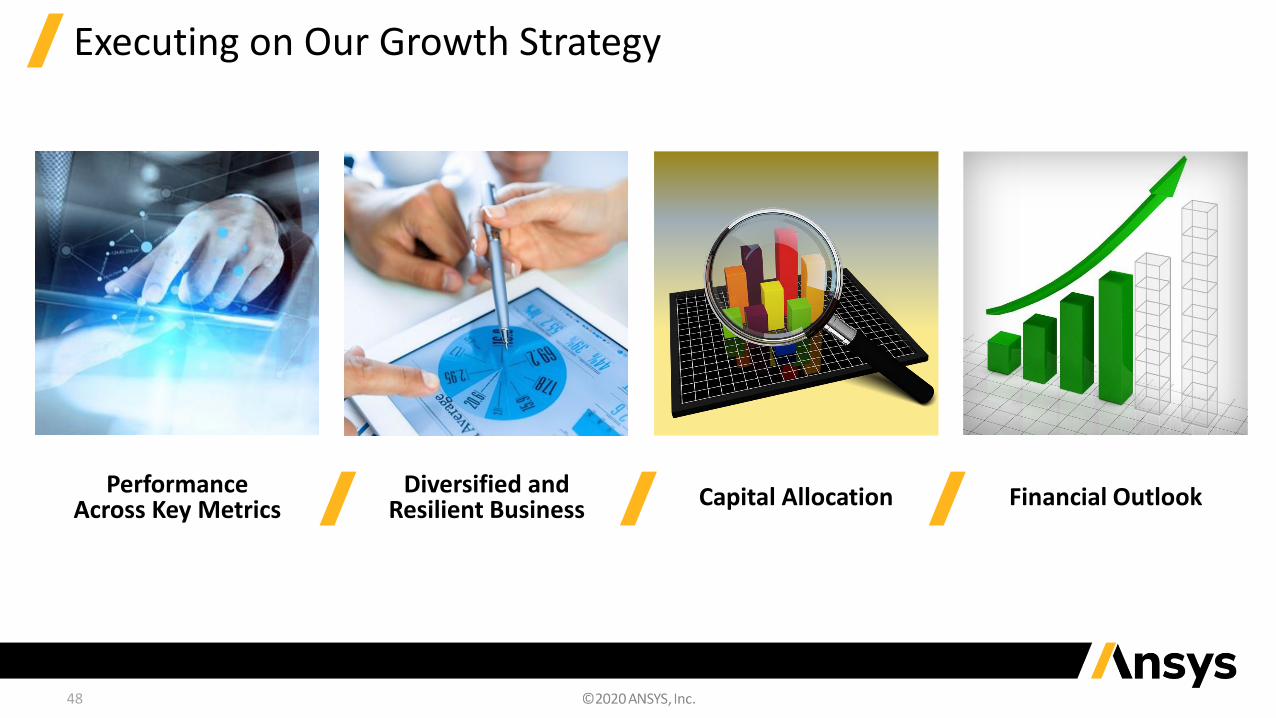
Executing on Our Growth Strategy
Diversified andResilient Business Capital Allocation Financial OutlookPerformance
Across Key Metrics
49
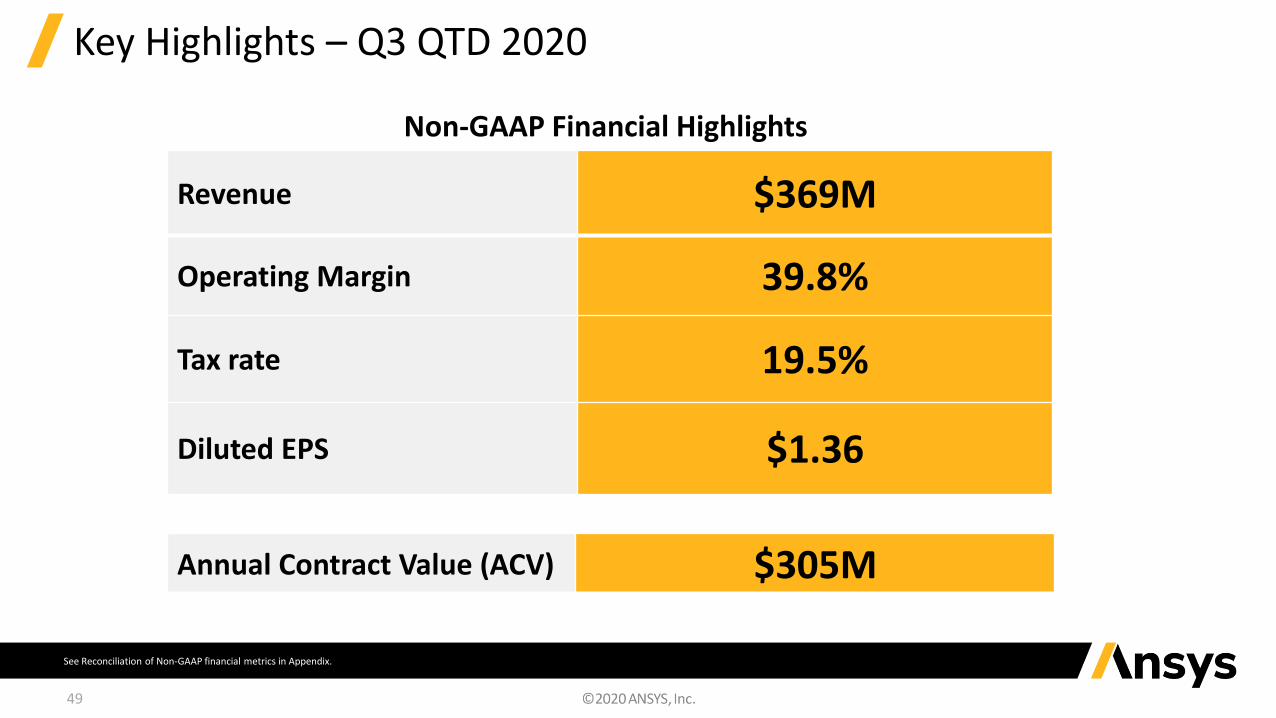
Key Highlights – Q3 QTD 2020
See Reconciliation of Non-GAAP financial metrics in Appendix.
Revenue $369M
Operating Margin 39.8%
Tax rate 19.5%
Diluted EPS $1.36
Annual Contract Value (ACV) $305M
Non-GAAP Financial Highlights

50
Strong Annual Contract Value – Q3 YTD
$920 $951
Q3 YTD 2019 Q3 YTD 2020
Recurring Non-Recurring
81% ofQ3 YTD 2020 ACV
from recurring sources77% from
recurring sources
51
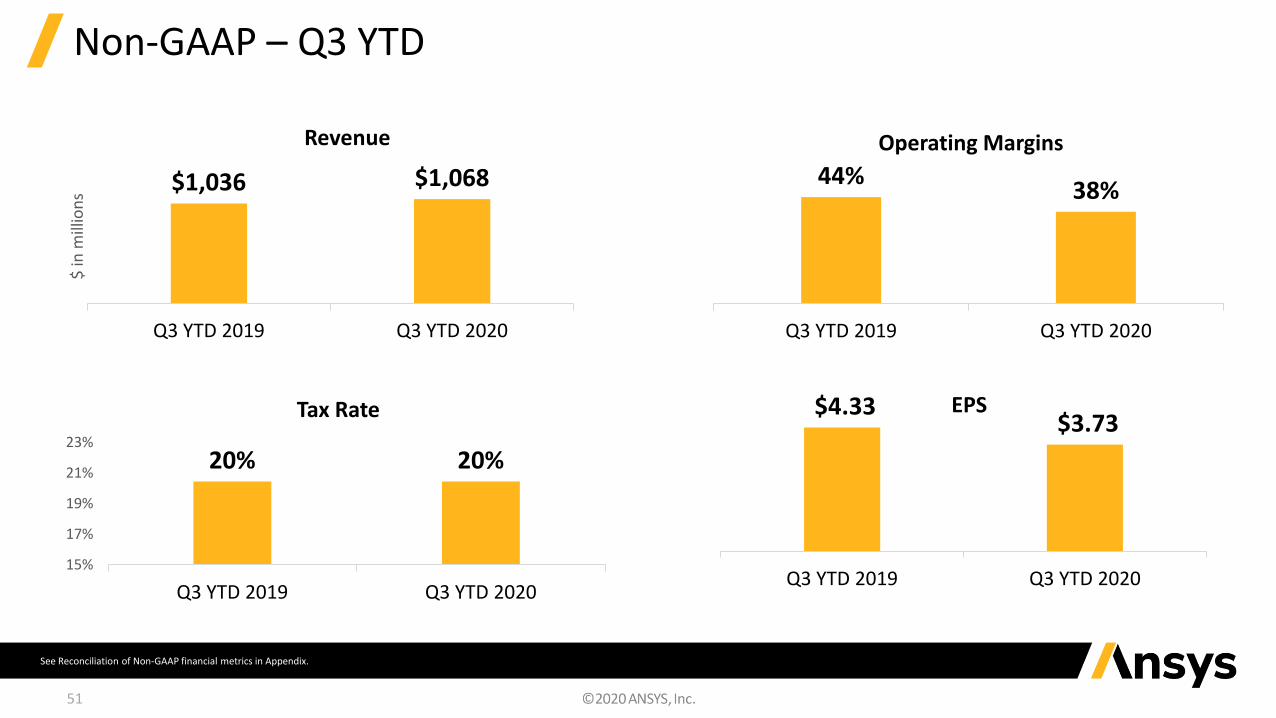
Non-GAAP – Q3 YTD
See Reconciliation of Non-GAAP financial metrics in Appendix.
$4.33 $3.73
Q3 YTD 2019 Q3 YTD 2020
EPS
44%38%
Q3 YTD 2019 Q3 YTD 2020
Operating Margins
20% 20%
15%
17%
19%
21%
23%
Q3 YTD 2019 Q3 YTD 2020
Tax Rate
$1,036 $1,068
Q3 YTD 2019 Q3 YTD 2020
$ in
mill
ion
s
Revenue
52
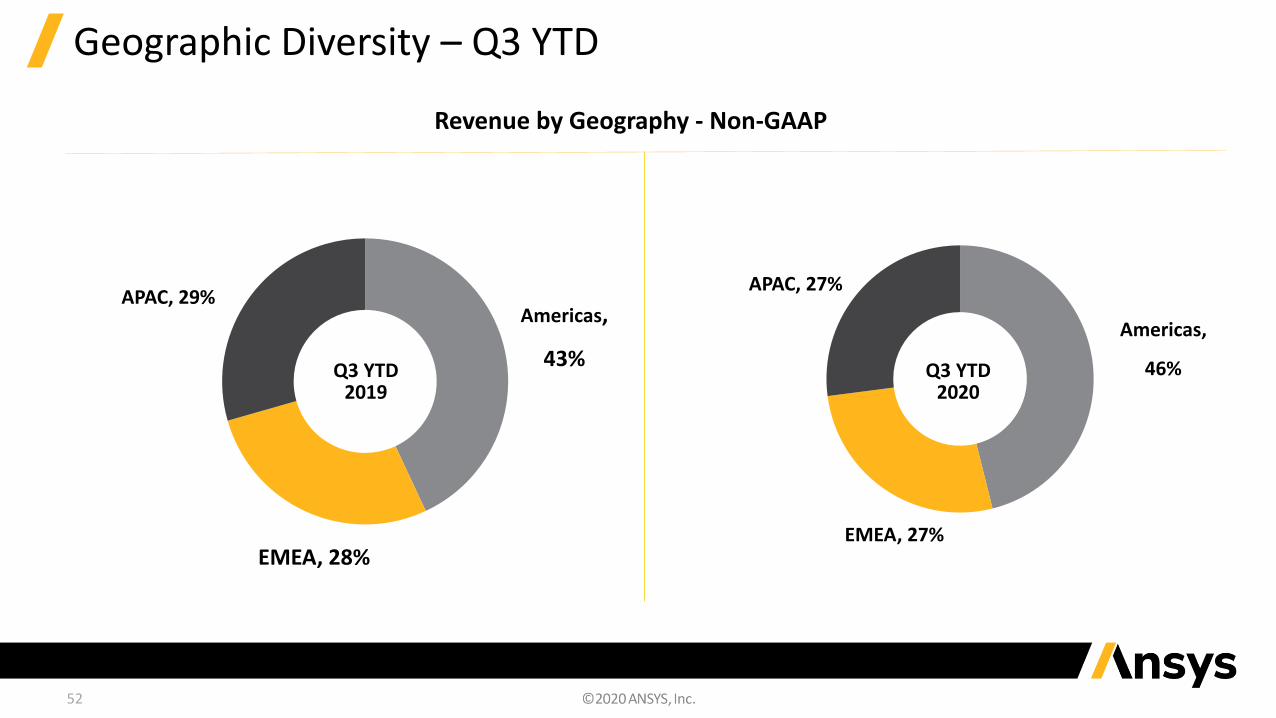
Geographic Diversity – Q3 YTD
Americas,
46%
EMEA, 27%
APAC, 27%
Revenue by Geography - Non-GAAP
Americas,
43%
EMEA, 28%
APAC, 29%
Q3 YTD 2019
Q3 YTD 2020
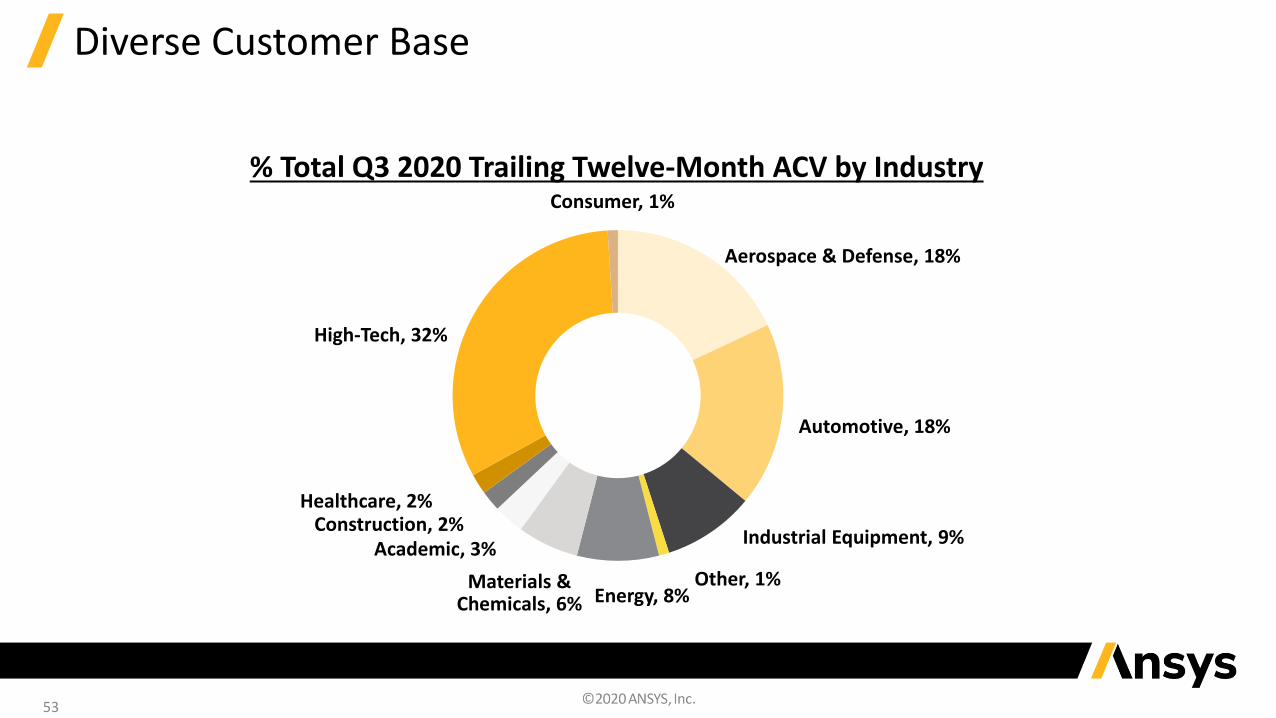
Diverse Customer Base
Aerospace & Defense, 18%
Automotive, 18%
Industrial Equipment, 9%
Other, 1%Energy, 8%
Materials & Chemicals, 6%
Academic, 3%Construction, 2%
Healthcare, 2%
High-Tech, 32%
Consumer, 1%
% Total Q3 2020 Trailing Twelve-Month ACV by Industry
53

54
Diverse Revenue Sources – Q3 YTD
23% 22%
55% 59%
18% 15%
4% 4%
Q3 YTD 2019 Q3 YTD 2020
Lease Maintenance Perpetual Service
(Revenue by Type - Non-GAAP)($ Million)
23%
Lease & Maintenance Revenue
$240 $238
$566 $625
$191 $162$39 $43
Q3 YTD 2019 Q3 YTD 2020
Lease Maintenance Perpetual Service
(Revenue as a % of Total - Non-GAAP)
Lease&
MaintenanceRevenue
78%
81%
$1,036 $1,068
55
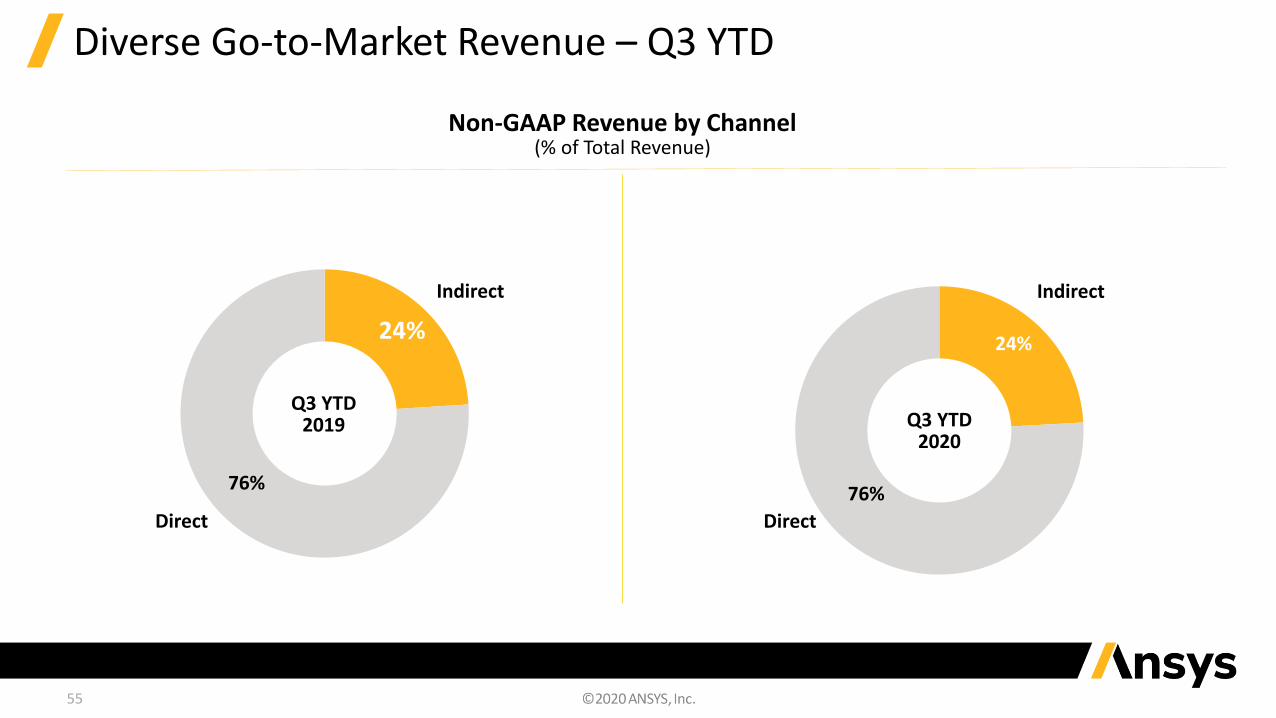
Diverse Go-to-Market Revenue – Q3 YTD
Direct
Indirect
24%
76%
Non-GAAP Revenue by Channel(% of Total Revenue)
Q3 YTD 2019 Q3 YTD
2020
24%
Indirect
Direct
76%
56
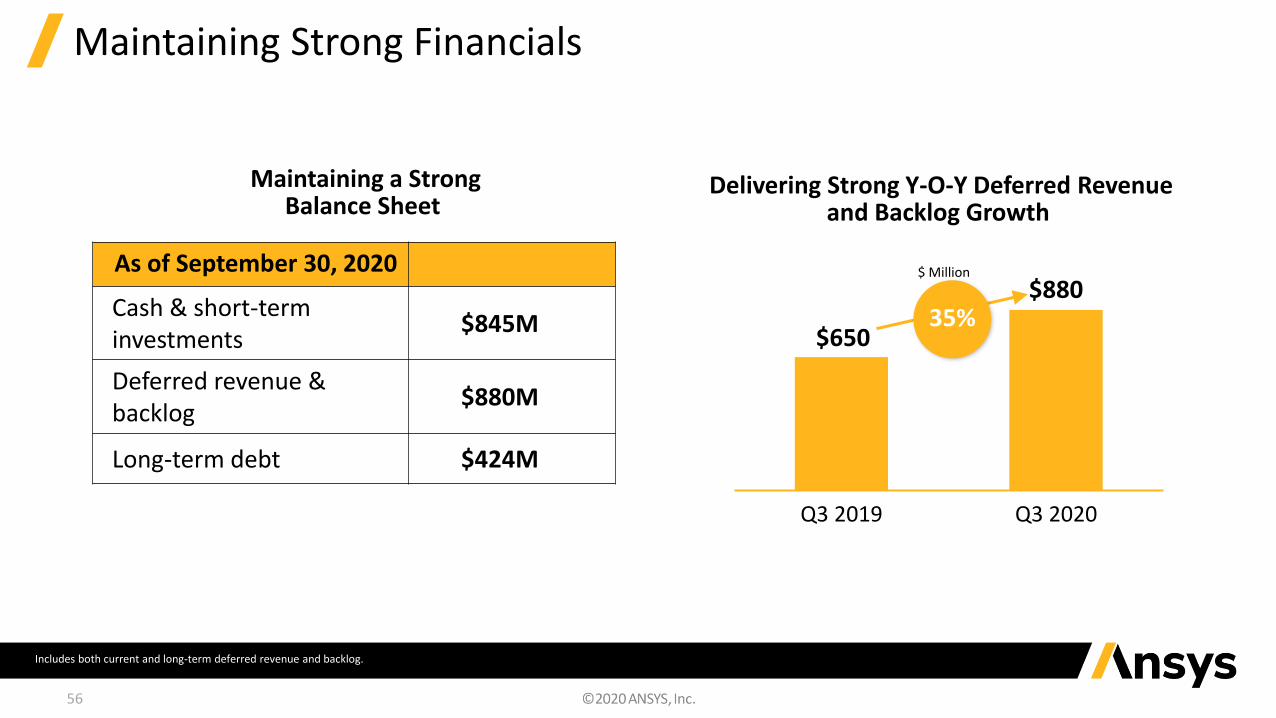
Maintaining Strong Financials
As of September 30, 2020
Cash & short-term investments
$845M
Deferred revenue & backlog
$880M
Long-term debt $424M
$650
$880
Q3 2019 Q3 2020
$ Million
35%
Delivering Strong Y-O-Y Deferred Revenue and Backlog Growth
Maintaining a Strong Balance Sheet
Includes both current and long-term deferred revenue and backlog.
57
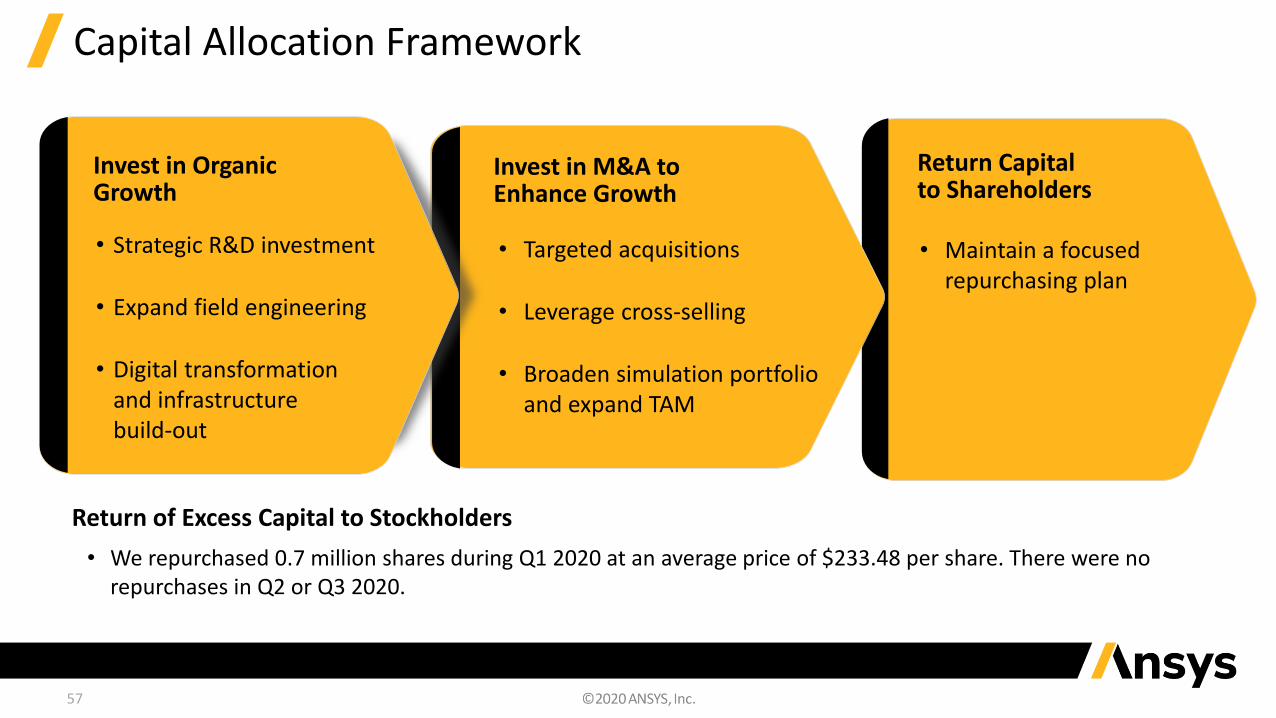
Capital Allocation Framework
• Maintain a focused repurchasing plan
Return Capital to Shareholders
• Targeted acquisitions
• Leverage cross-selling
• Broaden simulation portfolio and expand TAM
Invest in M&A to Enhance Growth
Invest in OrganicGrowth
• Strategic R&D investment
• Expand field engineering
• Digital transformationand infrastructure build-out
• We repurchased 0.7 million shares during Q1 2020 at an average price of $233.48 per share. There were no repurchases in Q2 or Q3 2020.
Return of Excess Capital to Stockholders
58
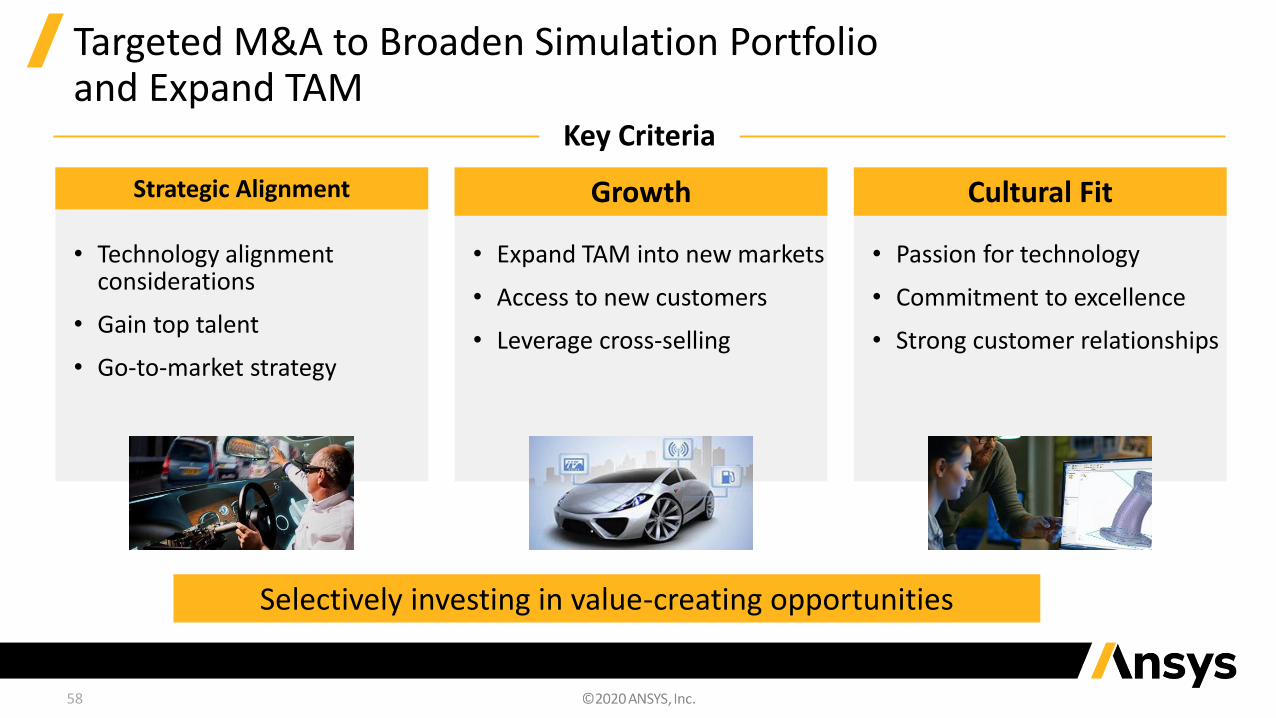
Targeted M&A to Broaden Simulation Portfolio and Expand TAM
Selectively investing in value-creating opportunities
Strategic Alignment
• Technology alignment considerations
• Gain top talent
• Go-to-market strategy
Growth
• Expand TAM into new markets
• Access to new customers
• Leverage cross-selling
Cultural Fit
• Passion for technology
• Commitment to excellence
• Strong customer relationships
Key Criteria
59
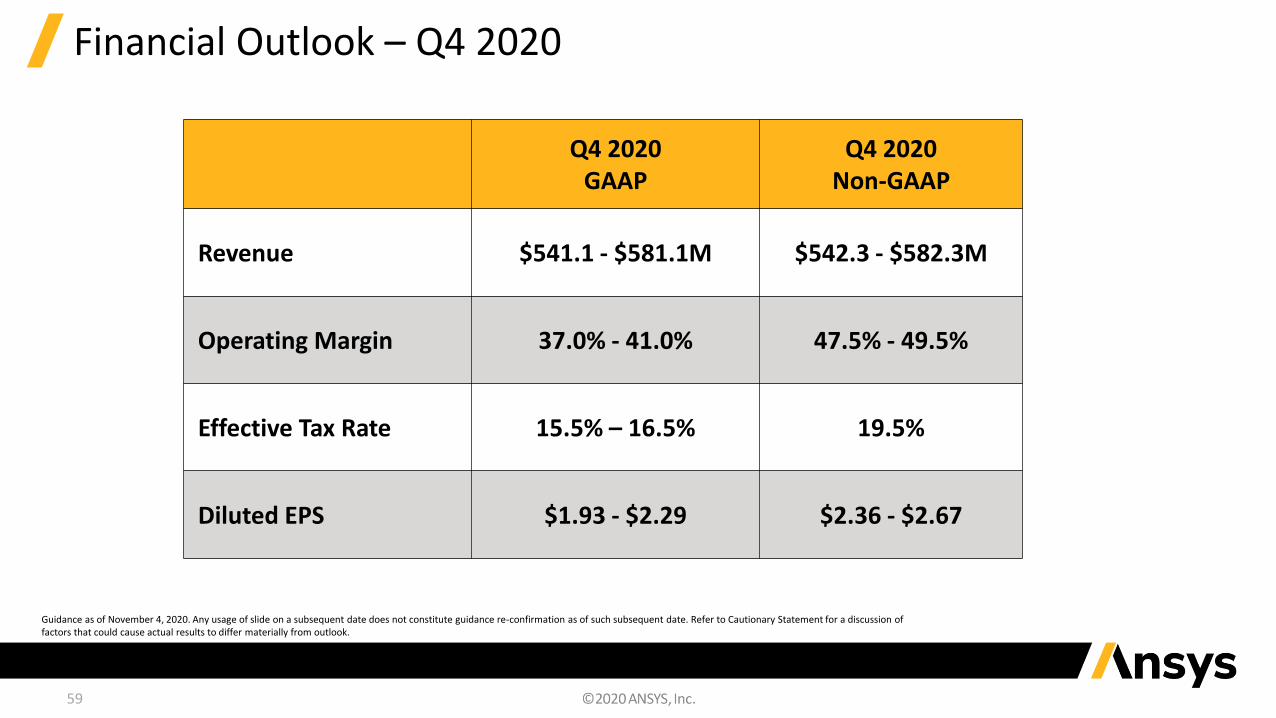
Financial Outlook – Q4 2020
Q4 2020GAAP
Q4 2020Non-GAAP
Revenue $541.1 - $581.1M $542.3 - $582.3M
Operating Margin 37.0% - 41.0% 47.5% - 49.5%
Effective Tax Rate 15.5% – 16.5% 19.5%
Diluted EPS $1.93 - $2.29 $2.36 - $2.67
Guidance as of November 4, 2020. Any usage of slide on a subsequent date does not constitute guidance re-confirmation as of such subsequent date. Refer to Cautionary Statement for a discussion of factors that could cause actual results to differ materially from outlook.
60
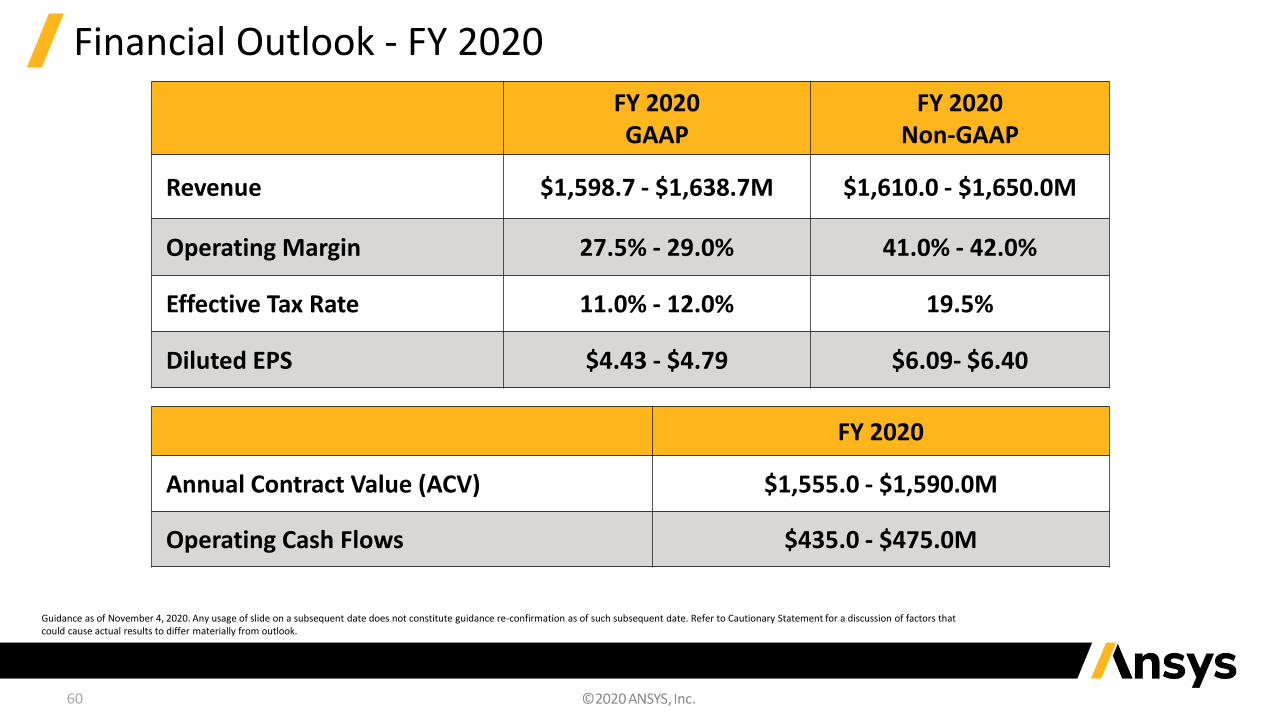
Financial Outlook - FY 2020
FY 2020GAAP
FY 2020Non-GAAP
Revenue $1,598.7 - $1,638.7M $1,610.0 - $1,650.0M
Operating Margin 27.5% - 29.0% 41.0% - 42.0%
Effective Tax Rate 11.0% - 12.0% 19.5%
Diluted EPS $4.43 - $4.79 $6.09- $6.40
FY 2020
Annual Contract Value (ACV) $1,555.0 - $1,590.0M
Operating Cash Flows $435.0 - $475.0M
Guidance as of November 4, 2020. Any usage of slide on a subsequent date does not constitute guidance re-confirmation as of such subsequent date. Refer to Cautionary Statement for a discussion of factors that could cause actual results to differ materially from outlook.
61
The Growth Story Continues to 2022: Marching Towards $2B ACV and Investing Selectively
45% 42-44%
FY 2019 FY 2022
• Continued execution on Pervasive Simulation strategy
• Capitalize on emerging high-growth solutions
• Invest in world-class customer-facing expertise
• Includes impact of “tuck-in” acquisitions
• Slight dilution from M&A
• Ongoing infrastructure and digital transformation investments
Marching Toward $2 Billion! Investing in the Business
$1.5B
$2.0B
FY 2019 FY 2022
ACVOperating Margins
(Non-GAAP)
11%+CAGR
Investment

Appendix
63
Non-GAAP MeasuresWe provide non-GAAP revenue, non-GAAP gross profit, non-GAAP gross profit margin, non-GAAP operating income, non-GAAP operating profit margin, non-GAAP net income and non-GAAP diluted
earnings per share as supplemental measures to GAAP regarding our operational performance. These financial measures exclude the impact of certain items and, therefore, have not been calculated in
accordance with GAAP. A detailed explanation of each of the adjustments to such financial measures is described below. These prepared remarks also contain a reconciliation of each of these non-GAAP
financial measures to its most comparable GAAP financial measure.
We use non-GAAP financial measures (a) to evaluate our historical and prospective financial performance as well as our performance relative to our competitors, (b) to set internal sales targets and
spending budgets, (c) to allocate resources, (d) to measure operational profitability and the accuracy of forecasting, (e) to assess financial discipline over operational expenditures and (f) as an important
factor in determining variable compensation for management and employees. In addition, many financial analysts that follow us focus on and publish both historical results and future projections based on
non-GAAP financial measures. We believe that it is in the best interest of our investors to provide this information to analysts so that they accurately report the non-GAAP financial information. Moreover,
investors have historically requested, and we have historically reported, these non-GAAP financial measures as a means of providing consistent and comparable information with past reports of financial
results.
While we believe that these non-GAAP financial measures provide useful supplemental information to investors, there are limitations associated with the use of these non-GAAP financial measures. These
non-GAAP financial measures are not prepared in accordance with GAAP, are not reported by all our competitors and may not be directly comparable to similarly titled measures of our competitors due to
potential differences in the exact method of calculation. We compensate for these limitations by using these non-GAAP financial measures as supplements to GAAP financial measures and by reviewing the
reconciliations of the non-GAAP financial measures to their most comparable GAAP financial measures.
The adjustments to these non-GAAP financial measures, and the basis for such adjustments, are outlined below:
Acquisition accounting for deferred revenue. Historically, we have consummated acquisitions in order to support our strategic and other business objectives. In accordance with the fair value provisions
applicable to the accounting for business combinations, acquired deferred revenue is often recorded on the opening balance sheet at an amount that is lower than the historical carrying value. Although this
acquisition accounting requirement has no impact on our business or cash flow, it adversely impacts our reported GAAP revenue in the reporting periods following an acquisition. In order to provide
investors with financial information that facilitates comparison of both historical and future results, we provide non-GAAP financial measures which exclude the impact of the acquisition accounting
adjustment. We believe that this non-GAAP financial adjustment is useful to investors because it allows investors to (a) evaluate the effectiveness of the methodology and information used by us in our
financial and operational decision-making, and (b) compare our past and future reports of financial results as the revenue reduction related to acquired deferred revenue will not recur when related lease
licenses and software maintenance contracts are renewed in future periods.
Amortization of intangible assets from acquisitions. We incur amortization of intangible assets, included in our GAAP presentation of amortization expense, related to various acquisitions we have
made. We exclude these expenses for the purpose of calculating non-GAAP gross profit, non-GAAP gross profit margin, non-GAAP operating income, non-GAAP operating profit margin, non-GAAP net
income and non-GAAP diluted earnings per share when we evaluate our continuing operational performance because these costs are fixed at the time of an acquisition, are then amortized over a period of
several years after the acquisition and generally cannot be changed or influenced by us after the acquisition. Accordingly, we do not consider these expenses for purposes of evaluating our performance
during the applicable time period after the acquisition, and we exclude such expenses when making decisions to allocate resources. We believe that these non-GAAP financial measures are useful to
investors because they allow investors to (a) evaluate the effectiveness of the methodology and information used by us in our financial and operational decision-making, and (b) compare our past reports of
financial results as we have historically reported these non-GAAP financial measures.

64
Non-GAAP MeasuresStock-based compensation expense. We incur expense related to stock-based compensation included in our GAAP presentation of cost of maintenance and service; research and development expense; and selling, general
and administrative expense. This non-GAAP adjustment also includes excess payroll tax expense related to stock-based compensation. Stock-based compensation expense (benefit) incurred in connection with our deferred
compensation plan held in a rabbi trust includes an offsetting benefit (charge) recorded in other income (expense). Although stock-based compensation is an expense and viewed as a form of compensation, we exclude these
expenses for the purpose of calculating non-GAAP gross profit, non-GAAP gross profit margin, non-GAAP operating income, non-GAAP operating profit margin, non-GAAP net income and non-GAAP diluted earnings per share
when we evaluate our continuing operational performance. We similarly exclude income (expense) related to assets held in a rabbi trust in connection with our deferred compensation plan. Specifically, we exclude stock-based
compensation and income (expense) related to assets held in the deferred compensation plan rabbi trust during our annual budgeting process and our quarterly and annual assessments of our performance. The annual
budgeting process is the primary mechanism whereby we allocate resources to various initiatives and operational requirements. Additionally, the annual review by our board of directors during which it compares our historical
business model and profitability to the planned business model and profitability for the forthcoming year excludes the impact of stock-based compensation. In evaluating the performance of our senior management and
department managers, charges related to stock-based compensation are excluded from expenditure and profitability results. In fact, we record stock-based compensation expense into a stand-alone cost center for which no
single operational manager is responsible or accountable. In this way, we can review, on a period-to-period basis, each manager's performance and assess financial discipline over operational expenditures without the effect of
stock-based compensation. We believe that these non-GAAP financial measures are useful to investors because they allow investors to (a) evaluate our operating results and the effectiveness of the methodology used by us to
review our operating results, and (b) review historical comparability in our financial reporting as well as comparability with competitors' operating results.
Transaction expenses related to business combinations. We incur expenses for professional services rendered in connection with business combinations, which are included in our GAAP presentation of selling, general and
administrative expense. These expenses are generally not tax-deductible. We exclude these acquisition-related transaction expenses, derived from announced acquisitions, for the purpose of calculating non-GAAP operating
income, non-GAAP operating profit margin, non-GAAP net income and non-GAAP diluted earnings per share when we evaluate our continuing operational performance, as we generally would not have otherwise incurred these
expenses in the periods presented as a part of our operations. We believe that these non-GAAP financial measures are useful to investors because they allow investors to (a) evaluate our operating results and the effectiveness
of the methodology used by us to review our operating results, and (b) review historical comparability in our financial reporting as well as comparability with competitors' operating results.
Tax Cuts and Jobs Act. We recorded impacts to our income tax provision related to the enactment of the Tax Cuts and Jobs Act of 2017, specifically for the transition tax related to unrepatriated cash and the impacts of the tax
rate change on net deferred tax assets. We exclude these impacts for the purpose of calculating non-GAAP net income and non-GAAP diluted earnings per share when we evaluate our continuing operational performance, as (i)
the charges are not expected to recur as part of our normal operations and (ii) the charges resulted from the extremely infrequent event of major U.S. tax reform, the last such reform having occurred in 1986. We believe that
these non-GAAP financial measures are useful to investors because they allow investors to (a) evaluate our operating results and the effectiveness of the methodology used by us to review our operating results, and (b) review
historical comparability in our financial reporting.
Non-GAAP tax provision. We utilize a normalized non-GAAP annual effective tax rate (AETR) to calculate non-GAAP measures. This methodology provides better consistency across interim reporting periods by eliminating the
effects of non-recurring items and aligning the non-GAAP tax rate with our expected geographic earnings mix. To project this rate, we analyzed our historic and projected non-GAAP earnings mix by geography along with other
factors such as our current tax structure, recurring tax credits and incentives, and expected tax positions. On an annual basis we will re-evaluate this rate for significant items that may materially affect our projections.
Non-GAAP financial measures are not in accordance with, or an alternative for, GAAP. Our non-GAAP financial measures are not meant to be considered in isolation or as a substitute for comparable GAAP financial measures
and should be read only in conjunction with our consolidated financial statements prepared in accordance with GAAP.
We have provided a reconciliation of the non-GAAP financial measures to the most directly comparable GAAP financial measures as listed below:
GAAP Reporting Measure Non-GAAP Reporting MeasureRevenue Non-GAAP RevenueGross Profit Non-GAAP Gross ProfitGross Profit Margin Non-GAAP Gross Profit MarginOperating Income
Non-GAAP Operating IncomeOperating Profit Margin Non-GAAP Operating Profit MarginNet Income
Non-GAAP Net IncomeDiluted Earnings Per Share Non-GAAP Diluted Earnings Per Share

65
Appendix
66
Appendix

67
Appendix
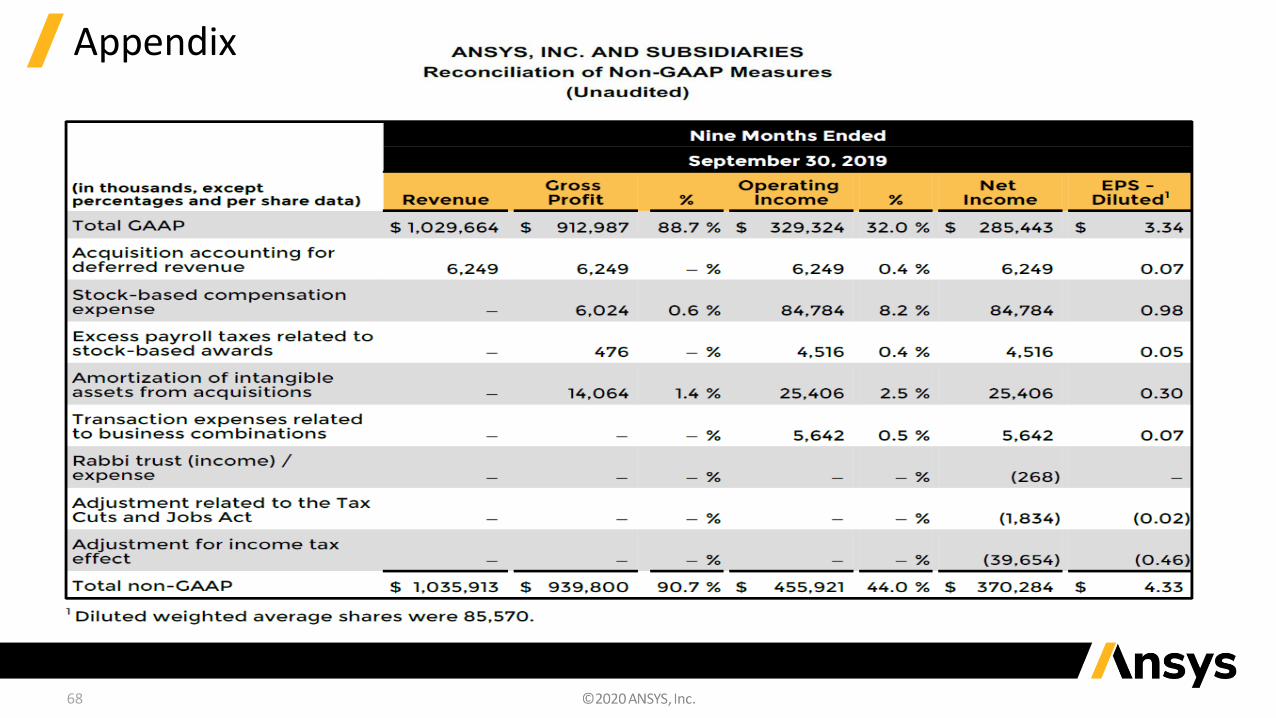
68
Appendix
69
AppendixANSYS, INC. AND SUBSIDIARIES
Reconciliation of Forward-Looking Guidance
Quarter Ending December 31, 2020
Earnings Per Share -Diluted
U.S. GAAP expectation $1.93 - $2.29
Exclusions before tax:
Acquisition adjustments to deferred revenue $0.01
Acquisition-related amortization $0.15 - $0.17
Stock-based compensation and related excess payroll tax $0.39 - $0.45
Transaction expenses related to business combinations $0.02
Adjustment for income tax effect ($0.19) - ($0.22)
Non-GAAP expectation $2.36 - $2.67
ANSYS, INC. AND SUBSIDIARIES
Reconciliation of Forward-Looking Guidance
Year Ending December 31, 2020
Earnings Per Share -Diluted
U.S. GAAP expectation $4.43 - $4.79
Exclusions before tax:
Acquisition adjustments to deferred revenue $0.13
Acquisition-related amortization $0.63 - $0.65
Stock-based compensation and related excess payroll tax $1.69 - $1.75
Transaction expenses related to business combinations $0.05
Adjustment for income tax effect ($0.89) - ($0.92)
Non-GAAP expectation $6.09 - $6.40
70
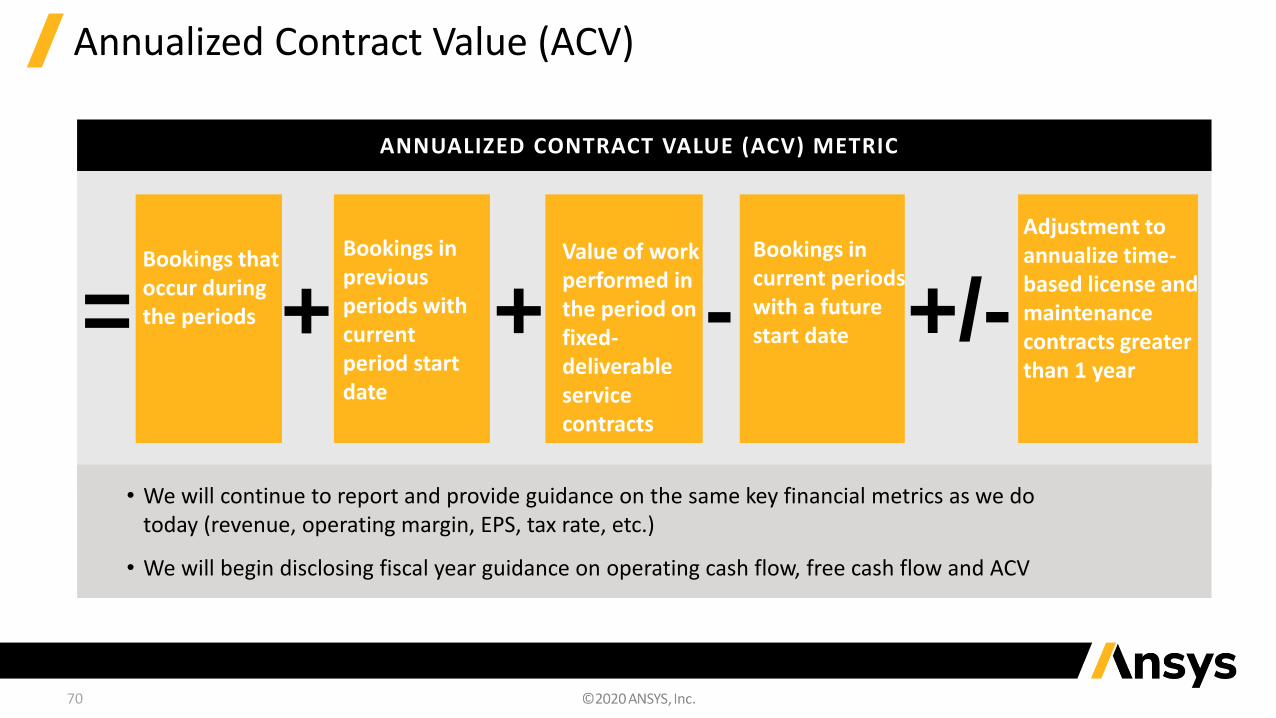
Annualized Contract Value (ACV)
ANNUALIZED CONTRACT VALUE (ACV) METRIC
= + - +/-Bookings that occur during the periods
Bookings in previous periods with current period start date
Adjustment to annualize time-based license and maintenance contracts greater than 1 year
• We will continue to report and provide guidance on the same key financial metrics as we do today (revenue, operating margin, EPS, tax rate, etc.)
• We will begin disclosing fiscal year guidance on operating cash flow, free cash flow and ACV
Bookings in current periodswith a future start date+
Value of work performed in the period on fixed-deliverable service contracts

Annette N. Arribas, IRCSenior Director, Global Investor Relations Officer
Phone: +1 (724) 820-3700Email: [email protected]
NASDAQ:ANSS
Virginea Stuart GibsonInvestor Relations ManagerPhone: +1 (724) 820-4225
Email: [email protected]
https://investors.ansys.com