INNOVATION STRATEGIES OF LATECOMER FIRMS … · 1.1.3 Open Innovation as a Critical Strategy for...
184
INNOVATION STRATEGIES OF LATECOMER FIRMS FROM EMERGING ECONOMIES ZHAO YANG YANG (M.Sc. NATIONAL UNIVERSITY OF SINGAPORE; CITY UNIVERSITY OF HONG KONG) A THESIS SUBMITTED FOR THE DEGREE OF DOCTOR OF PHILOSOPHY DIVISION OF ENGINEERING AND TECHNOLOGY MANAGEMENT NATIONAL UNIVERSITY OF SINGAPORE 2013
Transcript of INNOVATION STRATEGIES OF LATECOMER FIRMS … · 1.1.3 Open Innovation as a Critical Strategy for...

INNOVATION STRATEGIES OF LATECOMER
FIRMS FROM EMERGING ECONOMIES
ZHAO YANG YANG
(M.Sc. NATIONAL UNIVERSITY OF SINGAPORE; CITY UNIVERSITY OF HONG KONG)
A THESIS SUBMITTED FOR THE DEGREE OF
DOCTOR OF PHILOSOPHY
DIVISION OF ENGINEERING AND TECHNOLOGY
MANAGEMENT
NATIONAL UNIVERSITY OF SINGAPORE
2013

DECLARATION
I hereby declare that the thesis is my original work and it has been written by
me in its entirety. I have duly acknowledged all the sources of information
which have been used in the thesis.
This thesis has also not been submitted for any degree in any university previously.
Zhao Yang-Yang
29 May, 2013

i
ACKNOWLEDGMENT
I would like to express my deep gratitude to several people who supported me in
my PhD journey. First and foremost, I am indebted to my supervisors Professor
C. C. Hang, Professor P. K. Wong and Dr A. Subramanian for their insightful
guidance and constant support. They have been wonderful advisors who have
encouraged and challenged me intellectually regarding this research in all
possible ways. They provided me with excellent training in formulating research
questions, writing research articles and in addressing reviewers‘ comments. They
have been generous with their patience and time. I am thankful for every moment
I spent with them at National University of Singapore (NUS). Their personal
imprints on me are far beyond research. It is fortunate to have them as my
supervisors.
I am grateful to my other thesis committee members, Professor C. Watanabe,
Professor Y. R. Choi and Professor J. Kasser for their invaluable guidance and
support in enriching this thesis. I also benefited greatly from the many valuable
comments and suggestions by Professor W. Vanhaverbeke, Professor E. Gansey,
Professor C. Tucci and Professor P. Phan. Any errors and omissions remain my
own.
It has been wonderful to be a part of the NUS academic community. I have learnt
a lot from the faculty and fellow students in the Division of Engineering and
Technology Management (D-ETM). I specially thank A/Professor K. H. Chai,

ii
Professor C. Lee and Professor C. C. Tang for their support. I would also like to
thank the staff of D-ETM – Patricia, Mavis and Mable – who helped me with
administrative matters. Generous help from Dr Y. Ruan, Ms. W. Li, Ms. A. Fong,
Mr. Y. C. Cheng and Mr. Y. H. Lan is also very much appreciated.
In addition, I am grateful to NUS for providing a research scholarship during my
PhD programme. NUS and our division also provided conference fundings, which
made it possible for me to attend SMS China conference (Guangzhou, Dec.
2012), PICMET Summer Conference (Vancouver, Jul. 2012), IEEM Annual
Meeting (Singapore, Dec. 2011), where I presented papers based on this thesis.
The publications were mainly joint-written papers with my supervisors.
Finally and more importantly, my special thanks go to my parents who have been
my greatest source of strength. They motivated me to embark on this PhD journey
and encouraged me to make my PhD dream a reality. This thesis is dedicated to
them.

iii
TABLE OF CONTENTS
ACKNOWLEDGEMENT………………………………………………...….…i
TABLE OF CONTENTS……………………………………………………... iii
LIST OF TABLES………………………………………………………..…..…v
LIST OF FIGURES………………………………………………………….....vi
SUMMARY…………………………………………………………………….vii
CHAPTER 1. ........................................................................................................... 1
INTRODUCTION................................................................................................... 1
1.1 Research Background and Motivation ..................................................... 1 1.1.1 Disadvantages and Advantages of Latecomer Firms ............................................ 6 1.1.2 Innovation Strategies of Latecomer Firms ........................................................... 9 1.1.3 Open Innovation as a Critical Strategy for Latecomer Firms ............................. 12 1.1.4 Combined Utilization of Open Innovation and Disruptive Innovation .............. 16
1.2 Objectives and Significance of the Thesis ............................................... 17
1.3 Organization of the Thesis ..................................................................... 22
CHAPTER 2. ......................................................................................................... 23
TECHNOLOGY LICENSING AND INNOVATION PERFORMANCE ...... 23
2.1 Introduction ........................................................................................... 23
2.2 Theory and Hypothesis .......................................................................... 27
2.3 Data and Methodology ........................................................................... 37 2.3.1 Sample and Data ................................................................................................. 37 2.3.2 Variables ............................................................................................................. 38 2.3.3 Methods .............................................................................................................. 42
2.4 Results .................................................................................................... 44
2.5 Discussion and Summary ....................................................................... 52
CHAPTER 3. ......................................................................................................... 59
SUBSTITUTION EFFECT IN MERGERS AND ACQUISITIONS ON
INNOVATION PERFORMANCE...................................................................... 59
3.1 Introduction ........................................................................................... 59
3.2 Theory and Hypothesis .......................................................................... 63
3.3 Data and Methodology ........................................................................... 73 3.3.1 Sample and Data ................................................................................................. 73 3.3.2 Variables ............................................................................................................. 74 3.3.3 Methods .............................................................................................................. 78
3.4 Results .................................................................................................... 78

iv
3.5 Discussion and Summary ....................................................................... 87
CHAPTER 4. ......................................................................................................... 90
COMBINING OPEN INNOVATION AND DISRUPTIVE INNOVATION .. 90
4.1 Introduction ........................................................................................... 90
4.2 Theory Background ............................................................................... 92 4.2.1 Latecomers‘ Disruptive Innovation Path ............................................................ 92 4.2.2 Latecomers‘ Perspective of Cooperation ............................................................ 94 4.2.3 Dynamics between Latecomers and Incumbents in Disruptive Innovation ........ 97
4.3 Methodology ........................................................................................ 100 4.3.1 Research Strategy ............................................................................................. 100 4.3.2 Disruptive Innovation Cases by Chinese Latecomers ...................................... 103
4.3.2.1 Haier: Success with the Non-Consuming Market............................................ 103 4.3.2.2 Haier America: The Leader in Niche Markets ................................................ 104 4.3.2.3 Galanz: New Designs for Emerging Markets .................................................. 105 4.3.2.4 The Zhejiang E-bike Community: A Two-wheeler Revolution ........................ 106 4.3.2.5 CIMC: Giving Big Opportunities to Spin-offs ................................................. 109 4.3.2.6 UFIDA: Slow and Steady Wins the Race ........................................................ 111
4.4 Discussion ............................................................................................. 113 4.4.1 Conditions for Combining Open Innovation and Disruptive Innovation ......... 113 4.4.2 Utilization of Open Innovation by Latecomer Disruptors and Incumbents ...... 120
4.5 Summary .............................................................................................. 124
CHAPTER 5. ...................................................................................................... 128
CONCLUSION .................................................................................................. 128
5.1 Summary of Theoretical Contributions ............................................... 128
5.2 Summary of Managerial Implications .................................................. 131
5.3 Recommendations for Future Work .................................................... 138
BIBLIOGRAPHY .............................................................................................. 142
PUBLICATIONS ............................................................................................... 170

v
LIST OF TABLES
Table 0-1. Summary of the three essays .................................................................. xi
Table 2-1. Descriptive statistics for Essay One ...................................................... 46
Table 2-2. Negative binomial regression for Essay One ........................................ 47
Table 2-3. Negative binomial regression for Essay One ........................................ 58
Table 3-1. Descriptive statistics for Essay Two...................................................... 79
Table 3-2. Negative binomial regression for Essay Two ........................................ 80
Table 4-1. Case summary at unit of each innovation............................................ 102
Table 4-2. Case summary at firm level ................................................................. 114

vi
LIST OF FIGURES
Figure 0-1. Conceptual model of the thesis .............................................................. x
Figure 0-2. Complexity of open innovation mechanisms ......................................... x
Figure 1-1. Value creation in an open source environment ...................................... 3
Figure 1-2. Composition of total factor productivity ................................................ 4
Figure 1-3. The process of internalizing spillover technologies .............................. 5
Figure 1-4. An open innovation paradigm ............................................................. 10
Figure 2-1. Licensing expenses in China ................................................................ 25
Figure 2-2. Number of licenses in China‘s high-tech industries ............................ 25
Figure 2-3. Interaction plots for Essay One ............................................................ 52
Figure 3-1. Situations for possible substitution in M&A ........................................ 62
Figure 3-2. Interaction plots for Essay Two ........................................................... 86
Figure 4-1. Two-stage disruptive innovation path ................................................... 93
Figure 4-2. Conditions for combining open innovation and disruptive innovation
for latecomers .................................................................................... 115
Figure 5-1. Proposed matrix for measuring successful M&A .............................. 135
vii
SUMMARY
This thesis consists of three essays on the innovation strategies of latecomer firms
from emerging economies. The main aim is twofold. The first is to study how
these firms use the innovation strategy of the latest generation (Rothwell, 1994) –
open innovation – for technological catching-up. The second is to further explore
the application of open innovation in a specific type of innovation that could
make latecomers an actual economic powerhouse – disruptive innovation
(Christensen, 1997). The conceptual model is illustrated in Figure 0-1; the details
are elaborated in the following paragraphs and Table 0-1.
According to Rothwell (1994) and Chesbrough (2003), the era of open innovation
has arrived: it is critical for firms to draw on external resources through interfirm
cooperation to amplify the value of their own innovation assets and achieve
greater innovation performance. However, current literature indicates that the
actual increase of a latecomer‘s innovation performance through open innovation
may be debatable. In order to ascertain the effectiveness of open innovation to a
latecomer‘s innovation performance, this study examines how latecomers use the
two extreme ends of the open innovation spectrum: licensing and mergers and
acquisitions (M&A).
Open innovation research operates through four different mechanisms, ranging
from simple to complex, as shown in Figure 0-2. The lowest end, licensing, is the

viii
most simple and the most common open innovation mechanism for latecomers to
acquire technologies. M&A is the most complex, necessitating a full range of
resources.
The literature thus far has demonstrated mixed results regarding the impact of
inward technology licensing (ITL) on a latecomer‘s innovation performance.
Based on a sample of 154 Chinese high-tech firms, Essay One firstly investigates
whether ITL could promote a latecomer‘s innovation performance. I then discuss
the importance of technology newness in ITL strategy, arguing that the strategic
choice of the right technology does provide latecomers with the opportunity to
gain the benefits from learning by licensing.
In the past decade, latecomers in China have attempted to swiftly catch up with
technology trends by increasing M&A. Using a sample of 100 listed Chinese
high-tech firms, Essay Two examines the substitution effect in M&A among
latecomers in China. I investigate whether these latecomer acquirers substituted
their own competency with that of the target firms in order to achieve growth
through innovation. It was found that when an acquiring firm integrates a target
firm with a relatively greater knowledge base from a distant technology domain,
increased innovation could result.
Essay Three focuses on the role of open innovation in the disruptive innovation
setting. I argue that disruptive innovation does not necessarily lead to competition
between latecomers and incumbents, and investigate situations where both parties

ix
have cooperated, with beneficial results. In-depth case studies of disruptive
innovation cases in China‘s high-tech industries were conducted to substantiate
this point.
This thesis attempts to fill a number of gaps in the literature. The findings would
advance the knowledge of the strategic management literature of both open
innovation and disruptive innovation, and contribute to the academic views of
latecomer firms from emerging economies.

x
Figure 0-2. Complexity of open innovation mechanisms (Marks and Mirvis, 1998)
Low Complexity
-Investment
-Control over operations
-Commitment of resources
High
Licensing Joint
Ventures
Strategic
Alliance
Mergers &
Acquisitions
Licensing
Mergers &
Acquisitions
Innovation
Performance
Disruptive
Innovation
Essay One:
H1,2,3,4
Figure 0-1. Conceptual model of the thesis
Essay Three:
P1,2,3,4
Essay Two:
H1,2
Open Innovation

xi
Table 0-1. Summary of the three essays
Essay One Technology Licensing and Innovation
Performance: Evidence from Chinese
Latecomers in High-tech Industries
Essay Two Substitution Effect in Mergers and
Acquisitions on Innovation Performance:
Evidence from Chinese Latecomers in
High-tech Industries
Essay Three Combining Open Innovation (OI) and Disruptive
Innovation (DI): Evidence Based on Case Studies
of Chinese Latecomers
Research
Questions
The way by which licensing-in experience
affects innovation performance focusing
on the impacts of number of licenses,
technology age and absorptive capacity.
Whether there is a substitution effect in
M&A and when it takes place at the
acquiring firm.
Whether latecomers could cooperate with
incumbents (i.e., use OI) to commercialize DI
and, if so, what are the conditions for a successful
cooperation.
Hypothesis/
Propositions
H1. The number of licenses has a
curvilinear (an inverted U) effect on the
subsequent innovation performance of a
licensee.
H2. The age of licensed-in technology has
a negative effect on the subsequent
innovation performance of a licensee.
H3. A licensee‘s existing technological
capability positively moderates the
relationship between the number of
licenses and the subsequent innovation
performance.
H4. A licensee‘s existing technological
capability negatively moderates the
relationship between the age of licensed-in
technology and the subsequent innovation
performance.
H1. Technology distance has a negative
effect on the subsequent innovation
performance of an acquiring firm.
H2. The relative knowledge base positively
moderates the relationship between the
technology distance and the subsequent
innovation performance of an acquiring
firm.
P1. In cases where latecomers have
complementary assets and IP, DI can be achieved
without OI. This may be because de alio
latecomers are able to leverage complementary
assets created in other markets.
P2. In cases where latecomers lack complementary
assets and IP in the target market, they may win
by using OI practices in developing and
introducing a DI into the market. However, this is
only possible for latecomers who can subsequently
develop their own complementary assets or IP.
P3. In cases where latecomers have IP but not the
required complementary assets, they can
undertake OI strategies to gain access to external
complementary assets to commercialize DI.
P4. In cases where latecomers have the required
complementary assets but without IP in the target
market, they can source external technologies to
achieve DI by engaging in OI.
Data State Intellectual Property Office of China (SIPO) and firm websites
Taiwan Economic Journal, SIPO, firm annual reports and online reports
interviews, firm websites, academic papers, books and online reports

xii
Essay One Essay Two Essay Three
Unit of
Analysis
Firm Firm Firm
Sample size 151 208 6
Methods Negative binomial regression (firm level) Negative binomial regression with random
effects model (firm year panel)
Multiple case studies
Key
Findings The newer the licensed-in technology is,
the better the subsequent innovation
performance is.
If technology age is not taken into
account, the curvilinear (an inverted U)
relationship between number of licenses
and the subsequent innovation
performance is obscured.
Firms with higher absorptive capacity
have a more optimistic perception to
adopt the larger number of licenses and
newer technologies.
The negative relationship between
technology distance and the subsequent
innovation performance is evidenced
among Chinese latecomers, rather than
an inverted U shape based on developed
economies.
When an acquirer integrates a target firm
with a relatively greater knowledge base
from a distant technology domain, this
better supports the substitution and
promotes innovation.
Whether or not to combine DI and OI would
depend on the presence of complementary
assets and intellectual property.
The three ways to benefit both latecomer
disruptors and incumbents by engaging in OI
are concluded as follows:
(1) OI facilitates a latecomer‘s survival or the
success of DI;
(2) OI allows both latecomers and incumbents
to be involved in DI;
(3) OI, such as out-licensing and spin-offs,
enables incumbents to disrupt themselves.
Contributio-
ns and
Implications
Looking into the characteristics of
licensed-in technologies to evaluate the
effectiveness of Inward Technology
Licensing (ITL) is a possible way to
reconcile previous conflicting empirical
evidences.
Being the first to verify the importance
of technology age raises the needs to
pay more attention to the strategic
choice of licensed-in technologies.
How much a firm can gain from ITL
depends very much on the firm itself.
There is under-recognition of the
substitution effect in the M&A literature.
The strategic intention to undertake
M&A (substitute or not) may be more
important than the management
challenges in maximizing synergies.
Highlighting the difference between
firms from developed economies and
latecomers from emerging economies in
the resource integration with target firms
may add on a more complete picture of
the M&A literature.
The identification of the important role of OI in
establishing and sustaining DI development
changes the sole competition scenario between
latecomer disruptors and incumbents in the DI
literature.
Firms should learn from the benefits of
collaboration and promotes the co-development
of DI by latecomers and incumbents.
Firms should learn to manage its innovation
partners based on their own conditions.

1
CHAPTER1.
INTRODUCTION
1.1 Research Background and Motivation
In the last decade, emerging economies such as China, India, Russia and Brazil
entered in the global competitive landscape, exhibiting unprecedented growth. The
accelerating shift of global economic power has unleashed a vast number of
opportunities to firms located in emerging economies. Firms from emerging
economies generally enter late into the high-tech industries by necessity, not by
their own choices, and thus are termed latecomers (Mathews, 2002). Indeed, some
latecomers have managed to catch up with industry leaders from developed
economies. However, though they may enjoy some initial advantages, latecomers
face myriad challenges of technological catching-up, including poor technology
resources, inferior pre-emption of assets, costly buyer switching costs and less
National Innovation System (NIS) support (Lieberman and Montgomery, 1988;
Cho et al., 1998; Mathews, 2002). To meet these challenges, latecomers are more
likely to cooperate with others and become innovative in order to survive.
Innovation is critical to a latecomer‘s survival. Any innovation strategy adopted by
a latecomer would involve a value creation process that acknowledges the role of
external resources in developing competitive advantages and improving the
effectiveness of innovation. External resources, such as knowledge, assets and

2
skills lie outside the boundaries of latecomers, and are usually owned by
incumbents. Latecomers often access these external resources by cooperation with
other firms. This kind of interfirm cooperation is conceptualized as a new
paradigm, namely open innovation (Chesbrough, 2003; Chesbrough et al., 2006),
which allows a firm to draw on external resources to amplify the value of their
own assets. The focal firm (latecomer in this thesis) usually has weaker resource
accumulation than incumbents (Mathews, 2002). The asymmetric nature of this
relationship between latecomers and incumbents has not gained much attention in
the extant open innovation literature (Chesbrough, 2003; Chesbrough et al., 2006).
However, through the channel of open innovation, latecomers may recognize,
assimilate and apply imported resources to create their own innovations. Once
created, the new innovation is added to the resource pool in the open environment
for other firms to use. For instance, incumbents may adopt a new innovation
created by latecomers to renew their internal competency. Thus, dynamic
cooperative interaction between latecomers and incumbents consists of bilateral
resource flows in the value creation process, which is demonstrated in Figure 1-1.
When latecomers utilize external resources, the differences in the innovation
performance that they create are strongly related to strategic management based on
their internal capabilities. However, while this relationship suggests the
coexistence of potential benefits and additional costs when latecomers adopt open
innovation, open innovation itself does not automatically lead to a convergence of

3
internal and external resources. Thus, an important task in innovation management
is to optimally internalize the external resources, thereby promoting innovation.
Figure 1-1. Value creation in an open source environment
The internalization of the external resources, especially technology resources, is
associated with technological process in a broad sense. The technological process
necessitates both indigenous R&D and the effective utilization of external
technologies. These external technologies generated by other firms are also known
as spillover technologies (Griliches, 1979). There are many factors that affect the
overall technological process, including self-generation factors, dependent factors
and the indirect factors, as shown in Figure 1-2 (Watanabe and Asgari, 2004). The
self-generation factors represent a firm‘s own efforts in technology development,
such as the R&D investment. The dependent factors include assimilated (absorbed)
Incumbent or
Early Innovator
Latecomer or
Imitator Interaction
New Innovation
New Innovation

4
spillover technologies, learning effects and economies of scale. In addition, the
indirect factors, such as labor, capital, managerial improvement, institutional
revolution and policy, also affect the technological process. In this thesis, I focus
on the innovation that contributes to technological development by latecomers,
which can be attributed to collaborative work of learning, spillover technologies
together with existing technology stock generated by internal R&D.
Figure 1-2. Composition of total factor productivity
(Source: Watanabe and Asgari, 2004)
To effectively utilize spillover technologies, latecomers should first be able to
identify which external technology should be learnt, should not be learnt, or cannot
be learnt. Then latecomers should import the technologies that should be learnt
into the existing technology stock and internalize them. The success of this
internalization is determined by the absorptive capacity of latecomers, and thus
absorptive capacity is critical for the effective utilization of spillover technologies.

5
Absorptive capacity can be attributed to the accumulation of past learning
experience. The learning experience results from incorporating the spillover
technologies into the production system. Therefore, learning plays an important
role of the effective utilization of spillover technologies. This process of
internalizing spillover technologies is illustrated in Figure 1-3.
Figure1-3. The process of internalizing spillover technologies
(Source: Watanabe et al., 2001)
Although some latecomers can successfully internalize external resources,
especially spillover technologies, into the innovation process through open
innovation, others are not successful. In order to reveal the strategies behind the
success stories, this thesis aims to examine how latecomers capture value from
open innovation in the emerging economy context.

6
In the following sections, I will review the advantages and disadvantages of being
a latecomer, as well as the innovation strategies that latecomers use to meet these
challenges. A brief overview of previous and on-going research on the innovation
strategies of latecomers will also be presented.
1.1.1 Disadvantages and Advantages of Latecomer Firms
The literature on technological innovation management has shown great interest in
how latecomers are able to catch up with industry leaders. Ever since the entry
order effect was first mentioned and examined by Bain (1956), scholars have
endeavoured to identify latecomer disadvantages and advantages from different
perspectives like the resourced-based view, institutional theory and transaction cost
economics (Hobday, 1995; Cho et al., 1998; Hoskisson et al., 2000; Xie and Wu,
2003; Mathews, 2006; Tzeng, 2008).
Latecomer disadvantages have been mostly examined in four aspects: initial
technology resources being poor, inferior pre-emption of assets, costly buyer
switching costs and less NIS support (Lieberman and Montgomery, 1988; Cho et
al., 1998; Mathews, 2002). As late entrants to an industry, latecomers face many
roadblocks (Mathews, 2002). Unlike latecomers, early movers have developed
technology leadership derived from long-term cumulative experience and learning.
Incumbents may establish technology barriers for latecomers by applying for IP
protection and leveraging industry standard settings (Katz and Shapiro, 1994).

7
Also, early movers may pre-emptively obtain the limited assets, such as locations,
product characteristics, equipment investments and distribution channels
(Lieberman and Montgomery, 1988). Latecomers‘ potential consumers may find
the switching cost to be prohibitive, and will thus remain loyal to existing pioneer
products. The switching cost, including investment to be a qualified innovation
supplier, supplier-specific learning by the buyer and contractual switching cost, are
costly for latecomers due to customers‘ loyalty to existing pioneer products
(Lieberman and Montgomery, 1988; Cho et al., 1998). Latecomers from emerging
economies are usually isolated from the firms that own most of the high-tech
resources, namely incumbents from developed economies. Moreover, the
underdeveloped NIS infrastructure in emerging economies provides insufficient
incentives and protection to domestic firms.
However, latecomer advantages do exist and they shape these firms‘ catching-up
strategies. One such advantage is the lower cost and risk of innovation (Mathews,
2002) than for early movers. For example, industry readiness is usually high in
terms of educated consumers and trained workers when latecomers enter the
market. More importantly, latecomers are able to be free-riders by exploiting the
technology resources of early movers in three main ways. First, knowledge
spillover and learning-based productivity improvements make the free-rider effect
available to latecomers (Lieberman and Montgomery, 1988; Cho et al., 1998).
Second, cost reduction can be achieved in the labour market by pre-employee
screenings because early movers have already performed the verification and

8
education of the past employees (Guasch and Weiss, 1980). Third, latecomers can
take advantage of pre-empted assets by partnering with others. This partly stems
from the complementary ownership of assets co-specialized with the underlying
innovation. In addition, latecomers can learn from early movers‘ mistakes, both
technological and otherwise. The market tests by early movers may spare
latecomers from the risk of the unknown nature of customer response to an
innovation.
The four basic characteristics of latecomer firms have been outlined by Mathews
(2002) as follows: (1) Industry entry: late entrant to an industry, not by choice but
by historical necessity; (2) Resources: initially resource poor, e.g., lacking
technology and market access; (3) Strategic intent: focused on catching-up as its
primary goal (Mathews and Cho, 1999); (4) Competitive position: some initial
competitive advantages, such as low cost, which can be achieved by learning from
proven technologies/prior experiences initiated by predecessors. Besides,
latecomers from emerging economies have another characteristic of being close to
emerging markets. In spite of their resource constraints, they may react to the
latent needs in emerging markets actively due to less organizational inertia. To
further achieve their strategic goal of catching-up, latecomers must be able to
overcome their disadvantages and leverage their advantages. The latecomer
challenges can be resolved by targeted strategies, which will be elaborated in the
next section.

9
1.1.2 Innovation Strategies of Latecomer Firms
Rothwell‘s (1994) five generations of innovation are recognized worldwide as a
milestone in the development of an understanding of innovation strategies. In the
early 1950s, the rise of multinational firms in the west and Japan swelled the
economy through high-tech development. Thus, the first generation of innovation
was mainly driven by technology breakthroughs, and R&D was regarded as a
firm‘s ‗ivory tower‘. From the 1960s to the 1970s, the battle for market shares
shifted the innovation focus to the second generation, namely the ‗market pull‘
generation. Subsequently, in the mid-1970s, the emergence of inflation and
stagflation motivated firms to cut down on their operational costs. Hence, R&D
and marketing became more tightly aligned, and this coupling is now referred to as
the third generation of innovation. As the economy recovered in the early 1980s,
the revolution of the fourth generation of innovation started from a ‗time-based
struggle‘ where the strategic focus was on integrated business processes and
linkages between suppliers and leading customers were strengthened. From the
1990s onward, resource constraints became the central debate. As a critical part of
their innovation management, firms began to look outside their boundaries for
collaborative partnerships. This is called the fifth generation, also known as the
era of open innovation, and is notable for its emphasis on system integration and
networking. Chesbrough (2003) claimed that open innovation had become the new
paradigm of external resource utilization. By doing so, a firm can move back and
forth more flexibly via different mechanisms, as illustrated in Figure 1-4.

10
In contrast to the other four generations, the fifth generation is not clearly defined
at an operational level. Although research has proven that open innovation is
beneficial to incumbents, less attention has been paid to latecomers. Thus, there is
much to investigate with regard to how open innovation may impact latecomers‘
growth.
Figure 1-4. An open innovation paradigm (Chesbrough, 2003)
During the last decade, due to the decentralization of manufacturing and the
Internet, this openness and access to information has sped up resource transfers
around the globe. Hence, many firms have experienced change at a rate well
beyond what could have been expected. Information symmetry has enhanced the
freedom of technology transfer and created a new stream of innovators, i.e.,
latecomers. Unlike fast followers, these firms do not use open innovation passively;
rather, they use external resources in order to innovate.
Furthermore, the type of innovation that a latecomer performs is selective,
depending on its specific disadvantages and advantages. According to Tidd et al.
11
(2001) and Gatignon et al. (2002), innovations can be classified as incremental
innovation (sustaining innovation and continuous innovation), radical innovation
(sustaining innovation and discontinuous innovation) or disruptive innovation
(discontinuous innovation). Next, I will examine all three types of innovation and
explain why disruptive innovation has proven to be the most beneficial to
latecomers.
Incremental Innovation: Through incremental innovation, a firm makes a
sustainable improvement to an existing product and develops a critical competitive
strategy in an established industry. However, incremental innovation does not
appear to be an ideal candidate for those latecomers for two reasons: first,
latecomers might not have the existing technology to incrementally improve;
second, it is almost impossible for latecomers to succeed when competing directly
with incumbents in an incremental innovation market.
Radical Innovation: Through radical innovation, a firm dramatically changes a
product to create a high-end market with greater profits. Radical innovation is not
suitable for latecomers, as they would not have sufficient time, financial resources
and technological capabilities to create superior technologies.
Disruptive Innovation: Disruptive innovation enables firms to create a new ride,
or to attack the mainstream market from the low-end, if their products are good
enough. Even if latecomers have limited resources, they can successfully use
disruptive innovation. This is particularly true for such firms in emerging

12
economies, where many hidden needs may still be unmet at the bottom of the
pyramid markets (Prahalad, 2004, 2012). To focus on the needed business model,
latecomers likely require technological support from external partners. However,
unlike latecomers, incumbents are usually not attracted to disruptive innovation in
low-end or new niche markets (Christensen, 1997). Thus, incumbents feel less
threatened and are willing to cooperate with latecomers. This cooperation allows
incumbents to act as significant economic players in new or low-end markets.
The aforementioned five generations, each with its own specific innovation
strategy, offer simple representations of a complex business world. The different
innovation strategies belonging to the distinct generations can occur concurrently
to bring about better and faster innovations. By focusing on latecomers‘ strategic
dimensions, this thesis investigates the significance of the innovation strategy of
the latest generation, namely open innovation, and the disruptive innovation
strategy that offers the most favourable innovation trajectory for technological
catching-up. Specifically, this thesis will examine the general impact of open
innovation on latecomers‘ growth, as well as how this strategy affects the
development of disruptive innovation. Thus, the next two subsections will review
the literature on the impact of open innovation on latecomers‘ growth and the
combined utilization of open innovation and disruptive innovation.
1.1.3 Open Innovation as a Critical Strategy for Latecomer Firms
The foundation of how well latecomers can create innovation is how well they

13
formulate strategies through targeted catching-up efforts. Of these various
strategies, technology acquisition through open innovation is especially useful for
latecomers with limited resources to break technology barriers and renew their
internal competency. As previously discussed, entering the industry late may give
latecomers the unexpected advantage of being able to access already-developed
advanced technologies. Latecomers can then use the proven technologies to create
innovation at a lower cost, and do it more quickly than the early movers who
initially developed the technologies. To secure such an advantage, latecomers must
complete the following two steps. First, they should identify which technologies
are useful and then secure access to them through the channel of open innovation.
For example, inward technology licensing (ITL) is the most basic channel of
technology transfer and has been widely adopted by latecomers. Second, the
latecomers should evolve from learners to innovators, relying on their absorptive
capacity. Absorptive capacity is a firm‘s ability to recognize the value of
technology, assimilate it, and then apply it for an innovation (Cohen and Levinthal,
1989). Some latecomers are indeed able to absorb imported technologies and
quickly develop innovations in order to seize booming market opportunities.
Others without enough absorptive capacity can use the most complex channel of
open innovation, namely mergers and acquisitions (M&A). Although it is complex
in terms of investment, operations and commitment of resources (Marks and
Mirvis, 1998), M&A is the fastest track to acquire a full range of resources and
allows latecomers to import technologies as well as other relevant innovation

14
assets, such as absorptive capacity, complementary assets and R&D equipment.
Thus, the research covering ITL and M&A is able to explain the effectiveness of
open innovation on a latecomer‘s innovation performance.
The development of ITL has a long history. Since the mid-1980s, the establishment
of intellectual property (IP) protection has increased firms‘ willingness to perform
out-licensing and technology utilization beyond their boundaries (Gallini, 2002;
Dahlander and Gannb, 2010). Latecomers may find innovative opportunities with
other firms who own the IP. The gradual maturity of the IP system promotes
latecomers as licensees to participate in the development of other components or
associated products (Chesbrough et al., 2006). In addition to exploring the
environmental readiness, researchers (Link et al., 1983; Atuahene-Gima, 1993)
have investigated two important conditions used by latecomers to decide whether
to license or not: (1) the firm‘s characteristics and (2) the management‘s
perceptions. The transition from opportunity identification to licensing decision is
one of the two stages needed for successful ITL (Atuahene-Gima, 1993). The other
stage is the post-adoption stage that encompasses technology adoption to
innovation performance (Atuahene-Gima, 1993). However, the determinants for
the post-adoption stage are limited, primarily due to licensing experience, and the
impact of licensing experience on actual innovation performance is still
inconclusive (Ahuja and Katila, 2001; Álvarez et al., 2002; Johnson, 2002; Tsai
and Wang, 2009). The existing literature has yet to view the determinants
regarding the nature of technology as playing a significant role in ITL strategy

15
(Arora and Gambardella, 2010). Thus, I believe it would be promising to examine
the determinants related to the nature of the technology in ITL adoption by
latecomers. This research will shed new light on how the ITL strategy impacts
innovation.
Though complex, M&A has advantages over the other open innovation
mechanisms, because it allows latecomers to maximize the benefits of resources
transfer from a target and also reduces the number of competitors in the field.
Indeed, an increasing number of latecomers have used M&A as a way to increase
innovation. However, earlier empirical studies concluded that M&A had a negative
or an insignificant impact on a recipient‘s innovation performance (Henderson and
Cockburn, 1996; Ornaghi, 2006; Danzon et al., 2007). Hence, researchers find it
difficult to explain why and how latecomers utilize M&A based on the traditional
wisdom to maximize synergies in developed economies (Seth, 1990; Cording et al.,
2002).
During M&A, the relatively low absorptive capacity associated with inferior
knowledge accumulation places a lot of pressure on latecomers to internalize the
acquired resources; this does not usually occur for incumbents in developed
economies. Without the certain capability paired with optimized learning efforts,
latecomers find it difficult to capture the value embedded in the acquired sources.
As the nature of learning is neither costless nor automatic, latecomers need
purposeful learning to astutely proceed with the strategic choice in the analysis of

16
potential targets (Bell, 1984; Teece, 2000). Thus, it is particularly worthwhile to
conduct a more in-depth study along the line of latecomers‘ strategic intentions and
target selections.
The aforementioned scattered results from both ITL and M&A research still could
not satisfactorily explain how open innovation affects a latecomer‘s innovation
performance. Therefore, Essay One and Essay Two will attempt to resolve the
above issues regarding the ITL and M&A practices of latecomers from emerging
economies.
1.1.4 Combined Utilization of Open Innovation and Disruptive Innovation
After investigating the impact of open innovation on the innovation performance
of latecomers, this thesis further explores the application of open innovation in a
specific type of innovation – disruptive innovation. Disruptive innovation indicates
the favourable innovation trajectory for latecomers making use of technology to
achieve innovation. Without the external resources available through the channel
of open innovation, latecomers may not be able to solve all of the challenges in
developing disruptive innovation. However, the utilization of the two combined
innovation strategies may promote innovation.
As one of the latecomer strategies, disruptive innovation has received increasing
attention in the recent technological innovation management literature. Being
technologically isolated from the world centres of innovation, latecomers,

17
especially those from emerging economies, are more likely to develop simpler,
cheaper products that are of a good-enough standard to enter a market that is less
attractive to incumbents. Purposeful value creation for the low-end or a new
market is known as a disruptive innovation path that enables latecomers to disrupt
the incumbents. The success of latecomers‘ disruptive innovation depends on
product competition and is triggered by the performance oversupply of existing
products by incumbents in the mainstream market (Christensen, 1997). Thus far,
the existing literature has only examined disruptive innovation from an
independent firm‘s view – either the incumbent or the latecomer (Christensen and
Raynor, 2003; Utterback and Acee, 2005; Govindarajan and Kopalle, 2006) without
interaction between the two. However, the popularity of the open innovation
strategy (Chesbrough et al., 2006) is due to its emphasis on the cooperation
between firms. The existing literature seems to ignore the potential cooperation in
developing disruptive innovation (Christensen and Raynor, 2003; Spedale, 2003;
Utterback and Acee, 2005; Govindarajan and Kopalle, 2006; Hüsig and Hipp, 2009).
Therefore, further exploration of the combined utilization of open innovation and
disruptive innovation could have far-reaching implications. Essay Three will
investigate this opportunity.
1.2 Objectives and Significance of the Thesis
The research gaps that this thesis addresses are summarized below:

18
A. The benefits of open innovation have been widely studied for firms in
developed economies, but the existing literature has not adequately
investigated the impact of open innovation on latecomer cases in emerging
economies. Specifically, the degree of improvements to a latecomer‘s
innovation performance through open innovation is still debatable. It is
possible that latecomers with distinct characteristics have developed new
strategies when conducting open innovation that account for their tremendous
growth over the last decade. Furthermore, the important determinants regarding
the nature of the technology affecting the effectiveness of open innovation
have not received much attention. Few studies have examined these
determinants in latecomers‘ strategic choice of a target (either technology or
partner) through open innovation, or their impacts on the subsequent
innovation performance.
B. With regard to the type of innovation favoured by latecomers, the application
of open innovation in commercializing disruptive innovation needs to be
investigated. Although disruptive innovation has been widely discussed as one
of the most important catching-up strategies used by latecomers to
economically surpass incumbents, cooperative scenarios between latecomers
and incumbents via open innovation have yet to be studied. In other words, it is
not known whether and how open innovation can be combined with disruptive
innovation.

19
In line with the above research gaps, the research objectives of this thesis are
summarized below:
To address Gap A, the two specific objectives are to:
explore technology newness1 as a determinant of a latecomer licensee‘s
innovation performance and examine the impact of the ITL strategy.
explore technology distance2 as a determinant of a latecomer acquirer‘s
innovation performance and examine the measure of successful M&A for
latecomers in emerging economies.
Of the open innovation mechanisms, it is understood that ITL and M&A give an
effective and efficient view for studying the effectiveness of technical learning
from external resources. From simple technology transfer by ITL to a full range of
resource acquisitions by M&A, this thesis attempts to discover latecomer strategies
to internalize imported resources for indigenous R&D development. Other open
innovation mechanisms, such as strategic alliance and joint venture, are not central
to the investigation of open innovation in latecomer cases and are thus not
discussed in this thesis.
To address Gap B, the specific objective is to:
1 Technology newness, being an important determinant regarding the nature of technologies –
technology age, is an important representative of technology value in the extant licensing literature.
The relevant details are given in Chapter Two. 2 Technology distance, being an important determinant regarding the nature of technologies –
technology domain, is an important proxy of the strategic intention of acquiring firm in the extant
M&A literature. The relevant details are given in Chapter Three.

20
investigate the role of open innovation in disruptive innovation processes
and the conditions under which latecomers can combine open innovation
and disruptive innovation for their technological catching-up.
The application of open innovation in the development of disruptive innovation
can be considered an ideal strategic combination for latecomers‘ catching-up.
Since the mid-1990s, there have been some remarkably successful disruptive
innovation cases by latecomers. In contrast, the other two types of sustaining
innovation, i.e., incremental and radical innovation, tend not to be favoured by
technologically laggard firms, and are thus beyond the scope of this thesis.
It is clear from the reviews of China‘s high-tech industries3 over the last decade
that some latecomers have achieved remarkable catching-up with market leaders;
others, however, have faced serious difficulties. This successful catching-up has
undoubtedly contributed to China becoming the world‘s fastest growing economy,
and thus the strategic reasons behind it are worth investigating. This thesis
attempts to explain why some latecomers are able to use open innovation
successfully while others are not. In this thesis, the latecomers are Chinese firms
3 The widely adopted definition of high-tech industries was established by the Organization for
Economic Co-operation and Development (OECD) in 1986. The high-tech industries were
identified based upon their high R&D intensities (R&D spending as a percentage of production)
relative to other manufacturing industries. Based on the OECD classification (Hatzichronoglou,
1997), the high-tech industries are cataloged by Chinese government into five sectors, namely
pharmaceuticals, aircraft and spacecraft, electronic and telecommunications, computers and office
machinery and medical equipments and meters. Among the five sectors, electronic and
telecommunications has been the most developed sector and has performed the most innovation
related activities in China. According to China Statistics Yearbook (2011), the sector of electronic
and telecommunications had the best output value, the highest expenditure of new product
development and the most patenting activities in the past decade. Thus, this thesis mainly studies
the industries in this high-tech sector.

21
operating in high-tech industries that have caught up with existing incumbents
mostly from developed economies, in several ways. The first two essays
investigate the traditional ways of open innovation through ITL and M&A. The
third essay explores the renewed type of innovation that successfully uses
disruptive technologies; this is a small set of latecomers.
Although the findings in these essays are based on cases from China, the results
may be generalized to latecomers from other emerging economies, particularly
those with sizeable domestic markets, such as India, Brazil and Russia. This is
because the main characteristics of the focal firms in this research are true of all
latecomers in other countries. The results of this thesis would provide an in-depth
view of utilization of open innovation by latecomers. It will add on to the strategic
management of technological innovation literature. This thesis would offer insights
regarding latecomers‘ strategic choice by considering the significant determinants
of technology newness and technology distance in open innovation. The findings
regarding these two significant determinants may uncover hidden management
wisdoms about open innovation for latecomers. Further investigation of the
application of open innovation in the context of the type of innovation favoured by
latecomers, i.e., disruptive innovation, would provide more guidance for
latecomers to effectively use open innovation strategies and catch up more surely
and quickly.

22
1.3 Organization of the Thesis
This thesis is structured as follows. Chapter 2 (Essay One) elaborates the ITL
strategy – the simplest open innovation mechanism – for latecomers. Chapter 3
(Essay Two) discusses M&A strategy – the most complex open innovation
mechanism – for latecomers. After confirming the impact of open innovation on
latecomers‘ growth in Chapters 2 and 3, Chapter 4 (Essay Three) investigates the
application of open innovation in the disruptive innovation setting. Chapters 2 to 4
present the three essays, each with an introduction, theory and hypotheses, data
and methods, results, discussion and summary. Chapter 5 concludes by discussing
this thesis‘s contributions and implications, and making recommendations for
future research.

23
CHAPTER 2.
TECHNOLOGY LICENSING AND INNOVATION PERFORMANCE
2.1 Introduction
The phenomenal rise in the number of latecomers from emerging economies who
have become fast followers and caught up with industry leaders has drawn the
attention of researchers. Inward technology licensing (ITL) has been emphasized
as one of the most important strategies that latecomers use to build up their
competitive advantage, especially in technology-intensive industries (Teece, 1986;
Fosfuri, 2000, 2006; Johnson, 2002; Laursen et al., 2010). Successful ITL is
associated with the process of identifying a licensing opportunity, making a
licensing decision and adopting licensed-in technologies. Earlier studies have
investigated the determinants of opportunity identification and licensing decisions,
and have identified three categories, namely firm characteristics, management
perceptions and external environment (Atuahene-Gima, 1993). However, the
adoption of licensed-in technologies has received less attention. Thus, this essay
aims to identify the important factors in adopting licensed-in technologies and
reveal their relationships with innovation performance.
The stream of research exploring the relationship between firms‘ ITL strategy and
their subsequent innovation performance has shown mixed results. Álvarez et al.‘s
(2002) findings underscored the significance of ITL strategy for accelerating a

24
latecomer‘s technological catching-up. Ahuja and Katila (2001) examined the size
of technology acquisitions and determined that size had a positive impact on a
firm‘s innovation performance. On the contrary, Johnson‘s (2002) study showed
that inward licensing experience had a negative impact on innovation performance.
Although Johnson‘s (2002) work showed a firm‘s internal R&D to be an important
factor influencing the association between licensing inputs and innovation
performance, recent findings by Tsai and Wang (2009) have raised doubts about
this association and showed that ITL expenditure did not contribute significantly to
innovation performance in Taiwan, even under the moderating effect of internal
R&D. Thus, the precise means by which inward licensing experience affects
innovation performance is still inconclusive. Each of these studies furthered our
understanding of the micro-foundation of licensing, but did not shed much light on
the determinants of purposeful ITL strategy.
This essay attempts to resolve the above mixed results by investigating the learning
by licensing effect among Chinese latecomers. Given Chinese latecomers‘
remarkable technological catching-up over the last decade, their learning is likely
to have relied on technology transferred through licensing. Based on data from the
World Bank (2007), Figure 2-1 shows how Chinese latecomers‘ licensing expenses
increased dramatically from 1998 to 2005. Among my sample of four high-tech
industries in China, pure technology transfer grew steadily from 1998 to 2003 and
has dramatically increased since mid-2004, as shown by the number of licensing
agreements in Figure 2-2. During the period 1995-2008, it was reported that China

25
contributed 22.9% of the total number of patents filed with the World Intellectual
Property Organization (WIPO), ranking third in the world for patenting after Japan
and USA (WIPO, 2011). Some Chinese latecomers such as Huawei, ZTE and
Haier, even ranked among top patent applicants in their particular fields (WIPO,
2011). Thus, investigating the licensing activities of Chinese latecomers will
certainly help uncover the ITL strategies that promote innovation.
Figure 2-1. Licensing expenses in China (Work Bank, 2007)
Figure 2-2. Number of licenses in China‘s high-tech industries
(Source: State Intellectual Property Office of China)
0
50,000,000
100,000,000
150,000,000
200,000,000
250,000,000
1998 1999 2000 2001 2002 2003 2004 2005
Licensin
g fees($)
Year
0
500
1000
1500
2000
2500
3000
1998 1999 2000 2001 2002 2003 2004 2005
No.of licenses
Year

26
Considering the nature of latecomers‘ inferior resources, the two critical factors
that can promote innovation performance are (1) the number of licenses and (2) the
age of licensed-in technology; these represent the ITL strategic choice embedded
in the overall strategy of the firm. The number of licenses is a direct measure of
licensing activities and represents the extent of ITL, while the age of licensed-in
technology is an important measure of its value. Although Rockett (1990a, b)
extended the licensing literature to cover the role of technology age in outward
licensing, there is a lack of research investigating this important factor in the post-
adoption stage of ITL. By focusing on the above two factors, the main goal of this
essay is to investigate the strategic choice of ITL on the growth of innovation in
the post-adoption stage. This essay borrows from organizational learning theory4
and examines the respective impacts of the number of licenses and the age of
licensed-in technology on the subsequent innovation performance of a licensee, as
well as the moderating effect of absorptive capacity on the above two relationships.
4 The concept of organizational learning theory is initiated by Cangelosi and Dill (1965) and origins
from behavior and psychology theory (Cyert and March, 1963; Weick, 1979). The organizational
learning theory studies models and theories about the way an organization learns and adapts. There
are two levels of analysis of organizational learning theory, namely individual level and
organizational level. In this study, I mainly focus on the organizational level. An organization is
seen as an adaptive system that has the ability to sense the changes from its environment (both
internal and external) and adapt accordingly in the organizational learning theory. The effectiveness
of organizational learning is found strongly associated with absorptive capacity (Cohen and
Levinthal, 1990), which is the part I mainly adopted from organizational learning theory. The
absorptive capacity of an organization is treated as a trade-off between the efficiency of internal
communication and the ability to explore and exploit information from other organizations or the
environment (Cohen and Levinthal, 1990).

27
2.2 Theory and Hypothesis
A wide range of studies have identified licensing as one of the most important
mechanisms of technology transfer (Davidson and McFetridge, 1985; Fosfuri,
2000; Chesbrough, 2003; Arora and Gambardella, 2010). This strategy adds
additional inputs to a licensee‘s technology landscape and this inward flow of
technology has the potential to help the licensee build competitive advantage by
integrating internal R&D and external technologies (Grant, 1996). Leone et al.
(2009) found that firms who undertake ITL have better innovation performances
compared to non-licensing firms. Furthermore, Álvarez et al. (2002) claimed that
technology acquisition by ITL is a potentially significant means for latecomers to
accelerate their technological catching-up.
There are both environmental drives and internal motivations for latecomers to
adopt ITL. Rapid technology change, aggressive competition in technological
capability, and strengthened intellectual property protection create catching-up
barriers for latecomers who want to access and adapt technological advances
(Grant, 1996; Lee, 1996; Leone et al., 2009). However, licensing from industry
leaders allows latecomers to tap into external resources. In addition, ITL helps
latecomers leverage their initial competitive advantage to enjoy the free-rider
effect (Lee and Lim, 2001; Mathews, 2002), which further promotes their internal
motivations for ITL. The internal motivations for latecomers‘ ITL can be
categorized as passive or active. The conventional research (Lubatkin, 1983;

28
Roberts and Berry, 1985; Atuahene-Gima, 1993; Chatterji, 1996; Kollmer and
Dowlin, 2004) treated ITL as new product development or a market entry strategy
to reduce the financial risk of R&D and time-to-market. Due to their initially weak
technological capability and the entry order disadvantage (Mathews, 2002), ITL by
latecomers has been traditionally viewed as a passive reaction to compensate for
technological shortcomings or a means to break the industry‘s entry barrier (Hill,
1997; Lowe and Taylor, 1998). However, recent research has viewed ITL as a
means to open up learning opportunities (Cohen and Levinthal, 1989; Pitkethly,
2001) and spur inventive activities (Leone et al., 2009). ITL has become a popular
strategy for speeding up a licensee‘s endogenous technology change and
technological capability development over time (Johnson, 2002; Tsai and Wang,
2009). By relying on a licensing channel to possess proven technology, latecomers
can focus more on their own potentially superior or competing technology (Hill,
1997). Hence, ITL is widely accepted as a potential means for latecomers to build
competitive advantages by adopting licensed-in technologies (Grant, 1996).
According to organizational learning theory, the adoption of licensed-in
technology can be viewed as a learning process (Chesbrough, 2003; Laursen et al.,
2010). The technologies available in the market are potential learning opportunities
for licensees (Pitkethly, 2001; Johnson, 2002). Learning by licensing is associated
with a firm‘s ability to identify and acquire licensed-in technology, and then
process it into innovation. Moreover, it demands that licensees‘ R&D efforts act
not only as a direct input to innovation performance, but also as a means of

29
absorptive capacity (Cohen and Levinthal, 1989). Licensed-in technologies enlarge
the licensee‘s pool of existing knowledge stock (Vanhaverbeke et al., 2004), and
thus indirectly favours the absorptive capacity of the licensee (Katrak, 1997). If
they possess a certain absorptive capacity, licensees may sense the potential of
licensed-in technology to generate innovation by recombining the knowledge
(Henderson and Cockburn, 1994). This knowledge recombination benefits from
alternative technology inputs via ITL and is regarded as an important strategy for
latecomers to catch up on their technology (Kodama, 1995; Kim, 1997). Thus,
learning by licensing is a viable strategy to promote innovation for the licensee
(Mathews and Cho, 1999; Johnson, 2002). In practice, not all licensees can
successfully carry out the learning by licensing because the potential technological
benefits depend on effective learning and implementation (Dahlman et al., 1987).
Obtaining external technologies by purchasing patents together with relevant
support, such as experience, expertise and R&D inputs, is required to realize the
benefits of these technologies. Without adequate capability, licensees will have a
hard time identifying technology opportunities and making full use of licensed-in
technologies. The catching-up literature (Winiecki, 1987) also exposed the failure
of Soviet-type economies‘ technology acquisitions and highlighted the difficulties
in adopting licensed-in technologies thereby visualizing the importance of strategic
management in ITL adoption.
The effectiveness of ITL adoption, along with subsequent innovation performance,
has been widely studied. Research by Willmore (1991) and Lee (1996) presented

30
the alleged positive effect of licensing on internal R&D. Johnson (2002) captured
the positive relationship between inward licensing experience and patent
generation by a licensee. Indeed, ITL has been proven to play an important role in
influencing the innovation performance of a licensee, albeit most likely with a time
lag (Xie and Wu, 2003; Fabrizio, 2009). Empirical evidence by Mansfield et al.
(1982) indicated that the average ―start-up lag‖ for international technology
transfer is two years. This implies that licensees cannot immediately improve their
innovation performance; rather, it results from the period of learning. Therefore, I
use subsequent patent generation (within three years immediately after licensing)
as a measurement of the innovation output of ITL strategy. This essay objectively
analyzes patent generation by Chinese latecomers who adopted ITL in high-tech
industries where knowledge is highly intensive, markets are difficult to penetrate,
cost advantages are minimal, and strategies of linkage and leverage are important.
Since all latecomers from China share a similar regulatory environment and
experience roughly the same environmental forces (Xie and Wu, 2003), I am able
to focus on the factors of strategic management in ITL adoption. This essay does
not assert that these ITL factors are the only source of heterogeneity among
licensees, only that they are the most important. This is further discussed in the
following paragraphs.
In the latecomer context, one key factor embedded in the overall strategy of a
licensee is the number of licenses. The number of licenses is a direct link to the
extent of ITL and financial exposure of the latecomer. Since latecomers lack

31
resources (Mathews, 2002), the limitations of R&D inputs and existing capability
constrain the number of licenses and hinder the learning effect in ITL adoption. A
larger number of licenses means that more licensed-in technologies can be
translated into learning opportunities for the licensee. Moreover, licensing-in
technologies can enlarge the internal knowledge base and extend the innovation
scope by boosting knowledge recombination (Henderson and Cockburn, 1994;
Ahuja and Katila, 2001; Vanhaverbeke et al., 2004). Beyond a certain level,
latecomers may face difficulties absorbing a large number of licensed-in
technologies (Cohen and Levinthal, 1989) due to their inferior technological
capability; an excessive number of licensed-in technologies may hamper the
efficiency of learning (March, 1991). This is because adopting more licensed-in
technologies requires more R&D efforts to spur effective learning, including
human and financial capital support. The extra effort required is unsustainable for
latecomers who often suffer the resource constraints. For instance, internal
intelligences are important assets for realizing both tangible and intangible
technology transfers by cooperating with licensors (Atuahene-Gima, 1993;
Fleisher et al., 2010). The fact is that these intelligences are always in short supply
for latecomers in emerging economies due to the lack of human capital
accumulation (Liu, 1998). Moreover, latecomers rarely have sufficient financial
capital for external hires. Thus, it is difficult for latecomers to benefit from a large
number of licensed-in technologies. Even worse, too much reliance on ITL may
affect internal R&D development because it diminishes the staff‘s motivation to

32
innovate themselves (Pillai, 1979). If a licensee only uses licensed-in technologies
as they are or does not bother to adapt or customize the technologies according to
its own needs, the benefits of learning cannot be optimized to develop its
innovative capability. Therefore, I believe that excessive ITL impedes a licensee‘s
subsequent innovation performance and propose Hypothesis 1:
H1. The number of licenses has a curvilinear (an inverted U) effect on the
subsequent innovation performance of a licensee.
Considering the limited resources allocated to ITL, latecomers should carefully
select the technology to be licensed to ensure that innovation can be achieved.
Before licensing-in decisions, latecomers should have the capacity to identify
which is the proper technology that they should learn from. It is because this
possible technology change triggered by licensing-in decisions can be incorporated
to the production and thus affects the productivity in the post-licensing stage
(Nelson, 1964). As emphasized by Fosfuri (2000) and Ziedonis (2007), ITL is an
important instrument of strategic choice regarding the vintage of technology (or
the equivalent quality in their research) beyond a simple entry mode (or the right to
use the technology). To examine the quality of technology, technology age was
first proposed by Rockett (1990a, b) as an important determinant that licensors can
use to extract rents from licensees. I argue that technology age can be used by a
licensee as a measure to capture returns on innovation from ITL.

33
Technology age has been stressed as a critical factor affecting knowledge
recombination and, as a result, innovation performance (Nerkar, 2003). All
technologies depreciate in value as they grow old (Perez and Soete, 1988; Tanaka
et al., 2007). Since old technologies have been extensively used by competing
firms for extended periods and have likely been replaced by new technologies,
they are less valuable as inputs that contribute to innovation (Katila, 2002). In
contrast, recent technologies offer promising technological opportunities, and thus
they are more interesting sources for knowledge recombination (Kodama, 1995;
Sorensen and Stuart, 2000).
In addition, recent technologies can help latecomers maintain a good fit between
themselves and the competitive environment (Sorensen and Stuart, 2000). In high-
tech industries where the technology life cycle is short, new technologies may
quickly become outdated. Besides endogenous technology development,
latecomers can update their patent portfolios by importing recent patents. These
recent patents can facilitate a market entry to an emerging technological field
(Fosfuri, 2000). During the early development of a technological field, every firm
is new to the area and the relevant patents available in the technology market are
likely to be very recent. As the technology matures, latecomers who license the
recent technology enjoy the learning curve advantages (Nelson, 1995; Shane,
2001). The learning curve embodies the initial difficulty of learning; the possible
returns of learning come after the initial familiarity is gained (Ritter and Schooler,
2002). The initial learning takes latecomers some time, possibly years, to absorb

34
the licensed-in technology to the level where they can generate innovation based
on the accumulation of learning-by-doing (von Hippel, 1988). If the licensed-in
technology is recent, it is more likely to be advantageous even after ITL adoption.
Based on the above arguments, I propose Hypothesis 2:
H2. The age of licensed-in technology has a negative effect on the subsequent
innovation performance of a licensee.
The existing literature has suggested that cultivating an in-house technological
capability is critical for maximizing the learning outcomes of ITL adoption
(Kumar et al., 1999; Tsai and Wang, 2009). Song et al. (2005) pointed out that
internal R&D efforts have a significant effect on the adoption of technology. Sen
and Rubenstein (1990) claimed that the cumulative efficiency of past technology
learning could increase the effectiveness of external technology adoption. In other
words, by adding R&D inputs over time, technological knowledge can be
accumulated (Drejer, 2000; Schoenecker and Swanson, 2002). Accumulative
technological knowledge (as the notion of existing technological capability in this
study) represents a licensee‘s absorptive capacity to recognize the value of
technology, assimilate it, and apply it to innovation (Cohen and Levinthal, 1989;
March, 1991; Hall et al., 2001). A number of scholars (e.g., Cohen and Levinthal,
1990; Stock et al., 2001) have hypothesized that a high level of accumulative
technological knowledge can lead to inertia and rigidity, resulting in an inward-
looking tendency. However, I do not expect this factor to be important in this study,

35
which focuses on latecomers from China. Unlike firms in advanced countries, all
of the latecomer firms covered in my study still have relatively low level of
technological knowledge accumulation. Interestingly, a recent study of Taiwanese
high-tech firms (Tsai and Wang, 2009) has also found a net positive moderating
effect of accumulative technology capability. Given that the Taiwanese firms
generally have higher level of knowledge accumulation than the Chinese firms
(both samples in the same high-tech sector of electronic and telecommunications),
I can safely infer that the inertia/rigidity factor is unlikely to be a significant factor
for the latecomer firms in this study. Therefore, the well-established technological
capability can improve the absorption of imported technologies from ITL and
enhance the effectiveness of learning on latecomers‘ innovation performance (von
Hippel, 1988; March, 1991; Gambardella, 1992; Mowery et al., 1996; Grünfeld,
2003). It implies that the existing level of the technological capability determines
the extent to which licensee can efficiently adopt licensed-in technologies. When
the number of licenses is certain, the strong existing technological capability may
boost the effectiveness of adopting licensed-in technologies and result in a better
innovation performance. If the number is uncertain, weak existing technological
capability may limit adoption to a very small number of licenses due to the low
level of absorptive capacity.
During the course of technology utilization, the post-licensing innovation
performance may also be enhanced by knowledge recombination in an integrated
knowledge pool (Henderson and Cockburn, 1996; Kogut and Zander, 1996;

36
Fleming, 2001). An enlarged knowledge pool can be created via external
technology acquisition channels, such as ITL. Licensed-in technologies can add to
the existing knowledge pool and serve as sources of possible knowledge
recombination for renewed innovations. Furthermore, sizeable existing knowledge
base (strong existing technological capability in this study) increases the
possibilities for licensed-in technologies to be combined with existing technologies
(Cohen and Levinthal, 1989, 1990; Henderson and Cockburn, 1996; Kogut and
Zander, 1996; Fleming, 2001; Vanhaverbeke et al., 2004). The above arguments
imply that, if a licensee imports a greater number of technologies, its subsequent
innovation performance will only improve when it has a competent existing
technological capability.
In addition, existing technological capability allows licensees to enjoy direct
benefits from the vintages of licensed-in technologies, such as technology age. Old
technology has limited value for innovation, while recent technology has greater
potential (Perez and Soete, 1988; Katila, 2002; Tanaka et al., 2007). However, only
firms with competent technological capability can realize the potential benefits of
recent technology. As the level of existing technological capability increases, more
technological opportunities embedded in the recent technology can be identified
and explored (Cohen and Levinthal, 1989; March, 1991; Hall et al., 2001).
Therefore, the more recent technologies a licensee imports, the better its
subsequent innovation performance will be when it has a strong enough existing
technological capability.

37
In sum, the above arguments lead to the following hypotheses regarding the
moderating role of a licensee‘s existing technological capacity:
H3. A licensee’s existing technological capability positively moderates the
relationship between the number of licenses and the subsequent innovation
performance.
H4. A licensee’s existing technological capability negatively moderates the
relationship between the age of licensed-in technology and the subsequent
innovation performance.
2.3 Data and Methodology
2.3.1 Sample and Data
This essay uses a licensing dataset obtained from the State Intellectual Property
Office of China (SIPO), which includes both domestic and international licenses
obtained by Chinese licensees from 1998 to 2009. Each record contains the
licensor‘s name, licensee‘s name, name and application number of the licensed-in
patent and the registration date of licensing. This sample focuses on patent
licensing transactions by Chinese firms in the high-tech sector of electronic and
telecommunications, including telecommunications, mobile, IT, and consumer
electronics industries, completed during the observation period from 1998 to 2005.
This provides an initial set of ‗licensing-in data points‘ for 154 firms.

38
The extra patent data for each licensee is also collected from SIPO. Additional
information about each licensee, such as the year established and number of
employees, is retrieved from the company website, annual reports, or public media.
This additional information allows us to cross-link the original dataset with other
sources of information that are necessary for my analysis. The extended data for
three firms is unavailable, so they are not included in the empirical test.
2.3.2 Variables
Dependent Variable
Innovation performance: The number of patents has been widely used as a
measurement of innovation performance in prior empirical research (Henderson
and Cockburn, 1994; Ahuja and Lampert, 2001; Hall et al., 2001). Thus, I adopt
this variable and use patent generation as a proxy indicator of the innovation
performance for each licensee. I count the number of patents applied for by each
licensee within three, four or five years after the licensing year. If the licensee has
multiple licensing years, I average the patent counts. The average number of
patents generated by each licensee within three years after licensing is considered
as the dependent variable. The number of patents generated within four or five
years is used to construct the variables that I use to check the robustness of the
outcomes.

39
Independent Variables
Number of licenses (NL): This independent variable is the total number of
licensing agreements for each licensee over the period 1998-2005. It includes both
international patent licensing and domestic patent licensing.
Age of licensed-in technology (ALT): This independent variable is the time lag
between the application year of the patent licensed in and the registration year of
the licensing agreement from SIPO. First, I compute the time lag for each licensing
agreement. Next, I average the time lags for each licensee over the period 1998-
2005.
Moderating Variable
Existing technological capability (ETC): Because existing knowledge stock may
influence the absorptive capacity for learning (Perez and Soete, 1988; Laursen et
al., 2010), I use each licensee‘s existing patent stock in SIPO to measure this
moderating variable. First, I count the number of patents applied for by each
licensee during the five years prior to licensing at the level of each licensing
agreement. Next, I average the cumulative number of patents during the five years
prior to licensing for each licensee. This value is treated as the measurement of
existing technological capability.

40
Control Variables
Age of internal technology (AIT): Theoretical research about learning (Sorensen
and Stuart, 2000; Katila, 2002; Nerkar, 2003) suggests that technology age in the
existing knowledge stock has a significant impact on innovation. Thus, the average
age of internal technology is a variable that should be controlled for. Using data
about each licensee‘s existing patent stock for the five years prior to licensing, this
variable is calculated by computing the time lag between the application year of
the patent and the first licensing year in SIPO.
Diversity age of internal technology (DAIT): The impact of the diversity of the age
of internal technology is also considered an important factor (Cohen and Levinthal,
1989; Katila, 2002). Thus, I use a standard deviation of the age of the internal
patent stock to measure the age of the licensee‘s internal technology.
Firm age: Since the number of years of operations can influence innovation
performance, I include firm age as a control variable to capture prior experience in
technology development activities. Firm age is defined as the number of years
from the establishing year of the licensee to 2009.
Firm size dummy: Many studies have reported that firm size influences
innovativeness in learning (Cohen and Levinthal, 1989; Henderson and Cockburn,
1996). The number of employees has been widely used as a measure of firm size
(Ettlie and Rubenstein, 1987; Calof, 1994). To determine the size of each licensee,

41
I count its employees. Since less than one third of the firms‘ employee numbers are
listed and the numbers for private firms are unreliable, I transformed this variable
into a dummy variable. In line with the Institute Für Mittelstandsforschung (Small
Business Research Institute) and United Nations Conference on Trade and
Development (UNCTAD), firms with less than 500 employees are defined as
Small and Medium Enterprises (SMEs) and those with more than 500 employees
are large enterprises (Commission of the European Communities, 1985; Corsten,
1987; Neelamegham, 1992). Thus, a value of 1 represents a large enterprise with
more than 500 employees. If the employee number is equal to or less than 500, the
value is coded as 0.
Regional dummy: Prior research has shown that regional institutional policies,
geographical knowledge spillover, business ties and local competition affect how
firms acquire products and process knowledge (Barney, 1991; Koschatzky, 1998).
Therefore, a regional dummy is added as a control variable. I control this effect by
identifying the Chinese province that each licensee is located in and sorting them
based on the total number of patents from their province over the period 1985-
2009. Since the number of 1,000,000 patents is about the average accumulated
patent number of the province that my sample firms located, I use this average
number as a benchmark to measure this dummy variable. The value of this variable
is set to 1 for licensees located in Chinese provinces where the total number of
patents is equal to or greater than 1,000,000 , and 0 for licensees located in Chinese
provinces where the total number of patents is less than 1,000,000.

42
Licensor dummy: I control the interrogate linkage between the licensor and
licensee using this dummy variable. If the licensee has a sole licensor, meaning all
of its patents are licensed from just one licensor, the value of licensor dummy is
coded as 0. Otherwise, it is coded as 1.
Year dummy: This dummy variable indicates a particular licensing year recorded
in SIPO over the period 1998-2005. The year is set to1998 by default. As there are
not enough observations from 1999 to 2001, I combine the year dummy 1 (1999),
year dummy 2 (2000) and year dummy 3 (2001) together and control for these
years as year dummy 123. Year dummy 4, 5, 6 and 7 refer to the particular years
2002, 2003, 2004 and 2005, respectively.
2.3.3 Methods
This section describes the econometric approach used to conduct the empirical
analysis in this essay; it is also adopted in the next essay. Because the dependent
variable is a count variable – number of patents, this study uses a negative
binomial regression analysis. The count data usually exhibits over-dispersion and
has only non-negative integer values (Maddala, 1983). To analyze the count data,
the linear regression model based on the assumption of homoscedasticity is
violated to explain the normally distributed errors. The appropriate models for the
count data are built on the Poisson probability distribution (Cameron and Trivedi,
1998; Greene, 2008). However, the basic Poisson model only applies to count data
that has the same mean and variance. The Poisson model does not fit well for this

43
study because the count data – number of patents – differs across observations
(heterogeneity) and its variance usually exceeds the mean5. Thus, the negative
binomial regression model is the standard choice for the over-dispersion data of
countable patents (Hausman et al., 1984; Kennedy, 1998). The negative binomial
regression model also has the advantage of capturing both observed and
unobserved heterogeneity in the analysis, whereas only observed heterogeneity is
captured in the Poisson regression model (Long, 1997). To avoid the negative
value of the dependent variable, the negative binomial regression model
parameterizes the independent variables as an exponential function (Long, 1997):
Yj= exp ( αX1j + β*X2j + …..γ* Cj + εj)
Where Yj is the number of patents generated by a firm j, Xnj is the vector of the
acquisition variables to be tested and Cj is the vector of the control variables
affecting Yj. This specification implies that the number of patents by a firm in any
year is randomly distributed following the negative binomial model.
Based on the theoretical expectations regarding innovation performance and the
determinants of the number of licenses, age of licensed-in technology and existing
technological capability, the above model is used in this study to explain a
licensee’s innovation performance in terms of number of patents. Furthermore, this
5 I calculate the Lagrange Multiplier (LM) test for overdispersion in this essay and the next essay.
The LM test is used in the Poisson model versus the negative binomial model (Johansson, 1995;
Cameron and Trivedi, 1998). The results indicate that the effects of overdispersion are statistically
significant, which is against the Poisson assumption of the equality of the mean and variance. Thus,
the negative binomial model that can accommodate overdispersion is more appropriate than the
Poisson model.

44
study adopts a firm-level analysis rather than a firm-year panel due to an inherent
problem with the data provided by the data source – SIPO. Specifically, in the
period of observation, the number of inward licensing deals are not made available
for every year, but are instead lumped together across several years, resulting in
zero entries for some years and very high figures for certain years. Indeed, for
many of the sampled firms6, their licenses appear only in one particular licensing
year, with zero entries for all other years. Because of this problem of data
aggregation across multiple years, a firm-year panel analysis would not be
appropriate. Indeed, I have run a firm-year panel test and found the results to be
poor due to the violation of the pooled-analysis assumption of equal population
variances. Thus, I adopt a firm-level negative binomial analysis. In addition, a
sensitivity analysis is carried out later to test the robustness of the results.
2.4 Results
The descriptive statistics and correlations between variables are presented in Table
2-1. The coefficients reveal that the analysis does not suffer from multicollinearity
in the interaction terms between existing technological capability (ETC), number
of licenses (NL), and age of licensed-in technology (ALT). Table 2-2 shows the
6 For example, Shenzhen Shanling Electronics Ltd., one of my sample firms, has 726 licensing-in
deals registered in 2005; Dongwan DaXin Science and Technology Ltd. has 542 licensing-in deals
only in the year of 2005; and Shenzhen Huajia Digital Ltd. has 368 licensing-in deals recorded in
2005.

45
results of the regression analysis on the effects of NL and ALT, as well as the
moderating effect of ETC, on the innovation performance of a licensee. Model 1
presents the base model with all control variables. AIT has an inverted U
relationship with innovation performance, which is similar to the results of prior
work by Katila (2002). The impacts of the firm size and regional dummy turn out
to be significant for the innovation performance. The effect of the licensor dummy
is insignificant, which means that whether a firm has a sole licensor or many
licensors does not have a strong impact on the innovation performance.

46
Table 2-1. Descriptive statistics - Mean, standard deviation and correlations
Variables Mean Standard
deviation 1 2 3 4 5 6 7 8 9 10
1. Innovation
performance 149.53 954.633 1
2. NL 19 79.285 -.025 1
3. ALT 7.87 2.709 -.098 .094 1
4. ETC 10.80 62.951 .438** -.031 -.066 1
5. AIT .61 .613 1.335 .266** -.051 -.099 .127 1
6. DAIT .175 .469 .176* -.018 -101 .144 .640** 1
7. Firm age 13.91 7.122 .061 -.075 .131 .183* .138 .286** 1
8. Firm size dummy .36 .483 .191* -.109 -.036 .216** .108 .188* .275** 1
9. Regional dummy .95 .225 .037 .043 .177* .040 -.069 .025 -.051 -.005 1
10. Licensor dummy .29 .456 -.067 .084 -.022 .067 .048 .082 .063 .060 .022 1
**. Correlation is significant with the P value of 0.01 (2-tailed, significant at 10%)
*. Correlation is significant with the P value of 0.05 (2-tailed, significant at 5%)
Number of observations (N) =151
Notes: Year dummies were included in the analysis but not shown in this table.

47
Table 2-2. Negative binomial regression (Dependent variable = Innovation performance)
Variables Model 1 Model 2 Model 3 Model 4 Model 5 Model 6 Model 7 Model 8
H1 H2 H1, H2 H1, H2 H3 H4 H3, H4
AIT
AIT^2
DAIT
Firm age
Firm size
dummy
Regional
dummy
Licensor
dummy
2.712* (1.599)
-.387* (.225)
-.613 (1.960)
.122 (.0925)
2.160* (1.139)
3.653* (2.030)
-.497 (1.169)
3.203** (1.620)
-.451** (.227)
-.959 (2.075)
.125 (.0876)
1.738 (1.125)
3.907** (1.956)
-.651 (1.084)
2.479** (1.187)
-.433** (.1808)
.410 (1.724)
.109 (.0768)
1.980** (.889)
4.319** (1.790)
.302 (.855)
3.825** (1.583)
-.625*** (.229)
-.559 (2.164)
.118 (.0723)
1.869** (.825)
5.320*** (1.888)
.417 (.855)
4.967*** (1.377)
-.900*** (.215)
-1.913 (1.675)
.0586 (.0492)
-.0168 (.640)
4.042** (1.651)
.790 (.647)
4.379*** (1.167)
-.776*** (.192)
-2.212 (1.354)
.0608 (.0471)
-.335 (.601)
3.818** (1.559)
1.139* (.624)
5.052*** (1.415)
-.918*** (.220)
-1.569 (1.764)
.0618 (.0492)
.132 (.638)
4.014** (1.643)
.840 (.649)
4.519*** (1.179)
-.812*** (.190)
-1.648 (1.443)
.0571 (.0477)
-.110 (.599)
3.769** (1.541)
1.276** (.622)
Year
dummy123
Year dummy 4
Year dummy 5
Year dummy 6
Year dummy 7
Constants
-1.943 (1.290)
-.814 (1.093)
-.904 (1.000)
.124 (.918)
.388 (1.396)
-3.152 (2.984)
-1.930 (1.271)
-1.015 (1.018)
-1.034 (.956)
.628 (1.037)
.255 (1.222)
-3.775 (3.012)
-2.261** (1.114)
-1.917** (.903)
-2.332*** (.773)
-.725 (.743)
.594 (.960)
1.665 (2.537)
-1.734 (1.138)
-1.719** (.840)
-2.949*** (.807)
-.277 (.705)
-.0094 (.886)
.940 (2.616)
-1.221 (1.015)
-1.208 (.749)
-.838 (.754)
-.975 (.601)
.0280 (.811)
-.606 (2.162)
-.858 (.930)
-1.096 (.675)
-1.081 (.730)
-.524 (.635)
.195 (.721)
-.897 (2.003)
-1.067 (.984)
-1.166 (.724)
-.600 (.777)
-.960 (.595)
.109 (.795)
-1.028 (2.142)
-.763 (.946)
-1.119 (.709)
-.565 (.785)
-.690 (.621)
.243 (.731)
-1.338 (2.022)

48
NL
NL^2
ALT
.0758 (.0913) -.00041 (.00038)
-.629*** (.129)
.0952** (.0439) -.00048** (.00019) -.782*** (.152)
.0775** (.0359) -.00042*** (.00016) -.442*** (.136)
.0586* (.0316) -.00031** (.00015) -.400*** (.120)
.0780** (.0353) -.00043*** (.00016) -.413*** (.139)
.0624** (.0310) -.00034** (.00015) -.362*** (.124)
ETC
ETC * NL
ETC * NL^2
ETC * ALT
.0428*** (.0106)
.130*** (.0461) -.0394** (.0189) .0037** (.0017)
.201*** (.0798) -.0249** (.0114)
.366*** (.101) -.0598*** (.0199) .0050*** (.0017) -.0289*** (.0092)
Pseudo R2
Log likelihood
0.0627 -336.076
0.0678 -334.237
0.0879 -327.017
0.0980 -323.415
0.1258 -313.439
0.1317 -311.335
0.1273 -312.912
0.1358 -309.861
***P<0.01, **P<0.05, * P<0.1 (2-tailed)
N=151; STANDARD ERRORS IN BRACKET

49
Model 2, Model 3 and Model 4 test Hypotheses 1 and 2. Model 2 shows that the
estimated coefficient of NL does not have a significant effect on the innovation
performance of a licensee, but Model 4 verifies the inverted U shape effect
(P<0.05). The age of licensed-in technology (ALT) has a negative impact on
innovation performance. The results in Model 3 and Model 4 show that ALT has a
significant negative effect on the innovation performance of a licensee (as
expected, P<0.01).
Thus far, the study focuses on the individual effects of NL and ALT on the
subsequent innovation performance. The rest of the models examine the
moderating effect of existing technological capability (ETC) on the above two
relationships, which is visualized in Figure 2-37
. Model 5 shows that the
moderating variable of ETC has a positive impact on the subsequent innovation
performance. Model 6 and Model 8 examine the moderating effect of ETC on the
effect of NL on innovation performance. The results from Model 6 show that ETC
has an alleviating effect on the relationship between NL and innovation
performance (P<0.05): the interaction term with the linear term of NL is negative,
while that of the squared term is positive. To gain additional insights, I further
draw the interaction plots in Set A, Figure 2-3, in support of Hypothesis 3. This
figure, based on Model 8 and 90 percentiles of the data, shows that there are two
7 Based on the coefficients of the negative binomial regressions in Table 2-2, I calculate how ETC
changes the likelihood that a licensee will successfully generate innovation by adopting licensed-in
technologies (so called incidence-ratio minus 1). The surfaces in both figures - Set A and Set B -
show the impact of ETC on the chance that a firm will successfully adopt licensed-in technologies
(under the measure of NL and ATL).

50
different ITL strategies that promote the post-licensing innovation. In the case of
adopting only a few licenses, the licensee still needs to rely on its own R&D in
order to achieve a better innovation performance. However, a licensee can obtain
the benefits of a large number of licenses by internalizing licensed-in technologies.
When importing many external technologies, it would not make sense for the
quantity to affect the post-licensing innovation performance, only for the existing
capability of the licensee to absorb the imported technologies. Model 7 and Model
8 investigate the interaction effect between ALT and ETC on the innovation
performance of the licensee. The results show that the licensee‘s ETC negatively
moderates the relationship between ALT and innovation performance (P<0.01),
which supports Hypothesis 4. In other words, the absorptive capacity of the firm
has a smaller positive impact on the subsequent innovation performance as the
technology age increases. The interaction is plotted in Set B, Figure 2-3, based on
Model 8 and 90 percentile of the data. The pattern is in line with the prediction that,
with a high existing technological capability, latecomers can take greater
advantage of recent licensed-in technologies. The positive effect on innovation
performance only appears when the licensee acquires new technologies. Even with
a strong existing technological capability, technologies that are more than 4.5 years
old prior to licensing seem to have no value for subsequent innovation. This
finding disagrees with the wisdom that ―old is gold‖ (Nerkar, 2003) when
exploring the value of internal knowledge.

51
Several robustness tests confirm the accuracy of the results. First, I add the
industry dummy into the model. This shows the similar results as reported above.
Second, I change the dependent variable of innovation performance in the analysis
of the full models by adjusting the period of patent counts to three years, four years
and five years after licensing. The estimated coefficients maintain similar
empirical results, which support hypotheses H1 to H4.
Set A: Interaction of Number of Licenses and Existing Technological Capability
0
6 0.00
5.00
10.00
15.00
20.00
25.00
30.00
35.00
40.00
45.00
1.00 2.00 3.00 4.00 5.00 6.00 7.00 8.00 9.00 10.00 11.00 12.00 13.00
Number of licenses
Inn
ov
ati
on
pe
rfo
rma
nce

52
Set B: Interaction of Age of Licensed-in Technology and Existing Technological
Capability
Figure 2-3. Interaction plots
2.5 Discussion and Summary
The existing literature has paid little attention to latecomers‘ ITL strategy for
technological capability development. However, as a significant number of
Chinese latecomers have successfully become top patent generators, this research
topic deserves greater attention. Due to their weaker resources, it is important for
latecomers to learn from forerunners and innovate effectively. Due to the dramatic
0
7
-2.00
0.00
2.00
4.00
6.00
8.00
10.00
12.00
14.00
0.00 1.00 2.00 3.00 4.00 5.00 6.00 7.00 8.00 9.00 10.00 11.00
Inn
ov
ati
on
pe
rfo
rma
nce
Age of licensed-in technology

53
increase in ITL activities that has been observed in China over the last decade,
there is an urgent need to investigate the ITL strategy behind the success stories of
Chinese latecomers. By treating ITL as an integral part of technological strategic
management, this essay explores how latecomers can make proactive management
decisions to minimize the risk of licensing and maximize their innovation
performance.
This essay explores ITL strategy for latecomers by focusing on two critical factors:
(1) the number of licenses and (2) the age of licensed-in technology. I found that
the age of licensed-in technology is a critical factor for the subsequent innovation
performance of the licensee. As technology becomes old, its value for inward
licensing depreciates. The age of licensed-in technology also negatively affects the
positive impact of existing technological capability on innovation performance,
indicating that older technology is less valuable for implementing a catching-up
strategy. By considering the factor of age of licensed-in technology, this essay
reconciles the contradictory research findings about the impact of prior licensing
experience and determines there is an inverted U relationship between the number
of licenses and the subsequent innovation performance. Moreover, this relationship
is positively moderated by a licensee‘s existing technological capability. That is,
without complementary technological capability, excessive licensing impedes a
licensee‘s learning. Subsequent to my research findings above, I have come across
a very recent paper (Wang et al., 2013) that has made similar findings for H1 and
H2 in China, for both high-tech and non-high tech manufacturing firms as well as

54
service firms, albeit over a much shorter time period (2000-2003). Despite the
differences in sector and time coverage of this new paper, I believe it further
validates my research findings. My above empirical findings support the resource-
based approach for determining what technology latecomers should license in, and
help explain why some latecomers‘ innovation performance outshines others. This
essay provides important empirical support for the recent trend of inward licensing
as a strategy for latecomers to achieve technological catching-up.
Based on the above findings, the age of licensed-in technology is predicted as a
hidden factor that influences the effectiveness of learning by licensing. Due to the
concern over the mixed results of the linear relationship between licensing-in
experience (number of licenses in this study) and subsequent innovation
performance (Ahuja and Katila, 2001; Álvarez et al., 2002; Johnson, 2002; Tsai
and Wang, 2009), this study further tests the moderating effect of the age of
licensed-in technology on the above linear relationship. The analysis is conducted
in line with the same set of variables in Table 2-2, and the results are shown in
Table 2-3. Model 1 contains the same control variable as Table 2-2. The results
from Model 2 are consistent with the existing finding of the insignificant linear
effect of licensing-in experience (number of licenses in this study) on the
subsequent innovation performance (Tsai and Wang, 2009). Model 3 adds the
variable – age of licensed-in technology. Like the results from Table 2-2, Model 3
shows the same negative relationship between the age of licensed-in technology
and the subsequent innovation performance. Ultimately, Model 4 employs all the

55
variables and tests the interaction effect of the number of licenses and the age of
licensed-in technology. The results from Model 4 reveal that the age of licensed-in
technology positively moderates the relationship between the number of licenses
and the subsequent innovation performance with a P-value of 0.071. The linear
relationship between the number of licenses and the subsequent innovation
performance turns out to be significantly negative (P<0.1), while the negative
relationship between the age of licensed-in technology and the subsequent
innovation performance remains the same (P<0.01). The finding of the significant
moderation effect further supports the predication that the age of licensed-in
technology is an important hidden factor that affects the effectiveness of licensing-
in experience at promoting innovation. It is found that latecomers can import a
large number of older technologies and internalize them to generate innovation.
This finding can be explained by two underlying reasons. First, licensing is an
important tool used by latecomers to break an industry‘s entry barriers. The
fundamental technologies that emerge together with an industry‘s development are
often old and thus the patents are available in the market. These patents are
generally filed by the pioneers in the industry who often set the dominant designs
or industry standards. For newcomers to the industry, it is impossible to
circumvent the technical barriers to trade their products without licensing the
fundamental technologies. For example, the two Chinese latecomers in
telecommunications industry who have become the industry leaders, i.e., Huawei
and ZTE, are in the list of licensees in the dataset. The patents that Huawei and

56
ZTE licensed are mainly fundamental ones from the firm that set the industry
standards – Quantum Telecom. The second reason explaining why latecomers can
make use of imported old technologies to generate innovation relates to the
business model which is about how to make use of the technology. There are
circumstances when new technologies are not available or too expensive to be
licensed by latecomers. It is also reasonable that latecomers choose not to compete
directly with incumbents for technology leadership, but to enter the market first by
licensing old technologies and gradually accumulate the technological capability.
The old licensed-in technology itself may not contribute much to the upcoming
innovation by latecomers; however, the business model to use the old technology
for the development of good-enough products to meet the needs of a low-end or
new group of customers is favourable. In this way, how advanced or new of a
technology maybe does not matter much for latecomers trying to innovate quickly,
because the specific innovation trajectory may enable the imported old
technologies to become visible in the market and favoured by the certain group of
the customers. The details of the specific innovation trajectory will be discussed in
Essay Three.
Finally, I would like to acknowledge several caveats in this essay. First, due to
limitations of the data sources, a cross sectional dataset rather than panel data was
used to conduct the empirical testing. Although I added in the year dummy as a
control variable, this may have captured the limited differences between years
when analyzing the firm level data, rather than the firm year panel. Second, besides

57
the quantitative aspect, it would be interesting to test the qualitative aspect of the
licensed-in technologies. However, the widely used measurement of weighted
citation cannot be tested based on the SIPO database as there is citation data
missing from 2004 to 2007 in the database. The missing citation data in SIPO
precluded us from examining the more quality aspects such as the value of
technologies in this essay. Due to the above concerns, more research along these
lines is warranted.

58
Table 2-3. Negative binomial regression
(Dependent variable = Innovation performance)
Variables Model 1 Model 2 Model 3 Model 4
AIT
AIT square
DAIT
Firm age
Firm size
dummy
Regional dummy
Licensor dummy
2.712* (1.599)
-.387* (.225)
-.613 (1.960)
.122 (.0925)
2.160* (1.139)
3.653* (2.030)
-.497 (1.169)
2.386 (1.536)
-.359* (.214)
-.169 (1.933)
.1082 (.0898)
2.214* (1.133)
3.441* (2.064)
-.745 (1.159)
2.434** (1.203)
-.428** (.182)
.444 (1.722)
.108 (.0772)
1.987** (.891)
4.282** (1.801)
.270 (.870)
3.257** (1.555)
-.551** (.227)
.161 (2.140)
.109 (.078)
1.918** (.841)
4.319** (1.790)
.518 (.887)
Year dummy123
Year dummy 4
Year dummy 5
Year dummy 6
Year dummy 7
Constants
-1.943 (1.290)
-.814 (1.093)
-.904 (1.000) .124 (.918)
.388 (1.396)
-3.152 (2.984)
-2.060 (1.273) -.765 (1.082) -1.012 (.995) -.0543 (.951) .720 (1.443) -2.514 (2.971)
-2.278** (1.118) -1.905** (.910) -2.316*** (.777) -.735 (.749) .647 (1.004) 1.685 (2.539)
-2.139* (1.171) -1.864** (.909) -2.556** (.783) -.724 (.730) .138 (.990) 2.720 (2.768)
NL
ALT
NL*ALT
-.0125 (.0134)
-.0013 (.0065) -.621*** (.134)
-.0802* (.0433) -.811*** (.176) .0081* (.0045)
Pseudo R2
Log likelihood
0.0627 -336.076
0.0648 -335.322
0.0880 -326.997
0.0925 -325.360
***P<0.01, **P<0.05, * P<0.1 (2-tailed)
N=151; STANDARD ERRORS IN BRACKET

59
CHAPTER 3.
SUBSTITUTION EFFECT IN MERGERS AND ACQUISITIONS ON
INNOVATION PERFORMANCE
3.1 Introduction
The fact that nearly 50% of all mergers and acquisitions (M&A)8 fail makes M&A
strategies a hot topic (Kitching, 1974; Rostand, 1994; Conn et al., 2001;
Schoenberg, 2006). A central issue raised in the M&A literature is the strategic
choice of target firms to explain the performance variance among acquiring firms.
The strategic choice is based on the possible interaction between the target and
acquiring firm after M&A. This interaction is characterized by complementarity
and substitution. When there is synergy between the two organizations, they
cooperate well and complement each other. If not, the target firm becomes a
possible substitute serving the function of replacement. Much of the existing M&A
literature on this subject has focused on the synergy effect (Seth, 1990; Ahuja and
Katila, 2001; Capron and Piste, 2002; King et al., 2004; Koenig and Mezick, 2004;
Cloodt et al., 2006), whereas less attention has been paid to the possible
substitution.
Maximizing the synergy effect is the most widely adopted measure and is used as a
8 There are two different activities embedded in the term ―M&A‖: a merger is a consolidation of
two firms into one legal entity, whereas an acquisition is a takeover of a smaller firm by a large one
in terms of firm value.

60
strategic selection criterion in M&A. The synergy effect posits that the integration
of the target and acquiring firm is more effective than the two firms operating
separately (Cording et al., 2002). It has been found that the synergy effect in M&A
leverages not only financial synergies, such as debt capacity and financial risk
(Lewellen, 1971; Brunner, 1988; Leland, 2007), but also operational synergies,
such as economies of scale, resource reallocation and cost reduction (Pautler,
2001). In line with the synergy effect, the under-performance of post-M&A
innovation activities has been mainly attributed to the management challenges
associated with the differences between the two firms during the integration
process (Child et al., 1999; Schweiger and Very, 2003). Ahuja and Katila (2001)
and Cloodt et al. (2006) examined the differences in the technology bases and
found that an acquiring firm is not better off chooses a target firm with distant
technologies and a large amount knowledge base. It is notable that technologically
advanced firms can benefit from similar external resources that complement their
existing competency. Since some technologically laggard firms, such as latecomers,
do not possess good-enough competencies that can be complemented, they need to
substitute many different technologies to swiftly catch up. The latecomer cases
may invalidate the traditional view of the synergy effect based on the two critical
measures of technology distance and relative knowledge size. This essay aims to
uncover the contingencies where the traditional view on technology distance and
its impact on post-M&A innovation outcomes are turned upside down.

61
Although there exists rich M&A literature in developed economies, it is
insufficient without taking account of the new growth economies, such as China
(Cooke, 2006). The fact of high failure rates (Kitching, 1974; Rostand, 1994; Conn
et al., 2001; Schoenberg, 2006) has not stopped Chinese latecomers from engaging
in M&A. To the contrary, they continue to employ M&A at ever increasing rates.
After the economic crisis of 2003, the volume of M&A grew at a rate of 70% over
the following five years in China (Chen and Shin, 2008). As of the first half year of
2012, the M&A in China accounted for 38.4% of the total volume of M&A in Asia,
which makes China the world‘s second largest M&A market after the US (Reuters,
2012). Of all M&A participants in China, high-tech, materials and new energy
related firms are the three main industries (Reuters, 2012). Higgins and Rodriguez
(2006) highlighted that M&A could lead to cost reduction and solve the distress of
outdated technological pipelines. These benefits make M&A a popular form of
competency reconfiguration, especially for latecomers whose technological
capability is poor and easy to elapse during technological evolution. This helps
explain why some latecomers choose not to achieve catching-up by their own
R&D, but rather to integrate external R&D capability through M&A. Moreover,
the need to catch up with fast-changing technology trends may encourage
latecomers to substitute new blood from target firms for their existing competency.
However, whether there is any possible substitution in M&A and its effect on the
innovation performance of an acquiring firm remain inconclusive.
In the context of Chinese latecomers, this essay investigates the situation where

62
both synergy and substitution are possibilities in M&A, as shown in the upper left-
hand quadrant Figure 3-1. Figure 3-1 clarifies the four fundamental situations
based on the two dimensions, namely (1) technology disparity and (2)
technological capability. According to Jaffe (1986), substitution only exists among
related technologies, while non-related technologies do not necessarily substitute
each other but are only acquired for diversification. To fit this situation, this study
sampled both Chinese target and acquiring firms within the high-tech sector of
electronic and telecommunications to avoid the situation of technological non-
relatedness. Moreover, this essay acknowledges the fact that, as latecomers,
Chinese high-tech firms are initially resource poor and thus have relatively low
technological capabilities, especially compared to firms from developed economies
(Mathews, 2002). This gives an important scope to this study.
Figure 3-1. Situations for possible substitution in M&A
Specifically, this essay examines the post-M&A innovation performance of 100
Acquiring for
synergy and/or
substitution (*The possible substitution
is the focus of this study)
Acquiring for
diversification (*Not covered in this
study)
Acquiring for
synergy (*The existing studies in
developed economies)
Acquiring for
diversification (*Not covered in this
study)
Tech
nolo
gical C
apab
ility
of A
cquirin
g F
irms
Lo
w
Hig
h
Non-related Related
Technology Disparity

63
Chinese listed firms with a focus on the effects of technology distance and relative
knowledge base between the target and acquiring firm. This essay views
technology distance as a proxy for the possible strategy intention of substitution.
Equally important, the relative knowledge base influences the success of
substitution towards a greater innovation performance. Furthermore, the interaction
effect between the technology distance and relative knowledge base will be
examined in the empirical literature for the first time. By presenting new empirical
findings, this essay contributes to the strategic management literature on M&A and
adds to the substitution perspective of latecomers, rather than solely relying on the
traditional view of firms in developed economies.
3.2 Theory and Hypothesis
A growing body of literature has shown interest in refining the boundaries of
external resources for technology development. Innovations led by external
resources beyond a firm‘s existing technology domain have a significant influence
on technology development (Rosenkopf and Nerkar, 2001). The creation of
innovation along a distinct technology trajectory is mainly determined by
motivations, existing competency and external resources (Cohen and Levinthal,
1994; Teece et al., 1997). By focusing on M&A strategies for latecomers, this
essay investigates the motivations, qualitative and quantitative dimensions of

64
knowledge, as well as its impact on subsequent innovation performance, in the
context of emerging economies.
Motivation of M&A by Latecomers
As a form of external resource importation, M&A is primarily known as an
important gateway to facilitate market entry and growth (Hitt et al., 1996). The
rationale for M&A can be broadly categorized as either proactive motivations or
adaptive motivations (Burns et al., 2005). Firms may engage in M&A due to
proactive motivations such as increasing economies of scale or bringing in new
technologies, R&D equipment and intelligence to enhance their R&D productivity.
Under the pressures of economic and technological changes, firms are motivated to
acquire other firms in order to adapt to fast-changing technology trends and
reconfigure their competency.
To acquire or not to acquire is an important purchasing or self-making decision for
acquiring firms. It was found M&A can help acquiring firms overcome resource
constraints and promotes resource reintegration, thereby increasing the overall
value of the knowledge stock by cost-cutting. According to a Centre Watch report
(2000), acquiring firms, on average, experience a 34% reduction in R&D activities
three years after M&A. This reduction of duplicate R&D is driven by resource
reintegration, which implicitly assumes to substitute for the need to perform
internal R&D. This might be a possible form of substitution, but most likely
happen to technologically advanced firms: instead of throwing away their throwing

65
away their existing technologies, they will try to integrate the newly acquired
technologies with their existing technologies. However, there might be another
form of substitution in the case of acquiring firms that are latecomers with
relatively low level of accumulated technologies: the acquiring firm may stop
using what it has already accumulated earlier, and switch to using the new
technologies acquired through M&A instead. Indeed, it has been found that firms
with relatively weaker technology pipelines, like latecomers, have a higher
probability of undertaking M&A (Higgins and Rodriguez, 2006). Similarly, firms
with inferior or outdated R&D portfolios, like latecomers, tend to engage in M&A
(Danzon et al., 2007). It is also true that it usually take years for a latecomer to
develop its own technological capability. As an alternative, M&A may enable a
latecomer to speed up its competency reconfiguration. Thus, it is possible that the
acquiring firm simply replaces its existing technological assets with that of the
target firm. It is this second meaning of substitution that I would like to focus on in
this study.
Technology Boundaries and Post-M&A Innovation Performance
M&A is associated with the process of integrating the internal resources of an
acquiring firm and the external resources from a target firm. Innovation as an
outcome of the integration process is closely related to the technology boundaries
of the knowledge bases (Breschi et al., 2003). As firms tend to gradually increase
their knowledge coherence by patenting in closely related technological fields

66
(Lippman and Rumelt, 1982; Breschi et al., 2003), great efforts are needed if a firm
is active in two or more technology fields. It has been pointed out that in which
direction a firm decides to develop its technological competency depends on
linkages between technology fields (Lippman and Rumelt, 1982; Breschi et al.,
2003). A firm‘s competency evolves by acquiring external resources. However,
firms often have difficulties moving away from an existing technology track due to
knowledge and organizational inertia. A firm‘s existing legacy leads to technology
development along a particular path and may lock out opportunities to upgrade
technological competency (Teece et al., 1997; Cohen and Levinthal, 1994). The
efficiency of integration in M&A is maximized when there are no differences
between the technology domain, cognitive range and form of thought (Nooteboom,
2000). However, a target and an acquiring firm are never identical, and the major
differences can result in management difficulties during the integration process as
well as innovation outputs. Acquiring a target firm with non-distant knowledge is
recommended because the familiar knowledge is associated with common forms of
thought, shared cognitive ranges and similar innovation routines (Spender, 1989;
Kogut and Zander, 1996), and the similar knowledge elements will facilitate
technological learning (Cohen and Levinthal, 1989; Lane and Lubatkin, 1998). In
contrast, integrating distant knowledge can be resource-consuming (Haspeslagh
and Jemison, 1991; Singh and Zollo, 1997).
The absorptive capacity theory has been widely employed in the organizational
learning literature to explain the effectiveness of assimilating the unfamiliar

67
knowledge (Cohen and Levinthal, 1990; Mowery et al., 1996; Ahuja and Katila,
2001; Tsai, 2001; Zahra and George, 2002; Lane et al., 2006; Makri et al., 2010).
On one hand, the learning capability is enhanced when acquiring familiar
knowledge (Cohen and Levinthal, 1990; Grant, 1996; Kogut and Zander, 1996).
On the other hand, interaction with unfamiliar knowledge may lead to solving old
problems in new ways, which is termed the ―cross-fertilization effect‖ (Cohen and
Levinthal, 1990; Ahuja and Katila, 2001). Ahuja and Katila (2001) suggested that
integrating too similar knowledge could limit the benefits of organizational
learning. Furthermore, they pointed that a moderate degree of relatedness between
the acquired and existing knowledge benefits an acquiring firm the most by
creating synergy in the post-M&A stage. Thus, Ahuja and Katila (2001) and
Cloodt et al. (2006) found a curvilinear (an inverted U) relationship between the
relatedness of the acquired knowledge and the subsequent innovation performance.
It is worthwhile to mention that the studies by Ahuja and Katila (2001) and Cloodt
et al. (2006) were under the context of developed economies where firms‘
technological capability is advanced. On average, latecomers from emerging
economies are not so technologically advanced. This essay examines cases in
emerging economies (i.e., China) and thus may expect to find a different function
of using distant knowledge.
In line with the absorptive capacity argument, a lower level of knowledge
accumulation makes it difficult for latecomers to achieve synergy when acquiring
distant knowledge (Cohen and Levinthal, 1990; Grant, 1996; Kogut and Zander,

68
1996). When a latecomer acquires the non-distant knowledge, it reduces the
integration cost of inappropriate routines and also enhances the technological
learning that will allow it to delve deeper into a specialized domain (Berger and
Luckmann, 1967). As the technology distance becomes shorter, acquired
knowledge is more likely to enhance the latecomers‘ exploration capability for
continuous innovation, especially the innovation with shared technology domains.
Thus, I propose Hypothesis 1:
H1. Technology distance has a negative effect on the subsequent innovation
performance of an acquiring firm.
Quantitative Dimension of Knowledge and Post-M&A Innovation Performance
Despite the importance of technology distance, the quantity of acquired knowledge
remains a preliminary condition for a firm to benefit from M&A. In the pre-M&A
stage, the accumulative existing knowledge of the acquiring firm determines its
absorptive capacity to integrate external resources (Ahuja and Katila, 2001; Cloodt
et al., 2006). Ideally, the acquired knowledge from the target firm is added to the
existing knowledge pool of the acquiring firm and becomes part of the integrated
absorptive capacity after M&A (Ahuja and Katila, 2001; Cloodt et al., 2006).
However, the transition of organizational forms during the integration process can
be risky (Amburgey et al., 1993; Capron, 1999), since either the acquired
knowledge or existing knowledge has been encapsulated in certain skills and
routines (Nelson and Winter, 1982). During the integration process, the acquired

69
knowledge base needs to transition and be united with the existing organizational
forms. A large quantity of acquired knowledge usually results in a high level of
organizational disruption due to management distrust, business model differences
and other inherent routine differences. Even if the transition period is not long-
lasting, the subsequent benefits in terms of innovation under the newly shared
organizational form are at risk (Kogut and Zander, 1996). This risk can be
significant, especially when the existing knowledge base is not large enough to
absorb the acquired one. Thus, the relative knowledge base between the size of the
knowledge base of a target firm and that of an acquiring firm has been identified as
a critical integration factor influencing post-M&A innovation performance (Ahuja
and Katila, 2001; Cloodt et al., 2006). Ahuja and Katila (2001) and Cloodt et al.
(2006) have suggested a negative relationship between the relative knowledge base
and the subsequent innovation performance of acquiring firms in developed
economies. In comparison with developed economies, the management culture of
emerging economies, such as power distance and uncertainty avoidance in China,
may result in a lack of incentives in cross-organizational integrations (Hofestede
and Bond, 1988; Pieper, 1990). This management culture, which profoundly
influences the individual, group and organizational behaviors, may cause further
organizational disruptions in the integration process. Thus, my theory in the
context of emerging economies suggests the same: the integration process occurs
fitfully when there is an overload of the acquired knowledge (as the notion of high

70
relative knowledge base), and the subsequent integration difficulties impair the
innovation activities and potential growth.
Needs of Integration and Post-M&A Innovation Performance
There has been mounting concern of the ways to promote a firm‘s post-M&A
innovation performance. The existing literature consistently supports that an
acquiring firm should create innovation together with a target firm by capturing
synergies, but should not to acquire an innovative firm with unfamiliar technology
for diversification (Jensen and Ruback, 1983; Jarrel et al., 1988; Andrade et al.,
2001; Akbulut and Matsusaka, 2010). For instance, Andrade et al. (2001) and
Akbulut and Matsusaka (2010) found that undiversified firms are valued higher
than their diversified counterparts after M&A. The above strategy is based on the
assumption that the main strategic goal of M&A is to achieve synergy (Lewellen,
1971; Brunner, 1988; Pautler, 2001; Leland, 2007). This may be true in developed
economies where firms undertake M&A for the subsequent synergy value because
it can extend its existing competency. However, latecomers in emerging economies
have a different reason for engaging in M&A. Due to the concern that latecomers
are not technologically advanced, they are more likely to take root by acquiring
unfamiliar technology from an innovative firm and using it as it is.
However, the strategy that latecomers undertake in M&A tends to be substitution,
not diversification. Scholars have investigated the phenomenon of the
―diversification discount‖ where the value of a firm that pursues diversifying

71
M&A activities declines (Campa and Kedia, 2002; Lamont and Polk, 2002 and
Villalonga, 2004). This phenomenon has been articulated since the fall of
diversifying M&A in the 1950s (Shleifer and Vishny, 1991; Matsusaka, 1993;
Akbulut and Matsusaka, 2010). The common cause of this value destroying effect
associated with diversifying M&A is the limitation of resource exchange where
only a small part of the existing and acquired knowledge is involved in the post-
M&A integration process. Despite the integration efforts, the indigestibility of the
non-integrated parts, which is mostly attributed to the unfamiliar knowledge, from
the target firms results in organizational disruption and hurts the value of the
acquiring firm (Hennart and Reddy, 1997). It should be noted that the acquiring
firms generally have negative abnormal returns in M&A diversification, whereas
the target firms can have positive abnormal returns (Jensen and Ruback, 1983;
Jarrell et al., 1988; Andrade et al., 2001). Technologically laggard firms, such as
latecomers from emerging economies, may just replace their existing competency
with that of the target firm; therefore, integration is not necessary in the post-M&A
stage. If there is no integration of the acquiring and target knowledge bases, I
predict there will be substitution.
This essay examines the requirements for integrating the two knowledge bases via
the joint effect of the two integration factors, namely the technology distance and
relative knowledge base. The possibility of integration decreases as the technology
characteristics of the two knowledge bases become incompatible with each other.
As the technology distance between the target and acquiring firm increases, the

72
acquired knowledge becomes more likely to be from outside the explorative scope
of the existing absorptive capacity, and thus the compatibility of the two
knowledge bases collapses. On the other hand, the practical needs of
organizational integration are associated with the initial strategic selection during
M&A. The cost of organizational integration depends on the size of the two
knowledge bases: the larger the acquired knowledge base, the higher the
integration cost, e.g., time and efforts, that the existing organization must pay to
prevent organizational disruption. Thus, the needs of integration further decreases
as the acquired knowledge base grows relative to the existing one (as the notion of
relative knowledge base). To obtain the benefits of M&A, latecomers can reduce
integration costs by eliminating the outdated technology and shifting their R&D
focus to the emerging field. Some latecomers may choose to simply add new
businesses and replace existing technology with the new R&D because they do not
need to be integrated.
Under the circumstance of non-integration, latecomers do not need to worry that
the overload of the acquired knowledge base will impair its existing competency.
Sevilir and Tian (2012) found evidence that acquiring the target firms with greater
R&D intensity and knowledge accumulation significantly boosts the subsequent
returns. That is, when acquiring distant knowledge, the sizeable knowledge base of
the target firm helps the acquiring firm achieve better innovation in the possible
new direction. Given that latecomers have difficulties in integrating unfamiliar
technologies in Hypothesis 1, latecomer may opt to mitigate this need of

73
integration by resorting to acquiring the external technologies to substitute (replace)
it own technologies instead. The success of this substitution is more likely to
appear when the acquired distant knowledge base is relatively larger than the
existing one, because the large relative knowledge base not only can further reduce
the needs of integration but also help promote innovation after substitution.
Therefore, when the relative knowledge base is getting larger and the technology
distance is getting longer, increased innovation could result in the post-M&A stage.
Based on the above arguments, I propose Hypothesis 2:
H2. The relative knowledge base positively moderates the relationship between
the technology distance and the subsequent innovation performance of an
acquiring firm.
3.3 Data and Methodology
3.3.1 Sample and Data
The source for M&A activities was originally based on the Taiwan Economic
Journal (TEJ) database. Sample selection started with the entire population of
listed Chinese firms in the observation period from 2003 to 2008 in the high-tech
sector of electronic and telecommunications, which includes the electronics, IT,
mobile and telecommunications industries. Years prior to 2003 were excluded

74
from the sample due to the absence of M&A activities recorded in the TEJ
database. The dataset contains the names of the acquiring and target firms, the
merger year and the year the acquiring firm was established. After carefully
selecting the target firms without technology disparity from the TEJ database
(Jaffe, 1986), the initial panel sample consisted of 100 firms, 208 firm-year
observations, and 1210 M&A deals. Next, I added the patent and firm
heterogeneity data to the panel. Data related to the firms‘ patent information was
obtained from the State Intellectual Property Office of China (SIPO) database and
additional firm heterogeneity information, such as the number of employees in the
acquiring firm, the number of R&D employees in the acquiring firm and the
registered capital on initial public offering (IPO), was collected from annual
reports. Finally, I processed the relevant data according to the following variable
definition for numerical analysis.
3.3.2 Variables
Dependent Variable
Innovation performance: The number of patents has been widely used as a
measurement of innovation performance in prior empirical research (Henderson
and Cockburn, 1994; Ahuja and Lampert, 2001; Hall et al., 2001). Thus, I adopt
this variable and use patent generation as a proxy indicator of the innovation
performance for each acquiring firm. I count the number of patents applied for by
each licensee within one, two and three years after the M&A year. The average

75
number of patents generated by each licensee within two years after the M&A year
is considered the dependent variable. The number of patents generated within one
year and three years after the M&A year is used in the robustness test.
Independent Variables
Technology distance (TD): This variable is a knowledge-relatedness measure
between every two patents by the target and acquiring firm. All patent applications
in SIPO are observed for a period of three years prior to the M&A year. In line
with Jaffe‘s (1986), Engelsman and van Raan‘s (1992) and Breshi et al.‘s (2003)
measure of knowledge-relatedness, technology distance is computed by
Technology distance = 1-S;
where Ak is the number of patents by the acquiring firm that are classified in
primary technological field k, Tk is the number of patents by the target firm that are
classified in primary technological field k and n is the maximum number of
classification codes. The classification codes are collected from the three stages of
IPC codes of each patent that the target and acquiring firm applied for in SIPO.
The cosine index S represents the co-occurrence of the acquiring and target firm;
n
k
k
n
k
k
n
k
kk
TA
TA
S
1
2
1
2
1

76
the greater the S value, the more the target and acquiring firm co-appear in the
same technological field.
Moderating Variable
Relative knowledge base (RKB): This variable is a ratio obtained by dividing the
knowledge base of the target firm by the sum of the knowledge base of the
acquiring firm and the prior acquired knowledge base of the target firm. The
knowledge base of the target firm is the cumulative number of patents applied for
by the target firm in SIPO three years prior to the M&A year. The knowledge base
of the acquiring firm is the cumulative number of patents applied for by the
acquiring firm in SIPO three years prior to the M&A year.
Control Variables
Number of M&A: Many researchers (Henderson and Cockburn, 1996; Ornaghi,
2006; Danzon et al., 2007) have studied the effects of M&A on the subsequent
R&D performance and found both negative and insignificant effects, though
negative effects seem dominant. Thus, I control for total number of M&A deals per
year over the observation period from 2003 to 2008.
R&D capability: Prior research has shown that innovation performance is directly
associated with R&D capability (Cohen and Levinthal, 1989; Griliches, 1998). The
number of R&D employees, R&D expenses and knowledge stock have been
widely adopted as measures of the R&D capability of a firm. I use the number of

77
R&D employees of each acquiring firm as recorded in the annual report as the
control variable. In practice, there is no official record of R&D expenses in the
annual reports of Chinese listed firms. However, I am able to count the number of
patents applied for by the acquiring firms during the three years prior to the M&A
year and use it as the measure of the R&D capability in the robustness test.
Firm size: Early studies have reported that firm size influences innovation
performance (Ettlie and Rubenstein, 1987; Cohen and Levinthal, 1989; Henderson
and Cockburn, 1996). The number of employees has been used as a measure of
firm size in empirical studies (Atuahene-Gima, 1993). Thus, firm size is defined as
the total number of employees recorded in the acquiring firm‘s annual report.
Registered capital: The initial capital status is important to a firm‘s performance,
especially to latecomers with resource constraints. I include registered capital as a
control variable to control for the financial capital of each acquiring firm. The
recorded registered capital is the amount of money registered with the acquiring
firm when the IPO occurred.
Location dummy: Schoenberg (2000), Cartwright (2005) and Phene et al. (2006)
have shown that whether an acquisition is domestic or foreign affects the
subsequent innovation performance. Thus, I include this location dummy in the
control variables. If the M&A is domestic, the value is defined as 0; if the M&A is
international, the value is defined as 1.

78
3.3.3 Methods
This study uses a negative binomial regression analysis, which is the same as the
method in Essay One, because the dependent variable is measured by a countable
number of patents. In this study, the tested dataset is a firm-year panel. A Hausman
specification test9 is conducted to decide whether to use a random-effects model or
fixed-effects model (Hausman et al., 1984). As the results of the Hausman test are
insignificant, I use a negative binomial regression analysis with a random-effects
model. A sensitivity analysis is later carried out to test the firmness of the results.
3.4 Results
Table 3-1 presents the descriptive statistics and correlations of all the variables.
The mean value and relative standard deviation of the dependent variable show
more than a five-fold difference, which confirms the choice to use a negative
binomial regression rather than a Poisson regression in this study. Moreover, the
independent variables of technology distance and relative knowledge base are, for
the most part, not highly correlated with the control variables.
9 This method contrasts with the fix-effects and random-effects models and it helps choose the
random-effects over the fix-effects model in this study for methodological reasons. The fixed-
effects model is limited to estimations of samples that have variation in the dependent variable over
time. However, in my sample, some firms would be dropped out because they have no patents
during the observation period. Moreover, the random-effects model has the advantage of estimating
time-invariant dummy variables such as the location dummy.

79
Table 3-1. Descriptive statistics - Mean, standard deviation and correlations
**. Correlation is significant with the P value of 0.01 (2-tailed, significant at 10%)
*. Correlation is significant with the P value of 0.05 (2-tailed, significant at 5%)
Number of observations (N) = 208.
Variables Mean Standard
deviation
1 2 3 4 5 6 7 8
1. Innovation
performance 166.981 1158.819 1
2. TD .850 .317 -.052 1
3. RKB 1.129 4.287 -.035 -.352** 1
4. Number of M&A 5.817 10.492 .349** -.307** .082 1
5. R&D capability 658.111 1772.471 -.049 -.110 .069 .023 1
6. Firm size 2871.966 7286.195 . 653** -.133 -.005 .251** .673** 1
7. Registered capital 90044.7 252922.2 .132 -.085 -.025 .042 .891** -.093 1
8. Location dummy .0384 .180 .343** -.160* .113 .344** .080 -.017 .046 1

80
Table 3-2. Negative binomial regression
(Dependent variable = Innovation performance)
Variables Model 1 Model 2a Model 2b Model 3a Model 3b
H1 H2
Number of M&A
R&D capability
Firm size
Registered
capital/1000
Location dummy
Constants
-.0034 (.0065) .00010 (.00020) .00007*** (.00002) -.0021 (.0017) .951* (.497) -.219 (.241)
-.0082 (.0107) .00018 (.00016) .00009** (.00004) -.0034** (.0015) -.0329 (.578) .816** (.325)
-.0188 (.0116) .00021 (.00016) .00009** (.00004) -.0034** (.0014) .170 (.591) .125 (.505)
-.0068 (.0106) .00042* (.00023) .00004** (.00004) -.0051*** (.0019) .0047 (.514) 1.009*** (.332)
-.0182 (.0118) .00039* (.00024) .00009** (.00004) -.0046** (.0020) .0915 (.559) .413 (.506)
TD
TD^2
-1.293*** (.286)
4.142 (2.846) -4.817* (2.495)
-1.501*** (.304)
4.328 (2.788) -5.115** (2.447)
RKB
TD*RKB
TD^2*RKB
-.0772** (.0318) .216** (.0915)
-.0192 (.0488) -.178 (.246) .447* (.096)
Wald chi2
Log likelihood
32.25
-624.297
48.91
-614.598
54.25
-612.968
53.49
-611.891
64.01
-608.936
***P<0.01, **P<0.05, * P<0.1(two-tailed)
N=208; STANDARD ERRORS IN BRACKET

81
Table 3-2 shows the results of the negative binomial analysis with the estimators of
Log likelihood and Wald chi-square. The likelihood ratio tests for all the models
are within three significance levels (1%, 5% and 10%, two-tailed). Model 1 shows
the basic model with all of the control variables. Of the control variables, firm size
and location dummy show a significant positive effect on the dependent variable of
innovation performance while the number of M&A has an insignificant effect on
the post-M&A innovation performance, which is consistent with prior findings
(Henderson and Cockburn, 1996; Danzon et al., 2007). The other control variables
also show insignificant effects.
Model 2 includes the key independent variable of technology distance and tests its
impact on the post-M&A innovation performance. The result from Model 2a
shows a significant negative effect (P<0.001), thereby supporting Hypothesis 1.
This is the primary hypothesis to determine if acquiring firms have difficulties
integrating target firms from distant technology domains. Hypothesis 1 indicates
that acquiring firms have the strategic intention of using substitution when a target
firm is chosen from a distant technology domain. In Model 2b, I added the variable
of technology distance and squared it to test the curvilinear effect. Since the result
shown in Model 2b is not significant, I dropped the squared variable in the analysis
of the full model.
The M&A behavior of one of the latecomers examined in the sample –

82
UTStarcom10
– supports my prediction of Hypothesis 1. Since 1997, UTStarcom‘s
fame has risen due to its seizure of the Personal Handy-phone System (PHS) in
China. In the late 1990s and early 2000s, PHS was a low-end technology and
UTStarcom‘s only product, and its sales made up nearly 80% of the firm‘s total
revenue. When China‘s Ministry of Information Industry lifted its ban on the
penetration of PHS in 2003, many competitors appeared due to the low entry
barriers, and, as a result, the revenue of UTStarcom dropped dramatically.
Thereafter, UTStarcom decided to find new growth to differentiate its production
line. To do so, UTStarcom changed their R&D focus to CDMA, a high-end
technology and compeletely different terminal solution (one of the 3G solutions)
from PHS. Since 2003, UTStarcom has begun around 50 M&A in order to
reconfigure their competency. For example, in the early 2003, UTStarcom spent
US$100 million on purchasing part of CommWorks, the subsidiary of 3COM in
China, which was a dominant CDMA supplier in China. In 2004, UTStarcom
acquired the mobile sector from Audiovox Communications Corp. and the CDMA
equipment supplier Syscomm under Korea‘s Hyundai Corp. at the cost of US$165
million, as well as the firm, Telos from Canada. These targets from different
countries supported the entire value chain of CDMA terminals, which supposedly
would lift UTStarcom‘s business performance. However, no matter how
UTStarcom tried to integrate CDMA terminals as their core business, it was too
10
The data of UTStarcom case are collected from the following firm website and online report:
http://www.utstar.com.cn/; Liu, H.F. and Yu, J.Y. 2010. Life and Death—UTStarcom‘s strategy
(original title: 生死―小灵通‖—UT 斯达康之路). Modern Reading Magazine (现代阅读), 10.

83
hard to compete with other strong competitors in the cell phone market. As of 2006,
UTStarcom has almost given up the business of CDMA terminals.
In Model 3a, I added the moderating variable of relative knowledge base, and
further tested the interaction between this variable and technology distance. Model
3a employs all of the variables and presents the final analysis of this study. Though
Model 3b tests the moderating effect of the relative knowledge base based on
Model 2b, there are no clear results and thus it will not be further discussed.
The result of Model 3a are consistent with the earlier studies (Ahuja and Katila,
2001; Cloodt et al., 2006) which found that the relative knowledge base has a
negative impact (P<0.05) on innovation performance. A fitting analogy to this
phenomenon would be a lion trying to swallow an elephant, even though it lacks a
big enough stomach. Merging with a firm that has a strong and large technological
capacity requires extra resources to repair the disruptions, such as disruptions to
the organizational routines (Hitt et al., 1996). These repairs may result in
management difficulties for the newly integrated firm. Due to similar reasons, the
cases of the mergers between TCL11
(a large Chinese cell phone and TV producer)
and Alcatel (a world player in the cell phone market) as well as TCL and Thomson
Electronics Corp. (a world player in the TV market) in 2004 both ended with huge
11
The data of TCL case are collected from the following firm website, online report and academic
paper: http://www.tcl.com/en.php/news/about/id/143.html; http://baike.baidu.com/view/5085.htm;
Su, L.F. and Zhang, Z.L. 2007. The cross-border M&A of TCL: Only for internationalization?
(original title: TCL 的跨国并购:为国际化而国际化?) Economics and Management (经济与管
理), 21(9): 38-43.

84
losses. However, the merger between Lenovo12
(a Chinese PC producer) and IBM
PC (a world player) in 2005 was considered successful by Lenovo‘s CEO, based
on the maintenance of their market share and stock price. It is reasonable that
management capabilities may affect the rate of success of M&A. However, there is
no doubt that with acquiring a larger volume of assets will also come additional
management challenges for the integrating firm, even though the giants, such as
Alcatel, Thomson and IBM PC, bring benefits such as brand awareness, sales
channels and IP that aid the acquirers‘ internationalization.
In Model 3a, Hypothesis 2 is verified by the results of the positive coefficient
(P<0.05) between the interaction term (between technology distance and relative
knowledge base) and the post-M&A innovation performance. The interaction plots
based on Model 3a lends further support to my prediction, as shown in Figure 3-2.
Figure 3-2 shows that acquisitions with a relatively small technology base (the
minimum value of 0 in the sample) lead to a decrease in the post-M&A innovation
performance as the technology distance between a target and an acquiring firm
increases. This is the case for most firms as the relative technology base is
relatively small. In contrast, acquiring targets with a relatively big technology base
(the maximum value of 10 in the sample) leads to an improvement of the
technological performance as the technology distance increases. This may appear
to be at odds with arguments that found a decreasing absorptive capacity with
12
The data of Lenovo case are collected from the following online reports:
http://en.wikipedia.org/wiki/Lenovo; http://industry.caijing.com.cn/2013-03-21/112610222.html

85
increasing technology distance (Nooteboom et al., 2007). However, this
phenomenon can be explained by the fact that firms that acquire targets with strong
technological assets at a large distance from their existing technological
competencies do not need to integrate the two technology bases. It may be the case
that the old technology is replaced by the technology of the target firm. A second
characteristic of the figure is that for very small technology distance (<0.35) a
higher relative technology base of the target firm implies a poorer innovation
performance; at higher values of technology distance the opposite is true. This
confirms that, when the acquired technologies are not too distant from existing
technologies, the latecomers are likely to try to achieve synergy between the
acquired and own technologies, but when technology distance is high, they are
likely to switch to a substitution approach instead (i.e., positive values for high
technological distance combined with a large relative technology base of the
target).
This substitution can be illustrated using an example of China‘s top management
solution provider, namely UFIDA13
. Their growing-up story through M&A further
evidences the finding in Hypothesis 2. In UFIDA‘s early days (1997-1998), its
product development focused on middleware platform and ERP software.
However, because the middleware platform market was dominated by giants like
13
The data of UFIDA are collected from the following firm website and online reports:
http://www.yonyou.com/about/index.aspx; http://business.sohu.com/50/13/article205611350.shtml;
http://tech.sina.com.cn/s/n/2003-08 25/1140225041.shtml

86
Figure 3-2. Interaction plots
IBM and Oracle, UFIDA decided to give up self-developing middleware platform
and cooperate with IBM‘s Websphere platform instead. Since then, UFIDA has
concentrated on ERP development for local enterprises where their technology
capabilities have a good reputation and they can enjoy more localized advantages
than foreign competitors. Thus, UFIDA acquired several domestic firms to
facilitate specialization in ERP solutions. When UFIDA was established in 1988,
the financial module in its existing enterprise software was the only product.
Gradually, UFIDA added in new management modules by integrating with
stronger counterparts. For example, in 2003, UFIDA acquired Beijing Huili IT Ltd.
and Beijing AnYi Software Ltd., two strong players in the management software
industry that specialize in production capital and e-commerce management
respectively. Over the following three years, the new ERP modules in production
-1.00
-0.80
-0.60
-0.40
-0.20
0.00
0.20
0.40
0.2 0.4 0.6 0.8 1 1.2 1.4
Inn
ov
ati
on
pe
rfo
rma
nce
Technology distance
Low relative knowledge base(0.0)
High relative knowledge base(10.0)

87
capital and e-commerce leveraged the market potential and helped UFIDA gain the
majority share of the Chinese ERP software market. In 2006, UFIDA‘s market
share even rapidly rose to 21%, completely surpassing other domestic and foreign
players. This prominent performance shows that the above acquisitions helped
UFIDA successfully substitute middleware platform with ERP development.
Several robustness tests confirmed the accuracy of the results. First, the analysis of
the full models assessed changes in the dependent variable of innovation
performance by adjusting the period of the patent counts from one year to three
years after M&A. Second, the number of R&D employees was replaced by the
existing knowledge base of the acquiring firms. Third, I changed the relative
knowledge base to the total acquired knowledge base from the target firms. The
estimated coefficients from the above three independent tests all produced similar
empirical results, which support both Hypothesis 1 and Hypothesis 2.
3.5 Discussion and Summary
This essay has investigated the substitution effect in M&A in emerging economies
for assisting latecomers‘ competency building. Using China as the context, I
identified how latecomers‘ strategic choices differ from the smooth acquisition
process of related technologies and found the contingencies where the substitution
effect can improve the post-M&A innovation performance. The striking finding is
that when the technology distance between a target and an acquiring firm increases,

88
a greater acquired knowledge base will reverse the negative effect of technology
distance on innovation performance. The results reveal that M&A can create a
more flexible set of strategic choices than simply aiming for the incremental
complements portrayed in the traditional view of the synergy effect. Overall,
acquiring for substitution is also an important alternative strategic choice for
acquiring firms.
This essay has made the following empirical contributions. Although prior
literature has investigated the impact of technology similarity and relative
knowledge base on innovation performance, this essay is among the earliest to
examine their interaction effect on innovation performance in the M&A literature.
The finding of the negative effect of relative knowledge base on post-M&A
innovation performance is consistent with earlier works (Ahuja and Katila, 2001;
Cloodt et al., 2006). However, I found a negative effect between the technology
distance and post-M&A innovation performance in emerging economies. This
result is not entirely surprising because the prior finding of a curvilinear
correlation between technology similarity and innovation performance was based
on developed economies (Ahuja and Katila, 2001; Cloodt et al., 2006). Unlike
acquiring firms in developed economies, latecomers in emerging economies often
lack the absorptive capacity to integrate distant knowledge from target firms.
Furthermore, this essay proves the fact that the acquired absorptive capacity tested
by the relative knowledge base plays an important moderating role in the

89
relationship between the technology distance and the post-M&A innovation
performance.
Finally, I would like to acknowledge the caveats in this essay. First, of all the
situations in Figure 3-1, this study focused on the substitution effect in M&A
among latecomers within the scope of technological relatedness in emerging
economies. Besides well-established research in firms within the scope of
technological relatedness in developed economies, another two situations of
acquiring target firms with technological disparity are left for future research.
Second, the basic argument of this study has been based on the assumption that
acquiring firms obtain the target firms with valuable assets (as the notion of a
―good buy‖). Because the assets of the target firms are undervalued by the market,
the potential of a ―good buy‖ motivates the acquiring firms to undertake M&A
(Pautler, 2001). Despite the good intention, the actual value of the assets is not
measured in this study, because there is insufficient data to introduce a variable
that measures the value of the sample firms. Since this study employs patent data
as a proxy of the innovation performance, patent citations can be measured as the
value of innovation. Unfortunately, there is missing citation data from the period
2004-2007 in the SIPO database. This suggests the need for further research on the
value laggards between a target and an acquiring firm, as well as the need for more
fine-grained measures of technology bases.

90
CHAPTER 4.
COMBINING OPEN INNOVATION AND DISRUPTIVE INNOVATION
4.1 Introduction
With the growing importance of emerging economies, disruptive innovation (DI) has
attracted renewed attention in the literature. The DI theory has been articulated as a
powerful means for latecomers to ―attack from below‖ and eventually overtake the
global market by introducing simple, convenient and low cost products (Christensen,
1997; Adner, 2002; Charitou and Markides, 2003; Christensen and Raynor, 2003;
Gillbert, 2003; Govindarajan and Kopalle, 2006; Yu and Hang, 2010). When a
latecomer introduces a disruptive technology into the marketplace, it results in
competition with the incumbents and can potentially make the latecomer the new
market leader. Prior research has emphasized this aspect of head-on competition
(Christensen, 1997). Thus, DI has been analyzed from the perspective of either the
latecomer or the incumbent (Christensen and Raynor, 2003; Utterback and Acee,
2005; Govindarajan and Kopalle, 2006). The possible interaction that occurs
between the two has not been examined and remains a gap in the DI research.
The latecomer-incumbent cooperation does occur and this cooperation has been
examined in other types of discontinuous technological change. For instance,
Spedale (2003) investigated the types of cooperation that take place between

91
latecomers and incumbents in response to the introduction of a radical technology,
specifically the application of Fibre-optics in optical communication. However, the
results might not be applicable to disruptive technology, which is very different from
radical technology. Recently, Hüsig and Hipp (2009) explored whether incumbents
could integrate the potential disruptive technology – WiFi, in order to complement
the existing product towards the development of sustaining innovation. This internal-
external resource integration strategy described as open innovation (OI)
(Chesbrough, 2003), is known to benefit incumbents at large. However, latecomers
who have resource constraints (Mathews, 2002) may also choose to undertake OI to
access external resources and to cooperate with incumbents in DI development
because incumbents usually do not pursue their own DIs owing to asymmetric
motivation (Christensen, 1997; Yu and Hang, 2010).
Existing studies (Spedale, 2003; Hüsig and Hipp, 2009) have examined the
latecomer-incumbent cooperation only in relation to the goal of sustaining
innovation, whereas this essay will study this collaboration aiming at creating DIs.
This present study will also go beyond the telecommunications industry to cover
cases in a number of high-tech industries. From a latecomer‘s perspective, I raise the
following research questions:
(1) Whether latecomer disruptors could cooperate with incumbents (i.e., use OI)
to commercialize DI?
(2) If so, what are the conditions for a successful cooperation?

92
The research questions are addressed through multiple case studies describing the
experience of latecomers in China‘s high-tech industries. From these case studies, I
have discovered that DI does not always lead to competition between latecomers and
incumbents and that collaborative ties can be important in determining the market
success of DI. The cases have also enabled me to analyze the favourable conditions
under which OI can combine with DI and to explore the benefits for latecomer
disruptors and incumbents to undertake OI.
4.2 Theory Background
4.2.1 Latecomers’ Disruptive Innovation Path
To achieve catching-up, latecomers frequently adopt DI into their business models
(Christensen and Raynor, 2003; Wu et al., 2010) to establish a market foothold with
a new disruptive technology. The disruptive product or service disrupts the market
by attacking the over-served market from the low-end or by stimulating a need that
expands the market (Christensen, 1997; Utterback and Acee, 2005). The disruptive
technology is typically inferior on many attributes compared to products in the
mainstream market, but makes up for this deficit with features that are attractive to
the low-end or a new market (Christensen, 1997). As there are usually many
latecomers competing in the same market segment, this essay clearly distinguishes
the two stages in the DI path (as shown in Figure 4-1): the foothold stage when the

93
latecomer initially enters the market; the competitive stage when the latecomer
competes with other disruptors. A vast portion of the DI literature elaborates the
foothold stage with respect to how latecomers gain a foothold in a market, and pays
less attention to the competitive stage which has been widely implied but not
explicitly emphasized (Christensen, 1997; Rafii and Kampas, 2002; Christensen and
Raynor, 2003; Christensen et al., 2004; Keller and Hüsig, 2009). For a DI to be
successful, the technology on which it is based should improve continuously
throughout the competitive stage. Latecomers are often challenged by two types of
firms, fast disruptive followers and incumbents. Competition with fast disruptive
followers usually occurs early in the competitive stage, while competition with
incumbents usually occurs later once the disruptive technology has threatened the
incumbents‘ established business. An incumbent‘s position may be disrupted, if the
performance of the latecomer‘s product or service reaches a level acceptable to the
mainstream market after traversing the entire DI path.
Figure 4-1. Two-stage disruptive innovation path
Competitive Stage
Foothold Stage
Time
Per
form
ance
Mainstream market

94
4.2.2 Latecomers’ Perspective of Cooperation
One of the main challenges for latecomers is shortage of technology (Mathews, 2002,
2006). To compensate, they may cooperate with incumbents to tap into advanced
technologies and bypass steps in the technology trajectory in order to catch up
quickly (Lee and Lim, 2001). The strategic goal of latecomers is to raise their
position towards market leadership by swift innovation (Lim, 1997; Mathews, 2002).
Latecomers have a competitive advantage in exploiting emerging opportunities and
responding to relevant technologies compared to incumbents who are often locked
into existing business and sustaining innovation (Christensen, 2006; Henderson,
2006). However, latecomers rarely have the ownership advantages enjoyed by
incumbents that are needed to develop technology and leverage the
commercialization. By cooperating with incumbents, latecomers may pursue
their goal of catching-up and eventually rising to the top of the market. Therefore, it
is critical for latecomers to cooperate strategically with incumbents to complement
their missing resources.
Building on Teece‘s (1986) framework regarding the two key drivers that affect the
cooperation strategies and outcomes of innovators – complementary assets and
appropriability regime – this study tries to understand whether latecomers can
cooperate with incumbents in commercializing DI and raise their market position.
Complementary assets such as distribution networks, service capabilities,
complementary technologies, brands and competitive manufacturing are necessary

95
in commercializing a technology (Teece, 1986; Gans and Stern, 2003). The existing
players in the market always leverage their pre-emption rights of those
complementary assets (Lieberman and Montgomery, 1998). If complementary assets
are owned by a competitor or a third party, it is critical for latecomers to obtain them
through cooperation so that they can rapidly commercialize their innovation. For
instance, having been the world‘s manufacturers for many years, some Chinese
latecomers have accumulated the necessary capacity in the downstream of value
chain to appropriate value from innovations in the local market. However, unlike the
incumbents, they generally do not have other complementary assets, especially the
brand, distribution channels and complementary technologies. Cooperation with
incumbents may, under particular circumstances, be the easiest route for latecomers
to obtain the missing complementary assets, so that they can rapidly grow and
capture the local market. Though this can be difficult in the same market segment, it
may be attractive to incumbents in a new market, especially given the large
population of potential customers in China.
Appropriability regime is the other important driver that has been identified to shape
cooperation between latecomers and incumbents, especially in high-tech industries
(Teece, 1986; Gans and Stern, 2003). Appropriability regime refers to an
environment that allows markets for technology to coalesce and function efficiently
(Teece, 1986). In the context of a sole country such as China, firms share the similar
state of democracy and economic environment that determine the degree of
appropriability regime (Liu, 2005). Looking into the functional content,

96
appropriability regime has been regarded as a function of the legal intellectual
property rights regime (Orozco, 2007). Intellectual property (IP) is an exclusive right
for the creator of IP to capture value over the use of an invention or technology
(Wagner, 2003). IP is protected primarily to stimulate the transfer of technology in
the form of licensing, joint venture and foreign direct investment (Gould and Gruben,
1996). This involves technology markets where IP rights and contracts are well
defined, litigation is predictable and damages can be assessed. In addition,
appropriability regime is also a function of the degree to which the technology
behind the innovation is tacit, i.e., the degree to which it is imitable (Orozco, 2007).
Teece (1986) demonstrated that tacit or poorly codified knowledge is harder to
transmit and harder to appropriate. Because the ownership of technology is a major
incentive for cooperation between firms, this study mainly concentrates on the
transferable part of the appropriability regime, namely IP.
In the field of discontinuous technological change, early contributions by Spedale
(2003) gave evidence for the existence of cooperation strategies for both new
entrants (as the notion of latecomer in this context) and incumbents at times of
radical technology. Spedale (2003) found that incumbents tend to undertake
structured cooperation (at inter-organizational level) with the latecomer for the new
technology and apply the technology to their traditional market (market-pull
strategy). Whereas, the unstructured cooperation (at individual level) is likely to
appear in the specialist niches where latecomer with new technology tends to
concentrate (technology push). As the other type of the discontinuous technology,

97
disruptive technology has also been found to have an enhancing effect on the
existing sustaining innovation for incumbents who cooperates it (Hüsig and Hipp,
2009). However, little research has been done on cooperation for developing DI,
especially from latecomers‘ perspective. Since the latecomer characteristics
discussed above may be applicable to DI, the dynamics underlying this cooperation
between latecomer disruptors and incumbents will be discussed in the next sub-
section.
4.2.3 Dynamics between Latecomers and Incumbents in Disruptive Innovation
Earlier studies have investigated how latecomers‘ DI may cause incumbents to lose
their dominant position (Christensen, 1997, 2006; Christensen and Raynor, 2003;
Henderson, 2006; Wu et al., 2010; Yu and Hang, 2010). Christensen (1997) found
that incumbents have a hard time sensing or appreciating DI opportunities and
therefore tend to ignore them. Limited by their organizational routines and sole focus
on existing customers, incumbents may miss new market trends and make wrong
decisions about future directions. The incumbents are preoccupied with competitors
in sustaining innovation and usually do not pay enough attention to the disruptive
power especially in the low-end market. This ignorance gives latecomers an
opportunity to start and grow. Thus, DI creates avenues for latecomers to enter from
the low-end or create a new niche market. Incumbents are rarely motivated to pursue
DI because their existing customers are not interested in the initially inferior DI
products and the DI market is often associated with a small group of under-served

98
customers who are not seen as particularly profitable. However, Christensen (1997)
found that the disruptive technology will improve over time and its performance
may eventually be improved to a level suitable for the mainstream market. By
competing from an unexpected direction, latecomers may gradually catch up with
and out-compete incumbents who only monitor competitors in the sustaining
direction in the existing market (Afuah and Utterback, 1991; Christensen, 1997).
Although incumbents often miss DI opportunities, this does not imply that
latecomers may take it for granted that their DI efforts will be successful. If
latecomers can develop their own disruptive technology and successfully
commercialize it, they could capture the overlooked market. However, if latecomers
simply have disruptive ideas based on more recent knowledge, without the ability to
quickly realize them, they may attempt to cooperate with incumbents in order to gain
access to their complementary resources, e.g., manufacturing technology,
distribution channels, etc. In the same situation, a small entrant firm may have
capability to gain a foothold in disruptive innovation, but insufficient resources to
compete and grow rapidly; it will then be a need for tapping the resources of
incumbents if a win-win arrangement could be made. For incumbents, this type of
cooperation with latecomers is only worthwhile if they can expect value in return in
the form of disruptive ideas, licensing fees, etc. (Narula, 2006). As key drivers,
complementary assets and IP may significantly affect potential cooperation between
latecomer disruptors and incumbents (Gans et al., 2002; Gans and Stern, 2003; He
et al., 2006). Moreover, the importance of these drivers varies with the market

99
segments. In an existing market where complementary assets and IP are mainly
controlled by incumbents, the traditional DI path is to create a foothold at the low-
end using the existing technology. Thus, for cooperation to occur the latecomers
must be able to offer incumbents new ideas. In a new market where both
complementary assets and IP are underdeveloped, cooperation between latecomers
and incumbents is mutually beneficial because it will accelerate the
commercialization of DI and create a bigger threat to other competitors.
Cooperation to share complementary assets and IP can be achieved by different OI
strategies including joint ventures, alliances, corporate venture capital, acquisitions,
outsourcing deals, licensing agreements, and spin-offs (Shenkar and Li, 1999;
Chesbrough et al., 2006; Van de Vrande et al., 2009a, b). OI can offer latecomers a
channel to directly contract complementary assets and IP in order to commercialize
their potentially disruptive ideas. Alternatively, latecomers can indirectly access
complementary assets and IP by allying with their owners. Instead of treating
latecomers as threats, incumbents are increasingly interested in sourcing interesting
ideas from latecomers or even investing in them. Consequently, OI may create a
win-win situation where both latecomers and incumbents are better off than in a
competitive DI scenario.
To further explore how OI and DI could interact, I examine Chinese latecomers who
launched successful DI technologies. These case studies are described in the
following section.

100
4.3 Methodology
4.3.1 Research Strategy
Case study has been recognized as a useful research strategy for creating theoretical
constructs, propositions and midrange theories based on real events (Eisenhardt and
Graebner, 2007). In general, research based on multiple case studies is considered
more robust than research based on a single case study (Eisenhardt and Graebner,
2007). This essay uses multiple case studies to offer a broader perspective on
China‘s high-tech industries. The process of theory building through case studies is
divided into two major stages (Carlile and Christensen, 2005): a descriptive stage
and a normative stage. The former recognizes important attributes through careful
observation and correlates them with patterns to address the research interest. The
latter refines the theory built during the descriptive stage through detailed empirical
and ethnographic observation. For the purpose of this essay, I used the descriptive
stage over multiple case studies.
To conduct the descriptive stage, I followed a sequence of three steps: design-
observation, categorization and association.
First step: I selected the technology that has been proven to be successful DIs in the
mainstream market to serve as the source of case studies. The unit of case studied is
per disruptive innovation. As a collective pool of raw data, the cases were carefully
filtered based on Govindarajan and Kopalle‘s (2005) five criteria for DI: (1) inferior

101
on the attributes that mainstream customers value; (2) offering new features relative
to existing products; (3) sold at a lower price; (4) attractive to a low-end, price
sensitive or new market segment; (5) improvements to potentially attract mainstream
customers. Since DI theory has only been extant over the past decade, not many
empirical examples have been thoroughly studied or documented. Finally, I was able
to identify six DI cases that meet the above criteria, and provide sufficient data
support, derived from five Chinese latecomers. The six cases14
based on the DI
criteria are summarized in Table 4-1 and the details are presented in the following
section.
Second Step: I analyzed the cases by examining OI practices in terms of different
mechanisms such as licensing, M&A as well as other contractual modes, for each DI.
Then I classified the latecomers according to cooperation, complementary assets and
IP. The details are presented in Section 4.4.1.
Third Step: I used this evidence to articulate the conditions for combining DI and OI.
Based on observations from the cases, I further provided the ways for both
14 Among the six cases, the data of the three cases by the two Chinese disruptors, namely, e-bike
case by LuYuan, mini magic child washer case and wine cellar case by Haier, were collected from
interviews. The interviews were conducted face to face during the on-site visits to the firms. The
interviewees of the e-bike case were the founders and top managers in LuYuan headquarters,
Zhejiang, China. The interviewees of the mini magic child washer case and wine cellar case were
the team leaders of the R&D center in Haier headquarters, Qingdao, China.
Due to the limitation of the linkages to the rest three Chinese disruptors, I was not able to conduct
interviews with them. Thus, the three cases, namely Galanz microwave oven, CIMC stainless steel
refrigerated container and UFIDA U9, were mainly based on the second-hand but reliable data,
including firm websites, academic papers, books and online reports. The details of the data sources
are indicated in the footnote of the three cases respectively.

102
latecomers and incumbents to benefit from using OI in the context of DI. The details
are presented in Section 4.4.2.
Table 4-1. Case summary at unit of each innovation
Case
No.
DI product/
service
Mainstream
product/ service
DI features Market segmentation
1 ―Mini Magical
Child‖ washer
Large cubage (5kg)
washer at a high price
Smaller (1.5kg),
electricity and space
saving, and pricing low
Targeting the non-
consumption summer
market in China – new
market disruption
2 Wine cellar Niche premium
product sold at a high
price in America
Simpler (without
agitator), cheaper
(40%)
Growing form niche
market to mainstream
– new market disruption
3 Microwave
oven
Big size and
expensive model
mainly populated in
developed countries
Smaller size and
cheaper
Localizing the existing
product and meeting the
needs of the emerging
middle class in China
–new market disruption
4 Electric-bike
(e-bike)
Motorbikes
–pollution, hard to
operate, expensive
Environmental friendly,
lighter, easy to park and
cheaper
Seizing the opportunity of
two-wheeler‘s revolution
driven by Chinese
government (to restrict
motorbikes in major
cities)
– new market disruption
5 Stainless steel
refrigerated
container
Aluminum
refrigerated container
– expensive, light
weight, advanced
foaming technology
Cheaper (lower cost by
reengineering the
manufacturing process
and improving the
efficiently)
Using an existing inferior
technology to enter a
market and continuously
improving price-
performance of products
to disrupt the dominator
(the Japanese giant)
– low-end disruption
6 U9 (an
software
platform)
A platform with a
whole suite of fixed
applications
– time costly and
intensive human
capital involvement
Flexible structure
(based on service
oriented architecture),
shorter delivery time,
cheaper and real time
communication
Using a new technology
to enter a market and
attack from the low-end to
gain a share from existing
players (SAP, Oracle) in
China
– low-end disruption

103
4.3.2 Disruptive Innovation Cases by Chinese Latecomers
In this section, six DI cases from China are presented. The cases are drawn from a
broad range of high-tech areas including consumer electronics, refrigerated
containers, IT and transportation.
4.3.2.1 Haier: Success with the Non-Consuming Market
Haier created a successful DI example by designing a mini washing machine for
China‘s huge untapped market. In the early 1990s, Haier started to manufacture
conventional washing machines to meet Chinese consumption needs. At one point,
the interesting phenomenon that washing machine sales severely dropped every
summer drew the attention of Haier‘s top management. After analyzing the market,
Haier found that (1) the Chinese family size was shrinking due to the one-child
policy and (2) the market was mainly dominated by the 5 kg cubage washing
machine. People wanted smaller washing machines, but they were not available.
Thus, Haier identified the demand for the mini washing machine.
In 1995, Haier designed a washing machine suitable for daily use called the ―mini
magical child‖ with 1.5 kg cubage, low noise and high efficiency. The mini model
saved water, electricity and space, and was sold at a lower price. In the first year, its
sales volume achieved 30,000 units and the next year it hit one million units. Haier
continued to improve the functions and developed twelve generations of ―mini

104
magical child‖ products in two years. Patents were also filed worldwide to protect
this innovation.
4.3.2.2 Haier America: The Leader in Niche Markets
In 1995, Haier started to sell its refrigerators in the US. To support global R&D
activities, the Haier Research Institute was established in 1996 and allied with 28
incumbents from US, Japan, Germany, etc. Haier America was founded in 1999 as a
joint venture between Haier and Welbilt Appliances Inc., an established American
home appliance distributor. To support Haier America, Haier invested in its own
factory located in South Carolina. Hoping to extend its DI success story in the US
market, Haier America recruited local employees to identify local needs and relied
on their partners to distribute the products. With the help of Welbilt Appliances, a
large distribution network was established between Haier America and BestBuy,
Wal-Mart, Sears, Lowe‘s, Home Depot and Target.
Haier America‘s first successful DI product – a wine cellar – had previously been
considered a premium product for a niche market. However, as a serial disruptor,
Haier saw the growth potential of this niche market. Haier America‘s wine cellar
was designed without an agitator that made it 40% cheaper than the existing
Whirlpool model. The good-enough features coupled with a much lower price
stimulated the growth of this niche market all over the world. Just two years later,
Haier had captured 60% of the market in the US. Eventually, Haier has around 60%

105
of the global market share for wine cellars and its reputation has helped open up the
US market for other Haier white goods.
4.3.2.3 Galanz15
: New Designs for Emerging Markets
In the early 1990s, microwave ovens were popular in the mass markets of developed
countries. However, due to their high price and large size, only 2% of Chinese
families owned one. The annual market capacity in China was estimated to be
around 20,000 units and was mainly dominated by foreign incumbents. Despite a
technology shortage and inexperience in the consumer electronics industry, Galanz
decided to enter the microwave oven market and designed its products for the
emerging middle class. Galanz built its R&D team by seconding five senior
engineers from Shanghai FeiYue, one of four microwave oven manufacturers in
China, and imported the production line from Toshiba. In 1993, Galanz introduced
its own small, energy-efficient microwave oven at an affordable price and quickly
captured 10% of the market share in China. Since then, Galanz has unlocked the
latent mass market in China and achieved annual sales of over 25 million units in
2007.
After establishing itself in China, Galanz pursued an original equipment
manufacturer (OEM) role in the global value chain. Rather than competing in the
international microwave oven market directly, Galanz expanded its production scale
15
The data of Galanz microwave oven case were collected from the following firm website and
online report: http://www.galanz.com/about.shtml; Hang, C.C., Chen, J. and Subramian, A.M. 2010.
Developing Disruptive Products from Emerging Economies: Lessons from Asian Cases.
http://www.eng.nus.edu.sg/etm/research/publications/30.pdf

106
and cooperated with foreign incumbents. To disrupt the mainstream market in
developed countries, Galanz continued its R&D efforts to master the key
technologies for manufacturing microwave ovens and improved their performance to
the satisfaction level of high-end markets. As Galanz‘s manufacturing capabilities
continuously improved, more and more overseas incumbents moved their production
lines to Galanz. This helped Galanz develop its own core competency as an OEM.
By 2008, Galanz had applied for 508 patents and some of them, such as light-wave
microwave ovens, have become the new industry standard. From its humble
beginning in China, Galanz has become an internationally acclaimed brand and the
world leader in microwave oven sales since 1998.
4.3.2.4 The Zhejiang E-bike Community: A Two-wheeler Revolution
First appearing in the late 1990s, two-wheeler electric vehicles (e-bikes) have
become well known as a unique Chinese DI. After the Chinese government
restricted motorcycles in major cities in the early to mid-2000s, the large scale
commercialization of e-bikes took off. The design of the e-bike was based on the
manual bicycle with the simple additions of a hub motor at either the front or the rear
wheel, a battery at the back seat and a simple electronic controller mounted on the
handlebars. The attractive characteristics of e-bikes compared to motorcycles, such
as their small size, light weight, lower pollution and lower price, created a new trend
in public transportation. E-bikes especially met the needs of people in cities who
required a basic means of transport that is relatively fast, easy to operate and

107
convenient to park. Annual sales of e-bikes grew explosively from the initial 60,000
vehicles in 1998 to over 21 million in 2008. At present, China accounts for more
than 90% of global e-bike sales and has become the world‘s largest producer,
consumer and exporter of e-bikes.
The e-bike‘s success did not result from a single firm but from a community of
affiliated firms. The three largest e-bike communities are clustered in three Chinese
localities, namely Zhejiang, Tianjin and Jiangsu. These communities cooperated to
obtain government support for e-bikes and the Zhejiang government began offering
e-bike licenses in 1998. The legitimization of e-bikes triggered the boom of the e-
bike business with production growing exponentially from 50,000 in 1998 to 4
million in 2009 in Zhejiang alone. Further using Zhejiang as an example, I illustrate
how the development of the e-bike industry can be attributed to the highly
modularized industry structure. This organized structure allows manufacturers to
cooperate with modular suppliers to obtain the main e-bike components, including
the battery, motor and frame. For example, TianNeng Electronic Co. Ltd and
ChaoWei Power Co. Ltd. in Zhejiang currently supply about 90% of all e-bike
batteries. XinDaYang Group Co. Ltd, a Zhejiang motorcycle firm specializing in
motor development, invented the brushless motor widely adopted for use in e-bikes.
The frames of e-bikes are not much different from traditional bicycles and so can be
sourced from any bicycle frame manufacturer. Zhejiang LuYuan Electric Vehicle Co.
Ltd. was established in 1997 and became a pioneer e-bike manufacturer. During the
early days, in partnership with several other manufacturers, LuYuan established the

108
parameters for outsourcing e-bike components. Although the gross margin of
manufacturing one e-bike was only about 100 or 200 Chinese Yuan, close
cooperation within the value chain allowed e-bike firms to maintain their low cost
advantage and shorten the whole production cycle time. This grassroots level
innovation coupled with low costs and swift response to customer demands has
made e-bike manufacturers a formidable threat to the motorcycle firms. Some
famous Chinese motorcycle firms, including the Geely Group and Zhejiang
QianJiang Motorcycle Co. Ltd., tried to produce their own e-bikes, but ultimately
gave up. Even some e-bike firms could not survive the furious price-performance
competition. While the number of e-bike firms in Zhejiang peaked at 330, only
about 200 firms currently remain. One of these survivors is LuYuan.
In late 1998, LuYuan suffered a large-scale battery crisis due to quality issues.
Worse yet, the battery supplier refused to accept the returns or solve the problem.
Though LuYuan took the responsibility to accept the returns, thousands of broken
batteries threatened its reputation and caused great financial loss. After the crisis,
LuYuan realized the importance of advanced technology and manufacturing
capacity to guarantee the quality of e-bike batteries. LuYuan invested heavily in its
own R&D and developed its own battery related IP. To eliminate the possibility of
another battery crisis, LuYuan now has its own battery factory and battery brand. As
evidence of its continuous efforts to innovate, every year LuYuan files for about ten
patents and every month LuYuan introduces about five new models of e-bikes. With
accumulated capital and technology, LuYuan has gradually integrated the core

109
components into its manufacturing system. Over the last ten years, LuYuan has built
its competitiveness by controlling product cost, quality and performance.
4.3.2.5 CIMC16
: Giving Big Opportunities to Spin-offs
Since the early 1990s, CIMC (China International Marine Containers Group) has
been the world‘s largest manufacturer of low-tech dry-cargo containers. To diversify
their production line, CIMC entered the refrigerated container market in 1995 with
the hope of competing with the Japanese incumbent in this high-tech segment. There
were two product streams in the refrigerated container market: aluminum containers
based on full foaming technology and stainless steel containers based on
sandwich foaming technology. The foaming technologies used by these two
products were totally different. Sandwich foaming technology was relatively inferior
to full foaming technology in terms of the quality of foams. Even if the quality of
foams can be improved, the costs were found to be very much the same. This is why
the choice of application in which metal mostly depends on costs. The aluminum
containers were light-weight, while the stainless steel containers were heavy and
relatively expensive. At the time, aluminum containers based on full foaming
technology, namely aluminum refrigerated containers, were mainstream and the
16
The data of CIMC Stainless steel refrigerated container case were collected from the following
firm website, book and online reports: http://www.cimc.com/about/company/management/;
http://atandsonline.com/articles/press-releases/steel-cargo-containers-vs-aluminum-shipping-
containers/; Joerss, M. and Zhang, H. 2008. A Pioneer in Chinese Globalization: An Interview with
CIMC‘s President. http://www.mckinseychina.com/wp-content/uploads/2011/01/cimc08.pdf
Banhart, J. and Seeliger. H.W. 2012. Trends in aluminum foam sandwich technology. Advanced
Engineering Materials. Special Issue: Highly Porous Metals and Ceramics, 14(2): 1082-1087.
Zeng, M. 2007. Dragons at Your Door: How Chinese Cost Innovation Is Disrupting Global
Competition. Boston: Harvard Business School Press.

110
Japanese incumbents dominated 95% of the market share. To enter the market,
CIMC started a spin-off called Shanghai CIMC Reefer Container Co., Ltd. (SCRC)
and licensed sandwich foaming technology from Graaff Transport System GmbH, a
German incumbent with a minority share of the market. Due to the high technology
barrier, CIMC also established a joint venture with Graaff, giving Graaff a 2% share
of SCRC and hiring its technological experts to lead R&D.
CIMC rapidly absorbed Graaff‘s technology and increased its production efficiency.
When the production line was originally transferred from Graaff, the manufacturing
time was twenty minutes per container. CIMC reduced it to ten minutes per
container in 2002, then to five minutes per container in 2004. This increased
efficiency was achieved through process reengineering and also lowered production
costs. To improve thermal insulation, CIMC creatively applied automobile
technology to their refrigerated container development and improved the technology
originally licensed from Graaff.
In less than eight years, CIMC replaced the market standard with its more affordable
stainless steel refrigerated containers. In 2003, CIMC captured 44% of the global
market share and became the world‘s leading supplier of refrigerated containers.
That same year, the Japanese incumbents pulled out of the refrigerated container
market as their aluminum products could not compete with CIMC‘s performance
and price. In 2005, CIMC bought 77 patents from Graaff and has since owned the
whole series of patents related to stainless steel refrigerated containers.

111
4.3.2.6 UFIDA17
: Slow and Steady Wins the Race
Founded in 1988, UFIDA Software Company has grown to be the largest vendor of
software with enterprise applications in China. UFIDA has dominated the low-end
small and medium enterprises (SME) market since the early 2000s. UFIDA then
started to gain some market share from the leading high-end global vendors, such as
SAP and Oracle. UFIDA‘s strategy has been to seize the DI opportunity created by
maturing Chinese enterprises that require management applications to increase their
productivity. As a consequence, UFIDA has changed its strategic focus to operation
expansion so it can maintain its leadership position in China. Since 2003, UFIDA
has invested in R&D on service oriented architecture (SOA). In 2007, UFIDA
formed a ―SOA creative centre‖ with IBM, the number one player in the SOA
industry. SOA is an IT architectural platform used to turn business applications into
functions and processes customized for individual businesses. UFIDA creatively
implemented SOA in enterprise application development and in 2008 introduced
―U9‖, the world‘s first enterprise application based on the SOA platform.
Unlike the conventional service provider oriented model, UFIDA‘s U9 is a DI based
on a client oriented model. Using enterprise resource planning (ERP) as an example,
the conventional product is a platform with a whole suite of fixed applications. The
delivery time for a SME version is around three to six months, while a large
17
The data of UFIDA U9 case were collected from the following firm website and online reports:
http://www.yonyou.com/about/index.aspx;http://oracle.sys-con.com/node/355113; Goldman Sachs,
2010. Global Software and Services: China emerging, more of an IT services force for now.
http://www.kingdee.com/pub/139208306/2010/files/20100822-Goldman%20Sachs-
Global%20Technology%20Software.pdf; http://www.yunnao.com/shownews.aspx?newsid=326

112
enterprise version usually needs more than one year to complete. Moreover, the
vendor has to adjust the system for each client after implementation, which has a
very high cost. Thus, leading global vendors such as SAP and Oracle target the high-
end market in order to increase their margins. However, by using SOA, U9 loosely
couples the distributed applications based on the individual client‘s needs. As a
result, U9 costs about 40% less than equivalent enterprise applications by the leading
global vendors. To accommodate growing Chinese enterprises with diverse needs
and management styles, UFIDA localized the design and implementation and also
introduced new features like real time reaction and global operations for medium
and large enterprises. By offering flexible solutions at a competitive price, U9
appealed to clients unable to afford the traditional high-end applications. While SAP
and Oracle are still popular among the highest ranking enterprises, U9 has been
rapidly adopted by Chinese enterprises with relatively low level but customized
requirements in the high-end ERP market.
Within just twelve months of its launch, UFIDA‘s U 9 entered five new markets and
client numbers and sales increased by 5%. UFIDA captured 49.2% of the Chinese
high-end market by the end of 2008 and became an appealing alternative to
incumbents like SAP and Oracle. U9‘s share of the high-end market has rapidly
increased over the past few years and, considering the ever-rising demands of
Chinese enterprises, still has room to grow.

113
4.4 Discussion
The six cases described in the previous section give evidences that latecomer
disruptors and incumbents might openly cooperate to commercialize DI. The details
of the interactions between those firms are summarized in Table 4-2. In this section,
I discuss the conditions for combining OI and DI as well as the propositions for both
latecomers and incumbents to undertake OI when commercializing DI.
4.4.1 Conditions for Combining Open Innovation and Disruptive Innovation
When dealing with their inadequate resources, latecomers may find it is too late to
create their own. As a result, latecomers will be keen to pursue external resources
such as complementary assets and IP. Based on ownership of complementary assets,
latecomers can be divided into two categories: those with and those without
complementary assets. Latecomers with complementary assets are usually de alio
entrants who have accumulated complementary assets from other markets and are
able to deploy them in the target market. Latecomers without complementary assets
are either de novo entrants (start-ups) or de alio entrants whose complementary
assets from other markets are not applicable to the target market. Alternatively,
based on IP ownership, latecomers can be divided into two categories: those with IP
and those without IP. Some latecomers have their own disruptive technologies and
the associated IP. This exclusive ownership creates entry barriers for potential
competitors and builds the latecomers‘ competitive advantage in the market.
Since DI usually does not require ground-breaking technologies (Hobday, 1995),

114
latecomers with appropriate ideas but without IP can introduce DI by importing
available technology from incumbents who have greater bargaining power in
technology markets.
Table 4-2. Case summary at firm level
Case
No.
Latecomer
disruptor
OI practice in the
foothold stage of DI
OI practice in the
competitive stage of DI
Performance
1 Haier
Group
No (self-development) No (self -development) Worlds‘ No.1
share in mini
washing market
2 Haier
America
1996 – Haier allied with 28
foreign incumbents to
support technology
development
1999 – founded as a joint
venture between Haier and
Welbilt Appliances Inc., an
established American home
appliance distributor
Partnership with Best
Buy, Wal-Mart, Sears,
Lowe‘s, Home Depot and
Target to develop a
distribution network
Worlds‘ No. 1
share in mini
refrigerated
market
3 Galanz
Group
Early 1990s – imported the
production line from
Toshiba and seconded
engineers from Shanhai
Feiyue, one of four Chinese
microwave oven
manufactures
Vertically cooperating
with overseas incumbents
by being their original
equipment manufacturer
(OEM)
Worlds‘ No. 1
share in
microwave oven
manufacturing
4 Zhejiang
LuYuan
Electric
Vehicle Co.
Ltd.
(LuYuan)
1997 – vertically cooperated
with component suppliers
and partnered with other e-
bike manufactures for e-
bike‘s litigation and
parameters setting
No (Because a battery
crisis happened in Dec.
1998, LuYuan realized
the importance of the
advanced-technology and
quality control, and
started to invest its own
component factories)
Top player in e-
bike market and
a key player in e-
bike‘s
international
standard setting
5 China
Internation
al Marine
Container
Group
(CIMC)
1995 – spun off Shanghai
CIMC Reefer Container
Co., Ltd. and established a
joint venture with Graaff, a
German incumbent
Acquiring Graaff‘s
refrigerated container
related patents
Worlds‘ No. 1
share in the
refrigerated
container market
6 UFIDA
Software
Company
2007 – formed a ―SOA
creative centre ‖ with IBM
and became the leader of the
SOA application in
enterprise software industry
Continuously work with
IBM and use its
distribution network to
expand overseas markets
Top player in
China‘s high-end
enterprise market

115
As cooperation depends on ownership of complementary assets and IP, I examine
these together. Figure 4-2 summarizes these conditions and analyzes when OI has
been introduced in the DI sample cases. Each DI case is considered as one unit of
analysis. In Figure 4-2, the upper quadrants show the presence of OI and OI strategy
while the lower quadrants show the DI outcome.
OI strategy
DI outcome
Latecomer with IP Latecomer without IP
Latecomer
with
complementary
assets
OI not used OI (licensing, spin-off,
joint venture, alliance)
Latecomer without
complementary
assets
OI (joint venture, alliance) OI (licensing, alliance)
Figure 4-2. Conditions for combining open innovation and disruptive innovation
for latecomers
In cases where latecomers have complementary assets and IP, DI can be achieved
without OI. This is because de alio latecomers are able to leverage complementary
Haier ―mini magical
child‖ won
CIMC ―refrigerated
container‖ & UFIDA ―U9‖ won
Haier America
―wine cellar‖ won
Galanz―microwave
oven‖&LuYuan―e-bike‖
won by later developing
complementary assets or IP

116
assets created in other markets (He et al., 2006). These applicable complementary
assets enable the latecomer to gain some time to develop or utilize its IP for DI
development. By using this IP, the latecomer secures the competitive advantage to
commercialize the DI. The success of Haier‘s ―mini magical child‖ is a good
evidence to support the above proposition. Before starting DI, Haier had
accumulated manufacturing experience in consumer electronics. The complementary
technologies, manufacturing capability, distribution channels, brand and supplier
relationships had been established during the development of their prior
conventional washing machine. Thus, Haier was self-reliant with regard to
technology and made rapid inroads into a new market disruption. To expand the
―mini magical child‖ product line, Haier further developed its IP and designed
various versions based on the initial model to secure a dominant position in the mini
washing machine market. The case illustrates that OI is not necessary for successful
DI when latecomers own complementary assets and IP.
In cases where latecomers lack complementary assets and IP in the target market,
latecomers may start by using OI practices in developing and introducing a DI into
the market. However, this is only possible in cases such as Galanz and LuYuan
where latecomers are able to later develop their own complementary assets or IP.
Though OI can lower the entry barriers and allow latecomers to gain a foothold, if
they do not eventually develop these resources, latecomers will struggle to survive in
the competitive stage. Galanz was a textile OEM before entering the microwave
oven market, but this experience did not provide the firm with any complementary

117
assets applicable to the consumer electronics industry. By using OI to access outside
experts and import Toshiba‘s production line, Galanz gained an immediate foothold
and eventually unlocked the potentially huge, emerging Chinese market. To become
a global player, Galanz cooperated with foreign incumbents and established itself as
an OEM after many years of OI. Though it entered the market without
complementary assets and IP, Galanz has become the world‘s largest microwave
oven manufacturer and controls key manufacturing and IP. Similarly, LuYuan
successfully entered the e-bike industry without complementary assets and IP. In a
highly modularized industry such as e-bikes, manufacturing efficiency was most
important. Thus, lack of IP was a minor disadvantage to LuYuan, a de novo
latecomer, which used OI to work with component suppliers to establish a foothold.
The e-bike‘s modularized design made cooperation with suppliers easy and lowered
the entry barriers. But the benefits of OI always come with risks and LuYuan
experienced problems with its battery supplier. Once it became important to have a
competitive advantage through better batteries, LuYuan invested in its own battery
factory and created related IP. The success of Galanz‘s microwave oven and
LuYuan‘s e-bike gives evidence that OI is critical during the foothold stage for
latecomer disruptors without complementary assets and IP. It also shows that the
further development of competitive advantage through complementary assets and IP
is necessary in the competitive stage.
In cases where latecomers have IP but not the required complementary assets,
latecomers can achieve DI by using OI strategies. De alio latecomers with IP may

118
face organizational inertia when repeating DI success, but OI can help these firms
become serial disruptors. After the miracle of the ―mini magical child‖ in China, the
joint venture Haier America and local factory was created to serve US niche markets.
When Haier made its entry into the US, this was without complementary assets such
as brand and distribution channel. However, its wine cellar, a DI case based on
existing technology, opened up a niche market. The success of this DI was only
possible through cooperation with US incumbent Welbilt Appliances which
developed the Haier brand and built alliances with major retailers like BestBuy,
Sears, Target, etc. for distribution. This cooperation between one latecomer (Haier
America) and multiple incumbents was a win-win situation for all partners involved.
Supported by the Haier Research Institute in China, Haier America diversified its
product line during the competitive stage. Haier America has since enjoyed a good
reputation and has the majority of the market share for compact fridges worldwide.
This case illustrates how OI can help a latecomer without complementary assets to
exploit a DI opportunity.
In cases where latecomers have applicable complementary assets but without IP in
the target market, they can also achieve DI by engaging in OI. De alio entrants may
utilize their accumulated complementary assets for DI in different segments of the
same industry. This is how firms such as CIMC and UFIDA were able to capture the
mainstream market with a low-end disruption. CIMC had complementary assets in
container manufacturing before it became a disruptor. To enter the refrigerated
container market, CIMC spun off SCRC and developed a joint venture with a

119
German incumbent Graaff. CIMC started from scratch and eventually improved the
product and lowered the cost to the point that the Japanese incumbent was forced to
exit the market. To protect its newly earned position as the market leader, CIMC
purchased IP from Graaff to enhance its control of the related technology. Similarly,
UFIDA established a strategic alliance with an incumbent to develop a world-class
product. Though UFIDA started R&D on its own SOA, cooperation with IBM
allowed them to catch up more quickly and create the U9 enterprise application.
Besides technology support, the alliance with IBM provided guidance in function
development, code management and program testing. In this way, UFIDA
eventually gained the ability to serve the high-end markets. IBM‘s distribution
networks also expedited UFIDA‘s entry into overseas markets including Hong Kong,
Japan and other Asian countries. These two cases show that DI is not driven only by
technology – sometimes DI is more about how to make use of technology.
Latecomers may share disruptive ideas with incumbents and incumbents may work
with latecomers to commercialize DI. In these two case studies, it is clear that
cooperation was a win-win situation for the latecomers (CIMC, UFIDA) and the
incumbents (Graaff, IBM).
To summarize, the above case analysis is based on Teece‘s (1986) classic
framework examining whether and when OI happens in the DI context. The OI
strategies are shown in the form of different modes, such as licensing, strategic
alliance, joint venture, etc. The results of the case studies show promise that OI
strategies are applicable in DI development. They also clearly show that OI

120
strategies occur under certain circumstances in the Chinese latecomer cases. Thus, I
make the following four propositions based on the above case analysis.
Proposition 1. In cases where latecomers have complementary assets and IP, DI can
be achieved without OI. This may be because de alio latecomers are able to leverage
complementary assets created in other markets.
Proposition 2. In cases where latecomers lack complementary assets and IP in the
target market, they may win by using OI practices in developing and introducing a
DI into the market. However, this is only possible for the latecomers who can
subsequently develop their own complementary assets or IP.
Proposition 3. In cases where latecomers have IP but not the required
complementary assets, they can undertake OI strategies to gain access to external
complementary assets to commercialize DI.
Proposition 4. In cases where latecomers have the required complementary assets
but without IP in the target market, they can source external technologies to achieve
DI by engaging in OI.
4.4.2Utilization of Open Innovation by Latecomer Disruptors and Incumbents
Based on the above multiple-case analysis, this essay provides three ways to benefit
both latecomer disruptors and incumbents to combine OI and DI. These may occur
during the foothold stage and/or the competitive stage of DI. This section describes
121
each way in more detail.
Way 1. OI facilitates a latecomer’s survival or the success of DI.
Latecomer disruptors can leverage OI to reduce investment risk and time to market.
For example, the rise of e-bike firms during the foothold stage can be attributed to
cooperation between specialized firms. Close cooperation among members in the e-
bike community allowed them to share risk, reduce costs and quickly respond to
customers. Similarly, UFIDA‘s cooperation with IBM greatly reduced the time to
market for U9 and assured its quality. It is also important to note that, in order to be
a successful disruptor, the disruptive technology must improve continuously during
the competitive stage. OI, such as cooperation with other firms, can help latecomers
improve more quickly. For example, Galanz cooperated with incumbents to gain
complementary assets before it became the leading OEM. This core competence as a
manufacturer was essential to the global success of Galanz‘s microwave ovens.
Regarding the choice of OI modes in the DI cases, latecomers commonly used the
contractual mode, such as licensing, strategic alliance or joint venture, but seldom
used the acquisition mode, such as M&A. One possible reason is that latecomers
cannot commit a large amount of resources or manage the complexity of the
operations of two firms during M&A. The other key reason is that the acquired firms
are already in an existing market. That is, the acquiring mode usually facilitates the
entry into an existing market rather than new market creation. Thus, the latecomers

122
who engaged in M&A are most likely trying to catch up with market trends rather
than trying to disrupt others.
Way 2. OI allows both latecomers and incumbents to be involved in DI.
Latecomers and incumbents may struggle to innovate effectively if they rely solely
on internal R&D. The incumbents in the case studies, namely Graaff and IBM, as
well as many others have started to explore the possibility of increasing their R&D
productivity by tapping into externally developed innovations. In many cases, high-
tech latecomers in emerging economies are an interesting source of ideas and
technologies. One reason is that they are closer to emerging markets and sensitive to
their latent needs. For instance, UFIDA effectively localized U9 to meet the
increasing needs of Chinese enterprises. Even though SAP and Oracle were aware of
SOA‘s potential in enterprise applications, their existing clients were resistant to new
software. Secondly, latecomers‘ fresh knowledge promotes innovation and has the
potential to trigger DI opportunities. Thirdly, less constraint from the organizational
routine allows latecomers to take risks and take advantage of changes in resources,
processes and values. Often rich in ideas, latecomers may wish to cooperate with
incumbents to make up for their lack of resources. For example, the successful
commercialization of Haier America‘s wine cellar relied on incumbents‘ distribution
channels and technological support. The involvement of OI in commercializing DI
allows both latecomers and incumbents to seize potentially huge growth
opportunities and share the high risk of uncertain markets. Moreover, many

123
contractual modes of OI in the DI cases, i.e., licensing, strategic alliance and joint
venture, allow the co-existence of latecomers and incumbents.
Way 3. OI enables incumbents to disrupt themselves.
Incumbents can learn a lot from the e-bike case, as well as CIMC and Haier‘s
success stories of DI. It is possible for an incumbent to disrupt themselves by
engaging in OI. This can be illustrated by the case of XinDaYang Group Co. Ltd in
China‘s two-wheeler revolution (the e-bike case in this study). As a domestic
motorcycle manufacturing incumbent, XinDaYang Group was supposed to be
disrupted by e-bike producers; however, this did not happen. Instead of being
disrupted by others, XinDaYang Group became a pioneer propelling the e-bikes
revolution by leveraging their technology advantage of motor development. When e-
bike emerged in the late 1990s, XinDaYang Group started to develop a specialized
motor for e-bikes. This brushless motor was introduced by XinDaYang Group in
2003, and significantly improved the e-bike‘s performance in terms of efficiency,
reliability and other key performance measures. Shortly after, XinDaYang Group
established partnerships with the key e-bike producers (e.g., LuYuan) through OI,
and has since become a core component supplier for the entire industry.
When dealing with innovations that do not fit with the current business model, firms
could also spin them off or license them out. In the case of CIMC‘s refrigerated
containers, licensing agreements signed with German incumbent Graaff provided the
key technology resources to pursue the disruptive opportunity and reengineer the

124
product. However, this does not necessarily mean the technology stimulates the
disruptive features e.g., simple, low cost, etc. There is a need of a systematic way to
check for disruptiveness, such as a modified stage gate process (Danneels, 2004; Yu
and Hang, 2011). To ensure that spin-offs or licensees do not become their disruptor,
firms can position them in different market segments to explore opportunities for
new growth. For instance, rather than replacing Haier‘s existing products, Haier
America‗s wine cellar expanded the market territory. Alternatively, firms can
include clauses that allow them to use new technology developed by their spin-offs
and licensees. In this way, incumbents can protect themselves from potential
disruption and disrupt themselves.
4.5 Summary
This essay explored the conditions of applying OI to commercialize DI and then
identified situations where cooperation between latecomer disruptors and
incumbents benefitted both firms. It has contributed three important research
implications to the literature, which are summarized as follows.
Though a great number of studies have examined how latecomers disrupt the
mainstream market and surpass incumbents, few have investigated the possibilities
of cooperation between latecomers and incumbents in developing DI. This study
concurs with Christensen (1997) that there is competition between latecomer

125
disruptors and incumbents, but it is shown that this only happens at the point in the
competition when the disruptive product and existing product meet in the same tier
of the market. Utterback and Acee (2005) contended that the true importance of
disruptive technology could be to create new markets rather than to displace existing
products. Cooper and Schendel (1976) pointed out that latecomers‘ market
expansion is less of a threat to incumbents than other firms introducing substitute
products. Thus, latecomer disruptors and incumbents are potentially well suited to
cooperate with each other. The finding of the importance of OI between latecomers
and incumbents in many DI cases gives a fresh perspective to the existing DI
literature that focuses on competition (Christensen, 1997). I found that OI could
facilitate latecomer disruptors and incumbents to work together to create new value,
especially in the pursuit of emerging and non-consumption markets. The cooperative
scenarios found in the case studies provide us with better understanding of the role
of OI in developing DI.
This essay underscored the implications of the model of Gans and Stern (2003) in
the context of DI. The contingencies whether latecomer disruptors openly cooperate
with incumbents are closely related to complementary assets and IP that they own.
Gans and Stern‘s (2003) classical analysis of cooperation possibilities between
latecomers and incumbents was adapted to identify these conditions and predict
whether cooperation is a strategic choice. This essay identified an additional
situation from the DI cases, which was overlooked by the model of Gans and Stern‘s
(2003). In a situation where complementary assets and IP are not important for

126
commercializing a new technology, Gans and Stern (2003) expected competition
and cooperation strategies would both be effective and latecomers would compete
with incumbents for technology priority. However, in the e-bike case study, there
was no technology competition between the latecomers (e-bike firms) and
incumbents (motorbike firms), and the situation favoured the latecomers (e-bike
firms). This was partially caused by government policy which supported the e-bike
industry for its environmental benefits. Moreover, most of the motorbike firms were
probably unwilling to enter the e-bike industry in view of its low profit margins.
This essay enhances the understanding of cooperation strategies at times of
technological discontinuities (Spedale, 2003; Hüsig and Hipp, 2009). The
implications of cooperation strategies evidenced in the context of radical
technological change by Spedale (2003) are not applicable for latecomers in DI
development. In contrast, the essay gave evidence that latecomers, such as UFIDA,
who concentrate on specialized markets, can undertake structured cooperation (at the
inter-organizational level) and successfully sustain the development of the new
technology. Though radical and disruptive technology both can lead to discontinuous
innovation, the former appears to be a greater threat to existing products. This is
because the beauty of DI development is more about the business model, rather than
the technology itself like radical innovation. Thus, latecomers may find the
technology with disruptive potential in the market and cooperate with the technology
owner. Besides trading for technologies, in the case of UFIDA‘s U9, cooperation
with the incumbent – IBM – help build the competitive advantage in terms of
127
reputation, international distribution network, etc. Similarly, Spedale‘s (2003)
finding – ―latecomers tend to concentrate in specialist niches where leading-edge
applications are explored and developed (specialist, technology-push strategy) at
times of radical technological change‖ – cannot be generalized in the context of DI. I
found the latecomers in the specialist niches, such as Haier America, can apply the
market pull strategy in developing DI. Moreover, the essay identified the latecomers,
such as CIMC, who utilize technology-pull strategy also can successfully capture the
traditional mainstream market. Despite more difficulties in disrupting the existing
technology in the traditional mainstream than the specialist niches, latecomers can
strategically partner with less dominate players to raise the chance to win. Without
structured cooperation with others, fierce competition in the competitive stage of DI
will challenge latecomers to survive even though they may enter from the low-end of
the foothold market. And only if latecomers are de alio entrants with strong
complementary assets in the target market, as in the case of CIMC‘s refrigerated
containers, are they likely to achieve the performance improvement and eventually
disrupt the industry leader. In addition, it was clearly observed that there are more
cases, such as Haier‘s ―mini magical child‖, Galanz microwave and e-bike, related to
the market-pull strategy. All latecomers in those cases uncovered the latent needs in
developing economies and then rapidly grew the market, and eventually became
strong global players.

128
CHAPTER 5.
CONCLUSION
5.1 Summary of Theoretical Contributions
Latecomer firms from emerging economies have long wowed the world with their
technological catching-up over the last decade. This thesis explores the reasons
why some latecomers could become upcoming innovators by utilizing external
resources, i.e., open innovation. Despite the vast literature on open innovation
strategies in developed economies, it is insufficient to use current understanding to
explain the catching-up cases in emerging economies. In fact, latecomers deserve
special attention in the strategic management literature, because they face the
critical ―do or die‖ situation where every action they take needs to be prudent in
order to survive. Furthermore, the uncertainties caused by resource constraints
mean that latecomers cannot afford to make any wrong decisions. The extant
literature on external resource utilization has not investigated enough details of
these survival strategies.
To fill the research gap, this thesis provides important strategic guidance for
latecomers to effectively turn external resources into innovative capabilities. The
findings reveal that the latent relationships between the key determinants in the
strategic choice of which target to acquire affects the subsequent innovation
performance. The uniqueness of latecomers – the nature of being a technological

129
laggard and special catching-up trajectory – largely causes them to undertake open
innovation differently from incumbents. By examining this uniqueness, this thesis
presents both quantitative and qualitative findings that contribute broadly to the
strategic management literature.
I have concluded that open innovation can help latecomers promote innovation
under certain contingencies. Specifically, I investigated latecomer strategies in
using open innovation‘s two extreme mechanisms according to the complexity
ranking, i.e., licensing and M&A. Furthermore, I investigated the combinative
utilization of licensing and M&A, as well as other open innovation mechanisms, in
latecomers‘ favourable catching-up trajectory, i.e., disruptive innovation. The main
theoretical contributions throughout the whole thesis include the three following
aspects:
First, the age of licensed-in technology is the first being investigated in this thesis.
The existing literature mainly focuses on the impact of the quantity of licenses and
shows mixed results of the linear relationship (i.e., positive, negative or
insignificant) with innovation performance (Ahuja and Katila, 2001; Álvarez et al.,
2002; Johnson, 2002; Tsai and Wang, 2009). By considering the technology age, I
found a curvilinear (an inverted U) relationship between the number of licenses
and the licensee‘s innovation performance (H1). The inverted U shape reveals that
a moderate level of the quantity of licenses should be compatible with the existing
absorptive capacity. Indeed, the technology recency most positively affects the
130
growth of innovation (H2). The positive effects of the number of licenses and
technology recency are more likely to be observed in latecomers with high
absorptive capacity (H3, H4).
Second, substitution effect in M&A is found to be more important for latecomers.
The existing literature mainly treats M&A as a strategy to maximize synergies and
further identifies an inverted U relationship between technology similarity and
innovation performance (Ahuja and Katila, 2001; Cloodt et al., 2006). In the
context of technologically laggard firms, this thesis discovers that latecomers do
not have enough absorptive capacity to acquire different technologies (H1).
However, latecomers can acquire a target with competent new technologies to
substitute their existing technologies. This substitution will result in an innovation
performance that is proportional to the joint effect of the size and the distance of
the technology acquired (H2).
Third, this thesis presents novel research in the application of open innovation to
develop disruptive innovation. Disruptive innovation is the trajectory that best
enables latecomers to enter a market and potentially become leaders. This kind of
competition with incumbents has been greatly emphasized in the existing
disruptive innovation literature (Christensen, 1997; Christensen, 2003; Utterback
and Acee, 2005). However, cooperation with incumbents through open innovation
has yet to be studied as a viable strategy for disruptive innovation. This thesis
suggests several ways that open innovation can be successfully applied in

131
disruptive innovation under certain conditions. The basic conditions for combining
open innovation and disruptive innovation are based on the complementary assets
and IP owned by latecomers. Furthermore, latecomers need to develop the
acquired assets in a complementary way to enhance the competitive advantage.
The enabling role of open innovation for latecomers and incumbents to cooperate
indeed aids the success of disruptive innovation in three ways, which extend the
view of open innovation in disruptive innovation theory: (1) open innovation
facilitates a latecomer‘s survival or the success of disruptive innovation; (2) open
innovation allows both latecomers and incumbents to be involved in disruptive
innovation; and (3) open innovation enables incumbents to disrupt themselves
when needed.
5.2 Summary of Managerial Implications
Based on the above findings, this thesis offers the following important managerial
implications. First of all, latecomers have more flexible strategic choices than
incumbents and more determinants to consider when utilizing open innovation.
Besides the common determinants like the quantity of technology (size of the
knowledge base in this thesis), latecomers need to address the characteristics of the
technology in their open innovation strategy, such as the age, technology distance
and interactions among determinants. This thesis sheds light on latecomers‘ new
strategies for growth. To a certain extent, the first two essays represent an attempt

132
to open the ―black box‖ – how to integrate the external resources – through a
closer empirical investigation of the above determinants. In addition to the
empirical investigation, the qualitative study in the last essay offers new insights
for using open innovation in the specific innovation trajectory favoured by
latecomers. The managerial implications are detailed below.
The thesis reveals latecomer strategies for successful learning by licensing. It
discloses that latecomers‘ ITL strategy is not only about how much learning can be
achieved from licensing, but also about identifying the right technology resources
to learn. The direct implication is that ITL enables latecomers to enlarge their
knowledge pool in a short period of time, although extra time and resources are
required to fully absorb licensed-in technologies. Licensed-in technologies can
serve as seeds that spur internal R&D development, but resource allocation to
internal R&D development is critical in the long run. In the case where competitors
are not willing to license out some of their core technologies, latecomers must
accumulate technological capability to compensate for the shortage of technology
available in the market. Thus, latecomers need to optimize their resource allocation
between ITL and internal R&D development. The other important implication of
this study is for the long-term planning of technological capability development.
Latecomers may not be fully motivated to purchase patents to compensate for their
technology shortfalls, but building them into their patent portfolios is the best
approach for promoting their technological capability development. In high-tech
fields, licensing as a fast track to transfer technology may spur a firm‘s

133
technological learning and innovation for competency building. Furthermore,
learning from the latest technology rather than older technology has prominent
advantages, especially for latecomers who have been accumulating absorptive
capacity. Instead of passive licensing to fill technology gaps, updating their
technology portfolios by strategically importing the right technology is a wiser
way for latecomers to grow steadily and achieve technological catching-up.
On the other hand, when the assumption that external resources have to be
integrated is dropped, a flexible strategic choice to substitute the competency of
target for the existing one should be recognized. This is the main focus of the
second essay in this thesis. The empirical findings provide guidance to managers
who are increasingly involved with technological catching-up via M&A, and
suggest that firms should manage strategic choices based on the characteristics of
their technology bases. Essay Two emphasizes that both the quantitative (e.g.,
knowledge base) and qualitative dimensions (e.g., technological distance) between
the target and acquiring firm matter a great deal for the post-M&A innovation
performance. Although this essay focuses on situations where the acquiring firms
have low technological capabilities relative to firms in developed economies
(Mathews, 2002) and where the target firms are technology-related (Jaffe, 1986), it
provides takeaways for managing the success of post-M&A innovation
performance, as summarized in Figure 5-1. In the case of latecomers in emerging
economies, their primary goal is to realize the potential technological catching-up.
Substituting the existing competency with an advanced one through M&A is

134
probably the easiest and fastest way to catch up, especially for latecomers without
the burden of knowledge rigidity and organizational inertia. Even though some
latecomers acquire in order to achieve economies of scale, the inferior absorptive
capacity and management challenges in the integrating firm would easily kill the
chance of success in M&A, and thus it is only possible to acquire for quantitative
complementarity. However, when a firm with a high technological capability
acquires a target with similar technology, it is reasonable the firm to maximize
synergies to complement its existing competency. This occurs because this firm is
likely a forerunner in its field and if the firm already possesses a well-established
technological capability, there is no reason to sacrifice the existing competency for
a new one. In the case of acquiring target firms that are technologically unrelated
to the existing business, more management challenges appear in the integrated
organization and M&A can only be successful if they are conquered. This is the
case even for firms in developed economies. In cases where latecomers have low
technological capabilities, the post-M&A innovation is only achievable by
qualitative complementarity, not quantitative complementarity. It is possible to
innovate by combining technologies from totally different industries, but the
inferior absorptive capacity associated with a poor technology accumulation goes
nowhere for latecomers to spend additional efforts integrating a large amount of
external resources.
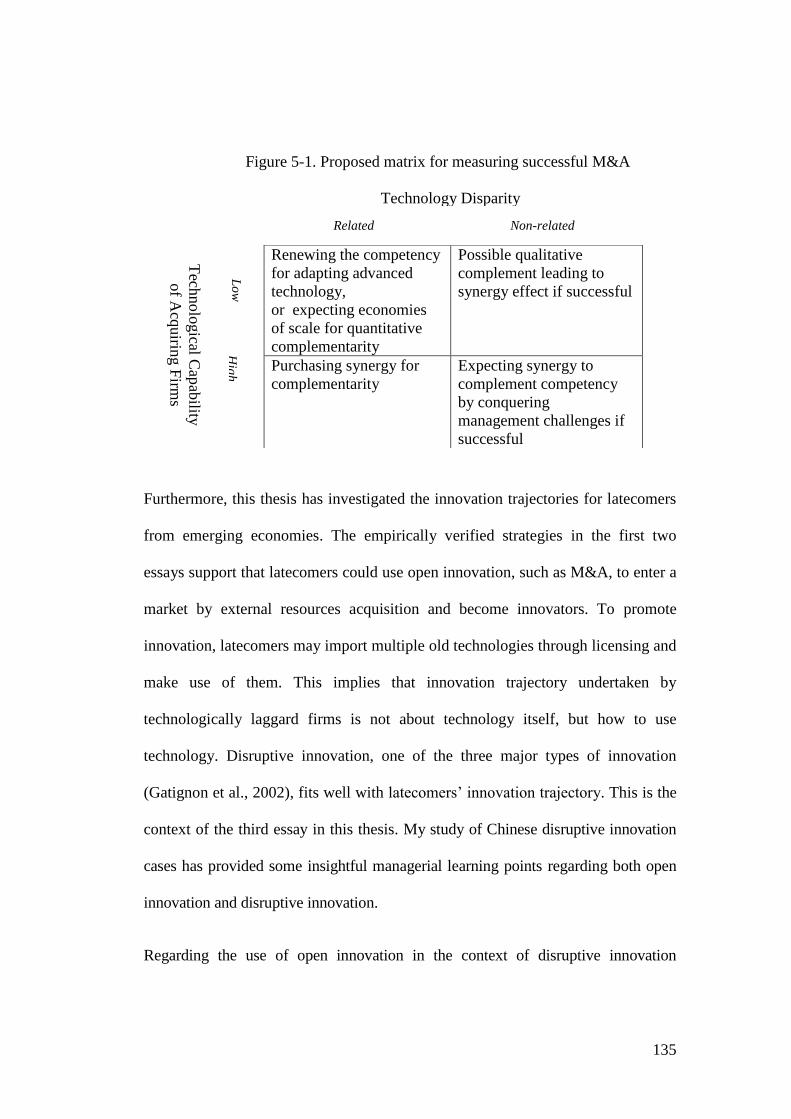
135
Figure 5-1. Proposed matrix for measuring successful M&A
Furthermore, this thesis has investigated the innovation trajectories for latecomers
from emerging economies. The empirically verified strategies in the first two
essays support that latecomers could use open innovation, such as M&A, to enter a
market by external resources acquisition and become innovators. To promote
innovation, latecomers may import multiple old technologies through licensing and
make use of them. This implies that innovation trajectory undertaken by
technologically laggard firms is not about technology itself, but how to use
technology. Disruptive innovation, one of the three major types of innovation
(Gatignon et al., 2002), fits well with latecomers‘ innovation trajectory. This is the
context of the third essay in this thesis. My study of Chinese disruptive innovation
cases has provided some insightful managerial learning points regarding both open
innovation and disruptive innovation.
Regarding the use of open innovation in the context of disruptive innovation
Renewing the competency
for adapting advanced
technology,
or expecting economies
of scale for quantitative
complementarity
Possible qualitative
complement leading to
synergy effect if successful
Purchasing synergy for
complementarity
Expecting synergy to
complement competency
by conquering
management challenges if
successful
Tech
nolo
gical C
apab
ility
of A
cquirin
g F
irms
Lo
w
Hig
h
Technology Disparity
Related Non-related

136
development, licensing appears to be an essential strategy. Licensing is the most
commonly adopted strategy to access technology in all the cases, while M&A
occurs less frequently. It is understood that fewer latecomers can pursue M&A due
to its greater complexity (Marks and Mirvis, 1998). The underlying cause can be
also tracked by the specific innovation trajectory and revels that not every
catching-up firm conducts disruptive innovation. A firm that pursues M&A tends
to enter the existing market that the target firm are in, and thus does not create a
new market or disrupt others. In other words, the strategy to pursue disruptive
innovation may be viewed as an alternative to M&A.
The in-depth case studies also provide insights into opportunity exploitation for
disruptive innovation. The three ways to exploit disruptive opportunities are
summarized. First, a latecomer may seek opportunities to cooperate with an
incumbent that is less dominant in the market. This may lead to a collaborative effort,
which eventually allows the firms to disrupt the market. CIMC‘s refrigerated
container is a typical case illustrating how a latecomer seized an opportunity at a
time when the incumbent was failing and created a good-enough product with a
much lower price that eventually came to dominate the market. Second, niche
markets can serve as shortcuts for latecomers to enter new fields. Since incumbents
often underestimate niche markets, they are good places for latecomers to develop
disruptive innovation. For instance, Haier America‘s wine cellar served as an
important starting point for Haier to enter the global compact fridge market. Third,
some latecomers are able to foresee booming opportunities that incumbents miss due

137
to their focus on sustaining innovation (Christensen, 1997). After UFIDA nearly
missed an opportunity to enter the high-end market, it was motivated to seek new
solutions. The success of UFIDA‘s U9 demonstrated the importance of anticipating
market trends that can allow latecomers to jump into new areas and enlarge the
market.
In addition, the third essay challenges the traditional globalization strategy of
―think global, act local‖. It demonstrates that open innovation helps local
innovations grow as global applications, albeit its effectiveness is contingent upon
the firm itself. That is, it is possible for latecomers to introduce pioneer
innovations in emerging economies and then become international players.
Latecomers may adopt the strategy of ―design local, go global‖ by climbing up the
value chain to become innovators, despite their humble beginning from
downstream, such as manufacturing. It is also notable that most of the disruptive
innovation cases are new market disruptions that meet latent needs at the bottom of
the pyramid markets (Prahalad, 2004, 2012; Ray and Ray, 2011). Thus, the
traditional top-down approach of ―think global, act local‖ may not be suitable for
latecomer firms from emerging economies.
Finally, policy makers can largely contribute to facilitating open innovation
implementation as ―invisible hands‖ (Ahmad, 1990). This thesis confirms that the
presence of markets for technology and markets for ideas facilitate technological
learning and innovation, especially for technologically laggard firms. Developing
138
the ecosystem that facilitates technology and idea transfer is an important
instrument that policy makers can employ to promote technological development.
In this way, policy makers in emerging economies can pay more attention to the
market order and an appropriate IPR environment in order to motivate business
activities. Similarly, formulating policies that encourage domestic firms to actively
adopt open innovation strategies to make market entry is necessary because
external resource acquisition plays an important role in the formation of innovative
capabilities. Furthermore, policy makers may provide incentives for firms to climb
the industry value chain and gradually develop their innovation capabilities. For
instance, Chinese e-bike firms greatly benefited from the decentralized
manufacturing and the industry modularity. Even though they come from humble
beginnings, firms can tap into the disruptive opportunities and eventually become
the industry leaders.
5.3 Recommendations for Future Work
This thesis is subject to various qualifications and raises a number of questions for
further work.
First, the analysis of the effect of licensing and M&A on R&D outcomes was
carried out from the angle of the demand side, i.e., the licensees and acquiring
firms. The dynamics between being a recipient and a supplier in a technology

139
market have not been addressed from a latecomer‘s perspective. A host of
interesting research questions may arise about the drivers and conditions of the role
of shifting between technology recipient and supplier from both the strategic and
economic efficiency views.
Second, the technology strategic literature indicates there are different open
innovation mechanisms that help latecomers access external resources to achieve
technological catching-up. I believe that different open innovation mechanisms may
have different success rates when utilized by different types of latecomers. Of the
various open innovation strategies examined in this thesis, I did not try to identify
which one was ideal and only used them to illustrate their supporting roles in
innovation development. For example, even though the latecomers included de novo
and de alio entrants, I did not go further to analyze if there exist any differences in
their use of open innovation in order to stay the focus. This may open a potential
line of new research investigating which mechanism is a desirable alternative for
latecomers and when these alternatives are complementary, e.g., licensing and
M&A.
Third, this thesis focuses on some factors with regard to the qualitative and
quantitative dimensions of technology, such as technology age, technology
distance and knowledge base. Latecomers‘ success is also driven by other factors,
such as public policy, management perceptions, organizational routines, cultures,
etc., which have not been addressed in this thesis. Analysis of those additional

140
factors may give a more comprehensive view of latecomer strategies. For instance,
research could expand on the conditions for acquiring new or old technologies by
examining the managements‘ perceptions of whether the acquisition was motivated
by exploration or exploitation in organisational learning.
Fourth, this thesis looked into latecomer strategies and mainly addressed the
research questions from a latecomer‘s perspective. For instance, the third essay
concentrates on the conditions leading to open innovation that help latecomers
achieve disruptive innovation; the essay did not focus on the outcomes for
incumbents. Only in two cases (UFIDA‘s U9 and e-bike) did I address how
cooperation with a latecomer helped an incumbent (IBM and XinDaYang Group)
extend its market presence. This open innovation eventually led to fierce
competition with other incumbents (SAP/Oracle and motorcycle manufacturers). In
the value creation network, it would be interesting to study the feedback loop to
the incumbent‘s side. The same research questions could be examined from the
incumbent‘s perspective to uncover how incumbents may learn from latecomers
through open innovation.
Finally, the studies in this thesis are based on the context of high-tech firms in
China, one of the fastest growing economic embodiments within the last decade.
The strategies demonstrated in this thesis highlight the strategic development
routes for latecomers on the rise in high-tech industries. However, these strategies

141
for technological catching-up may be context-sensitive. For example, firms from
South Korea and other Asian ―four tigers‖ economies followed the export-growth
path for technological catching-up (Xie and Wu, 2003), while firms from China
and Japan started from the local market-focused path. A comparative study of the
research questions over different countries will offer a deeper understanding of
latecomer strategies that takes into account contextual factors. Nevertheless, this
thesis could serve as a basic reference for further research in diverse contexts, as
more emerging economies catch up on R&D and innovation.

142
BIBLIOGRAPHY
Adner, R. 2002. When are technologies disruptive? A demand-based view of the
emergence of competition. Strategic Management Journal, 23(8): 667-688.
Afuah, A.N. and Utterback, J.M. 1991. The emergence of a new supercomputer
architecture. Technological Forecasting and Social Change, 40(4): 315-328.
Ahmad S. 1990. Adam Smith's four invisible hands. History of Political Economy,
22(1): 137-144.
Ahuja, G. and Katila, R. 2001. Technological acquisitions and the innovation
performance of acquiring firms: A longitudinal study. Strategic Management
Journal, 22(3): 197-220.
Ahuja, G. and Lampert, C.M. 2001. Entrepreneurship in large corporations: a
longitudinal study of how established firms create breakthrough inventions.
Strategic Management Journal, 22: 521-554.
Akbulut, M. and Matsusaka, J. 2010. 50+ years of diversification announcements.
Financial Review, 45: 231-262.
Álvarez, R., Crespi, G. and Ramos, J. 2002. The impact of licenses on a ―Late
Starter‖ LDC: Chile in the 1990s. World Development, 30(8): 1445-1460.

143
Amburgey, T.L., Kelly, D. and Barnett, W.P. 1993. Resetting the clock: The
dynamics of organizational change and failure. Administrative Science Quarterly,
38: 51-73.
Andrade, G., Mitchell, M. and Stafford, E. 2001. New evidence and perspectives
on mergers. Journal of Economic Perspectives, 15: 103-120.
Arora, A. and Gambardella, A. 2010. The market for technology. In Hall B. H. and
Rosenberg, N. (eds.), Economics of Innovation, Handbook of the Economics of
Innovation. UK: Oxford, 642-665.
Atuahene-Gima, K. 1993. Determinants of inward technology licensing intentions:
an empirical analysis of Australian engineering firms. Journal of Product
Innovation Management, 10(3): 230-240.
Bain, J.S. 1956. Barriers to New Competition, MA: Harvard University Press.
Barney, J. 1991. Firm resources and sustained competitive advantage. Journal of
Management, 17(1): 99-120.
Bell, M. 1984. ‗Learning‘ and the accumulation of industrial technological capacity
in developing countries. In Fransman, M. and King, K. (eds.), Technological
Capability in the Third World. London: Macmillan, 187-209.
Berger, P. L. and Luckmann, T. 1967. The Social Construction of Reality: A
Treatise in the Sociology of Knowledge. New York: Doubleday & Co.

144
Breschi, S., Lissoni, F. and Malerba, F. 2003. Knowledge-relatedness in firm
technological diversification. Research Policy, 32(1): 69-87.
Brunner, R. 1998. The use of excess cash and debt capacity as a motive for merger.
Journal of Financial and Quantitative Analysis, 23(2): 199-217.
Burns, L.R., Sean, N. and John, E. 2005. Mergers, acquisitions and the advantages of
scale in the pharmaceutical industry. In Burns, L. R. (eds.), The Business of
Healthcare. Cambridge: Cambridge University Press, 223-270.
Calof, J.L.1994. The relationship between firm size and export behavior. Journal of
International Business Studies, 25(2): 367-387.
Cameron, C.A. and Trivedi, P.K. 1998. Regression Analysis of Count Data.
Cambridge: Cambridge University Press.
Campa, J.M. and Kedia, S. 2002. Explaining the diversification discount.
Journal of Finance, 57(4): 1731-1762.
Cangelosi, V.E., and Dill, W.R. 1965. Organizational learning: Observations
toward a theory. Administrative Science Quarterly, 10(2): 175-203.
Capron, L. 1999. The long-term performance of horizontal acquisitions. Strategic
Management Journal, 20(11): 987-1018.
Capron, L. and Pistre, N. 2002. When do acquirers earn abnormal returns? Strategic

145
Management Journal, 23(9): 781-794.
Carlile, P.R. and Christensen, C.M. 2005. The Cycles of Theory Building in
Management Research. Boston: Harvard Business School. Work Paper, No. 05-057.
Cartwright, S. 2005. Mergers and acquisitions: An update and appraisal. In
Hodgkinson, G.P. and Ford, J.K. (eds.), International Review of Industrial and
Organizational Psychology. Chichester: John Wiley, 20:1-38.
Centre Watch, 2000. Troubling Numbers for Big Pharma Consolidation, 2-3.
Charitou, C. and Markides, C. 2003. Responses to disruptive strategic innovation.
Sloan Management Review, 44(2): 55-63.
Chatterji, D. 1996. Accessing external sources of technology. Research Technology
Management, 39(2): 569-559.
Chesbrough, H. 2003. Open Innovation: The New Imperative for Creating and
Profiting from Technology. Boston: Harvard Business School Press.
Chesbrough, H., Vanhaverbeke, W. and West, J. 2006. Open Innovation:
Researching a New Paradigm. Oxford: Oxford University Press.
Chen, C.H. and Shin, H.T. 2008. Mergers and Acquisitions in China: Impacts of
WTO Accession. MA: Edward Elgar Publishing.

146
Child, J., Pitkethly, R. and Faulkner, D. 1999. Changes in management practice and
the post-acquisition performance achieved by direct investors in the UK. British
Journal of Management, 10(3): 185-198.
China Statistics Yearbook, 2011. China High-tech Industry Data Book 2011.
http://www.sts.org.cn/sjkl/gjscy/data2011/data11.pdf
Cho, D.S., Kim, D.J. and Rhee, D.K. 1998. Latecomer strategies: Evidence from the
semiconductor industry in Japan and Korea. Organization Science, 9(4): 489-505.
Christensen, C.M. 1997. The Innovator's Dilemma: When New Technologies
Cause Great Firms to Fail. Boston: Harvard Business School Press.
Christensen, C.M. and Raynor, M.E. 2003. The Innovator's Solution: Creating and
Sustaining Successful Growth. Boston: Harvard Business School Press.
Christensen, C.M. 2006. The ongoing process of building a theory of disruption.
Journal of Product Innovation Management, 23(1): 39-55.
Christensen, C.M., Anthony, S.D. and Roth, E.A. 2004. Seeing What's Next. Boston:
Harvard Business School Press.
Cloodt, M., Hagedoom, J. and Kranenburg, H.V. 2006. Mergers and acquisitions:
Their effect on the innovative performance of companies in high-tech industries.
Research Policy, 35(5): 642-654.

147
Cockburn, I. 2006. Is the pharmaceutical industry in a productivity crisis? In Jaffe,
A., Lerner, J. and Stern, S. (eds). Innovation Policy and the Economy. MA: MIT
Press, 7: 1-32.
Cohen, W.M. and Levinthal, D.A. 1989. Innovation and learning: The two faces of
R&D. The Economic Journal, 99(397): 569-596.
Cohen, W.M. and Levinthal, D.A. 1990. Absorptive capacity: A new perspective of
learning and innovation. Administrative Science Quarterly, 35(1): 128-152.
Cohen, W.M. and Levinthal, D.A. 1994. Fortune favors the prepared firm.
Management Science, 40(2): 227-251.
Commission of the European Communities, 1985. Utilization of the Results of
Community Sponsored R, D. and D. In: Newsletter – new technologies and
innovation policy, Nr.46. Luxembourg: 2-10.
Conn, C., Cosh, A., Guest, P. and Hughes, A. 2001. Long Run Share Performance
of UK Firms Engaging in Cross Border Acquisitions. University of Cambridge,
Centre for Business Related Research. Working Essay, No. 214.
Cording, M., Christmann, P. and Bourgeois, L.J. III. 2002. A Focus on the
Resources in M&A Success: a Literature Review to Resolve Two Paradoxes. Essay
presented at the 2002 Annual Meeting of the Academy of Management, Denver, US.

148
Cooke, F.L. 2006. Acquisitions of state-owned enterprises by MNCs: Driving forces,
barriers and implications for HRM. British Journal of Management, 17: 5105-5121.
Cooper, A. and Schendel, D. 1976. Strategic responses to technological threats.
Business Horizons, 19(1): 61-69.
Corsten, H. 1987. Technology transfer from universities to small and medium-
sized enterprises — an empirical survey from the standpoint of such enterprises.
Technovation, 6(1): 57-68.
Cyert, R.M. and March, J.G. 1963. A Behavioral Theory of the Firm, 2nd edition.
MA: Wiley-Blackwell.
Dahlander, L. and Gannb, D.M. 2010. How open is innovation? Research Policy, 39
(6): 699-709.
Dahlman, C.J., Larsen, B.R. and Westphal, L.E. 1987. Managing technological
development: Lessons from the newly industrializing countries. World Development,
15(6): 759-775.
Danneels, E. 2004. Disruptive technology reconsidered: A critique and research
agenda. Journal of Product Innovation Management, 21(4): 246-258.
Danzon, P., Epstein, A. and Nicholson, S. 2007. Mergers and acquisitions in the
pharmaceutical and biotech industries. Managerial and Decision Economics, 28
(4/5): 307-328.

149
Davidson, W.H. and McFetridge, D.G. 1985. Key characteristics in the choice of
international technology transfer mode. Journal of International Business Studies,
16(2): 5-21.
Drejer, A. 2000. Organizational learning and competence development. The
Learning Organization, 7(4): 206-220.
Eisenhardt, K. and Graebner, M.E. 2007. Theory building from cases: Opportunities
and challenges. Academy of Management Journal, 50(1): 25-32.
Engelsman, E.C. and van Raan, A.F.J. 1992. A patent-based cartography of
technology. Research Policy, 23(1):1-26.
Ettlie, J.E. and Rubenstein A.H. 1987. Firm size and product innovation. Journal of
Product Innovation Management, 4(2): 89-108.
Fabrizio, K.R. 2009. Absorptive capacity and the search for innovation. Research
Policy, 38(2): 255-267.
Fleisher, B., Li, H. and Zhao, M.Q. 2010. Human capital, economic growth, and
regional inequality in China. Journal of Development Economics, 92(2): 215-231.
Fleming, L. 2001. Recombinant uncertainty in technological search. Management
Science, 47(1): 117-132.
Fosfuri, A. 2000. Patent Protection, imitation, and the mode of technology transfer.
International Journal of Industrial Organization, 18(7): 1129-1149.

150
Fosfuri, A. 2006. The licensing dilemma: Understanding the determinants of the
rate of technology licensing. Strategic Management Journal, 27(12): 1141-1158.
Gallini, N.T. 2002. The economics of patents: Lessons from recent US patent reform.
Journal of Economic Perspectives, 16(2): 131-154.
Gambardella, A. 1992. Competitive advantages from in-house scientific research:
the US pharmaceutical industry in the 1980s. Research Policy, 21(5): 391-407.
Gans, J.S., Hsu, D. and Stern, S. 2002. When does start-up innovation spur the gale
of creative destruction? RAND Journal of Economics, 33 (4): 571-586.
Gans, J.S. and Stern, S. 2003. The product market and the market for ―Ideas‖:
commercialization strategies for technology entrepreneurs. Research Policy, 32(2):
333-350.
Gatignon, H., Tushman, M.L., Smith, W. and Anderson, P. 2002. A structural
approach to assessing innovation: Construct development of innovation locus, type
and Characteristics. Management Science, 48(9): 1103-1122.
Gillbert, C. 2003. The disruption opportunity. MIT Sloan Management Review,
44(4): 27-32.
Gould, D.M. and Gruben, W.C. 1996. The role of intellectual property rights in
economic growth. Journal of Development Economics, 48(2): 323-350.

151
Govindarajan, V. and Kopalle, P.K. 2005. Disruptiveness of innovations:
Measurement and an assessment of reliability and validity. Strategic Management
Journal, 27(2): 189-199.
Govindarajan, V. and Kopalle, P.K. 2006. The usefulness of measuring
disruptiveness of innovations ex post in making ex ante predictions. Journal of
Product Innovation Management, 23(1): 12-18.
Grant, R.M. 1996. Toward a knowledge-based theory of the firm. Strategy
Management Journal, 17:109-122.
Greene, W. 2008. Econometric Analysis, sixth edition. Prentice Hall: Englewood
Cliffs.
Griliches, Z. 1979. Issues in assessing the contribution of research and
development to productivity growth. Bell Journal of Economics, 10 (1): 92-116.
Griliches, Z. 1998. R&D and Productivity: The Econometric Evidence. Chicago:
University of Chicago Press.
Grünfeld, L.A. 2003. Meet me halfway but don‘t rush: absorptive capacity and
strategic R&D investment revisited. International Journal of Industrial
Organization, 21:1091-1120.
Guasch, J. L. and Weiss, A. 1980. Adverse selection by markets and the advantage
of being late. The Quarterly Journal of Economics, 94(3): 453-466.

152
Hall, B.H., Jaffe, A.B. and Trajtenberg, M. 2001. The NBER Patent Citations Data
File: Lessons, Insights and Methodological Tools. The National Bureau of
Economic Research.Working Paper No. 8498.
Haspeslagh, C. and Jemison, B. 1991. Managing Acquisitions: Creating Value
through Corporate Renewal. New York: The Free Press.
Hatzichronoglou, T. 1997. Revision of the High-tech Sector and Product
Classification. OECD Science, Technology and Industry Working Papers, 1997/02.
OECD Publishing.
Hausman, J.A., Hall, B.H. and Griliches, Z. 1984. Econometric models for count
data with an application to the patents – R&D relationship. Econometrica, 52(4):
909-938.
He, Z.L., Lim, K.H. and Wong, P.K. 2006. Entry and competitive dynamics in the
mobile telecommunications market. Research Policy, 35(8): 1147-1165.
Henderson, R.M. and Cockburn, I. 1994. Measuring competence? Evidence from
the pharmaceutical drug discovery. Strategic Management Journal, 15(S1): 63-84.
Henderson, R.M. and Cockburn, I. 1996. Scale, scope and spillovers: The
determinants of research productivity in drug discovery. The RAND Journal of
Economics, 27(1): 32-59.

153
Henderson, R.M. 2006. The innovator‘s dilemma as a problem of organizational
competence. Journal of Product Innovation Management, 23(1): 5-11.
Hennart, J.F. and Reddy, S. 1997. The choice between mergers/acquisitions and
joint ventures: the case of Japanese investors in the United States. Strategic
Management Journal, 18(1):1-12.
Higgins, M.J. and Rodriguez, D. 2006. The outsourcing of R&D through acquisition
in the pharmaceutical industry. Journal of Financial Economics, 80(2): 351-383.
Hill, C.W.L. 1997. Establishing a standard: competitive strategy and technological
standards in winner-take-all industries. Academy of Management Executive, 11(2):
7-25.
Hitt, M.A., Hoskisson, R.E., Johnson, R.A. and Moesel, D.D. 1996. The market for
corporate control and firm innovation. Academy of Management Journal,
39(5):1084-1119.
Hobday, M. 1995. Innovation in East Asia: The Challenge to Japan. London:
Edward Elgar Publishing.
Hofstede, G. and Bond, M.H. 1988. The Confucius connection: From cultural roots
to economic growth. Organizational Dynamics, 16(4): 5-21.
Hoskisson, R.E., Lorraine, E., Lau, C.M. and Wright, M. 2000. Strategy in
emerging economies. The Academy of Management Journal, 43(3): 249-267.

154
Hüsig, S. and Hipp, C. 2009. The disruptive potential of Wi-Fi in the German
hotspot market. International Journal of Mobile Communications, 7(6): 615-631.
Jaffe, A.B. 1986. Technological opportunity and spillovers of R&D: Evidence from
firm‘s patents, profits, and market value. American Economic Review, 76(5): 984-
1001.
Jarrel, G., Brickley, J. and Netter, J. 1988. The market for corporate control: The
empirical evidence since 1980. Journal of Economic Perspectives, 2(1): 49-68.
Jensen, M. and Ruback, R. 1983. The market for corporate control: The scientific
evidence. Journal of Financial Economics, 11(1-4): 5-50.
Johansson, P. 1995. Tests for serial correlation and overdispersion in a count data
regression model. Journal of Statistical Computation and Simulation, 53(3-4):
153-164.
Johnson, D. 2002. Learning-by-licensing: R&D and technology licensing in
Brazilian invention. Economics of Innovation and New Technology, 11(3): 163-
177.
Katila, R. 2002. New product search over time: Past ideas in their prime? Academy
of Management Journal, 45(5): 995-1010.

155
Katrak, H. 1997. Developing countries‘ imports of technology, in-house
technological capabilities and efforts: An analysis of the Indian experience. Journal
of Development Economics, 53(1): 67-83.
Katz, M. and Shapiro, C. 1994. System competition and network effects. Journal
of Economic Perspectives, 8(2): 93-115.
Keller, A and Hüsig, S. 2009. Ex ante identification of disruptive innovations in the
software industry applied to web applications: The case of Microsoft's vs. Google's
office applications, Technological Forecasting and Social Change, 76(8): 1044-
1054.
Kennedy, P. 1998. A Guide to Econometrics, fourth edition. MA: The MIT Press.
Kim, L.S. 1997. Imitation to Innovation: The Dynamics of Korea’s Technological
Learning. Boston: Harvard Business School Press.
King, D., Dalton, D., Daily, C. and Covin, J. 2004. Meta-analyses of post acquisition
performance indications of unidentified moderators. Strategic Management Journal,
25(2):187-200.
Kitching, J. 1974. Winning and losing with European acquisitions. Harvard
Business Review, 52: 124-136.
Kodama, F. 1995. Emerging Patterns of Innovation. Boston: Harvard Business
School Press.

156
Koenig, M.E.D. and Mezick, E.M. 2004. Impact of mergers and acquisitions on
research productivity within the pharmaceutical industry. Scientometrics, 59(1):
157-169.
Kollmer, H. and Dowlin, M. 2004. Licensing as a commercialization strategy for
new technology-based firms. Research Policy, 33:1141-1151.
Kogut, B. and Zander, U. 1996. What firms do? Coordination, identity, and learning,
Organizational Science, 7(5): 502-518.
Koschatzky, K. 1998. Firm innovation and region: The role of space in innovation
processes. International Journal of Innovation Management, 2(4): 383-408.
Kumar, V., Kumar, U. and Persaud, A. 1999. Building technological capability
through importing technology: The case of Indonesian manufacturing industry.
Journal of Technology Transfer, 24: 81-86.
Lane, P.J., Koka, B.R. and Pathak, S. 2006. The reification of absorptive capacity: A
critical review and rejuvenation of the construct. Academy of Management Review,
31(4): 833-863.
Lane, P.J. and Lubatkin, M. 1998. Relative absorptive capacity and
interorganizational learning. Strategic Management Journal, 19(5): 461-477.
Lamont, O. and Polk, C. 2002. Does diversification destroy value? Evidence from
the industry shocks. Journal of Financial Economics, 63(1): 51-77.

157
Laursen, K., Leone M.I. and Torrisi, S. 2010. Technological exploration through
licensing: New insights from the licensee‘s point of view. Industrial and
Corporate Change, 19(3): 871-897.
Lee, J. 1996. Technology imports and R&D efforts of Korean manufacturing firms.
Journal of Development Economics, 50(1): 197-210.
Lee, K. and Lim, C. 2001. Technology regimes, catching-up and leapfrogging:
Findings from the Korean industries. Research Policy, 30(3): 459-483.
Leland, H. 2007. Financial synergies and the optimal scope o the firm: Implications
for mergers, spinoffs and structured finance. Journal of Finance, 62(2): 765-807.
Leone, M.I., Boccadel, P., Magnusso, M. and Reichstei, T. 2009. Fuel on the
Invention Funnel: Technology Licensing-in, Antecedents and Invention
Performance. Druid Conference (Summer), Denmark.
Lewellen, W. 1971. A pure financial rationale for the conglomerate merger.
Journal of Finance, 26(2): 521-537.
Lieberman, M.B. and Montgomery, D.B. 1998. First-mover (dis)advantages:
Retrospective and link with the resource-based view. Strategic Management
Journal, 19(12):1111-1125.
Link, A., Tassey, G. and Zmud, R.W. 1983. The induce versus purchase decision:
An empirical analysis of industrial R&D. Decision Sciences, 14(1): 46-61.

158
Lippman, S. and Rumelt, R. 1982. Uncertain imitability: An analysis of interfirm
differences in efficiency under competition. Bell Journal of Economics, 13(2): 418-
438.
Liu, W.Q. 2005. Intellectual property protection related to technology in China.
Technological Forecasting and Social Change, 72(3): 339-348.
Liu, Z. 1998. Earnings, education, and economic reforms in urban China.
Economic Development and Cultural Change, 46(4): 697-725.
Long, J.S. 1997. Regression Models for Categorical and Limited Dependent
Variables. Advanced Quantitative Techniques in the Social Sciences Number 7.
Thousand Oaks: Sage Publications.
Lowe, J. and Taylor, P. 1998. R&D and technology purchase through license
agreements: Complementary strategies and complementary assets. R&D
Management, 28(4): 263-278.
Lubatkin, M. 1983. Mergers and the performance of the acquiring firm. Academy of
Management Review, 8(2): 218-225.
Maddala, G.S. 1983. Limited Dependent and Qualitative Variables in
Econometrics. New York: Cambridge University Press.
159
Makri, M., Hitt, M.A. and Lane, P.J. 2010. Complementary technologies, knowledge
relatedness and invention outcomes in high technology mergers and acquisitions.
Strategic Management Journal, 31(6): 602-628.
Mansfield, E., Romeo, A., Schwartz, D., Teece, D., Wander, S. and Brach, P. 1982.
Technology Transfer, Productivity and Economic Policy. New York: W. W. Nor
ton.
March, J.G. 1991. Exploration and exploitation in organizational learning.
Organization Science, 2(1): 71-87.
Marks, M.L. and Mirvis, P.H. 1998. Joining Forces: Making One Plus One
Equal Three in Merger, Acquisition and Alliances. San Francisco: Jossey-Bass.
Mathews, J.A. and Cho, D.S. 1999. Combinative capabilities and organizational
learning by latecomer firms: The case of the Korean semiconductor industry.
Journal of World Business, 34(2): 139-156.
Mathews, J.A. 2002. Competitive advantages of the latecomer firms: A resource-
based account of industrial catch up strategies. Asia Pacific Journal of
Management, 19: 467-488.
Mathews, J.A. 2006. Catch-up strategies and the latecomer effect in industrial
development. New Political Economy, 11(3): 313-335.

160
Matsusaka, J. 1993. Takeover motives during the conglomerate merger wave.
RAND Journal of Economics, 24(3): 357-379.
Mowery, D.C., Oxley, J. and Silverman, B. 1996. Strategic alliances and interfirm
knowledge transfer. Strategic Management Journal, 17: 77-91.
Narula, R. 2006. Globalization, new ecologies, new zoologies and the purported
death of the eclectic paradigm. Asia Pacific Journal of Management, 23(2): 143-
151.
Neelameghan, A. 1992. Information for Small Enterprises. Bangalore: Sarada
Ranganathan Endowment for Library Science.
Nelson, R.R. 1964. Aggregate production functions and medium-range growth
projections. The American Economic Review, 54(5): 575-606.
Nelson, R.R. and Winter, S.G. 1982. An Evolutionary Theory of Economic Change.
MA: Harvard University Press.
Nelson, R. 1995. Recent evolutionary theorizing about economic change. Journal
of Economic Literature, 33(1): 48-90.
Nerkar, A. 2003. Old is gold? The value of temporal exploration in the creation of
new knowledge. Management Science, 49(2): 211-229.

161
Nooteboom, B. 2000. Learning by interaction: Absorptive capacity, cognitive
distance and governance. Journal of Management and Governance, 4(1): 69-92.
Nooteboom, B., Vanhaverbeke, W., Duijsters, G.M., Gilsing, V.A. and van den
Oord, A. 2007. Optimal cognitive distance and absorptive capability. Research
Policy, 36(7): 1016-1034.
Ornaghi, C. 2006. Mergers and Innovation: The Case of the Pharmaceutical
Industry. Southampton, UK, University of Southampton. Discussion Essays in
Economics and Econometrics 0605.
Orozco, D. 2007. Will India and China profit from technological innovation?
Northwestern Journal of Technology and Intellectual Property, 5(3): 426-435.
Pautler, P. 2001. Evidence on Mergers and Acquisitions. Bureau of Economics,
Federal Trade Commission: WP.
Perez, C. and Soete, L. 1988. Catching up in technology: entry barriers and windows
of opportunities. Technical Change and Economic Theory, 458-479.
Pieper, R. 1990. Human Resource Management: An International Comparison.
Berlin: Walter de Gruyter & Co.
Pillai, P.M. 1979. Technology transfer, adaptation and assimilation. Economic and
Political Weekly, 14(47): 121-126.

162
Pitkethly, R.H. 2001. Intellectual property strategy in Japanese and UK companies:
patent licensing decisions and learning opportunities. Research Policy, 30(3): 425-
442.
Phene, A., Fladmoe-Lindquist, F. and Marsh, L. 2006. Breakthrough innovations in
the U.S. biotechnology industry: The effects of technological space and geographic
origin. Strategic Management Journal, 27: 369-388.
Prahalad, C.K. 2004. The Fortune at the Bottom of the Pyramid: Eradicating
Poverty with Profits. Philadelphia: Wharton Business Publishing.
Prahalad, C.K. 2012. Bottom of the pyramid as a source of breakthrough innovations.
Journal of Product Innovation Management, 29(1): 6-12.
Rafii, F. and Kampas, P. 2002. How to identify your enemies before they destroy
you. Harvard Business Review, 80 (11): 115-123.
Ray, S. and Ray, P.K. 2011. Product innovation for the people‘s car in an emerging
economy. Technovation, 31(5-6): 216-227.
Reuters, 2012. http://www.zaobao.com.sg/cninvest/pages5/cninvest_zong120621a.shtml
Ritter, F.E. and Schooler, L.J. 2002. The learning curve. In Smelser, N. J. and
Baltes, P. B, (eds.) International Encyclopedia of the Social and Behavioral
Sciences. Amsterdam: Pergamon, 8602-8605.

163
Roberts, E.B. and Berry, C.A. 1985. Entering new businesses: Selecting strategies
for success. MIT Sloan Management Review, 26.
Rockett, K.E. 1990a. Choosing the competition and patent licensing. The RAND
Journal of Economics, 21(1): 161-171.
Rockett, K.E. 1990b. The quality of licensed technology. International Journal of
Industrial Organization, 8(4): 559-574.
Rosenkopf, L. and Nerkar, A. 2001. Beyond local search: boundary-spanning,
exploration, and impact in the optical disk industry. Strategic Management Journal,
22(4): 287-306.
Rostand, A. 1994. Optimizing Managerial Decisions during the Acquisition
Integration Process. 14th Annual Strategic Management Society International
Conference, Paris.
Rothwell, R. 1994. Towards the fifth-generation innovation process. International
Marketing Review, 11(1): 7-31.
Schoenberg, R. 2000. The influence of cultural compatibility within cross-border
acquisitions: A review. Advances in Mergers and Acquisitions, 1(1): 43-59.
Schoenberg, R. 2006. Measuring the performance of corporate acquisitions: An
empirical comparison of alternative metrics. British Journal of Management, 17(4):
361-370.

164
Schoenecker, T. and Swanson, L. 2002. Indicators of firm technological capability:
Validity and performance implications. Engineering Management, 49(1): 36-44.
Schweiger, D. and Very, P. 2003. Creating value through merger and acquisition
integration. Advances in Mergers and Acquisitions, 2: 1-26.
Sen, F. and Rubenstein, A.H. 1990. An exploration of factors affecting the
integration of in-house R&D with external technological acquisition strategies of a
firm. IEEE Transaction on Engineering Management, 37(4): 246-258.
Seth, A. 1990. Value creation in acquisitions: A re-examination of performance
issues. Strategic Management Journal, 11(2): 99-115.
Sevilir, M. and Tian, X. 2012. Acquiring Innovation. Working Paper, Indiana
University.
Shane, S. 2001. Regimes and new firm formation. Management Science, 47(9):
1173-1190.
Shenkar, O. and Li, J.T. 1999. Knowledge search in international cooperative
ventures. Organization Science, 10(2): 134-143.
Shleifer, A. and Vishny, R. 1991. Takeovers in the 80s and the 90s: Evidence and
implication. Strategic Management Journal, 12: 51-59.

165
Singh, H. and Zollo, M. 1997. Knowledge Accumulation and the Evolution of
Post-acquisition Management Practices. Presented at the Academy Management
Conference, Boston, August 8-13.
Song, M., Bij, H.V.D. and Weggeman, M. 2005. Determinants of level of
knowledge application: A knowledge-based and information-processing perspective.
Journal of Product Innovation Management, 22(5): 430-444.
Sorensen, J. and Stuart, T. 2000. Aging, obsolescence and organizational innovation.
Administrative Science Quarterly, 45(1): 81-112.
Spedale, S. 2003. Technological discontinuities: Is co-operation an option? Long
Range Planning, 36(3): 253-268.
Spender, J. 1989. Industry Recipe: The Nature and Sources of Managerial
Judgement. Oxford: Basil Blackwell.
Stock, G.N., Greis, N.P. and Fischer, W.A. 2001: Absorptive capacity and new
product development. The Journal of High Technology Management Research, 12
(1), 77-91.
Tanaka, H., Iwaisako, T. and Futagami, K. 2007. Dynamic analysis of innovation
and international transfer of technology through licensing. Journal of International
Economics, 73: 189-212.

166
Teece, D.J., Pisano, G. and Shuen, A. 1997. Dynamic capabilities and strategic
management. Strategic Management Journal, 18: 509-533.
Teece, D.J. 1986. Profiting from technological innovation: Implications for
integration, collaboration, licensing and public policy. Research Policy, 15(6): 285-
305.
Teece, D.J. 2000. Firm Capabilities and economic development: Implications for
newly industrializing economies. In Kim, L. and Nelson, R. (eds.), Technology,
Learning and Innovation. Cambridge: Cambridge University Press, 105-128.
Tidd, J., Bessant, J. and Pavitt, K. 2001. Managing Innovation: Integrating
Technological, Market and Organizational Change, second Edition. Chichester:
John Wiley.
Tsai, K.H. and Wang, J.C. 2009. External technology sourcing and innovation
performance in LMT sectors: An analysis based on the Taiwanese technological
innovation survey. Research Policy, 38(5): 518-526.
Tsai, W.P. 2001. Knowledge transfer in intraorganizational networks: Effects of
network position and absorptive capacity on business unit innovation and
performance. Academy of Management Journal, 44(5): 995-1004.

167
Tzeng, C.H. 2008. Developing high-technology latecomer firms to compete
internationally: A three-sector growth model. Journal of International
Management, 14:190-206.
Utterback, J.M. and Acee, H.J. 2005. Disruptive technologies: An expanded view.
International Journal of Innovation Management, 9(1): 1-17.
Vanhaverbeke, W., Beerkens, B. and Duysters, G. 2004. Explorative and
Exploitative Learning Strategies in Technology-based Alliance Networks.
Academy of Management Best Conference Essay, vol. TIM: J1-J6.
Van de Vrande, V., de Jong, J.P.J. Vanhaverbeke, W. and de Rochemont, M. 2009a.
Open innovation in SMEs: Trends, motives and management challenges.
Technovation, 29: 423-437.
Van de Vrande, V., Vanhaverbeke, W. and Duysters, G. 2009b. External technology
sourcing: The effect of uncertainty on governance mode choice. Journal of
Business Venturing, 24(1): 62-80.
Villalonga, B. 2004. Does diversification cause the ‗diversification discount‘?
Financial Management, 33(2): 5-27.
von Hippel, E. 1988. The Sources of Innovation. New York: Oxford University
Press.

168
Wagner, R.P. 2003. Information wants to be free: Intellectual property and the
mythologies of control. Columbia Law Review, 103: 995-1034.
Wang, Y., Roijakkers, N. and Vanhaverbeke, W. 2013. Learning-by-licensing:
How Chinese firms benefit from licensing-in technologies. IEEE Transactions on
Engineering Management, 60(1): 46-58.
Watanabe C. and Asgari, B. 2004. Impacts of functionality development on
the dynamism between learning and diffusion of technology. Technovation, 24(8):
651-664.
Watanabe, C., Zhu, B., Criffy-Brown, C. and Asgari, B. 2001. Global technology
spillover and its impact on industry‘s R&D strategies. Technovation, 21(5): 281-
291.
Weick, K.E. 1979. The Social Psychology of Organizing, 2nd edition. MA:
Addison-Wesley.
WIPO, 2011. http://www.wipo.int/ipstats/en/statistics/patents/
Winiecki, J. 1987. Soviet-type economies‘ strategy for catching up through
technology imports- an anatomy of failure. Technovation, 6(2): 115-145.
Willmore, L. 1991. Technological imports and technological efforts: An analysis of
the determinants in Brazilian firms. The Journal of Industrial Economics, 39(4):
421-432.

169
World Bank, 2007. http://search.worldbank.org/data?qterm=licensing&language=EN
Wu, X.B., Ma, R.F. and Shi, Y.J. 2010. How do latecomer firms capture value from
disruptive technologies? A secondary business-model innovation perspective. IEEE
Transactions on Engineering Management, 57(1): 51-61.
Xie, W. and Wu, G.S. 2003. Differences between learning processes in small tigers
and large dragons: Learning processes of two color TV (CTV) firms within China.
Research Policy, 32(8): 1463-1479.
Yu, D. and Hang, C.C. 2010. A reflective review of disruptive innovation theory.
International Journal of Management Reviews, 12(4): 435-452.
Yu, D. and Hang, C.C. 2011. Creating technology candidates for disruptive
innovation: Generally applicable R&D strategies. Technovation, 31(8): 401-410.
Zahra, S.A. and George, G. 2002. Absorptive capacity: A review,
reconceptualization and extension. Academy of Management Review, 27(2): 185-
203.
Ziedonis, A. 2007. Real options in technology licensing. Management Science,
53(10): 1618-1633.

170
PUBLICATIONS
(Relevant to the contents in the thesis)
1. Zhao, Y.Y., Wong, P.K., Subramanian, A. and Hang, C.C. 2011. New insight
into technology licensing strategy and innovation performance: The evidence on
Chinese latecomers in high-tech industries. The IEEE international conference on
Industrial Engineering and Engineering Management, Dec. 2011, Singapore. (The
journal version is under preparation for submission to Technovation.)
2. Zhao, Y.Y., Wong, P.K. and Hang, C.C. 2012. Mergers and acquisitions for
latecomers in emerging economies: The substitution effect on innovation
performance. Strategic Management Society conference, Dec. 2012, China. (The
journal version is under preparation for submission to Strategic Management
Journal.)
3. Zhao, Y.Y., Hang, C.C., Vanhaverbeke, W. and Subramanian, A. 2012.
Combining disruptive innovation and open innovation: Evidence based on case
studies of Chinese latecomers. Portland International Center for Management of
Engineering and Technology conference, Jul. 2012, Vancouver. (The journal version
has been submitted to Technological Forecasting and Social Change Journal and the
current status is R&R.)