Innovation, Skill, and Economic...
28
Innovation, Skill, and Economic Segregation Prepared by: Richard Florida, University of Toronto Charlotta Mellander,* Jönköping International Business School Working Paper Series Martin Prosperity Research *Corresponding author
Transcript of Innovation, Skill, and Economic...
Innovation, Skill, and Economic Segregation
Prepared by: Richard Florida, University of Toronto
Charlotta Mellander,* Jönköping International Business School
Working Paper Series
Martin Prosperity Research
*Corresponding author

Florida is University Professor and Director of Cities at the Martin Prosperity Institute in the Rotman School of Management, University of Toronto, ([email protected]). Mellander is professor of economics, Jönköping International Business School, Jönköping University ([email protected]).
Acknowledgements: We thank Deborah Strumsky for providing her patent and inventor data Karen King for help with various aspects of this research; and the Martin Prosperity Institute for research support.
MPI Working Paper Series: The Geography of the Global Super Rich (Florida & Mellander) 1
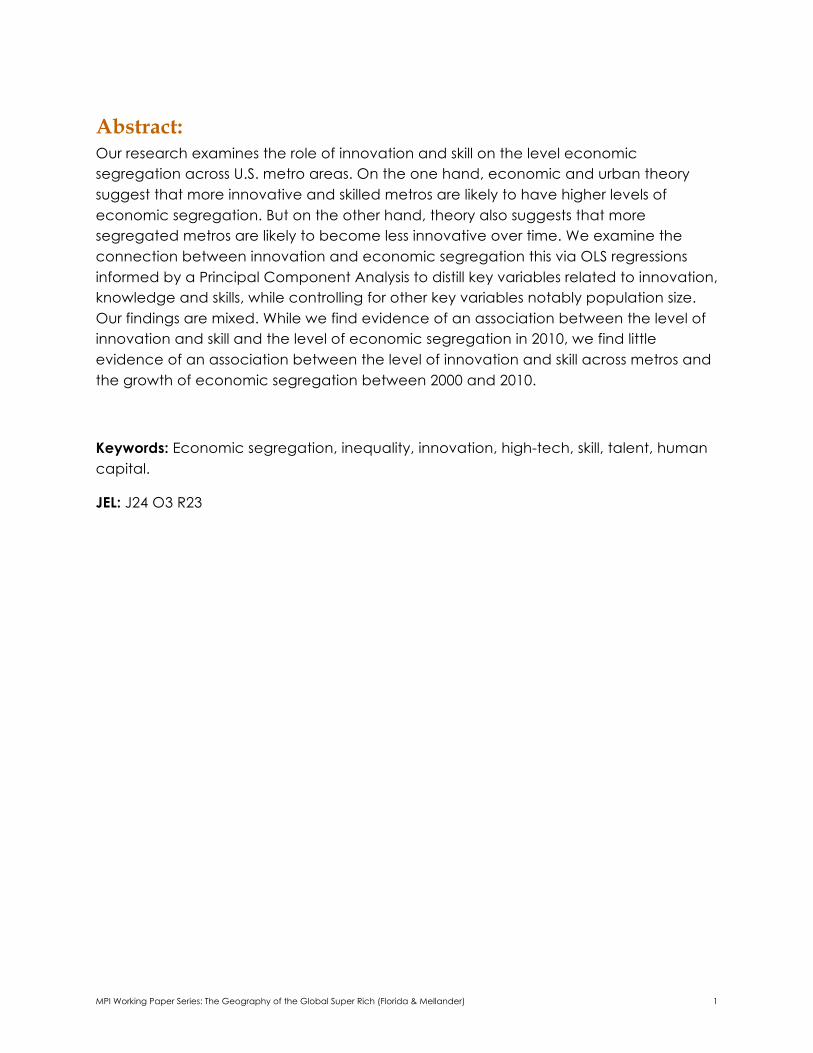
Abstract: Our research examines the role of innovation and skill on the level economic segregation across U.S. metro areas. On the one hand, economic and urban theory suggest that more innovative and skilled metros are likely to have higher levels of economic segregation. But on the other hand, theory also suggests that more segregated metros are likely to become less innovative over time. We examine the connection between innovation and economic segregation this via OLS regressions informed by a Principal Component Analysis to distill key variables related to innovation, knowledge and skills, while controlling for other key variables notably population size. Our findings are mixed. While we find evidence of an association between the level of innovation and skill and the level of economic segregation in 2010, we find little evidence of an association between the level of innovation and skill across metros and the growth of economic segregation between 2000 and 2010.
Keywords: Economic segregation, inequality, innovation, high-tech, skill, talent, human capital.
JEL: J24 O3 R23
MPI Working Paper Series: The Geography of the Global Super Rich (Florida & Mellander) 2
Introduction One of the biggest issues of the past decade or so is that people and places has been the growing divides of people and place by income and other socio-economic factors. A large body of research has documented the growth in inequality and the rising gap between rich and poor (Piketty, 2014), the growing divide or so-called Great Divergence between places (Glaeser et al., 2009; Bishop, 2012; Hsieh and Moretti, 2015; Ganong and Shoag, 2015; Giannone, 2017); the decline of the middle class and of middle-class (Taylor and Fry, 2012; Hulchanski, 2009); and the growing economic segregation within places (Sampson, 2012; Sharkey, 2013; Watson et al., 2006; Reardon and Bischoff, 2011). Recent studies have examined the connections between metro size and inequality (Baum and Snow, 2013) on the one hand and the innovativeness of places compared to their inequality (Aghion et al., 2015).
This paper examines the connection innovation and skill and economic segregation. On the one hand, there are good reasons informed by economic and urban theory to believe that more innovative metros will be more economically segregated. More innovative metros will by definition have greater concentrations of high-tech industries and occupations. These industries will be populated by more skilled and affluent talent (Morretti, 2012). The more affluent and skilled groups will use their resources to self-segregate into areas with better access to employment and to transit and which offer better schools, better amenities and better services (Glaeser et al., 2001; Edlund et al. 2015; Diamond, 2016). The demand for housing by these more advantaged will in turn bid up the cost of housing in these areas. But, these high-tech industries and higher skill talent will in turn attract lower-skill, lower-wage routine support and service industries who, as a result of the higher housing prices in these metros, will segregate into less expensive, less well-served, less connected and less-advantaged neighborhoods in these metros.
On the other hand, there are reasons to expect that more economically segregated metros may be less innovative. Economic and urban theory draws a connection between diversity—especially the density of diversity—and innovation (Jacobs, 1969, 1984; Florida, 2002; Glaeser, 2011). Denser, more diverse places attract a wider range of talent. But, economic segregation by definition separates groups into separate neighborhoods and sections of the city, reducing their ability to interact and combine to generate innovative ideas and innovative companies.
We use both OLS regression and Principal Component Analysis to examine the effects of more innovative and skilled metros on the level and change in economic segregation, while controlling for other factors such as population size and income. We measure innovation based on the location of patented innovations and inventors and measure skill in terms of education and occupation. We introduce a new measure of economic segregation based on income, education and occupation. We look at the
MPI Working Paper Series: The Geography of the Global Super Rich (Florida & Mellander) 3
role of innovation and skill on both the level of economic segregation and its growth over decade spanning 2000–2010.
Our findings with regard to the connection between more innovative and skilled metros and economic segregation are mixed. On the one hand, we find evidence of an association between the level of innovation and skill and the level of economic segregation in 2010, although the evidence is stronger for our measures of skill than it is for the measures of innovation per se. On the other hand, we find little evidence of an association between the level of innovation and skill across metros and the growth of economic segregation between 2000 and 2010. Generally speaking, we find that even though more highly innovative and skilled metros can be said to have higher levels of economic segregation, they have not seen significant growth in it over the past decade.
The rest of this paper proceeds as follows. The next section outlines the key theories and concepts that inform our analysis from the broad literatures on urban economics of clustering, agglomeration, the Great Divergence, inequality and the back to the city movement and the urban sociology literature on economic segregation and spatial inequality. After that, we outline our variables and data and then describe our methodology specifically our use of regression analysis informed by a Principal Component Analysis. We then summarize the key findings that flow from these analyses. The concluding section sums up the main takeaways from our research.
Concepts and Theory A wide body of research in economics, sociology and urban studies has documented the growing economic divides between classes and across and within places. One stream of research has focused on the rise in inequality within and across nations (Atkinson, 1975, 2015; Piketty, 2014). Piketty (2014) documents the rise in inequality across nations and argues that it is a function of a basic law of capitalism where the rate of return to capital outpaces the rate of economic growth (r>g). A large body of studies suggest that inequality is a function of skill-biased technical change (Autor et al., 1998, 2003, 2006; Acemoglu, 1998), brought on by globalization, the deindustrialization of once high-paying manufacturing jobs and the splitting of the labor market it into a smaller cluster of high-paying, high skill knowledge jobs and a much larger share of low-paying, low-skill routine service jobs in fields like food service, clerical and administrative work, retail shops and personal care.
Economic divides are not only growing between classes so to speak, but across places. Within urban economics, a growing number of studies have documented the growing gap or Great Divergence between more or less successful places (Glaeser et al., 2009; Moretti, 2012), largely a result of the geographic clustering of high-skill high wage industries and jobs. Other research has noted the clustering of more educated and
MPI Working Paper Series: The Geography of the Global Super Rich (Florida & Mellander) 4
skilled people in locations that are both more productive and have access to better jobs and career networks but which offer higher levels of amenities (Bishop, 2009; Albouy and Stuart, 2014; Albouy, 2016).
Economic inequality across metros has been found to be closely linked to their population size (Baum-Snow and Pavan, 2013; Baum-Snow et al., 2014). Other research finds inequality across metros to varies by type, with wage inequality is a function of globalization and, skill-biased technical change, while income inequality is more closely related to poverty and racial disadvantage as weakening of unions and the erosion of social welfare programs (Florida and Mellander, 2014). Other research has found that higher levels of urban inequality are associated with lower rates of growth, after controlling for factors like education and skill levels which tend to drive growth across metros (Glaeser et al., 2009). More unequal metros also experienced significantly shorter spells of growth (Benner and Pastor, 2015)
Geographic divides not only exist across places but within them. A separate line of research spanning economics and sociology has identified the growing inequality that exists within as well as across cities and metro areas. Income segregation grew in all but three of the nation’s 30 largest metros between 1980 and 2010 (Taylor and Fry, 2012). Another study found that roughly 85 percent of the residents of America’s metro areas lived in neighborhoods that were more economically segregated in year 2000 than they were in 1970 (Watson, 2009). Economic segregation has also been found to have a negative effect on upward socio-economic mobility (Chetty et al., 2014).
Concomitant to this increase in economic segregation has been the general decline of middle class neighborhoods and the bifurcation of American cities and metros into small areas of concentrated affluence and much larger areas of concentrated disadvantage. The share of American families living in middle class neighborhoods fell from nearly two-thirds (65 percent) in 1970 to 40 percent in 2012 (Bischoff and Reardon, 2016). Between 1970 and 2012, the share of American families living in either all-poor or all-affluent neighborhoods more than doubled, increasing from roughly 15 percent to nearly 34 percent. The middle class share of the population shrunk 203 of 229 US metros between 2000 and 2014; 172 of 229 metros saw growth in affluent, upper-income households in the past decade and a half; 160 saw an increase in the share of low-income households; and roughly half, 108, experienced both, over the same period (Kochhar et al., 2016). Indeed, a broad literature in urban sociology documents the role of neighborhood effects in the persistence of poverty (Wilson, 2012; Sampson, 2012; Sharkey, 2013).
The past decade of so has also seen an acceleration in gentrification of urban centers and the back-to-the-city movement of affluent and educated households (Baum-Snow and Hartley, 2016). Several factors have driven more affluent, educated whites back to the urban core. One is access to the large concentration of the higher-paying
MPI Working Paper Series: The Geography of the Global Super Rich (Florida & Mellander) 5
knowledge, professional, tech, and creative jobs that are located there. Another is the growing tendency for the affluent to want to locate in closer proximity to work to avoid long commutes (Edlund et al., 2015). But the most important factor driving the back-to-the-city movement of affluent, educated whites appears to be access to the amenities cities offer—from libraries and museums to restaurants and cafés. As such gentrification has occurred lower-income, less educated racial minorities have moved out—or been pushed out—of these areas, mainly as a result of rising housing prices (Baum-Snow and Hartley, 2016).
While racial segregation has declined (Glaeser and Vigdor, 2012), race continues to intersect with both income inequality and economic segregation. Cities and metro areas are splitting into areas of racially-concentrated poverty and racially-concentrated affluence (Goetz et al., 2015). The economic penalty for growing up in conditions of racially-concentrated poverty is considerable. Rothwell and Massey (2014) found the difference in lifetime earnings between those raised in the richest 20 percent of neighborhoods versus those who grow up in the bottom 20 percent is about the same as the difference between just completing high school and having a college degree. The study finds that the lower rates of economic mobility among lacks is explained by “their disproportionate segregation” in disadvantaged neighborhoods.
If the back-to-the-city movement has been propelled by affluent and educated whites, urban poverty remains disproportionately concentrated in disadvantaged black neighborhoods (Wilson, 2012; Sampson, 2012; Sharkey, 2013). Hwang and Sampson (2014) found that the Chicago neighborhoods that saw most economic improvement over the past two decades were White and those with the least were Black. The neighborhoods that gentrified were those that were at least 35 percent White and no more than 40 percent Black. Neighborhoods with more than 40 percent Black residents saw little economic improvement and tended to stay poor.
There are reasons to believe that that the clustering of innovation and skills are bound up with the growth in urban inequality and economic segregation. For one, cities and urban areas have become increasingly preferred locations for high- tech companies’ startup and largely because of the increased locational preference of highly skilled tech workers for such locations (Florida and Mellander, 2016). Aghion et al., (2015) examined the connection between innovation and inequality across states and found a reasonably strong connection between innovation and the increase in the share of income going to the top one percent, but little evidence of a connection between innovation and broader income inequality based on the standard measure of the Gini coefficient. Indeed, it found that states with higher levels of innovation had higher rates of economic mobility as well.
MPI Working Paper Series: The Geography of the Global Super Rich (Florida & Mellander) 6
In light of these broad concepts and theory, our research takes a focused look at the connection between innovation, skills and economic segregation across metros. As noted above, it is framed around the basic hypothesis that economic segregation is related to the level of innovation and skill across metros. The logic behind this hypothesis, informed by this literature and theory, is that as metros attract knowledge-based industries and more highly-skilled talent that talent will self-segregate into areas with better access, better services and better amenities separate and apart from less-skilled and less-affluent groups. We now turn to the variables and data we employ to test that hypothesis.
Variables and Data We use a series of analytic techniques to examine the relationship of segregation on one hand, and innovation, high tech and skill on the other. We first summarize the variables and data used in our analysis, including the dependent variables for economic segregation and the independent and control variables.
Dependent Variables Economic Segregation: We employ a variety of measures of economic segregation based on income, education and occupation. These variables are based on Census tract level data the years 2000 and 2010 and cover approximately 90,000 tracts in 350 plus metropolitan regions. They are based on an Index of Dissimilarity (Massey and Denton, 1988). More formally, the Dissimilarity Index is expressed as:
𝐷 =12
𝑥&𝑋 −
𝑦&𝑌
+
&,-
where xi is the number of individuals in a selected group in tract I, X is the number of the selected group in the metropolitan area, yi is the number of “others” in the Census tract, and / is the corresponding number in the metropolitan area. N is the number of Census tracts in the metropolitan area and D gives a value of to what extent our selected group of individuals is differently distributed across Census tracts within the metropolitan area. 0 denotes minimum spatial segregation and 1 the maximum segregation.
The individual measures of segregation span income, educational and occupational segregation and include an index of overcall economic segregation. All based on Census tract level data for the years 2000 and 2010. They are as follows:
Segregation of the Poor: This variable measures the segregation of households below the poverty level. It is calculated based on the federally defined poverty level.
MPI Working Paper Series: The Geography of the Global Super Rich (Florida & Mellander) 7
Segregation of the Wealthy: This variable measures the segregation of wealthy households, those with incomes of $200,000 or higher for both year 2000 and 2010. This is the highest income group reported by tract by the Census in those years.
Income Segregation: This is a combined measure based on the above, with the variables for segregation of the poor and segregation of the wealthy equally weighted.
Segregation of the Less Educated (Less than High School Grads): This measures the segregation of adults with less than a high school degree.
Segregation of College Grads: This measures the segregation of adults with a Bachelor’s degree or higher.
Educational Segregation: This is a combined measure based on the above, with the variables for segregation of the less educated and segregation of college grads equally weighted.
Knowledge/Professional/Creative Class Segregation: This measures the segregation of knowledge, professional, arts and creative occupations.
Service Class Segregation: The definition of the service class is defined as service occupations and sales and office occupations in both year 2000 and 2010. This measures the segregation of individuals in the low-skilled, often low paid, service class jobs.
Working Class Segregation: The working class includes occupations in production, construction, extraction and maintenance, transportation and material moving.
Occupational Segregation: This is a combined measure based on the above, with the variables for segregation of the creative, service and working classes equally weighted. The occupational categories reported for at the tract level have varied over time.
Overall Economic Segregation: This variable combines the income, educational and occupational segregation indices (equally weighted) into an average segregation for the three.
Independent Variables We employ a range of metro level independent variables in our analysis. The first five variables capture innovation and high-tech industry and skills which are related to our key hypotheses.
MPI Working Paper Series: The Geography of the Global Super Rich (Florida & Mellander) 8
Patents per Capita: This variable is based on patents per 100,000 inhabitants and is from the US Patent and Trademark Office (USPTO).1
Inventors per Capita: This is defined as the total number of inventors based on patent data, divided by metro population or per 100,000 inhabitants. The data comes from the USPTO.
High Tech: This measure is based on the Tech Pole Index (De Vol et al., 1999) which includes: metro high-technology industrial output as a percentage of total US high-technology industrial output and the percentage of metro’s total economic output from high-tech industries compared to the national share.
We also employ two variables to capture skill, human capital or talent, one based on education and one based on occupation.
Education: We employ the standard measure for educational attainment or human capital based on the share of adults with a bachelor’s degree or more. These data are from the American Community Survey (ACS) for 2000 and 2010
Knowledge/Professional/Creative Class: This variable is based on the share of the labor force in knowledge, professional and creative occupations: creative occupations: computer and math; architecture and engineering; life and physical science; management; business and financial specialists; arts, design, media and entertainment; education; law; and healthcare. It is from the US Bureau of Labor Statistics Occupational and Employment Statistics for 2000 and 2010.
We also employ a number of other independent variables to control for other factors which may affect the level and change in economic segregation. All independent variables are logged in the analysis.
Service Class: This variable is based on the share of the labor force in service class occupations: health-care support; food preparation and food-service; building and grounds cleaning; personal care and service; low-end sales; office and administrative support; community and social services; and protective services. It is from the US Bureau of Labor Statistics Occupational and Employment Statistics for 2000 and 2010.
Population: We include a variable for population size from the ACS.
Income: This is measured as income per capita from the ACS.
Income Inequality: This is measured by the conventional measure of the Gini coefficient. This variable captures the distribution of incomes from the bottom to the
1 We thank Dr. Deborah Strumsky for sharing data on Inventors and Patents. A more detailed description of the patent and inventor variables is available upon request.
MPI Working Paper Series: The Geography of the Global Super Rich (Florida & Mellander) 9
top. Since the Census does not publish figures for income levels above $100,000 for metro areas, we are unable to calculate the Gini coefficient, but have to rely on the Gini coefficients provided by the Census for the years 2006 and 2010 as Gini coefficients for metros are not available for prior years. These Gini Coefficients appear to be somewhat consistent over time, with a correlation coefficient 0.730 for 2006 and 2012.
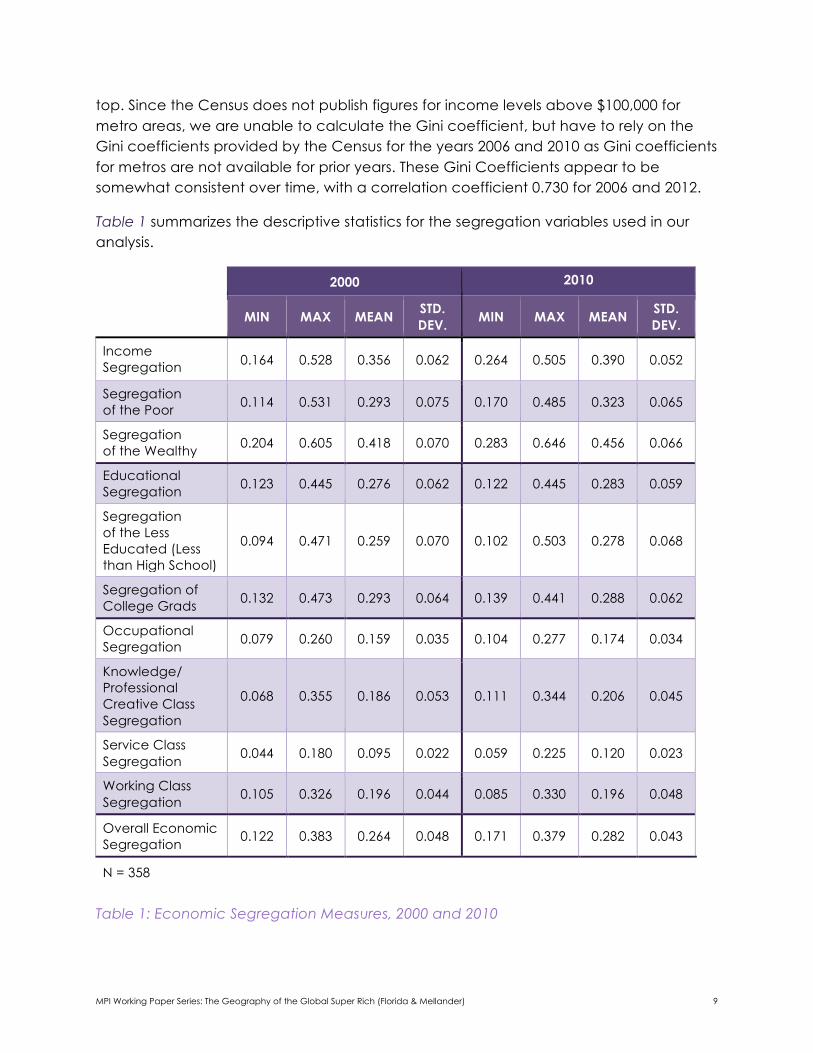
Table 1 summarizes the descriptive statistics for the segregation variables used in our analysis.
2000 2010
MIN MAX MEAN STD. DEV. MIN MAX MEAN STD.
DEV.
Income Segregation 0.164 0.528 0.356 0.062 0.264 0.505 0.390 0.052
Segregation of the Poor 0.114 0.531 0.293 0.075 0.170 0.485 0.323 0.065
Segregation of the Wealthy 0.204 0.605 0.418 0.070 0.283 0.646 0.456 0.066
Educational Segregation 0.123 0.445 0.276 0.062 0.122 0.445 0.283 0.059
Segregation of the Less Educated (Less than High School)
0.094 0.471 0.259 0.070 0.102 0.503 0.278 0.068
Segregation of College Grads 0.132 0.473 0.293 0.064 0.139 0.441 0.288 0.062
Occupational Segregation 0.079 0.260 0.159 0.035 0.104 0.277 0.174 0.034
Knowledge/ Professional Creative Class Segregation
0.068 0.355 0.186 0.053 0.111 0.344 0.206 0.045
Service Class Segregation 0.044 0.180 0.095 0.022 0.059 0.225 0.120 0.023
Working Class Segregation 0.105 0.326 0.196 0.044 0.085 0.330 0.196 0.048
Overall Economic Segregation 0.122 0.383 0.264 0.048 0.171 0.379 0.282 0.043
N = 358
Table 1: Economic Segregation Measures, 2000 and 2010
MPI Working Paper Series: The Geography of the Global Super Rich (Florida & Mellander) 10
Income segregation increased modestly between 2000 and 2010, from an average value of 0.356 across metros in 2000 to 0.390 in 2010. This increase appears to be driven by the bottom part of the distribution since the maximum value did not increase much over this decade while the minimum value went from 0.114 in 2000 to 0.170 in 2010. This suggests that the most segregated metro in year 2000 was not that much more segregated a decade later. However, it appears that the least segregated metro was significantly more segregated in 2010 than in 2000. The trend is similar for both segregation of the poor and segregation of the wealthy, where there have been increases at the bottom of the distribution. The average value for segregation of the poor increased from 0.114 in 2000 to 0.170 in 2010. Similarly, the average value for segregation of the wealthy increased from 0.204 in 2000 to 0.264 in 2010. The pattern is somewhat different at the top of the distribution. The average value for the segregation of poverty declined from 0.531 in 2000 to 0.485 in 2010. However, the pattern for segregation of the wealthy is the opposite, where the average value increased from 0.605 in 2000 to 0.646 in 2010.
We also see a modest increase in educational segregation over the decade spanning 2000–2010. Educational segregation overall increased from 0.276 in 2000 to 0.283 in 2010. This increase appears to be driven mainly by the rise in the segregation of less educated which increased from 0.259 in 2000 to 0.278 in 2010. The segregation of college grads declined marginally over this decade.
Occupational segregation also increased slightly from 0.159 in 2000 to 0.174 in 2010. Of the three types of occupational segregation, working class segregation on average remained at the same, while both creative class and service class segregation increased modestly over time.
Our combined measure of Overall Economic Segregation increased modestly from 0.264 in 2000 to 0.282 in 2010. The difference here appears to stem from the bottom the distribution. In the year 2000, the lowest segregation score for any metro was 0.122, and ten years later this value increased to 0.171. There was virtually no change at the top of the distribution, where the values were 0.383 in 2000 and 0.379 in 2010.
From the above, it appears that economic segregation across metros is more a function of the segregation of more advantaged groups. College graduates are more highly segregated than less educated groups. The knowledge/professional/creative class is more segregated than the service or working classes. And the wealthy are the most segregated of any group by far with a mean segregation value of 0.456. Put another way, almost half of the wealthy households in this group would need to move to another tract where they are not in majority, to even out their distribution and make it more similar to the rest of the population.
MPI Working Paper Series: The Geography of the Global Super Rich (Florida & Mellander) 11
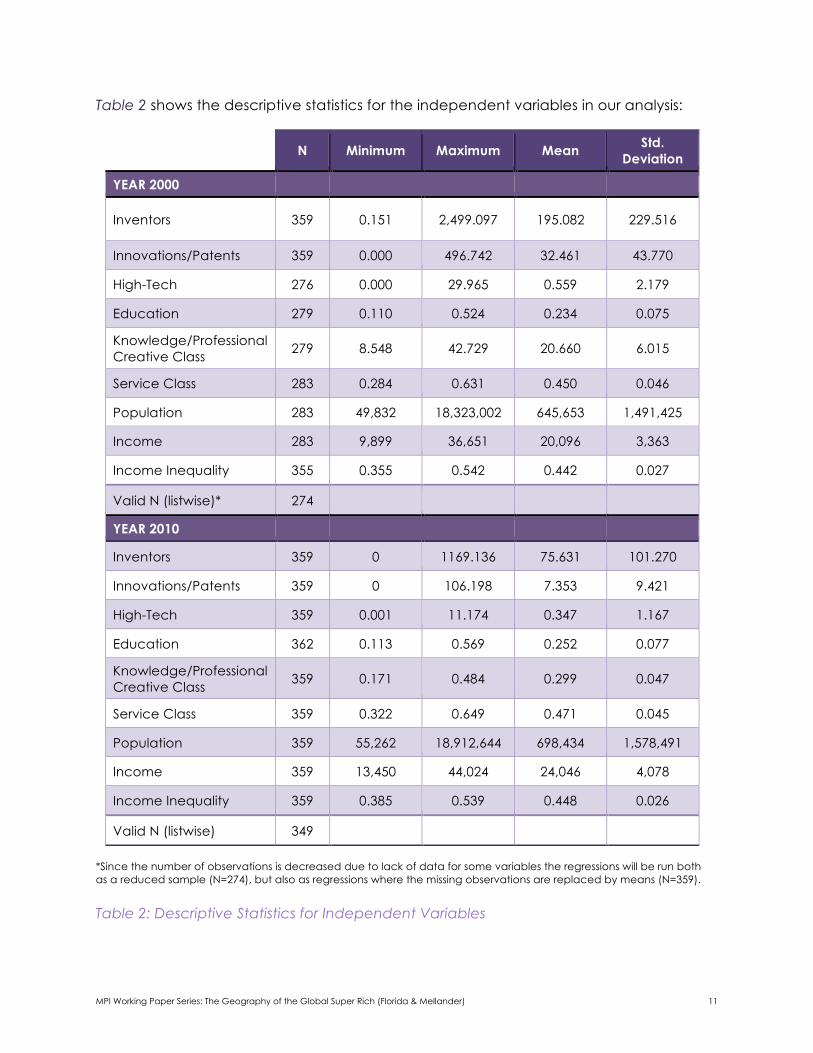
Table 2 shows the descriptive statistics for the independent variables in our analysis:
*Since the number of observations is decreased due to lack of data for some variables the regressions will be run both as a reduced sample (N=274), but also as regressions where the missing observations are replaced by means (N=359). Table 2: Descriptive Statistics for Independent Variables
N Minimum Maximum Mean Std. Deviation
YEAR 2000
Inventors 359 0.151 2,499.097 195.082 229.516
Innovations/Patents 359 0.000 496.742 32.461 43.770
High-Tech 276 0.000 29.965 0.559 2.179
Education 279 0.110 0.524 0.234 0.075
Knowledge/Professional Creative Class 279 8.548 42.729 20.660 6.015
Service Class 283 0.284 0.631 0.450 0.046
Population 283 49,832 18,323,002 645,653 1,491,425
Income 283 9,899 36,651 20,096 3,363
Income Inequality 355 0.355 0.542 0.442 0.027
Valid N (listwise)* 274
YEAR 2010
Inventors 359 0 1169.136 75.631 101.270
Innovations/Patents 359 0 106.198 7.353 9.421
High-Tech 359 0.001 11.174 0.347 1.167
Education 362 0.113 0.569 0.252 0.077
Knowledge/Professional Creative Class 359 0.171 0.484 0.299 0.047
Service Class 359 0.322 0.649 0.471 0.045
Population 359 55,262 18,912,644 698,434 1,578,491
Income 359 13,450 44,024 24,046 4,078
Income Inequality 359 0.385 0.539 0.448 0.026
Valid N (listwise) 349
MPI Working Paper Series: The Geography of the Global Super Rich (Florida & Mellander) 12
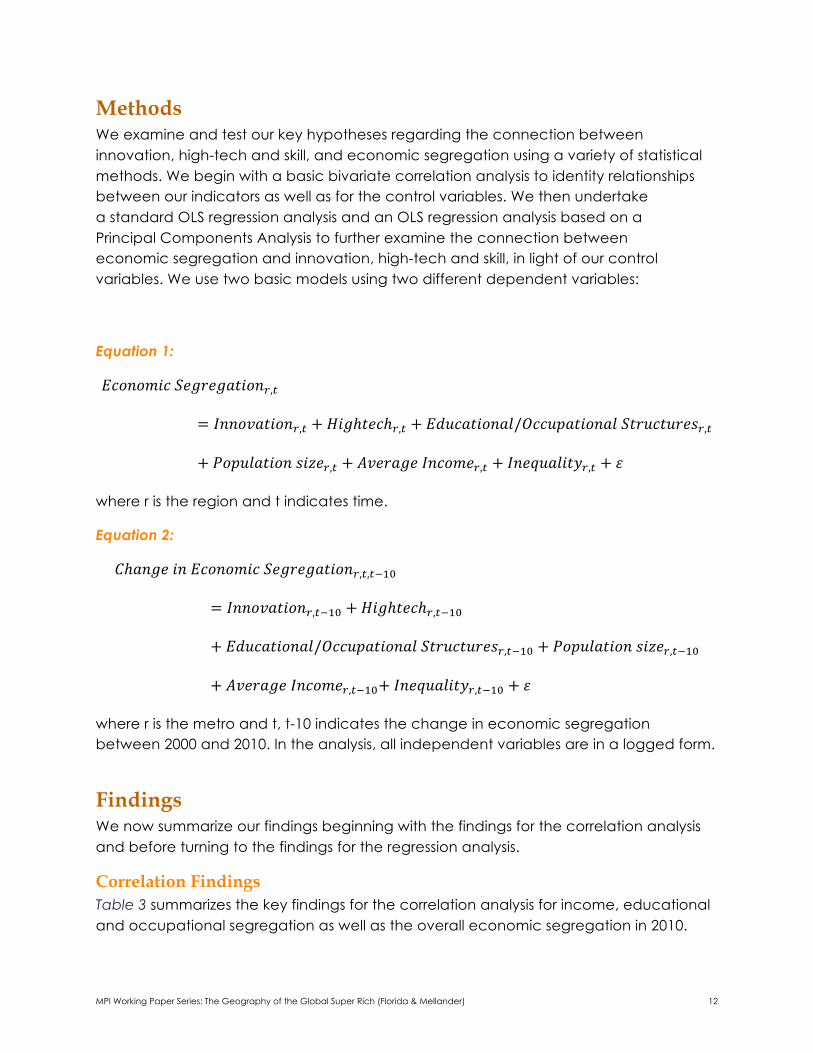
Methods We examine and test our key hypotheses regarding the connection between innovation, high-tech and skill, and economic segregation using a variety of statistical methods. We begin with a basic bivariate correlation analysis to identity relationships between our indicators as well as for the control variables. We then undertake a standard OLS regression analysis and an OLS regression analysis based on a Principal Components Analysis to further examine the connection between economic segregation and innovation, high-tech and skill, in light of our control variables. We use two basic models using two different dependent variables:
Equation 1:
𝐸𝑐𝑜𝑛𝑜𝑚𝑖𝑐𝑆𝑒𝑔𝑟𝑒𝑔𝑎𝑡𝑖𝑜𝑛;,=
= 𝐼𝑛𝑛𝑜𝑣𝑎𝑡𝑖𝑜𝑛;,= + 𝐻𝑖𝑔ℎ𝑡𝑒𝑐ℎ;,= + 𝐸𝑑𝑢𝑐𝑎𝑡𝑖𝑜𝑛𝑎𝑙/𝑂𝑐𝑐𝑢𝑝𝑎𝑡𝑖𝑜𝑛𝑎𝑙𝑆𝑡𝑟𝑢𝑐𝑡𝑢𝑟𝑒𝑠;,=
+ 𝑃𝑜𝑝𝑢𝑙𝑎𝑡𝑖𝑜𝑛𝑠𝑖𝑧𝑒;,= + 𝐴𝑣𝑒𝑟𝑎𝑔𝑒𝐼𝑛𝑐𝑜𝑚𝑒;,= + 𝐼𝑛𝑒𝑞𝑢𝑎𝑙𝑖𝑡𝑦;,= + 𝜀
where r is the region and t indicates time.
Equation 2:
𝐶ℎ𝑎𝑛𝑔𝑒𝑖𝑛𝐸𝑐𝑜𝑛𝑜𝑚𝑖𝑐𝑆𝑒𝑔𝑟𝑒𝑔𝑎𝑡𝑖𝑜𝑛;,=,=P-Q
= 𝐼𝑛𝑛𝑜𝑣𝑎𝑡𝑖𝑜𝑛;,=P-Q + 𝐻𝑖𝑔ℎ𝑡𝑒𝑐ℎ;,=P-Q
+ 𝐸𝑑𝑢𝑐𝑎𝑡𝑖𝑜𝑛𝑎𝑙/𝑂𝑐𝑐𝑢𝑝𝑎𝑡𝑖𝑜𝑛𝑎𝑙𝑆𝑡𝑟𝑢𝑐𝑡𝑢𝑟𝑒𝑠;,=P-Q + 𝑃𝑜𝑝𝑢𝑙𝑎𝑡𝑖𝑜𝑛𝑠𝑖𝑧𝑒;,=P-Q
+ 𝐴𝑣𝑒𝑟𝑎𝑔𝑒𝐼𝑛𝑐𝑜𝑚𝑒;,=P-Q+𝐼𝑛𝑒𝑞𝑢𝑎𝑙𝑖𝑡𝑦;,=P-Q + 𝜀
where r is the metro and t, t-10 indicates the change in economic segregation between 2000 and 2010. In the analysis, all independent variables are in a logged form.
Findings We now summarize our findings beginning with the findings for the correlation analysis and before turning to the findings for the regression analysis.
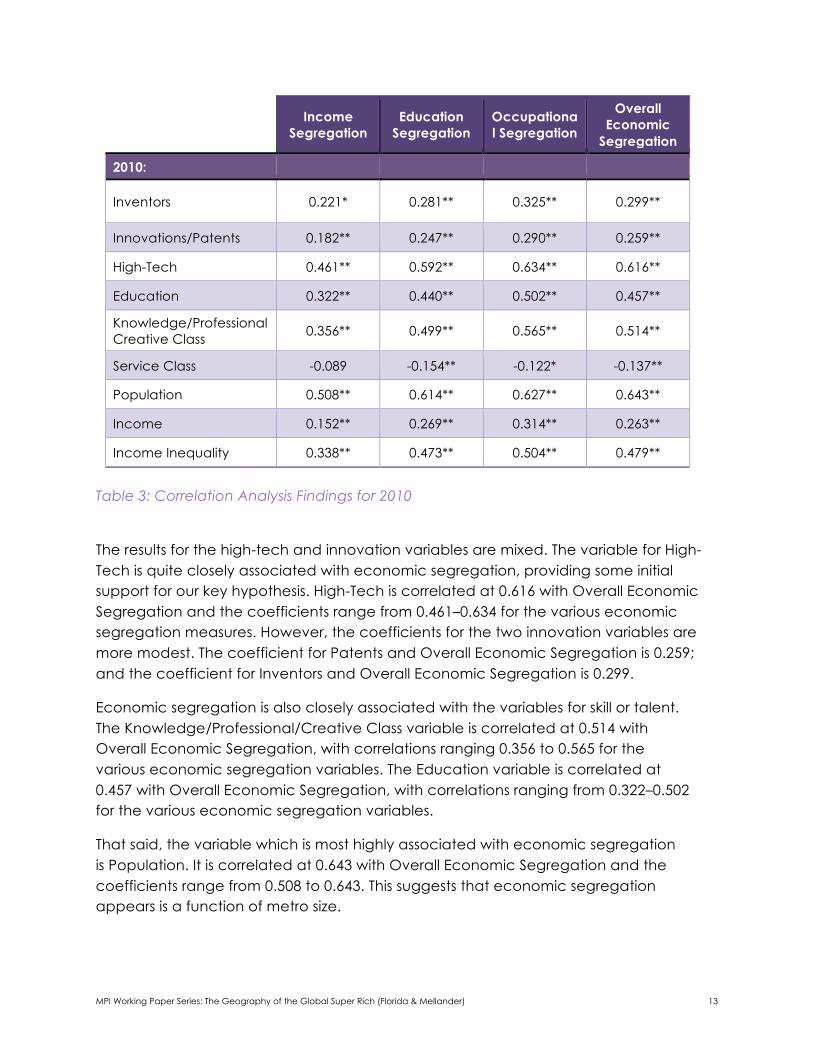
Correlation Findings Table 3 summarizes the key findings for the correlation analysis for income, educational and occupational segregation as well as the overall economic segregation in 2010.
MPI Working Paper Series: The Geography of the Global Super Rich (Florida & Mellander) 13
Table 3: Correlation Analysis Findings for 2010
The results for the high-tech and innovation variables are mixed. The variable for High-Tech is quite closely associated with economic segregation, providing some initial support for our key hypothesis. High-Tech is correlated at 0.616 with Overall Economic Segregation and the coefficients range from 0.461–0.634 for the various economic segregation measures. However, the coefficients for the two innovation variables are more modest. The coefficient for Patents and Overall Economic Segregation is 0.259; and the coefficient for Inventors and Overall Economic Segregation is 0.299.
Economic segregation is also closely associated with the variables for skill or talent. The Knowledge/Professional/Creative Class variable is correlated at 0.514 with Overall Economic Segregation, with correlations ranging 0.356 to 0.565 for the various economic segregation variables. The Education variable is correlated at 0.457 with Overall Economic Segregation, with correlations ranging from 0.322–0.502 for the various economic segregation variables.
That said, the variable which is most highly associated with economic segregation is Population. It is correlated at 0.643 with Overall Economic Segregation and the coefficients range from 0.508 to 0.643. This suggests that economic segregation appears is a function of metro size.
Income Segregation
Education Segregation
Occupational Segregation
Overall Economic
Segregation
2010:
Inventors 0.221* 0.281** 0.325** 0.299**
Innovations/Patents 0.182** 0.247** 0.290** 0.259**
High-Tech 0.461** 0.592** 0.634** 0.616**
Education 0.322** 0.440** 0.502** 0.457**
Knowledge/Professional Creative Class 0.356** 0.499** 0.565** 0.514**
Service Class -0.089 -0.154** -0.122* -0.137**
Population 0.508** 0.614** 0.627** 0.643**
Income 0.152** 0.269** 0.314** 0.263**
Income Inequality 0.338** 0.473** 0.504** 0.479**
MPI Working Paper Series: The Geography of the Global Super Rich (Florida & Mellander) 14
The variable for Income Inequality is positively associated with economic segregation as well, with a coefficient of 0.479 to Overall Economic Segregation correlations ranging from of 0.338–0.504 for the various economic segregation variables.
The variable for Income is also weakly positively to economic segregation, with a correlation coefficient of 0.263 to Overall Economic Segregation and coefficients which range from 0.152–0.314 for the various economic segregation measures.
The variable for the Service Class is weakly and negatively associated with Overall Economic Segregation (-0.137) with correlations ranging from -0.089 (and not significant) to -0.154 for the various economic segregation measures.
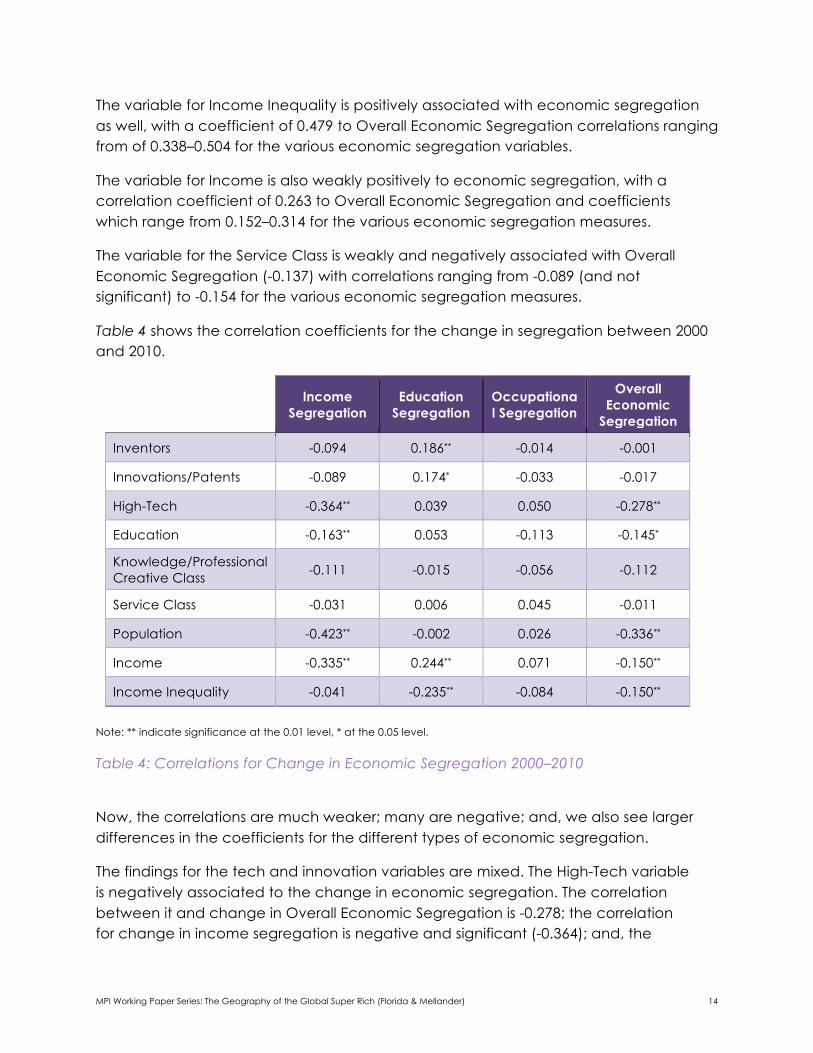
Table 4 shows the correlation coefficients for the change in segregation between 2000 and 2010.
Note: ** indicate significance at the 0.01 level, * at the 0.05 level.
Table 4: Correlations for Change in Economic Segregation 2000–2010
Now, the correlations are much weaker; many are negative; and, we also see larger differences in the coefficients for the different types of economic segregation.
The findings for the tech and innovation variables are mixed. The High-Tech variable is negatively associated to the change in economic segregation. The correlation between it and change in Overall Economic Segregation is -0.278; the correlation for change in income segregation is negative and significant (-0.364); and, the
Income Segregation
Education Segregation
Occupational Segregation
Overall Economic
Segregation
Inventors -0.094 0.186** -0.014 -0.001
Innovations/Patents -0.089 0.174* -0.033 -0.017
High-Tech -0.364** 0.039 0.050 -0.278**
Education -0.163** 0.053 -0.113 -0.145*
Knowledge/Professional Creative Class -0.111 -0.015 -0.056 -0.112
Service Class -0.031 0.006 0.045 -0.011
Population -0.423** -0.002 0.026 -0.336**
Income -0.335** 0.244** 0.071 -0.150**
Income Inequality -0.041 -0.235** -0.084 -0.150**
MPI Working Paper Series: The Geography of the Global Super Rich (Florida & Mellander) 15
correlations for change in education and occupational segregation are insignificant. Furthermore, the correlations between both change in Overall Economic Segregation and both Patents and Inventors are insignificant; the coefficients for change in educational segregation are significant and weakly positive for significant for both, while the correlations for the other types of economic segregation are insignificant.
The results for the skill or human capital variables are also mixed. The Education variable is negatively and weakly associated with Overall Economic Segregation (-0.145), while the correlation for the Knowledge/Professional/ Creative Class is insignificant. The variable for Education is significantly associated with income segregation. The remaining correlations for the skill variables are all insignificant.
Population is the variable that is most closely associated with the change in economic segregation between 2000 and 2010. The correlation between it and change in Overall Economic Segregation is -0.336, though this is driven largely by the correlation for Income Segregation (-0.423).
The variable for Income is also significantly related to the change in Overall Economic Segregation, with a negative coefficient of -0.150. But the coefficients for this variable are mixed, with a negative correlation to the change in Income Segregation (-0.335) and a positive correlation to the change in Educational Segregation (0.244).
From this it appears that both innovation and skill variables are much more closely associated with the level of economic segregation, and only weakly and in most cases negatively associated with the change in economic segregation.
Regression Findings We now turn the findings of our regression analysis, which provide a more refined test of our hypotheses regarding the role of innovation and skill in economic segregation, while controlling for other factors2.
We start with standard OLS regressions. Since the variables for Inventors and Patents are closely correlated to one another (with a correlation coefficient of 0.879), we only include Patents per capita in the regressions to avoid problems with multicollinearity. We also include the Education variable in our regressions but exclude the Knowledge/Professional/ Creative Class variable as they too are closely correlated with one another (with a correlation coefficient of 0.774). To a certain extent, we would expect them to capture similar information about innovation and skills.
2 Results for all seven segregation measures are available from the authors upon request.
MPI Working Paper Series: The Geography of the Global Super Rich (Florida & Mellander) 16
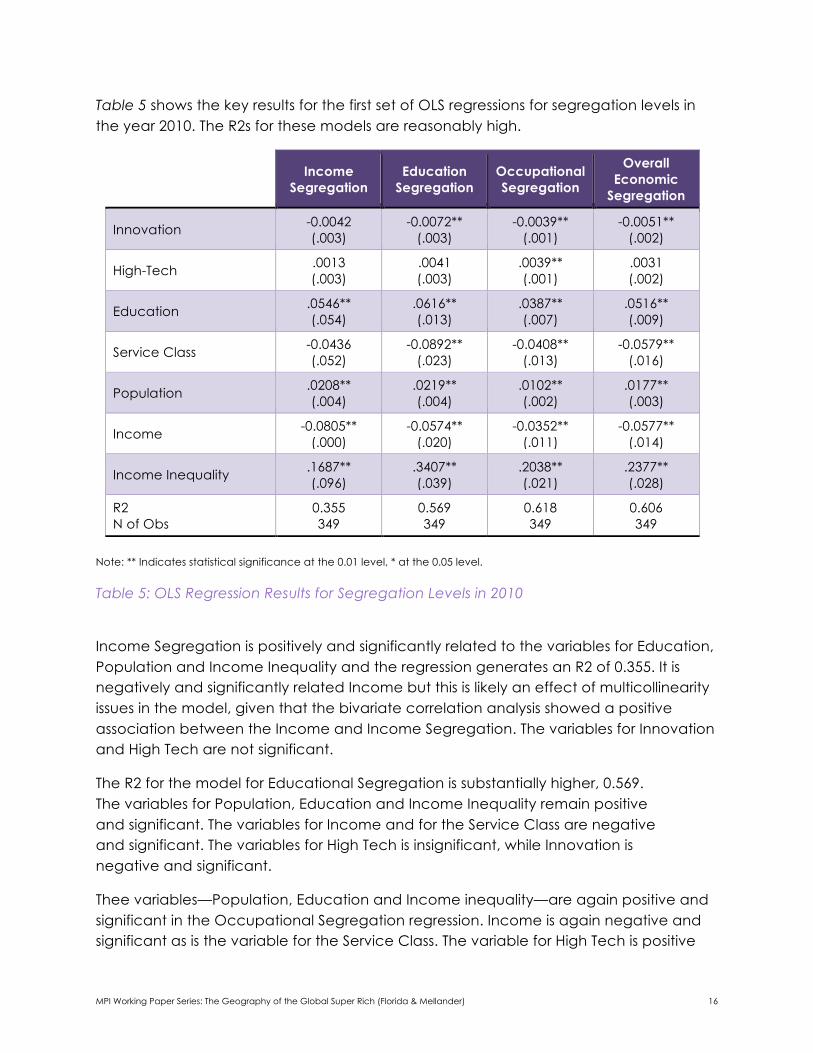
Table 5 shows the key results for the first set of OLS regressions for segregation levels in the year 2010. The R2s for these models are reasonably high.
Note: ** Indicates statistical significance at the 0.01 level, * at the 0.05 level.
Table 5: OLS Regression Results for Segregation Levels in 2010
Income Segregation is positively and significantly related to the variables for Education, Population and Income Inequality and the regression generates an R2 of 0.355. It is negatively and significantly related Income but this is likely an effect of multicollinearity issues in the model, given that the bivariate correlation analysis showed a positive association between the Income and Income Segregation. The variables for Innovation and High Tech are not significant.
The R2 for the model for Educational Segregation is substantially higher, 0.569. The variables for Population, Education and Income Inequality remain positive and significant. The variables for Income and for the Service Class are negative and significant. The variables for High Tech is insignificant, while Innovation is negative and significant.
Thee variables—Population, Education and Income inequality—are again positive and significant in the Occupational Segregation regression. Income is again negative and significant as is the variable for the Service Class. The variable for High Tech is positive
Income Segregation
Education Segregation
Occupational Segregation
Overall Economic
Segregation
Innovation -0.0042 (.003)
-0.0072** (.003)
-0.0039** (.001)
-0.0051** (.002)
High-Tech .0013 (.003)
.0041 (.003)
.0039** (.001)
.0031 (.002)
Education .0546** (.054)
.0616** (.013)
.0387** (.007)
.0516** (.009)
Service Class -0.0436 (.052)
-0.0892** (.023)
-0.0408** (.013)
-0.0579** (.016)
Population .0208** (.004)
.0219** (.004)
.0102** (.002)
.0177** (.003)
Income -0.0805** (.000)
-0.0574** (.020)
-0.0352** (.011)
-0.0577** (.014)
Income Inequality .1687** (.096)
.3407** (.039)
.2038** (.021)
.2377** (.028)
R2 N of Obs
0.355 349
0.569 349
0.618 349
0.606 349
MPI Working Paper Series: The Geography of the Global Super Rich (Florida & Mellander) 17
and significant, while the variable for Innovation is negative and significant. The R2 for the model for Occupational Segregation regression is 0.618.
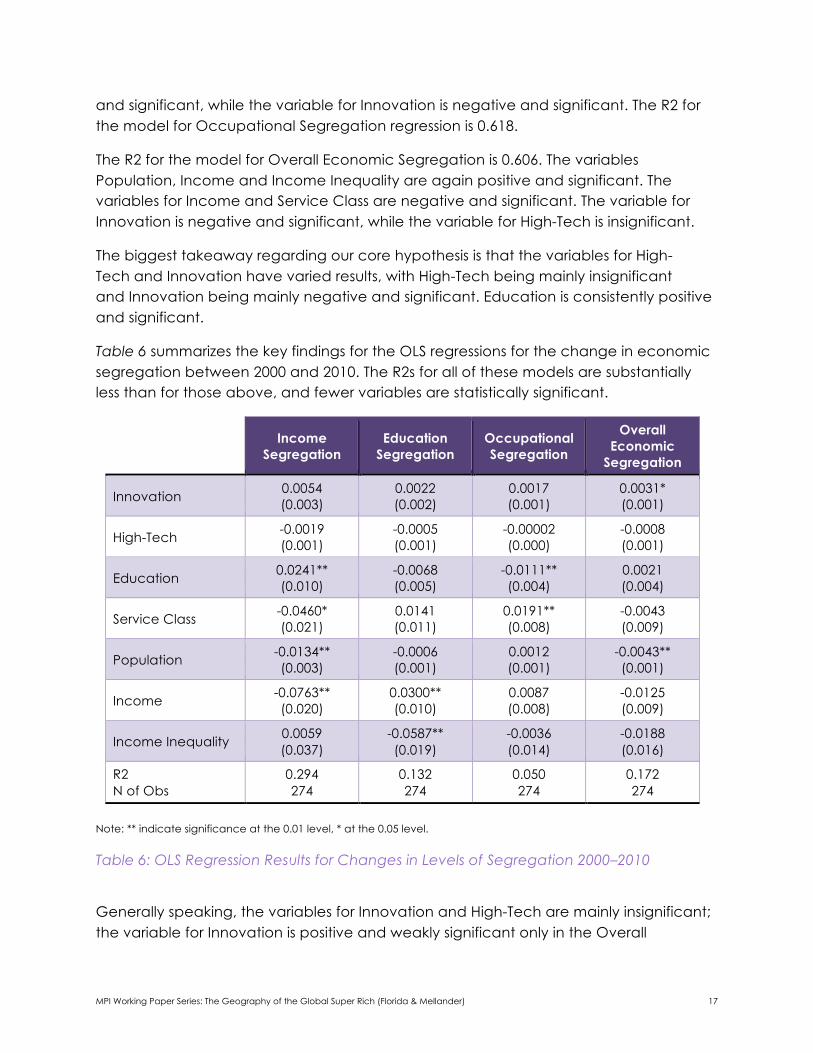
The R2 for the model for Overall Economic Segregation is 0.606. The variables Population, Income and Income Inequality are again positive and significant. The variables for Income and Service Class are negative and significant. The variable for Innovation is negative and significant, while the variable for High-Tech is insignificant.
The biggest takeaway regarding our core hypothesis is that the variables for High- Tech and Innovation have varied results, with High-Tech being mainly insignificant and Innovation being mainly negative and significant. Education is consistently positive and significant.
Table 6 summarizes the key findings for the OLS regressions for the change in economic segregation between 2000 and 2010. The R2s for all of these models are substantially less than for those above, and fewer variables are statistically significant.
Note: ** indicate significance at the 0.01 level, * at the 0.05 level.
Table 6: OLS Regression Results for Changes in Levels of Segregation 2000–2010
Generally speaking, the variables for Innovation and High-Tech are mainly insignificant; the variable for Innovation is positive and weakly significant only in the Overall
Income Segregation
Education Segregation
Occupational Segregation
Overall Economic
Segregation
Innovation 0.0054 (0.003)
0.0022 (0.002)
0.0017 (0.001)
0.0031* (0.001)
High-Tech -0.0019 (0.001)
-0.0005 (0.001)
-0.00002 (0.000)
-0.0008 (0.001)
Education 0.0241** (0.010)
-0.0068 (0.005)
-0.0111** (0.004)
0.0021 (0.004)
Service Class -0.0460* (0.021)
0.0141 (0.011)
0.0191** (0.008)
-0.0043 (0.009)
Population -0.0134** (0.003)
-0.0006 (0.001)
0.0012 (0.001)
-0.0043** (0.001)
Income -0.0763** (0.020)
0.0300** (0.010)
0.0087 (0.008)
-0.0125 (0.009)
Income Inequality 0.0059 (0.037)
-0.0587** (0.019)
-0.0036 (0.014)
-0.0188 (0.016)
R2 N of Obs
0.294 274
0.132 274
0.050 274
0.172 274
MPI Working Paper Series: The Geography of the Global Super Rich (Florida & Mellander) 18
Economic Segregation regression. The coefficients for key variables are frequently mixed with varying significance across these models. The R2 for the regression for the change in Income Segregation is significantly higher than for the other models.
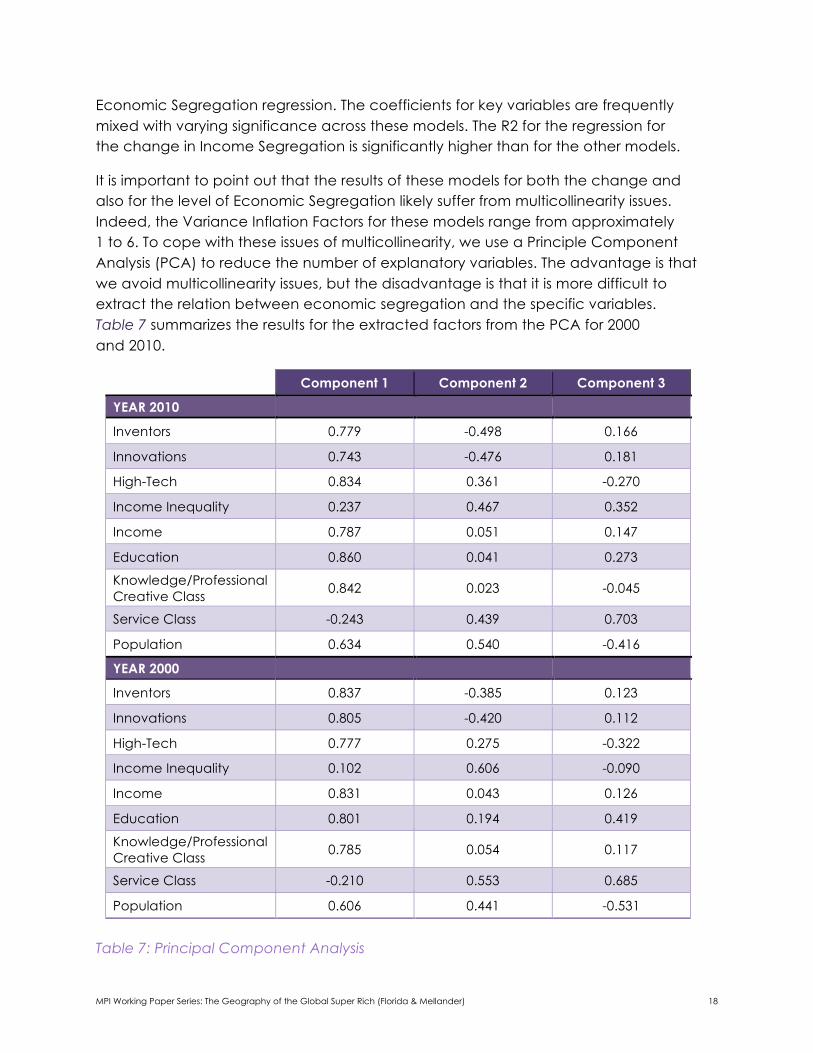
It is important to point out that the results of these models for both the change and also for the level of Economic Segregation likely suffer from multicollinearity issues. Indeed, the Variance Inflation Factors for these models range from approximately 1 to 6. To cope with these issues of multicollinearity, we use a Principle Component Analysis (PCA) to reduce the number of explanatory variables. The advantage is that we avoid multicollinearity issues, but the disadvantage is that it is more difficult to extract the relation between economic segregation and the specific variables. Table 7 summarizes the results for the extracted factors from the PCA for 2000 and 2010.
Table 7: Principal Component Analysis
Component 1 Component 2 Component 3
YEAR 2010
Inventors 0.779 -0.498 0.166
Innovations 0.743 -0.476 0.181
High-Tech 0.834 0.361 -0.270
Income Inequality 0.237 0.467 0.352
Income 0.787 0.051 0.147
Education 0.860 0.041 0.273
Knowledge/Professional Creative Class 0.842 0.023 -0.045
Service Class -0.243 0.439 0.703
Population 0.634 0.540 -0.416
YEAR 2000
Inventors 0.837 -0.385 0.123
Innovations 0.805 -0.420 0.112
High-Tech 0.777 0.275 -0.322
Income Inequality 0.102 0.606 -0.090
Income 0.831 0.043 0.126
Education 0.801 0.194 0.419
Knowledge/Professional Creative Class 0.785 0.054 0.117
Service Class -0.210 0.553 0.685
Population 0.606 0.441 -0.531
MPI Working Paper Series: The Geography of the Global Super Rich (Florida & Mellander) 19
The results of the PCA for both 2000 and 2010 generate three basic components. Component 1 is closely correlated with the variables for Patents, Inventors, High-Tech industry, Knowledge/ Professional/ Creative Class, Education, and Population all of which have correlation coefficients above 0.5. The top five metros for Component 1 are the leading knowledge and tech hubs of San Jose, Boulder, San Francisco, Washington DC and Boston. We refer to this component as Knowledge and Tech Hubs.
Component 2 is positively associated with Population and the Service Class as well as with Income Inequality. It is also strongly and negatively associated with the variables for Innovation and Inventors, but has a modest positive association to High-Tech. The leading metros for Component 2 include the three largest metros, New York, Los Angeles and Chicago, as well as metros with service and tourism economies, Miami, Tampa, Las Vegas, and Orlando. We refer to this component as Large and Service Places.
Component 3 is strongly and positively related to the variable for Service Class workers (0.703) but negatively associated with Population. It has weak associations to Innovations, Inventors sand a negative association to High-Tech. We refer to this component as Small Service Places.
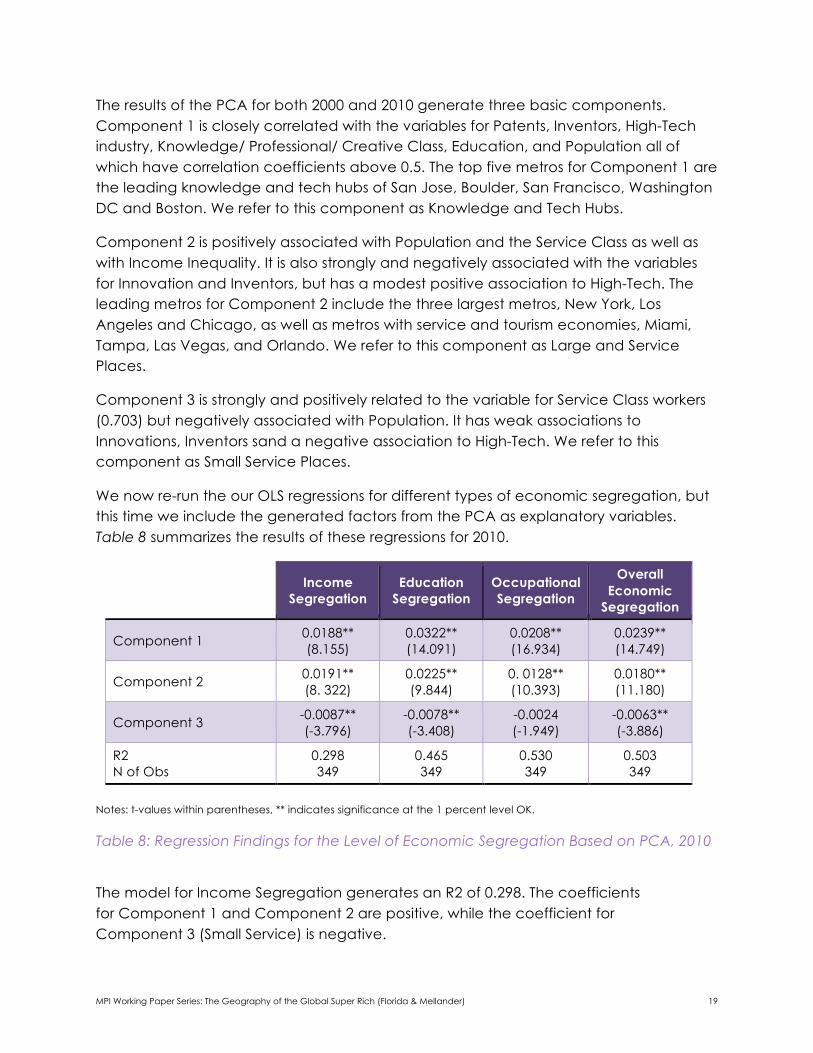
We now re-run the our OLS regressions for different types of economic segregation, but this time we include the generated factors from the PCA as explanatory variables. Table 8 summarizes the results of these regressions for 2010.
Notes: t-values within parentheses, ** indicates significance at the 1 percent level OK.
Table 8: Regression Findings for the Level of Economic Segregation Based on PCA, 2010
The model for Income Segregation generates an R2 of 0.298. The coefficients for Component 1 and Component 2 are positive, while the coefficient for Component 3 (Small Service) is negative.
Income Segregation
Education Segregation
Occupational Segregation
Overall Economic
Segregation
Component 1 0.0188** (8.155)
0.0322** (14.091)
0.0208** (16.934)
0.0239** (14.749)
Component 2 0.0191** (8. 322)
0.0225** (9.844)
0. 0128** (10.393)
0.0180** (11.180)
Component 3 -0.0087** (-3.796)
-0.0078** (-3.408)
-0.0024 (-1.949)
-0.0063** (-3.886)
R2 N of Obs
0.298 349
0.465 349
0.530 349
0.503 349
MPI Working Paper Series: The Geography of the Global Super Rich (Florida & Mellander) 20
The model for Educational Segregation generates a higher R2 of 0.465. The coefficient for Component 1 is more strongly and positively related than that of Component 2. Again, the coefficient for Component 3 is negative.
The model for Occupational Segregation generates an R2 of 0.530. This model generates positive and significant coefficients for Components 1 and 2, with the coefficient for Component 1 being stronger. Taken together these two Components explain 53 percent of the variation in occupational segregation. The coefficient for Component 3 is insignificant.
The model for our measure for Overall Economic Segregation generates an R2 of 0.503. The coefficients for Components 1 and 2 are positive and significant, with the coefficient for Component 1being stronger. The coefficient for Component 3 is negative and significant.
Taken on the whole, these findings suggest that economic segregation overall and across its three basic dimensions of income, education and occupation is associated with both Components 1 and 2, that is with Knowledge and Tech Hubs and Large and Service Places, but that it is more closely associated with the former. Economic segregation is negatively associated on balance with Small Service Places.
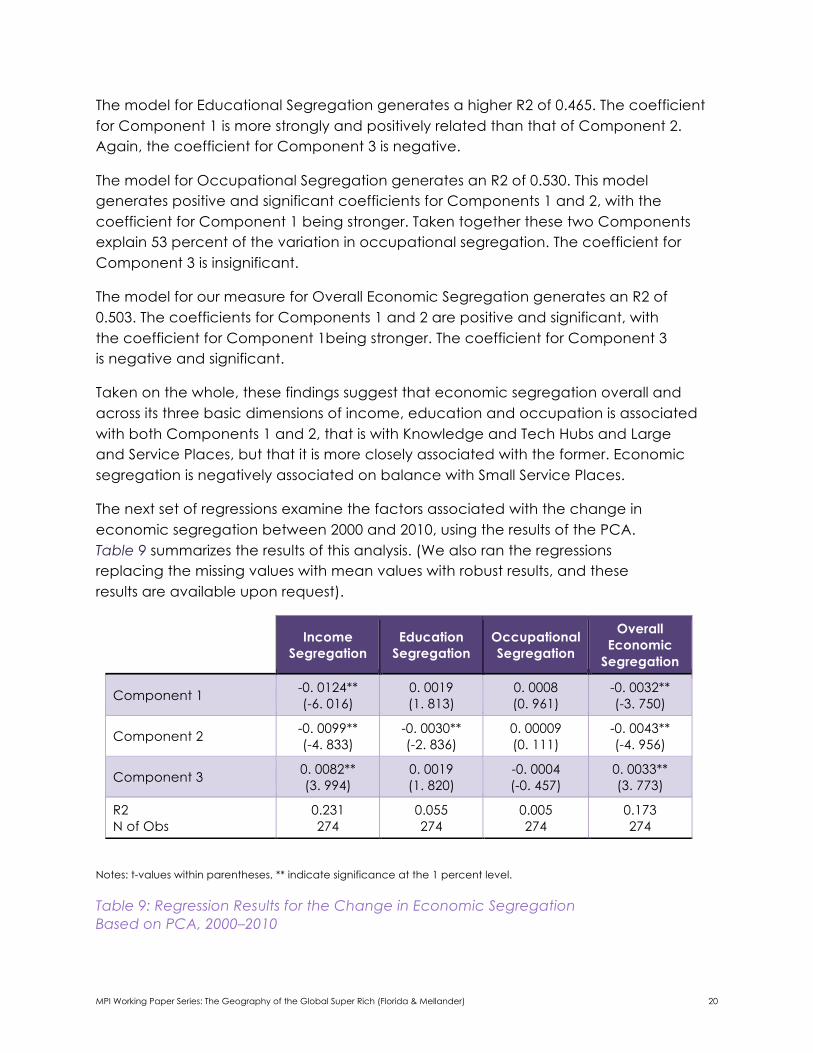
The next set of regressions examine the factors associated with the change in economic segregation between 2000 and 2010, using the results of the PCA. Table 9 summarizes the results of this analysis. (We also ran the regressions replacing the missing values with mean values with robust results, and these results are available upon request).
Notes: t-values within parentheses, ** indicate significance at the 1 percent level.
Table 9: Regression Results for the Change in Economic Segregation Based on PCA, 2000–2010
Income Segregation
Education Segregation
Occupational Segregation
Overall Economic
Segregation
Component 1 -0. 0124** (-6. 016)
0. 0019 (1. 813)
0. 0008 (0. 961)
-0. 0032** (-3. 750)
Component 2 -0. 0099** (-4. 833)
-0. 0030** (-2. 836)
0. 00009 (0. 111)
-0. 0043** (-4. 956)
Component 3 0. 0082** (3. 994)
0. 0019 (1. 820)
-0. 0004 (-0. 457)
0. 0033** (3. 773)
R2 N of Obs
0.231 274
0.055 274
0.005 274
0.173 274
MPI Working Paper Series: The Geography of the Global Super Rich (Florida & Mellander) 21
The R2s for these models are relatively low, ranging from roughly 0 to 0.231.
The model for Income Segregation generates R2s of 0.231 for the reduced sample and 0.130 for the expanded sample using means. Components 1 and 2 are now negative and significant in both models, while Component 3 is positive in the reduced sample model and insignificant in the model with the expanded sample.
The model for Educational Segregation generates very low R2s of 0.055 and 0.041. Only one variable is significant in either of these models, Component 2 in the model with the expanded sample.
The model for Occupational Segregation generates even lower R2s. No coefficients are significant in either of the models for occupational segregation.
The model for Overall Economic Segregation generates R2s of 0.173 for the reduced sample and 0.108 for the model based on the expanded sample. The coefficients for Components 1 and 2 are negative and significant in both models, while the coefficient for Component 3 is negative in the model with the reduce sample and insignificant in the model with the expanded sample. The results for the change in Overall Economic Segregation is clearly primarily driven by the change in income segregation. The result here seems to be primarily driven by the result for Income Segregation. Ultimately, the models for the change in Economic Segregation explain a lot less than our models for its level.
Conclusions Our research has examined the connection of innovation and skill to economic segregation across metros. We posed the connection between innovation and economic segregation at the metro level as taking the form of something of a tradeoff. On the one hand, economic and urban theory provides good reasons why more innovative and skilled metros are likely to experience greater levels of economic segregation. But, on the other hand, urban and economic theory also suggests that more economically segregated places are likely to be less innovative. To examine the connection between innovation and economic segregation across metros, we used OLS regressions in combination with a Principal Component Analysis that distilled key factors related to innovation, high-tech and skills across metros, while controlling for other factors such as population size, income and income inequality. We used measures of economic segregation that span income, education and occupation. And we used measures which examine the geographic location of both patented innovations and inventors, and variables for both the occupational and educational dimensions of skill or human capital. We examined the role of innovation and skill across metros on both the level of economic segregation and its growth over decade spanning 2000–2010.
MPI Working Paper Series: The Geography of the Global Super Rich (Florida & Mellander) 22
Our findings on the connection between innovation and skill at the metro level and economic segregation are mixed. On the one hand, we do find evidence of an association between the level of innovation and skill across metros and the level of economic segregation in 2010. Here, the evidence is stronger for our measures of skill than it is for the measures of innovation per se. On the other hand, there is little, if any, evidence of an association between the level of innovation and skill across metros and the growth of economic segregation between 2000 and 2010. Generally speaking, while more highly innovative and skilled metros are found to have higher levels of economic segregation, they have not seen significant growth in it over the past decade.
Here are several caveats to emphasize with regard to our findings. As noted above our OLS regressions most likely suffer from multicollinearity: Many of the key variables contain similar information. There is also the mitigating effect of size and density. Larger, denser metros tend to shape both innovation and economic segregation, having higher levels of both. Furthermore, there is the fact that the relationship between innovation and economic segregation takes the form of a tradeoff of sorts, as we noted at the outset. While economic segregation is likely to be higher in more innovative and skilled metros, higher levels of economic segregation are likely to dampen innovation over time. Our analysis is confined to a relatively short-time frame and may not be able to fully get at this set of interactions as they occur over time.
In this respect, our research is just a start and our results should be thought as illustrative not as confirmatory. We hope that our framing of the problem and the provisional findings of our analysis stimulate more research on this important topic.
MPI Working Paper Series: The Geography of the Global Super Rich (Florida & Mellander) 23
References Acemoglu, D. (1998) “Why Do New Technologies Complement Skills? Directed Technical Change and Wage Inequality,” The Quarterly Journal of Economics, 113(4), 1055 –1089. Aghion, P., Akcigit, U., Bergeaud, A., Blundell, R., Hémous, D. (2015) “Innovation and Top Income Inequality,” NBER Working Paper No 21247, available at: http://www.nber.org/papers/w21247 Albouy, D., Stuart, B. (2014) “Urban Population and Amenities: The Neoclassical Model of Location,” NBER Working Paper No 19919, available at: http://www.nber.org/papers/w19919
Albouy, D. (2016) “What Are Cities Worth? Land Rents, Local Productivity, and the Total Value of Amenities,” The Review of Economics and Statistics, 98(3), 477–487.
Atkinson, A.B. (1975) The Economics of Inequality, Oxford: Clarendon Press. Atkinson, A.B. (2015) Inequality, Cambridge, MA: Harvard University Press.
Autor, D. H., Katz, L. F., & Kearney, M. S. (2006). “The Polarization of the U.S. Labor Market”, NBER Working Paper No 11986, available at: http://www.nber.org/papers/w11986 Autor, D. H., Katz, L. F., & Krueger, A. B. (1998) ”Computing Inequality: Have Computers Changed the Labor Market?” Quarterly Journal of Economics, 113(4), 1169–1213. Autor, D. H., Levy, F., & Murnane, R. J. (2003). “The Skill Content of Recent Technological Change: An Empirical Exploration,” Quarterly Journal of Economics, 118(4), 1279–1333. Baum-Snow, N., Pavan, R. (2013) “Inequality and City Size,” Review of Economics and Statistics, 95(5), 1535–1548. Baum-Snow, N., Freedman, M., Pavan, R. (2014) “Why Has Urban Inequality Increased?” Brown University, available at: http://www.econ.brown.edu/fac/Nathaniel_Baum-Snow/capital_all_oct2014.pdf Baum-Snow, N., Hartley, D. (2016) “Causes and Consequences of Central Neighborhood Change, 1970–2010,” Paper presented at the Research Symposium on Gentrification and Neighborhood Change, May 25, 2016. Philadelphia: Federal Reserve Bank of Philadelphia. Benner, C., Pastor, M. (2015) “Brother, Can You Spare Some Time? Sustaining Prosperity and Social Inclusion in America’s Metropolitan Regions,” Urban Studies, 52(7), 1339–1356. Bettencourt, L. M. A., Lobo, J., Strumsky, D. (2007) “Invention in the City: Increasing Returns to Patenting as a Scaling Function of Metropolitan Size,” Research Policy, 36, 107–120.
Bischoff, K., Reardon, S. (2016) ”The Continuing Increase in Income Segregation, 2007–2012,” Stanford University, Center for Education and Policy Analysis, available at: https://cepa.stanford.edu/sites/default/files/the%20continuing%20increase%20in%20income%20segregation%20march2016.pdf Bishop, B. (2009) The Big Sort: Why the Clustering of Like-Minded America is Tearing Us Apart, Boston, MA: Houghton Mifflin Harcourt.
MPI Working Paper Series: The Geography of the Global Super Rich (Florida & Mellander) 24
Chetty, R., Hendren, N., Kline, P., Saez, E. (2014) “Where Is the Land of Opportunity? The Geography of Intergenerational Mobility in the United States,” The Quarterly Journal of Economics, 129(4), 1553–1623. De Vol, R., Wong, P., Catapano, J., Robitshek, G. (1999) “America’s High-Tech Economy: Growth, Development, and Risks for Metropolitan Areas,” Santa Monica, CA: Milken Institute Diamond, R. (2016) “The Determinants and Welfare Implications of US Workers’ Diverging Location Choices by Skill: 1980–2000,” American Economic Review, 106(3), 479–524 Edlund, L. Machado, C., Sviatschi, M. M. (2015) “Bright Minds, Big Rent: Gentrification and the Rising Returns to Skill,” NBER Working Paper Series No. 21729, available at: http://www.nber.org/papers/w21729
Florida, R. (2002) The Rise of the Creative Class, New York: Basic Books. Florida, R., Mellander, C. (2014) “The Geography of Inequality: Difference and Determinants of Wage and Income Inequality across U.S. Metros,” Regional Studies, 50:1, 79–92. Florida, R., Mellander, C. (2016) “The Rise of the Startup City: The Changing Geography of the Venture Capital Financed Innovation,” California Management Review, 59(1), 14–38. Ganong, P., Shoag, D. (2015) “Why Has Regional Income Convergence in the U.S. Declined?,” Harvard Kennedy School Working Paper, available at: http://scholar.harvard.edu/files/shoag/files/why_has_regional_income_convergence_in_the_us_declined_01.pdf Giannone, E. (2017) “Skilled-Biased Technical Change and Regional Convergence”, University of Chicago Working Paper, available at: http://home.uchicago.edu/~elisagiannone/files/JMP_ElisaG.pdf Glaeser, E. L., Kolko, J., Saiz, A. (2001) “Consumer City,” Journal of Economic Geography, 1(1), 27–50. Glaeser, E., Resseger, M., Tobio, K. (2009) “Inequality in Cities,” Journal of Regional Science, 49:4, 617–646. Glaeser, E. (2011) Triumph of the City, New York: Penguin. Glaeser, E., Vigdor. J. (2012) “The End of the Segregated century: Racial Separation in America's Neighborhoods,” 1890–2010, New York, NY: Manhattan Institute for Policy Research Goetz, E., Damiano, T., Hicks, J. (2015) “American Urban Inequality: Racially Concentrated Affluence.” Cambridge, MA: Lincoln Institute of Land Policy Goos, M., Manning, A. (2007) "Lousy and Lovely Jobs: The Rising Polarization of Work in Britain," Review of Economics and Statistics, 89(1): 118–33. Goos, M, Manning, A., Salomons, A. (2009) “Job Polarization in Europe,” The American Economic Review, 99(2), 58–63.
MPI Working Paper Series: The Geography of the Global Super Rich (Florida & Mellander) 25
Hsieh, C-T., Moretti, E. (2015) “Why Do Cities Matter? Local Growth and Aggregate Growth,” NBER Working Paper No. 21154, available at: http://www.nber.org/papers/w21154 Hulchanski, J. D. (2009) “Neighbourhood Trends in Divided Cities: Income Inequality, Social Polarization & Spatial Segregation: A selected bibliography,” Community University Research Alliance, available at: http://www.urbancentre.utoronto.ca/pdfs/curp/tnrn/Divided-Cities_SELECTEDbibliographyrev-Aug-2009.pdf Hwang, J., Sampson, R. J. (2014) "Divergent Pathways of Gentrification Racial Inequality and the Social Order of Renewal in Chicago Neighborhoods," American Sociological Review 79(4), 726–751. Jacobs, J. (1969) The Economies of Cities, New York: Random House Jacobs, J. (1984) Cities and the Wealth of Nations, New York: Random House Kochhar, R., Fry, R., Rohal, M. (2016) “America’s Shrinking Middle Class: A Close Look at Changes Within Metropolitan Areas,” Pew Research Center, available at: http://www.pewsocialtrends.org/2016/05/11/americas-shrinking-middle-class-a-close-look-at-changes-within-metropolitan-areas/ Manning, A. (2004) “We Can Work It Out: The Impact of Technological Change on the Demand for Low-Skill Workers,” Scottish Journal of Political Economy, 51(5), 581–608. Massey, D. S., Denton, N. A. (1988) “The Dimensions of Residential Segregation,” Social Forces, 67(2): 281–315. Morretti, E. (2012) The New Geography of Jobs, New York: Houghton Mifflin Harcourt Piketty, T. (2014) Capital in the Twenty-First Century, Cambridge, MA: Belknap Press Reardon, S. F., Bischoff, K. (2011) “Growth in the Residential Segregation of Families by Income, 1970–2009,” Russell Sage Foundation, available at: http://www.s4.brown.edu/us2010/Data/Report/report111111.pdf Rothwell, J. T., Massey, D. S. (2014) “Geographic Effects on Intergenerational Income Mobility,” Economic Geography, 91, 83–106. Sampson, R. J. (2012) Great American City: Chicago and the Enduring Neighborhood Effect, Chicago, IL: University of Chicago Press Semuels, A. (2015) “Where the White People Live,” The Atlantic, April 10th 2015, available at: https://www.theatlantic.com/business/archive/2015/04/where-the-white-people-live/390153/ Sharkey, P. (2013) Stuck in Place: Urban Neighborhoods and the End of Progress toward Racial Equality, Chicago, IL: The University of Chicago Press Taylor, P., Fry, R. (2012) “The Rise of Residential Segregation by Income,” Washington, D.C.: Pew Research Center, available at: http://www.pewsocialtrends.org/files/2012/08/Rise-of-Residential-Income-Segregation-2012.2.pdf
MPI Working Paper Series: The Geography of the Global Super Rich (Florida & Mellander) 26
Watson, T., Carlino, G., Gould Ellen, I. (2006) “Metropolitan Growth, Inequality, and Neighborhood Segregation by Income,” Brookings-Wharton Papers on Urban Affairs, 1–52. Watson, T. (2009) “Inequality and the Measurement of Residential Segregation by Income in American Neighborhoods,” Review of Income and Wealth, 55(3), 820–844. Wilson, W. J. (2012) The Truly Disadvantaged: The Inner City, the Underclass, and Public Policy, Chicago, IL: University of Chicago Press.