
Innovation in New Zealand: Issues of Firm Size, Local Market Size and Economic Geography · ·...
25
1 Innovation in New Zealand: Issues of Firm Size, Local Market Size and Economic Geography Hong Shangqin, Philip McCann and Les Oxley No: 04/2009
Transcript of Innovation in New Zealand: Issues of Firm Size, Local Market Size and Economic Geography · ·...

1
Innovation in New Zealand: Issues of Firm Size, Local
Market Size and Economic Geography
Hong Shangqin, Philip McCann and Les Oxley
No: 04/2009
2
WORKING PAPER No: 04/2009
Innovation in New Zealand: Issues of Firm Size, Local Market Size
and Economic Geography
April 2009
Hong Shangqin*, Philip McCann+ and Les Oxley*†
Abstract: In this paper we report empirical evidence from a mixed methods approach to investigating the drivers of innovation in New Zealand. The evidence comes from a primary questionnaire survey we conducted across seventy-five local firms plus fifteen face-to-face case study interviews. Our survey response data is analysed using four different types of probability models and the various models are all found to be largely consistent with each other. The insights from these estimation methods are then bolstered by detailed follow-up case studies of individual firms in different industries and product groups regarding their innovation and competition experiences. Our results from both forms of evidence-gathering suggest that in a small and isolated local market such as New Zealand, smallness in terms of firm size may not be an advantage for innovation. The reason appears to be that the notion of ‘small’ itself may have an absolute minimum threshold, below which translating entrepreneurship into innovation becomes problematic. As such, applying theories of local economic development to local economies which exhibit similar features to New Zealand may require us to adjust our thinking in order to take account of different absolute scale effects in different types of economies.
Keywords: Innovation; New Zealand; SME; economic geography
JEL Classifications: O31, O33, O38
Acknowledgments: We acknowledge financial support from the RSNZ Marsden Fund; the College of Business and Economics, University of Canterbury and the Management School, University of Waikato. We also appreciate and acknowledge the support of the New Zealand Manufacturers and Exporters Association and particularly John Walley, CEO.
†Corresponding author: Les Oxley, [email protected]
* Department of Economics and Finance, University of Canterbury, Private Bag 4800, Christchurch, 8140, New Zealand + Department of Economics, University of Waikato, Private Bag 3105, New Zealand
3
1. Introduction
The unique demographic, economic conditions and geographic location makes New Zealand an interesting case study for understanding the processes which foster innovation. New Zealand is a small and isolated economy which, at least in a textbook sense, is institutionally almost ideal for promoting local entrepreneurship and innovation. Yet, in spite of a macroeconomic and institutional framework which should be ideal for promoting innovation, the observed innovation performance of New Zealand is poor, and this is particularly noticeable in comparison with other small isolated countries such as Israel and Finland. The reasons for this poor performance are as yet unclear. It may be that the awareness of best-practice and state-of-the-art thinking on innovation issues is less in New Zealand than might be hoped. This scenario would call for better training and human capital development. Alternatively, there may be grounds for believing that some of the structural determinants of innovation in New Zealand are different to those in other countries. In this case, some of the recipes for promoting innovation which are adopted in other countries may not necessarily be appropriate in New Zealand. This paper aims to uncover the issues which drive innovation in New Zealand in order to assess the extent to which traditional innovation policy thinking is appropriate in the case of a small isolated economy. The approach of the paper is to analyse both empirical data and case study data in order to provide a broad perspective on New Zealand’s local innovation processes. This mixed methods approach therefore combines both quantitative and qualitative analysis. A major element of the research presented here relates to the construction of a manufacturing based Innovation Survey which was undertaken specifically as part of this research. Information including firm characteristics, innovation outcomes, innovation related practices, general practices and market environment were collected by means of this survey and a quantitative analysis was then applied to the data. Following the initial Survey, a number of in-depth case studies were then carried out in an attempt to resolve and explain some the quantitative results and to elaborate on further issues not captured by the data. The major findings of the paper are that New Zealand firms generally do demonstrate best-practice and state-of-the-art thinking on innovation issues. Moreover, the local institutional environment for entrepreneurship and innovation in New Zealand is excellent. Yet, translating high levels of local entrepreneurship into innovation remains a problem. The paper suggests that these observations can best be explained with reference to various structural features of the economy, which themselves cast doubt on some generally-received wisdom regarding the role played by firm size in innovation processes.
The paper is organised as follows. Section 2 describes the characteristics and features of the New Zealand economy and its innovation performance. Section 3 outlines the
4
research method, the design of the survey and case studies. Section 4 presents the empirical results and Section 5 reports the observations from the in-depth case studies. Section 6 provides a discussion and some conclusions.
2. Innovation Performance and the Characteristics of the New Zealand Economy Since the economic reforms of the 1980s and early 1990s (Evans et al. 1996) New Zealand has maintained macroeconomic stability, with unemployment and inflation kept consistently amongst the lowest levels in the OECD (OECD 2008a). New Zealand is now a relatively open economy with a largely transparent institutional system, the third strongest property rights in the world and the world’s strongest investor protection environment (Porter et al. 2007); the seventh most flexible labour market in the world and the world’s lowest labour firing costs (Porter et al. 2007); the world’s lowest number of procedures required to start a business (Porter et al. 2007); high firm competition and turnover (Law and McLellan 2005); and one of the world’s most transparent and least corrupt institutional environments in the world (Porter et al. 2007). The result is that New Zealand has relatively very low levels of regulation and bureaucracy by OECD standards (Gerardin and Kerr 2003; Hall and Casey 2006). In comparison to other small advanced countries New Zealand also has a relatively small public sector. New Zealand’s relative share of social expenditure ranks only 21st highest in the OECD (OECD 2008a) and New Zealand’s total tax revenue as a percentage of GDP ranks 15th out of thirty OECD countries, and this is lower than for all but one of the small OECD countries (OECD 2008a). Low levels of public sector intervention and regulation mean that New Zealand is consistently ranked as one of the world’s most liberalised economies1, the second best country in the world for doing business (World Bank 2009a), one of the best countries in the world for entrepreneurship2, the least corrupt country in the world3, the ninth best for overall institutions (Porter et al. 2007), with some of the world’s lowest trade barriers (MED 2005), and one of the best locations for international capital investment.4 These beneficial features ought to mean that the level of local entrepreneurial activity in New Zealand is very high, and indeed on some measures New Zealand is the world’s most entrepreneurial society (Acs and Szerb 2009). Yet, as mentioned above, in spite of all of the very good macroeconomic and institutional characteristics of the New Zealand economy, the innovation performance of New Zealand is very poor. Although New Zealand’s innovation probability scores are good relative to OECD countries (MED-Treasury 2005), patents per capita are ranked only twentieth in the world and below both the OECD and EU averages (OECD 2007a,b). Yet, even allowing for New Zealand’s industry structure, the
1 The Fraser Institute (2006) ranks New Zealand as the third freest economy in the world (http://www.freetheworld.com/2006/EFWinternational-rls.pdf). The Heritage Foundations (2007) ranks NZ as the fifth freest economy in the world (http://www.heritage.org/index/topten.cfm). 2 The Global Entrepreneurship Monitor (http://www.gemconsortium.org/). 3 Transparency International: www.transparency.org/layout/set/print/news_room/in_focus/2008/cpi2008/cpi_2008_table 4 Forbes ranked NZ 10th out of 135 countries in 2006 in terms of capital ‘hospitality’ (http://www.forbes.com/lists/2006/6/CHI010.html) and (http://www.forbes.com/2006/01/24/capital-hospitality-index_06caphosp_land.html).
5
World Economic Forum (Porter et al. 2007) ranks New Zealand only 27th in the world in terms of its overall capacity for innovation, which is the fourth lowest ranking for any advanced economy. Institutionally New Zealand ought to be ideally suited to promoting entrepreneurship and innovation, yet its local innovation performance appears to be much weaker than expected. Part of the issue may be related to the role in the innovation process played by the size of firms, the size of local markets and the size of cities in New Zealand. In terms of firm size, there is much international evidence which suggests that small firms have the highest propensity to innovate of all firms types (Acs and Audretsch 1988), and a U-shaped innovation-size distribution is accepted by many scholars (Tether et al. 1997), reflecting the fact that the largest firms are also seen to exhibit a high innovation propensities. Yet, translating these arguments to New Zealand may not be so straightforward because what is meant by large and small may be very different in different contexts. The definition for an SME often varies between countries and generally uses numerical criteria such as staff numbers and firm’s assets or profit levels. In the case of New Zealand the Ministry of Economic Development (MED) defines the firm size classification based on an enterprise’s employment headcount, and considers firms with 19 or fewer employees to be an SME. This is a simpler definition than that used by the European Commission. On 1 January 2005 the European Commission adjusted the 1996 definition of an SME using updated thresholds, defining a medium sized enterprise as a firm with fewer than 250 annual work units (AWU)5, an annual turnover6 of no more than €50 million, or a firm which has an annual balance sheet total7 of less than €43 million (European Commission 2003). In the United States, the Small Business Administration (SBA) defines a small business size standard for every single private sector industry, thereby aiming to accurately reflect industry differences in firm size distributions. The standard for a small or medium sized firm is usually stated either in terms of numbers of employees or average annual receipts8. Within the manufacturing sector, the size standard for approximately 75 percent of the industries is 500 employees, with the remaining industries having a higher threshold at 750, 1000 or 1500 employees. Compared to these thresholds, the vast majority of New Zealand’s SMEs are therefore actually micro or nano firms, rather than small or medium sized firms. In fact, on these definitions, very few firms in New Zealand would even be classed as medium sized firms in the USA. 5 Similar to the Full Time Equivalent (FTE) measurement, a full time worker is counted as one annual work unit, and part-time staff and seasonal workers are counted as fractions of one unit. 6 Income received in the reference year after rebates paid outs, excluding value added tax or other indirect taxes. 7 Refers to the value of the company’s main assets. 8 Average of total income plus cost of goods sold for the latest three fiscal years; for exclusion receipts refer to SBA’s website, http://www.sba.gov/services/contractingopportunities/sizestandardstopics/indexguide/index.html.
6
The importance of very small firms to knowledge generation in New Zealand can be gauged by the fact that just under 50% of the total business R&D in New Zealand is accounted for by firms of fewer than fifty employees and almost 80% is accounted for by firms of less than 250 employees (OECD 2007a). In both cases these are the highest relative R&D contributions by small firms of any OECD country. The equivalent numbers for the USA are less than 10% and less than 20%, respectively (OECD 2007a). Moreover, these figures are not necessarily typical for small countries. The total share of business R&D accounted for by firms with less than fifty employees in New Zealand is twice that of the next highest country, Australia, and five times that of Sweden, Finland and The Netherlands. Similarly, the total share of business R&D accounted for by firms with less than 250 employees is only 20% in countries such as Finland and Sweden, and less than 30% in Austria and Denmark.
Secondly, it is also found generally in the international literature that innovation propensities are increased when firms are located in large and diverse cities (Acs 2002). Combining this observation with the above observations from the international literature regarding small firms suggest that that large concentrations of small firms in large cities should promote innovation. Indeed, there is clear evidence from New Zealand which points to the role of cities in the promotion of innovation. In particular, Auckland is by far the largest city in New Zealand with a population three times that of the next city, and on some criteria the levels of entrepreneurial dynamism in Auckland relative to the national level are ranked as the highest in the OECD (Acs et al. 2008). Yet, with a population of 1.2 million people, Auckland is not even amongst the top eighty largest OECD cities (OECD 2007c), and would only rank as a small to medium sized city in the USA. While urban areas are regarded as being beneficial for innovation promotion, absolute scale may also be critical. As such, once again there may be an urban population threshold above which being located in a city is advantageous for fostering innovation.
Thirdly, market size may be important. New Zealand is the third smallest national market in the OECD, with a total national market which is only equivalent in scale to a medium sized urban market in the USA. Yet, in terms of its accessibility to other national markets, New Zealand is also one of the two most geographically isolated countries in the world (IMF 2004; OECD 2008b,c). Many other small countries, and particularly those in the EU, are part of a much larger market, such that exporting increases the returns to innovation. In contrast, the nearest adjacent market for New Zealand firms is Australia which is more than 2500km away and only accounts for 20 million people in total. The fact that the net benefits of exporting diminish as distance costs increase implies that the positive effect of exporting on innovation may therefore also be smaller in New Zealand than for many other small countries. Once again, it may well be that there is a size threshold in terms of market accessibility, above which innovation propensities and innovation successes increase, and New Zealand may only
7
be at the lower limit of this market size threshold.
Finally, the small scale and isolation of the New Zealand economy means that there is always a higher risk premium attached to the New Zealand dollar than for almost all other currencies. The result is that interest rates are consistently amongst the highest in the world. As such, the optimal investment portfolio for businesses may be rather different in New Zealand than in other countries with a greater relative preference for labour over capital investment. If technological progress means that innovation is also related to the embodied technology in capital deepening, then this may also inhibit New Zealand’s innovation performance.
The objective of this paper is to discover the main drivers of innovation for New Zealand firms. In particular, given the specific features and context of the New Zealand economy, our aim is to identify whether or not similar issues and influences promote innovation in New Zealand as in other countries. In particular we also examine whether New Zealand’s poor innovation performance is best explained by structural features or by issues related to awareness of the best-practice and state-of-the-art thinking in terms of innovation. One of the major issues we focus on specifically in this paper is the role in innovation promotion played by firm size.
3. Research Methodology and Data
We examine these issues by focusing on the New Zealand manufacturing sector. A mixed method approach was adopted, which combines both quantitative and qualitative analysis. This type of approach was used successfully by Roper and Hewitt-Dundas (2008). The quantitative part of analysis involves the design and implementation of an Internet-based survey, and the qualitative analysis includes 15 in-depth company interviews.
3.1 The Innovation Survey
Since 2005, Statistics New Zealand (SNZ) has conducted a business operations survey in order to gain a better understanding of firm practices, performance and innovation processes. The integrated, modular Business Operations Survey (BOS) has assisted studies of innovation by providing an invaluable data sources for a wide range of sectors. Due to the mandatory nature of the survey and its large sample size, high responses rates are almost guaranteed. Using the BOS, Fabling and Grimes (2007) found that indicators of firm success, such as profitability, productivity and market share, are largely unrelated to the size, age or sector of the firm, and instead depend on the specific business practices of the firm, such as capital deepening, R&D, market research, and policies for enhancing labor skills. The only exception here is in the case of export marketing, the effect of which tends to favour small and medium sized firms which have been in operation for fewer than ten years. Similarly, industry structure also appears to be very important, with firms in highly competitive industries perceiving
8
relatively greater barriers to innovation than firms in oligopolistic industries. Fabling (2007) also suggests that a broader use of innovation indicators which allows us to take account of the bundles of activities and competences that contribute to firm performance, rather than simply indicators of the higher-level outcomes, would represent a major step forward. Our development of a survey plus follow-up case studies is undertaken in this spirit. In terms of arriving at more general conclusions regarding the drivers of innovation in New Zealand, the major limitation of the BOS is with regard to its target population. Most enterprises in New Zealand are classified as small and medium-sized enterprises (SMEs) and in New Zealand these firms have 19 or fewer employees by definition (MED 2007). Yet, the target population for BOS 2005 excludes firms with 5 or fewer employees, and this implies that 86.9% of New Zealand’s enterprises are not sampled by the survey. Hence, the BOS survey results are somewhat biased towards sampling what in New Zealand terms are described as being medium to large firms. For this reason in this research we construct a new survey that also includes much smaller firms in the analyses. The Innovation Survey of the Manufacturing Sector which was undertaken for this research with the help of the New Zealand Manufacturers and Exporters Association is therefore purposely designed to complement the official Business Operations Survey, both in terms of its coverage and its information content. From hereon, we refer to the newly constructed survey as the “Innovation Survey”. The questionnaire we developed for this research was designed to collect information on New Zealand businesses in terms of five different themes: firm characteristics; innovation outputs; innovation related practices; general practices; and the market environment.
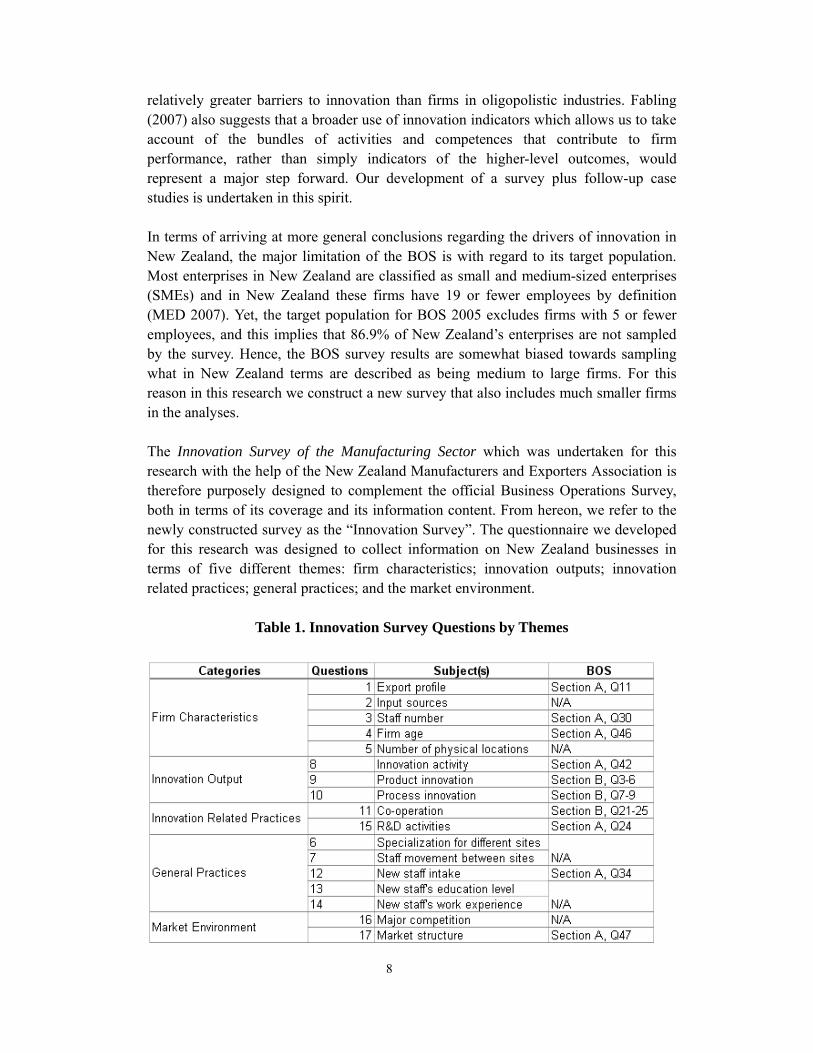
Table 1. Innovation Survey Questions by Themes
9
There were a total of 17 questions included in the final version of the Innovation Survey questionnaire. Table 1 lists the content of the questions and according to the nature of the subject, the questions are distributed into each of the five themes. Some of the questions were also included in the Business Operations Survey 2005, and we also include the BOS question listings where relevant. Unlike the official surveys, the responses to our Innovation Survey were all provided on a voluntary basis. In order to assist the response rates, the survey was designed to collect the required information as effortlessly as possible, in particular, categorical, multi-choice and numerical questions were widely used throughout the survey, with very few open-ended questions asked. In addition, instead of requesting actual figures for some of the numerical questions, respondents were asked to provide a percentage estimate. By sacrificing some accuracy, we not only encouraged the responses, but also respondents were more likely to reveal business characteristics, as various pieces of sensitive information, such as total sales and profit, were not requested. The Innovation Survey used the convenience sampling method by surveying all manufacturing firms, which are part of the New Zealand Manufacturers and Exporters Association (NZMEA) database. In November 2007 initial contact was made via a company e-mail, and survey invitations were addressed to either the Managing Director the General/Senior Manager. Two hyperlinks were listed at the bottom of the e-mail invitation. Survey participants could access the online survey by clicking on the first hyperlink. If preferred, participants could also print a PDF version of the survey questionnaire, which could be downloaded via the second hyperlink, and then send back the completed survey by fax. The two-version collection method was proposed to encourage responses. The on-line survey was open for three weeks after the initial invitation, during which period two e-mail reminders were sent during the second and the third week. Survey invitations were sent to 1274 manufacturing firms, out of which 75 responses were received by the end of the survey period, a response rate of 6 percent. Identification was made optional for completion of the survey, and only 32 respondents identified themselves by name. The available information suggested that most of the respondent firms were located in the Auckland in the North Island and the Christchurch (Canterbury) region in the South Island, with some respondents also from the Wellington, the West Coast and Southland regions. Such a distribution of firms confirmed that the sample exhibits a reasonable geographic coverage of the New Zealand manufacturing sector. The employment size distribution of the responding firms were as follows: 11 firms with 1-5 employees; 10 firms with 6-19 employees; 29 firms with 20-49 employees; 13 firms with 50-99 employees; 5 firms with 100-249 employees; 5 firms with 250-499 employees; and 2 firms with greater than 500 employees. As such, 21 firms accounting for 28% of the respondents are classified as small firms in New Zealand. However, in terms of the European Union SME definitions 68 firms accounting for 91% of the sample would be classified as SMEs, and in terms of the US definition of SMEs, 73 firms representing 97% of the sample would be classified as SMEs.
10
Detailed descriptions were provided on the questionnaire regarding what the firms should regard as innovations, and here we followed the principles set out in the Oslo Manual (OECD 2005). On the basis of the survey responses, for our analytical purposes in this paper we developed three indicators of innovation: a qualified innovator (QI), a product innovator (PI), and an operational process only innovator (OPI). Any firm which demonstrated some form of either product or process innovation during the last three financial years was classified as a qualified innovators (QI). The definition of a qualified innovator is a firm which during the last three financial years has developed or introduced a new or significantly improved product, service, operational process, organizational process, or marketing method. We then divided the qualified innovators into two sub-groups, namely product only innovators (PI) and operational process only innovators (OPI). The product only innovator (PI) is a firm innovation focus is solely on products and an operational process only innovator (OPI) is a firm which has a sole innovation focus on operational processes. The groups defined as PI and OPI are clearly both subsets of QI. Firms with no innovations in the previous three year period are treated as our reference group. The innovation group indicators QI, PI and OPI are categorical binary variables, which equal unity if a firm falls in the specified innovation group, and zero otherwise. Both linear and non-linear models can be used in this case. As already mentioned, when it comes to innovation and R&D issues the performance of New Zealand industry appears to be highly skewed relative to other international comparator cases. This observation, coupled with the fact that our sample size is not large, means that we have to allow for the possibility that our sample may also exhibit some small sample properties. For this reason we therefore estimate four different models, two of which are different types of linear probability models, plus a probit and a logit model.
3.2 Case Studies
Following our Innovation Survey, a series of follow-up studies were also undertaken during February 2008, whereby additional detailed information on the innovative behaviour of New Zealand manufacturing business could be collected. This enables us to provide additional inputs to the quantitative analysis and also gain insights into the questions or issues which were not directly addressed in the survey. In particular, the major aim of the case studies was to ascertain the extent to which the motives and approaches to innovation in New Zealand reflect those in reflected in the international literature. As has already been mentioned, the innovation performance of New Zealand is relatively poor by OECD standards. Therefore, as well as using the innovation survey to identify the firm and industry characteristics which influence innovation behaviour, the case studies allow us to assess the extent to which motives and perceptions may also play a role. As is well known, motivations and opportunities are critical for entrepreneurship and innovation (Acs et al. 2008).
11
The case studies covered manufacturing firms in the Auckland and Christchurch regions. The focus on these two urban areas is because they are the two largest industrial centers with relatively high concentrations of manufacturing firms. The case participants were firms which already responded to our on-line survey and who were prepared to be involved in the study. Seven out of 24 willing companies were eliminated, as they were located outside of the targeted regions and two other firms, one from each city, were not able to be involved for other reasons. As a result, 15 company case studies were undertaken, which is acceptable level of coverage for mixed methods research of this type (Mariampolski 2001). The case studies each took the form of semi-structured face-to-face interviews. The informants were typically the Managing Director or General Manager of the company. A list of interview questions was sent to interviewee(s) two weeks prior to the interview session, and these questions focused upon four main areas of enquiry:
• The business perspective on innovation, and the extent to which the firm recognizes the difference between technological and non-technological related innovations.
• The underlying motivation for innovation, and more specifically, what the firm perceives to be the major sources and drivers of innovation and what factors are regarded as being important for the innovation process.
• The role of staff and skills in innovation, and also the extent to which labour or skills shortages are a problem for the business.
• The role played by market size, geography, and exporting in promoting innovation.
Very little structure was imposed on the interviews. By asking open-ended questions the informants were able to express their opinions using their own constructs. As the interviews progressed, follow-up questions were asked to elicit greater detail or clarification. The interviews ranged from 40 to 90 minutes.
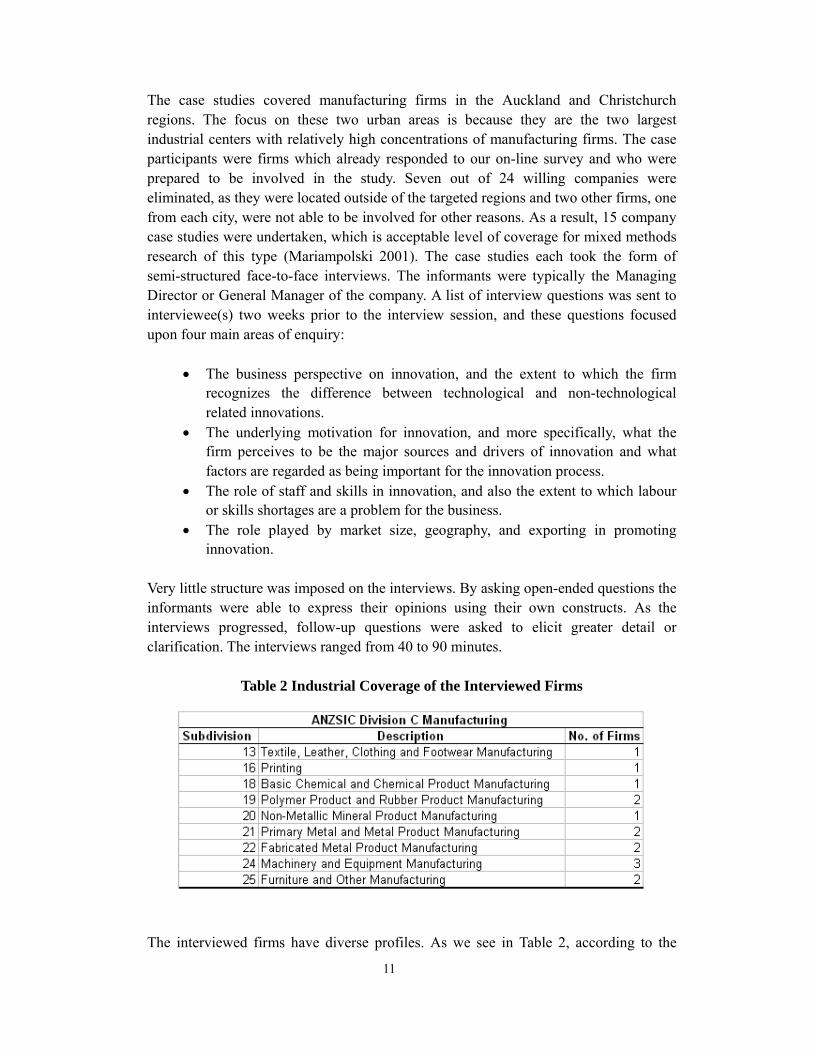
Table 2 Industrial Coverage of the Interviewed Firms
The interviewed firms have diverse profiles. As we see in Table 2, according to the
12
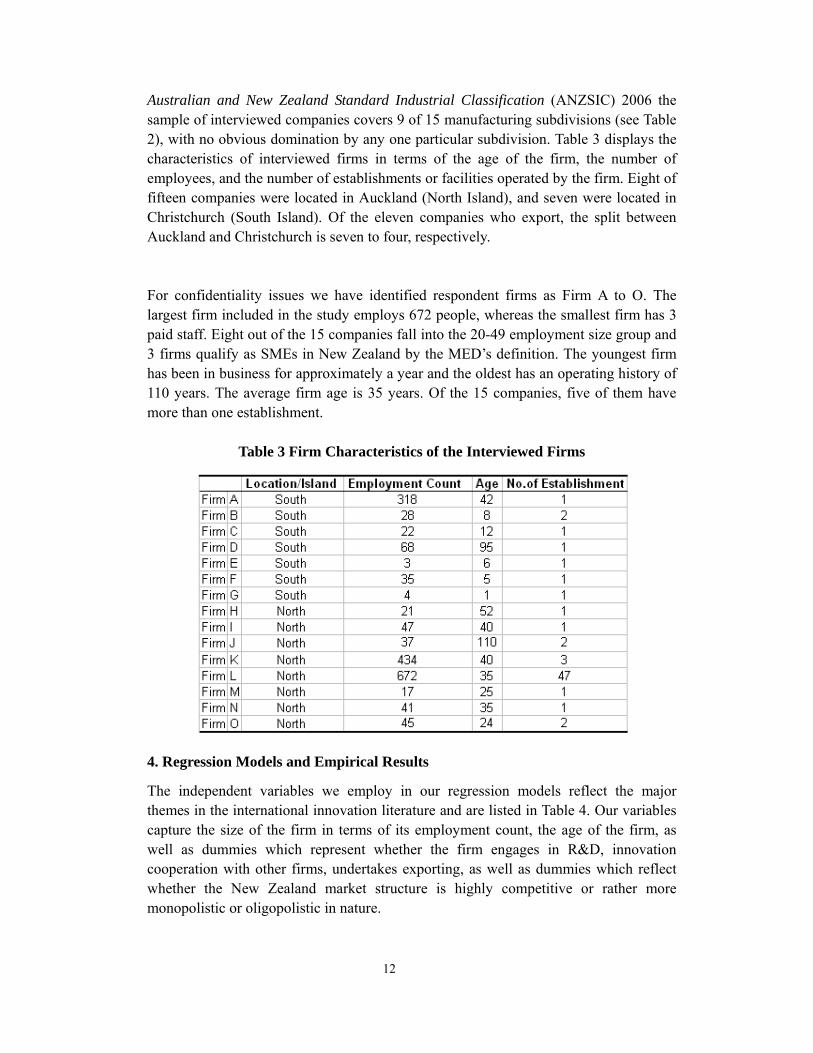
Australian and New Zealand Standard Industrial Classification (ANZSIC) 2006 the sample of interviewed companies covers 9 of 15 manufacturing subdivisions (see Table 2), with no obvious domination by any one particular subdivision. Table 3 displays the characteristics of interviewed firms in terms of the age of the firm, the number of employees, and the number of establishments or facilities operated by the firm. Eight of fifteen companies were located in Auckland (North Island), and seven were located in Christchurch (South Island). Of the eleven companies who export, the split between Auckland and Christchurch is seven to four, respectively. For confidentiality issues we have identified respondent firms as Firm A to O. The largest firm included in the study employs 672 people, whereas the smallest firm has 3 paid staff. Eight out of the 15 companies fall into the 20-49 employment size group and 3 firms qualify as SMEs in New Zealand by the MED’s definition. The youngest firm has been in business for approximately a year and the oldest has an operating history of 110 years. The average firm age is 35 years. Of the 15 companies, five of them have more than one establishment.
Table 3 Firm Characteristics of the Interviewed Firms
4. Regression Models and Empirical Results
The independent variables we employ in our regression models reflect the major themes in the international innovation literature and are listed in Table 4. Our variables capture the size of the firm in terms of its employment count, the age of the firm, as well as dummies which represent whether the firm engages in R&D, innovation cooperation with other firms, undertakes exporting, as well as dummies which reflect whether the New Zealand market structure is highly competitive or rather more monopolistic or oligopolistic in nature.
13
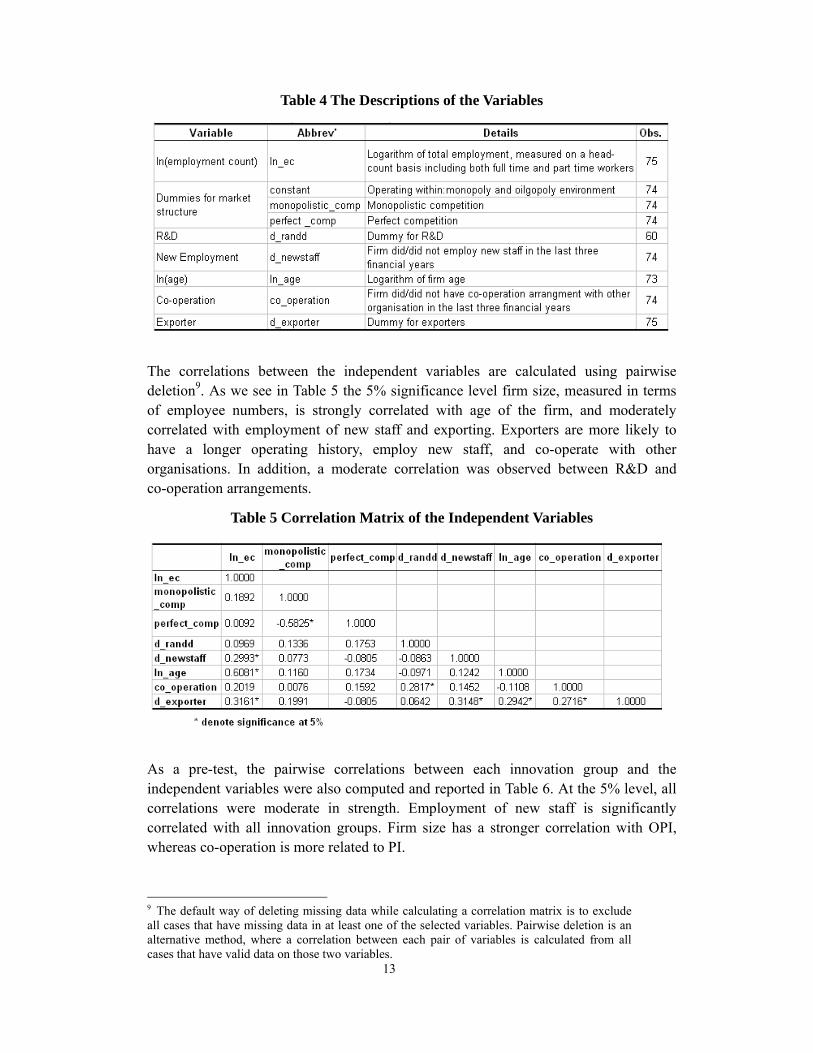
Table 4 The Descriptions of the Variables
The correlations between the independent variables are calculated using pairwise deletion9. As we see in Table 5 the 5% significance level firm size, measured in terms of employee numbers, is strongly correlated with age of the firm, and moderately correlated with employment of new staff and exporting. Exporters are more likely to have a longer operating history, employ new staff, and co-operate with other organisations. In addition, a moderate correlation was observed between R&D and co-operation arrangements.
Table 5 Correlation Matrix of the Independent Variables
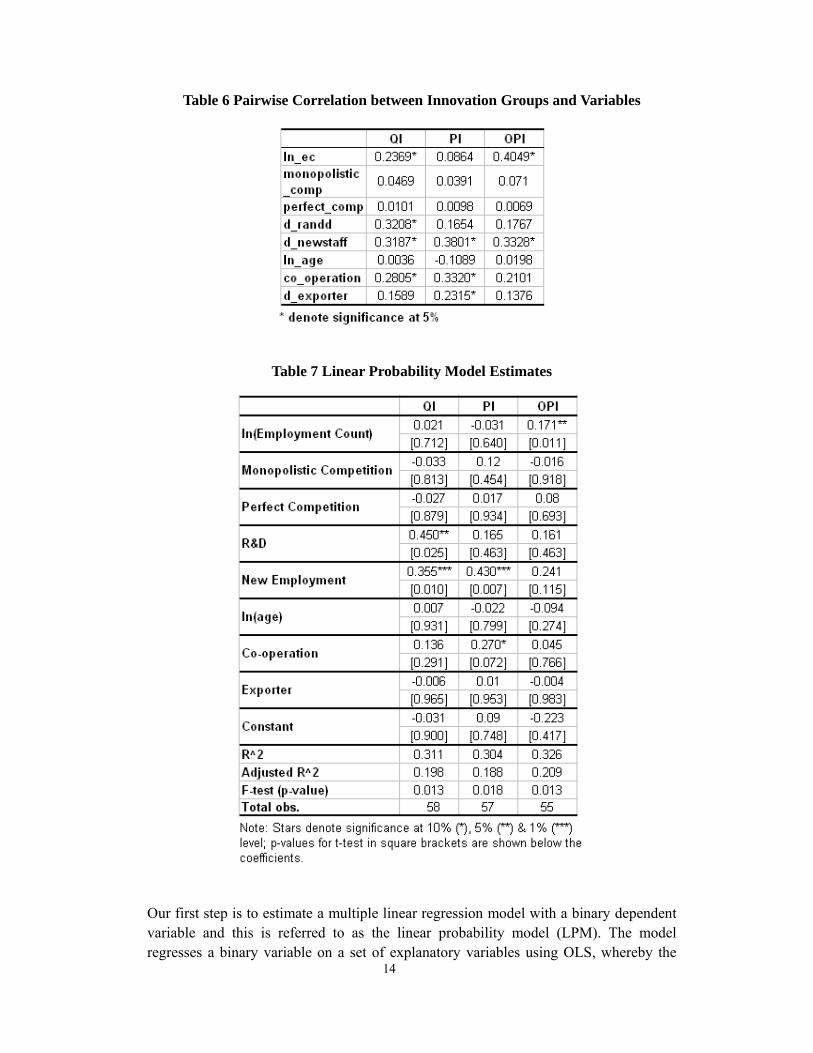
As a pre-test, the pairwise correlations between each innovation group and the independent variables were also computed and reported in Table 6. At the 5% level, all correlations were moderate in strength. Employment of new staff is significantly correlated with all innovation groups. Firm size has a stronger correlation with OPI, whereas co-operation is more related to PI.
9 The default way of deleting missing data while calculating a correlation matrix is to exclude all cases that have missing data in at least one of the selected variables. Pairwise deletion is an alternative method, where a correlation between each pair of variables is calculated from all cases that have valid data on those two variables.
14
Table 6 Pairwise Correlation between Innovation Groups and Variables
Table 7 Linear Probability Model Estimates
Our first step is to estimate a multiple linear regression model with a binary dependent variable and this is referred to as the linear probability model (LPM). The model regresses a binary variable on a set of explanatory variables using OLS, whereby the
15
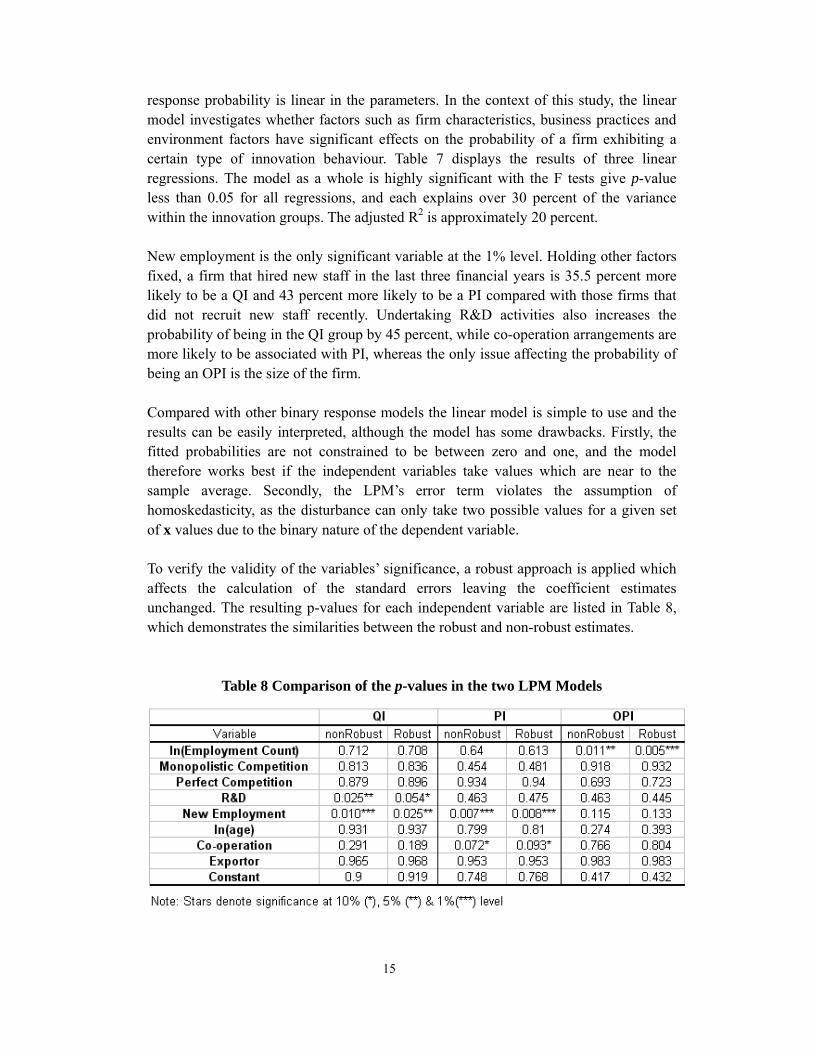
response probability is linear in the parameters. In the context of this study, the linear model investigates whether factors such as firm characteristics, business practices and environment factors have significant effects on the probability of a firm exhibiting a certain type of innovation behaviour. Table 7 displays the results of three linear regressions. The model as a whole is highly significant with the F tests give p-value less than 0.05 for all regressions, and each explains over 30 percent of the variance within the innovation groups. The adjusted R2 is approximately 20 percent. New employment is the only significant variable at the 1% level. Holding other factors fixed, a firm that hired new staff in the last three financial years is 35.5 percent more likely to be a QI and 43 percent more likely to be a PI compared with those firms that did not recruit new staff recently. Undertaking R&D activities also increases the probability of being in the QI group by 45 percent, while co-operation arrangements are more likely to be associated with PI, whereas the only issue affecting the probability of being an OPI is the size of the firm. Compared with other binary response models the linear model is simple to use and the results can be easily interpreted, although the model has some drawbacks. Firstly, the fitted probabilities are not constrained to be between zero and one, and the model therefore works best if the independent variables take values which are near to the sample average. Secondly, the LPM’s error term violates the assumption of homoskedasticity, as the disturbance can only take two possible values for a given set of x values due to the binary nature of the dependent variable. To verify the validity of the variables’ significance, a robust approach is applied which affects the calculation of the standard errors leaving the coefficient estimates unchanged. The resulting p-values for each independent variable are listed in Table 8, which demonstrates the similarities between the robust and non-robust estimates.
Table 8 Comparison of the p-values in the two LPM Models

16
Finally, we also have to allow for the fact that the relationship between the outcome probability and the independent variables may not be linear even as an approximation, and therefore we must also employ a non-linear model such as a probit or logit model to allow for this possibility.
The construction of both of these non-linear models is based upon a latent-variable
approach. Here a variable *iy is the net benefit of taking a particular course of action
and the outcome of the action iy are depended on *iy such that:
0=iy if 0* ≤iy and 1=iy if 0* >iy
However, only the binary outcome of the action (i.e. the innovation group identity) can
be observed, while *iy is a the latent variable that can be directly explained by the set of
explanatory variables:
iiii uxy += β*.
Therefore:
)()1(Pr)(Pr)(Pr)0(Pr **iiii yyxuxuy Ψ===<=−>=> ββ
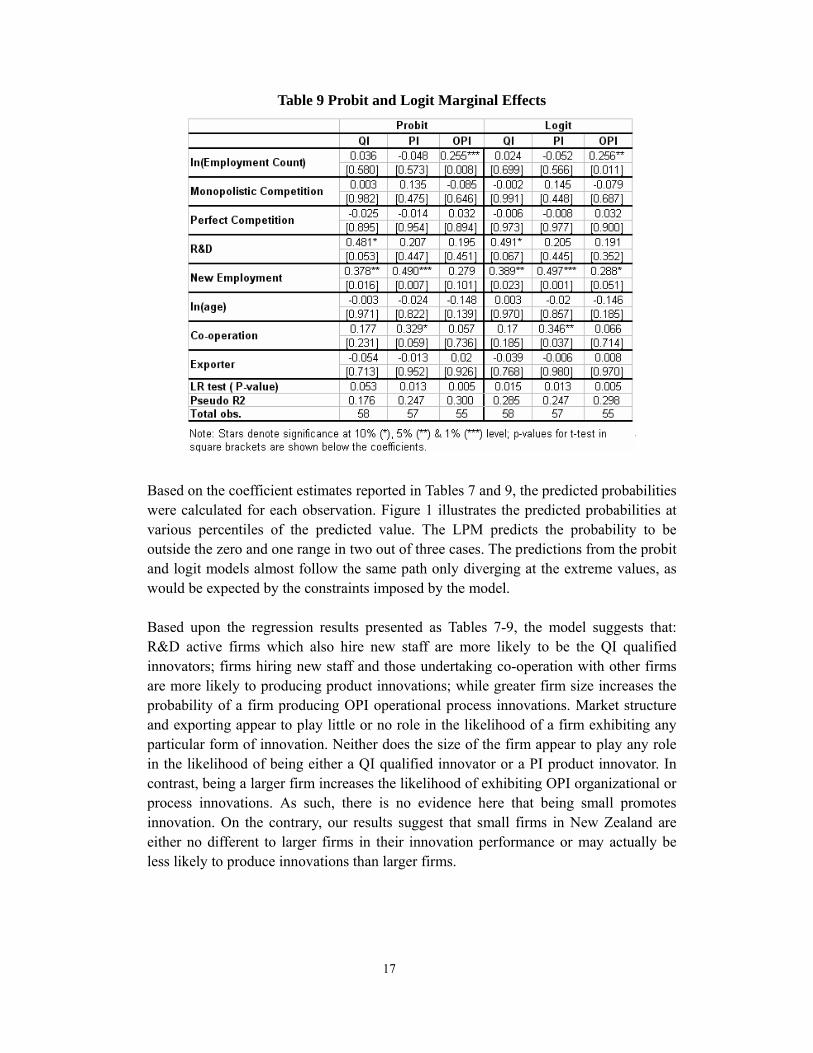
where Ψ(·) is a cumulative distribution function (CDF). For the probit model, Ψ(·) is the CDF of the normal distribution and the logit model bases its estimates on a logistic distribution. The CDF of the normal and logistic distribution are very similar to each other except in the tails. Table 9 shows the marginal effects obtained from the non-linear models. The variables found to have a significant effect on each innovation group are the same in the LPM, but with slightly higher marginal effects. The likelihood ratio tests results show that all regressions produce a p-value below 5%, except for the QI probit regression, which passed the test at 10% level. The regressions produced pseudo-R2 values of between 17.6 and 30 percent, and values of 0.2 or above are regarded as being very good (McFadden 1979; Louviere et al. 2000).
17
Table 9 Probit and Logit Marginal Effects
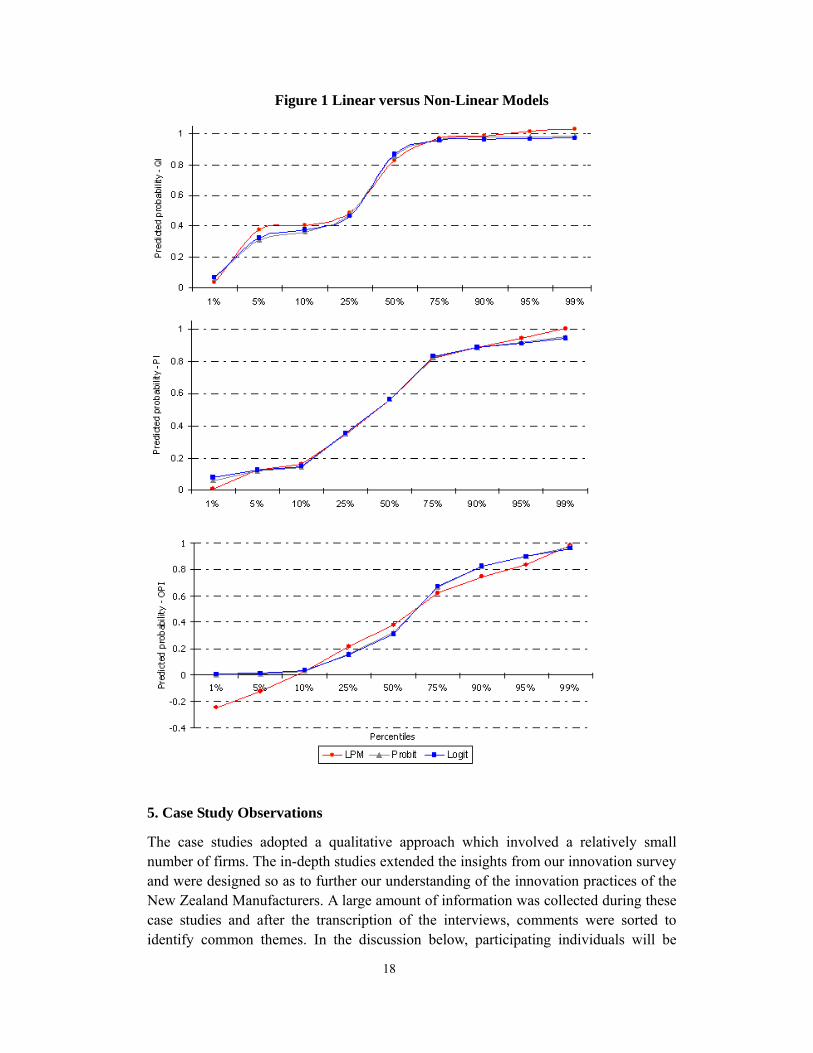
Based on the coefficient estimates reported in Tables 7 and 9, the predicted probabilities were calculated for each observation. Figure 1 illustrates the predicted probabilities at various percentiles of the predicted value. The LPM predicts the probability to be outside the zero and one range in two out of three cases. The predictions from the probit and logit models almost follow the same path only diverging at the extreme values, as would be expected by the constraints imposed by the model. Based upon the regression results presented as Tables 7-9, the model suggests that: R&D active firms which also hire new staff are more likely to be the QI qualified innovators; firms hiring new staff and those undertaking co-operation with other firms are more likely to producing product innovations; while greater firm size increases the probability of a firm producing OPI operational process innovations. Market structure and exporting appear to play little or no role in the likelihood of a firm exhibiting any particular form of innovation. Neither does the size of the firm appear to play any role in the likelihood of being either a QI qualified innovator or a PI product innovator. In contrast, being a larger firm increases the likelihood of exhibiting OPI organizational or process innovations. As such, there is no evidence here that being small promotes innovation. On the contrary, our results suggest that small firms in New Zealand are either no different to larger firms in their innovation performance or may actually be less likely to produce innovations than larger firms.
18
Figure 1 Linear versus Non-Linear Models
5. Case Study Observations
The case studies adopted a qualitative approach which involved a relatively small number of firms. The in-depth studies extended the insights from our innovation survey and were designed so as to further our understanding of the innovation practices of the New Zealand Manufacturers. A large amount of information was collected during these case studies and after the transcription of the interviews, comments were sorted to identify common themes. In the discussion below, participating individuals will be
19
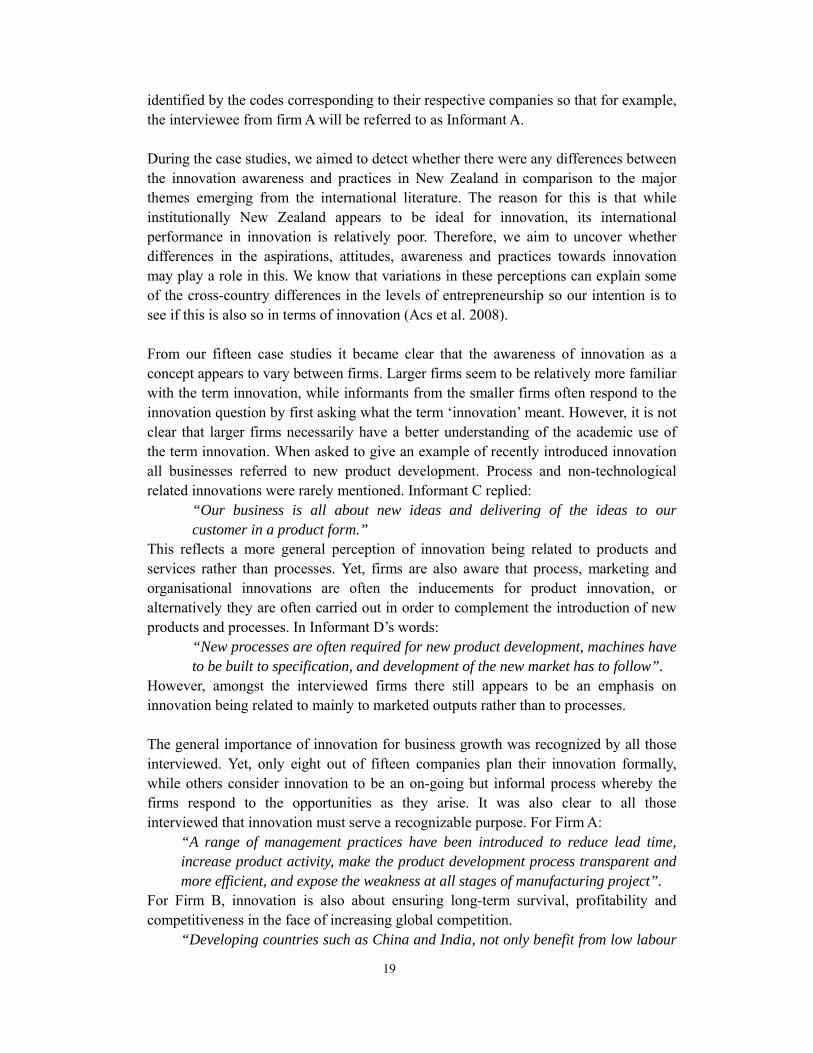
identified by the codes corresponding to their respective companies so that for example, the interviewee from firm A will be referred to as Informant A. During the case studies, we aimed to detect whether there were any differences between the innovation awareness and practices in New Zealand in comparison to the major themes emerging from the international literature. The reason for this is that while institutionally New Zealand appears to be ideal for innovation, its international performance in innovation is relatively poor. Therefore, we aim to uncover whether differences in the aspirations, attitudes, awareness and practices towards innovation may play a role in this. We know that variations in these perceptions can explain some of the cross-country differences in the levels of entrepreneurship so our intention is to see if this is also so in terms of innovation (Acs et al. 2008). From our fifteen case studies it became clear that the awareness of innovation as a concept appears to vary between firms. Larger firms seem to be relatively more familiar with the term innovation, while informants from the smaller firms often respond to the innovation question by first asking what the term ‘innovation’ meant. However, it is not clear that larger firms necessarily have a better understanding of the academic use of the term innovation. When asked to give an example of recently introduced innovation all businesses referred to new product development. Process and non-technological related innovations were rarely mentioned. Informant C replied:
“Our business is all about new ideas and delivering of the ideas to our customer in a product form.”
This reflects a more general perception of innovation being related to products and services rather than processes. Yet, firms are also aware that process, marketing and organisational innovations are often the inducements for product innovation, or alternatively they are often carried out in order to complement the introduction of new products and processes. In Informant D’s words:
“New processes are often required for new product development, machines have to be built to specification, and development of the new market has to follow”.
However, amongst the interviewed firms there still appears to be an emphasis on innovation being related to mainly to marketed outputs rather than to processes. The general importance of innovation for business growth was recognized by all those interviewed. Yet, only eight out of fifteen companies plan their innovation formally, while others consider innovation to be an on-going but informal process whereby the firms respond to the opportunities as they arise. It was also clear to all those interviewed that innovation must serve a recognizable purpose. For Firm A:
“A range of management practices have been introduced to reduce lead time, increase product activity, make the product development process transparent and more efficient, and expose the weakness at all stages of manufacturing project”.
For Firm B, innovation is also about ensuring long-term survival, profitability and competitiveness in the face of increasing global competition.
“Developing countries such as China and India, not only benefit from low labour

20
costs, but they are often protected by tariffs and government subsidies. Considering the scale of their production, New Zealand manufacturers have no or very little chance to compete in terms of price competition. In order to survive under such huge competitive pressures, we need to find the right market and live in the niche.”
The reason why New Zealand firms should focus innovations on niche markets is a question of scale. As Informant M points out is that a,
“typical niche market is generally ignored by the bigger players. It demands high-value added, high quality products that are highly specialized, customized and potentially difficult to make.”
Bigger firms will almost invariably come from other countries so the much smaller New Zealand firms need to focus on niche markets in order to compete internationally. However, this New Zealand focus on niche markets does not mean ignorance of the bigger markets. Informant I argues that,
“a successful company will need to find a balance between the mainstream and the innovative market”.
One way of achieving this, as Firm G does, is to try to access the larger markets using the so-called ‘piggyback method’ that first attracts customers using the specialized New Zealand niche product and then follows this up with a more conventional product when a supplier-customer relationship is firmly in place. Once the supplier-customer relationship is firmly established, the international customer may be willing to pay a slightly higher price in order to ensure convenience and a guaranteed quality of product from New Zealand. These types of approaches which focus on the exploitation of niche markets enable many small New Zealand firms to better deal with market and economic uncertainties. The sources of innovative ideas employed by the interviewed firms were also very diverse. Both internal and external sources are important and characteristics such as creativity, ingenuity and forward-thinking are regarded as invaluable for innovation. As Informant B point argues;
“always think ahead, discover the profit potential in the sunshine industry and improve the production process to make it a more environmentally friendly product”.
It is also regarded as being very important for a firm to continually update its understanding of its target market. Informant D states that:
“our sales person regularly receives feedbacks from existing customers and collects new ideas and market information from trade fairs”.
Co-operation with other firms and exporting are also both regarded as providing additional innovation opportunities for New Zealand firms. Eleven of the 15 companies were exporters, and all of them consider Australia to be their major export market or the export market with the greatest growth potential for New Zealand firms. Four non-exporters within the group are either considering exporting in the near future or they are already part of export value chain, which means they supply goods and services to other exporters. Under various circumstances, these forms of co-operation

21
can therefore be either a substitute or complement to exports. The final theme to emerge from all of the interviewed firms was the importance for innovation of face-to-face contact. All of the firms stressed the need for regular face-to-face contact with suppliers and customers in order to assess market developments and to acquire new knowledge, the basis for all innovations. As informant J noted:
“it is essential to be close to the market, face to face contact and networking is essential”.
At the same time, the isolation and small scale of the local New Zealand economy was mentioned by eights of the firms as being a major problem for growth and innovation. In order to help overcome these problems and to grow the business three of the firms are explicitly aiming to increase their exports to Australia. 6. Discussion and Conclusions The evidence gained from the fifteen case studies suggests that in general the innovation approaches in New Zealand are largely consistent with the benchmark approaches evident in the international literature. New Zealand firms acquire best-practice information from a wide variety of sources and their business practices are up to date with the types of discussion taking place in other countries. There is a generally high level of awareness of the importance of innovation and an awareness of the issues driving innovation. This general awareness of innovation issues is also reflected by the fact that the number of per capita scientific papers produced by New Zealand is high by international standards (OECD 2007b). As well as a high level of awareness, the highly liberalized and transparent New Zealand institutional environment is almost ideal for promoting entrepreneurship. The combination of awareness and institutions produces a society with the highest level of entrepreneurship in the world (Acs and Szerb 2009). Yet, this high level of entrepreneurship is not translated into an equivalent innovation performance. Although taking a broader perspective the innovation performance of New Zealand is probably stronger than many existing indicators imply (Fabling 2007), there still appears to be performance gap when moving from entrepreneurship to innovation. On the basis of this research, we would suggest that the likely reasons for this are related to the small size of the firms, the small size of the market, and the level of geographical isolation. While New Zealand’s innovation performance is good if we control for market and firm size, distance and sectoral composition (Crawford et al. 2007), the point remains that New Zealand’s scale and geography may be disadvantageous in terms of translating entrepreneurship into innovation. One particular aspect of this is that in the case of New Zealand the smallness and isolation of the economy appears to produce a different relationship between firm size and innovation performance in comparison to most other countries. As we have seen, our results suggest that in New Zealand’s small firms do not have an advantage in terms

22
of the generation of innovations, and in some cases larger firms have an advantage. Our observation is also consistent with other New Zealand findings (Fabling and Grimes 2007) which also suggest that firm success is either independent of firm size, or in some cases is positively related to the existence of oligopolistic structures. In contrast, our findings and the findings of Fabling and Grimes (2007) are rather different to the findings in many other countries in which small firms are found to be more innovative. While small firms may generally be considered to be advantageous for innovation in other countries, the weaker innovation performance of New Zealand suggests that there may still be a minimum size threshold above which small scale is advantageous. As such, part of the reason why the innovation advantage of being small does not appear to operate in New Zealand might be an absolute scale issue. Being a small firm in New Zealand implies being a micro or a nano-firm in many other countries, and it may be that these micro or nano-firms are simply be too small to maintain the levels of R&D and market research required in order to generate anything other than ad hoc occasional innovations rather than a large scale continuous stream of innovations. In a country such as New Zealand, in order to promote increased innovation and exports it may be the case that public policy should therefore be geared towards increasing the size of firms rather than reducing them, and this has already been advocated elsewhere (Skilling and Boven 2006). Similar arguments also relate to the scale and isolation of the local market. Although we have not explicitly examined these issues econometrically, the case study evidence of the New Zealand economy is so small and isolated that the conventional arguments regarding the impacts of market structure, trade and size on innovation may also carry much less weight in this particular context. New Zealand is already very highly deregulated and competitive with large numbers of tiny firms. Yet, ironically, New Zealand’s combination of small national market size, small city size, small firm size distribution, and extreme geographical isolation (McCann 2009) mean that highly competitive markets may not be the ideal market structure for translating local entrepreneurship into local innovation. As such, in spite of an almost ideal institutional context for entrepreneurship and innovation, the relatively weaker innovation performance of New Zealand may therefore be primarily related to the specific set of structural and geographical features of the local economy. In New Zealand, it is questionable whether the classic U-shape relationship between innovation intensity and firm size, as suggested by the international literature, really holds.
23
References Acs, Z.J., 2002, Innovation and the Growth of Cities, Edward Elgar, Cheltenham Acs, Z. J., and Audretsch, D. B., 1988, “Innovation and Large and Small Firms: An Empirical Analysis”, American Economic Review, 78.4, 678-690 Acs, Z.J., Bosma, N., and Sterberg, R, 2008, The Entrepreneurial Advantage of World Cities: Evidence from Global Entrepreneurship Monitor Data, Working Paper, H200810, SCALES, University of Utrecht and Netherlands Ministry of Economic Affairs Acs, Z.J., and Szerb, L., 2009, “The Global Entrepreneurship Index (GEINEX) and the Stages of Economic Development”, Working Paper, Global Entrepreneurship Monitor Crawford, R., Fabling, R., Grimes, A., and Bonner, N., 2007, “National R&D and Patenting: Is New Zealand an Outlier?”, New Zealand Economic Papers, 41.1 European Commission, 2003, The New SME Definition: User Guide and Model Declaration, Enterprise and Industry Publication, European Commission, Brussels Evans, L., Grimes, A., Teece, D., and Wilkinson, B., 1996, “Economic Reform in New Zealand 1984-95: The Pursuit of Efficiency”, Journal of Economic Literature, 34, 1856-1902 Fabling, R., 2007, “How Innovative are New Zealand Firms? Quantifying and Relating Organizational and Marketing Innovation to Traditional Science and Technology Indicators”, in Science, Technology and Innovation Indicators in a Changing World: Responding to Policy Needs, OECD, Paris Fabling, R., and Grimes, A., 2007, “Practice Makes Profit: Business Practices and Firm Success”, Small Business Economics, 29, 383-399 Gerardin, D., and Kerr, M., 2003, Controlling Market Power in Telecommunications, Oxford University Press, Oxford Hall, J., and Casey, A., 2006, “International Comparative Surveys of Regulatory Impact”, New Zealand Treasury Working Paper 06-05, Wellington IMF, 2004, New Zealand: Selected Issues, IMF Country Report No 04/127, International Monetary Fund, Washington DC Law, D., and McLellan, N., 2005, “The Contributions from Firm Entry, Exit and Continuation to Labour Productivity Growth in New Zealand”, New Zealand Treasury
24
Working Paper 05-01, Wellington Louviere, J.J., Hensher, D.A., and Swait, J.D., 2000, Stated Choice Methods, Cambridge University Press, Cambridge Mariampolski, H., 2001, Qualitative Market Research: A Comprehensive Guide, Sage Publications, Thousand Oaks, CA McCann, P., 2009, “Economic Geography, Globalisation and New Zealand’s Productivity Paradox”, 2009, New Zealand Economic Papers, 42.3, Forthcoming McFadden, D., 1979, ”Quantitative Methods for Analysing Travel Behaviour of Individuals, in Hensher, D.A., and Storper, P.R., (eds.), Behavioural Travel Modelling, Croom Helm, London
MED-Treasury 2005, Economic Development Indicators 2005: Growth Through Innovation, Ministry of Economic Development and The Treasury, Wellington
MED, 2007, Economic Development Indicators, Ministry of Economic Development, The Treasury and Statistics New Zealand, Wellington
OECD 2005, Oslo Manual: Guidelines for Collecting and Interpreting Innovation Data, Organisation for Economic Cooperation and Development, Paris OECD, 2007a, OECD Science, Technology and Industry Scoreboard 2007, Organisation for Economic Cooperation and Development, Paris OECD, 2007b, OECD Reviews of Innovation Policy: New Zealand, OECD, Paris
OECD 2007c, Competitive Cities in the Global Economy, Organisation for Economic Cooperation and Development, Paris
OECD 2008a, OECD Factbook 2008: Economic, Environmental and Social Statistics, Organisation for Economic Cooperation and Development, Paris
OECD 2008b, Economic Policy Reforms: Going for Growth, Organisation for Economic Cooperation and Development, Paris
25
OECD, 2008c, The Contribution of Economic Geography to GDP per Capita, Economics Department Working Paper, Organisation for Economic Cooperation and Development, Paris
Porter, M.E., Sala-i-Martin, X., and Schwab, K., 2007, World Economic Forum: The Global Competitiveness Report, Palgrave, Basingstoke Roper, S. and Hewitt-Dundas, N. 2008, “Innovation Persistence: Survey and Case-Study Evidence, Research Policy, 37, 149-162 Skilling, D., and Boven, D., 2006, “Developing Kiwi Global Champions: Growing Successful New Zealand Multinational Companies”, Discussion Paper 2006-03, New Zealand Institute, Auckland Tether, B.S., Smith, I.J., and Thwaites, A.T., 1997, “Smaller Enterprises and Innovation in the UK: The SPRU Innovations Database Revisited”, Research Policy, 26, 19-32 World Bank, 2009, Doing Business 2009, Washington DC