Innovation Has a Name....strong water heater and boiler sales in North America, as well as notable...
88
Innovation Has a Name. 2018 ANNUAL REPORT
Transcript of Innovation Has a Name....strong water heater and boiler sales in North America, as well as notable...

Innovation Has a Name.2018 ANNUAL REPORT

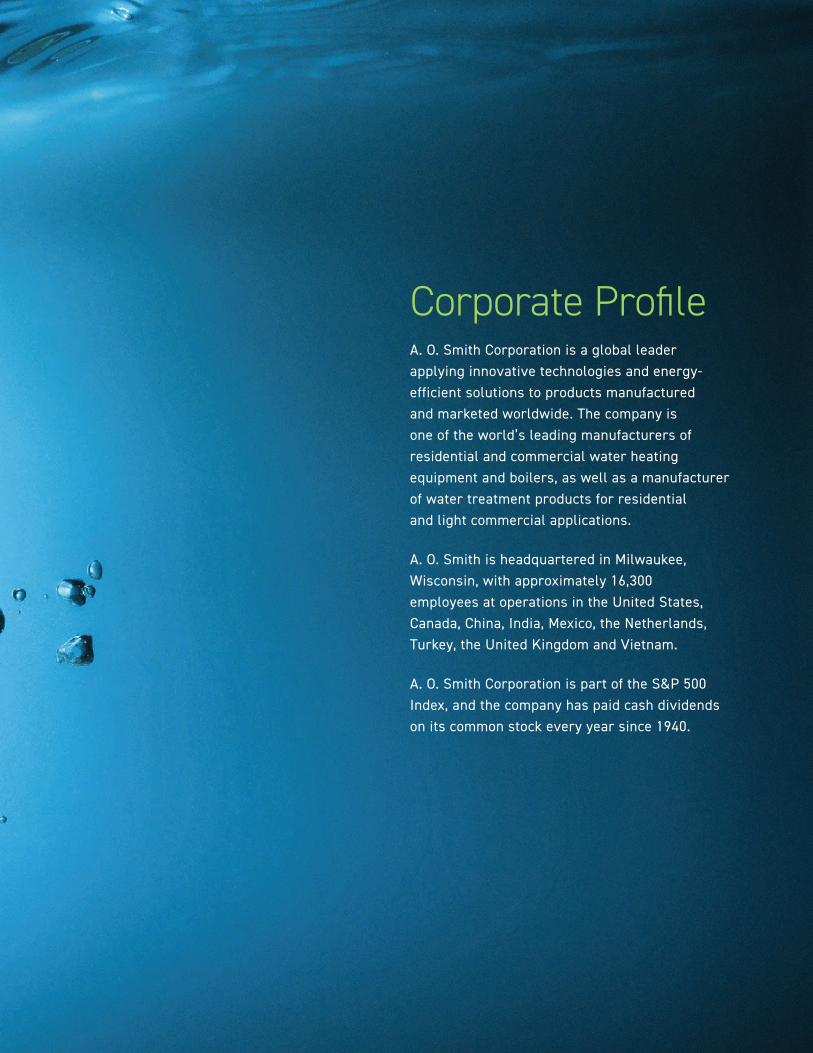
Corporate ProfileA. O. Smith Corporation is a global leader applying innovative technologies and energy-efficient solutions to products manufactured and marketed worldwide. The company is one of the world’s leading manufacturers of residential and commercial water heating equipment and boilers, as well as a manufacturer of water treatment products for residential and light commercial applications.
A. O. Smith is headquartered in Milwaukee, Wisconsin, with approximately 16,300 employees at operations in the United States, Canada, China, India, Mexico, the Netherlands, Turkey, the United Kingdom and Vietnam.
A. O. Smith Corporation is part of the S&P 500 Index, and the company has paid cash dividends on its common stock every year since 1940.

NET SALES
$3.2 BILLION 2018
2014$2.36
2015$2.54
2016$2.69
2017$3.00
2018$3.20
DOLLARS IN BILLIONS
ADJUSTED EARNINGS PER SHARE*
$2.61 PER SHARE 2018
2014$1.22
2015$1.58
2016$1.85
2017$2.17
2018$2.61
DOLLARS *2014, 2017 and 2018 earnings per share are non-GAAP.
DIVIDENDS
5-YEAR DIVIDEND CAGR: 30%
By the Numbers2018 marked another year of growth for A. O. Smith Corporation with strong water heater and boiler sales in North America, as well as notable gains in the global water treatment market. The 5-year compound annual growth rate of A. O. Smith’s dividend is 30 percent.
$0.80
$0.70
$0.60
$0.50
$0.40
$0.30
$0.20
$0.10
$0.00
2009$0.13
2010$0.14
2011$0.15
2012$0.18
2013$0.23
2014$0.30
2015$0.38
2016$0.48
2017$0.56
2018$0.76

Global LocationsA. O. Smith Corporation has a strong and growing presence around the globe. Employees live and work in 12 countries, and serve customers in more than 60 countries around the world.
Milwaukee, WI (world headquarters)
Ashland City, TN
Austin, TX
Banbury, England
Bangalore, India
Bourges, France
Charlotte, NC
Cookeville, TN
Dubai, United Arab Emirates
El Paso, TX
Fergus, Canada
Florence, KY
Franklin, TN
Groveport, OH
Haltom City, TX
Hanoi, Vietnam
Hong Kong SAR
Istanbul, Turkey
Johnson City, TN
Juarez, Mexico
Knoxville, TN
Lebanon, TN
McBee, SC
Nanjing, China
Stratford, Canada
Veldhoven, the Netherlands
Registrar. Stock Transfer Agent, Dividend Reinvestment Agent (for both classes of stock)
EQ Shareowner Services 1110 Centre Pointe Curve, Suite 101 Mendota Heights, MN 55120
800-468-9716
www.shareowneronline.com
Annual Meeting
The 2019 annual meeting of shareholders will be held on Tuesday, April 9, 2019, at 8:00 a.m. (CDT) at the Lloyd R. Smith Corporate Technology Center, 11000 W. Park Place, Milwaukee, WI.
Letter to ShareholdersMARCH 2019
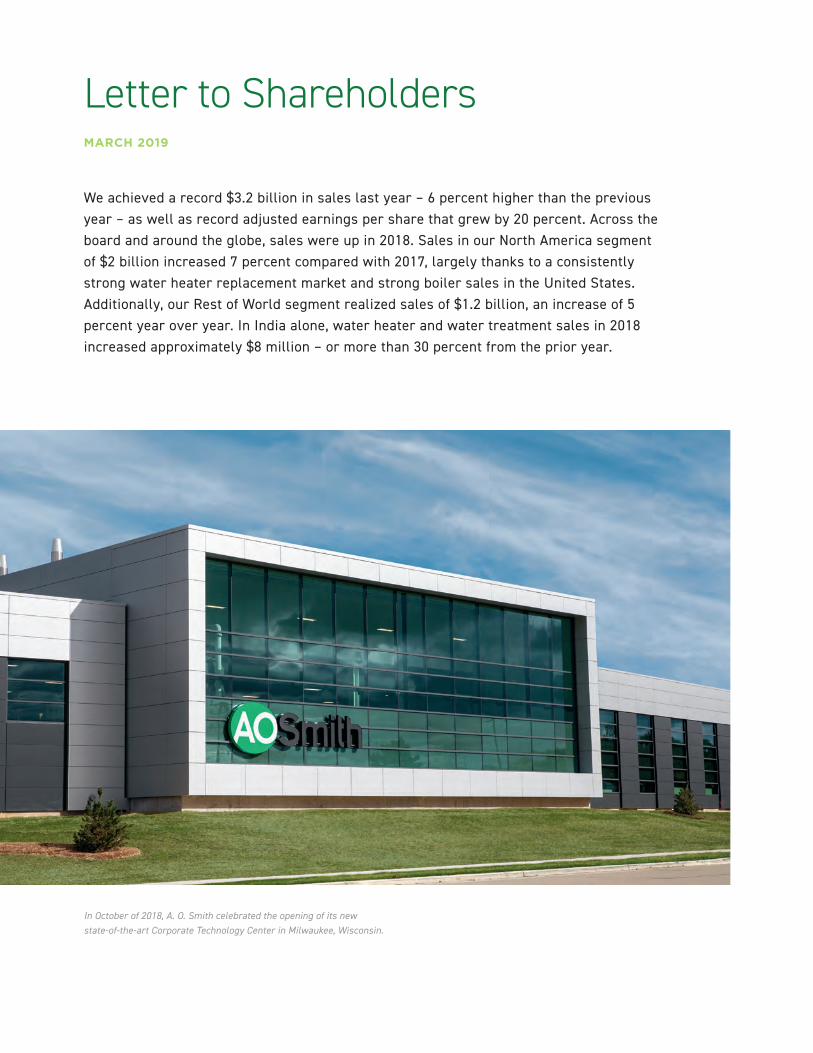
We achieved a record $3.2 billion in sales last year – 6 percent higher than the previous year – as well as record adjusted earnings per share that grew by 20 percent. Across the board and around the globe, sales were up in 2018. Sales in our North America segment of $2 billion increased 7 percent compared with 2017, largely thanks to a consistently strong water heater replacement market and strong boiler sales in the United States. Additionally, our Rest of World segment realized sales of $1.2 billion, an increase of 5 percent year over year. In India alone, water heater and water treatment sales in 2018 increased approximately $8 million – or more than 30 percent from the prior year.
In October of 2018, A. O. Smith celebrated the opening of its new state-of-the-art Corporate Technology Center in Milwaukee, Wisconsin.
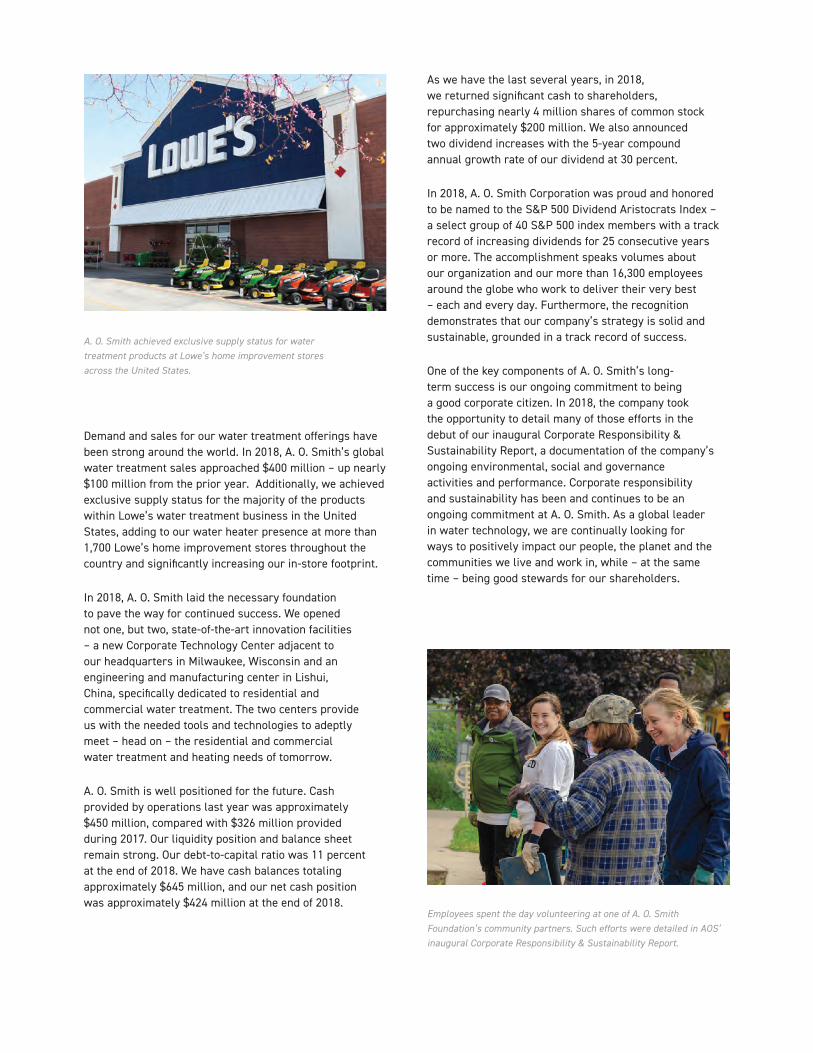
Demand and sales for our water treatment offerings have been strong around the world. In 2018, A. O. Smith’s global water treatment sales approached $400 million – up nearly $100 million from the prior year. Additionally, we achieved exclusive supply status for the majority of the products within Lowe’s water treatment business in the United States, adding to our water heater presence at more than 1,700 Lowe’s home improvement stores throughout the country and significantly increasing our in-store footprint.
In 2018, A. O. Smith laid the necessary foundation to pave the way for continued success. We opened not one, but two, state-of-the-art innovation facilities – a new Corporate Technology Center adjacent to our headquarters in Milwaukee, Wisconsin and an engineering and manufacturing center in Lishui, China, specifically dedicated to residential and commercial water treatment. The two centers provide us with the needed tools and technologies to adeptly meet – head on – the residential and commercial water treatment and heating needs of tomorrow.
A. O. Smith is well positioned for the future. Cash provided by operations last year was approximately $450 million, compared with $326 million provided during 2017. Our liquidity position and balance sheet remain strong. Our debt-to-capital ratio was 11 percent at the end of 2018. We have cash balances totaling approximately $645 million, and our net cash position was approximately $424 million at the end of 2018.
As we have the last several years, in 2018, we returned significant cash to shareholders, repurchasing nearly 4 million shares of common stock for approximately $200 million. We also announced two dividend increases with the 5-year compound annual growth rate of our dividend at 30 percent.
In 2018, A. O. Smith Corporation was proud and honored to be named to the S&P 500 Dividend Aristocrats Index – a select group of 40 S&P 500 index members with a track record of increasing dividends for 25 consecutive years or more. The accomplishment speaks volumes about our organization and our more than 16,300 employees around the globe who work to deliver their very best – each and every day. Furthermore, the recognition demonstrates that our company’s strategy is solid and sustainable, grounded in a track record of success.
One of the key components of A. O. Smith’s long-term success is our ongoing commitment to being a good corporate citizen. In 2018, the company took the opportunity to detail many of those efforts in the debut of our inaugural Corporate Responsibility & Sustainability Report, a documentation of the company’s ongoing environmental, social and governance activities and performance. Corporate responsibility and sustainability has been and continues to be an ongoing commitment at A. O. Smith. As a global leader in water technology, we are continually looking for ways to positively impact our people, the planet and the communities we live and work in, while – at the same time – being good stewards for our shareholders.
Employees spent the day volunteering at one of A. O. Smith Foundation’s community partners. Such efforts were detailed in AOS’ inaugural Corporate Responsibility & Sustainability Report.
A. O. Smith achieved exclusive supply status for water treatment products at Lowe’s home improvement stores across the United States.

On September 1, Kevin Wheeler transitioned to the role of A. O. Smith’s president and chief executive officer.
A. O. Smith intensified its Lean journey in 2018 to make the organization even more
effective and efficient with external and internal customers.
In the same vein of stewardship, in 2018, A. O. Smith intensified its Lean journey, utilizing Lean thinking to make the organization even more effective and more efficient with external and internal customers. While the mindset of efficiency has always been embedded in the company’s DNA and part of our values, we are encouraged and excited about where this multi-year Lean focus will take us as we work to further build on our track record of success.
As many know, we had a leadership change at the company in 2018. On September 1, Ajita Rajendra transitioned from chairman and chief executive officer to executive chairman of the corporation, and I took on the role of president and chief executive officer. I’m honored to have been named to the position and am working tirelessly to ensure that the company continues to move forward seamlessly.
Looking ahead to 2019, we are confident in our long-term strategy and our ability to adapt to an ever-changing market, just as A. O. Smith has done for the last 145 years. And, just as always, we remain committed to our Values – doing business with honesty and integrity, investing in innovation, and treating each other and our many partners with respect day in and day out. The formula has helped to get us to where we are today, and we remain confident that it will take us well into the future.
Finally, I would like to thank you – our shareholders – for your ongoing support of A. O. Smith. We appreciate your ongoing trust in A. O. Smith, and we do not take that trust lightly. We vow to continually work to raise the bar each and every day to further grow A. O. Smith and deliver an even greater return on your investment.
Kevin J. Wheeler President and Chief Executive Officer
1
UNITED STATES SECURITIES AND EXCHANGE COMMISSION
Washington, D.C. 20549 FORM 10-K
ANNUAL REPORT PURSUANT TO SECTION 13 OR 15(d) OF THE SECURITIES EXCHANGE ACT OF 1934 For the fiscal year ended December 31, 2018 OR TRANSITION REPORT PURSUANT TO SECTION 13 OR 15(d) OF THE SECURITIES EXCHANGE ACT OF 1934 For the transition period from to .
Commission File Number 1-475
A. O. Smith Corporation (Exact name of registrant as specified in its charter)
Delaware 39-0619790 (State of Incorporation) (I.R.S. Employer Identification No.)
11270 West Park Place, Milwaukee, Wisconsin 53224-9508 (Address of Principal Executive Office) (Zip Code)
(414) 359-4000 Registrant’s telephone number, including area code
Securities registered pursuant to Section 12(b) of the Act:
Title of Each Class
Shares of Stock Outstanding January 31, 2019 .
Name of Each Exchange on Which Registered z
Class A Common Stock (par value $5.00 per share)
26,059,903 Not listed
Common Stock (par value $1.00 per share)
141,852,744 New York Stock Exchange
Securities registered pursuant to Section 12(g) of the Act: None.
Indicate by check mark if the registrant is a well-known seasoned issuer, as defined in Rule 405 of the Securities Act. Yes No Indicate by check mark if the registrant is not required to file reports pursuant to Section 13 or Section 15(d) of the Act. Yes No Indicate by check mark whether the registrant (1) has filed all reports required to be filed by Section 13 or 15(d) of the Securities Exchange Act of 1934 during the preceding 12 months (or for such shorter period that the registrant was required to file such reports), and (2) has been subject to such filing requirements for the past 90 days. Yes No.
Indicate by check mark whether the registrant has submitted every Interactive Data File required to be submitted pursuant to Rule 405 of Regulation S-T (§232.405 of this chapter) during the preceding 12 months (or for such shorter period that the registrant was required to submit such files). Yes No
Indicate by check mark if disclosure of delinquent filers pursuant to Item 405 of Regulation S-K (§229.405 of this chapter) is not contained herein, and will not be contained, to the best of registrant’s knowledge, in definitive proxy or information statements incorporated by reference in Part III of this Form 10-K or any amendment to this Form 10-K.
Indicate by check mark whether the registrant is a large accelerated filer, an accelerated filer, a non-accelerated filer or a smaller reporting company, or emerging growth company. See the definitions of “large accelerated filer,” “accelerated filer,” “smaller reporting company,” and “emerging growth company” in Rule 12b-2 of the Exchange Act. Large accelerated filer Accelerated filer
Non-accelerated filer Smaller reporting company Emerging growth company
If an emerging growth company, indicate by check mark if the registrant has elected not to use the extended transition period for complying with any new or revised financial accounting standards provided pursuant to Section 13(a) of the Exchange Act.
Indicate by check mark whether the registrant is a shell company (as defined in Rule 12b-2 of the Act.) Yes No
The aggregate market value of voting stock held by non-affiliates of the registrant was $54,612,426 for Class A Common Stock and $8,368,308,653 for Common Stock as of June 30, 2018.
DOCUMENTS INCORPORATED BY REFERENCE
1. Portions of the company’s definitive Proxy Statement for the 2019 Annual Meeting of Stockholders (to be filed with the Securities and Exchange Commission under Regulation 14A within 120 days after the end of the registrant’s fiscal year and, upon such filing, to be incorporated by reference in Part III).
2
Table of Contents
A. O. Smith Corporation Index to Form 10-K
Year Ended December 31, 2018
Page Part I
Item 1. Business 3
Item 1A. Risk Factors 6
Item 1B. Unresolved Staff Comments 11
Item 2. Properties 11
Item 3. Legal Proceedings 11
Item 4. Mine Safety Disclosures 11
Part II
Item 5. Market for Registrant’s Common Equity, Related Stockholder Matters and Issuer Purchases
of Equity Securities 15
Item 6. Selected Financial Data 17
Item 7. Management’s Discussion and Analysis of Financial Condition and Results of Operations 18
Item 7A. Quantitative and Qualitative Disclosures About Market Risk 25
Item 8. Financial Statements and Supplementary Data 26
Item 9. Changes in and Disagreements with Accountants on Accounting and Financial Disclosure 58
Item 9A. Controls and Procedures 58
Item 9B. Other Information 58
Part III
Item 10. Directors, Executive Officers and Corporate Governance 60
Item 11. Executive Compensation 60
Item 12. Security Ownership of Certain Beneficial Owners and Management and Related
Stockholder Matters 60
Item 13. Certain Relationships and Related Transactions and Director Independence 61
Item 14. Principal Accounting Fees and Services 61
Part IV
Item 15. Exhibits, Financial Statement Schedules 62
3
PART 1
ITEM 1 - BUSINESS Our company is comprised of two reporting segments: North America and Rest of World. Our Rest of World segment is primarily comprised of China, Europe and India. Both segments manufacture and market comprehensive lines of residential and commercial gas and electric water heaters, boilers, tanks and water treatment products. Both segments primarily manufacture and market in their respective regions of the world. Our Rest of World segment also manufactures and markets in-home air purification products in China. NORTH AMERICA We serve residential and commercial end markets in North America with a broad range of products including: Water heaters. Our residential and commercial water heaters come in sizes ranging from 2.5 gallon (point-of-use) models to 4,000 gallon products with varying efficiency ranges. We offer electric, natural gas and liquid propane tank-type models as well as tankless (gas and electric), heat pump and solar tank units. Typical applications for our water heaters include residences, restaurants, hotels and motels, office buildings, laundries, car washes and small businesses. Boilers. Our residential and commercial boilers range in size from 40,000 British Thermal Units (BTUs) to 6.0 million BTUs. Our commercial boilers are primarily used in space heating applications for hospitals, schools, hotels and other large commercial buildings. Water treatment products. With the acquisition of Aquasana, Inc. (Aquasana) in 2016 and Hague Quality Water International (Hague) in 2017, we entered the North American water treatment market. Our water treatment products range from on-the-go filtration bottles and point-of-use carbon and reverse osmosis products to point-of-entry water softeners and whole-home water filtrations products. We also offer a complete line of food and beverage filtration products. Typical applications for our water treatment products include residences, restaurants, hotels and offices. A portion of our sales of water treatment products is comprised of replacement filters. Other. In our North America segment, we also manufacture expansion tanks, commercial solar water heating systems, swimming pool and spa heaters, related products and parts. A significant portion of our North America sales is derived from the replacement of existing products. We believe we are the largest manufacturer and marketer of water heaters in North America with a leading share in both the residential and commercial markets. In the commercial markets for both water heating and space heating, we believe our comprehensive product lines and our high-efficiency products give us a competitive advantage in these portions of the markets. Our wholesale distribution channel, where we sell our products primarily under the A. O. Smith and State brands, includes more than 1,300 independent wholesale plumbing distributors serving residential and commercial end markets. We also sell our residential water heaters through the retail and maintenance, repair and operations (MRO) channels. In the retail channel, our customers include four of the six largest national hardware and home center chains, including a long-standing exclusive relationship with Lowe’s where we sell A. O. Smith branded products. Our Lochinvar brand is one of the leading residential and commercial boiler brands in the U.S. Approximately 40 percent of Lochinvar branded sales consist of residential and commercial water heaters while the remaining 60 percent of Lochinvar-branded sales consist primarily of boilers and related parts. Our commercial boiler distribution channel is primarily comprised of manufacturer representative firms, the remainder of our Lochinvar branded products are distributed through wholesale channels. We sell our Aquasana branded products primarily directly to consumers through e-commerce as well as on-line retailers including Amazon and through other retail chains. Our water softener products are sold through water quality dealers and home center retail chains. Our A. O. Smith branded water treatment products are sold through Lowe’s. Our energy efficient product offerings continue to be a sales driver for our business. Our commercial water heaters and our condensing boilers continue to be an option for commercial customers looking for high efficiency water and space heating with a short payback period through energy savings. We offer residential heat pump, condensing tank-type and tankless water heaters in North America, as well as other higher efficiency water heating solutions to round out our energy efficient product offerings.

4
We sell our water heating products in highly competitive markets. We compete in each of our targeted market segments based on product design, reliability, quality of products and services, advanced technologies, energy efficiency, maintenance costs and price. Our principal water heating and boiler competitors in North America include Rheem, Bradford White, Rinnai, Aerco and Navien. Numerous other manufacturing companies also compete. Our principal water treatment competitors in the U.S. are Brita, Culligan, Kinetico, Pentair and Ecowater as well as numerous regional assemblers. REST OF WORLD We have operated in China for more than 20 years. In that time, we have been aggressively expanding our presence while building A. O. Smith brand recognition in the residential and commercial markets. The Chinese water heater market is predominantly comprised of electric wall-hung, gas tankless, combi-boiler, heat pump and solar water heaters. We believe we are one of the leading suppliers of water heaters to the residential market in China in dollar terms. We manufacture and market water treatment products, primarily residential reverse osmosis products. We also manufacture and market air purification products in China. We sell water heaters in more than 9,000 retail outlets in China, of which over 2,800 exclusively sell our products. Our water treatment products and air purification products are sold in over 7,500 and 3,500 retail outlets in China, respectively. In 2008, we established a sales office in India and began importing products specifically designed for India. We began manufacturing water heaters in India in 2010 and water treatment products in 2015. Our primary competitors in China in the electric water heater market segment are Haier and Midea, which are Chinese companies. We compete with Rinnai and Noritz in the gas tankless water heater market segment. Our principal competitors in the water treatment market are Qinyuan, Angel, Midea and Xiaomi. Our principal competitors in the China air purification market are Phillips, Panasonic and Sharp. In India, we compete with Bajaj and Havels in the water heater market and Eureka Forbes, Kent and Hindustan Unilever in the water treatment market. In addition, we sell water heaters in the European and Middle Eastern markets and water treatment products in Hong Kong, Turkey and Vietnam, all of which combined comprised less than six percent of total Rest of World sales in 2018.
5
RAW MATERIALS Raw materials for our manufacturing operations, primarily consisting of steel, are generally available in adequate quantities. A portion of our customers are contractually obligated to accept price changes based on fluctuations in steel prices. There has been volatility in steel costs over the last several years. RESEARCH AND DEVELOPMENT
To improve our competitiveness by generating new products and processes, we conduct research and development at our newly constructed Corporate Technology Center in Milwaukee, Wisconsin, at our Global Engineering Center in Nanjing, China, and at our operating locations. Our total expenditures for research and development in 2018, 2017 and 2016 were $94.0 million, $86.4 million and $80.1 million, respectively. PATENTS AND TRADEMARKS
We own and use in our businesses various trademarks, trade names, patents, trade secrets and licenses. We do not believe that our business as a whole is materially dependent upon any such trademark, trade name, patent, trade secret or license. However, our trade name is important with respect to our products, particularly in China, India and the U.S.
EMPLOYEES
We employed approximately 16,300 employees as of December 31, 2018, primarily non-union. BACKLOG
Due to the short-cycle nature of our businesses, none of our operations sustain significant backlogs.
ENVIRONMENTAL LAWS
Our operations are governed by a variety of federal, foreign, state and local laws intended to protect the environment. Compliance with environmental laws has not had and is not expected to have a material effect upon the capital expenditures, earnings, or competitive position of our company. See Item 3.
AVAILABLE INFORMATION We maintain a website with the address www.aosmith.com. The information contained on our website is not included as a part of, or incorporated by reference into, this Annual Report on Form 10-K. Other than an investor’s own internet access charges, we make available free of charge through our website our Annual Report on Form 10-K, quarterly reports on Form 10-Q, current reports on Form 8-K and amendments to these reports as soon as reasonably practical after we have electronically filed such material with, or furnished such material to, the Securities and Exchange Commission (SEC). All reports we file with the SEC are also available free of charge via EDGAR through the SEC’s website at www.sec.gov. We are committed to sound corporate governance and have documented our corporate governance practices by adopting the A. O. Smith Corporate Governance Guidelines. The Corporate Governance Guidelines, Criteria for Selection of Directors, Financial Code of Ethics, the A. O. Smith Guiding Principles, as well as the charters for the Audit, Personnel and Compensation, Nominating and Governance and the Investment Policy Committees of the Board of Directors and other corporate governance materials, may be viewed on the company’s website. Any waiver of or amendments to the Financial Code of Conduct or the A. O. Smith Guiding Principles also would be posted on this website; to date there have been none. Copies of these documents will be sent to stockholders free of charge upon written request of the corporate secretary at the address shown on the cover page of this Annual Report on Form 10-K. We are also committed to growing our business in a sustainable and socially responsible manner consistent with our Guiding Principles. This commitment has driven us to design, engineer, and manufacture highly innovative and efficient products in an environmentally responsible manner that help reduce energy consumption, conserve water, and improve drinking water quality and public health. Consistent with this commitment, we issued our first Corporate Responsibility & Sustainability (CRS) report in 2018 detailing our company's historic and current CRS efforts. Our CRS report is available on our website, www.aosmith.com. To further demonstrate our commitment, our company recently appointed Patricia K. Ackerman, Senior Vice President, Investor Relations, Treasurer, and Corporate Responsibility and Sustainability with specific responsibility for our CRS efforts.

6
ITEM 1A – RISK FACTORS You should carefully consider the risk factors set forth below and all other information contained in this Annual Report on Form 10-K, including the documents incorporated by reference, before making an investment decision regarding our common stock. If any of the events contemplated by the following risks actually occurs, then our business, financial condition, or results of operations could be materially adversely affected. As a result, the trading price of our common stock could decline, and you may lose all or part of your investment. The risks and uncertainties below are not the only risks facing our company.
The effects of a global economic downturn could have a material adverse effect on our business Global economic growth remains uneven and could stall or reverse course. If this were to occur it could adversely affect consumer confidence and spending patterns which could result in decreased demand for the products we sell, a delay in purchases, increased price competition, or slower adoption of energy efficient water heaters and boilers, or high quality water treatment products, which could negatively impact our profitability and cash flows. In addition, a deterioration in current economic conditions, including credit market conditions, could negatively impact our vendors and customers, which could result in an increase in bad debt expense, customer and vendor bankruptcies, interruption or delay in supply of materials, or increased material prices, which could negatively impact our ability to distribute, market and sell our products and our financial condition, results of operations and cash flows.
We increasingly sell our products and operate outside the U.S., and to a lesser extent, rely on imports and exports, which may present additional risks to our business
Approximately 43 percent of our net sales in 2018 were attributable to products sold outside of the U.S., primarily in China and Canada, and to a lesser extent in Europe and India. We also have operations and business relationships outside the U.S. that comprise a portion of our manufacturing, supply, and distribution. Approximately 10,000 of our 16,300 employees as of December 31, 2018 were located in China. At December 31, 2018, approximately $644 million of cash was held by our foreign subsidiaries, substantially all of which was located in China. International operations generally are subject to various risks, including: political, religious, and economic instability; local labor market conditions; new or increased tariffs or other trade restrictions, or changes to trade agreements; the impact of foreign government regulations, actions or policies; the effects of income taxes; governmental expropriation; the imposition or increases in withholding and other taxes on remittances and other payments by foreign subsidiaries; labor relations problems; the imposition of environmental or employment laws, or other restrictions or actions by foreign governments; and differences in business practices. Unfavorable changes in the political, regulatory, or trade climate, diplomatic relations, or government policies, particularly in relation to countries where we have a presence, including Canada, China, India and Mexico, could have a material adverse effect on our financial condition, results of operations and cash flows or our ability to repatriate funds to the U.S.
A portion of our business could be affected by further weakening of the Chinese economy
Approximately 34 percent of our net sales in 2018 were attributable to China. Our sales growth in China decreased in 2018. We believe that decrease was due to weakness in the housing market in China, weakening consumer sentiment in part associated with concerns about the trade tensions between China and the U.S. and a weakening Chinese economy. We derive a substantial portion of our sales in China from premium-tier products and weakening consumer confidence and sentiment as well as economic uncertainty may prompt consumers there to choose lower-priced alternatives or lengthen the cycle of replacement purchases. Further deterioration in the Chinese economy could adversely affect our financial condition, results of operations and cash flows.
A material loss, cancellation, reduction, or delay in purchases by one or more of our largest customers could harm our business
Net sales to our five largest customers represented approximately 39 percent of our sales in 2018. We expect that our customer concentration will continue for the foreseeable future. Our concentration of sales to a relatively small number of customers makes our relationship with each of these customers important to our business. We cannot assure that we will be able to retain our largest customers. Some of our customers may shift their purchases to our competitors in the future. The loss of one or more of our largest customers, any material reduction or delay in sales to these customers, or our inability to successfully develop relationships with additional customers could have a material adverse effect on our financial position, results of operations and cash flows.

7
Our international operations are subject to risks related to foreign currencies We have significant operations outside of the U.S., primarily in China and Canada and to a lesser extent Europe and India, and therefore, hold assets, including $539 million of cash denominated in local currency in China, incur liabilities, earn revenues and pay expenses in a variety of currencies other than the U.S. dollar. The financial statements of our foreign subsidiaries are translated into U.S. dollars in our consolidated financial statements. As a result, we are subject to risks associated with operating in foreign countries including fluctuations in currency exchange rates and interest rates, hyperinflation in some foreign countries or global exchange rate instability or volatility that strengthens the U.S. dollar against foreign currencies. Furthermore, typically our products are priced in foreign countries in local currencies. As a result, an increase in the value of the U.S. dollar relative to the local currencies of our foreign markets has had and would continue to have a negative effect on our profitability. In addition to currency translation risks, we incur a currency transaction risk whenever one of our subsidiaries enters into either a purchase or sale transaction using a currency different from the operating subsidiaries’ functional currency. The majority of our foreign currency transaction risk results from sales of our products in Canada which we manufacture in the U.S. These risks may hurt our reported sales and profits in the future or negatively impact revenues and earnings translated from foreign currencies into U.S. dollars.
A portion of our business could be adversely affected by a decline in North American new residential and commercial construction or a decline in replacement related volume
Residential and commercial construction activity in North America has shown modest growth and activity could decline again in the future. We believe that the majority of the markets we serve are for replacement of existing products and replacement related volume growth was strong in 2018. Changes in replacement volume and in the construction market could negatively affect us.
Because we participate in markets that are highly competitive, our revenues and earnings could decline as we respond to competition
We sell all of our products in highly competitive and evolving markets. We compete in each of our targeted markets based on product design, reliability, quality of products and services, advanced technologies, product performance, maintenance costs and price. Some of our competitors may have greater financial, marketing, manufacturing, research and development and distribution resources than we have, and some are increasingly expanding beyond their existing manufacturing or geographic footprints. Consumer purchasing behavior may shift the product mix in the market or result in a shift to new distribution channels, including e-commerce, which is a rapidly developing area. Development of a successful e-commerce strategy involves significant time, investment and resources. In North America, the tankless portion of the water heating market has for many years increased as a percentage of the overall market. While we have many tankless products, our market share for tankless products is lower than our market share for the remainder of the water heating market. Further acceleration of the tankless portion of the North America market, which we believe was less than eight percent of the market in 2018, could have an impact on our operating results. We cannot assure that our products will continue to compete successfully with those of our competitors, there could be new market participants that change the dynamics of those markets and it is possible that we will not be able to retain our customer base or improve or maintain our profit margins on sales to our customers, all of which could materially and adversely affect our financial condition, results of operations and cash flows.
If we are unable to develop product innovations and improve our technology and expertise, we could lose customers or market share
Our success may depend on our ability to adapt to technological changes in the water heating, boiler, water treatment and air purifier industries. If we are unable to timely develop and introduce new products, or enhance existing products, in response to changing market conditions or customer requirements or demands, our competitiveness could be materially and adversely affected. Our ability to develop and successfully market new products and to develop, acquire, and retain necessary intellectual property rights is essential to our continued success, but cannot reasonably be assured.
Changes in regulations or standards could adversely affect our business Our products are subject to a wide variety of statutory, regulatory and industry standards and requirements related to, among other items, energy and water efficiency, environmental emissions, labeling and safety. While we believe our products are currently efficient, safe and environment-friendly, a significant change to regulatory requirements (whether federal, foreign, state or local) such as electrification as a replacement for gas combustion, or to industry standards, could substantially increase

8
manufacturing costs, impact the size and timing of demand for our products, affect the types of products we are able to offer, or put us at a competitive disadvantage, any of which could harm our business and have a material adverse effect on our financial condition, results of operations and cash flow.
Our business may be adversely impacted by product defects Product defects can occur through our own product development, design and manufacturing processes or through our reliance on third parties for component design and manufacturing activities. We may incur various expenses related to product defects, including product warranty costs, product liability and recall or retrofit costs. While we maintain a reserve for product warranty costs based on certain estimates and our knowledge of current events and actions, our actual warranty costs may exceed our reserve, resulting in current period expenses and a need to increase our reserves for warranty charges. In addition, product defects and recalls may diminish the reputation of our brand. Further, our inability to cure a product defect could result in the failure of a product line or the temporary or permanent withdrawal from a product or market. Any of these events may have a material adverse impact on our financial condition, results of operations and cash flows.
Our operations could be adversely impacted by material price volatility and supplier concentration The market prices for certain raw materials we purchase, primarily steel, have been volatile. Significant increases in the cost of any of the key materials we purchase could increase our cost of doing business and ultimately could lead to lower operating earnings if we are not able to recover these cost increases through price increases to our customers. Historically, there has been a lag in our ability to recover increased material costs from customers, and that lag could negatively impact our profitability. In addition, in some cases we are dependent on a limited number of suppliers for some of the raw materials and components we require in the manufacture of our products. A significant disruption or termination of the supply from one of these suppliers could delay sales or increase costs which could result in a material adverse effect on our financial condition, results of operations and cash flows.
An inability to adequately maintain our information systems and their security and cybersecurity, as well as to protect data and other confidential information, could adversely affect our business and reputation
In the ordinary course of business, we utilize information systems for day-to-day operations, to collect and store sensitive data and information, including our proprietary and regulated business information and personally identifiable information of our customers, suppliers and business partners, as well as personally identifiable information about our employees. Our information systems, like those of other companies, are susceptible to outages due to system failures, cybersecurity threats, failures on the part of third-party information system providers, natural disasters, power loss, telecommunications failures, viruses, fraud, theft, malicious insiders or breaches of security. We continue to take steps to maintain and improve data security and address these risks and uncertainties by implementing and improving internal controls, security technologies, insurance programs, network and data center resiliency and recovery processes. However, any operations failure or breach of security from increasingly sophisticated cyber threats could lead to disruptions of our business activities, the loss or disclosure of both our and our customers’ financial, product and other confidential information and could result in regulatory actions and have a material adverse effect on our financial condition, results of operations and cash flows and our reputation.
We are subject to U.S. and global laws and regulations covering our domestic and international operations that could adversely affect our business and results of operations
Due to our global operations, we are subject to many laws governing international relations, including those that prohibit improper payments to government officials and restrict where we can do business, what information or products we can supply to certain countries and what information we can provide to a non−U.S. government, including but not limited to the Foreign Corrupt Practices Act and the U.S. Export Administration Act. Violations of these laws may result in criminal penalties or sanctions that could have a material adverse effect on our financial condition, results of operations and cash flows.
Our results of operations may be negatively impacted by product liability lawsuits and claims Our products expose us to potential product liability risks that are inherent in the design, manufacture, sale and use of our products. While we currently maintain what we believe to be suitable product liability insurance, we cannot be certain that we will be able to maintain this insurance on acceptable terms, that this insurance will provide adequate protection against potential liabilities or that our insurance providers will be able to ultimately pay all insured losses. In addition, we self-insure a
9
portion of product liability claims. A series of successful claims against us could materially and adversely affect our reputation and our financial condition, results of operations and cash flows. Our success is dependent on developing and retaining highly qualified personnel Attracting and retaining talented employees is important to the continued success and growth of our business. Failure to retain key personnel, particularly on the leadership team, could have a material effect on our business and our ability to execute our business strategies in a timely and effective manner. Sales growth of our boilers could stall resulting in lower than expected revenues and earnings The compound annual growth rate of our boiler sales has been approximately ten percent per year since our acquisition of Lochinvar in 2011, largely due to the transition in the boiler industry in the U.S. from lower efficiency, non-condensing boilers to higher efficiency, higher priced, condensing boilers, as well as new product introductions. We expect the transition to condensing boilers to continue, but if the transition to higher efficiency, higher priced, condensing boilers stalls as a result of lower energy costs, a U.S. recession occurs, or our competitors’ technologies surpass our technology, our growth rate could be lower than expected.
Potential acquisitions could use a significant portion of our capital and we may not successfully integrate future acquisitions or operate them profitably or achieve strategic objectives
We will continue to evaluate potential acquisitions, and we could use a significant portion of our available capital to fund future acquisitions. If we complete any future acquisitions, we may not be able to successfully integrate the acquired businesses or operate them profitably or accomplish our strategic objectives for those acquisitions. If we complete any future acquisitions in new geographies, our unfamiliarity with local regulations and market customs may impact our ability to operate them profitably or achieve our strategic objectives for those acquisitions. Our level of indebtedness may increase in the future if we finance acquisitions with debt, which would cause us to incur additional interest expense and could increase our vulnerability to general adverse economic and industry conditions and limit our ability to service our debt or obtain additional financing. The impact of future acquisitions may have a material adverse effect on our financial condition, results of operations and cash flows.
Our pension plans may require future pension contributions which could limit our flexibility in managing our company The projected benefit obligation liability of our defined benefit pension plans of $834 million exceeded the fair value of the plan assets of $778 million by approximately $56 million at December 31, 2018. U.S. employees hired after January 1, 2010 have not participated in our defined benefit plan, and benefit accruals for the majority of current salaried and hourly employees ended on December 31, 2014. We are forecasting that we will not be required to make a contribution to the plan in 2019, and we do not plan to make any voluntary contributions. However, we cannot provide any assurance that contributions will not be required in the future. Among the key assumptions inherent in our actuarially calculated pension plan obligation and pension plan expense are the discount rate and the expected rate of return on plan assets. If interest rates and actual rates of return on invested plan assets were to decrease significantly, our pension plan obligations could increase materially. The size of future required pension contributions could result in us dedicating a significant portion of our cash flows from operations to making the contributions which could negatively impact our flexibility in managing the company.
We have significant goodwill and indefinite-lived intangible assets and an impairment of our goodwill or indefinite-lived intangible assets could cause a decline in our net worth
Our total assets include significant goodwill and indefinite-lived intangible assets. Our goodwill results from our acquisitions, representing the excess of the purchase prices we paid over the fair value of the net tangible and intangible assets we acquired. We assess whether there have been impairments in the value of our goodwill or indefinite-lived intangible assets during the fourth quarter of each calendar year or sooner if triggering events warrant. If future operating performance at our businesses does not meet expectations, we may be required to reflect non-cash charges to operating results for goodwill or indefinite-lived intangible asset impairments. The recognition of an impairment of a significant portion of goodwill or indefinite-lived intangible assets would negatively affect our results of operations and total capitalization, the effect of which could be material. A significant reduction in our stockholders’ equity due to an impairment of goodwill or indefinite-lived intangible assets may affect our ability to maintain the debt-to-capital ratio required under our existing debt arrangements. We have identified the valuation of goodwill and indefinite-lived intangible assets as a critical accounting policy. See “Management’s Discussion and

10
Analysis of Financial Condition and Results of Operations – Critical Accounting Policies—Goodwill and Indefinite-lived Intangible Assets” included in Item 7 of this Annual Report on Form 10-K.
Certain members of the founding family of our company and trusts for their benefit have the ability to influence all matters requiring stockholder approval
We have two classes of common equity: our Common Stock and our Class A Common Stock. The holders of Common Stock currently are entitled, as a class, to elect only one-third of our board of directors. The holders of Class A Common Stock are entitled, as a class, to elect the remaining directors. Certain members of the founding family of our company and trusts for their benefit (Smith Family) have entered into a voting trust agreement with respect to shares of our Class A Common Stock and shares of our Common Stock they own. As of December 31, 2018, through the voting trust, these members of the Smith Family own approximately 62.9 percent of the total voting power of our outstanding shares of Class A Common Stock and Common Stock, taken together as a single class, and approximately 96.5 percent of the voting power of the outstanding shares of our Class A Common Stock, as a separate class. Due to the differences in the voting rights between shares of our Common Stock (one-tenth of one vote per share) and shares of our Class A Common Stock (one vote per share), the Smith Family voting trust is in a position to control to a large extent the outcome of matters requiring a stockholder vote, including the adoption of amendments to our certificate of incorporation or bylaws or approval of transactions involving a change of control. This ownership position may increase if other members of the Smith Family enter into the voting trust agreement, and the voting power relating to this ownership position may increase if shares of our Class A Common Stock held by stockholders who are not parties to the voting trust agreement are converted into shares of our Common Stock. The voting trust agreement provides that, in the event one of the parties to the voting trust agreement wants to withdraw from the trust or transfer any of its shares of our Class A Common Stock, such shares of our Class A Common Stock are automatically exchanged for shares of our Common Stock held by the trust to the extent available in the trust. In addition, the trust will have the right to purchase the shares of our Class A Common Stock and our Common Stock proposed to be withdrawn or transferred from the trust. As a result, the Smith Family members that are parties to the voting trust agreement have the ability to maintain their collective voting rights in our company even if certain members of the Smith Family decide to transfer their shares.
11
ITEM 1B - UNRESOLVED STAFF COMMENTS None. ITEM 2 - PROPERTIES Properties utilized by us at December 31, 2018 were as follows: North America In this segment, we have 14 manufacturing plants located in six states and two non-U.S. countries, of which 12 are owned directly by us or our subsidiaries and two are leased from outside parties. The terms of leases in effect at December 31, 2018 expire between 2019 and 2025. Rest of World In this segment, we have six manufacturing plants located in four non-U.S. countries, of which four are owned directly by us or our subsidiaries and two are leased from outside parties. The terms of leases in effect at December 31, 2018 expire between 2020 and 2022. Corporate and General We consider our plants and other physical properties to be suitable, adequate, and of sufficient productive capacity to meet the requirements of our business. The manufacturing plants operate at varying levels of utilization depending on the type of operation and market conditions. The executive offices of the company, which are leased, are located in Milwaukee, Wisconsin.
ITEM 3 - LEGAL PROCEEDINGS We are involved in various unresolved legal actions, administrative proceedings and claims in the ordinary course of our business involving product liability, property damage, insurance coverage, exposure to asbestos and other substances, patents and environmental matters, including the disposal of hazardous waste. Although it is not possible to predict with certainty the outcome of these unresolved legal actions or the range of possible loss or recovery, we believe, based on past experience, adequate reserves and insurance availability, that these unresolved legal actions will not have a material effect on our financial position or results of operations. A more detailed discussion of certain of these matters appears in Note 15 of Notes to Consolidated Financial Statements. ITEM 4 – MINE SAFETY DISCLOSURES Not applicable.
12
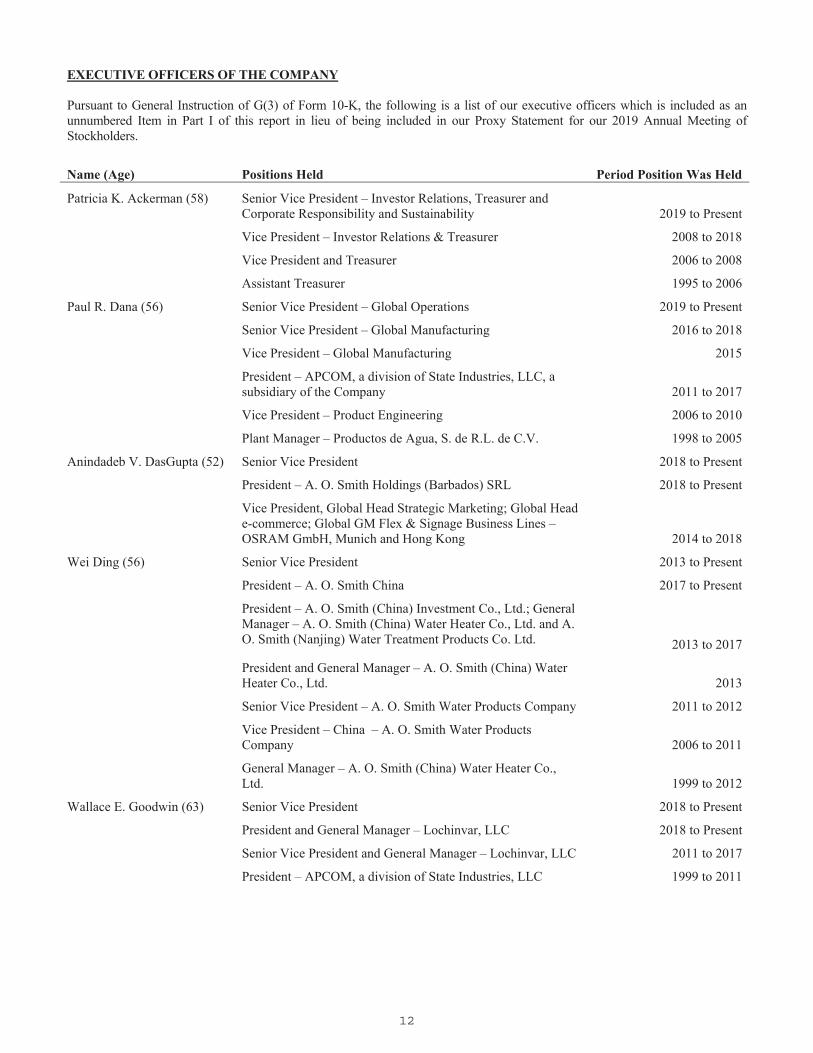
EXECUTIVE OFFICERS OF THE COMPANY Pursuant to General Instruction of G(3) of Form 10-K, the following is a list of our executive officers which is included as an unnumbered Item in Part I of this report in lieu of being included in our Proxy Statement for our 2019 Annual Meeting of Stockholders.
Name (Age) Positions Held Period Position Was Held
Patricia K. Ackerman (58) Senior Vice President – Investor Relations, Treasurer and Corporate Responsibility and Sustainability 2019 to Present
Vice President – Investor Relations & Treasurer 2008 to 2018
Vice President and Treasurer 2006 to 2008
Assistant Treasurer 1995 to 2006
Paul R. Dana (56) Senior Vice President – Global Operations 2019 to Present
Senior Vice President – Global Manufacturing 2016 to 2018
Vice President – Global Manufacturing 2015
President – APCOM, a division of State Industries, LLC, a subsidiary of the Company 2011 to 2017
Vice President – Product Engineering 2006 to 2010
Plant Manager – Productos de Agua, S. de R.L. de C.V. 1998 to 2005
Anindadeb V. DasGupta (52) Senior Vice President 2018 to Present
President – A. O. Smith Holdings (Barbados) SRL 2018 to Present
Vice President, Global Head Strategic Marketing; Global Head e-commerce; Global GM Flex & Signage Business Lines – OSRAM GmbH, Munich and Hong Kong 2014 to 2018
Wei Ding (56) Senior Vice President 2013 to Present
President – A. O. Smith China 2017 to Present
President – A. O. Smith (China) Investment Co., Ltd.; General Manager – A. O. Smith (China) Water Heater Co., Ltd. and A. O. Smith (Nanjing) Water Treatment Products Co. Ltd. 2013 to 2017
President and General Manager – A. O. Smith (China) Water Heater Co., Ltd. 2013
Senior Vice President – A. O. Smith Water Products Company 2011 to 2012
Vice President – China – A. O. Smith Water Products Company 2006 to 2011
General Manager – A. O. Smith (China) Water Heater Co., Ltd. 1999 to 2012
Wallace E. Goodwin (63) Senior Vice President 2018 to Present
President and General Manager – Lochinvar, LLC 2018 to Present
Senior Vice President and General Manager – Lochinvar, LLC 2011 to 2017
President – APCOM, a division of State Industries, LLC 1999 to 2011

13
Name (Age) Positions Held Period Position Was Held
Robert J. Heideman (52) Senior Vice President – Chief Technology Officer 2013 to Present
Senior Vice President – Engineering & Technology 2011 to 2012
Senior Vice President – Corporate Technology 2010 to 2011
Vice President – Corporate Technology 2007 to 2010
Director – Materials 2005 to 2007
Section Manager 2002 to 2005
D. Samuel Karge (44) Senior Vice President 2018 to Present
President – North America Water Treatment 2018 to Present
Vice President, Sales and Marketing – Zurn Industries 2016 to 2018
Vice President & Platform Leader – Pentair Residential Filtration 2012 to 2016
John J. Kita (63) Executive Vice President and Chief Financial Officer 2011 to Present
Senior Vice President, Corporate Finance and Controller 2006 to 2011
Vice President, Treasurer and Controller 1996 to 2006
Treasurer and Controller 1995 to 1996
Assistant Treasurer 1988 to 1994
Charles T. Lauber (56) Senior Vice President, Strategy and Corporate Development 2013 to Present
Senior Vice President – Chief Financial Officer – A. O. Smith Water Products Company 2006 to 2012
Vice President – Global Finance – A. O. Smith Electrical Products Company 2004 to 2006
Vice President and Controller – A. O. Smith Electrical Products Company 2001 to 2004
Director of Audit and Tax 1999 to 2001
Peter R. Martineau (64) Senior Vice President – Chief Information Officer 2016 to Present
Vice President – Business Transformation 2013 to 2015
Vice President – Customer Satisfaction 2010 to 2012
Mark A. Petrarca (55) Senior Vice President – Human Resources and Public Affairs 2006 to Present
Vice President – Human Resources and Public Affairs 2005 to 2006
Vice President – Human Resources – A. O. Smith Water Products Company 1999 to 2004
Ajita G. Rajendra (67) Executive Chairman 2018 to Present
Chairman and Chief Executive Officer 2017 to 2018
Chairman, President and Chief Executive Officer 2014 to 2017
President and Chief Executive Officer 2013 to 2014
President and Chief Operating Officer 2011 to 2012
Executive Vice President 2006 to 2011
President – A. O. Smith Water Products Company 2005 to 2011
Senior Vice President 2005 to 2007

14
Name (Age) Positions Held Period Position Was Held
James F. Stern (56) Executive Vice President, General Counsel and Secretary 2007 to Present
Partner – Foley & Lardner LLP 1997 to 2007
David R. Warren (55) Senior Vice President 2017 to Present
President and General Manager – North America Water Heater 2017 to Present
Vice President – International 2008 to 2017
Managing Director – A.O. Smith Water Products Company B.V.
2004 to 2008
Director, Reliance Sales 2002 to 2004
Regional Sales Manager 1999 to 2002
District Sales Manager 1990 to 1996
Sales Coordinator 1989 to 1990
Kevin J. Wheeler (59) President and Chief Executive Officer 2018 to Present
President and Chief Operating Officer 2017 to 2018
Senior Vice President 2013 to 2017
President and General Manager – North America, India and Europe Water Heating 2013 to 2017
Senior Vice President and General Manager – North America, India and Europe – A. O. Smith Water Products Company 2011 to 2012
Senior Vice President and General Manager – U.S. Retail – A. O. Smith Water Products Company 2007 to 2011
Vice President – International – A. O. Smith Water Products Company 2004 to 2007
Managing Director – A. O. Smith Water Products Company B.V. 1999 to 2004

15
PART II ITEM 5 - MARKET FOR REGISTRANT’S COMMON EQUITY, RELATED STOCKHOLDER MATTERS AND ISSUER PURCHASES OF EQUITY SECURITIES (a) Market Information. Our Common Stock is listed on the New York Stock Exchange under the symbol AOS. Our Class A
Common Stock is not listed. EQ Shareowner Services, P.O. Box 64874, St. Paul, Minnesota, 55164-0874 serves as the registrar, stock transfer agent and the dividend reinvestment agent for our Common Stock and Class A Common Stock.
(b) Holders. As of January 31, 2019, the approximate number of stockholders of record of Common Stock and Class A
Common Stock were 613 and 171, respectively. The actual number of stockholders is greater than this number of holders of record, and includes stockholders who are beneficial owners, but whose shares are held in street name by brokers and other nominees. This number of stockholders of record also does not include stockholders whose shares may be held in trust by other entities.
(c) Dividends. Dividends declared on the common stock are shown in Note 17 of Notes to Consolidated Financial Statements
appearing elsewhere herein. (d) Stock Repurchases. In the second quarter of 2018, our Board of Directors authorized adding 2,500,000 shares of
Common Stock an existing discretionary share repurchase authority. In the fourth quarter of 2018, our Board of Directors authorized adding an additional 5,000,000 shares of Common Stock the existing discretionary share repurchase authority. Under the share repurchase program, we may purchase the Common Stock through a combination of Rule 10b5-1 automatic trading plan and discretionary purchases in accordance with applicable securities laws. The number of shares purchased and the timing of the purchases will depend on a number of factors, including share price, trading volume and general market conditions, as well as working capital requirements, general business conditions and other factors, including alternative investment opportunities. The stock repurchase authorization remains effective until terminated by our Board of Directors which may occur at any time, subject to the parameters of any Rule 10b5-1 automatic trading plan that we may then have in effect. In 2018, we repurchased 3,797,800 shares at an average price of $53.34 per share and at a total cost of $202.6 million. As of December 31, 2018, there were 6,075,253 shares remaining on the existing repurchase authorization.
The following table sets forth the number of shares of common stock we repurchased during the fourth quarter of 2018:
ISSUER PURCHASES OF EQUITY SECURITIES
Period
Total Number of Shares Purchased
Average Price Paid per Share
Total Number of Shares Purchased as
Part of Publicly Announced Plans or
Programs
Maximum Number of Shares that may yet be Purchased
Under the Plans or Programs
October 1 – October 31, 2018 276,300 $ 48.75 276,300 7,881,253 November 1 – November 30, 2018 1,257,200 46.53 1,257,200 6,624,053 December 1 – December 31, 2018 548,800 45.09 548,800 6,075,253
(e) Performance Graph. The following information in this Item 5 of this Annual Report on Form 10-K is not deemed to be
“soliciting material” or to be “filed” with the SEC or subject to Regulation 14A or 14C under the Securities Exchange Act of 1934 or to the liabilities of Section 18 of the Securities Exchange Act of 1934, and will not be deemed to be incorporated by reference into any filing under the Securities Act of 1933 or the Securities Exchange Act of 1934, except to the extent we specifically incorporate it by reference into such a filing.

16
The graph below shows a five-year comparison of the cumulative shareholder return on our Common Stock with the cumulative total return of the Standard & Poor’s (S&P) 500 Index, S&P 500 Select Industrials Index, which are published indices.
Comparison of Five-Year Cumulative Total Return From December 31, 2013 to December 31, 2018
Assumes $100 Invested with Reinvestment of Dividends
Base
Period Indexed Returns
Company/Index 12/31/13 12/31/14 12/31/15 12/31/16 12/31/17 12/31/18
A. O. Smith Corporation 100.0 105.9 145.4 181.8 237.7 167.9
S&P 500 Index 100.0 113.7 115.3 129.0 157.2 150.3
S&P 500 Select Industrial Index 100.0 110.7 106.1 127.4 158.1 137.1
100
150
200
250
300
350
400
450
12/31/2013 12/31/2014 12/31/2015 12/31/2016 12/31/2017 12/31/2018
SMITH (A O) CORP
S&P 500 INDEX
S&P INDUSTRIAL INDEX
17
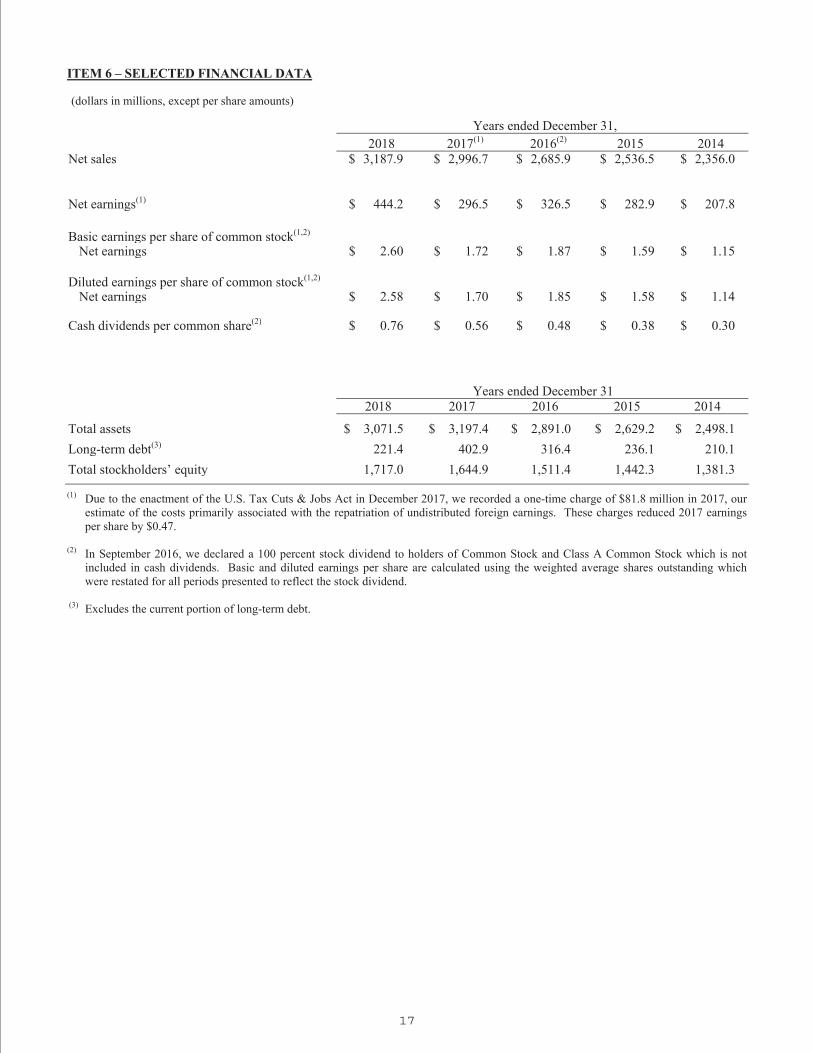
ITEM 6 – SELECTED FINANCIAL DATA (dollars in millions, except per share amounts)
Years ended December 31, 2018 2017(1) 2016(2) 2015 2014
Net sales $ 3,187.9 $ 2,996.7 $ 2,685.9 $ 2,536.5 $ 2,356.0
Net earnings(1) $ 444.2 $ 296.5 $ 326.5 $ 282.9 $ 207.8 Basic earnings per share of common stock(1,2)
Net earnings $ 2.60 $ 1.72 $ 1.87 $ 1.59 $ 1.15 Diluted earnings per share of common stock(1,2)
Net earnings $ 2.58 $ 1.70 $ 1.85 $ 1.58 $ 1.14 Cash dividends per common share(2) $ 0.76 $ 0.56 $ 0.48 $ 0.38 $ 0.30
Years ended December 31 2018 2017 2016 2015 2014
Total assets $ 3,071.5 $ 3,197.4 $ 2,891.0 $ 2,629.2 $ 2,498.1
Long-term debt(3) 221.4 402.9 316.4 236.1 210.1
Total stockholders’ equity 1,717.0 1,644.9 1,511.4 1,442.3 1,381.3
(1) Due to the enactment of the U.S. Tax Cuts & Jobs Act in December 2017, we recorded a one-time charge of $81.8 million in 2017, our estimate of the costs primarily associated with the repatriation of undistributed foreign earnings. These charges reduced 2017 earnings per share by $0.47.
(2) In September 2016, we declared a 100 percent stock dividend to holders of Common Stock and Class A Common Stock which is not
included in cash dividends. Basic and diluted earnings per share are calculated using the weighted average shares outstanding which were restated for all periods presented to reflect the stock dividend.
(3) Excludes the current portion of long-term debt.

18
ITEM 7 - MANAGEMENT’S DISCUSSION AND ANALYSIS OF FINANCIAL CONDITION AND RESULTS OF OPERATIONS OVERVIEW Our company is comprised of two reporting segments: North America and Rest of World. Our Rest of World segment is primarily comprised of China, Europe and India. Both segments manufacture and market comprehensive lines of residential and commercial gas and electric water heaters, boilers, tanks and water treatment products. Both segments primarily manufacture and market in their respective regions of the world. Our Rest of World segment also manufactures and markets in-home air purification products in China. In our North America segment, we project our sales in the U.S. will grow in 2019 compared to 2018 due to higher residential water heater and boiler volumes resulting from expected industry-wide new construction growth and expansion of replacement demand. We expect the North America commercial water heater industry to be flat in 2019, after declining over five percent in 2018 following growth of 11 percent in 2017, partially due to an anticipated regulatory change. Our sales of boilers grew nine percent in 2018, and we expect ten percent sales growth in 2019, driven by the continuing U.S. industry transition to higher efficiency products and our introduction of new products. We continued to expand our North America water treatment platform in 2018 by being named exclusive supplier of water treatment products to Lowe’s, with sales commencing in August 2018. We expect sales of North America water treatment products to increase by 35 to 40 percent in 2019, compared to 2018, primarily due to volume growth and a full year of sales to Lowe’s.
In our Rest of World segment, we expect China sales to decline in 2019 at a rate of between seven and 10 percent in U.S. dollars and three to six percent in local currency, as we believe the Chinese economy will continue to be weak and the Chinese currency will depreciate compared to the U.S. dollar by approximately four percent in 2019 compared with 2018. In addition, we expect our sales in India to grow over 30 percent in 2019 from approximately $34 million in 2018. Combining all of these factors, we expect our consolidated sales to grow one to 2.5 percent and between 2.5 to four percent in local currency terms in 2019. Our stated acquisition strategy includes a number of our water-related strategic initiatives. We will seek to continue to grow our core residential and commercial water heating, boiler and water treatment businesses throughout the world. We will also continue to look for opportunities to add to our existing operations in high growth regions demonstrated by our introduction of water treatment products in India and Vietnam and air purification products in China in 2015. RESULTS OF OPERATIONS Our sales in 2018 were a Company record $3,188 million surpassing 2017 sales of $2,997 million by 6.4 percent. The increase in sales in 2018 was primarily due to pricing actions related to higher steel costs and higher sales of boilers and residential water heaters in the U.S. as well as higher sales of water treatment products in China. Our global water treatment sales grew to approximately $400 million in 2018. Sales in China grew four percent in 2018. Excluding the impact of the appreciation of the U.S. dollar against the Chinese currency, our sales in China increased almost two percent in 2018. Our sales in 2017 were higher than 2016 sales of $2,686 million by 11.6 percent, primarily due to higher sales in China as well as higher sales of water heaters and boilers in North America. Our sales in China grew 15.9 percent in 2017 to over $1 billion, and excluding the impact of the appreciation of the U.S dollar against the Chinese currency, sales in China grew 17.9 percent in 2017 compared to 2016. Our gross profit margin in 2018 of 41.0 percent was essentially flat compared to our gross profit margin of 41.1 percent in 2017. Our gross profit margin in 2017 decreased from 41.5 percent in 2016. The slightly lower margin in 2017 compared to 2016 was due to significantly higher steel costs that more than offset pricing actions taken in 2017 in North America and China. Selling, general and administrative (SG&A) expenses were $31.0 million higher in 2018 than in 2017. The increase in SG&A expenses in 2018 to $753.8 million was primarily due to higher advertising expenses related to brand building and higher product development engineering expenses in China. SG&A expenses were $60.3 million higher in 2017 than in 2016 primarily due to higher selling and advertising expenses to support increased volumes and brand building in our newer product categories. On March 21, 2018, we announced a plan to close our Renton, Washington plant and transfer water heater, boiler and storage tank production to our other U.S. plants. The majority of the consolidation of operations occurred in the second quarter of 2018 and the Renton plant was fully closed in the third quarter of 2018. As a result of the relocation of production, we incurred pre-tax restructuring and impairment expenses of $6.7 million in the first quarter of 2018, primarily related to employee

19
severance and compensation-related costs, building lease exit costs and the impairment of assets. These activities are reflected in “restructuring and impairment expenses” in the accompanying financial statements. We are providing non-GAAP measures (adjusted earnings, adjusted earnings per share (EPS), and adjusted segment earnings) that exclude Renton related restructuring and impairment expenses and one-time expenses associated with the U.S. Tax Cuts & Jobs Act (U.S. Tax Reform). Reconciliations to measures on a GAAP basis are provided later in this section. Interest expense was $8.4 million in 2018 compared to $10.1 million in 2017 and $7.3 million in 2016. Higher interest rates in 2018 were offset by lower debt levels, primarily due to the repatriation of approximately $312 million of cash from outside of the U.S., which was primarily used to pay down floating rate debt, as well as, to fund our share repurchase activity and dividend payments. The higher interest expense in 2017 compared to 2016 was primarily related to higher interest rates as well as higher overall debt levels primarily due to increased share repurchases and acquisitions completed in 2016 and 2017. Other income was $21.2 million in 2018 compared to $21.3 million in 2017 and $18.1 million in 2016. The increase in other income in 2017 compared to 2016 was primarily due to higher non-service cost related pension income and higher interest income. Pension income in 2018 was $8.7 million compared to $9.1 million in 2017 and $6.9 million in 2016. The service cost component of our pension income is reflected in cost of products sold and SG&A expenses. All other components of our pension income are reflected in other income. Our effective income tax rate was 20.4 percent in 2018, compared with 43.1 percent in 2017 and 29.4 percent in 2016. The significant increase in our effective income tax rate in 2017 compared to prior years was due to one-time charges associated with U.S. Tax Reform of $81.8 million, primarily related to the mandatory repatriation tax on undistributed foreign earnings that we are required to pay over eight years. Excluding the impact of the U.S. Tax Reform one-time charges, our adjusted effective income tax rate was 27.4 percent in 2017. Our effective income tax rate in 2018 was lower than our adjusted effective income tax rate in 2017 due to lower federal income taxes related to U.S. Tax Reform. Our adjusted effective income tax rate in 2017 was lower than our effective income tax rate in 2016 primarily due to lower U.S. state income taxes and higher deductions for share-based compensation. We estimate our annual effective income tax rate for the full year 2019 will be approximately 21.5 percent. North America Sales in our North America segment were $2,045 million in 2018 or $140 million higher than sales of $1,905 million in 2017. The increase in sales in 2018 compared to 2017 was primarily due to pricing actions related to higher steel costs and higher volumes of boilers and residential water heaters in the U.S. North America water treatment sales, including a full year of sales from Hague and the launch of products at Lowe’s commencing in August 2018, incrementally added approximately $29 million of sales in 2018. Sales in 2017 were $162 million higher than sales of $1,743 million in 2016. The increase in sales in 2017 compared to 2016 was primarily due to higher volumes of water heaters and boilers, price increases in the U.S. for water heaters largely related to steel cost increases as well as our customers’ pre-buy of commercial water heaters in advance of an anticipated 2018 regulatory change. North America water treatment sales, comprised of Hague, acquired in September 2017 and Aquasana, acquired in August 2016, incrementally added approximately $40 million of sales in 2017. North America segment earnings were $464.1 million in 2018 compared to segment earnings of $428.6 million and $385.9 million in 2017 and 2016, respectively. Segment margins were 22.7 percent, 22.5 percent and 22.1 percent in 2018, 2017 and 2016, respectively. Adjusted segment earnings and segment margin in 2018, which exclude restructuring and impairment expenses, were $470.8 million and 23.0 percent, respectively. The higher adjusted segment earnings and adjusted segment margin in 2018 compared to 2017 were primarily due to the favorable impact from higher sales of residential water heaters and boilers and pricing actions in the U.S. that were partially offset by higher steel costs and one-time expenses associated with the launch of water treatment products at Lowe’s. The higher segment earnings and segment margin in 2017 compared to 2016 were primarily due to higher water heater and boiler volumes and pricing actions which were partially offset by higher steel costs. We estimate our 2019 North America segment margin will be between 23 and 23.5 percent. Rest of World Sales in our Rest of World segment in 2018 were $1,174 million or $58 million higher than sales of $1,116 million in 2017. Sales in China grew four percent in 2018 primarily due to higher sales of water treatment products, including consumables, which were partially offset by lower sales of electric water heaters and air purifiers. The appreciation of the U.S. dollar against the Chinese currency contributed approximately $23 million to segment sales in 2018. Excluding the benefit of the U.S. dollar appreciation, sales in China increased 1.9 percent in 2018. Water heater and water treatment sales in India increased $8 million, over 30 percent, in 2018 compared to 2017. Sales in our Rest of World segment in 2017 were $150 million higher than sales of $966 million in 2016. Sales in China grew 15.9 percent to over $1 billion in 2017 due to higher demand for our
20
consumer products, led by water treatment and air purification products and pricing actions primarily due to higher steel and installation costs. Excluding the impact from the appreciation of the U.S. dollar in 2017, sales in China increased 17.9 percent. Water heater and water treatment sales in India increased $8 million, over 40 percent, in 2017 compared to 2016. Rest of World segment earnings were $149.3 million in 2018 compared to segment earnings of $149.3 million and $129.1 million in 2017 and 2016, respectively. Segment margins were 12.7 percent in 2018 compared to 13.4 percent and 13.4 percent in 2017 and 2016, respectively. Segment earnings in 2018 were flat compared to 2017 primarily due to higher water treatment product sales and improved performance in India that were offset by lower sales of electric water heaters and air purifiers as well as higher SG&A expenses. Higher SG&A expenses in China were primarily due to higher advertising expenses related to brand building and higher product development engineering expenses. Segment margin declined in 2018 compared to 2017 as a result of the factors above. Higher segment earnings in 2017 compared to 2016 were primarily due to higher sales in China, which included a price increase, partially offset by higher steel costs, higher fees paid to installers and increased SG&A expenses. Higher SG&A expenses in China were primarily due to the expansion of water treatment and air purification product retail outlets in tier 2 and tier 3 cities, higher advertising expenses related to brand building in our newer product categories and higher water treatment product development engineering costs. We expect our 2019 Rest of World segment margin will be approximately 12 to 12.5 percent due to lower sales and profitability in China. LIQUIDITY AND CAPITAL RESOURCES Our working capital was $853.2 million at December 31, 2018 compared with $973.1 million and $791.2 million at December 31, 2017 and December 31, 2016, respectively. Approximately $312 million in foreign cash was repatriated in 2018 and utilized to repay floating rate debt, pay dividends and repurchase shares. The decline in cash, cash equivalents and marketable securities balances more than offset sales-related increases in accounts receivable, and explains the majority of the decline in working capital in 2018. Cash generation in China and sales-related increases in accounts receivable, and inventory levels led to the majority of the increase in working capital in 2017. As of December 31, 2018, essentially all of our $645.0 million of cash, cash equivalents and marketable securities was held by our foreign subsidiaries. We expect to repatriate approximately $150 million in the first half of 2019 and use the proceeds to repay floating rate debt. Cash provided by operating activities during 2018 was $448.9 million compared with $326.4 million during 2017 and $446.6 million during 2016. The increase in cash flows in 2018 compared to 2017 was primarily due to higher earnings and lower outlays for working capital in 2018. The decline in cash flows in 2017 compared to 2016 was primarily due to higher outlays for working capital than the below normal levels experienced in 2016, which more than offset the impact of higher earnings in 2017. Our capital expenditures were $85.2 million in 2018, $94.2 million in 2017 and $80.7 million in 2016. We broke ground in 2016 on the construction of a new water treatment and air purification products manufacturing facility in Nanjing, China, to support the expected growth of these products in China. The facility became operational in May 2018. Included in 2018 capital expenditures were approximately $13 million related to capacity expansion in China. Included in 2017 capital expenditures were approximately $24 million related to capacity expansion in China. Included in 2016 capital expenditures were approximately $13 million related to capacity expansion in China as well as approximately $11 million related to the continuation of our enterprise resource planning (ERP) system implementation. For 2019, we project approximately $85 million of capital expenditures and approximately $75 million of depreciation and amortization expense. In November 2016, we issued $45 million of fixed rate term notes in two tranches to two insurance companies. Principal payments commence in 2023 and 2028 and the notes mature in 2029 and 2034, respectively. The notes carry interest rates of 2.87 and 3.10, respectively. We used proceeds of the notes to pay down borrowings under our revolving credit facility. In December 2016, we completed a $500 million multi-currency five year revolving credit facility with a group of nine banks. The facility has an accordion provision which allows it to be increased up to $700 million if certain conditions (including lender approval) are satisfied. Borrowing rates under the facility are determined by our leverage ratio. The facility requires us to maintain two financial covenants, a leverage ratio test and an interest coverage test, and we were in compliance with the covenants as of December 31, 2018. The facility backs up commercial paper and credit line borrowings, and it expires on December 15, 2021. As a result of the long-term nature of this facility, the commercial paper and credit line borrowings as well as drawings under the facility are classified as long-term debt.
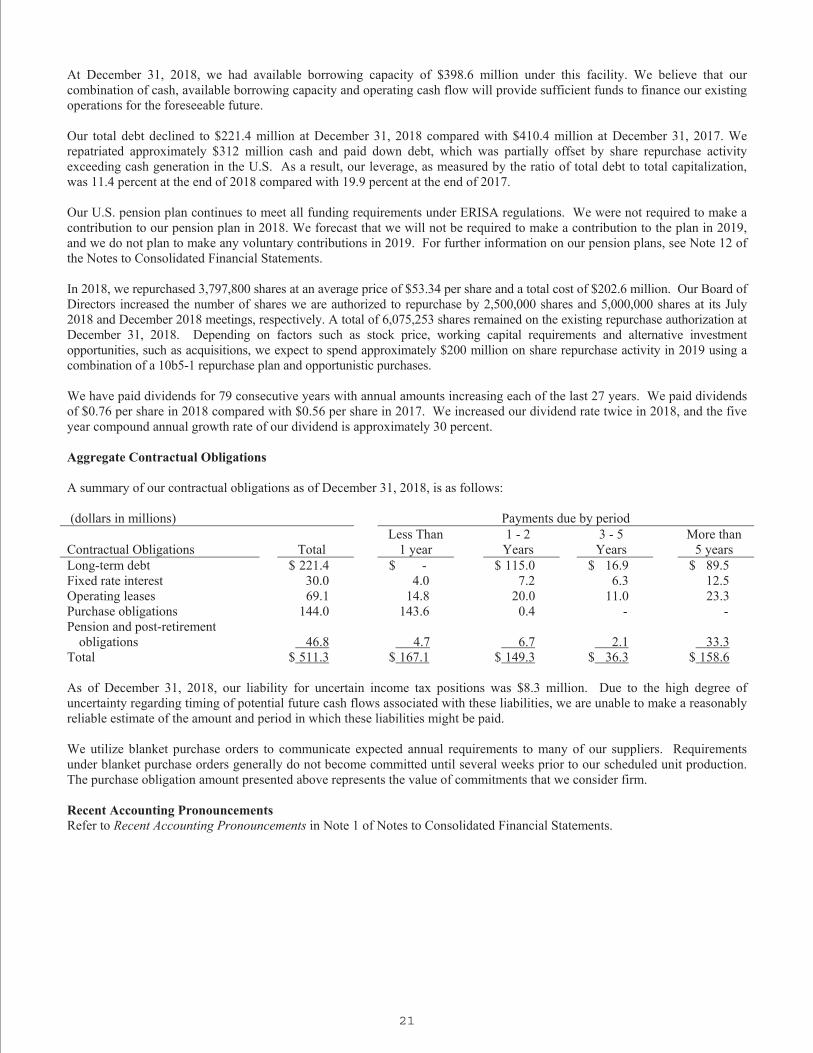
21
At December 31, 2018, we had available borrowing capacity of $398.6 million under this facility. We believe that our combination of cash, available borrowing capacity and operating cash flow will provide sufficient funds to finance our existing operations for the foreseeable future. Our total debt declined to $221.4 million at December 31, 2018 compared with $410.4 million at December 31, 2017. We repatriated approximately $312 million cash and paid down debt, which was partially offset by share repurchase activity exceeding cash generation in the U.S. As a result, our leverage, as measured by the ratio of total debt to total capitalization, was 11.4 percent at the end of 2018 compared with 19.9 percent at the end of 2017. Our U.S. pension plan continues to meet all funding requirements under ERISA regulations. We were not required to make a contribution to our pension plan in 2018. We forecast that we will not be required to make a contribution to the plan in 2019, and we do not plan to make any voluntary contributions in 2019. For further information on our pension plans, see Note 12 of the Notes to Consolidated Financial Statements. In 2018, we repurchased 3,797,800 shares at an average price of $53.34 per share and a total cost of $202.6 million. Our Board of Directors increased the number of shares we are authorized to repurchase by 2,500,000 shares and 5,000,000 shares at its July 2018 and December 2018 meetings, respectively. A total of 6,075,253 shares remained on the existing repurchase authorization at December 31, 2018. Depending on factors such as stock price, working capital requirements and alternative investment opportunities, such as acquisitions, we expect to spend approximately $200 million on share repurchase activity in 2019 using a combination of a 10b5-1 repurchase plan and opportunistic purchases. We have paid dividends for 79 consecutive years with annual amounts increasing each of the last 27 years. We paid dividends of $0.76 per share in 2018 compared with $0.56 per share in 2017. We increased our dividend rate twice in 2018, and the five year compound annual growth rate of our dividend is approximately 30 percent. Aggregate Contractual Obligations A summary of our contractual obligations as of December 31, 2018, is as follows: (dollars in millions) Payments due by period Contractual Obligations
Total
Less Than 1 year
1 - 2 Years
3 - 5 Years
More than 5 years
Long-term debt $ 221.4 $ - $ 115.0 $ 16.9 $ 89.5 Fixed rate interest 30.0 4.0 7.2 6.3 12.5 Operating leases 69.1 14.8 20.0 11.0 23.3 Purchase obligations 144.0 143.6 0.4 - - Pension and post-retirement
obligations
46.8 4.7 6.7 2.1 33.3 Total $ 511.3 $ 167.1 $ 149.3 $ 36.3 $ 158.6 As of December 31, 2018, our liability for uncertain income tax positions was $8.3 million. Due to the high degree of uncertainty regarding timing of potential future cash flows associated with these liabilities, we are unable to make a reasonably reliable estimate of the amount and period in which these liabilities might be paid. We utilize blanket purchase orders to communicate expected annual requirements to many of our suppliers. Requirements under blanket purchase orders generally do not become committed until several weeks prior to our scheduled unit production. The purchase obligation amount presented above represents the value of commitments that we consider firm. Recent Accounting Pronouncements Refer to Recent Accounting Pronouncements in Note 1 of Notes to Consolidated Financial Statements.
22
Critical Accounting Policies Our accounting policies are described in Note 1 of Notes to Consolidated Financial Statements. Also as disclosed in Note 1, the preparation of financial statements in conformity with accounting principles generally accepted in the U.S. requires the use of estimates and assumptions about future events that affect the amounts reported in the financial statements and accompanying notes. Future events and their effects cannot be determined with absolute certainty. Therefore, the determination of estimates requires the exercise of judgment. Actual results inevitably will differ from those estimates, and such differences may be material to the financial statements.
The most significant accounting estimates inherent in the preparation of our financial statements include estimates associated with the evaluation of the impairment of goodwill and indefinite-lived intangible assets, as well as significant estimates used in the determination of liabilities related to warranty activity, product liability and pensions. Various assumptions and other factors underlie the determination of these significant estimates. The process of determining significant estimates is fact-specific and takes into account factors such as historical experience and trends, and in some cases, actuarial techniques. We monitor these significant factors and adjustments are made as facts and circumstances dictate. Historically, actual results have not significantly deviated from those determined using the estimates described above. Goodwill and Indefinite-lived Intangible Assets
In conformity with U.S. Generally Accepted Accounting Principles (GAAP), goodwill and indefinite-lived intangible assets are tested for impairment annually or more frequently if events or changes in circumstances indicate that the assets might be impaired. We perform impairment reviews for our reporting units using a fair-value method based on management’s judgments and assumptions. The fair value represents the estimated amount at which a reporting unit could be bought or sold in a current transaction between willing parties on an arm’s-length basis. The estimated fair value is then compared with the carrying amount of the reporting unit, including recorded goodwill. We are subject to financial statement risk to the extent that goodwill and indefinite-lived intangible assets become impaired. Any impairment review is, by its nature, highly judgmental as estimates of future sales, earnings and cash flows are utilized to determine fair values. However, we believe that we conduct thorough and competent annual valuations of goodwill and indefinite-lived intangible assets and that there has been no impairment in goodwill or indefinite-lived assets in 2018. Product warranty Our products carry warranties that generally range from one to ten years and are based on terms that are generally accepted in the market. We provide for the estimated cost of product warranty at the time of sale. The product warranty provision is estimated based upon warranty loss experience using actual historical failure rates and estimated costs of product replacement. The variables used in the calculation of the provision are reviewed at least annually. At times, warranty issues may arise which are beyond the scope of our historical experience. We provide for any such warranty issues as they become known and estimable. While our warranty costs have historically been within calculated estimates, it is possible that future warranty costs could differ significantly from those estimates. The allocation of the warranty liability between current and long-term is based on the expected warranty liability to be paid in the next year as determined by historical product failure rates. At December 31, 2018 and 2017, our reserve for product warranties was $139.3 million and $141.2 million, respectively. Product liability Due to the nature of our products, we are subject to product liability claims in the normal course of business. We maintain insurance to reduce our risk. Most insurance coverage includes self-insured retentions that vary by year. In 2018, we maintained a self-insured retention of $7.5 million per occurrence with an aggregate insurance limit of $125.0 million. We establish product liability reserves for our self-insured retention portion of any known outstanding matters based on the likelihood of loss and our ability to reasonably estimate such loss. There is inherent uncertainty as to the eventual resolution of unsettled matters due to the unpredictable nature of litigation. We make estimates based on available information and our best judgment after consultation with appropriate advisors and experts. We periodically revise estimates based upon changes to facts or circumstances. We also utilize an actuary to calculate reserves required for estimated incurred but not reported claims as well as to estimate the effect of adverse development of claims over time. At December 31, 2018 and 2017, our reserve for product liability was $39.3 million and $40.1 million, respectively.
23
Pensions We have significant pension benefit costs that are developed from actuarial valuations. The valuations reflect key assumptions regarding, among other things, discount rates, expected return on plan assets, retirement ages, and years of service. Consideration is given to current market conditions, including changes in interest rates in making these assumptions. Our assumption for the expected return on plan assets was 7.15 percent in 2018 and 7.50 percent in 2017. The discount rate used to determine net periodic pension costs decreased to 3.65 percent in 2018 from 4.15 percent in 2017. For 2019, our expected return on plan assets is 7.15 percent and our discount rate is 4.32 percent. In developing our expected return on plan assets, we evaluate our pension plan’s current and target asset allocation, the expected long-term rates of return of equity and bond indices and the actual historical returns of our pension plan. Our plan’s target allocation to equity managers is approximately 30 to 60 percent, with the remainder allocated primarily to bond managers, private equity managers and real estate managers. Our actual asset allocation as of December 31, 2018, was 40 percent to equity managers, 48 percent to bond managers, 10 percent to real estate managers, and two percent to private equity managers. We regularly review our actual asset allocation and periodically rebalance our investments to our targeted allocation when considered appropriate. Our pension plan’s historical ten-year and 25-year compounded annualized returns are 8.9 percent and 8.5 percent, respectively. We believe that with our target allocation and the expected long-term returns of equity and bond indices as well as our actual historical returns, our 7.15 percent expected return on plan assets for 2019 is reasonable.
The discount rate assumptions used to determine future pension obligations at December 31, 2018 and 2017 were based on the Aon AA Only Above Median yield curve, which was designed by Aon to provide a means for plan sponsors to value the liabilities of their postretirement benefit plans. The AA Only Above Median yield curve represents a series of annual discount rates from bonds with AA minimum average rating as rated by Moody’s Investor Service, Standard & Poor’s and Fitch Ratings. We will continue to evaluate our actuarial assumptions at least annually, and we will adjust the assumptions as necessary. We recognized pension income of $8.7 million, $9.1 million, and $6.9 million in 2018, 2017, and 2016, respectively. Costs associated with our replacement retirement plan in 2018 were approximately $6 million, consistent with 2017. We made changes to our pension plan including closing the plan to new entrants effective January 1, 2010, and the sunset of our plan for the majority of our employees on December 31, 2014. Lowering the expected return on plan assets by 25 basis points would decrease our net pension income for 2018 by approximately $2.0 million. Lowering the discount rate by 25 basis points would increase our 2018 net pension income by approximately $0.1 million. Non-GAAP Measures We provide non-GAAP measures (adjusted earnings, adjusted earnings per share (EPS) and adjusted segment earnings) that exclude restructuring and impairment expenses in 2018 and the impact of a one-time charge associated with U.S. Tax Reform in 2017. We believe that the measures of adjusted earnings, adjusted EPS and adjusted segment earnings provide useful information to investors about our performance and allow management and our investors to better compare our performance year over year.
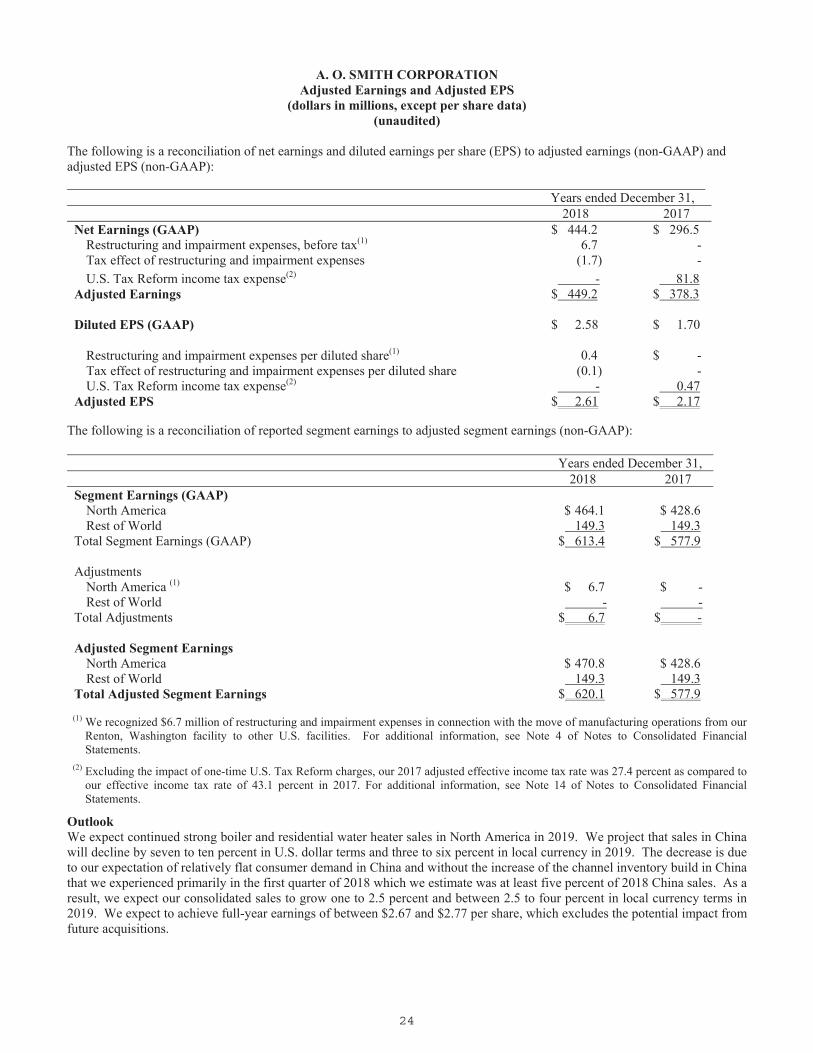
24
A. O. SMITH CORPORATION Adjusted Earnings and Adjusted EPS
(dollars in millions, except per share data) (unaudited)
The following is a reconciliation of net earnings and diluted earnings per share (EPS) to adjusted earnings (non-GAAP) and adjusted EPS (non-GAAP):
Years ended December 31, 2018 2017 Net Earnings (GAAP) $ 444.2 $ 296.5
Restructuring and impairment expenses, before tax(1) 6.7 - Tax effect of restructuring and impairment expenses (1.7) -
U.S. Tax Reform income tax expense(2) - 81.8 Adjusted Earnings $ 449.2 $ 378.3 Diluted EPS (GAAP) $ 2.58 $ 1.70
Restructuring and impairment expenses per diluted share(1) 0.4 $ - Tax effect of restructuring and impairment expenses per diluted share (0.1) - U.S. Tax Reform income tax expense(2) - 0.47
Adjusted EPS $ 2.61 $ 2.17 The following is a reconciliation of reported segment earnings to adjusted segment earnings (non-GAAP):
Years ended December 31, 2018 2017 Segment Earnings (GAAP)
North America $ 464.1 $ 428.6 Rest of World 149.3 149.3
Total Segment Earnings (GAAP) $ 613.4 $ 577.9
Adjustments North America (1) $ 6.7 $ - Rest of World - -
Total Adjustments $ 6.7 $ -
Adjusted Segment Earnings North America $ 470.8 $ 428.6 Rest of World 149.3 149.3
Total Adjusted Segment Earnings $ 620.1 $ 577.9
(1) We recognized $6.7 million of restructuring and impairment expenses in connection with the move of manufacturing operations from our Renton, Washington facility to other U.S. facilities. For additional information, see Note 4 of Notes to Consolidated Financial Statements.
(2) Excluding the impact of one-time U.S. Tax Reform charges, our 2017 adjusted effective income tax rate was 27.4 percent as compared to our effective income tax rate of 43.1 percent in 2017. For additional information, see Note 14 of Notes to Consolidated Financial Statements.
Outlook We expect continued strong boiler and residential water heater sales in North America in 2019. We project that sales in China will decline by seven to ten percent in U.S. dollar terms and three to six percent in local currency in 2019. The decrease is due to our expectation of relatively flat consumer demand in China and without the increase of the channel inventory build in China that we experienced primarily in the first quarter of 2018 which we estimate was at least five percent of 2018 China sales. As a result, we expect our consolidated sales to grow one to 2.5 percent and between 2.5 to four percent in local currency terms in 2019. We expect to achieve full-year earnings of between $2.67 and $2.77 per share, which excludes the potential impact from future acquisitions.

25
OTHER MATTERS Environmental Our operations are governed by a number of federal, foreign, state, local and environmental laws concerning the generation and management of hazardous materials, the discharge of pollutants into the environment and remediation of sites owned by the company or third parties. We have expended financial and managerial resources complying with such laws. Expenditures related to environmental matters were not material in 2018 and we do not expect them to be material in any single year. We have reserves associated with environmental obligations at various facilities and we believe these reserves together with available insurance coverage are sufficient to cover reasonably anticipated remediation costs. Although we believe that our operations are substantially in compliance with such laws and maintain procedures designed to maintain compliance, there are no assurances that substantial additional costs for compliance will not be incurred in the future. However, since the same laws govern our competitors, we should not be placed at a competitive disadvantage. Market Risk We are exposed to various types of market risks, primarily currency. We monitor our risks in such areas on a continuous basis and generally enter into forward contracts to minimize such exposures for periods of less than one year. We do not engage in speculation in our derivatives strategies. Further discussion regarding derivative instruments is contained in Note 1 of Notes to Consolidated Financial Statements. We enter into foreign currency forward contracts to minimize the effect of fluctuating foreign currencies. At December 31, 2018, we had net foreign currency contracts outstanding with notional values of $210.9 million. Assuming a hypothetical ten percent movement in the respective currencies, the potential foreign exchange gain or loss associated with the change in exchange rates would amount to $21.1 million. However, gains and losses from our forward contracts will be offset by gains and losses in the underlying transactions being hedged. Our earnings exposure related to movements in interest rates is primarily derived from outstanding floating-rate debt instruments that are determined by short-term money market rates. At December 31, 2018, we had $101.4 million in outstanding floating-rate debt with a weighted-average interest rate of 2.9 percent at year end. A hypothetical ten percent annual increase or decrease in the year-end average cost of our outstanding floating-rate debt would result in a change in annual pre-tax interest expense of approximately $0.3 million. Forward-Looking Statements This filing contains statements that we believe are “forward-looking statements” within the meaning of the Private Securities Litigation Reform Act of 1995. Forward-looking statements generally can be identified by the use of words such as “may,” “will,” “expect,” “intend,” “estimate,” “anticipate,” “believe,” “forecast,” “guidance” or words of similar meaning. All forward-looking statements are subject to risks and uncertainties that could cause actual results to differ materially from those anticipated as of the date of this filing. Important factors that could cause actual results to differ materially from these expectations include, among other things, the following: a further weakening of the Chinese economy and/or a further decline in the growth rate of consumer spending or housing sales in China; negative impact to our businesses from international tariffs and trade disputes; potential weakening in the high efficiency boiler segment in the U.S.; significant volatility in raw material prices; our inability to implement or maintain pricing actions; potential weakening in U.S. residential or commercial construction or instability in our replacement markets; foreign currency fluctuations; our inability to successfully integrate or achieve our strategic objectives resulting from acquisitions; competitive pressures on our businesses; the impacts of potential information technology or data security breaches; changes in government regulations or regulatory requirements; and adverse developments in general economic, political and business conditions in key regions of the world. Forward-looking statements included in this filing are made only as of the date of this filing, and we are under no obligation to update these statements to reflect subsequent events or circumstances. All subsequent written and oral forward-looking statements attributed to the Company, or persons acting on our behalf, are qualified entirely by these cautionary statements. ITEM 7A – QUANTITATIVE AND QUALITATIVE DISCLOSURES ABOUT MARKET RISK See “Market Risk” above.
26
ITEM 8 – FINANCIAL STATEMENTS AND SUPPLEMENTARY DATA REPORT OF INDEPENDENT REGISTERED PUBLIC ACCOUNTING FIRM The Board of Directors and Stockholders A. O. Smith Corporation Opinion on the Financial Statements We have audited the accompanying consolidated balance sheets of A. O. Smith Corporation (the Company) as of December 31, 2018 and 2017, the related consolidated statements of earnings, comprehensive earnings, stockholders’ equity and cash flows for each of the three years in the period ended December 31, 2018, and the related notes and financial statement schedule listed in the index at Item 15(a) (collectively referred to as the “consolidated financial statements”). In our opinion, the consolidated financial statements present fairly, in all material respects, the financial position of the Company at December 31, 2018 and 2017, and the results of its operations and its cash flows for each of the three years in the period ended December 31, 2018, in conformity with U.S. generally accepted accounting principles. We also have audited, in accordance with the standards of the Public Company Accounting Oversight Board (United States) (PCAOB), the Company’s internal control over financial reporting as of December 31, 2018, based on criteria established in Internal Control - Integrated Framework issued by the Committee of Sponsoring Organizations of the Treadway Commission (2013 framework) and our report dated February 15, 2019 expressed an unqualified opinion thereon. Basis for Opinion These financial statements are the responsibility of the Company’s management. Our responsibility is to express an opinion on the Company’s financial statements based on our audits. We are a public accounting firm registered with the PCAOB and are required to be independent with respect to the Company in accordance with the U.S. federal securities laws and the applicable rules and regulations of the Securities and Exchange Commission and the PCAOB. We conducted our audits in accordance with the standards of the PCAOB. Those standards require that we plan and perform the audit to obtain reasonable assurance about whether the financial statements are free of material misstatement, whether due to error or fraud. Our audits included performing procedures to assess the risks of material misstatement of the financial statements, whether due to error or fraud, and performing procedures that respond to those risks. Such procedures include examining, on a test basis, evidence regarding the amounts and disclosures in the financial statements. Our audits also included evaluating the accounting principles used and significant estimates made by management, as well as evaluating the overall presentation of the financial statements. We believe that our audits provide a reasonable basis for our opinion. /s/ Ernst & Young LLP
We have served as A. O. Smith Corporation’s auditor since 1917. Milwaukee, Wisconsin February 15, 2019

27
CONSOLIDATED BALANCE SHEETS
December 31 (dollars in millions) 2018 2017 Assets Current Assets Cash and cash equivalents $ 259.7 $ 346.6 Marketable securities 385.3 473.4 Receivables 647.3 592.7 Inventories 304.7 297.0 Other current assets 41.5 57.2 Total Current Assets 1,638.5 1,766.9 Net property, plant and equipment 540.0 528.9 Goodwill 513.0 516.7 Other intangibles 293.1 308.7 Other assets 86.9 76.2 Total Assets $ 3,071.5 $ 3,197.4 Liabilities Current Liabilities Trade payables $ 543.8 $ 535.0 Accrued payroll and benefits 79.4 90.8 Accrued liabilities 120.4 116.0 Product warranties 41.7 44.5 Long-term debt due within one year - 7.5 Total Current Liabilities 785.3 793.8 Long-term debt 221.4 402.9 Product warranties 97.7 97.9 Pension liabilities 49.4 48.1 Other liabilities 200.7 209.8 Total Liabilities 1,354.5 1,552.5 Commitments and contingencies - -
Stockholders’ Equity Preferred Stock - - Class A Common Stock (shares issued 26,191,327 and 26,239,559) 131.0 131.2 Common Stock (shares issued 164,516,267 and 164,468,033) 164.5 164.5 Capital in excess of par value 496.7 486.5 Retained earnings 2,102.8 1,788.7 Accumulated other comprehensive loss (350.8) (299.5) Treasury stock at cost (827.2) (626.5) Total Stockholders’ Equity 1,717.0 1,644.9 Total Liabilities and Stockholders’ Equity $ 3,071.5 $ 3,197.4
See accompanying notes which are an integral part of these statements.
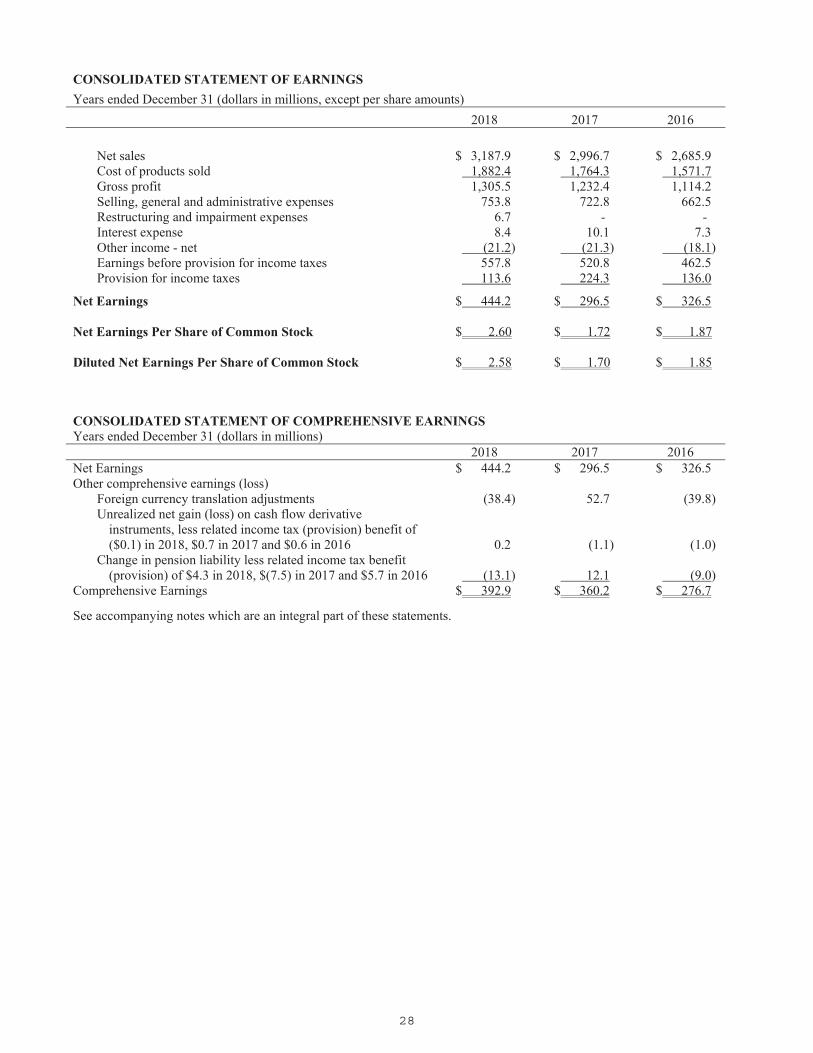
28
CONSOLIDATED STATEMENT OF EARNINGS
Years ended December 31 (dollars in millions, except per share amounts)
2018 2017 2016
Net sales $ 3,187.9 $ 2,996.7 $ 2,685.9 Cost of products sold 1,882.4 1,764.3 1,571.7 Gross profit 1,305.5 1,232.4 1,114.2 Selling, general and administrative expenses 753.8 722.8 662.5 Restructuring and impairment expenses 6.7 - - Interest expense 8.4 10.1 7.3 Other income - net (21.2) (21.3) (18.1) Earnings before provision for income taxes 557.8 520.8 462.5 Provision for income taxes 113.6 224.3 136.0
Net Earnings $ 444.2 $ 296.5 $ 326.5
Net Earnings Per Share of Common Stock $ 2.60 $ 1.72 $ 1.87
Diluted Net Earnings Per Share of Common Stock $ 2.58 $ 1.70 $ 1.85
CONSOLIDATED STATEMENT OF COMPREHENSIVE EARNINGS Years ended December 31 (dollars in millions)
2018 2017 2016 Net Earnings $ 444.2 $ 296.5 $ 326.5 Other comprehensive earnings (loss)
Foreign currency translation adjustments (38.4) 52.7 (39.8) Unrealized net gain (loss) on cash flow derivative
instruments, less related income tax (provision) benefit of ($0.1) in 2018, $0.7 in 2017 and $0.6 in 2016 0.2 (1.1) (1.0)
Change in pension liability less related income tax benefit (provision) of $4.3 in 2018, $(7.5) in 2017 and $5.7 in 2016 (13.1) 12.1 (9.0)
Comprehensive Earnings $ 392.9 $ 360.2 $ 276.7
See accompanying notes which are an integral part of these statements.

29
CONSOLIDATED STATEMENT OF CASH FLOWS Years ended December 31 (dollars in millions) 2018 2017 2016 Operating Activities Net earnings $ 444.2 $ 296.5 $ 326.5 Adjustments to reconcile earnings to cash provided by (used in)
operating activities: Depreciation and amortization 71.9 70.1 65.1 U.S. Tax Reform income tax expense - 81.8 -
Stock based compensation expense 10.1 9.9 9.4 Net changes in operating assets and liabilities, net of acquisitions: Current assets and liabilities (40.0) (127.8) 68.5 Noncurrent assets and liabilities (37.3) (4.1) (22.9)
Cash Provided by Operating Activities 448.9 326.4 446.6 Investing Activities Acquisitions of businesses - (43.1) (90.8) Investments in marketable securities (523.4) (583.5) (563.8) Proceeds from sales of marketable securities 595.9 562.7 435.1 Capital expenditures (85.2) (94.2) (80.7) Cash Used in Investing Activities (12.7) (158.1) (300.2) Financing Activities Long-term debt (repaid) incurred (189.0) 86.5 74.1 Common stock repurchases (202.6) (139.1) (135.2) Net proceeds (payments) from stock option activity 0.9 (0.9) 5.7 Acquisition related contingent payments (2.3) (1.7) - Dividends paid (130.1) (96.9) (84.2) Cash Used in Financing Activities (523.1) (152.1) (139.6) Net (decrease) increase in cash and cash equivalents (86.9) 16.2 6.8 Cash and cash equivalents-beginning of year 346.6 330.4 323.6 Cash and Cash Equivalents-End of Year $ 259.7 $ 346.6 $ 330.4 See accompanying notes, which are an integral part of these statements.
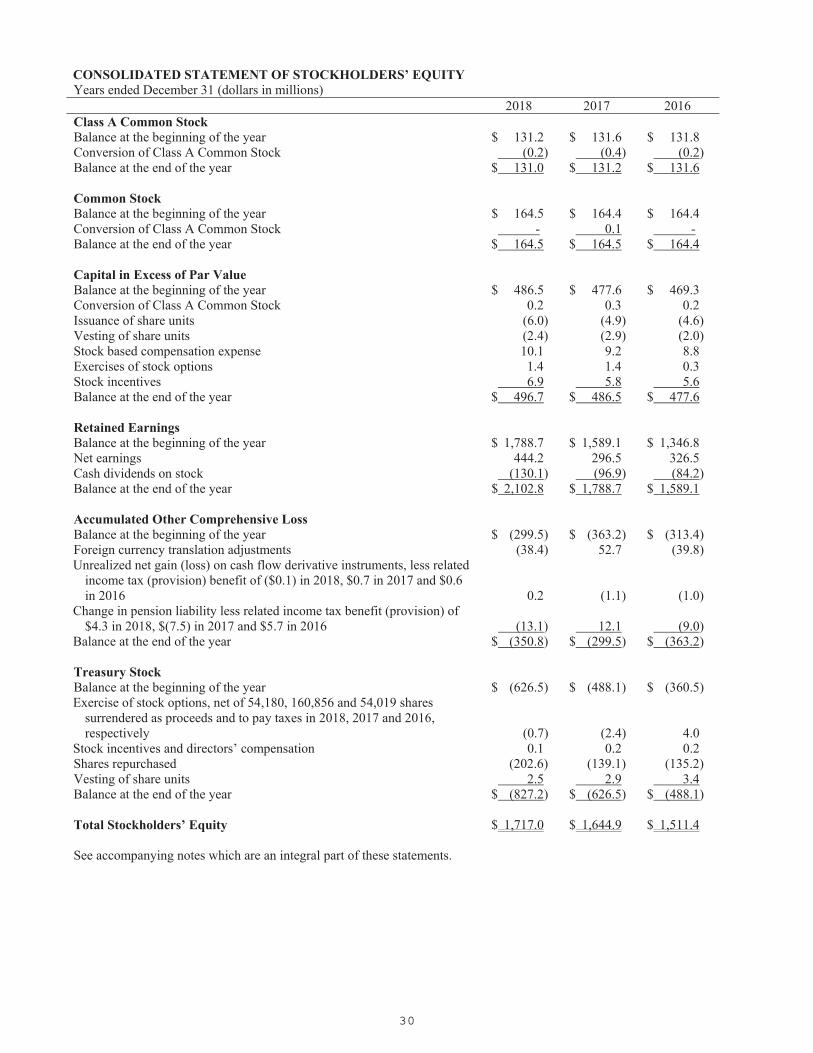
30
CONSOLIDATED STATEMENT OF STOCKHOLDERS’ EQUITY Years ended December 31 (dollars in millions) 2018 2017 2016 Class A Common Stock Balance at the beginning of the year $ 131.2 $ 131.6 $ 131.8 Conversion of Class A Common Stock (0.2) (0.4) (0.2) Balance at the end of the year $ 131.0 $ 131.2 $ 131.6 Common Stock Balance at the beginning of the year $ 164.5 $ 164.4 $ 164.4 Conversion of Class A Common Stock - 0.1 - Balance at the end of the year $ 164.5 $ 164.5 $ 164.4 Capital in Excess of Par Value Balance at the beginning of the year $ 486.5 $ 477.6 $ 469.3 Conversion of Class A Common Stock 0.2 0.3 0.2 Issuance of share units (6.0) (4.9) (4.6) Vesting of share units (2.4) (2.9) (2.0) Stock based compensation expense 10.1 9.2 8.8 Exercises of stock options 1.4 1.4 0.3 Stock incentives 6.9 5.8 5.6 Balance at the end of the year $ 496.7 $ 486.5 $ 477.6 Retained Earnings Balance at the beginning of the year $ 1,788.7 $ 1,589.1 $ 1,346.8 Net earnings 444.2 296.5 326.5 Cash dividends on stock (130.1) (96.9) (84.2) Balance at the end of the year $ 2,102.8 $ 1,788.7 $ 1,589.1 Accumulated Other Comprehensive Loss Balance at the beginning of the year $ (299.5) $ (363.2) $ (313.4) Foreign currency translation adjustments (38.4) 52.7 (39.8) Unrealized net gain (loss) on cash flow derivative instruments, less related
income tax (provision) benefit of ($0.1) in 2018, $0.7 in 2017 and $0.6 in 2016 0.2 (1.1) (1.0)
Change in pension liability less related income tax benefit (provision) of $4.3 in 2018, $(7.5) in 2017 and $5.7 in 2016 (13.1) 12.1 (9.0)
Balance at the end of the year $ (350.8) $ (299.5) $ (363.2) Treasury Stock Balance at the beginning of the year $ (626.5) $ (488.1) $ (360.5) Exercise of stock options, net of 54,180, 160,856 and 54,019 shares
surrendered as proceeds and to pay taxes in 2018, 2017 and 2016, respectively (0.7) (2.4) 4.0
Stock incentives and directors’ compensation 0.1 0.2 0.2 Shares repurchased (202.6) (139.1) (135.2) Vesting of share units 2.5 2.9 3.4 Balance at the end of the year $ (827.2) $ (626.5) $ (488.1) Total Stockholders’ Equity $ 1,717.0 $ 1,644.9 $ 1,511.4 See accompanying notes which are an integral part of these statements.

31
NOTES TO CONSOLIDATED FINANCIAL STATEMENTS
1. Organization and Significant Accounting Policies
Organization. A. O. Smith Corporation (A. O. Smith or the Company) is comprised of two reporting segments: North America and Rest of World. The Rest of World segment is primarily comprised of China, Europe and India. Both segments manufacture and market comprehensive lines of residential and commercial gas and electric water heaters, boilers, tanks and water treatment products. Both segments primarily manufacture and market in their respective regions of the world. The Rest of World segment also manufacturers and markets in-home air purification products in China.
Consolidation. The consolidated financial statements include the accounts of the Company and its wholly owned subsidiaries after elimination of intercompany transactions.
Use of estimates. The preparation of financial statements in conformity with accounting principles generally accepted in the United States (U.S.) requires management to make estimates and assumptions that affect the amounts reported in the accompanying financial statements and notes. Actual results could differ from those estimates.
Fair value of financial instruments. The carrying amounts of cash, cash equivalents, marketable securities, receivables, floating rate debt and trade payables approximated fair value as of December 31, 2018 and 2017, due to the short maturities or frequent rate resets of these instruments. As of December 31, 2018 and 2017, the carrying value of term notes with insurance companies was approximately $120.0 million and $127.5 million, respectively, which approximated fair value in both years. The fair value was estimated based on current rates offered for debt with similar maturities.
Foreign currency translation. For all subsidiaries outside the U.S., with the exception of its Barbados, Hong Kong and Mexican companies and its non-operating companies in the Netherlands, the Company uses the local currency as the functional currency. For those operations using a functional currency other than the U.S. dollar, assets and liabilities were translated into U.S. dollars at year-end exchange rates, and revenues and expenses were translated at weighted-average exchange rates. The resulting translation adjustments were recorded as a separate component of stockholders’ equity. The Barbados, Hong Kong, Mexican and Netherlands companies use the U.S. dollar as the functional currency. Gains and losses from foreign currency transactions were included in net earnings and were not significant in 2018, 2017, or 2016. Cash and cash equivalents. The Company considers all highly liquid investments with a maturity of three months or less when purchased to be cash equivalents. Marketable securities. The Company considers all highly liquid investments with maturities greater than 90 days when purchased to be marketable securities. At December 31, 2018, the Company’s marketable securities consisted of bank time deposits with original maturities ranging from 180 days to 12 months and were primarily located at investment grade rated banks in China. Inventory valuation. Inventories are carried at lower of cost and net realizable value. Cost is determined on the last-in, first-out (LIFO) method for a majority of the Company’s domestic inventories, which comprised 64 percent and 59 percent of the Company’s total inventory at December 31, 2018 and 2017, respectively. Inventories of foreign subsidiaries, the remaining domestic inventories and supplies were determined using the first-in, first-out (FIFO) method. Property, plant and equipment. Property, plant and equipment are stated at cost. Depreciation is computed primarily by the straight-line method. The estimated service lives used to compute depreciation are generally 25 to 50 years for buildings, three to 20 years for equipment and three to 15 years for software. Maintenance and repair costs are expensed as incurred. Goodwill and other intangibles. Goodwill and indefinite-lived intangible assets are not amortized but are reviewed for impairment on an annual basis. Separable intangible assets, primarily comprised of customer relationships, that are not deemed to have an indefinite life are amortized on a straight-line basis over their estimated useful lives which range from three to 25 years.

32
1. Organization and Significant Accounting Policies (continued) Impairment of long-lived and amortizable intangible assets. Property, plant and equipment and intangible assets subject to amortization are reviewed for impairment whenever events or changes in circumstances indicate that the carrying amount may not be recoverable. If the sum of the expected undiscounted cash flows is less than the carrying value of the related asset or group of assets, a loss is recognized for the difference between the fair value and carrying value of the asset or group of assets. Such analyses necessarily involve significant judgment. Product warranties. The Company’s products carry warranties that generally range from one to ten years and are based on terms that are consistent with the market. The Company records a liability for the expected cost of warranty-related claims at the time of sale. The allocation of the warranty liability between current and long-term is based on expected warranty claims to be paid in the next year as determined by historical product failure rates. The following table presents the Company’s product warranty liability activity in 2018 and 2017: Years ended December 31 (dollars in millions) 2018 2017 Balance at beginning of year $ 141.2 $ 140.9 Expense 40.7 39.7 Claims settled (42.5) (39.4) Balance at end of year $ 139.4 $ 141.2 Derivative instruments. The Company utilizes certain derivative instruments to enhance its ability to manage currency as well as raw materials price risk. The Company does not enter into contracts for speculative purposes. The fair values of all derivatives are recorded in the consolidated balance sheets. The change in a derivative’s fair value is recorded each period in current earnings or accumulated other comprehensive loss (AOCL), depending on whether the derivative is designated as part of a hedge transaction and if so, the type of hedge transaction. See Note 13, “Derivative Instruments” of the notes to consolidated financial statements for disclosure of the Company’s derivative instruments and hedging activities. Fair Value Measurements. Accounting Standards Codification (ASC) 820 Fair Value Measurements, among other things, defines fair value, establishes a consistent framework for measuring fair value and expands disclosure for each major asset and liability category measured at fair value on either a recurring basis or nonrecurring basis. ASC 820 clarifies that fair value is an exit price, representing the amount that would be received to sell an asset or paid to transfer a liability in an orderly transaction between market participants. As such, fair value is a market-based measurement that should be determined based on assumptions that market participants would use in pricing an asset or liability. As a basis for considering such assumptions, ASC 820 establishes a three-tier fair value hierarchy, which prioritizes the inputs used in measuring fair value as follows: (Level 1) observable inputs such as quoted prices in active markets; (Level 2) inputs, other than the quoted prices in active markets, that are observable either directly or indirectly; and (Level 3) unobservable inputs in which there is little or no market data, which require the reporting entity to develop its own assumptions.
Assets and liabilities measured at fair value are based on the market approach which are prices and other relevant information generated by market transactions involving identical or comparable assets or liabilities. Assets measured at fair value on a recurring basis are as follows (dollars in millions):
Fair Value Measurement Using December 31, 2018 December 31, 2017 Quoted prices in active markets for identical assets (Level 1) $ 385.3 $ 473.4 Significant other observable inputs (Level 2) 7.5 (1.4) There were no changes in the valuation techniques used to measure fair values on a recurring basis.
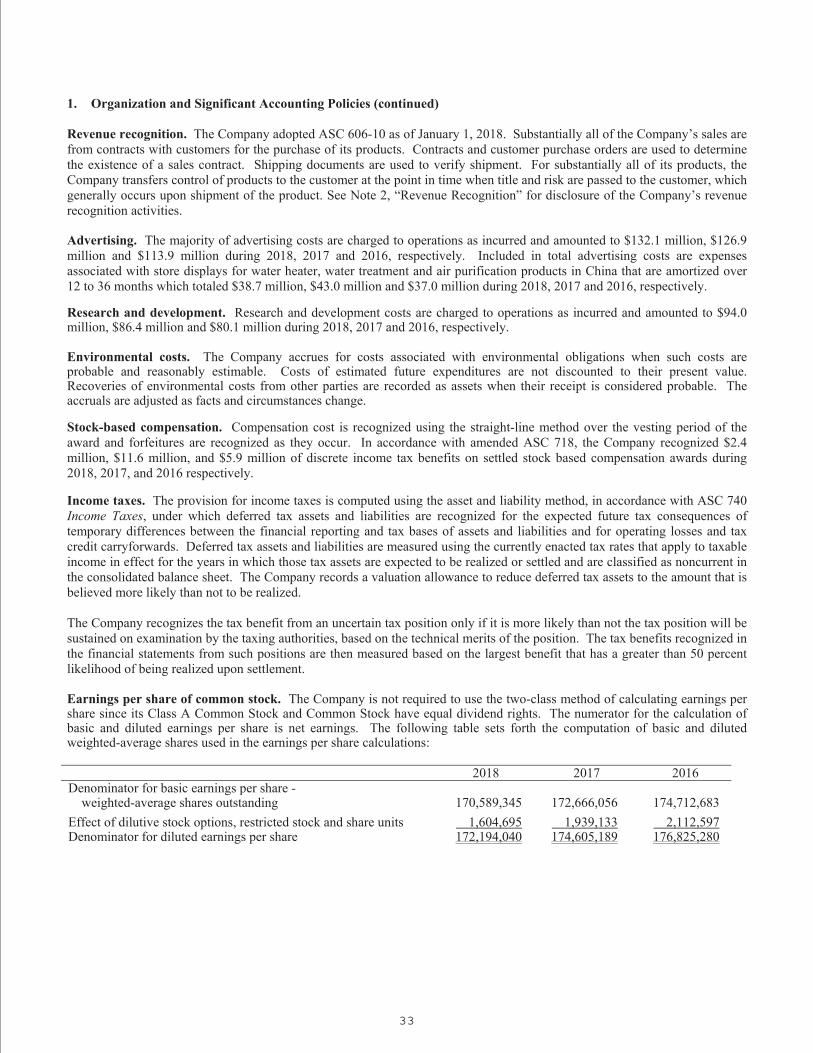
33
1. Organization and Significant Accounting Policies (continued) Revenue recognition. The Company adopted ASC 606-10 as of January 1, 2018. Substantially all of the Company’s sales are from contracts with customers for the purchase of its products. Contracts and customer purchase orders are used to determine the existence of a sales contract. Shipping documents are used to verify shipment. For substantially all of its products, the Company transfers control of products to the customer at the point in time when title and risk are passed to the customer, which generally occurs upon shipment of the product. See Note 2, “Revenue Recognition” for disclosure of the Company’s revenue recognition activities. Advertising. The majority of advertising costs are charged to operations as incurred and amounted to $132.1 million, $126.9 million and $113.9 million during 2018, 2017 and 2016, respectively. Included in total advertising costs are expenses associated with store displays for water heater, water treatment and air purification products in China that are amortized over 12 to 36 months which totaled $38.7 million, $43.0 million and $37.0 million during 2018, 2017 and 2016, respectively. Research and development. Research and development costs are charged to operations as incurred and amounted to $94.0 million, $86.4 million and $80.1 million during 2018, 2017 and 2016, respectively. Environmental costs. The Company accrues for costs associated with environmental obligations when such costs are probable and reasonably estimable. Costs of estimated future expenditures are not discounted to their present value. Recoveries of environmental costs from other parties are recorded as assets when their receipt is considered probable. The accruals are adjusted as facts and circumstances change. Stock-based compensation. Compensation cost is recognized using the straight-line method over the vesting period of the award and forfeitures are recognized as they occur. In accordance with amended ASC 718, the Company recognized $2.4 million, $11.6 million, and $5.9 million of discrete income tax benefits on settled stock based compensation awards during 2018, 2017, and 2016 respectively.
Income taxes. The provision for income taxes is computed using the asset and liability method, in accordance with ASC 740 Income Taxes, under which deferred tax assets and liabilities are recognized for the expected future tax consequences of temporary differences between the financial reporting and tax bases of assets and liabilities and for operating losses and tax credit carryforwards. Deferred tax assets and liabilities are measured using the currently enacted tax rates that apply to taxable income in effect for the years in which those tax assets are expected to be realized or settled and are classified as noncurrent in the consolidated balance sheet. The Company records a valuation allowance to reduce deferred tax assets to the amount that is believed more likely than not to be realized. The Company recognizes the tax benefit from an uncertain tax position only if it is more likely than not the tax position will be sustained on examination by the taxing authorities, based on the technical merits of the position. The tax benefits recognized in the financial statements from such positions are then measured based on the largest benefit that has a greater than 50 percent likelihood of being realized upon settlement. Earnings per share of common stock. The Company is not required to use the two-class method of calculating earnings per share since its Class A Common Stock and Common Stock have equal dividend rights. The numerator for the calculation of basic and diluted earnings per share is net earnings. The following table sets forth the computation of basic and diluted weighted-average shares used in the earnings per share calculations: 2018 2017 2016 Denominator for basic earnings per share - weighted-average shares outstanding
170,589,345
172,666,056
174,712,683
Effect of dilutive stock options, restricted stock and share units 1,604,695 1,939,133 2,112,597 Denominator for diluted earnings per share 172,194,040 174,605,189 176,825,280

34
1. Organization and Significant Accounting Policies (continued) On April 11, 2016, the Company’s stockholders approved a proposal to increase the Company’s authorized shares of Common Stock and on September 7, 2016, the Company’s Board of Directors declared a two-for-one stock split of the Company’s Class A Common Stock and Common Stock (including treasury shares) in the form of a 100 percent stock dividend to stockholders of record on September 21, 2016 and payable on October 5, 2016. All references in the financial statements and footnotes to the number of shares outstanding, price per share, per share amounts and stock based compensation data have been recast to reflect the stock split for all periods presented. Reclassifications. Certain amounts from prior years have been reclassified to conform with current year presentation.
Recent Accounting Pronouncements In August 2017, the Financial Accounting Standards Board (FASB) amended Accounting Standards Codification (ASC) 815, Derivatives and Hedging (issued under Accounting Standards Update (ASU) 2017-12, “Targeted Improvements to Accounting for Hedging Activities”). Under this amendment, more hedging strategies are eligible for hedge accounting treatment. ASU 2017-12 also amends the presentation and disclosure requirements regarding derivatives and hedging and changes how companies assess effectiveness. The Company adopted the amendment on January 1, 2018 and the adoption of ASU 2017-12 did not have a material impact on its consolidated balance sheets, statements of earnings or statements of cash flows.
In May 2017, the FASB amended ASC 718, Compensation – Stock Compensation (issued under ASU 2017-09, “Scope of Modification Accounting”). This amendment clarifies when changes to the terms or conditions of share-based payment awards must be accounted for as a modification. Under this amendment, modification accounting must be used if three conditions are met: the fair value changes, the vesting conditions change, or the classification of the award changes due to the changes in terms or conditions. The Company adopted the amendment on January 1, 2018 and the adoption of ASU 2017-09 did not have a material impact on its consolidated balance sheets, statements of earnings or statements of cash flows.
In March 2017, the FASB amended ASC 715, Compensation – Retirement Benefits (issued under ASU 2017-07, “Improving the Presentation of Net Periodic Pension Cost and Net Periodic Postretirement Benefit Cost”). This amendment changes the way net periodic benefit cost associated with employer-sponsored defined benefit plans is presented in the statement of earnings. Under the amendment, the service cost component of net periodic benefit cost is included in the same lines in the statement of earnings as other employee compensation costs and the other components of net periodic benefit cost must be presented separately outside of income from operations. The Company adopted the amendment on January 1, 2018. As a result of this adoption, for the year ended December 31, 2017 the Company retrospectively reclassified $6.3 million and $4.6 million of non-service cost pension income from cost of products sold and selling, general and administrative expenses, respectively, to other income in the consolidated statement of earnings. The for the year ended December 31, 2016, the Company retrospectively reclassified $5.1 million and $3.6 million of non-service cost pension income from cost of products sold and selling, general and administrative expenses, respectively, to other income in the consolidated statement of earnings. The adoption did not have a material impact on the Company’s consolidated balance sheets, statements of earnings or statements of cash flows.
In January 2017, the FASB amended ASC 350, Intangibles – Goodwill and Other (issued under ASU 2017-04, “Simplifying the Test for Goodwill Impairment”). This amendment simplifies the test for goodwill impairment by only requiring an entity to perform an annual or interim goodwill impairment test by comparing the fair value of a reporting unit with its carrying amount and recognize an impairment charge for the amount that the carrying amount exceeds the reporting unit’s fair value. Any loss recognized should not exceed the total amount of goodwill allocated to that reporting unit. The amendment requires adoption on January 1, 2020. The Company does not expect that the adoption of ASU 2017-04 will have a material impact on its consolidated balance sheets, statements of earnings or statements of cash flows. In October 2016, the FASB amended ASC 740, Income Taxes (issued under ASU 2016-16). This amendment requires that the income tax consequences of an intra-entity transfer of an asset other than inventory be recognized when the transfer occurs. The Company adopted this amendment on January 1, 2018 and the adoption of amended ASU 2016-16 did not have a material impact on its consolidated balance sheets, statement of earnings or statements of cash flows.
In February 2016, the FASB amended ASC 842, Leases (issued under ASU 2016-02). This amendment requires the recognition of lease assets and lease liabilities on the balance sheet for most leasing arrangements currently classified as operating leases. This amendment is effective for periods beginning January 1, 2019. The Company intends to apply the modified retrospective transition method and elect the transition option to use the effective date of January 1, 2019 as the date of initial application. The Company also intends to elect the package of practical expedients and the practical expedient not to separate lease and non-lease components. The Company does not intend to elect the hindsight practical expedient.

35
1. Organization and Significant Accounting Policies (continued) In 2018, the Company completed a comprehensive analysis of its lease population. The impact of adoption will result in the recognition of lease liabilities and corresponding right-of-use assets of approximately $55 million each. The adoption of ASU 2016-02 will not have a material impact on its consolidated balance sheets, statements of earnings or statements of cash flows. In May 2014, the FASB issued ASC 606-10, Revenue from Contracts with Customers (issued under ASU 2014-09). ASU 2014-09 replaces all previously existing revenue recognition guidance. The Company adopted ASU 2014-09 on January 1, 2018 using the full retrospective method and therefore applied the standard to all contracts commencing on or after January 1, 2016. The Company recognized a net after-tax reduction to opening retained earnings of $3.9 million as of January 1, 2016 in connection with the adoption of ASU 2014-09. The adoption of ASU 2014-09 did not have a material impact on the Company’s consolidated balance sheets, statements of earnings or statements of cash flows. See Note 2 “Revenue Recognition” for further discussion. 2. Revenue Recognition Substantially all of the Company’s sales are from contracts with customers for the purchase of its products. Contracts and customer purchase orders are used to determine the existence of a sales contract. Shipping documents are used to verify shipment. For substantially all of its products, the Company transfers control of products to the customer at the point in time when title and risk are passed to the customer, which generally occurs upon shipment of the product. Each unit sold is considered an independent, unbundled performance obligation. The Company’s sales arrangements do not include other performance obligations that are material in the context of the contract. The nature, timing and amount of revenue for a respective performance obligation are consistent for each customer. The Company measures the sales transaction price based upon the payment terms associated with the transaction and whether the sales price is subject to refund or adjustment. Sales and value added taxes are excluded from the measurement of transaction price. The Company’s payment terms for the majority of its customers are 30 to 90 days from shipment.
Additionally, certain customers in China pay prior to the shipment of products resulting in a customer deposits liability of $47.0 million and $56.0 million at December 31, 2018 and December 31, 2017, respectively. The Company assesses collectability based on the creditworthiness of the customer as determined by credit checks and analysis, as well as the customer’s payment history. The Company’s allowance for doubtful accounts was $6.4 million and $5.3 million at December 31, 2018 and December 31, 2017, respectively.
Rebates and incentives are based on pricing agreements and are tied to sales volume. The amount of revenue is reduced for variable consideration related to customer rebates which are calculated using expected values and is based on program specific factors such as expected rebate percentages based on expected volumes. In situations where the customer has the right to return eligible products, the Company reduces revenue for its estimates of expected product returns, which are primarily based on an analysis of historical experience. Changes in such accruals may be required if actual sales volume differs from estimated sales volume or if future returns differ from historical experience. Shipping and handling costs billed to customers are included in net sales and the related costs are included in cost of products sold and are activities performed to fulfill the promise to transfer products.
Disaggregation of Net Sales The Company is comprised of two reporting segments: North America and Rest of World. The Rest of World segment is primarily comprised of China, Europe and India. Both segments manufacture and market comprehensive lines of residential and commercial gas and electric water heaters, boilers, tanks and water treatment products. Both segments primarily manufacture and market in their respective regions of the world. The Rest of World segment also manufactures and markets in-home air purification products in China. As each segment manufactures and markets products in its respective region of the world, the Company has determined that geography is the primary factor in reporting its sales. The Company further disaggregates its North America segment sales by major product line as each of North America’s major product lines is sold through distinct distribution channels and these product lines may be impacted differently by certain economic factors. Within the Rest of World segment, particularly in China and India, the Company’s major customers purchase across the Company’s product lines, utilizing the same distribution channel regardless of product type. In addition, the impact of economic factors is unlikely to be differentiated by product line in the Rest of World segment.

36
2. Revenue Recognition (continued) The North America segment major product lines are defined as the following:
Water heaters The Company’s water heaters are open water heating systems that heat potable water. Typical applications for water heaters include residences, restaurants, hotels and motels, office buildings, laundries, car washes and small businesses. The Company sells residential and commercial water heater products and related parts through its wholesale distribution channel, which includes more than 1,300 independent wholesale plumbing distributors. The Company also sells residential water heaters and related parts through retail and maintenance, repair and operations (MRO) channels. A significant portion of the Company’s water heater sales in the North America segment is derived from the replacement of existing products.
Boilers The Company’s boilers are closed loop water heating systems used primarily for space heating or hydronic heating. The Company’s boilers are primarily used in applications in commercial settings for hospitals, schools, hotels and other large commercial buildings while residential boilers are used in homes, apartments and condominiums. The Company’s boiler distribution channel is comprised primarily of manufacturer representative firms, with the remainder our boilers distributed through wholesale channels. The Company’s boiler sales in the North America segment are derived from a combination of replacement of existing products and new construction.
Water treatment products The Company’s water treatment products range from point-of-entry water softeners and whole-home water filtration products to on-the-go filtration bottles and point-of-use carbon and reverse osmosis products. Typical applications for the Company’s water treatment products include residences, restaurants, hotels and offices. A portion of the Company’s sales of water treatment products in the North America segment is comprised of replacement filters.
The following table disaggregates the Company’s net sales by segment. As described above, the Company’s North America segment sales are further disaggregated by major product line. In addition, the Company’s Rest of World segment sales are disaggregated by China and all other Rest of World.
Years ending December 31 (dollars in millions) 2018 2017 2016 North America
Water heaters and related parts $1,757.0 $1,663.0 $1,563.2 Boilers and related parts 200.4 183.3 161.6 Water treatment products(1)
87.3 58.5 18.4 Total North America 2,044.7 1,904.8 1,743.2 Rest of World
China $1,070.4 $1,029.4 $ 887.5 All other Rest of World 103.2 86.9 78.1
Total Rest of World 1,173.6 1,116.3 965.6 Inter-segment sales (30.4) (24.4) (22.9)
Total Net Sales $3,187.9 $2,996.7 $2,685.9
(1) Includes Hague Quality Water International (Hague) and Aquasana, Inc. (Aquasana) from the date of acquisition of September 5, 2017 and August 8, 2016, respectively.
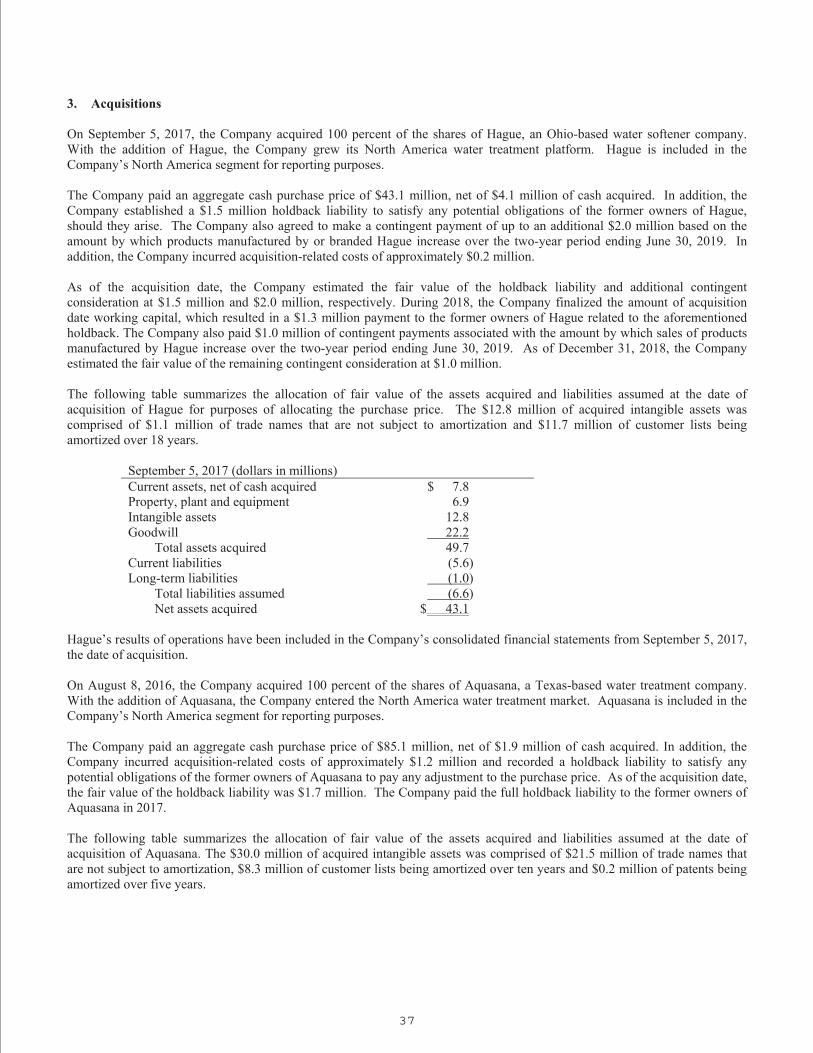
37
3. Acquisitions
On September 5, 2017, the Company acquired 100 percent of the shares of Hague, an Ohio-based water softener company. With the addition of Hague, the Company grew its North America water treatment platform. Hague is included in the Company’s North America segment for reporting purposes. The Company paid an aggregate cash purchase price of $43.1 million, net of $4.1 million of cash acquired. In addition, the Company established a $1.5 million holdback liability to satisfy any potential obligations of the former owners of Hague, should they arise. The Company also agreed to make a contingent payment of up to an additional $2.0 million based on the amount by which products manufactured by or branded Hague increase over the two-year period ending June 30, 2019. In addition, the Company incurred acquisition-related costs of approximately $0.2 million. As of the acquisition date, the Company estimated the fair value of the holdback liability and additional contingent consideration at $1.5 million and $2.0 million, respectively. During 2018, the Company finalized the amount of acquisition date working capital, which resulted in a $1.3 million payment to the former owners of Hague related to the aforementioned holdback. The Company also paid $1.0 million of contingent payments associated with the amount by which sales of products manufactured by Hague increase over the two-year period ending June 30, 2019. As of December 31, 2018, the Company estimated the fair value of the remaining contingent consideration at $1.0 million. The following table summarizes the allocation of fair value of the assets acquired and liabilities assumed at the date of acquisition of Hague for purposes of allocating the purchase price. The $12.8 million of acquired intangible assets was comprised of $1.1 million of trade names that are not subject to amortization and $11.7 million of customer lists being amortized over 18 years.
September 5, 2017 (dollars in millions) Current assets, net of cash acquired $ 7.8 Property, plant and equipment 6.9 Intangible assets 12.8 Goodwill 22.2 Total assets acquired 49.7 Current liabilities (5.6) Long-term liabilities (1.0) Total liabilities assumed (6.6) Net assets acquired $ 43.1
Hague’s results of operations have been included in the Company’s consolidated financial statements from September 5, 2017, the date of acquisition. On August 8, 2016, the Company acquired 100 percent of the shares of Aquasana, a Texas-based water treatment company. With the addition of Aquasana, the Company entered the North America water treatment market. Aquasana is included in the Company’s North America segment for reporting purposes. The Company paid an aggregate cash purchase price of $85.1 million, net of $1.9 million of cash acquired. In addition, the Company incurred acquisition-related costs of approximately $1.2 million and recorded a holdback liability to satisfy any potential obligations of the former owners of Aquasana to pay any adjustment to the purchase price. As of the acquisition date, the fair value of the holdback liability was $1.7 million. The Company paid the full holdback liability to the former owners of Aquasana in 2017. The following table summarizes the allocation of fair value of the assets acquired and liabilities assumed at the date of acquisition of Aquasana. The $30.0 million of acquired intangible assets was comprised of $21.5 million of trade names that are not subject to amortization, $8.3 million of customer lists being amortized over ten years and $0.2 million of patents being amortized over five years.

38
3. Acquisitions (continued)
August 8, 2016 (dollars in millions) Current assets, net of cash acquired $ 7.3 Property, plant and equipment 2.7 Intangible assets 30.0 Goodwill 60.4 Total assets acquired 100.4 Current liabilities (7.1) Long-term liabilities (8.2) Total liabilities assumed (15.3) Net assets acquired $ 85.1
Aquasana’s results of operations have been included in the Company’s financial statements from August 8, 2016, the date of acquisition. 4. Restructuring and Impairment Expenses On March 21, 2018, the Company announced a move of manufacturing operations from its Renton, Washington facility to other U.S. facilities. The Company recognized $6.7 million of restructuring and impairment expenses, comprised of $4.0 million of severance and compensation related costs, lease exit costs of $2.1 million and impairment charges related to long-lived assets totaling $0.6 million, as well as a corresponding $1.7 million tax benefit related to the charges. As of December 31, 2018, the consolidation of the Renton facility to other U.S. facilities was complete. There were no restructuring and impairment expenses in 2017 or 2016. The following table presents an analysis of the Company’s restructuring reserve for the twelve months ended December 31, 2018:
(dollars in millions) Severance
Costs Lease Exit
Costs Fixed Assets Impairment Total
Balance at January 1, 2018 $ - $ - $ - $ - Restructuring expense recognized 4.0 2.1 0.6 6.7 Cash payments and disposals (3.8) (0.8) (0.6) (5.2)
Balance at December 31, 2018 $ 0.2 $ 1.3 $ - $ 1.5 5. Statement of Cash Flows Supplemental cash flow information is as follows: Years ended December 31 (dollars in millions) 2018 2017 2016 Net change in current assets and liabilities, net of
acquisitions:
Receivables $ (54.6) $ (75.8) $ (15.1) Inventories (7.7) (37.5) (23.4) Other current assets 10.0 (9.0) (3.2) Trade payables 8.8 (5.1) 101.5 Accrued liabilities, including payroll and benefits (3.5) 12.2 6.0 Income taxes payable (refundable) 7.0 (12.6) 2.7
$ (40.0) $ (127.8) $ 68.5

39
6. Inventories December 31 (dollars in millions) 2018 2017 Finished products $ 137.6 $ 140.4 Work in process 23.3 18.3 Raw materials 174.4 160.5 Inventories, at FIFO cost 335.3 319.2 LIFO reserve (30.6) (22.2) $ 304.7 $ 297.0 The Company recognized after-tax LIFO (income) expense of $(0.4) million, $(0.3) million and $0.3 million in 2018, 2017 and 2016, respectively. 7. Property, Plant and Equipment December 31 (dollars in millions) 2018 2017 Land $ 11.2 $ 11.2 Buildings 323.3 329.9 Equipment 643.8 608.4 Software 118.5 110.6 1,096.8 1,060.1 Less accumulated depreciation and amortization 556.8 531.2 $ 540.0 $ 528.9 8. Goodwill and Other Intangible Assets Changes in the carrying amount of goodwill during the years ended December 31, 2018 and 2017 consisted of the following: (dollars in millions) North America Rest of World Total Balance at December 31, 2016 $ 432.2 $ 59.3 $ 491.5 Acquisitions 22.2 - 22.2 Currency translation adjustment 2.8 0.2 3.0 Balance at December 31, 2017 457.2 59.5 516.7 Currency translation adjustment (3.3) (0.4) (3.7) Balance at December 31, 2018 $ 453.9 $ 59.1 $ 513.0 The carrying amount of other intangible assets consisted of the following: 2018 2017
December 31 (dollars in millions)
Gross Carrying Amount
Accumulated Amortization Net
Gross Carrying Amount
Accumulated Amortization Net
Amortizable intangible assets: Patents $ 3.7 $ (3.3) $ 0.4 $ 3.7 $ (2.7) $ 1.0 Customer lists 236.8 (108.2) 128.6 235.8 (93.3) 142.5
Total amortizable intangible assets 240.5 (111.5) 129.0 239.5 (96.0) 143.5 Indefinite-lived intangible assets:
Trade names 164.1 - 164.1 165.2 - 165.2 Total intangible assets $ 404.6 $(111.5) $ 293.1 $ 404.7 $ (96.0) $ 308.7 Amortization expenses of other intangible assets of $14.3 million, $13.7 million, and $13.4 million were recorded in 2018, 2017 and 2016, respectively. In the future, excluding the impact of any future acquisitions, the Company expects amortization expense of approximately $14.2 million annually and the intangible assets will be amortized over a weighted average period of 12 years.

40
8. Goodwill and Other Intangible Assets (continued) The Company concluded that no goodwill impairment existed at the time of the annual impairment tests which were performed in the fourth quarters of 2018, 2017 and 2016. No impairments of other intangible assets were recorded in 2018, 2017 and 2016. 9. Debt and Lease Commitments December 31 (dollars in millions) 2018 2017 Bank credit lines, average year-end interest rates of 3.4% for 2018 and
2.5% for 2017 $ 17.1 $ 15.9
Revolving credit agreement borrowings, average year-end interest rates of 3.5% for 2018 and 2.5% for 2017 10.0 190.0
Commercial paper, average year-end interest rates of 2.7% for 2018 and 1.7% for 2017 74.3 77.0
Term notes with insurance companies, expiring 2029-2034, average year-end interest rates of 3.3% for 2018 and 3.4% for 2017 120.0 122.7
Canadian term notes with insurance companies, expiring through 2018, average year-end interest rates of 5.3% for 2017 - 4.8
221.4 410.4 Less long-term debt due within one year - 7.5 Long-term debt $ 221.4 $ 402.9 In December 2016, the Company completed a $500 million multi-year multi-currency revolving credit agreement with a group of nine banks, which expires on December 15, 2021. The facility has an accordion provision which allows it to be increased up to $700 million if certain conditions (including lender approval) are satisfied. Borrowings under the Company’s bank credit lines and commercial paper borrowings are supported by the revolving credit agreement. As a result of the long-term nature of this facility, the commercial paper and credit line borrowings are classified as long-term debt at December 31, 2018 and 2017. At its option, the Company either maintains cash balances or pays fees for bank credit and services. On November 28, 2016, the Company issued $45 million in term notes in two tranches to two insurance companies. Principal payments commence in 2023 and 2028 and the notes mature in 2029 and 2034. The notes have interest rates of 2.87 percent and 3.10 percent. Proceeds of the notes were used to pay down borrowings under the Company’s revolving credit facility. Scheduled maturities of long-term debt within each of the five years subsequent to December 31, 2018 are as follows: Years ending December 31 (dollars in millions) Amount 2019 $ - 2020 6.8 2021 108.2 2022 6.8 2023 10.0
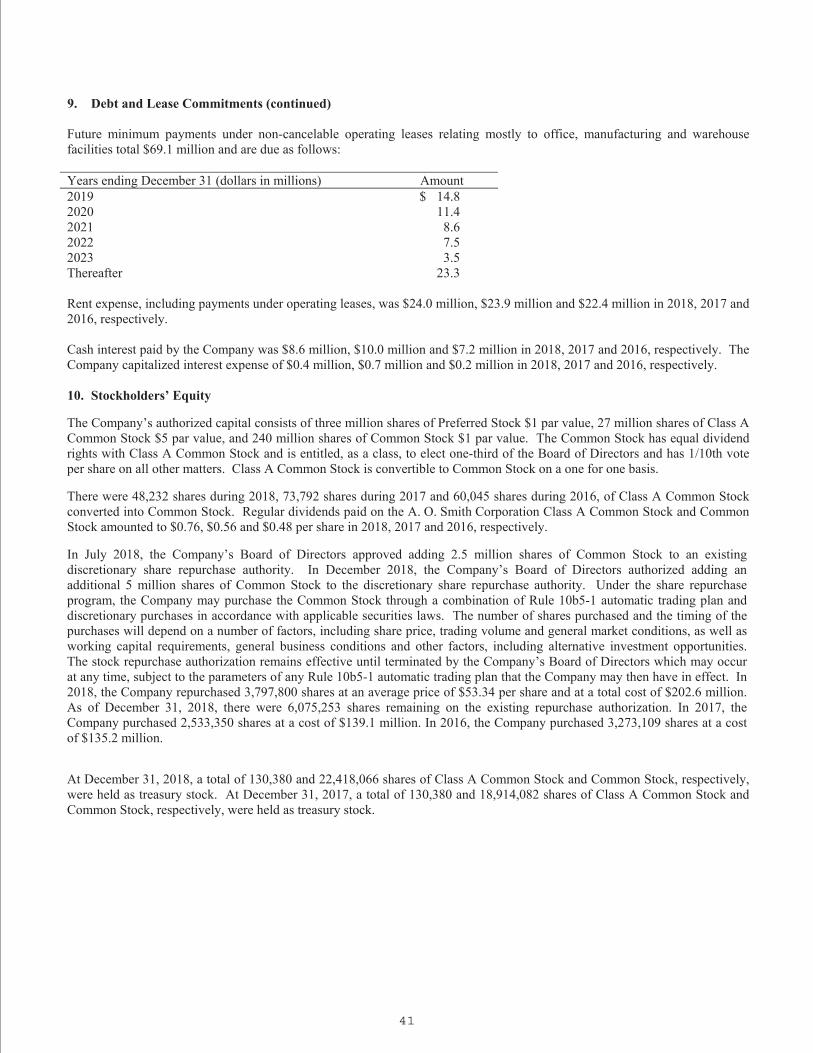
41
9. Debt and Lease Commitments (continued) Future minimum payments under non-cancelable operating leases relating mostly to office, manufacturing and warehouse facilities total $69.1 million and are due as follows: Years ending December 31 (dollars in millions) Amount 2019 $ 14.8 2020 11.4 2021 8.6 2022 7.5 2023 3.5 Thereafter 23.3 Rent expense, including payments under operating leases, was $24.0 million, $23.9 million and $22.4 million in 2018, 2017 and 2016, respectively. Cash interest paid by the Company was $8.6 million, $10.0 million and $7.2 million in 2018, 2017 and 2016, respectively. The Company capitalized interest expense of $0.4 million, $0.7 million and $0.2 million in 2018, 2017 and 2016, respectively. 10. Stockholders’ Equity
The Company’s authorized capital consists of three million shares of Preferred Stock $1 par value, 27 million shares of Class A Common Stock $5 par value, and 240 million shares of Common Stock $1 par value. The Common Stock has equal dividend rights with Class A Common Stock and is entitled, as a class, to elect one-third of the Board of Directors and has 1/10th vote per share on all other matters. Class A Common Stock is convertible to Common Stock on a one for one basis.
There were 48,232 shares during 2018, 73,792 shares during 2017 and 60,045 shares during 2016, of Class A Common Stock converted into Common Stock. Regular dividends paid on the A. O. Smith Corporation Class A Common Stock and Common Stock amounted to $0.76, $0.56 and $0.48 per share in 2018, 2017 and 2016, respectively.
In July 2018, the Company’s Board of Directors approved adding 2.5 million shares of Common Stock to an existing discretionary share repurchase authority. In December 2018, the Company’s Board of Directors authorized adding an additional 5 million shares of Common Stock to the discretionary share repurchase authority. Under the share repurchase program, the Company may purchase the Common Stock through a combination of Rule 10b5-1 automatic trading plan and discretionary purchases in accordance with applicable securities laws. The number of shares purchased and the timing of the purchases will depend on a number of factors, including share price, trading volume and general market conditions, as well as working capital requirements, general business conditions and other factors, including alternative investment opportunities. The stock repurchase authorization remains effective until terminated by the Company’s Board of Directors which may occur at any time, subject to the parameters of any Rule 10b5-1 automatic trading plan that the Company may then have in effect. In 2018, the Company repurchased 3,797,800 shares at an average price of $53.34 per share and at a total cost of $202.6 million. As of December 31, 2018, there were 6,075,253 shares remaining on the existing repurchase authorization. In 2017, the Company purchased 2,533,350 shares at a cost of $139.1 million. In 2016, the Company purchased 3,273,109 shares at a cost of $135.2 million.
At December 31, 2018, a total of 130,380 and 22,418,066 shares of Class A Common Stock and Common Stock, respectively, were held as treasury stock. At December 31, 2017, a total of 130,380 and 18,914,082 shares of Class A Common Stock and Common Stock, respectively, were held as treasury stock.

42
10. Stockholders’ Equity (continued) Accumulated other comprehensive loss is as follows:
December 31 (dollars in millions) 2018 2017 Cumulative foreign currency translation adjustments $ (64.9) $ (26.5) Unrealized net loss on cash flow derivative instruments less related
income tax benefit provision of $0.2 in 2018 and $0.6 in 2017 (0.7) (0.9) Pension liability less related income tax benefit of $180.1 in 2018 and
$175.9 in 2017 (285.2) (272.1) $(350.8) $(299.5)
Changes to accumulated other comprehensive loss by component are as follows:
Years ended December 31,
2018 2017 Cumulative foreign currency translation
Balance at beginning of period $ (26.5) $ (79.2) Other comprehensive gain (loss) before reclassifications (38.4) 52.7 Balance at end of period (64.9) (26.5)
Unrealized net (loss) gain on cash flow derivatives
Balance at beginning of period (0.9) 0.2 Other comprehensive gain (loss) before reclassifications 0.6 (0.5) Realized gains on derivatives reclassified to cost of products sold (net of tax
provision of $0.2 and $0.4 in 2018 and 2017, respectively)(1) (0.4) (0.6) Balance at end of period (0.7) (0.9)
Pension liability Balance at beginning of period (272.1) (284.2) Other comprehensive (loss) gain before reclassifications (27.0) 1.4 Amounts reclassified from accumulated other comprehensive loss (1) 13.9 10.7 Balance at end of period (285.2) (272.1)
Total accumulated other comprehensive loss, end of period $ (350.8) $ (299.5)
(1) Amounts reclassified from accumulated other comprehensive loss: Realized gains on derivatives reclassified to cost of products sold (0.6) (1.0) Tax provision 0.2 0.4 Reclassification net of tax $ (0.4) $ (0.6) Amortization of pension items: Actuarial losses $ 19.0 (2) $ 17.9 (2) Prior year service cost (0.5)(2) (0.4)(2) 18.5 17.5 Tax benefit (4.6) (6.8) Reclassification net of tax $ 13.9 $ 10.7
(2)These accumulated other comprehensive loss components are included in the computation of net periodic benefit cost. See Note 12 “ Pensions and Other Post-retirement Benefits” for additional details
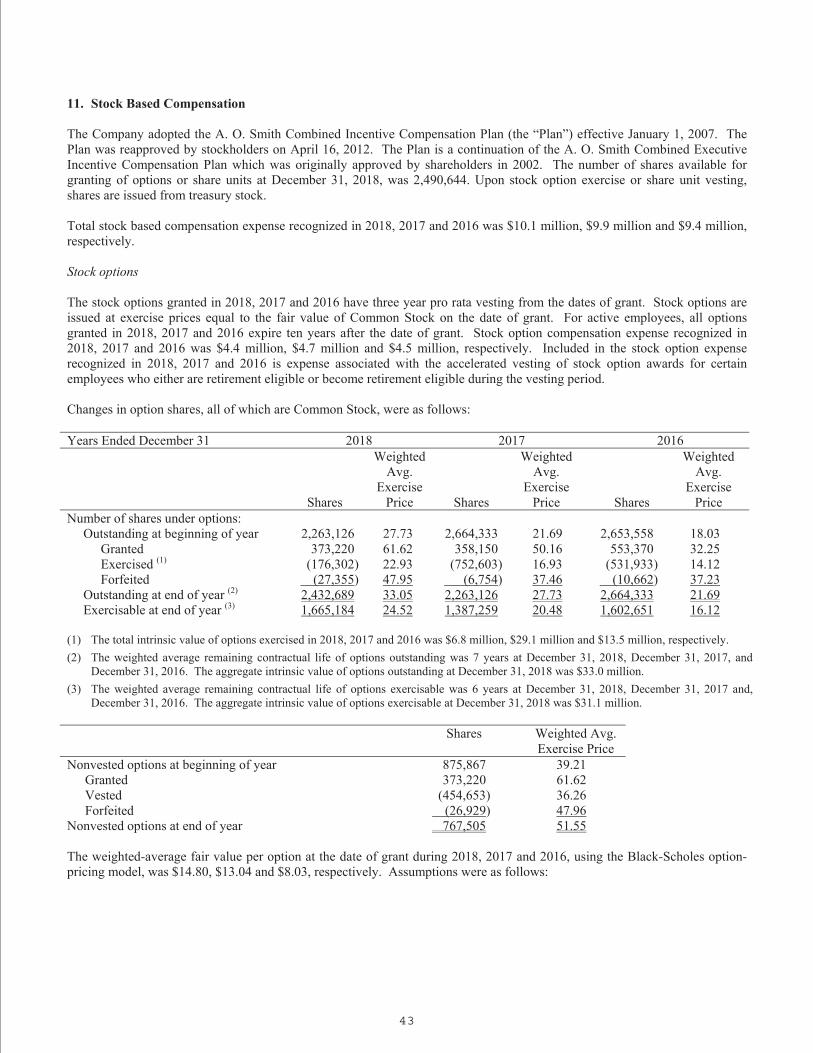
43
11. Stock Based Compensation
The Company adopted the A. O. Smith Combined Incentive Compensation Plan (the “Plan”) effective January 1, 2007. The Plan was reapproved by stockholders on April 16, 2012. The Plan is a continuation of the A. O. Smith Combined Executive Incentive Compensation Plan which was originally approved by shareholders in 2002. The number of shares available for granting of options or share units at December 31, 2018, was 2,490,644. Upon stock option exercise or share unit vesting, shares are issued from treasury stock.
Total stock based compensation expense recognized in 2018, 2017 and 2016 was $10.1 million, $9.9 million and $9.4 million, respectively. Stock options
The stock options granted in 2018, 2017 and 2016 have three year pro rata vesting from the dates of grant. Stock options are issued at exercise prices equal to the fair value of Common Stock on the date of grant. For active employees, all options granted in 2018, 2017 and 2016 expire ten years after the date of grant. Stock option compensation expense recognized in 2018, 2017 and 2016 was $4.4 million, $4.7 million and $4.5 million, respectively. Included in the stock option expense recognized in 2018, 2017 and 2016 is expense associated with the accelerated vesting of stock option awards for certain employees who either are retirement eligible or become retirement eligible during the vesting period.
Changes in option shares, all of which are Common Stock, were as follows: Years Ended December 31 2018 2017 2016
Shares
Weighted Avg.
Exercise Price Shares
Weighted Avg.
Exercise Price Shares
Weighted Avg.
Exercise Price
Number of shares under options: Outstanding at beginning of year 2,263,126 27.73 2,664,333 21.69 2,653,558 18.03 Granted 373,220 61.62 358,150 50.16 553,370 32.25 Exercised (1) (176,302) 22.93 (752,603) 16.93 (531,933) 14.12 Forfeited (27,355) 47.95 (6,754) 37.46 (10,662) 37.23 Outstanding at end of year (2) 2,432,689 33.05 2,263,126 27.73 2,664,333 21.69 Exercisable at end of year (3) 1,665,184 24.52 1,387,259 20.48 1,602,651 16.12 (1) The total intrinsic value of options exercised in 2018, 2017 and 2016 was $6.8 million, $29.1 million and $13.5 million, respectively.
(2) The weighted average remaining contractual life of options outstanding was 7 years at December 31, 2018, December 31, 2017, and December 31, 2016. The aggregate intrinsic value of options outstanding at December 31, 2018 was $33.0 million.
(3) The weighted average remaining contractual life of options exercisable was 6 years at December 31, 2018, December 31, 2017 and, December 31, 2016. The aggregate intrinsic value of options exercisable at December 31, 2018 was $31.1 million.
Shares Weighted Avg.
Exercise Price Nonvested options at beginning of year 875,867 39.21 Granted 373,220 61.62 Vested (454,653) 36.26 Forfeited (26,929) 47.96 Nonvested options at end of year 767,505 51.55 The weighted-average fair value per option at the date of grant during 2018, 2017 and 2016, using the Black-Scholes option-pricing model, was $14.80, $13.04 and $8.03, respectively. Assumptions were as follows:

44
11. Stock Based Compensation (continued) 2018 2017 2016 Expected life (years) 5.7 5.7 5.8 Risk-free interest rate 2.9% 2.4% 1.7% Dividend yield 1.0% 1.0% 1.3% Expected volatility 22.1% 26.5% 27.7% The expected life of options for purposes of these models is based on historical exercise behaviors. The risk free interest rates for purposes of these models are based on the U.S. Treasury yield curve in effect on the date of grant for the respective expected lives of the option. The expected dividend yields for purposes of these models are based on the dividends paid in the preceding four quarters divided by the grant date market value of the Common Stock. The expected volatility for purposes of these models is based on the historical volatility of the Common Stock.
Stock Appreciations Rights (SARs)
Certain non-U.S.-based employees were granted SARs. Each SAR award grants the employee the right to receive cash equal to the excess of the share price of the Company’s Common Stock on the date that a participant exercises such right over the grant date value of the SAR. SARs granted have three year pro rata vesting from the date of grant. SARs were issued at exercise prices equal to the fair value of the Company’s Common Stock on the date of grant and expire ten years from the date of grant. The fair value and compensation expense for SARs are remeasured at each reporting period using the Black-Scholes option-pricing model, using assumptions similar to stock option awards. No SARs were granted in 2018, 2017 or 2016. As of December 31, 2018, there were 16,170 SARs outstanding and exercisable. In 2017, there were 23,660 SARs outstanding and 15,774 were exercisable. In 2016, there were 24,940 SARs outstanding and 8,320 were exercisable. Stock based compensation expense attributable to SARS was not material in 2018, 2017 and 2016. Restricted stock and share units Participants may also be awarded shares of restricted stock or share units under the Plan. The Company granted 106,581, 107,853 and 160,465 share units under the plan in 2018, 2017 and 2016, respectively. The share units were valued at $6.6 million, $5.4 million and $5.2 million at the date of issuance in 2018, 2017 and 2016, respectively, and will be recognized as compensation expense ratably over the three-year vesting period; however, included in share based compensation is expense associated with the accelerated vesting of share unit awards for certain employees who either are retirement eligible or become retirement eligible during the vesting period. Compensation expense of $5.7 million, $5.2 million and $4.9 million was recognized in 2018, 2017 and 2016, respectively. Certain non-U.S.-based employees receive the cash value of vested shares at the vesting date in lieu of shares. A summary of share unit activity under the plan is as follows:
Number of Units Weighted-Average Grant Date Value
Outstanding at January 1, 2018 433,290 $ 34.96 Granted 106,581 61.70 Vested (145,105) 30.79 Forfeited (15,165) 43.44 Outstanding at December 31, 2018 379,601 42.93
45
12. Pension and Other Post-retirement Benefits The Company provides retirement benefits for all U.S. employees including benefits for employees of previously owned businesses which were earned up to the date of sale. The Company also has two foreign pension plans, neither of which is material to the Company’s financial position. The Company has a defined contribution plan which matches 100 percent of the first one percent of contributions made by participating employees and matches 50 percent of the next five percent of employee contributions. The Company also has defined contribution plans for certain hourly employees which provide for matching Company contributions. The Company also has a defined benefit plan for salaried employees and its non-union hourly workforce. In 2009, the Company announced U.S. employees hired after January 1, 2010, would not participate in the defined benefit plan, and benefit accruals for the majority of current salaried and hourly employees sunset on December 31, 2014. An additional Company contribution is made to the defined contribution plan in lieu of benefits earned in a defined benefit plan. The Company also has defined benefit and contribution plans for certain union hourly employees. The Company has unfunded defined-benefit post-retirement plans covering certain hourly and salaried employees that provide medical and life insurance benefits from retirement to age 65. Certain hourly employees retiring after January 1, 1996, are subject to a maximum annual benefit and salaried employees hired after December 31, 1993, are not eligible for post-retirement medical benefits.
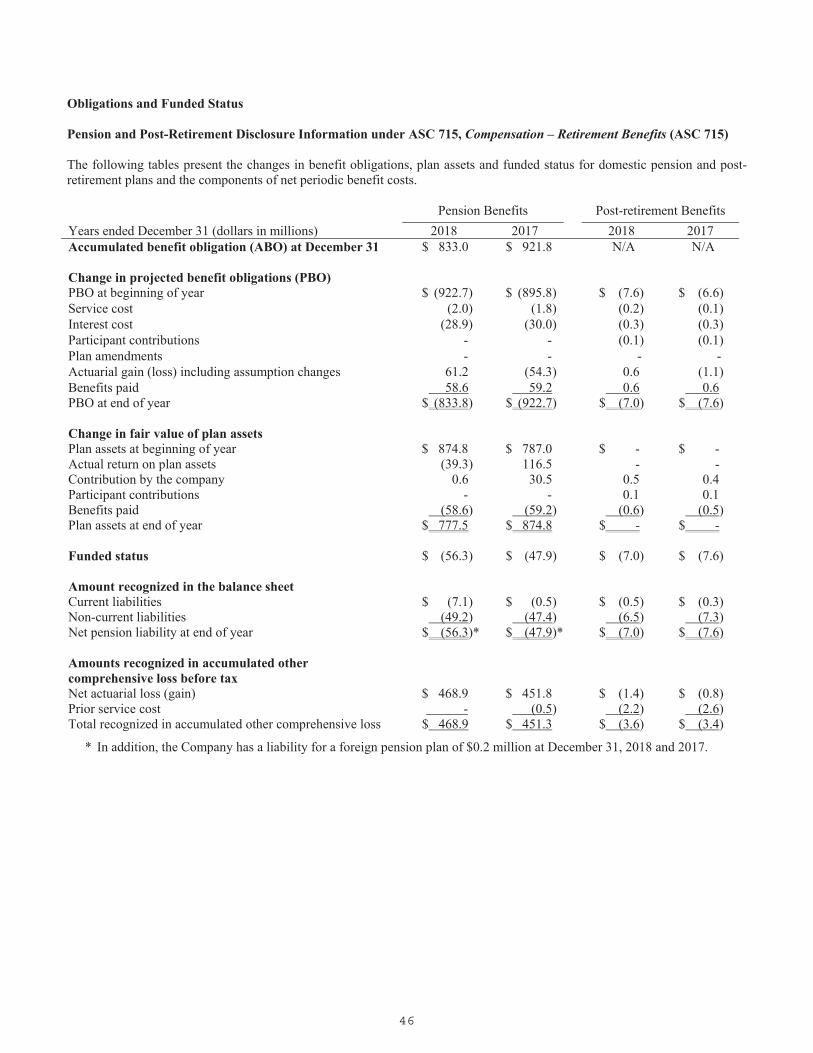
46
Obligations and Funded Status Pension and Post-Retirement Disclosure Information under ASC 715, Compensation – Retirement Benefits (ASC 715) The following tables present the changes in benefit obligations, plan assets and funded status for domestic pension and post-retirement plans and the components of net periodic benefit costs. Pension Benefits Post-retirement Benefits
Years ended December 31 (dollars in millions) 2018 2017 2018 2017 Accumulated benefit obligation (ABO) at December 31 $ 833.0 $ 921.8 N/A N/A Change in projected benefit obligations (PBO) PBO at beginning of year $ (922.7) $ (895.8) $ (7.6) $ (6.6) Service cost (2.0) (1.8) (0.2) (0.1) Interest cost (28.9) (30.0) (0.3) (0.3) Participant contributions - - (0.1) (0.1) Plan amendments - - - - Actuarial gain (loss) including assumption changes 61.2 (54.3) 0.6 (1.1) Benefits paid 58.6 59.2 0.6 0.6 PBO at end of year $ (833.8) $ (922.7) $ (7.0) $ (7.6) Change in fair value of plan assets Plan assets at beginning of year $ 874.8 $ 787.0 $ - $ - Actual return on plan assets (39.3) 116.5 - - Contribution by the company 0.6 30.5 0.5 0.4 Participant contributions - - 0.1 0.1 Benefits paid (58.6) (59.2) (0.6) (0.5) Plan assets at end of year $ 777.5 $ 874.8 $ - $ - Funded status $ (56.3) $ (47.9) $ (7.0) $ (7.6) Amount recognized in the balance sheet Current liabilities $ (7.1) $ (0.5) $ (0.5) $ (0.3) Non-current liabilities (49.2) (47.4) (6.5) (7.3) Net pension liability at end of year $ (56.3)* $ (47.9)* $ (7.0) $ (7.6) Amounts recognized in accumulated other comprehensive loss before tax
Net actuarial loss (gain) $ 468.9 $ 451.8 $ (1.4) $ (0.8) Prior service cost - (0.5) (2.2) (2.6) Total recognized in accumulated other comprehensive loss $ 468.9 $ 451.3 $ (3.6) $ (3.4)
* In addition, the Company has a liability for a foreign pension plan of $0.2 million at December 31, 2018 and 2017.
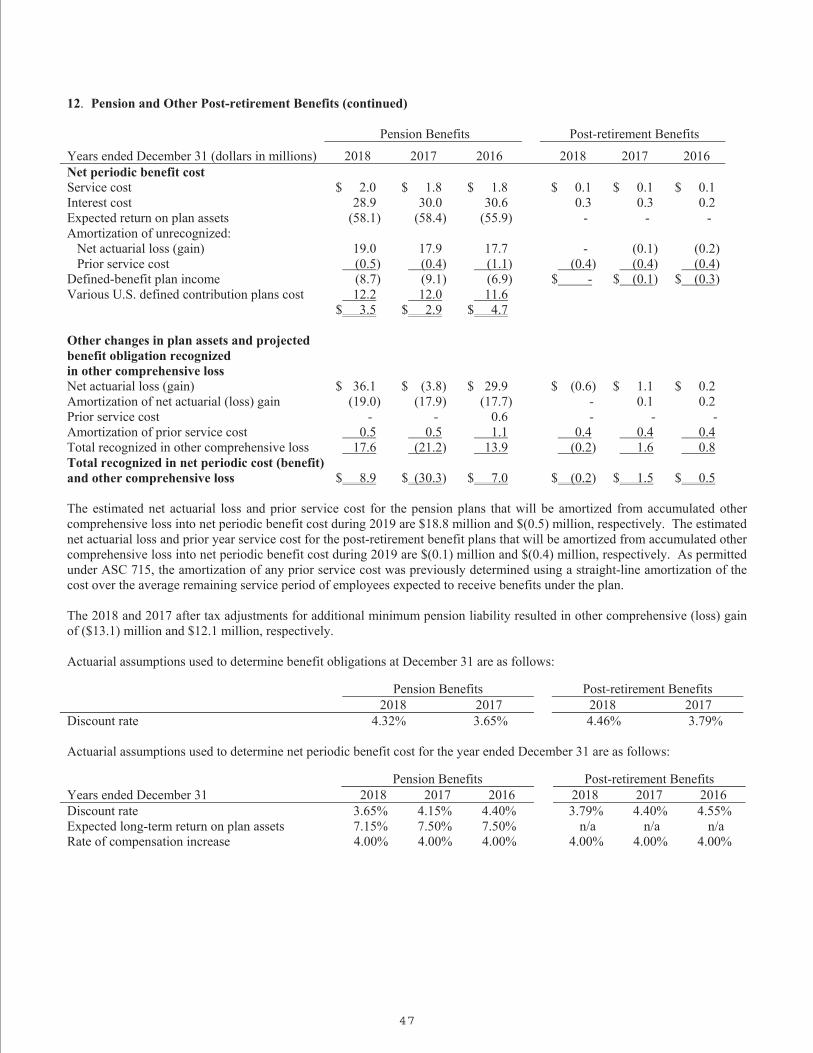
47
12. Pension and Other Post-retirement Benefits (continued)
Pension Benefits Post-retirement Benefits A
Years ended December 31 (dollars in millions) 2018 2017 2016 2018 2017 2016 Net periodic benefit cost Service cost $ 2.0 $ 1.8 $ 1.8 $ 0.1 $ 0.1 $ 0.1 Interest cost 28.9 30.0 30.6 0.3 0.3 0.2 Expected return on plan assets (58.1) (58.4) (55.9) - - - Amortization of unrecognized: Net actuarial loss (gain) 19.0 17.9 17.7 - (0.1) (0.2) Prior service cost (0.5) (0.4) (1.1) (0.4) (0.4) (0.4) Defined-benefit plan income (8.7) (9.1) (6.9) $ - $ (0.1) $ (0.3) Various U.S. defined contribution plans cost 12.2 12.0 11.6 $ 3.5 $ 2.9 $ 4.7 Other changes in plan assets and projected benefit obligation recognized in other comprehensive loss
Net actuarial loss (gain) $ 36.1 $ (3.8) $ 29.9 $ (0.6) $ 1.1 $ 0.2 Amortization of net actuarial (loss) gain (19.0) (17.9) (17.7) - 0.1 0.2 Prior service cost - - 0.6 - - - Amortization of prior service cost 0.5 0.5 1.1 0.4 0.4 0.4 Total recognized in other comprehensive loss 17.6 (21.2) 13.9 (0.2) 1.6 0.8 Total recognized in net periodic cost (benefit) and other comprehensive loss $ 8.9 $ (30.3) $ 7.0 $ (0.2) $ 1.5 $ 0.5 The estimated net actuarial loss and prior service cost for the pension plans that will be amortized from accumulated other comprehensive loss into net periodic benefit cost during 2019 are $18.8 million and $(0.5) million, respectively. The estimated net actuarial loss and prior year service cost for the post-retirement benefit plans that will be amortized from accumulated other comprehensive loss into net periodic benefit cost during 2019 are $(0.1) million and $(0.4) million, respectively. As permitted under ASC 715, the amortization of any prior service cost was previously determined using a straight-line amortization of the cost over the average remaining service period of employees expected to receive benefits under the plan. The 2018 and 2017 after tax adjustments for additional minimum pension liability resulted in other comprehensive (loss) gain of ($13.1) million and $12.1 million, respectively.
Actuarial assumptions used to determine benefit obligations at December 31 are as follows:
Pension Benefits Post-retirement Benefits 2018 2017 2018 2017 Discount rate 4.32% 3.65% 4.46% 3.79% Actuarial assumptions used to determine net periodic benefit cost for the year ended December 31 are as follows:
Pension Benefits Post-retirement Benefits Years ended December 31 2018 2017 2016 2018 2017 2016 Discount rate 3.65% 4.15% 4.40% 3.79% 4.40% 4.55% Expected long-term return on plan assets 7.15% 7.50% 7.50% n/a n/a n/a Rate of compensation increase 4.00% 4.00% 4.00% 4.00% 4.00% 4.00%

48
12. Pension and Other Post-retirement Benefits (continued) Assumptions
In developing the expected long-term rate of return on plan assets assumption, the Company evaluated its pension plan’s target and actual asset allocation and expected long-term rates of return of equity and bond indices. The Company also considered its pension plan’s historical ten-year and 25-year compounded annualized returns of 8.9 percent and 8.5 percent, respectively.
Assumed health care cost trend rates
Assumed health care cost trend rates as of December 31 are as follows:
2018 2017 Health care cost trend rate assumed for next year 6.00 % 6.50 % Rate to which the cost trend rate is assumed to decline (the ultimate trend rate) 5.00 % 5.00 % Year that the rate reaches the ultimate trend rate 2021 2021 A one-percentage-point change in the assumed health care cost trend rates would not result in a material impact on the Company’s consolidated financial statements. Plan Assets
The Company’s pension plan weighted asset allocations as of December 31 by asset category are as follows:
Asset Category 2018 2017 Equity securities 40 % 45 % Debt securities 48 43 Real estate 10 9 Private equity 2 2 Other - 1 100 % 100 %
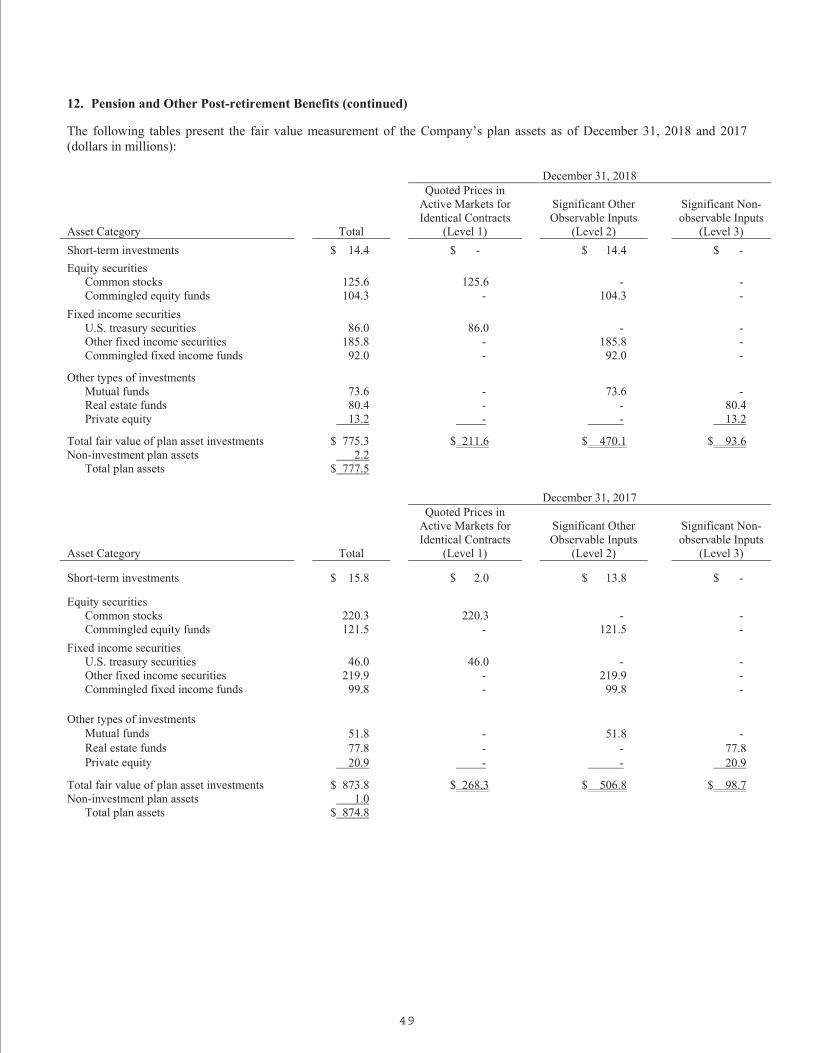
49
12. Pension and Other Post-retirement Benefits (continued)
The following tables present the fair value measurement of the Company’s plan assets as of December 31, 2018 and 2017 (dollars in millions): December 31, 2018
Asset Category Total
Quoted Prices in Active Markets for Identical Contracts
(Level 1)
Significant Other Observable Inputs
(Level 2)
Significant Non-observable Inputs
(Level 3)
Short-term investments $ 14.4 $ - $ 14.4 $ -
Equity securities Common stocks 125.6 125.6 - - Commingled equity funds 104.3 - 104.3 -
Fixed income securities U.S. treasury securities 86.0 86.0 - - Other fixed income securities 185.8 - 185.8 - Commingled fixed income funds 92.0 - 92.0 -
Other types of investments Mutual funds 73.6 - 73.6 - Real estate funds 80.4 - - 80.4 Private equity 13.2 - - 13.2
Total fair value of plan asset investments $ 775.3 $ 211.6 $ 470.1 $ 93.6 Non-investment plan assets 2.2 Total plan assets $ 777.5 December 31, 2017
Asset Category Total
Quoted Prices in Active Markets for Identical Contracts
(Level 1)
Significant Other Observable Inputs
(Level 2)
Significant Non-observable Inputs
(Level 3)
Short-term investments $ 15.8 $ 2.0 $ 13.8 $ -
Equity securities Common stocks 220.3 220.3 - - Commingled equity funds 121.5 - 121.5 -
Fixed income securities U.S. treasury securities 46.0 46.0 - - Other fixed income securities 219.9 - 219.9 - Commingled fixed income funds 99.8 - 99.8 -
Other types of investments Mutual funds 51.8 - 51.8 - Real estate funds 77.8 - - 77.8 Private equity 20.9 - - 20.9
Total fair value of plan asset investments $ 873.8 $ 268.3 $ 506.8 $ 98.7 Non-investment plan assets 1.0 Total plan assets $ 874.8
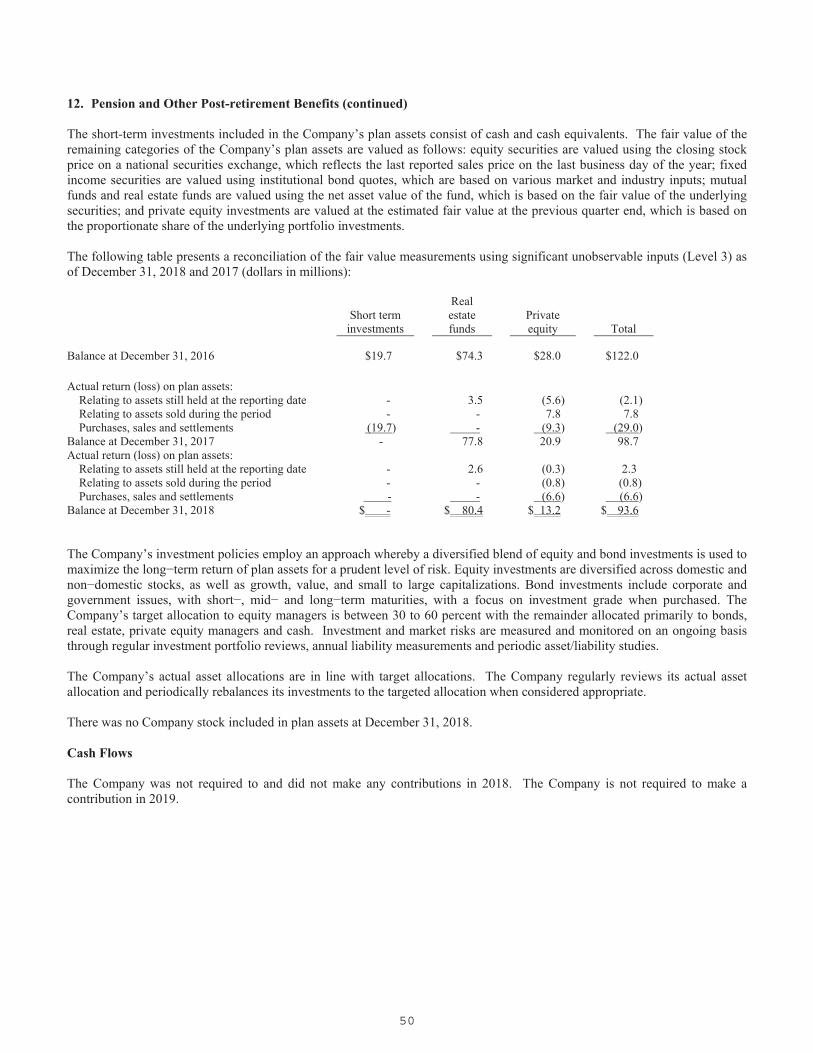
50
12. Pension and Other Post-retirement Benefits (continued)
The short-term investments included in the Company’s plan assets consist of cash and cash equivalents. The fair value of the remaining categories of the Company’s plan assets are valued as follows: equity securities are valued using the closing stock price on a national securities exchange, which reflects the last reported sales price on the last business day of the year; fixed income securities are valued using institutional bond quotes, which are based on various market and industry inputs; mutual funds and real estate funds are valued using the net asset value of the fund, which is based on the fair value of the underlying securities; and private equity investments are valued at the estimated fair value at the previous quarter end, which is based on the proportionate share of the underlying portfolio investments. The following table presents a reconciliation of the fair value measurements using significant unobservable inputs (Level 3) as of December 31, 2018 and 2017 (dollars in millions):
Short term
investments
Real estate funds
Private equity Total
Balance at December 31, 2016 $19.7 $74.3 $28.0 $122.0
Actual return (loss) on plan assets: Relating to assets still held at the reporting date - 3.5 (5.6) (2.1) Relating to assets sold during the period - - 7.8 7.8 Purchases, sales and settlements (19.7) - (9.3) (29.0)
Balance at December 31, 2017 - 77.8 20.9 98.7 Actual return (loss) on plan assets:
Relating to assets still held at the reporting date - 2.6 (0.3) 2.3 Relating to assets sold during the period - - (0.8) (0.8) Purchases, sales and settlements - - (6.6) (6.6)
Balance at December 31, 2018 $ - $ 80.4 $ 13.2 $ 93.6 The Company’s investment policies employ an approach whereby a diversified blend of equity and bond investments is used to maximize the long−term return of plan assets for a prudent level of risk. Equity investments are diversified across domestic and non−domestic stocks, as well as growth, value, and small to large capitalizations. Bond investments include corporate and government issues, with short−, mid− and long−term maturities, with a focus on investment grade when purchased. The Company’s target allocation to equity managers is between 30 to 60 percent with the remainder allocated primarily to bonds, real estate, private equity managers and cash. Investment and market risks are measured and monitored on an ongoing basis through regular investment portfolio reviews, annual liability measurements and periodic asset/liability studies. The Company’s actual asset allocations are in line with target allocations. The Company regularly reviews its actual asset allocation and periodically rebalances its investments to the targeted allocation when considered appropriate. There was no Company stock included in plan assets at December 31, 2018. Cash Flows The Company was not required to and did not make any contributions in 2018. The Company is not required to make a contribution in 2019.
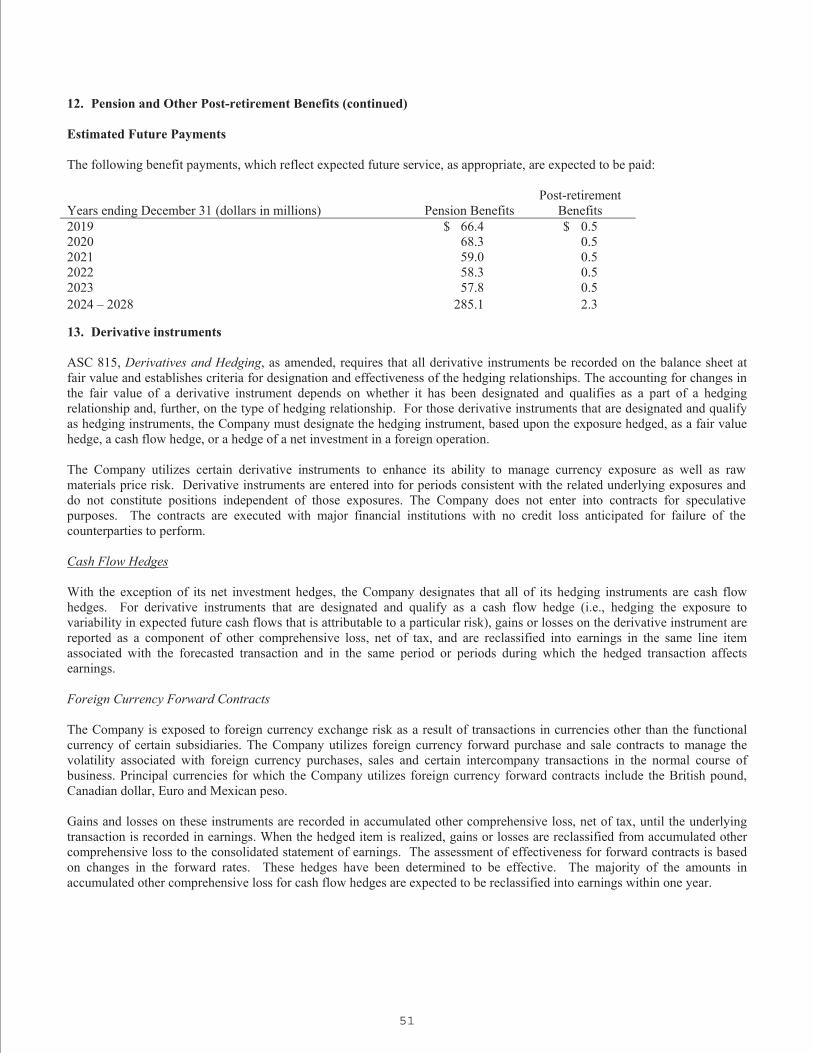
51
12. Pension and Other Post-retirement Benefits (continued)
Estimated Future Payments The following benefit payments, which reflect expected future service, as appropriate, are expected to be paid: Years ending December 31 (dollars in millions)
Pension Benefits
Post-retirement Benefits
2019 $ 66.4 $ 0.5 2020 68.3 0.5 2021 59.0 0.5 2022 58.3 0.5 2023 57.8 0.5 2024 – 2028 285.1 2.3
13. Derivative instruments ASC 815, Derivatives and Hedging, as amended, requires that all derivative instruments be recorded on the balance sheet at fair value and establishes criteria for designation and effectiveness of the hedging relationships. The accounting for changes in the fair value of a derivative instrument depends on whether it has been designated and qualifies as a part of a hedging relationship and, further, on the type of hedging relationship. For those derivative instruments that are designated and qualify as hedging instruments, the Company must designate the hedging instrument, based upon the exposure hedged, as a fair value hedge, a cash flow hedge, or a hedge of a net investment in a foreign operation.
The Company utilizes certain derivative instruments to enhance its ability to manage currency exposure as well as raw materials price risk. Derivative instruments are entered into for periods consistent with the related underlying exposures and do not constitute positions independent of those exposures. The Company does not enter into contracts for speculative purposes. The contracts are executed with major financial institutions with no credit loss anticipated for failure of the counterparties to perform.
Cash Flow Hedges With the exception of its net investment hedges, the Company designates that all of its hedging instruments are cash flow hedges. For derivative instruments that are designated and qualify as a cash flow hedge (i.e., hedging the exposure to variability in expected future cash flows that is attributable to a particular risk), gains or losses on the derivative instrument are reported as a component of other comprehensive loss, net of tax, and are reclassified into earnings in the same line item associated with the forecasted transaction and in the same period or periods during which the hedged transaction affects earnings. Foreign Currency Forward Contracts The Company is exposed to foreign currency exchange risk as a result of transactions in currencies other than the functional currency of certain subsidiaries. The Company utilizes foreign currency forward purchase and sale contracts to manage the volatility associated with foreign currency purchases, sales and certain intercompany transactions in the normal course of business. Principal currencies for which the Company utilizes foreign currency forward contracts include the British pound, Canadian dollar, Euro and Mexican peso.
Gains and losses on these instruments are recorded in accumulated other comprehensive loss, net of tax, until the underlying transaction is recorded in earnings. When the hedged item is realized, gains or losses are reclassified from accumulated other comprehensive loss to the consolidated statement of earnings. The assessment of effectiveness for forward contracts is based on changes in the forward rates. These hedges have been determined to be effective. The majority of the amounts in accumulated other comprehensive loss for cash flow hedges are expected to be reclassified into earnings within one year.

52
13. Derivative instruments (continued) The following table summarizes, by currency, the contractual amounts of the Company’s foreign currency forward contracts: December 31 (dollars in millions) 2018 2017 Buy Sell Buy Sell British pound $ - $ 1.0 $ - $ 1.2 Canadian dollar - - - 48.1 Euro 32.0 - 29.3 - Mexican peso 27.8 - 16.3 - Total $ 59.8 $ 1.0 $ 45.6 $ 49.3 Commodity Futures Contracts In addition to entering into supply arrangements in the normal course of business, the Company also enters into futures contracts to fix the cost of certain raw material purchases, principally steel, with the objective of minimizing changes in cost due to market price fluctuations. The hedging strategy for achieving this objective is to purchase steel futures contracts on the New York Metals Exchange (NYMEX) and copper futures contracts on the open market of the London Metals Exchange (LME) or over the counter contracts based on the LME. With NYMEX, the Company is required to make cash deposits on unrealized losses on steel derivative contracts. The after-tax gains and losses of the contracts as of December 31, 2018 were recorded in accumulated other comprehensive loss and will be reclassified into cost of products sold in the period in which the underlying transaction is recorded in earnings. The after-tax gains and losses on the contracts will be reclassified within one year. Commodity hedges outstanding at December 31, 2018 total approximately 15,000 tons of steel. Net Investment Hedges The Company enters into certain foreign currency forward contracts to hedge the exposure to a portion of the Company’s net investments in certain non-U.S. subsidiaries against the effect of exchange rate fluctuations on the translation of foreign currency balances to the U.S. dollar. For the derivative instruments that are designated and qualify as net investment hedges, gains and losses are reported in other comprehensive loss where they offset gains and losses recorded on the Company’s net investments in its non-U.S. subsidiaries. These hedges are determined to be effective. The Company recognized $7.4 million of after-tax gains associated with hedges of a net investment in non-U.S. subsidiaries in currency translation adjustment in other comprehensive loss in 2018. The contractual amount of the Company’s foreign currency forward contracts that are designated as net investment hedges is $150.0 million as of December 31, 2018. The following tables present the impact of derivative contracts on the Company’s financial statements.
Fair value of derivatives designated as hedging instruments under ASC 815: Fair Value December 31 (dollars in millions) Balance Sheet Location 2018 2017
Foreign currency contracts Other current assets $ 3.9 $ 0.2
Other non-current assets 5.1 -
Accrued liabilities (0.6) (1.8)
Commodities contracts Other current assets - 0.2
Accrued liabilities (0.9) - Total derivatives designated as hedging instruments $ 7.5 $ (1.4)

53
13. Derivative instruments (continued) The effect of derivative instruments on the consolidated statement of earnings is as follows.
Years ended December 31 (dollars in millions)
14. Income Taxes The components of the provision (benefit) for income taxes consisted of the following: Years ended December 31 (dollars in millions) 2018 2017 2016 Current: Federal $ 60.1 $ 148.0 $ 71.6 State 15.6 9.4 14.5 International 38.6 43.8 34.9 Deferred: Federal (1.7) 23.5 11.0 State 1.5 5.8 5.2 International (0.5) (6.2) (1.2) $ 113.6 $ 224.3 $ 136.0 The provision for income taxes differs from the U.S. federal statutory rate due to the following items: Years ended December 31 2018 2017 2016 Provision at U.S. federal statutory rate 21.0 % 35.0 % 35.0 % State taxes, net of federal benefit 2.4 1.9 2.8 International income tax rate differential - China (2.3) (6.5) (6.2) International income tax rate differential - other 1.1 0.1 0.3 U.S. manufacturing credit - (1.4) (1.5) Research tax credits (0.5) (0.3) (0.3) Excess tax benefit on stock compensation (0.4) (2.2) (1.1) Other (0.9) 0.8 0.4 20.4 % 27.4 % 29.4 % U.S. Tax Cuts & Jobs Act (U.S. Tax Reform) - 15.7 - 20.4 % 43.1 % 29.4 %
U.S. Tax Reform was enacted on December 22, 2017 and significantly changed U.S. corporate income tax laws. Among other things, U.S. Tax Reform reduced the U.S. corporate income tax rate to 21 percent commencing on January 1, 2018, implemented a territorial tax system and levied a one-time mandatory tax on undistributed earnings of foreign subsidiaries of U.S. companies.
Derivatives in ASC 815 cash flow hedging relationships
Amount of gain (loss) recognized in other
comprehensive loss on derivative
Location of gain (loss) reclassified from
accumulated other comprehensive loss into
earnings
Amount of gain (loss) reclassified from accumulated
other comprehensive loss into earnings
2018 2017 2018 2017
Foreign currency contracts $ 1.8 $ (1.1) Cost of products sold $ 0.3 $ 0.4 Commodities contracts (1.1) 0.5 Cost of products sold 0.3 0.6
$ 0.7 $ (0.6) $ 0.6 $ 1.0
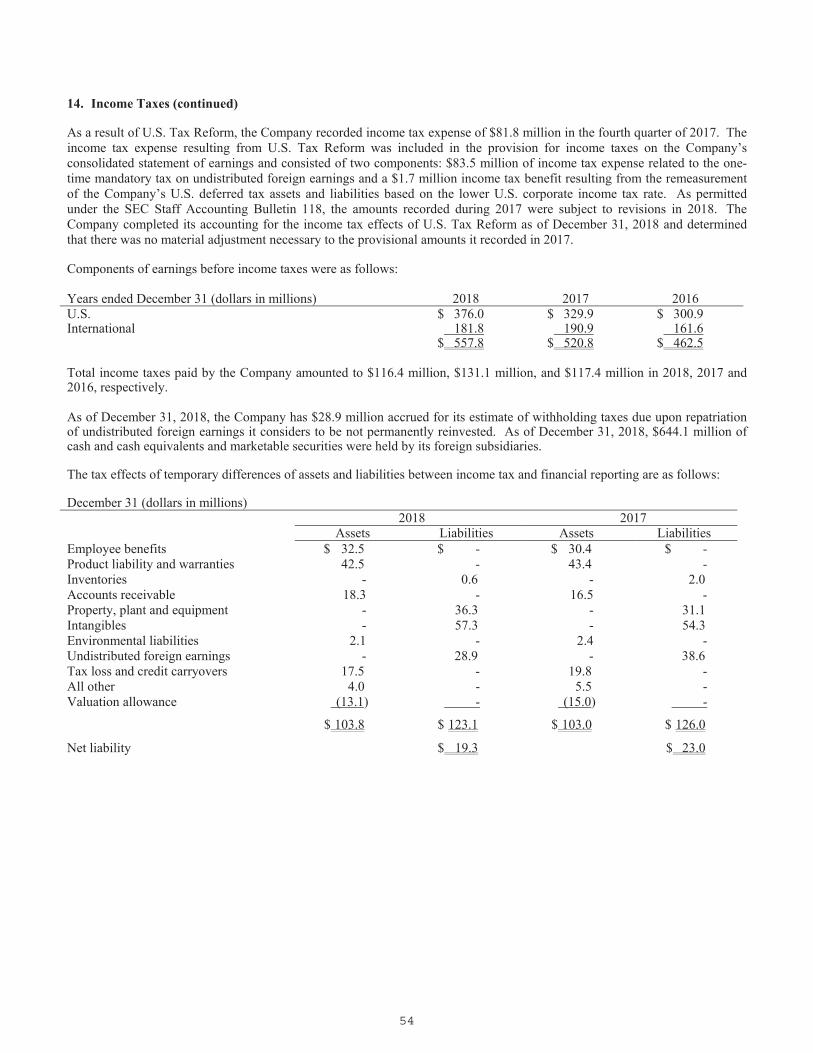
54
14. Income Taxes (continued) As a result of U.S. Tax Reform, the Company recorded income tax expense of $81.8 million in the fourth quarter of 2017. The income tax expense resulting from U.S. Tax Reform was included in the provision for income taxes on the Company’s consolidated statement of earnings and consisted of two components: $83.5 million of income tax expense related to the one-time mandatory tax on undistributed foreign earnings and a $1.7 million income tax benefit resulting from the remeasurement of the Company’s U.S. deferred tax assets and liabilities based on the lower U.S. corporate income tax rate. As permitted under the SEC Staff Accounting Bulletin 118, the amounts recorded during 2017 were subject to revisions in 2018. The Company completed its accounting for the income tax effects of U.S. Tax Reform as of December 31, 2018 and determined that there was no material adjustment necessary to the provisional amounts it recorded in 2017. Components of earnings before income taxes were as follows: Years ended December 31 (dollars in millions) 2018 2017 2016 U.S. $ 376.0 $ 329.9 $ 300.9 International 181.8 190.9 161.6 $ 557.8 $ 520.8 $ 462.5 Total income taxes paid by the Company amounted to $116.4 million, $131.1 million, and $117.4 million in 2018, 2017 and 2016, respectively. As of December 31, 2018, the Company has $28.9 million accrued for its estimate of withholding taxes due upon repatriation of undistributed foreign earnings it considers to be not permanently reinvested. As of December 31, 2018, $644.1 million of cash and cash equivalents and marketable securities were held by its foreign subsidiaries. The tax effects of temporary differences of assets and liabilities between income tax and financial reporting are as follows: December 31 (dollars in millions) 2018 2017 Assets Liabilities Assets Liabilities Employee benefits $ 32.5 $ - $ 30.4 $ - Product liability and warranties 42.5 - 43.4 - Inventories - 0.6 - 2.0 Accounts receivable 18.3 - 16.5 - Property, plant and equipment - 36.3 - 31.1 Intangibles - 57.3 - 54.3 Environmental liabilities 2.1 - 2.4 - Undistributed foreign earnings - 28.9 - 38.6 Tax loss and credit carryovers 17.5 - 19.8 - All other 4.0 - 5.5 - Valuation allowance (13.1) - (15.0) -
$ 103.8 $ 123.1 $ 103.0 $ 126.0
Net liability $ 19.3 $ 23.0

55
14. Income Taxes (continued) The Company believes it is more likely than not that it will realize its deferred tax assets through the reduction of future taxable income. The Company considered historical operating results in determining the probability of the realization of the deferred tax assets. A reconciliation of the beginning and ending amounts of tax loss carryovers, credit carryovers and valuation allowances is as follows: December 31 (dollars in millions) Net Operating Losses and Tax Credits Valuation Allowances 2018 2017 2018 2017 Beginning balance $ 19.8 $ 18.2 $ 15.0 $ 13.1 Additions - 1.6 - 1.9 Reductions (2.3) - (1.9) - Ending balance $ 17.5 $ 19.8 $ 13.1 $ 15.0 The Company has foreign net operating loss carryovers that expire in 2019 through 2026 and state and local net operating loss carryovers that expire between 2019 and 2035. A reconciliation of the beginning and ending amount of unrecognized benefits is as follows: (Dollars in millions) 2018 2017 Balance at January 1 $ 6.2 $ 4.2 Additions for tax positions of prior years 2.1 2.0 Balance at December 31 $ 8.3 $ 6.2 The amount of unrecognized tax benefits that, if recognized, would affect the effective income tax rate is $0.8 million. The Company recognizes potential interest and penalties related to unrecognized tax benefits as a component of income tax expense. At December 31, 2018, there was an immaterial amount of interest and penalties accrued. The Company anticipates that there will not be a decrease in the total amount of unrecognized tax benefits in 2019. The Company’s U.S. federal income tax returns and its U.S. state and local income tax returns are subject to audit for the years 2016-2018 and 2001-2018, respectively. The Company is subject to non-U.S. income tax audits for the years 2009-2018. 15. Commitments and Contingencies The Company is a potentially responsible party in judicial and administrative proceedings seeking to clean up sites which have been environmentally impacted. In each case the Company has established reserves, insurance proceeds and/or a potential recovery from third parties. The Company believes any environmental claims will not have a material effect on its financial position or results of operations. The Company is subject to various claims and pending lawsuits for product liability and other matters arising out of the conduct of the Company's business. With respect to product liability claims, the Company has self-insured a portion of its product liability loss exposure for many years. The Company has established reserves and has insurance coverage, which it believes are adequate to cover incurred claims. For the years ended December 31, 2018 and 2017, the Company had $125 million of product liability insurance for individual losses in excess of $7.5 million. The Company periodically reevaluates its exposure on claims and lawsuits and makes adjustments to its reserves as appropriate. The Company believes, based on current knowledge, consultation with counsel, adequate reserves and insurance coverage that the outcome of such claims and lawsuits will not have a material adverse effect on the Company's financial position, results of operations or cash flows.
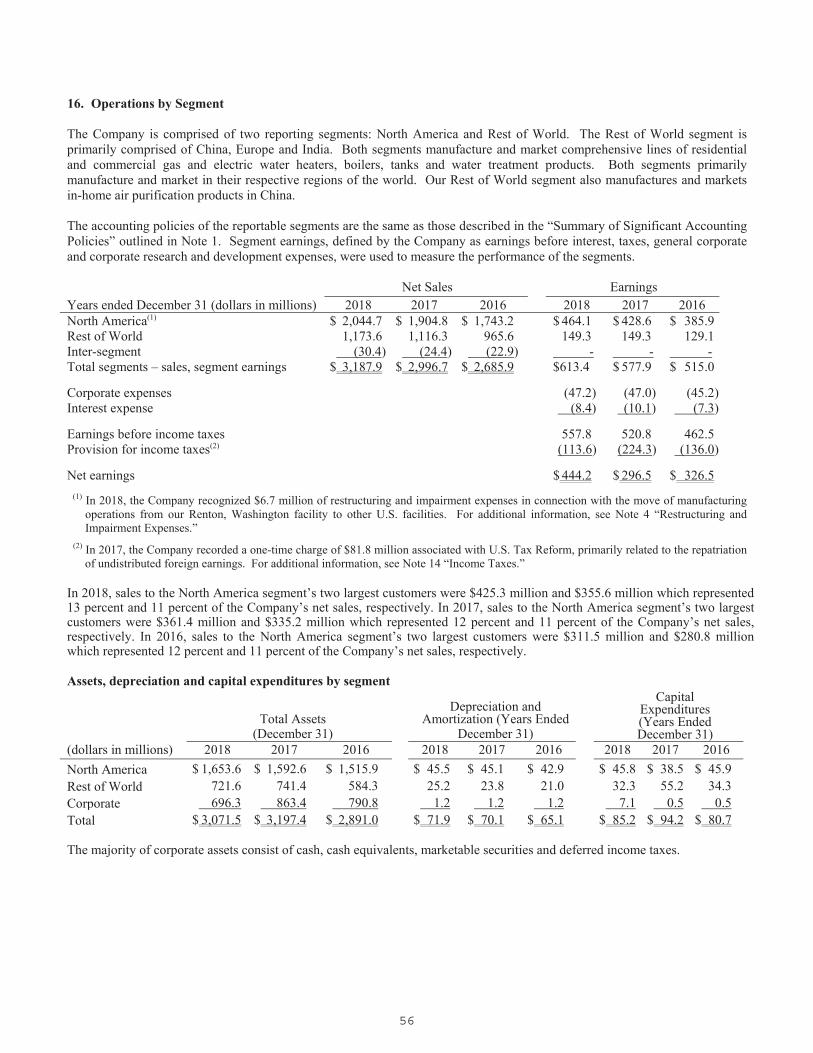
56
16. Operations by Segment The Company is comprised of two reporting segments: North America and Rest of World. The Rest of World segment is primarily comprised of China, Europe and India. Both segments manufacture and market comprehensive lines of residential and commercial gas and electric water heaters, boilers, tanks and water treatment products. Both segments primarily manufacture and market in their respective regions of the world. Our Rest of World segment also manufactures and markets in-home air purification products in China. The accounting policies of the reportable segments are the same as those described in the “Summary of Significant Accounting Policies” outlined in Note 1. Segment earnings, defined by the Company as earnings before interest, taxes, general corporate and corporate research and development expenses, were used to measure the performance of the segments. Net Sales Earnings Years ended December 31 (dollars in millions) 2018 2017 2016 2018 2017 2016 North America(1) $ 2,044.7 $ 1,904.8 $ 1,743.2 $ 464.1 $ 428.6 $ 385.9 Rest of World 1,173.6 1,116.3 965.6 149.3 149.3 129.1 Inter-segment (30.4) (24.4) (22.9) - - - Total segments – sales, segment earnings $ 3,187.9 $ 2,996.7 $ 2,685.9 $613.4 $ 577.9 $ 515.0
Corporate expenses (47.2) (47.0) (45.2) Interest expense (8.4) (10.1) (7.3)
Earnings before income taxes 557.8 520.8 462.5 Provision for income taxes(2) (113.6) (224.3) (136.0)
Net earnings $ 444.2 $ 296.5 $ 326.5
(1) In 2018, the Company recognized $6.7 million of restructuring and impairment expenses in connection with the move of manufacturing operations from our Renton, Washington facility to other U.S. facilities. For additional information, see Note 4 “Restructuring and Impairment Expenses.”
(2) In 2017, the Company recorded a one-time charge of $81.8 million associated with U.S. Tax Reform, primarily related to the repatriation of undistributed foreign earnings. For additional information, see Note 14 “Income Taxes.”
In 2018, sales to the North America segment’s two largest customers were $425.3 million and $355.6 million which represented 13 percent and 11 percent of the Company’s net sales, respectively. In 2017, sales to the North America segment’s two largest customers were $361.4 million and $335.2 million which represented 12 percent and 11 percent of the Company’s net sales, respectively. In 2016, sales to the North America segment’s two largest customers were $311.5 million and $280.8 million which represented 12 percent and 11 percent of the Company’s net sales, respectively. Assets, depreciation and capital expenditures by segment
Total Assets (December 31)
Depreciation and Amortization (Years Ended
December 31)
Capital Expenditures (Years Ended December 31)
(dollars in millions) 2018 2017 2016 2018 2017 2016 2018 2017 2016
North America $ 1,653.6 $ 1,592.6 $ 1,515.9 $ 45.5 $ 45.1 $ 42.9 $ 45.8 $ 38.5 $ 45.9 Rest of World 721.6 741.4 584.3 25.2 23.8 21.0 32.3 55.2 34.3 Corporate 696.3 863.4 790.8 1.2 1.2 1.2 7.1 0.5 0.5 Total $ 3,071.5 $ 3,197.4 $ 2,891.0 $ 71.9 $ 70.1 $ 65.1 $ 85.2 $ 94.2 $ 80.7 The majority of corporate assets consist of cash, cash equivalents, marketable securities and deferred income taxes.

57
16. Operations by Segment (continued) Net sales and long-lived assets by geographic location The following data by geographic area includes net sales based on product shipment destination and long-lived assets based on physical location. Long-lived assets include net property, plant and equipment and other long-term assets. Long-lived Assets
(December 31) Net Sales
(Years Ended December 31) (dollars in millions) 2018 2017 2016 2018 2017 2016
United States $ 327.3 $ 303.0 $ 292.4 United States $ 1,820.8 $ 1,698.1 $ 1,570.7 China 252.6 250.8 184.3 China 1,071.2 1,034.9 887.1 Canada 3.1 3.2 3.1 Canada 175.0 163.7 138.7 Other Foreign 42.9 47.1 48.4 Other Foreign 120.9 100.0 89.4 Total $ 625.9 $ 604.1 $ 528.2 Total $ 3,187.9 $ 2,996.7 $ 2,685.9 17. Quarterly Results of Operations (Unaudited) (dollars in millions, except per share amounts)
1st Quarter 2nd Quarter 3rd Quarter 4th Quarter 2018 2017 2018 2017 2018 2017 2018 2017
Net sales $ 788.0 $ 740.0 $ 833.3 $ 738.2 $ 754.1 $ 749.9 $ 812.5 $ 768.6 Gross profit 321.5 300.9 341.0 304.2 306.0 305.0 337.0 322.3 Net earnings 98.8 87.7 114.5 92.4 104.6 93.7 126.3 22.7
Basic earnings per share 0.58 0.51 0.67 0.53 0.61 0.54 0.75 0.13
Diluted earnings per share 0.57 0.50 0.66 0.53 0.61 0.54 0.74 0.13
Common dividends declared 0.18 0.14 0.18 0.14 0.18 0.14 0.22 0.14 Net earnings per share are computed separately for each period, and therefore, the sum of such quarterly per share amounts may differ from the total for the year. In the first quarter of 2018, the Company recorded $6.7 million of restructuring and impairment expenses associated with a move of manufacturing operations from its Renton, Washington facility to other U.S. facilities. These charges reduced after-tax earnings by $5.0 million or $0.03 per share. In the fourth quarter of 2017, the Company recorded a one-time charge of $81.8 million associated with U.S. Tax Reform, primarily related to the repatriation of undistributed foreign earnings. These charges reduced earnings per share by $0.47.
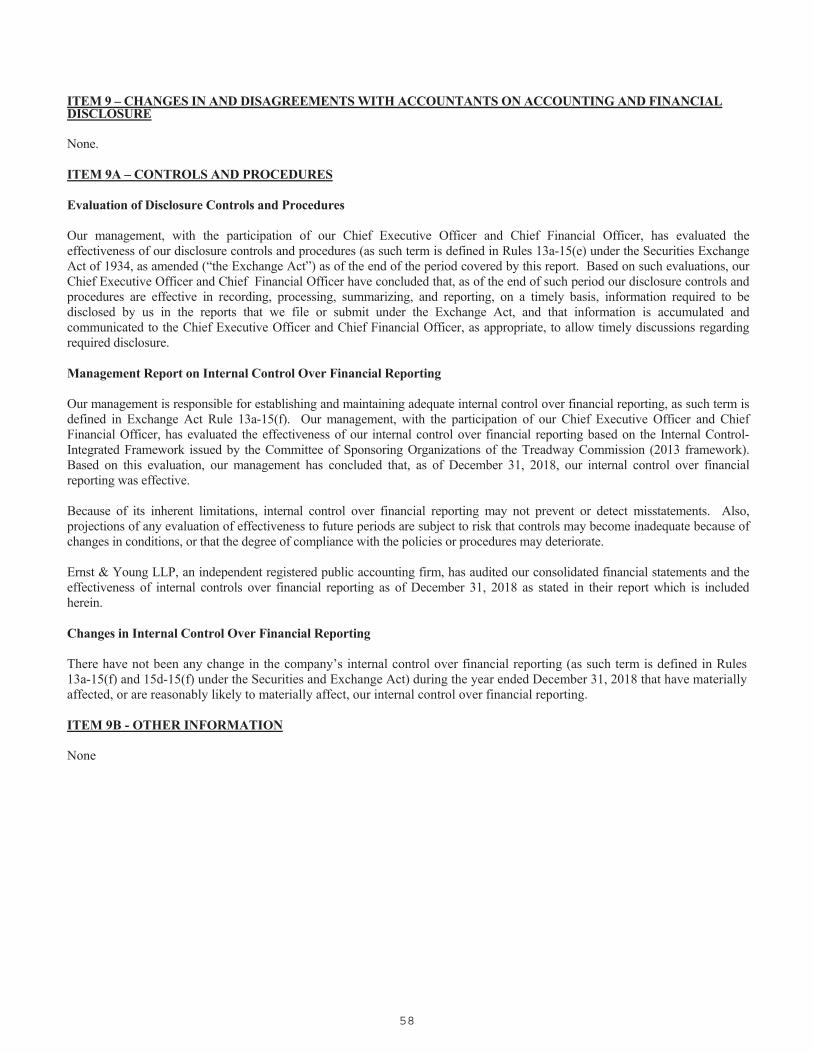
58
ITEM 9 – CHANGES IN AND DISAGREEMENTS WITH ACCOUNTANTS ON ACCOUNTING AND FINANCIAL DISCLOSURE None. ITEM 9A – CONTROLS AND PROCEDURES Evaluation of Disclosure Controls and Procedures Our management, with the participation of our Chief Executive Officer and Chief Financial Officer, has evaluated the effectiveness of our disclosure controls and procedures (as such term is defined in Rules 13a-15(e) under the Securities Exchange Act of 1934, as amended (“the Exchange Act”) as of the end of the period covered by this report. Based on such evaluations, our Chief Executive Officer and Chief Financial Officer have concluded that, as of the end of such period our disclosure controls and procedures are effective in recording, processing, summarizing, and reporting, on a timely basis, information required to be disclosed by us in the reports that we file or submit under the Exchange Act, and that information is accumulated and communicated to the Chief Executive Officer and Chief Financial Officer, as appropriate, to allow timely discussions regarding required disclosure. Management Report on Internal Control Over Financial Reporting Our management is responsible for establishing and maintaining adequate internal control over financial reporting, as such term is defined in Exchange Act Rule 13a-15(f). Our management, with the participation of our Chief Executive Officer and Chief Financial Officer, has evaluated the effectiveness of our internal control over financial reporting based on the Internal Control-Integrated Framework issued by the Committee of Sponsoring Organizations of the Treadway Commission (2013 framework). Based on this evaluation, our management has concluded that, as of December 31, 2018, our internal control over financial reporting was effective. Because of its inherent limitations, internal control over financial reporting may not prevent or detect misstatements. Also, projections of any evaluation of effectiveness to future periods are subject to risk that controls may become inadequate because of changes in conditions, or that the degree of compliance with the policies or procedures may deteriorate. Ernst & Young LLP, an independent registered public accounting firm, has audited our consolidated financial statements and the effectiveness of internal controls over financial reporting as of December 31, 2018 as stated in their report which is included herein. Changes in Internal Control Over Financial Reporting There have not been any change in the company’s internal control over financial reporting (as such term is defined in Rules 13a-15(f) and 15d-15(f) under the Securities and Exchange Act) during the year ended December 31, 2018 that have materially affected, or are reasonably likely to materially affect, our internal control over financial reporting. ITEM 9B - OTHER INFORMATION
None

59
REPORT OF INDEPENDENT REGISTERED PUBLIC ACCOUNTING FIRM
The Board of Directors and Stockholders A. O. Smith Corporation Opinion on Internal Control over Financial Reporting We have audited A. O. Smith Corporation’s internal control over financial reporting as of December 31, 2018, based on criteria established in Internal Control—Integrated Framework issued by the Committee of Sponsoring Organizations of the Treadway Commission (2013 framework) (the COSO criteria). In our opinion, A. O. Smith Corporation (the Company) maintained, in all material respects, effective internal control over financial reporting as of December 31, 2018, based on the COSO criteria. We also have audited, in accordance with the standards of the Public Company Accounting Oversight Board (United States) (PCAOB), the consolidated balance sheets of A. O. Smith Corporation as of December 31, 2018 and 2017, and the related consolidated statements of earnings, comprehensive earnings, stockholders’ equity, and cash flows for each of the three years in the period ended December 31, 2018, and the related notes and financial statement schedule listed in the index at Item 15(a) and our report dated February 15, 2019 expressed an unqualified opinion thereon. Basis for Opinion The Company’s management is responsible for maintaining effective internal control over financial reporting and for its assessment of the effectiveness of internal control over financial reporting included in the accompanying Management Report on Internal Control over Financial Reporting. Our responsibility is to express an opinion on the Company’s internal control over financial reporting based on our audit. We are a public accounting firm registered with the PCAOB and are required to be independent with respect to the Company in accordance with the U.S. federal securities laws and the applicable rules and regulations of the Securities and Exchange Commission and the PCAOB. We conducted our audit in accordance with the standards of the PCAOB. Those standards require that we plan and perform the audit to obtain reasonable assurance about whether effective internal control over financial reporting was maintained in all material respects. Our audit included obtaining an understanding of internal control over financial reporting, assessing the risk that a material weakness exists, testing and evaluating the design and operating effectiveness of internal control based on the assessed risk, and performing such other procedures as we considered necessary in the circumstances. We believe that our audit provides a reasonable basis for our opinion. Definition and Limitations of Internal Control Over Financial Reporting A company’s internal control over financial reporting is a process designed to provide reasonable assurance regarding the reliability of financial reporting and the preparation of financial statements for external purposes in accordance with generally accepted accounting principles. A company’s internal control over financial reporting includes those policies and procedures that (1) pertain to the maintenance of records that, in reasonable detail, accurately and fairly reflect the transactions and dispositions of the assets of the company; (2) provide reasonable assurance that transactions are recorded as necessary to permit preparation of financial statements in accordance with generally accepted accounting principles, and that receipts and expenditures of the company are being made only in accordance with authorizations of management and directors of the company; and (3) provide reasonable assurance regarding prevention or timely detection of unauthorized acquisition, use, or disposition of the company’s assets that could have a material effect on the financial statements. Because of its inherent limitations, internal control over financial reporting may not prevent or detect misstatements. Also, projections of any evaluation of effectiveness to future periods are subject to the risk that controls may become inadequate because of changes in conditions, or that the degree of compliance with the policies or procedures may deteriorate. /s/ Ernst & Young LLP
Milwaukee, Wisconsin February 15, 2019

60
PART III ITEM 10 - DIRECTORS, EXECUTIVE OFFICERS AND CORPORATE GOVERNANCE
The information included under the headings “Election of Directors” and “Board Committees” in our definitive Proxy Statement for the 2019 Annual Meeting of Stockholders (to be filed with the Securities and Exchange Commission (SEC) under Regulation 14A within 120 days after the end of the registrant’s fiscal year) is incorporated herein by reference. The information required regarding Executive Officers of the company is included in Part I of this Annual Report on Form 10-K under the caption “Executive Officers of the Company.” We have a separately designated Audit Committee on which Gene C. Wulf, Dr. Ilham Kadri, Mark D. Smith and Idelle K. Wolf serve, with Mr. Wulf, as Chairperson. All members are independent under applicable SEC and New York Stock Exchange rules; the Board of Directors of the company has concluded that Ms. Wolf and Mr. Wulf are “audit committee financial experts” in accordance with SEC rules.
We have adopted a Financial Code of Ethics applicable to our principal executive officer, principal financial officer and principal accounting officer. As a best practice, this code has been executed by key financial and accounting personnel as well. In addition, we have adopted a general code of business conduct for our directors, officers and all employees, which is known as the A. O. Smith Guiding Principles. The Financial Code of Ethics, the A. O. Smith Guiding Principles and other company corporate governance matters are available on our website at www.aosmith.com. We are not including the information contained on our website as a part of or incorporating it by reference into, this Form 10-K. We intend to disclose on this website any amendments to, or waivers from, the Financial Code of Ethics or the A. O. Smith Guiding Principles that are required to be disclosed pursuant to SEC rules. There have been no waivers of the Financial Code of Ethics or the A. O. Smith Guiding Principles. Stockholders may obtain copies of any of these corporate governance documents free of charge by writing to the Corporate Secretary at the address on the cover page of this Form 10-K.
The information included under the heading “Compliance with Section 16(a) of the Securities Exchange Act” in our definitive Proxy Statement for the 2019 Annual Meeting of Stockholders (to be filed with the SEC under Regulation 14A within 120 days after the end of the registrant’s fiscal year) is incorporated herein by reference.
ITEM 11 - EXECUTIVE COMPENSATION
The information included under the headings “Executive Compensation,” “Director Compensation,” “Report of the Personnel and Compensation Committee” and “Compensation Committee Interlocks and Insider Participation” in the company’s definitive Proxy Statement for the 2019 Annual Meeting of Stockholders (to be filed with the SEC under Regulation 14A within 120 days after the end of the registrant’s fiscal year) is incorporated herein by reference.
ITEM 12 - SECURITY OWNERSHIP OF CERTAIN BENEFICIAL OWNERS AND MANAGEMENT AND RELATED STOCKHOLDER MATTERS
The information included under the headings “Principal Stockholders” and “Security Ownership of Directors and Management” in our definitive Proxy Statement for the 2019 Annual Meeting of Stockholders (to be filed with the SEC under Regulation 14A within 120 days after the end of the registrant’s fiscal year) is incorporated herein by reference.
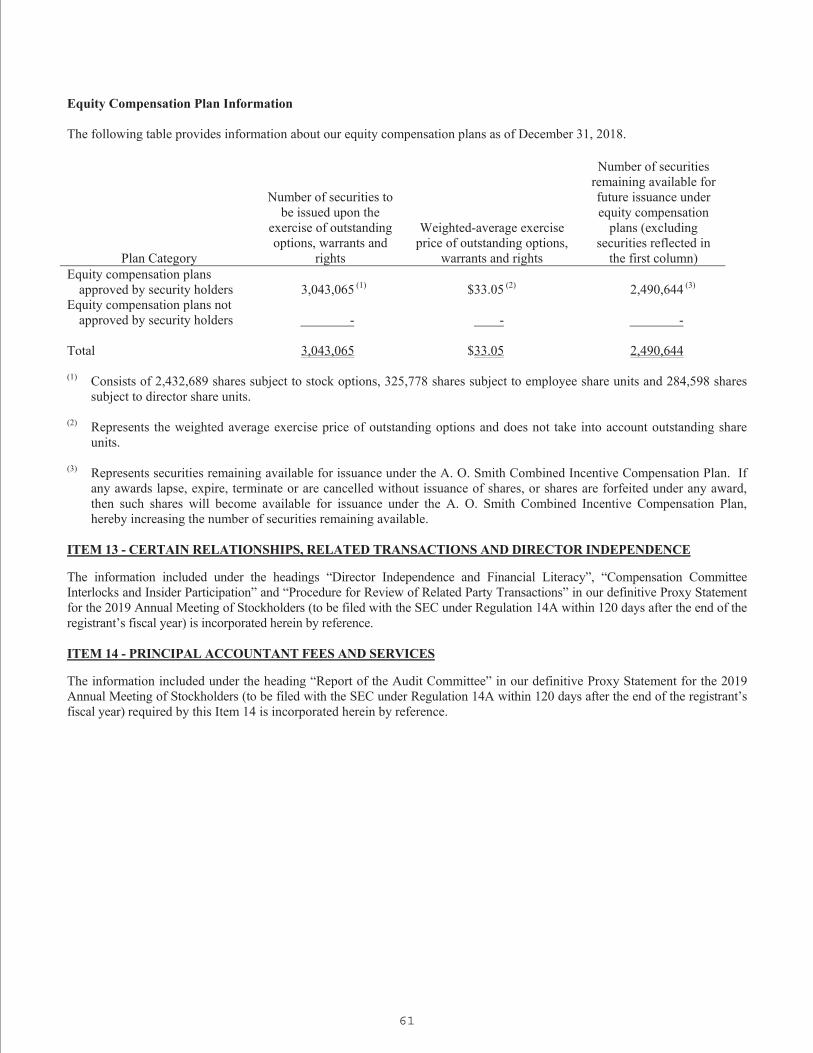
61
Equity Compensation Plan Information The following table provides information about our equity compensation plans as of December 31, 2018.
Plan Category
Number of securities to be issued upon the
exercise of outstanding options, warrants and
rights
Weighted-average exercise price of outstanding options,
warrants and rights
Number of securities remaining available for future issuance under equity compensation
plans (excluding securities reflected in
the first column) Equity compensation plans approved by security holders 3,043,065 (1) $33.05 (2) 2,490,644 (3)
Equity compensation plans not approved by security holders - - - Total 3,043,065 $33.05 2,490,644 (1) Consists of 2,432,689 shares subject to stock options, 325,778 shares subject to employee share units and 284,598 shares
subject to director share units. (2) Represents the weighted average exercise price of outstanding options and does not take into account outstanding share
units. (3) Represents securities remaining available for issuance under the A. O. Smith Combined Incentive Compensation Plan. If
any awards lapse, expire, terminate or are cancelled without issuance of shares, or shares are forfeited under any award, then such shares will become available for issuance under the A. O. Smith Combined Incentive Compensation Plan, hereby increasing the number of securities remaining available.
ITEM 13 - CERTAIN RELATIONSHIPS, RELATED TRANSACTIONS AND DIRECTOR INDEPENDENCE
The information included under the headings “Director Independence and Financial Literacy”, “Compensation Committee Interlocks and Insider Participation” and “Procedure for Review of Related Party Transactions” in our definitive Proxy Statement for the 2019 Annual Meeting of Stockholders (to be filed with the SEC under Regulation 14A within 120 days after the end of the registrant’s fiscal year) is incorporated herein by reference. ITEM 14 - PRINCIPAL ACCOUNTANT FEES AND SERVICES
The information included under the heading “Report of the Audit Committee” in our definitive Proxy Statement for the 2019 Annual Meeting of Stockholders (to be filed with the SEC under Regulation 14A within 120 days after the end of the registrant’s fiscal year) required by this Item 14 is incorporated herein by reference.
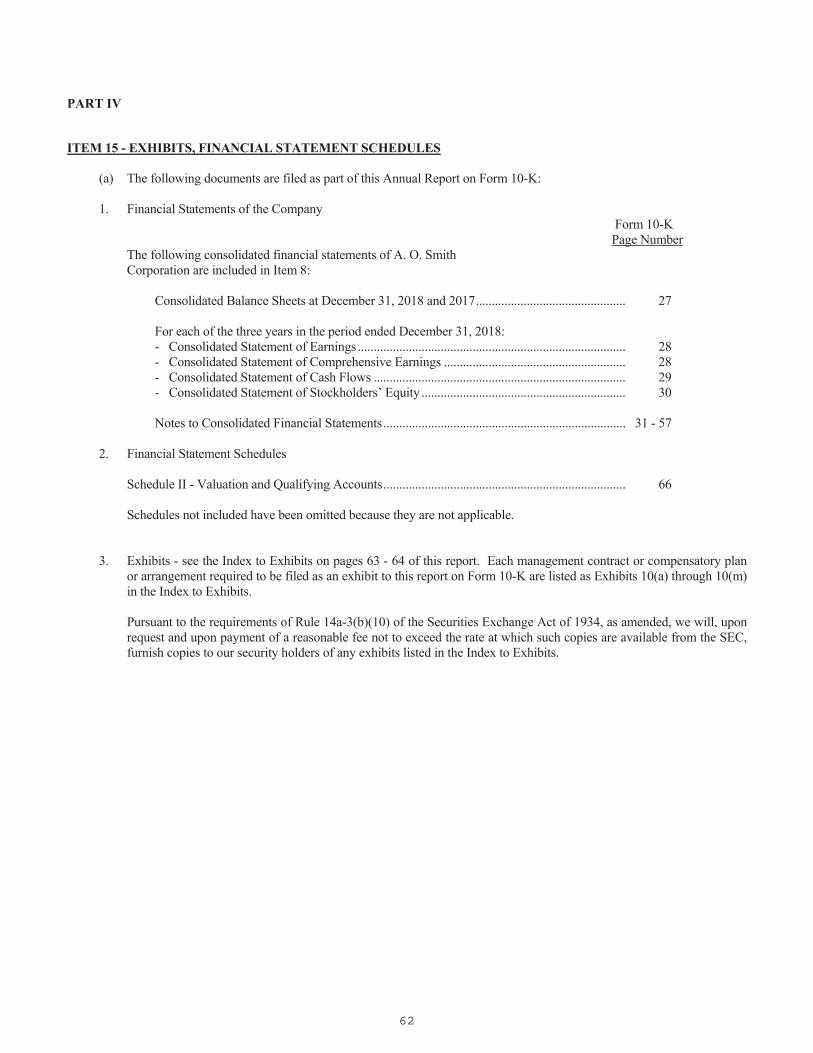
62
PART IV ITEM 15 - EXHIBITS, FINANCIAL STATEMENT SCHEDULES (a) The following documents are filed as part of this Annual Report on Form 10-K: 1. Financial Statements of the Company Form 10-K Page Number The following consolidated financial statements of A. O. Smith Corporation are included in Item 8: Consolidated Balance Sheets at December 31, 2018 and 2017 ............................................... 27 For each of the three years in the period ended December 31, 2018: - Consolidated Statement of Earnings .................................................................................... 28 - Consolidated Statement of Comprehensive Earnings ......................................................... 28 - Consolidated Statement of Cash Flows ............................................................................... 29 - Consolidated Statement of Stockholders’ Equity ................................................................ 30 Notes to Consolidated Financial Statements ............................................................................ 31 - 57 2. Financial Statement Schedules Schedule II - Valuation and Qualifying Accounts ............................................................................ 66 Schedules not included have been omitted because they are not applicable. 3. Exhibits - see the Index to Exhibits on pages 63 - 64 of this report. Each management contract or compensatory plan
or arrangement required to be filed as an exhibit to this report on Form 10-K are listed as Exhibits 10(a) through 10(m) in the Index to Exhibits.
Pursuant to the requirements of Rule 14a-3(b)(10) of the Securities Exchange Act of 1934, as amended, we will, upon
request and upon payment of a reasonable fee not to exceed the rate at which such copies are available from the SEC, furnish copies to our security holders of any exhibits listed in the Index to Exhibits.
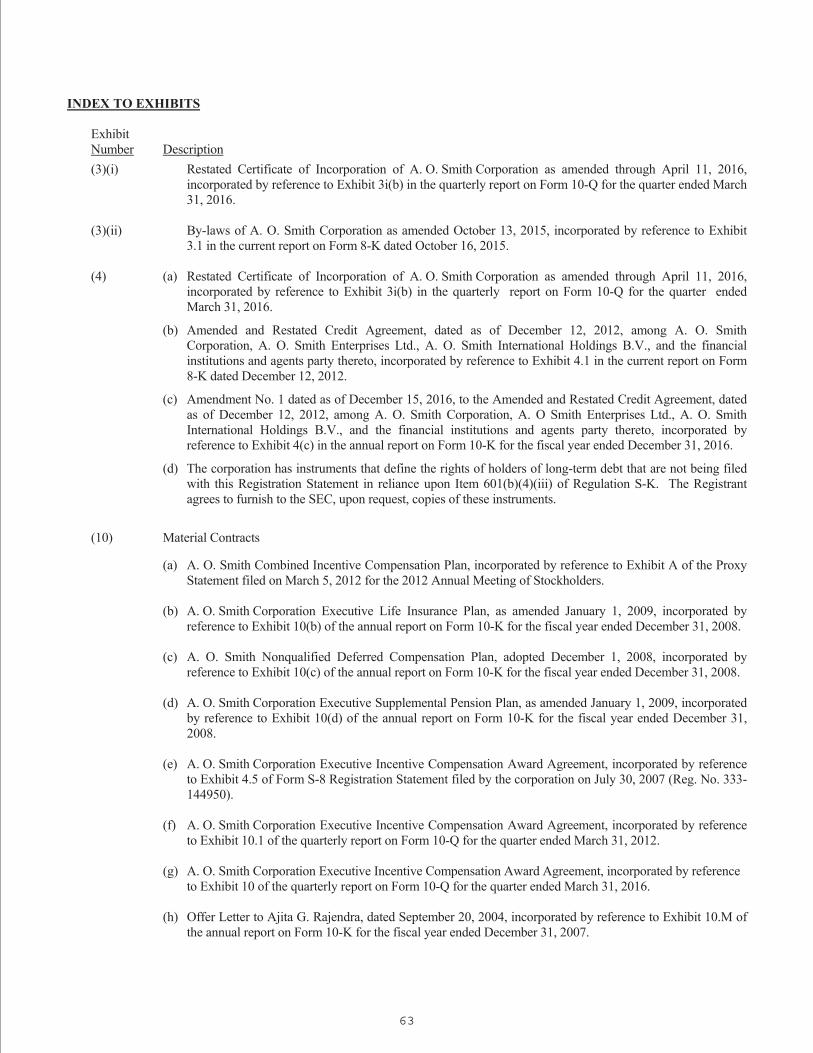
63
INDEX TO EXHIBITS Exhibit Number Description
(3)(i) Restated Certificate of Incorporation of A. O. Smith Corporation as amended through April 11, 2016, incorporated by reference to Exhibit 3i(b) in the quarterly report on Form 10-Q for the quarter ended March 31, 2016.
(3)(ii) By-laws of A. O. Smith Corporation as amended October 13, 2015, incorporated by reference to Exhibit
3.1 in the current report on Form 8-K dated October 16, 2015. (4) (a) Restated Certificate of Incorporation of A. O. Smith Corporation as amended through April 11, 2016,
incorporated by reference to Exhibit 3i(b) in the quarterly report on Form 10-Q for the quarter ended March 31, 2016.
(b) Amended and Restated Credit Agreement, dated as of December 12, 2012, among A. O. Smith Corporation, A. O. Smith Enterprises Ltd., A. O. Smith International Holdings B.V., and the financial institutions and agents party thereto, incorporated by reference to Exhibit 4.1 in the current report on Form 8-K dated December 12, 2012.
(c) Amendment No. 1 dated as of December 15, 2016, to the Amended and Restated Credit Agreement, dated as of December 12, 2012, among A. O. Smith Corporation, A. O Smith Enterprises Ltd., A. O. Smith International Holdings B.V., and the financial institutions and agents party thereto, incorporated by reference to Exhibit 4(c) in the annual report on Form 10-K for the fiscal year ended December 31, 2016.
(d) The corporation has instruments that define the rights of holders of long-term debt that are not being filed with this Registration Statement in reliance upon Item 601(b)(4)(iii) of Regulation S-K. The Registrant agrees to furnish to the SEC, upon request, copies of these instruments.
(10) Material Contracts
(a) A. O. Smith Combined Incentive Compensation Plan, incorporated by reference to Exhibit A of the Proxy Statement filed on March 5, 2012 for the 2012 Annual Meeting of Stockholders.
(b) A. O. Smith Corporation Executive Life Insurance Plan, as amended January 1, 2009, incorporated by
reference to Exhibit 10(b) of the annual report on Form 10-K for the fiscal year ended December 31, 2008. (c) A. O. Smith Nonqualified Deferred Compensation Plan, adopted December 1, 2008, incorporated by
reference to Exhibit 10(c) of the annual report on Form 10-K for the fiscal year ended December 31, 2008. (d) A. O. Smith Corporation Executive Supplemental Pension Plan, as amended January 1, 2009, incorporated
by reference to Exhibit 10(d) of the annual report on Form 10-K for the fiscal year ended December 31, 2008.
(e) A. O. Smith Corporation Executive Incentive Compensation Award Agreement, incorporated by reference
to Exhibit 4.5 of Form S-8 Registration Statement filed by the corporation on July 30, 2007 (Reg. No. 333-144950).
(f) A. O. Smith Corporation Executive Incentive Compensation Award Agreement, incorporated by reference
to Exhibit 10.1 of the quarterly report on Form 10-Q for the quarter ended March 31, 2012.
(g) A. O. Smith Corporation Executive Incentive Compensation Award Agreement, incorporated by reference to Exhibit 10 of the quarterly report on Form 10-Q for the quarter ended March 31, 2016.
(h) Offer Letter to Ajita G. Rajendra, dated September 20, 2004, incorporated by reference to Exhibit 10.M of the annual report on Form 10-K for the fiscal year ended December 31, 2007.

64
INDEX TO EXHIBITS (continued) Exhibit Number Description
(i) Amendment to Offer Letter to Ajita G. Rajendra dated December 10, 2015, incorporated by reference to Exhibit 10(i) of the annual report on Form 10-K for the fiscal year ended December 31, 2015.
(j) A. O. Smith Corporation Senior Leadership Severance Plan, incorporated by reference to Exhibit 10.1 of the quarterly report for Form 10-Q for the quarter ended June 30, 2009.
(k) Form of A. O. Smith Corporation Special Retention Award Agreement, incorporated by reference to
Exhibit 10.1 of the quarterly report on Form 10-Q for the quarter ended March 31, 2011. (l) Stockholder Agreement dated as of December 9, 2008, between A. O. Smith Corporation and each Smith
Investment Company stockholder who becomes a signatory thereto, incorporated by reference to Exhibit 10.3 of the current report on Form 8-K dated December 9, 2008.
(m) Summary of Directors’ Compensation incorporated by reference to Exhibit 10.1 of the quarterly report on
Form 10-Q for the quarter ended June 30, 2018.
(21) Subsidiaries.
(23) Consent of Independent Registered Public Accounting Firm. (31.1) Certification by the Chief Executive Officer, pursuant to Section 302 of the Sarbanes-Oxley Act, dated
February 15, 2019. (31.2) Certification by the Executive Vice-President and Chief Financial Officer, pursuant to Section 302 of the
Sarbanes-Oxley Act, dated February 15, 2019. (32.1) Written Statement of the Chief Executive Officer Pursuant to 18 U.S.C. Section 1350. (32.2) Written Statement of the Chief Financial Officer Pursuant to 18 U.S.C. Section 1350. (101) The following materials from A. O. Smith Corporation’s Annual Report on Form 10-K for the fiscal year
ended December 31, 2018 are filed herewith, formatted in XBRL (Extensive Business Reporting Language): (i) the Consolidated Balance Sheets as of December 31, 2018 and 2017, (ii) the Consolidated Statement of Earnings for the three years ended December 31, 2018, (iii) the Consolidated Statement of Comprehensive Earnings for the three years ended December 31, 2018, (iv) the Consolidated Statement of Cash Flows for the three years ended December 31, 2018, (v) the Consolidated Statement of Stockholders’ Equity for the three years ended December 31, 2018 and (vi) the Notes to Consolidated Financial Statements.

65
SIGNATURES Pursuant to the requirements of Section 13 or 15(d) of the Securities Exchange Act of 1934, the registrant has duly caused this report to be signed on behalf of the undersigned, thereunto duly authorized.
A. O. SMITH CORPORATION
Date: February 15, 2019 By: /s/ Ajita G. Rajendra Ajita G. Rajendra Executive Chairman of the Board of Directors
Pursuant to the requirements of the Securities Exchange Act of 1934, this report has been signed below as of February 15, 2019 by the following persons on behalf of the registrant and in the capacities and on the dates indicated.
Name and Title Signature
AJITA G. RAJENDRA /s/ Ajita G. Rajendra Executive Chairman of the Board of Directors Ajita G. Rajendra KEVIN J. WHEELER /s/ Kevin J. Wheeler Director Kevin J. Wheeler President and Chief Executive Officer JOHN J. KITA /s/ John J. Kita Executive Vice President and Chief Financial Officer John J. Kita DANIEL L. KEMPKEN /s/ Daniel L. Kempken Vice President and Controller Daniel L. Kempken RONALD D. BROWN /s/ Ronald D. Brown Director Ronald D. Brown WILLIAM P. GREUBEL /s/ William P. Greubel Director William P. Greubel PAUL W. JONES /s/ Paul W. Jones Director Paul W. Jones DR. ILHAM KADRI /s/ Dr. Ilham Kadri Director Dr. Ilham Kadri BRUCE M. SMITH /s/ Bruce M. Smith Director Bruce M. Smith MARK D. SMITH /s/ Mark D. Smith Director Mark D. Smith IDELLE K. WOLF /s/ Idelle K. Wolf Director Idelle K. Wolf GENE C. WULF /s/ Gene C. Wulf Director Gene C. Wulf

66
A. O. SMITH CORPORATION
SCHEDULE II - VALUATION AND QUALIFYING ACCOUNTS
(Dollars in millions)
Years ended December 31, 2018, 2017 and 2016
Description
Balance at Beginning
of Year
Charged to Costs and Expenses
Acquisition of
Businesses
Deductions
Balance at End of Year
2018:
Valuation allowance for trade and
notes receivable
$ 5.3 $ 1.5 $ -
$ (0.4) $ 6.4 Valuation allowance for deferred
tax assets
15.0 - -
(1.9) 13.1
2017:
Valuation allowance for trade and
notes receivable
$ 6.3 $ - $ 0.2
$ (1.2) $ 5.3 Valuation allowance for deferred
tax assets
13.1 1.9 -
- 15.0
2016:
Valuation allowance for trade and
notes receivable
$ 6.0 $ 1.1 $ 0.2
$ (1.0) $ 6.3 Valuation allowance for deferred
tax assets
11.0 2.1 -
- 13.1

67
Exhibit 21 SUBSIDIARIES: The following lists all subsidiaries and affiliates of A. O. Smith Corporation.
Name of Subsidiary Jurisdiction in Which
Incorporated AOS Holding Company Delaware A. O. Smith Water Treatment (North America), Inc. Delaware SICO Acquisition, LLC Delaware Takagi - A. O. Smith Tankless Water Heater Company LLC Delaware American Water Heater Company Nevada Hague Europe, LLC Ohio William R. Hague, Inc. Ohio Lochinvar, LLC Tennessee State Industries, LLC. Tennessee Aquasana, Inc. Texas A. O. Smith Holdings (Barbados) SRL Barbados A. O. Smith Enterprises Ltd. Canada A. O. Smith (China) Environmental Products Co., Ltd. China A. O. Smith (China) Investment Co., Ltd. China A. O. Smith (China) Water Heater Co., Ltd. China A. O. Smith (China) Water Products Co., Ltd. China A. O. Smith L’eau chaude S.a.r.l. France Waterboss Europe, SRL France A. O. Smith (Hong Kong) Limited Hong Kong SAR A. O. Smith India Water Products Private Limited India Products de Agua, S. de R.L. de C.V. Mexico A.O. Smith Holdings I B.V. The Netherlands A.O. Smith Holdings II B.V. The Netherlands A.O. Smith Holdings III B.V. The Netherlands A.O. Smith International Holdings B.V. The Netherlands A.O. Smith Products v.o.f. The Netherlands A.O. Smith Water Products Company B.V. The Netherlands AO Smith Su Teknolojileri Anonim Sirketi Turkey A. O. Smith Water FZE United Arab Emirates Lochinvar Limited United Kingdom A. O. Smith Vietnam Company Limited Vietnam

68
Exhibit 23
CONSENT OF INDEPENDENT REGISTERED PUBLIC ACCOUNTING FIRM
We consent to the incorporation by reference in the Registration Statements (Form S-8 Nos. 333-144950 and 333-170436) pertaining to the A. O. Smith Combined Incentive Compensation Plan of our reports dated February 15, 2019, with respect to the consolidated financial statements and schedule of A. O. Smith Corporation, and the effectiveness of internal control over financial reporting of A. O. Smith Corporation, included in this Annual Report (Form 10-K) for the year ended December 31, 2018.
/s/ Ernst & Young LLP
Milwaukee, Wisconsin
February 15, 2019
69
Exhibit 31.1 CERTIFICATION OF CHIEF EXECUTIVE OFFICER I, Kevin J. Wheeler, certify that:
1. I have reviewed this annual report on Form 10-K of A. O. Smith Corporation;
2. Based on my knowledge, this report does not contain any untrue statement of a material fact or omit to state a material fact necessary to make the statements made, in light of the circumstances under which such statements were made, not misleading with respect to the period covered by this report;
3. Based on my knowledge, the financial statements and other financial information included in this report, fairly present in all material respects the financial condition, results of operations and cash flows of the registrant as of, and for, the periods presented in this report;
4. The registrant’s other certifying officer and I are responsible for establishing and maintaining disclosure controls and
procedures (as defined in Exchange Act Rules 13a-15(e) and 15d-15(e)) and internal control over financial reporting (as defined in Exchange Act Rules 13a-15(f) and 15d-15(f)) for the registrant and have:
a) Designed such disclosure controls and procedures, or caused such disclosure controls and procedures to be designed under our supervision, to ensure that material information relating to the registrant, including its consolidated subsidiaries, is made known to us by others within those entities, particularly during the period in which this report is being prepared;
b) Designed such internal control over financial reporting, or caused such internal control over financial reporting to be designed under our supervision, to provide reasonable assurance regarding the reliability of financial reporting and the preparation of financial statements for external purposes in accordance with generally accepted accounting principles;
c) Evaluated the effectiveness of the registrant’s disclosure controls and procedures and presented in this report our conclusions about the effectiveness of the disclosure controls and procedures, as of the end of the period covered by this report based on such evaluation; and
d) Disclosed in this report any changes in the registrant’s internal control over financial reporting that occurred during the registrant’s most recent fiscal quarter (the registrant’s fourth fiscal quarter in the case of an annual report) that has materially affected, or is reasonably likely to materially affect, the registrant’s internal control over financial reporting; and
5. The registrant’s other certifying officer and I have disclosed, based on our most recent evaluation of internal control over financial reporting, to the registrant’s auditors and the audit committee of the registrant’s board of directors:
a) All significant deficiencies and material weaknesses in the design or operation of internal control over financial reporting which are reasonably likely to adversely affect the registrant’s ability to record, process, summarize and report financial information; and
b) Any fraud, whether or not material, that involves management or other employees who have a significant role in the registrant’s internal control over financial reporting.
Date: February 15, 2019 /s/ Kevin J. Wheeler Kevin J. Wheeler President and Chief Executive Officer
70
Exhibit 31.2 CERTIFICATION OF CHIEF FINANCIAL OFFICER I, John J. Kita, certify that; 1. I have reviewed this annual report on Form 10-K of A. O. Smith Corporation; 2. Based on my knowledge, this report does not contain any untrue statement of a material fact or omit to state a material
fact necessary to make the statements made, in light of the circumstances under which such statements were made, not misleading with respect to the period covered by this report;
3. Based on my knowledge, the financial statements and other financial information included in this report, fairly present
in all material respects the financial condition, results of operations and cash flows of the registrant as of, and for, the periods presented in this report;
4. The registrant’s other certifying officer and I are responsible for establishing and maintaining disclosure controls and
procedures (as defined in Exchange Act Rules 13a-15(e) and 15d-15(e)) and internal control over financial reporting (as defined in Exchange Act Rules 13a-15(f) and 15d-15(f)) for the registrant and have:
a) Designed such disclosure controls and procedures, or caused such disclosure controls and procedures to be
designed under our supervision, to ensure that material information relating to the registrant, including its consolidated subsidiaries, is made known to us by others within those entities, particularly during the period in which this report is being prepared;
b) Designed such internal control over financial reporting, or caused such internal control over financial reporting to
be designed under our supervision, to provide reasonable assurance regarding the reliability of financial reporting and the preparation of financial statements for external purposes in accordance with generally accepted accounting principles;
c) Evaluated the effectiveness of the registrant’s disclosure controls and procedures and presented in this report our
conclusions about the effectiveness of the disclosure controls and procedures, as of the end of the period covered by this report based on such evaluation; and
d) Disclosed in this report any changes in the registrant’s internal control over financial reporting that occurred during
the registrant’s most recent fiscal quarter (the registrant’s fourth fiscal quarter in the case of an annual report) that has materially affected, or is reasonably likely to materially affect, the registrant’s internal control over financial reporting; and
5. The registrant’s other certifying officer and I have disclosed, based on our most recent evaluation of internal control over
financial reporting, to the registrant’s auditors and the audit committee of the registrant’s board of directors:
a) All significant deficiencies and material weaknesses in the design or operation of internal control over financial reporting which are reasonably likely to adversely affect the registrant’s ability to record, process, summarize and report financial information; and
b) Any fraud, whether or not material, that involves management or other employees who have a significant role in the
registrant’s internal control over financial reporting. Date: February 15, 2019 /s/ John J. Kita John J. Kita Executive Vice President and Chief Financial Officer
71
Exhibit 32.1
Certification Pursuant to 18 U.S.C. Section 1350, As Adopted Pursuant to Section 906 of the Sarbanes-Oxley Act of 2002
In connection with the Annual Report of A. O. Smith Corporation (the “Company”) on Form 10-K for the fiscal year ended December 31, 2018, as filed with the Securities and Exchange Commission on the date hereof (the “Report”). I, Kevin J. Wheeler, President and Chief Executive Officer of the Company, certify, pursuant to 18 U.S.C. §1350, as adopted pursuant to §906 of the Sarbanes-Oxley Act of 2002, that to the best of my knowledge: (1) The Report fully complies with the requirements of Section 13(a) or 15(d) of the Securities Exchange Act of 1934; and (2) The information contained in the Report fairly presents, in all material respects, the financial condition and results of
operations of the Company. Date: February 15, 2019 /s/ Kevin J. Wheeler Kevin J. Wheeler President and Chief Executive Officer This certification accompanies this Report pursuant to Section 906 of the Sarbanes-Oxley Act of 2002 and shall not be deemed filed by the Company for purposes of Section 18 of the Securities Exchange Act of 1934, as amended. A signed original of this written statement required by Section 906 has been provided to the Company and will be retained by the Company and furnished to the Securities and Exchange Commission or its staff upon request.
72
Exhibit 32.2
Certification Pursuant to 18 U.S.C. Section 1350, As Adopted Pursuant to Section 906 of the Sarbanes-Oxley Act of 2002
In connection with the Annual Report of A. O. Smith Corporation (the “Company”) on Form 10-K for the fiscal year ended December 31, 2018, as filed with the Securities and Exchange Commission on the date hereof (the “Report”). I, John J. Kita, Executive Vice President and Chief Financial Officer of the Company, certify, pursuant to 18 U.S.C. §1350, as adopted pursuant to §906 of the Sarbanes-Oxley Act of 2002, that to the best of my knowledge: (1) The Report fully complies with the requirements of Section 13(a) or 15(d) of the Securities Exchange Act of 1934;
and (2) The information contained in the Report fairly presents, in all material respects, the financial condition and results of
operations of the Company. Date: February 15, 2019 /s/ John J. Kita John J. Kita Executive Vice President and Chief Financial Officer
This certification accompanies this Report pursuant to Section 906 of the Sarbanes-Oxley Act of 2002 and shall not be deemed filed by the Company for purposes of Section 18 of the Securities Exchange Act of 1934, as amended. A signed original of this written statement required by Section 906 has been provided to the Company and will be retained by the Company and furnished to the Securities and Exchange Commission or its staff upon request.

Innovation Has a Name From the new, cutting-edge products that A. O. Smith
is developing and bringing to market … to the way
that the company is doing it, innovation is front and
center, just as it has been for the last 145 years.
While “Innovation has a name” is the company’s
tag line, it is more than a catchy phrase. Innovation
is embedded in the DNA of A. O. Smith, defining
who we are and how we operate. For A. O. Smith,
the formula is quite simple – innovation drives
value to consumers, which in turn, drives value to
shareholders. The company’s ongoing commitment to
innovation was evident on a number of fronts in 2018.

Providing New Tools to Help Consumers and ContractorsInnovation doesn’t just come in the way of new facilities and new products. In 2018, A. O. Smith set out to make it even easier for U.S. consumers to select the right water heater based on their typical household hot water needs, usage patterns and home location. The A. O. Smith team created an app that plumbers can quickly add to their websites, which provides quick, customized hot water solutions to consumers, all from their local plumbers’ websites.
A. O. Smith has created an app that plumbers can add to their websites, which provides quick hot water solutions to consumers.
A. O. Smith’s new water treatment engineering and manufacturing facility in Lishui, China has
been deemed one of the most sophisticated facilities of its kind in the world.
Signs of A. O. Smith’s commitment to innovation were evident around the globe in 2018 as the company opened a new state-of-the-art water treatment engineering and manufacturing facility in Lishui, China. The project – nearly 700,000-square-feet in size – includes two manufacturing plants, a multi-functional, complete water treatment R&D lab and administrative offices.
The facility - deemed one of the most sophisticated residential water treatment and air purification facilities in the world - not only provides A. O. Smith with enhanced capabilities, but further cements A. O. Smith as a global leader in the residential and commercial water treatment and air purification industries.
Opening of a Global Engineering Center in China

Unveiling of the New Corporate Technology CenterFollowing the opening of the China facility, A. O. Smith unveiled its new Corporate Technology Center, the company’s new innovation center and laboratory adjacent to the company’s world headquarters in Milwaukee, Wisconsin. The 43,000-square-foot hub serves as home base for a team of global engineers as they develop and test core technologies to be used in A. O. Smith products around the world – products that will heat, clean and conserve water.
Innovation is not only evident in the products being developed at the facility, but also in how the facility itself operates. All the laboratory test water is being captured and reclaimed in a custom-built, multi-story tank, where water is being recycled and reused to heat the building.
A. O. Smith’s new 43,000-square-foot innovation center and laboratory will serve as home base for the company’s team of global engineers as they develop and test core technologies.
In 2018, iCOMM Wi-Fi connectivity became a standard built-in feature on all Cyclone® Mxi model commercial water heaters.
Standardizing Wi-Fi ConnectivityIn 2018, A. O. Smith added iCOMM Wi-Fi connectivity service as a built-in feature on all Cyclone® Mxi model commercial water heaters. The interface allows customers to proactively manage and monitor their Cyclone water heaters from anywhere in the world using their smartphones. Via the app, customers also receive precautionary alerts which can help prevent temporary business outages and lost revenues.
A. O. Smith is also making the most of the incoming data that shows exactly how a water heater performs in certain facilities under certain conditions. This, in turn, sets the stage for future services that can be offered around proactive replacement and predictive failure.

Leveraging Solar PowerIn 2018, A. O. Smith also designed and produced a new water heater specifically for the solar market. The 50-gallon water heater integrates with photovoltaic solar panels, allowing homeowners to generate hot water from solar energy, while also having a backup to the grid on days when the sun isn’t as prevalent. A built-in display allows consumers to monitor the amount of energy coming in from the PV solar panels. A. O. Smith has partnered with SunEarth, a leader in installing renewable energy technology, on the project. The new solar units are being sold under the SunEarth brand in the U.S. and its territories.
Expanding the Family of Zero Cold Water Products in ChinaIn China, where there is heightened sensitivity to conserving water, it is common for families to collect any initial cold water from their taps and reserve it for other uses. Recognizing the pain point, in 2016 and 2017, A. O. Smith launched Zero Cold Water gas tankless water heater products, eliminating all initial cold water with the help of a built-in DC circulation pump and a special patented-design return water valve.
Given the notable success of the Zero Cold Water Series, in 2018, A. O. Smith extended the line of products with additional model offerings, including the Zero Cold Water Combi Boiler, which – as a first of its kind in China – not only provides hot water via tankless units, but also heating to homes.
In 2018, A. O. Smith designed and produced a new water heater specifically for the solar market.
Further Enhancing the CREST® Condensing Boiler FamilyMid-year, Lochinvar proudly rolled out enhancements to its category-leading CREST® Condensing Boiler family, further boosting product performance and efficiency. The new single-blower, single-chamber burner units deliver up to 96.2% thermal efficiency, translating into reduced gas consumption, lower fuel bills for consumers, greater product dependability and a faster payback rate.
Lochinvar rolled out enhancements to its CREST® Condensing Boiler family, further boosting product performance and efficiency.
A. O. Smith expanded its line of Zero Cold Water gas tankless water heater products in China in 2018.

Board of Directors
William P. GreubelRetired Chief Executive Officer & Director, Wabash National CorporationElected to Board 20063,4
Bruce M. SmithRetired Chairman of the Board of Managers & Former Chief Executive Officer, Smith Investment Company LLCElected to Board 19952,3,4
Idelle K. WolfRetired President, Barnes DistributionElected to Board 20051
Kevin J. WheelerPresident & Chief Executive OfficerElected to Board 20172
Ajita G. RajendraExecutive Chairman & Former Chief Executive OfficerElected to Board 20112
Paul W. JonesRetired Executive Chairman & Former Chief Executive OfficerElected to Board 20043,4
Dr. Ilham KadriChief Executive Officer Solvay S.A.Elected to Board 20161
Mark D. SmithBusiness Manager, Strattec Security CorporationElected to Board 20011
Gene C. WulfRetired Director, Executive Vice President & Chief Financial Officer, Bemis Company, Inc.Elected to Board 20031
Ronald D. BrownFormer Vice Chairman, The Armor GroupElected to Board 20013,4
1 Audit Committee2 Investment Policy Committee3 Nominating and Governance Committee4 Personnel and Compensation Committee
From left to right, pictured at the A. O. Smith facility in Lishui, China

Senior Leadership
Patricia K. AckermanSenior Vice President, Investor Relations, Treasurer & Corporate Responsibility and Sustainability
Wallace E. “Eddie” GoodwinSenior Vice President; President & General Manager – Lochinvar, LLC
John J. KitaExecutive Vice President & Chief Financial Officer
Ajita G. RajendraExecutive Chairman
Anindadeb V. DasGuptaSenior Vice President – International; President – A. O. Smith Holdings (Barbados) SRL
D. Samuel KargeSenior Vice President; President – North America Water Treatment
Peter R. MartineauSenior Vice President – Chief Information Officer
David R. WarrenSenior Vice President; President & General Manager – North America Water Heating
Paul R. DanaSenior Vice President – Global Operations
Dr. Robert J. HeidemanSenior Vice President – Chief Technology Officer
Charles T. LauberSenior Vice President – Strategy & Corporate Development
James F. SternExecutive Vice President, General Counsel & Secretary
Wei DingSenior Vice President; President – A. O. Smith China
Daniel L. KempkenVice President & Controller
Mark A. PetrarcaSenior Vice President – Human Resources & Public Affairs
Kevin J. WheelerPresident & Chief Executive Officer


11270 West Park PlaceP.O. Box 245008Milwaukee, WI 53224-9508
414.359.4000
www.aosmith.com