Innovation Effects and Origins of Ego-Network Stability ...
190
Innovation Effects and Origins of Ego-Network Stability: The Hidden Dimension of Social Capital A DISSERTATION SUBMITTED TO THE FACULTY OF THE UNIVERSITY OF MINNESOTA BY Pankaj Kumar IN PARTIAL FULFILLMENT OF THE REQUIREMENTS FOR THE DEGREE OF DOCTOR OF PHILOSOPHY Advisor: Akbar Zaheer April 2018
Transcript of Innovation Effects and Origins of Ego-Network Stability ...

Innovation Effects and Origins of Ego-Network Stability: The Hidden Dimension of
Social Capital
A DISSERTATION
SUBMITTED TO THE FACULTY OF THE
UNIVERSITY OF MINNESOTA
BY
Pankaj Kumar
IN PARTIAL FULFILLMENT OF THE REQUIREMENTS
FOR THE DEGREE OF
DOCTOR OF PHILOSOPHY
Advisor: Akbar Zaheer
April 2018

© Pankaj Kumar 2018

i
Acknowledgements
I believe the story which follows applies to my dissertation journey. Though different
versions of this story exist, I borrow the one by Joel Osteen.
One time, I heard about this wealthy man. He was known for being very eccentric
and far out. One night, he was having a big party at his house. In his backyard, his
swimming pool was filled with sharks and alligators. He announced to all the
guests, “Anyone who will swim across my pool, I will give you anything that you
want.”
In a few minutes, there was a big splash. He looked over and this man was
swimming 90 to nothing, dodging the alligator, maneuvering his way around the
sharks as frantic as could be. He made it to the other side just in the nick of time
and jumped out totally panicked. The wealthy man came over and said, “I can’t
believe it. You’re the bravest person I’ve ever met. Now what do you want me to
give you?” The man said, “What I want more than anything else is the name of
the person that just pushed me in!”
Unlike the story, I know the name of the person who pushed me in. Aks Zaheer is the
best advisor and mentor any student can have and such has been his contributions to my
intellectual development that I am short of words to express my gratitude. I thank him for
recruiting me in the Ph.D. program. This deserves special mention because not many
schools were willing to take risk given my lack of research experience. In addition, but
for the countless hours he spent with me discussing the crafts of writing in general and
the nuts and bolts of the dissertation in particular, I would not have been able to make it.
Despite my complete ignorance of the process (further aggravated by my introverted
nature), Aks never misjudged my ignorance for arrogance. He replied to my emails even
when I least expected him to do so (e.g., even when he was in transit). Aks was generous
with his advice on research, family, and job search. He has been a great mentor and
coauthor.
I am indebted to Sri Zaheer for being part of the committee and my coauthor. I learnt
from her how to get to the point. Her comments were short and succinct but extremely
thought provoking and rich enough to completely change the whole narrative. A case in
point is one of the papers coauthored with Aks. Sri suggested some changes while
reviewing the preliminary draft which I at that point in time felt not necessary. Fast
forward a couple of rounds in the revision process, we ended up doing exactly what she
had suggested right from the beginning. I also appreciate her bank-rolling my AOM and

ii
other conferences during my job search and, to top it all, when Aks was pushing me hard
in my second year paper, she put in kind words of encouragement.
My acknowledgement will be incomplete without mentioning Harry Sapienza. Harry is
an epitome of both kind-heartedness and intellect, with extreme finickiness about diction.
He suggested me to think about my dissertation from a long-term perspective – that is –
the ultimate goal of my dissertation should not be to just publish one paper but to build a
solid building block of my scholarship for years to come. He also encouraged me to not
only work hard as a scholar but also be happy and focus on my family.
I deeply appreciate Martin Ganco for his excellent advice and look forward to finishing
my project with him. He was always accessible and open to help. I immensely benefitted
from his codes for name matching and our discussions about the joint project.
Joe Ritter was quite generous in accepting to be my committee member. He has been a
source of excellent feedback all through the journey. I learnt a lot from his class,
especially about the difference-in-differences estimator. He was kind enough to email me
new relevant articles whenever he came across one for testing my theory in the
dissertation. In sum, I am blessed to have a committee of these wonderful scholars who
guided me (Aks pushed me!) to the finish line. Last but not least Russell Funk deserves
special mention because despite being not in my committee he was more than willing to
respond to my questions.
iii
Abstract
Much research has shown that firms’ ego-network configurations, i.e., structural holes or
network closure, help them achieve superior innovation outcomes. However, little is
known about how overall ego-network stability affects innovation. In this two-part
dissertation, I first argue that in the alliance network context the stability is detrimental
for the focal firm’s innovation performance. Moreover, firms are affected differentially
by the stability depending on whether they span structural holes and on whether their
inventive activities are geographically concentrated. Spanning structural holes mitigates
the negative effect of ego-network stability whereas the geographic concentration of
firms’ inventive activities further worsens the negative relationship. Next, I develop
propositions about the origins of firms’ ego-network stability. I limit my theorizing in this
case to structural hole stability or the stability of open structures only, with special focus
on the embeddedness of alliance brokerage structures in geographic and network
community space. I argue that the stability of network structures increases with the
geographic distance between member firms. In contrast, I hypothesize that member
firms’ location in different network communities has a negative effect on the stability of
networks. I empirically test my propositions regarding the (ego-network) stability-
performance relationship using 198 biopharmaceutical firms headquartered in the U.S.
over a 21-year period from 1985 to 2005. My estimation sample for testing the origins of
structural hole stability comprises of 329 broker and 680 alter firms over 1985-2005,
yielding 61,495 triad-year observations in the global pharmaceutical industry context. I
find support for my ideas. I contribute theoretically by highlighting the importance of

iv
network stability, a salient but lost dimension of social capital, for the focal firm’s
performance. My work has practical implications in terms of network rewiring and
maintenance.

v
Table of Contents
List of Tables……………………………………………………………………………..vi
List of Figures……………………………………………………………………………vii
Chapter 1. Introduction……………………………………………………………………1
Chapter 2. Ego-Network Stability and Innovation Performance………………………...10
Chapter 3. Origins of Ego-Network Stability: A Deeper Look into Brokerage (Structural
Hole) Stability …………………………………………………………………………..75
Chapter 4. Conclusion…………………………………………………………………..115
References………………………………………………………………………………125
Appendix………………………………………………………………………………..147

vi
List of Tables
i. Table 1. Descriptive statistics and correlations for Chapter 2……………….68
ii. Table 2. Estimation of citation-weighted patent count sans self-citations using
unconditional fixed-effects Poisson models………………………………....69
iii. Table 3. Estimation of citation-weighted patent count sans self-citations
controlling for time-varying unobserved heterogeneity…………………......70
iv. Table 4. Descriptive statistics and correlations for Chapter 3……………...110
v. Table 5. Estimation of the hazard of decay using discrete-time complementary
log-log survival model……………………………………………………...111
vi. Table 6. Robustness check using different operationalizations of the decay
event………………………………………………………………………...112

vii
List of Figures
i. Figure 1. Stability measure illustrated by the example of Amgen …………..71
ii. Figure 2. Plot of citation-weighted patent count against structural holes,
geographic concentration, and stability ……………………………………..72
iii. Figure 3. Interaction plot between stability and structural holes and between
stability and geographic concentration ……………………………………...73
iv. Figure 4. Plot to illustrate the extraction of open triad……. ………………113
v. Figure 5. Stable triad .………………………………………………………113
vi. Figure 6. Different types of decay events ………………………………….114

1
CHAPTER 1
Introduction
In strategy research a firm’s performance takes center stage (Gulati, Nohria, &
Zaheer, 2000; Baum, Cowan, & Jonrad, 2014). Stressing interfirm heterogeneity, strategy
researchers attempt to understand how and why a firm differs from another in
performance (Nelson, 1991). The firm’s performance, in this regard, is multidimensional
in nature, with scholars focusing, among many other dimensions, on financial or
accounting performance (e.g., Barnett, Greve, & Park, 1994), firm’s market performance
(e.g., Kale, Dyer, & Singh, 2002), survival and growth (e.g., Sapienza, Autio, George, &
Zahra, 2006), CSR (corporate social responsibility) (e.g., Johnson & Greening, 1999),
and innovation (e.g., Schilling & Phelps, 2007). For the purposes of this dissertation, I
focus solely on innovation. The reason is that modern-day economic activities are
becoming more and more knowledge intensive. Innovation in such knowledge-based
environments is quite challenging but necessary – challenging because the knowledge
relevant for innovation exhibits high rate of obsolescence, and necessary because
innovation might be a key determinant for the firm’s survival and performance
(Utterback, 1994). The following excerpts from the Economist article aptly characterize
innovation:
Innovation has become the new theology…Yet there is still much confusion over
what it is and how to make it happen… INNOVATION has become the industrial
religion of the late 20th century. Business sees it as the key to increasing profits
and market share. Governments automatically reach for it when trying to fix the
economy… economists are still struggling to understand this most mysterious part
of the wealth-creation process (The Economist, 1999).

2
Research into the ‘how and why’ of the differences in interfirm performance can
be broadly categorized into two streams: One view treats the firm as an individual,
atomistic actor, devoid of relations, and tries to explain the firms’ conduct on the basis of
the firm’s resources (e.g., Barney, 1991) or on the basis of industries to which the firm
belongs (e.g., Porter, 1979). The other view, taking a relational stance, emphasizes
network resources as drivers of firms’ performance (e.g., Gulati, 1999). Without a doubt,
both streams have enriched and complemented the strategic management research.
However, I, through this dissertation, intend to build on and contribute to the second
stream, the ‘embeddedness’ view (Granovetter, 1985). My broader research objective is
to a) improve the understanding of when and how interfirm networks affect firms’
innovation performance, and b) how firms can make performance-enhancing network
structures, if any exist, persist.
The social capital that firms derive from their ego-network structures of direct
alliance relations acts as a resource. Along the lines of Bourdieu, I define social capital as
“the sum of the resources, actual or virtual, that accrue to an individual or a group by
virtue of possessing a durable network of more or less institutionalized relationships of
mutual acquaintance and recognition” (Bourdieu & Wacquant, 1992: 119). On the whole,
social capital is a property of the collectivity (Burt, 1992). It helps produce goods and
services, in my context innovation, similar to physical or human capital (Coleman, 1988:
S98). Structures and the associated social capital set the scope of knowledge exchange
(Cowan & Jonard, 2004; Krackhardt, 1992) by influencing the level and quality of inter-
3
organizational interaction and by serving as a gateway to critical resources such as
information and knowledge (Gulati, 2007; Bourdieu, 1980; Kogut, 2000). The social
capital embedded in the structural pattern of connections affects the firm’s innovation
performance (Nahapiet & Ghosal, 1998; Baker, 1990; Powell, Koput, & Smith-Doerr,
1996; Schilling & Phelps, 2007) across such diverse contexts as nanotechnology (Funk,
2014), biotechnology (Baum, Calabrese, & Silverman, 2000), computer (Sytch &
Tatarynowicz, 2014), semiconductor (Podolny, Stuart, & Hannan, 1996), automotive
(Dyer & Nobeoka, 2002), telecommunication (Majumdar & Venkataraman, 1998) and
chemical (Ahuja, 2000).
Scholars generally agree that (egocentric) network structures, which the firm
inhabits, are heterogeneous in their ability to generate social capital, which, in turn,
explains interfirm differences in performances (Walker, Kogut, & Shan, 1997; Burt,
2000). Studies acknowledge that the flow of ideas and information varies based on the
differences in the structural configuration of network “pipes” (Podolny, 2001), with
different firms facing different costs and benefits of accessing information based on the
configuration of their alliance network structures (Owen-Smith & Powell, 2004).
Two distinct structural configurations have dominated the structure-performance
debate. First, closed structures (Coleman, 1990), in which all partner firms have alliance
relationship with each other, generate social capital by engendering mutual trust and
creating and maintaining group norms (Uzzi, 1997; Granovetter, 1985). Also, any partner
firm is less likely to engage in opportunistic behavior because of the imminent censure
4
from other members and the related reputational risk (Coleman, 1988). The social capital
from these closed structures fosters knowledge sharing by group members and
subsequent integration, thus affecting innovation (Inkpen & Tsang, 2005; Adler & Kwon,
2002). Second, open structures or structural holes, the structural configurations in which
the focal firm is connected with two unconnected alliance partner firms, generate social
capital by providing access to non-redundant and a diverse set of ideas. The focal firm in
these structures enjoys the undivided attention of the two partners vying for the same
relationship, leading to better terms for knowledge exchange, catalyzing the performance
of innovating firms (Hargadon & Sutton, 1997). Thus, notwithstanding the discussions
about competing network configurations, extant scholarly debate has veered around to the
key idea that the configuration of the ego-network structure, and the ensuing social
capital, determines the focal firm’s innovation outcomes.
In this dissertation, I draw attention to another relevant yet underemphasized
dimension of the ego-network structure – network stability – in an attempt to build “a
more general network model of social capital” (Burt, 2001:31). The original theorizing
about social capital underscored both the configuration and the stability of the network of
relations to understand performance differentials. As Coleman (1990:320) insightfully
suggests:
A second factor which affects the creation and destruction of social capital is the
stability of social structure. Every form of social capital, with the exception of
that deriving from formal organizations with structures based on positions,
depends on stability.
5
Other scholars (cf. Dhanaraj & Parkhe, 2006) have emphasized stability’s
theoretical import. Insofar as the firms (‘nodes’) in the alliance network are in perpetuity
homogenous in knowledge and in nature, i.e., in their willingness to share knowledge, a
sole focus on the configuration of alliance network ties to evaluate the focal firm’s
innovation performance makes sense. However, the focal firm’s network stability
becomes salient when the nodes in its alliance network are heterogeneous and nodal
identities matter. In this vein, in addition to the configuration, the composition of the
network matters (Phelps, 2010).
Furthermore, focusing on network dynamics, studies have shown that structural
holes are “fragile” (Stovel, Golub, & Milgrom, 2011), and their benefits are short-lived
(Buskens & van de Rijt, 2008). Scholars also suggest that structural holes “decay” (Burt,
2002), and “timing” matters for their performance benefits, implying that stability (or the
lack thereof) and the ensuing change in the composition of the ego-network structure may
be relevant to the network’s value-creating potential (Burt, 1992; Soda, Usai, & Zaheer,
2004; Baum, McEvily, & Rowley, 2012).
Stability is usually seen as being positively related to performance in the alliance
literature (e.g., Luo, 2005) because it reduces the alliance partners’ costs of coordination
and monitoring (Mjoen & Tallman, 1997) and enhances their knowledge transfer
efficiency (Lee & Cavusgil, 2006). Along similar lines, the human capital literature
argues that turnover negatively affects productivity (Osterman, 1987). Dees and Shaw
(2001) show this detrimental effect of turnover due to the social capital losses resulting

6
from changes in social structures. Thus, in certain contexts, including alliances, stability
may increase performance.
However, there are reasons to believe that stability will negatively influence
innovation. The firm’s network stability and the ensuing continual information flows
among the focal firm and its partners over time could make knowledge less valuable
because of increased similarity in their knowledge bases, reducing the knowledge
recombination potential and, thus, innovation. In sum, stability might have a dark side
when it comes to innovation performance.
The first objective of my dissertation is to bring stability back in theories of
(egocentric) network structure-conduct-performance. In light of this emphasis, in Chapter
2, I attempt to explicitly define network stability and articulate its importance as a
theoretical construct. In order to do so I integrate scholarly articles in which stability is
either discussed explicitly or alluded to. Drawing on Burt and Merluzzi’s (2016) measure
of network churn, I propose a fine-grained measure of network stability. To delineate
how stability affects the focal firm’s innovation performance, I investigate the outcomes
of ego-network stability in the alliance context, arguing that the stability reduces the
innovation advantages of the focal firm. I further investigate two contingencies, namely,
the structural holes spanned and the geographic concentration of the inventive activities
of the focal firm, that moderate the detrimental effects of ego-network stability on
innovation. The focal firm may be able to limit the negative effects of stability on
innovation by spanning structural holes in its alliance portfolios whereas the negative
7
effects are worsened when the focal firm’s inventive activities are geographically
concentrated. I empirically test and find support for these hypotheses using 198
biopharmaceutical firms headquartered in the U.S. over a 21-year period from 1985 to
2005.
The second objective of my dissertation is to examine the origins of ego-network
stability. In Chapter 3, I develop propositions about what determines the stability of open
structure configurations or structural holes. My switching from the stability of the overall
ego-network in the prior discussion to the stability of open structural configurations needs
further justification. First, I show in Chapter 2, among other things, that though network
stability reduces innovation, open network configurations or structural holes help
mitigate this negative relationship. As a follow-up study, I believe it makes sense to look
into what makes these performance-enhancing open structure configurations persist.
Second, most research has found a positive relationship between structural holes and
performance both at the individual and at the firm levels of analysis. At the same time,
scholars have suggested that structural holes or brokerage structures are “fragile” (Stovel,
Golub, & Milgrom, 2011) and that structural holes “decay” (Burt, 2002). Searching for
ways to enhance their stability is worthy of attention. Third, inclusion of the overall
network would have necessitated an enormous amount of time and effort to collect
additional fine-grained data such as the exact latitude and longitude of partner firms, with
probably not much theoretical traction beyond the findings from looking at the origins of
structural holes.

8
I consider the effects of the embedding of interfirm alliance brokerage structures
in both geographical space and in network communities to understand their persistence or
decay. I argue that geographic distance between member firms increases the stability of
open network structures or structural holes. Distance reduces information quality and
quantity, making brokerage identification difficult, and imposes additional coordination
and communication costs, affecting alters’ expected value of new relationship formation
and maintenance, hence stabilizing brokerage. In contrast, I suggest that brokerage triad
firms’ membership in different network communities exerts a destabilizing effect on
brokerage because of inter-community competition. I test my hypotheses with 329 broker
and 680 alter firms over 1985-2005, yielding 61,495 triad-year observations in the global
pharmaceutical industry context. I show that both the distance between the two alter firms
and the distance between the broker and the alter firm are salient in reducing the
likelihood of brokerage decay. However, brokerage triad firms’ location in different
network communities increases brokerage decay.
In Chapter 4, I discuss key takeaways from my studies. Here I answer the so-what
question for managers and researchers. I hope the readers find the manuscript an
interesting read. I chose not to create a separate chapter for the empirical analysis and
instead kept them together with my propositions because I believe both theory and
empirics go better together as a unit to tell a richer coherent story. To the extent that my
work is able to draw the reader’s attention to the second important aspect of network
structure, its stability, which has otherwise been relatively less studied with the dominant

9
focus being on the configuration of network structures, I consider this dissertation makes
a contribution to the emerging literature on network dynamics and performance.

10
CHAPTER 2
Ego-Network Stability and Innovation Performance
Five months ago the stream did flow,
The lilies bloomed within the sedge,
And we were lingering to and fro,
Where none will track thee in this snow,
Along the stream, beside the hedge.
Ah, Sweet, be free to love and go!
For if I do not hear thy foot,
The frozen river is as mute,
The flowers have dried down to the root:
And why, since these be changed since May,
Shouldst thou change less than they.
-From Change Upon Change by Elizabeth Barrett Browning
Inter-organizational relationships are considered the prime determinants of firm
innovation because of access to knowledge and R&D capabilities from network partners
(Gulati, Nohria, & Zaheer, 2000). How firms structure their alliance network
relationships is even more important in knowledge-intensive industries because of the
rapid obsolescence of existing knowledge and the inability of firms to keep up with fast-
paced technological changes on their own (Powell, Koput, & Smith-Doerr, 1996). Much
network research has focused on the association between the structure of firm’s
relationships, the ensuing structural social capital (Nahapiet & Ghosal, 1998) and the
focal firm’s performance (Baum, Cowan, & Jonrad, 2014).
More specifically, a large number of studies have examined the configuration of
ego’s network or the structural organization of focal firm’s direct alliance ties and, in
turn, the focal firm’s innovation performance using two ideal types, namely, structural
holes (Burt, 1992) and closure (Coleman, 1990). A structural hole arises when the focal
11
firm has alliances with two other firms (‘alters’) that are not themselves connected,
providing diverse, nonredundant, and timely information to the focal firm and, thus,
improving its innovation performance (e.g. Hansen, 1999). The other ideal type, closure,
represents a structure in which all partner firms are connected to one other through
alliances, enhancing mutual trust and maintaining norms of group conduct (Uzzi, 1997).
The social capital thus generated facilitates the focal firm’s innovation via knowledge
sharing by group members and subsequent integration (e.g., Schilling & Phelps, 2007). In
sum, whatever the type, the main focus of extant work, for the most part, has been on the
configuration of the (egocentric) alliance network structure and the resulting innovation
outcomes for the focal firm.
I supplement this structural (or ‘configurational’) lens by suggesting that prior
research may have underemphasized how the stability of the ego-network structure, a key
ingredient in the original theorizing on social capital, may play the role of an overlooked
factor in explaining the innovation outcomes of firms inhabiting these structures. I define
network stability as the obverse, or complement, of ‘network churn’ (Burt & Merluzzi,
2016; Sasovova, Mehra, Borgatti, & Schippers, 2010). Stability reflects the extent to
which the composition of the focal firm’s ego network remains unchanged from one time
period to the next (see pages 36-37 for a detailed description of my construct definition).
More generally, it is worth recalling that seminal scholarship on the role of social
capital, the operant mechanism in networks, has underscored the importance of stability.
According to Coleman (1990: 320), “a second factor [the first is structure] which affects
the creation and destruction of social capital is the stability of social structure. Every
12
form of social capital…depends on stability.” Burt calls for “a more general network
model of social capital” (Burt, 2001: 31) and inclusion of stability is an important
direction in this regard. More recently, Burt supports the contention noting that, “Stability
cannot be taken for granted...Current answers to this question are typically little more
than assumptions convenient for formal models or speculation from cross-sectional
evidence” (2007: 101, emphasis mine). Dhanaraj and Parkhe (2006) also underscore the
importance of network stability as one of the three network orchestration processes,
besides knowledge movement and appropriability, to which a hub firm must pay attention
in order to reap innovation benefits. However, how ego-network stability affects
innovation outcomes mostly remains an open question.
The little work in which stability is either alluded to or explicitly mentioned, hints
at the construct’s relevance for the focal firm’s performance outcomes in general and
innovation performance in particular. For example, although global network properties
such as the network’s overall clustering coefficient or average network size might seem
stable, research suggests that such apparent stability might disguise the continual churn
occurring at the individual network level (Kossinets & Watts, 2006; Wellman, Renita,
David, & Nancy, 1997), with recurrent changes occurring in an individual focal firm’s
ties (Moody, McFarland, & Bender-deMoll, 2005). Further alluding to these underlying
network dynamics, scholars have suggested that structural holes are “fragile” (Stovel,
Golub, & Milgrom, 2011), and their benefits fleeting (Buskens & van de Rijt, 2008).
Scholars have also posited that structural holes “decay” (Burt, 2002), and that their value
arises from “timing,” implying that stability (or the lack thereof) and the resulting change

13
in the composition of ego’s network structures may be relevant to their value-creating
potential (Burt, 1992; Soda, Usai, & Zaheer, 2004; Baum, McEvily, & Rowley, 2012).
Extant work on stability in the alliance literature usually views stability as a
positive (e.g., Luo, 2005). Stability reduces the coordination and monitoring costs (Mjoen
& Tallman, 1997). It enhances knowledge transfer efficiency, thus facilitating learning
(Lee & Cavusgil, 2006). Similarly, the human capital literature posits that turnover is
negatively associated with productivity (Osterman, 1987). Dees and Shaw (2001)
underscore the negative effect of turnover, and the ensuing change in social structures,
due to social capital losses. Thus, in certain contexts, including alliances, stability may be
an asset for performance.
However, there are reasons to believe that ego-network stability has a dark side
in that the stability may negatively influence innovation at the firm level. The stability of
the firm’s network structure could make knowledge less valuable as continual
information flows across the focal firm and its partners over time create greater
commonality in their knowledge bases. Further, structural persistence promotes a
deepening of inter-firm relationships because of enhanced trust (Gulati, 1995a). The
resulting ease of communication and coordination may make knowledge transfer more
efficient, but also promote similarity of knowledge resources across the partner firms and
the focal firm, further reducing the innovation potential from knowledge recombination.
I also suggest that contingencies may influence the strength of the relationship of
network stability to innovation. A focal firm’s open structure – the structural holes in its
network – allows it to access nonredundant and diverse knowledge. The information

14
benefits thus available might help attenuate the negative innovation effect of network
stability. Conversely, the focal firm’s geographic concentration or the location of its
inventive activities in one country might enhance the negative effects of stability on
innovation due to the lack of knowledge diversity. Compared to high concentration,
geographic dispersion exposes the focal firm to heterogeneous knowledge environments
from multiple countries, increasing the focal firm’s recombination potential (Kogut &
Zander, 1993; Hitt, Hoskisson, & Kim, 1997). In sum, I investigate the following
questions: How does ego-network stability affect a focal firm’s innovation performance?
Further, how does structural hole spanning and geographic concentration mitigate or
aggravate the effects of network stability? I note that most of the limited work on
network stability has theorized about its antecedents (e.g., Stovel et al., 2011) and tested
it with mathematical models or individual level empirical data (Burt, 2002). I theorize
about and test the consequences of stability on innovation at the interfirm level.
Notable exceptions to the paucity of work on the structure-stability-performance
link are Soda et al.’s (2004) work on the declining performance effect of structural holes
bridged in the past, and Baum et al.’s (2012) research on the decreasing market share
benefits of bridging ties with age. However, unlike my work, Soda et al. (2004) focus on
holes spanned in the past relative to more current holes whereas Baum et al. (2012)
emphasize the fragility of older bridging ties. My study differs from this prior research in
two key ways. First, I construct a theoretical framework to explain the direct and
contingent outcomes of the stability of the ego-network structure rather than compare the
outcomes of past and current structural holes. Put another way, Soda et al. examine the
15
persistence of outcomes from the “memory” of a historically prior structural hole; I
examine the outcomes of the persistence of current structures. Second, in contrast to
Soda et al., or Baum et al., I evaluate the outcomes of the stability of the overall ego
network, rather than its configuration as structural holes (Soda et al.) or as ties (Baum et
al.). Specifically, I differ from Baum et al. (2012) by moving from the age of the tie to the
stability of the network structure. Placing dyadic relationships in an ego network context
allows me to “identify quite dramatic changes in seemingly stable relations” (Gadde &
Mattsson, 1987: 29).
My paper also differs from Aral and Van Alstyne’s (2011) diversity-bandwidth
trade-off paper in at least three ways. Specifically, Aral and van Alstyne (2011) examine
the success rate of job openings filled in the context of email exchanges among
employees within a single firm. First, a critical assumption in their paper is that, “Given
evidence suggesting the prevalence of weak ties in structurally diverse networks and the
likelihood of increased information flow in cohesive networks due to motivation and
exposure, the bandwidth of communication channels should be lower in diverse
networks. Thus, network diversity and channel bandwidth should trade off such that
greater network diversity is associated with lower channel bandwidth” (2011: 94). By
their logic, the variation in channel bandwidth or volume of communication derives from
the assumption that structural holes are comprised of weak ties. (Note that, according to
Burt (1990), weak ties are not a necessary condition for structural holes to exist). I do not
foresee this variation in my case because of the formal contractual nature of interfirm
alliance ties. These formalized relationships are strong, by definition, from the very

16
beginning.
Thus, I do not focus on any specific configuration of the network structure, such
as structural holes, nor on the strength of the ties, but focus instead on the stability of the
ego-network structure in general in my theorizing and empirics. Relatedly, there is no
trade-off between diversity and bandwidth in my setting not only because formal alliance
ties are strong but more importantly, the diversity arises from the differences in
composition of the alters over time, rather than from structural holes. For instance, I
provide the example of ImmuCell in my discussion of the first hypothesis, whose two
alters changed over time, suggesting greater diversity (and lower stability), even though
the configuration of the structure stayed constant.
Second, Aral and Van Alstyne (2011: 103, 119) assume that each employee
within the firm keeps providing diverse and novel information in perpetuity because as
the authors posit, “…each bit of novel information represents a job opening…” (2011:
104). The novel information required to fill a job vacancy relying only on emails from
employees within a firm in their case is qualitatively different and possibly less complex
than the novel information required to innovate in a knowledge-intensive context relying
on interaction between two or more profit-maximizing firms. Further, I argue that
knowledge novelty from alter firms within alliance networks in knowledge-intensive
industries diminishes over time due to rapid obsolescence. Thus, the nature of “novelty”
or “diversity” and, more to the point, their dynamics, are so fundamentally different in
my setting as to make comparisons theoretically moot.
Third, unlike job search, where a client provides quite specific job requirements,

17
the focal firm in my case initially has only a vague idea of the research problem in hand,
with the steps needed to find an optimal solution even more ambiguous. Thus, the nature
of the task (dependent variable) differs so completely (job vacancy fulfillment vs patents)
that their theoretical framework, again, may not apply to my setting. Also, it is difficult to
attribute the focal firm’s innovation to any specific alliance because firms recombine
ideas from multiple sources and have less incentive to acknowledge whatever they
learned over and beyond that in the stipulated contract (because of IP concerns). In this
regard, knowledge flow from the ego network that is relevant to the focal firm remains a
much more complex phenomenon than that studied in the Aral and Van Alstyne paper,
one that fundamentally modifies the theoretical underpinnings of the argumentation.
I empirically test my hypotheses using a panel of 198 U.S. firms in the
biopharmaceutical industry over a 21-year period from 1985 to 2005. To control for the
unobserved time invariant heterogeneity, and the fact that my dependent variable is a
citation-weighted patent count sans self-citations, I use a Poisson fixed effects quasi-
maximum likelihood estimator. Several tests support the robustness of my results.
In the following sections, I first theorize about the stability of the network
structure and its negative effect on the focal firm’s innovation performance. Next, I
examine how the focal firm’s structural holes ameliorate the negative effect of the
relationship between stability and innovation. Thereafter, I investigate the role of the
geographic concentration of the focal firm’s inventive activity in enhancing (i.e.
worsening) the negative effect of stability on innovation. Following this, I introduce my
empirical context, the biopharmaceutical industry, and detail the methods I employ to test

18
my hypotheses. I conclude with a discussion of my results and implications for future
research.
THEORY AND HYPOTHESES
Ego-Network Stability and Focal Firm Innovation
I begin my theoretical exposition with an illustration of how ego-network
stability, and its obverse, network churn, differ from a more conventional assessment of
structure that does not take into account the composition of the network nodes. Consider
the illustrative example of ImmuCell Corp’s ego network. In 1995, ImmuCell had
alliance relationships with Univax Biologics and Carrington Laboratories, and with
Center for Special Immunology and Carrington Laboratories in 1996. The two alter firms
(Univax and Carrington; and Center for Special Immunology and Carrington) were
unconnected with each other in both periods. A mere focus on structural configuration in
this scenario risks painting an incomplete picture because of the change in the
composition of the network partners over time (Halgin & Borgatti, 2012; Sasovova et al.,
2010; Feld, Suitor, & Hoegh, 2007). Conventional wisdom might argue that Immucell’s
network structure does not vary in that structural holes spanned and degree centrality
remain the same (Burt’s constraint = 0.5; direct ties = 2) for both time periods. However,
as is evident from the case, the composition of the ego network changed with Special
Immunology replacing Univax over the two periods. At the same time, it is possible that
the innovation outcomes of the structural stability measured in this way will also differ
because even though the network structure is the same across the two time periods, the
fact that one of the partners changes may further increase knowledge diversity for the ego

19
firm. The example underscores how stability, or its complement, network churn, is
necessary to more fully understand the effects of network change.
As mentioned earlier, I argue that ego-network stability is likely a negative when
it comes to the innovation-creation potential of the network. In the build up to this, my
central hypothesis, I first present a set of arguments that spell out the efficiency-
enhancing dimensions of network stability, before arguing the opposite for a net effect
that is negative. Ego-network stability, by which I mean a network with all repeated
partners, is likely to enhance the efficiency of interorganizational knowledge transfer
through four mechanisms: routines, shared beliefs, strength of ties, and trust (Dyer &
Singh, 1998). First, repeated interactions as a result of relational stability among the focal
firm and partner firms lead to the development of interorganizational routines (Zollo,
Reuer, & Singh, 2002), facilitating smooth coordination and cooperation. Second, with
the passage of time, common language and shared beliefs and meanings, as well as
standardized templates for knowledge transfer, develop as managers start to better
understand the other party’s behavior, language and beliefs, facilitating communication
and mitigating conflict (Tortoriello & Krackhardt, 2010; Doz, 1996; Uzzi, 1997).
Third, stability imparts strength to the alliance relationships underlying the ego
network via multiple interactions (Granovetter, 1973). Strong ties in the network
structure in turn smooth the transfer of not only codified knowledge but also complex and
tacit knowledge, permitting richer, and finer-grained, information exchange (Kotabe,
Martin, & Domoto, 2003; Hansen, 1999; Reagans & McEvily, 2003). Fourth, frequent
interactions over time inculcate trust (Gulati, 1995a; Gulati & Sytch, 2008; Zaheer,

20
McEvily, & Perrone, 1998; Hoetker, 2005). Trust, thus generated, facilitates coordination
between the focal firm and its alter firms (Obstfeld, 2005) and reduces monitoring costs
by inhibiting opportunism and mitigating conflict (Inkpen & Currall, 2004). Overall,
stability enhances knowledge transfer efficiency (Dhanaraj, Lyles, Steensma, & Tihanyi,
2004), thereby possibly increasing innovation.
A contrasting view of the relationship between stability and the focal firm’s
innovation performance emerges when we consider how stability affects the knowledge
diversity available to the focal firm through its network. Diversity, in general, in its
various forms such as geographic diversity (Zhang, Li, Li, & Zhou, 2010), ethnic
diversity (Nathan, 2015), science-based diversity (Feldman & Audretsch, 1999),
employee diversity (Østergaard, Timmermans, & Kristinsson, 2011), top management
team diversity (Wiersema & Bantel, 1992), R&D team diversity (Reagans, Zuckerman, &
McEvily, 2004), and technological diversity (Suzuki & Kodama, 2004), has been shown
to be a key ingredient in studies of creativity and innovation. Such diversity allows for
knowledge recombination, a critical condition for focal firm innovation (Hargadon, 2002;
Fleming, 2001; Henderson & Clark, 1990). Dissimilar knowledge available to the focal
firm increases both the quantity and variety of potential combinations of ideas, enhancing
the likelihood of finding innovative solutions (Utterback, 1971; Fleming, 2001). Van
Wijk, Van den Bosch, and Volberda (2001) show that the breadth of the knowledge to
which the focal firm is exposed makes the firm more likely to search for novel and
related knowledge. In the network context in particular, emphasizing information
diversity, Burt (1992: 48) in his exposition of structural hole theory states that
21
“information is the substance” in order to reap the performance benefits from the network
structure. Similarly, Phelps (2010) finds that technological diversity, coupled with
network closure, enhances innovation. In sum, “… while network structure matters,
access to heterogeneous knowledge is…of greater importance for innovation
performance” (Rodan & Galunic, 2004: 541, emphasis mine).
My conceptualization of the performance implications of network stability is
consistent with social resource theory (Lin, 1982; 1990) or Gulati’s (2007) network
resource theory. Theories that focus on the configuration of network structure (e.g., Burt,
1992; Coleman, 1990) treat resource access as given in that alliance partners are assumed
to be homogeneous and to contribute equally to the focal firm’s innovation (Tortoriello,
McEvily, & Krackhardt, 2014). In contrast, social resource theory emphasizes the role of
resources that the focal firm can access from its network (Lin, Ensel, &Vaughn, 1981).
Seen through a social resource lens, neither weak ties nor bridging ties per se impart
network advantages, but whether the focal firm’s partners have the resources the focal
firm needs to fulfill its research needs and whether the focal firm can access such
resources matters for deriving network benefits. In this regard, the nature of resources
that the focal firm’s social network makes available takes center stage. Social resource
theory is a natural extension of Penrose’s (1959: 75) analysis of the resource-based view
of the firm in which “heterogeneity of the productive services available or potentially
available from its resources…gives each firm its unique character.”
However, network stability reduces the knowledge diversity that is available to
the focal firm for generating innovation, even more so in the context of interfirm alliance

22
network, for three reasons. First, the “tapping points” of these interfirm relationships
through which the focal firm, inhabiting the ego network, accesses partner knowledge
over time are relatively restricted because alliance agreements typically cover only a part
of the partner firm’s knowledge base. Even this limited knowledge access is conditional
on the motivation and ability of the partner firms’ research professionals (Reinholt,
Pedersen, & Foss, 2011), who are both rationally- and contractually-bound to not share
any additional information over and beyond the stipulated agreement between the two
firms. Thus, the focal firm has a small window of opportunity for accessing the social
resource in that “initially” it is easier for the focal firm to absorb “relevant and easy-to-
transfer knowledge” from partner firms (Schildt, Keil, & Maula, 2012: 1155). Further
attempts to acquire knowledge from partners might entail further investments in the focal
firm’s time and effort, especially in R&D (Harrison, Hitt, Hoskisson, & Ireland, 2001).
Therefore, the likelihood of innovation reduces over time compared to the period early in
the life of the alliance when the focal firm can easily assimilate network resources based
on its preexisting knowledge (Mowery, Oxley, & Silverman, 1996).
Second, in knowledge-intensive industries, uncertainty, knowledge complexity,
and rapid obsolescence of technological knowledge make it almost impossible for the
focal firm to innovate by relying on social resources from the same set of alliance
partners. The reason is that partner inertia and idiosyncratic technological trajectories
ensure that partners keep innovating in the same direction as they did in the past, thus
making it detrimental for the focal firm to depend on the same partners for continued
innovation (Schweizer, 2005; Eisenhardt, 1989).

23
For example, in the biopharmaceutical industry drug development is a complex
process that requires amalgamating and updating knowledge from such multidisciplinary
fields as “molecular biology, physiology, biochemistry, analytic and medicinal chemistry,
crystallography and pharmacology” (Henderson, & Cockburn, 1994: 65). In this regard,
alliances and, by extension, networks created at a particular point in time might lose
relevance because the focal firm might face different knowledge requirements at different
points in time. But network stability might create network “lock-in” (Gulati & Westphal,
1999). In this regard, network stability represents the “dark side” of social capital which
puts the focal firm’s adaptability to changing research needs at peril, thus negatively
affecting innovation (Portes & Landolt, 1996; Gargiulo & Benassi, 1999; Gargiulo &
Ertug, 2006). In contrast, network churn, by removing inefficient partners, frees up the
focal firm’s resources to be used for other innovation projects (Vissa & Bhagavatula,
2012).
Third, network stability might make any specific configuration of network
structure sub-optimal. As relationships get stronger the focal firm and its partners are
more likely to have similar redundant ideas (Granovetter, 1973). The development of
partner-specific absorptive capacity (Dyer & Singh, 1998) makes the focal firm’s and its
partners’ knowledge bases similar, reducing the combinatorial opportunities. Stability
breeds familiarity among the focal firm and its alters, making the knowledge embedded
in the network structure more redundant by promoting the smooth flow, and the repeated
use, of ideas among member firms. Of course, these ex post knowledge homophily effects

24
might be slowed or limited by knowledge stock that is long lived, harder to learn, and by
lower absorptive capacity (see e.g. Hall, Jaffe, & Trajtenberg, 2005).
One way to resolve the tension between the positive effects of stability on
knowledge transfer efficiency and stability’s eventual negative effects on information
diversity benefits is to bear in mind that the underlying alliance relations that constitute
the focal firm’s ego network are formal in nature. The formalized nature of inter-firm
alliance relations ensures that the ties are relatively strong from the very start. High-
powered incentives (Williamson, 1985) make it likely that partner firms are induced to
cooperate with the focal firm to fulfill the knowledge-sharing goals of the alliance
(Locke, 1999). Given strong ties, network stability and the routines thus formed might
not further enhance knowledge transfer efficiency beyond a point. Further, because
knowledge rapidly becomes obsolete in fast-paced knowledge-intensive industries and
because partner firms, like all firms, suffer from inertia (as mentioned earlier), it reduces
the likelihood that partner firms continue to provide diverse knowledge elements over
time. Supporting this argument, Hoang & Rothaermel (2005), contrary to their
expectations, find that partner-specific experience negatively affects joint project
performance in the biopharmaceutical industry.
In addition, partners in interfirm networks are often more calculative and more
likely to exercise their bargaining power over the focal firm (Gargiulo & Ertug, 2014),
reducing the focal firm’s chances of gaining knowledge elements (Lavie, 2007). Thus,
increased knowledge transfer efficiency at the alliance level might be a processual
advance that does not necessarily translate into innovation derived from the ego network.

25
Other prior research also hints at these downsides. Moorman, Zaltman and Deshpande
(1992) find that over time, focal firms’ relationships are less valuable because they
become “stale or too similar.” In contrast, Baum, Calabrese, and Silverman (2000) find
that network churn, characterized by additions of new partners, increases innovation
performance in the Canadian biotechnology context. Holloway and Parmigiani (2016) in
their study of construction projects show that repeated partnerships reduce profitability.
Goerzen (2007) shows that firms quite often engage in repeated equity-based alliances,
with lower economic performance for those who have more repeated partnerships.
Overall, the suggestion is that stability reduces knowledge diversity.
In sum, I argue that, with network stability, the beneficial effects of
communication and trust and the subsequent efficiency gains in knowledge transfer
among the firms in the ego network might not provide enough novel knowledge elements
for innovation. In addition, these effects are further weakened by the lowered innovation-
directed knowledge diversity benefits of stable networks. Thus, I posit that:
Hypothesis 1. Ceteris paribus, greater ego-network stability of a focal firm is
associated with reduced innovation performance for the focal firm.
Contingent Effects of Structural Holes Spanning
In the previous hypothesis, I posited that ego-network stability has a negative
effect on the focal firm’s innovation performance. However, if the focal firm spans
structural holes in its network, prior theory and research contends that it gains access to
both more information sources (i.e., alters or partner firms), as well as much diverse
information, compared to firms that span fewer structural holes (Burt, 1992). The

26
arguments for why and how firms that span structural holes tend to generate superior
innovation outcomes are well established, so I only briefly reprise them here. Structural
hole theory posits that accessing disconnected alter firms (partner firms that are not
themselves connected) enables the focal firm to tap into nonredundant knowledge and
information diversity, which it can recombine to create innovation (e.g. Hargadon &
Sutton, 1997). Also, firms spanning structural holes are able to receive information in a
timely manner, view the world more holistically, and filter good ideas using the network
as a prism (Burt, 2004; Podolny, 2001). Such benefits apply even more strongly in
knowledge-intensive contexts in which technology keeps evolving.
Furthermore, for innovation, knowledge flows must occur among the focal firm’s
partners. One alter firm’s bid to outdo the other may allow the focal firm to extract better
terms for knowledge exchange from each of the alters. Thus, the power inherent in this
network configuration facilitates beneficial knowledge exchange for the focal firm, and a
nonredundant network structure allows the focal firm to quickly locate and retrieve the
knowledge needed for recombination and innovation (Schildt et al., 2012).
Moreover, a network structure full of structural holes enhances the quality of
information available to the focal firm because it is able to compare and contrast the
veracity of information provided by the different alter firms. Also, alter firms vying for
the focal firm’s attention allow the focal firm to have more control over its alters,
conceding the focal firm more favorable terms for knowledge generation and transfer. In
sum, the focal firm that spans structural holes is able to harness a greater ability to
arbitrage. The enhanced ability to arbitrage, to access diversity and nonredundant

27
knowledge allows the focal firm to mitigate the negative effects of stability described in
the previous section because of the greater novelty, vision advantage and arbitrage
possible via the structural holes that it spans (Rodan, 2010).
In contrast, access to fewer structural holes or structural closure in the network is
likely to worsen the negative relationship between ego-network stability and innovation
performance. In this case, lack of enough options to choose among different alters might
constrain the focal firm’s ability to arbitrage (Burt, 2004), further enhancing the negative
effects of lock-in created by network stability. The focal firm might have to adopt a more
conciliatory stance while negotiating terms of knowledge generation and transfer with
alter firms. Stability and the ensuing repeat interactions limit the leeway of the focal firm
because the alter firms might become aware of the focal firm’s rent extraction techniques,
unlike the case of focal firms spanning more structural holes, where increased
competition among alters keeps their power at bay. Also, spanning fewer structural holes
impairs the vision advantage of the focal firm as it may not be able to validate the
accuracy of the information and not exercise the threat option as effectively in the case of
deviant alter firms.
Taken together, I argue that when the focal firm spans more structural holes, the
negative effects of ego-network stability on innovative performance are mitigated. Thus,
Hypothesis 2. Ceteris paribus, the greater the spanning of structural holes by a
focal firm, the less negative the relationship between stability and the focal firm’s
innovation performance.

28
Contingent Effects of Geographic Concentration
I further posit that the degree to which the focal firm is geographically
concentrated in its inventive activities increases the negative effect of ego-network
stability on the focal firm’s innovation performance. Conversely, a focal firm with
operations in different countries (low geographic concentration) benefits from four key
knowledge advantages. First, multicountry presence offers it a more benevolent
environment for innovation. Differences in culture, markets, and institutions translate into
heterogeneity in knowledge elements across countries (Ghemawat, 2003). The reason is
that within each country, innovation systems in general, and firms in particular, face
different, idiosyncratic environments, thus leading to the development of unique
technological trajectories (Ahuja & Katila, 2004). The diversity made available by
multicountry knowledge environments is crucial in the innovation context because “a
diverse background provides a more robust basis for learning because it increases the
prospect that incoming information will relate to what is already known” (Cohen &
Levinthal, 1990: 131). In contrast, the lack of a multicountry presence (high geographic
concentration) prevents the firm from tapping into greater knowledge variety for
innovation. The reason is that knowledge is well known to be sticky, geographically
bounded and does travel easily across geographic boundaries (Jaffe, Trajtenberg, &
Henderson, 1993).
Second, having operations in different countries allows the focal firm to learn
from the best operating practices in different countries and handle complex transnational
knowledge environments to search for market opportunities (Ghoshal & Bartlett, 1988;

29
Westney & Zaheer, 2008; Hitt et al., 1997). Unlike the focal firm with multicountry
presence, the geographically-concentrated firm might lag behind in adopting the cutting-
edge practices from multiple countries. Third, multicountry presence allows the focal
firm to take advantage of employee diversity for innovation wherein employees educated
at diverse technical institutions are more likely to enhance innovation performance
(Østergaard et al., 2011). In this case also, the firm lacking in multicountry presence
might have a lower recombination potential because of technological know-how
similarity among its employees. Fourth, a presence in multiple countries allows the focal
firm to engage in arbitrage in knowledge-related factor markets, such as by performing
R&D in offshore locations, increasing the efficiency and effectiveness of its innovation-
related activities (Zhao, 2006; Nandkumar & Srikanth, 2016). In contrast, the
geographically-concentrated firm is less likely to engage in arbitrage because of the
relative efficiency of factor markets within one location.
In sum, high levels of geographic concentration (low internationalization) make it
less likely that the focal firm can take advantage of knowledge diversity. This lack of
diversity is likely to aggravate the negative effects of network stability. Thus,
Hypothesis 3. Ceteris paribus, the greater the geographic concentration of a focal
firm’s inventive activities, the more negative the relationship between stability
and the focal firm’s innovation performance.
30
METHODS
Data and Sample
I test my hypotheses with biopharmaceutical industry data. For the purposes of
this paper, the biopharmaceutical industry consists of medicinal chemicals (SIC 2833),
pharmaceutical preparations (SIC 2834), human diagnostics-- in vitro and in vivo (SIC
2835), and biological products, other than diagnostic substances (SIC 2836). This
empirical context is apt for various reasons: The industry is knowledge-intensive and
firms invest heavily in R&D (Henderson, 1994; Boland Jr & Tenkasi, 1995). Also,
innovation and new product introductions are crucial to survive in this industry (Nerkar
& Roberts, 2004). However, drug development is an uncertain process. Firms take, on an
average, 12.5 years to develop a new drug (PhRMA, 2013). Only 0.02% of the total
compounds from the discovery or pre-clinical testing stage get final approval as a drug
(PhRMA, 2013). In addition, the total cost to develop one drug varies from $1.5 billion to
$1.8 billion (DiMasi, Hansen, & Grabowski, 2003, 2008). Furthermore, as discussed
before, drug development is a complex process that requires amalgamating and updating
knowledge from such multidisciplinary fields as “molecular biology, physiology,
biochemistry, analytic and medicinal chemistry, crystallography and pharmacology”
(Henderson & Cockburn, 1994: 65).Uncertainty, high costs, knowledge complexity, and
rapid knowledge obsolescence make the network a commonplace “locus of innovation”
in this industry (Powell et al., 1996) because it almost impossible for firms to innovate
only in-house (Schweizer, 2005).
31
Furthermore, pharmaceutical firms tend to patent the bulk of their innovations
(Paruchuri, 2009; Levin, 1986), which is my dependent variable of interest. In fact, the
biopharma industry is more prone to ‘patent cliffs’ –a phenomena in which a firm’s
revenue fall sharply (fall off a cliff) when one of its leading drug approaches its patent
expiration date. For example, as soon as the patent protection for Pfizer’s Lipitor expired
on November 30, 2011, Watson Pharmaceuticals’ and Ranbaxy Laboratories’ generic
substitutes became available in the market (Time, 2011). As a result, Pfizer’s profit
reduced by 19% in the first quarter of 2012. Similarly, Eli Lilly saw a decline of 15% in
its sales volume on the patent expiration of Cymbalta and Evista. In contrast, Otsuka
Pharmaceutical was able to avoid the competition from generic manufacturers by
reinventing its blockbuster Abilify as a pediatric treatment drug besides its original use to
treat bipolar disorder. Thus, patents play an important role in the pharmaceutical industry.
Using the SDC Platinum database as a baseline, I selected all firms in the global
pharmaceutical industry, both public and private, which participated in alliances
announced from 1980 through 2005. I further augmented this information with
information from archival search using multiple sources such as SEC-EDGAR,
LexisNexis, Factiva, and Bloomberg (Phelps, 2010). Few alliances exist before 1980,
reducing the possibility of left censoring in the data. I used all alliance types because the
alliance’s scope is often understated, and innovative knowledge can come from any
alliance (Schilling & Phelps, 2007). Next, I define the network boundary as follows:
First, each pharmaceutical firm must have an alliance with another pharmaceutical firm
(Rowley, Behrens, & Krackhardt, 2000). In case the alliance has multiple partners, extant

32
work constructs dyads based on all possible dyadic combinations of alliance partners
(Lavie & Miller, 2008). In my case I determine how to deal with multiple partners on a
case-by-case basis after carefully analyzing the alliance text. As an example, I reproduce
below the alliance description from the SDC for Cambridge Biotech Corp, BioNebraska,
and R&C Enterprises:
Cambridge Biotech Corp., BioNebraska Inc., and R&C Enterprises have entered
into an agreement to create a joint venture specializing in osteoporosis
therapies…Under the joint venture agreement, Cambridge Biotech provided
funding and drug delivery technology and BioNebraska and R&C provided the
GHRF technology.
For this case, I created three alliances, namely one between Cambridge and
BioNebraska, one between Cambridge and R&C Enterprises, and one between
BioNebraska and R&C Enterprises. However, I take a different approach in the case of
the multi-party alliance between Igen, Inc., Eisai Co., Ltd., and Boehringer Mannheim,
GmbH whose alliance text I reproduce below from the SDC:
Igen granted Eisai and Boehringer Mannheim GmbH a license to develop a
clinical diagnostic system using its Origen technology. Eisai was granted the
exclusive right to work with Igen to develop a system and market the products in
Japan for the clinical diagnostic market. Mannheim was granted the license to
develop instruments and assays for the centralized diagnostic market.
For this case, I created only two alliances, namely ones between Igen and Eisai
and between Igen and Boehringer. From this specific alliance, I do not find any evidence
of relationship between Eisai and Boehringer.
Second, each alliance itself must be in the pharmaceutical domain (Schilling &
Phelps, 2007). Then, I aggregated all subsidiaries, joint ventures, spin-offs (50% or more
33
of the ownership), and business units at the ultimate parent level. In case a joint venture
was a 50-50 venture, I assigned all alliances formed by the joint venture to both the
parent firms. For example, TAP Pharmaceutical Products’ alliances were assigned to
Abbott and Takeda.
I further accounted for future name changes, reorganizations, and mergers and
acquisitions (M&As) using multiple sources such as the SDC Alliance Database,
Directory of Corporate Affiliations, Who Owns Whom and Bloomberg. Pharmaceutical
firms change names to, among other reasons, reflect changes in their drug profiles and to
deflect negative attention due to failed drugs or due to some external conditions beyond
their control. For example, Isis Pharmaceuticals changed its name after Paris attacks in
2015 to Ionis to avoid any negative connotation of being a terrorist organization. A
failure to consider such changes might inflate the number of firms in my sample, and,
also, make my network structures ‘artificial’ in that two alter firms might be one and the
same.
Some firms in my sample underwent multiple acquisitions. For example, Pacific
Biotech was acquired by Eli Lilly in 1990 and, later, acquired by Quidel in 1995. I
assigned alliances between Pacific Biotech and any other pharmaceutical firm before
1990 to Pacific Biotech, between 1990 and 1995 to Eli Lilly, and from 1995 onward to
Quidel.
I was especially cautious about reverse acquisitions in which (mostly) a private
firm in order to avoid the time and costs of the initial public offering (IPO) acquires a
public company. In such cases the acquired public company is the surviving entity but in

34
reality the private firm has the controlling interest and manages the operations. For
example, in the case of Access Pharmaceuticals and Chemex Pharmaceuticals merger in
1996, even though Chemex was the surviving entity, I treat it as the acquisition of
Chemex by Access. The reason is that Access had 60% interest in the company and not
otherwise. It is also consistent with the generally accepted accounting principles (GAAP)
requirements.
In addition, I tracked each merger announcement through completion to ensure
that the merger did not fell through post its announcement. In the case of ‘merger of
equals’ in which two firms of roughly equal size merge to form a new entity, I assigned
the combined alliance data to the new entity and updated further (post-merger) alliance
information using the new entity. For example, in 1995 Pharmacia of Sweden and
Upjohn of the US merged on a 50-50 basis to form Pharmacia and Upjohn. I assigned the
combined alliances of these two firms from 1995 onwards to Pharmacia and Upjohn.
For arriving at an accurate empirical estimate of each alliance’s duration, which
most prior literature assumes away by adopting a five-year rolling window approach, I
painstakingly created a hand-collected database with complete deal information using
multiple archival databases including SEC-EDGAR, LexisNexis, Factiva, Bloomberg
Professional Terminal, and Mergent Online, news sources such as PR Newswire,
Business Wire, PharmaTimes, Strategic Transactions :: Pharma & Medtech Business
Intelligence, BioCentury, and Pharmaceutical Online, trade journals such as Japan
Chemical Week, and company websites, especially their timelines and news sections for
major events such as NASDAQ listings. I removed alliances that did not actually get
35
created, and used a multi-pronged five-stage process to search for termination dates.
First, for alliances that specified termination dates in my deal text database, I further
accounted for alliance extensions or new alliances. Second, for open-ended alliances (the
majority of my data), I used a keyword-based search using partners’ names in
combination with multiple variations of the word “termination,” “end,” “complete,”
“dissolve,” “break” “withdraw,” “leave,” with or without drug or disease names and
further checked for any alliance extensions or new alliances. Joint venture terminations
were relatively easy to find using the names of joint ventures from deal texts.
Third, I used pharmaceutical compounds, disease areas or drug names from deal
texts to search such databases as Adis Insight to help me identify possible reasons for the
termination of alliances. If the trial or the drug was discontinued by the firm and no new
alliances were formed between alliance partners, I treated the discontinuation date as the
alliance termination date. Fourth, for every year since alliance formation I tracked its
mention in SEC filings and annual reports’ exhibit or agreement sections or followed the
deal’s progress using Factiva, until these reports did not discuss the deal anymore, which
I then used as the termination date. I did not use this method when the deal was
mentioned in only one year. Fifth, I checked for bankruptcies and mergers and
acquisitions and verified if the deal still continued between the new partners to
incorporate this new information. Taken together, these new data were used to calculate
alliance duration. The sequence of actions that I spell out here are the progressive,
cascading steps that I took if data on termination dates were unavailable in previous steps
– i.e. I went to the next step only if I could not find data in the prior step.
36
In Appendix 1 at the end of this dissertation, I present a detailed step-by-step
flowchart of how I determined termination dates, including the percentage of
observations for which I could identify the termination date in each step. In addition, in
Appendix 2 (also at the end of this dissertation), I provide further fine-grained detail
about this process using real-world examples (cases) from my dataset for each of the
steps mentioned in the flowchart. The cases selected for the detailed discussion are
broadly reflective of the different ways in which I arrived at the termination dates.
Together, the flowchart and the case examples provide fine-grained detail on the
exhaustive and systematic process that I utilized to determine alliance termination dates.
Given the exhaustiveness of my process, I am confident that these new data are well-
reflective of actual alliance termination dates and form a sound foundation of my
measure of ego-network stability.
I used this alliance duration information to construct undirected adjacency
matrices consisting of dyadic alliance ties between firms for each year and further to
create my network and alliance-based measures. This criterion resulted in 208 U.S. firms
each with at least two direct ties and 1,379 firm-year observations. The reason for
including firms with at least two direct ties is that I consider, in line with classic theory
(Simmel, 1950), the triad rather than the dyad is the smallest social unit that still retains
the distinctive properties of the network (Wasserman & Faust, 1994; Choi & Wu, 2009).
Furthermore, I collected U.S. patent data using multiple sources such as the
United States Patent and Trademarks Office (USPTO) (bulk downloads using Google’s
data mirror), NBER U.S. Patent Citations Data File (Hall, Jaffe, & Trajtenberg, 2001),

37
Harvard U.S. Patent Inventor Database (Lai, D’Amour, Yu, Sun, & Fleming, 2011), and
the Kogan, Papanikolaou, Seru and Stoffman’s (2011) dataset from its inception through
November, 2014. I further supplemented this data using the hand-collected data from the
USPTO website. Consistent with prior work, I used the application year in which firms
applied for the patent rather than year in which the patent was granted (Ahuja, 2000). My
last year of observation for the dependent variable is 2010. Since the patent grant lag is
approximately 3-4 years, tracking the patents through 2014 reduces the right censoring
bias for patents applied in 2010.
Next, I used the Office of Technology Assessment and Forecast concordance as
of 2008, otaf 283, to convert my 4-digit SIC code to relevant pharmaceutical technology
classes to identify pharmaceutical patents. Then, adjusting for name changes and M&As,
I aggregated these patents at the parent firm level. Using the application year of patents
entailed additional data collection effort when the original assignee firm merged or was
acquired by another firm. A case in point is the US patent number 7,189,412. The patent
was granted in 2007 to Aska Pharmaceutical but was applied for even before Aska
existed. Aska was formed by the merger of Grelan Pharmaceutical and Teikoku Hormone
in 2005 but the last application for this patent was filed in 2004. In this case, I tracked
other prior patents (patent number JPH09227364A) of Masaru Okamoto, the inventor of
the US patent number 7,189,412, and identified the original assignee to be Grelan
Pharmaceutical for the year 2004. Thus, in these cases, I tracked the prior patent
applications of the inventors of the granted patents to find their original employers
(assignees) in the patent application year and, thus, assigned the granted patent to the firm
38
which actually applied for that patent.
I matched this patent dataset with the data on 208 focal firms with 1,379 firm-year
observations. First, I matched the two datasets using firms’ CUSIP (Committee on
Uniform Securities Identification Procedures) numbers. I was careful not to ‘blindly’
match the CUSIP numbers. The reason is that CUSIP number changes even when firms
change their names. For example, Liposome Technology (CUSIP number 536311)
changed its name to Sequus Pharmaceuticals (CUSIP number 817471) in 1995. As a
result, a single firm might appear as two separate firms in the datasets if I ignore the
name changes, thus both overstating the number of firms in my sample and making the
match less likely if one of the firms were missing in one of the databases. In addition,
alliance datasets such as the SDC use historical CUSIP, i.e., the CUSIP assigned to firms
on the date the alliance was reported whereas patent datasets such as NBER use the
updated GVKEY or CUSIP at the time when the dataset was merged with the
COMPUSTAT database. To alleviate these issues, I created my own database of all the
name changes that the firms in my sample underwent. Then, I used the CUSIP history
(historical CUSIP and updated CUSIP) from the WRDS CRSP database to assign the
appropriate CUSIP to firms before matching.
Second, I used the exact name matching to identify the patents of the remaining
firms in the alliance-network dataset. Third, I used Hall’s (2008) name-matching
algorithm, with some modifications to enhance its workability, to match the firms left
after the previous step. Fourth, I manually matched the remaining unmatched firms in the
alliance-network dataset. I standardized and sorted all the firms in the patent dataset in

39
alphabetical order to make the matching from visual inspection feasible. Finally, I
manually searched for the remaining unmatched firms in the alliance-network dataset
using the google patent search engine (https://patents.google.com/) to confirm that the
unmatched firms did not patent at all.
I further triangulated the matched data by comparing the adjustments for M&As
and reorganizations in the patent and network databases. My final usable sample consists
of an unbalanced panel of 198 U.S. pharmaceutical firms with 1,236 firm-year
observations. An unbalanced panel is close to empirical reality and “is preferable”
because it avoids survivorship bias (Baum, 2006).
Dependent Variable
Citation-weighted patent count sans self-citations. I measure the focal firm i’s
innovation output for year t, as the citation-weighted patent count of granted patents p
applied for in a five-year window (t + 1 to t + 5) as: ∑ (1 + Citationnp
n=1 ), where
Citationn is the total number of citations, net of self-citations, for the nth
patent
(Trajtenberg, 1990). Most firms apply for patents within five years of conducting R&D
(Jaffe et al., 1993). Citation-weighted patents have been used extensively in innovation
studies, with time frames ranging from one to five years (cf. Sampson, 2007; Vasudeva,
Zaheer, & Hernandez, 2012; Kotha, Zheng, & George, 2011; Funk, 2014). Citation-
weighted patent counts are more informative than simple patent counts in capturing the
value of underlying innovations, or the value of R&D outputs (Trajtenberg, 1990).
Though patent-based measures correlate highly with other measures of innovation
performance such as new products (Comanor & Scherer, 1969) and market value (Hall et
40
al., 2005), they are not without limitations. Specifically, they do not represent innovations
without paper trails such as those based on trade secrets. However, any alternative data
collection effort that matches the volume and depth of information provided by patents
would be an extreme challenge. Further, some have argued that though citation-weighted
patent measures are better than simple patent counts in capturing the differences in values
of individual patents, they are still susceptible to interindustry variations in patenting
propensity. My focus on a single industry, pharmaceuticals, in which patenting is
commonplace, mitigates such issues because patenting propensity is more likely to be
stable within a single industry (Ahuja, 2000). In addition, my firm fixed-effects
specification controls for the time-invariant unobserved heterogeneity in patenting.
Independent Variables
Stability. Stability of the ego network captures the extent to which the focal firm’s
ego network remains unchanged from one time period to the next. I measure stability as
the percentage composition of the focal firm’s partners in its ego network that stayed the
same. I operationalize firm-level stability in two steps. First, I calculate network churn as
the percentage of the focal firm’s alliance partners that change (are added or lost) from
one year to the next (Burt & Merluzzi, 2016). I calculate the ratio for year t2 with the total
number of a) new ties that the focal firm formed between year t1 and year t2; and b) old
ties that the focal firm dissolved between year t1 and year t2 as the numerator (Sasovova
et al., 2010), and the total number of unique ties the focal firm had during the period as
the denominator (Burt & Merluzzi, 2016). Figure 1 illustrates the calculation of churn for
Amgen in 2001. From 2000 to 2001, Amgen dissolved two ties (Arris and Techne) and

41
initiated one new tie (Perkin-Elmer), resulting in a total change of three. During this
period, Amgen had ten unique ties (Arris, NPS, Chugai, Indevus, Techne, Yamanouchi,
Roche, Perkin-Elmer, Sumitomo, and Regeneron). Thus, 30 percent of Amgen’s ties
changed in 2001; therefore the churn rate of Amgen is 0.3.
Second, I measure the network stability at the focal-firm level using the
transformation Stabilityit=1- Churnit. In other words, the focal firm’s ego-network
stability in year t2 is the percentage of ties that stay the same from year t1 to year t2. For
Amgen for 2001, the stability is thus 1 - 0.3 or 0.70. When the focal firm enters the
sample for the first time, I assign a stability score of 1, in other words, assume the firm
experiences zero churn in that year.
Control Variables
Structural holes. Structural holes capture the lack of constraint faced by the focal
firm as regards its relationship with the partner firms in its ego network. I measure
structural holes in three stages. First, I compute the dyadic constraint using Burt’s (1992)
formula ciqt= (piqt
+ ∑ pikt
pkqt
)2
, k ≠ i, q, where piqt
measures the proportion of the focal
firm i’s involvement with the alter firm q in year t. The term ∑ pikt
pkqt
represents the
aggregate indirect tie strength between firms i and q via firm k in year t. A higher value
means that not only the focal firm has invested a large amount of time on the alter firm
but also that indirect ties impose constraint on the focal firm to negotiate better terms.
Second, I calculate the aggregate constraint faced by the focal firm i in year t using
Cit= ∑ ciqtq . Though in practice it varies from 0 to 1, the measure can exceed 1 (Borgatti,

42
2014) when q is not i’s only contact (Burt, 1992: 55) Third, I measure access to structural
holes using the Zaheer and Bell’s (2005) transformation Structural holesit=1- Cit. A high
score indicates exclusive access to alter firms and the measure differentiates between
closed and open triads in the focal firm’s ego network (Tatarynowicz, Sytch, & Gulati,
2016). I prefer this measure to other efficiency-based measures because it captures the
focal firm’s dependence in relationships and better reflects the ability of the focal firm to
negotiate and exploit entrepreneurial opportunities (Burt, 1992).
Geographic concentration (focal firm). The underlying latent variable I attempt
to capture is the focal firm’s geographic organization of activities for innovation. I use
the Herfindahl-Hirschman Index (HHI) of the focal firm’s inventive activities using
inventor location data for each year from the focal firm’s patents. I calculate this measure
as ∑ ini2
i , where i indexes the countries in which the focal firm’s inventors are present and
ini is the fraction of the focal firm’s patents in country i. An index value of 1 would
indicate that the research is concentrated in a single country. Firms with missing inventor
locations were assigned a score of 1, assuming no international presence.
I employed a robustness test, and find consistent results, with an alternative
measure of the firm’s geographic configuration that accounts for the organization in
different countries of the focal firm’s subsidiaries that formed alliances during my
sampling period. For year t, using the countries of the focal firm’s subsidiaries that
participated in alliances, I calculate the geographic concentration as ∑ c𝑖2
i , where i
indexes the countries in which the focal firm’s subsidiaries are present and ci is the

43
fraction of the focal firm’s alliances in country i. Like for its inventors, an index value of
1 indicates that all of the firm’s subsidiaries with alliances are present in one country.
Direct ties. The innovation benefits of knowledge exchange and scale provided by
the focal firm’s direct partners might be correlated with the advantages from spanning
structural holes (Ahuja, 2000).I control for Freeman’s (1978) degree centrality of the
focal firm by calculating the number of dyadic ties between the focal firm and its alter
firms in a network at time t.
Indirect ties. I counted the number of firms to which the focal firm was indirectly
connected in the whole network for year t to capture knowledge sharing via informal
channels in the network (Ahuja, 2000).
Technological opportunity. This measure controls for the fact that the focal
firm’s patenting might be affected by the opportunities it foresees in different
technological domains. For year t, I constructed this variable as the sum of the total
number of patents by all firms in that year in the technology classes in which the focal
firm patented, weighted by the proportion of the focal firm’s patents in each class (Ahuja,
2000). The technological opportunity variable is coded zero if the focal firm does not
patent in that year.
Technological base (log). I measure the focal firm’s technological base, a proxy
for the absorptive capacity and aggregate R&D, as the logged cumulative patent counts
until year t, with zero replaced by a very small number (0.0001) before transformation
(Funk, 2014). The focal firm with no patents till year t is coded 0. I use a discounted
stock model in which past patents are valued less than recent ones calculated as

44
∑ (1 - discount)t-α
PSiαtα = 1 where PS is the number of patents at time α and the annual
discount rate is 15% (Hall et al., 2005).
Technological diversity (focal firm). In order to account for the technological
scope of the focal firm based on its innovations until year t, I calculate the Blau Index of
diversity (Blau, 1977) as 1 - ∑ pati2
i , where i indexes the patent classes in which the focal
firm has patented thus far and pati is the proportion of the focal firm’s patents in patent
class i (Jiang, Tao, & Santoro, 2010; Vasudeva et al., 2012). An index value of 1
indicates perfect heterogeneity whereas 0 denotes exact homogeneity. The diversity
measure is assigned a value of zero if the focal firm did not patent until year t.
Technological distance (cosine). To measure technological similarity between
the focal firm and its partners for each firm-year t, I construct a k-dimensional vector l
containing the cumulative distribution of a firm’s patenting across different patent classes
until year t such that each element of the vector is equal to the fraction of the firm’s
patents in a class k. Next, I calculate the cosine angular distance (Jaffe, 1986) between a
firm i and its partner j using cosineijt = litljt' / √(l
itlit')(ljtljt
'). This measure ranges from 0 to
1, where 1 represents complete similarity. Next, I average the cosine distance between the
focal firm and its partners to calculate the aggregate measure. When the focal firm
patents but none of its alter firms do, I assume a distance of zero.
Industry similarity. To capture the effect of market-resource overlap, I measure
the proportion of the focal firm’s alliance partners that operate in the same four-digit SIC
codes as the focal firm (Polidoro, Ahuja, & Mitchell, 2011). Lavie (2007) finds that when

45
alliance partners and the focal firm belong to the same industry, alliance partners’
increased bargaining power places limits on the focal firm’s knowledge appropriation
capacity, affecting innovation.
Partners’ innovation value. The focal firm might gain more from partners that
have more valuable patents than from those who have less worthy patents. I account for
these differences in the technological importance of partners using the percentage of
citations received by partners’ patent out of total pharmaceutical patent citations up to
year t (Vasudeva et al., 2012).
Technological diversity (alliance partners). The focal firm’s alliance partners’
willingness to share knowledge for innovation might depend on whether or not the
partners are working in the same technological space. Similar to the technological
diversity of the focal firm, I control for this using the Blau Index of partners’ patent
diversity (Blau, 1977) as 1- ∑ partnerpati2
i , where i indexes the patent classes in which
the partner firms have patented thus far and partnerpati is the proportion of the partner
firms’ patents in patent class i (Vasudeva et al., 2012). An index value of 1 indicates
perfect heterogeneity whereas 0 exact homogeneity. The diversity measure is assigned
zero if none of the focal firm’s partners patent until year t.
Equity alliance (% of total alliance). For year t, I control for the differences in
firms’ incentives based on the proportion of alliances with equity transfer, cross equity
transfer, or joint venture in the alliance network (Lavie & Miller, 2008).
Cross-border participants (% of total alliance). For year t, I calculate the
46
proportion of the focal firm’s international partners to control for the knowledge diversity
imparted by foreign firms (Phelps, 2010).
Knowledge alliances (% of total). I control for the proportion of R&D, cross-
technology, or cross-licensing alliances that might affect patenting more directly relative
to the other types of alliances in each alliance network (Schilling & Phelps, 2007).
Cumulative alliance experience (focal firm). I capture the focal firm’s
differences in the management of alliances using the total number of alliances up to year t
(Anand & Khanna, 2000).
Average age of alliances. The focal firm’s alliance duration might affect both
stability and innovation performance. I control for this using the mean age of the focal
firm’s alliances in year t (Soda et al., 2004).
Acquirer dummy. I code the Acquirer dummy variable 1 in year t when the focal
firm acquired for the first time any other firm from my sample during the period the focal
firm was present in my sample to control for firm entry by acquisition.
Mergers and acquisitions stock (log). I measure the firm’s propensity to innovate
because of M&As by using its logged cumulative stock of M&As till time t, with zero
substituted for a very small number (0.0001).
Status (Bonacich centrality). Scholars have shown status to affect firm
performance (Podolny, 1993; Ertug & Castellucci, 2013). I capture status as normalized
Bonacich power centrality (Bonacich, 1987).
47
Model estimation
My dependent variable, Citation-weighted patent count sans self-citations, is
limited (nonnegative) and takes only discrete (integer) values (Maddala, 1983). In such
cases, estimation by the linear regression model will generally have heteroscedastic and
non-normal idiosyncratic errors (Manning, 1998; Manning & Mullahy, 2001). Also, the
predicted conditional mean values can be negative. I cannot log transform the dependent
variable because 15% of the count data is zero (Wooldridge, 2010). A brute-force log
transformation (adding a small positive quantity Δ to my dependent variable) yields
E[ln( Δ + y | x)] which cannot be retransformed to get my regression of interest E( y | x)
(O’hara & Kotze, 2010; Wooldridge, 2010). Also, it yields biased parameter estimates
(King, 1988). Any model from the linear exponential family such as the Poisson or the
negative binomial is a better fit here (Allison, 2009). Consequently, I use the Poisson
fixed effects unconditional quasi-maximum likelihood estimator in which the conditional
mean of my model (yit= αie
xit' β+ ϵit) takes the exponential form
EE [yit | xit,αi] = αie
xit' β= e(lnαi+ xit
' β), t =1, 2, …, T, i =1, 2, …, N, (1)
where yit is the citation-weighted patent count net of self-citations for the pharmaceutical
firm i at time t, xit include the independent variable, controls, and time effects, β are
estimated regression coefficients, αi are firm-specific unobserved time-constant effects,
and ϵit are idiosyncratic errors (shocks) (Cameron & Trivedi, 2013). The fixed-effects
estimator controls for the unobserved differences in the focal firm’s predisposition to
patent. The firm-effects αi in this case are allowed to be correlated with the predictor

48
variables xit. The estimation assumes strict exogeneity in that any of the past, present, and
future shocks (idiosyncratic errors) ϵit are uncorrelated with any of the explanatory
variables xit conditional on the unobserved effects αi (Wooldridge, 2010). In other
words, E[yit | xi1, xi2, …, xiT, αi]= E[y
it | xit,αi] (2)
I choose the Poisson fixed effects unconditional quasi (pseudo)-maximum
likelihood estimator for six reasons. First, the estimator allows for the consistent
estimation of 𝛽 without any incidental parameters problem (Lancaster, 2002). Second,
the marginal effects are identified (estimable) in this case in contrast to the Poisson
conditional maximum likelihood (CMLE) and the generalized method of moments
(GMM) estimators (Greene, 2002) because the first-order partial derivative of the
conditional mean with respect to any explanatory variable (∂E[yit | xit, αi]
∂xitj) will always
contain the multiplicative term αiexit
' β and these estimators eliminate the fixed effects αi.
The conditional maximum likelihood estimators estimate 𝛽 by partialling out the firm-
specific latent effects using the sufficient statistics ∑ yitt (Blundell, Griffith, & Van
Reenan, 1999); and the generalized-method-of-moments (GMM) estimators estimate 𝛽
by conditioning out the fixed effects using a quasi-differencing term (λityi
λi).
Third, “access to longitudinal data can control for heterogeneity through the
individual-specific effect αi, so the efficiency gains in going beyond Poisson models may
not be as great as in the cross-section case” (Cameron & Trivedi, 2013: 347; Hsiao,
2014). Fourth, the quasi-maximum likelihood estimation estimates “sandwich” cluster-
49
robust variance-covariance matrix that accounts for any intra-firm correlation and
overdispersion (Wooldridge, 1999). Fifth, the Poisson fixed-effects estimator is robust to
distributional misspecification (overdispersion or underdispersion) in its estimation of 𝛽
as long as the conditional mean specification in Equation (1) holds (Gourieroux, Monfort,
& Trognon, 1984; Wooldridge, 2010). Sixth, the Poisson fixed-effects estimation applies
equally well to any positive-skewed continuous variable whose domain is nonnegative
(Wooldridge, 2010).
In contrast, the negative binomial maximum likelihood estimators, both NB1, in
which the exponent of mean in the variance equation of count variable is 1, and NB2, in
which the exponent of mean is 2, are very sensitive to variance misspecification, making
the estimation inconsistent when variance is incorrectly specified (Cameron & Trivedi,
2010, 1986). Furthermore, in the case of unconditional maximum likelihood fixed-effects
estimation, the negative binomial estimators do not provide consistent estimates of β
because of the incidental parameters problem (Greene, 2007; Hilbe, 2011). Jointly
estimating N different incidental parameters α and K different β parameters makes the
number of estimated parameters to be estimated go to infinity, thus diluting the efficacy
of a large sample (NT) with fixed T and large N and making the estimation of 𝛽
inconsistent (Wooldridge, 2010). Moreover, negative binomial fixed-effects estimators
are restrictive in that “parametric model results are most easily obtained for the Poisson”
whereas the iterative algorithm in the negative binomial case might not converge
(Cameron & Trivedi, 2013: 347, 2010; Winkelmann, 2008). Moreover, some estimation

50
methods such as conditional maximum likelihood apply only to the NB1 model and not
the NB2.
Thus, the Poisson unconditional fixed effects quasi-maximum likelihood
estimator is appropriate for my empirical context because I can identify both consistent 𝛽
and the marginal effects. One caveat on using the quasi-maximum likelihood method is
that we cannot predict the probabilities of counts because the actual conditional density
of the count variable might be different (Wooldridge, 1997a). However, my main focus is
on the expected value of the count not the probability. I also used several alternative
model specifications as robustness tests (reported below).
There could still be some concern that though the model consistently estimates β
parameters, αi might be inconsistent because of their dependence on group size (T). To
the best of my knowledge none of the studies have looked at the impact of possibly
inconsistent incidental parameters αi on the marginal effects of the explanatory variables
xit whose estimates are consistent. I surmise that it is a lesser evil for two reasons. First,
even when both αi and β are inconsistently estimated and the incidental parameters
problem are present (not in my case), the marginal effects “have reasonable properties”
(Wooldridge, 2010: 618; Fernàndez-Val, 2009). In binary choice models, Greene (2004a:
110; words [in brackets] added) finds that “the marginal effect [at the mean] is closer to
the true value than the coefficient estimator is to its population counterpart.” Also, the
biases are much smaller than those in coefficients (Greene, 2004b), with the bias in the
marginal effect at the mean being possibly smaller than the average of individual
marginal effects (Greene, 2004a). Second, the bias might not be serious for T ≥ 5

51
(Wooldridge, 2010). Greene (2004a) does not find the bias to be as severe as that
described in Hsiao (2014) even for T = 2.
Results
Table 1 provides the descriptive statistics and the Pearson’s (bivariate) correlation
matrix for my variables. Though some variables exhibit moderate-to-high correlation, this
is not an issue because the variance inflation factor (VIF) for the overall model does not
exceed 10 (Kleinbaum, Kupper, & Muller, 1988), with the mean VIF being 7.72. Even
though I use a nonlinear regression model, I calculate the VIF using a linear regression
because multicollinearity is independent of the nature of the dependent variable (count or
otherwise) and is determined solely by the right-hand side predictor variables. An
interesting side-note is that how measures of multicollinearity (e.g., VIFs) relate to the
regression coefficients in nonlinear models remains an open question (for an exception,
see Bonate [1999]) and the VIF might not tell the complete story.
I mean-centered Structural holes, Geographic concentration (focal firm) and
Stability to eliminate nonessential multicollinearity and to “increase the interpretability of
regression coefficients” because of the presence of interaction term in the full model
(Hoffman & Gavin, 1998; Afshartous & Preston, 2011: 2; Aiken & West, 1991). As
shown in Table 1, my stability measure is negatively, though not significantly, correlated
with size-related measures such as direct ties, the focal firm’s technological base, and
indirect ties. One could argue that large networks are more prone to change just by
random chance, as explained by the negative correlation. The ego-network stability is
positively correlated with technological similarity between focal firms and alters (r =

52
0.08; p < 0.01), focal firms’ cumulative alliance experience (r = 0.06; p < 0.05), and the
average age of alliances in focal firms’ ego network (r = 0.30; p < 0.01). Some of these
correlations can be explained by noting that firms with greater alliance experience might
be more successful in retaining alliance partners. Increased alliance age might translate
into enhanced trust and repeated partnerships, thus enhancing their stability. Consistent
with extant theorizing that structural holes are fragile, stability is negatively associated
with structural holes (r = -0.07; p < 0.05). The geographic concentration of inventive
activities, one of my moderators, is negatively correlated with size-based measures,
namely, direct ties (r = -0.47; p < 0.01) and technological base (r = -0.29; p < 0.01),
suggesting that large firms are less likely to be geographically concentrated. Similarly,
firms are less likely to find alliance partners with high innovation value when the focal
firms are geographically concentrated (r = -0.36; p < 0.01).
Table 2 presents results of the regression analysis using the Poisson fixed effects
unconditional maximum likelihood estimator. Model 1 in Table 2 is a control variables
only baseline model. Structural holes, a moderator variable, Geographic concentration,
another moderator variable, and Stability, my main variable in the study, enter in Model
2. I add the interaction between Stability and Structural holes in Model 3 and the
interaction between Stability and Geographic concentration in Model 4. Model 5 is my
fully specified model with all variables and interaction terms.
Consistent with much of the prior work, I find that innovation performance
increases with access to structural holes. The coefficients of Structural holes in Models 2,
3, 4, and 5 are positive and significant (p < 0.05). I plotted in the top left corner of Figure

53
2 the predicted values of the conditional mean counts against Structural holes using the
regression estimates from Model 5, holding the other variables constant at their
respective sample mean values. Structural holes has a positive and increasing impact on
the conditional mean across the range of its observed values.
In nonlinear estimators, the marginal effects of changing predictors differ from
those calculated directly using the regression-coefficient estimates (Greene, 2007). Thus,
I also investigate the marginal effect of Structural holes on my dependent variable,
keeping all the other variables at their sample mean values (Long, 1997). I calculate the
marginal effect by taking the partial derivative of Equation (1) with respect to structural
holes in Model 5 (Cameron & Trivedi, 2013; Shaver, 2007).
Marginal EffectStructural holes
=
∂E[yit | xit,αi]
∂xitStructural holes= αie
xit' β(β
Structural holes+β
Stability X Structural holes Stability) (3)
xThe marginal effect of Structural holes at the sample mean of all variables is 12.43
citation-weighted patent counts net of self-citations (p < 0.05). In other words, 12.43 is
the instantaneous rate of change or the marginal change in the predicted conditional
expected value of Citation-weighted patents sans self-citations with respect to Structural
holes, keeping other variables at their sample means (Long & Freese, 2014).
The range of Structural holes is approximately one, calling for changes in the
variable that are of lesser magnitude than 1 for meaningful interpretation. Hence, I further
investigated discrete effects of the variable using the finite-difference method (arbitrary
changes in the variable), holding all other variables at their respective sample means

54
(Long, 1997).
Discrete EffectStructural holes
= ΔE[yit | xit, αi]
ΔxitStructural holes=
E[yit | xit, αi, xitS.holes = xitS. holes FINAL]- E[y
it | xit, αi, xitS.holes= xitS.holes INITIAL] (4)
The discrete effect of an explanatory variable refers to the change in the expected count
when the variable changes (∇ = final value - initial value) from its initial value to the final
value, when all other variables remain constant. The patent count increases by 4.63 as
Structural holes increases from the 10th
percentile to the 90th
percentile (χ2 = 5.27; p <
0.05). These results are consistent with expectations about the beneficial effects of
structural holes. I note that the formulae for the marginal and discrete effects in the case
of Geographic concentration and Stability use a logic similar to that in Equations (3) and
(4). Hence, I do not explicitly specify them in this essay to avoid repetition.
Models 2, 3, 4, and 5 show a significant, negative effect of Geographic
concentration (p < 0.05). I graphed in the top right corner of Figure 2 the predicted values
of the conditional mean of the dependent variable against Geographic concentration
using the regression estimates from Model 5, with all other variables at their respective
means. Geographic concentration negatively affects the conditional mean across the
range of its observed values, though at a diminishing rate as Geographic concentration
increases in value. The marginal effect of Geographic concentration at the sample mean
of all variables is -10.84 citation-weighted patent count sans self-citations (p < 0.05). The
expected count decreases by 2.27 as Geographic concentration increases from the 10th

55
percentile to the 90th
percentile (χ2 = 5.65; p < 0.05), thus suggesting that innovation
performance decreases when firms’ inventive activities are geographically concentrated.
Hypothesis 1 states that network stability negatively affects the focal firm’s
innovation performance. Stability has negative and significant (p < 0.05) coefficient
estimates in Models, 2, 3, 4, and 5. I graphed in the bottom left corner of Figure 2 the
expected count predictions against Stability. The bottom panel shows that Stability has a
negative, but diminishing, and significant (p < 0.05) impact on the predicted mean
counts. Stability, at the mean, reduces the conditional mean count of citation-weighted
patents by 3.87 (p < 0.01). The mean count reduces by 1.96 when Stability increases from
the 10th
percentile to the 90th
percentile (χ2 = 8.49; p < 0.01). These findings are
consistent with H1.
Hypothesis 2 proposes a positive moderating effect of structural holes on the
relationship between Stability and innovation performance. Equivalently, the effect of
Structural holes on patent counts becomes more positive as the level of Stability
increases and vice versa (Saunders, 1955). The coefficient of interaction between
Stability and Structural holes is positive and significant (p < 0.01) in Model 3, and is
positive and significant, though marginally, in Model 5 in Table 2 (p < 0.10). I plot this
interaction in Panel A of Figure 3 to gain further insights. The graph shows that the
negative effect of stability on the predicted patent counts is more detrimental to a focal
firm with low levels of structural holes in its network than for a focal firm with high
levels of structural holes.
We can interpret the interaction effect in two ways: one is to present the effect as

56
incidence-rate ratio (IRR) (multiplicative effects) and the other is to calculate marginal or
discrete interaction effects (Buis, 2010). I discuss both to evaluate my hypothesis. Using
the IRR, I find that as Stability increases by one unit when the focal firm spans no
structural holes, the patent count reduces by a factor of 0.75 (or 25 percent reduction in
patent counts). This effect of Stability on patent counts increases by a factor of 2.34 as
Structural holes increases by one unit from zero to one. Hence, if the focal firm spans
structural holes (or Structural holes = 1) then the effect of Stability is positive: 133.97
percent increase in patent counts with a unit increase in Structural holes. The effect is
significant with 90 percent two-tailed confidence interval, marginally supporting H2. I
note that the benefit of using the multiplicative interaction effects is that these effects
control for differences in baseline IRRs in their own category: thus, these effects control
for the baseline differences among firms with high and low Stability even when these
firms do not span structural holes (or Structural holes = 0) (Buis, 2010).
As suggested by Ai and Norton (2003), I also calculate the marginal interaction
effects on the predicted mean patent counts by taking the cross-partial derivative of
Equation (1) with respect to Structural holes and Stability or by taking the partial
derivative of Equation (3) with respect to Stability. The marginal interaction effect
(Norton, Wang, & Ai, 2004; Shaver, 2007) is
∂2E[yit | xit, αi]
∂xitStructural holes ∂xitStability = αie
xit' β[β
Stability X S.holes+
(βS. holes
+ βStability X S. holes
Stability) (βStability
+ βStability X S. holes
Structural holes +
βStability X Geog. concentration
Geographic concentration)] (5)

57
Substituting the coefficient estimates from Model 5 and holding all regressors at their
sample mean values, the interaction effect of Stability and Structural holes on the
expected patent count is 7.65. The effect is significant for one-tailed test at the 10%
significance level, marginally confirming the veracity of my Hypothesis 2.
Next, in order to assess the effect of a discrete change in the level of Structural
holes on the relationship between a discrete change in Stability and predicted mean count,
I follow Zelner (2009) approach to calculate the interaction effect using the discrete
double difference method. The discrete interaction effect is
Δ2E[yit | xit,αi]
ΔxitStability ΔxitS. holes = (E[y
it | xit,αi, xitS.holes= xitS. holes FINAL, xitStability = xitStability FINAL]
- E[yit | xit, αi, xitS.holes = xitS.holes INITIAL, xitStability = xitStability FINAL])
- (E[yit| xit, αi, xitS.holes = xitS. holes FINAL, xitStability = xitStability INITIAL]
- E[yit | xit, αi, xitS.holes = xitS.holes INITIAL, xitStability = xitStability INITIAL]) (6)
The discrete interaction effect on the expected value of patent count as Structural holes
changes from low (10th
percentile) to high (90th
percentile) and Stability changes from
low (10th
percentile) to high (10th
percentile) is 1.54. The effect is significant with 90
percent one-tailed confidence interval. Thus, I find marginal support for my second
hypothesis.
I have faith in the validity of the use of one-tailed test for the marginal effects for
H2 for two reasons. First, I formally hypothesize about the direction of the interaction
effect and my hypothesis derives from theory. Second, interaction effects between
continuous variables are, in general, difficult to detect at the 95 percent confidence level

58
(Morris, Sherman, & Mansfield, 1986; McClelland & Judd, 1993) because, among other
things, the test lacks statistical power (Jaccard, Wan, & Turrisi, 1990). Given my
constraints in increasing the sample size or in increasing the variance of the underlying
variables, I chose to increase the significance level to increase the statistical power of the
effect (Hoang & Rothaermel, 2005). The results largely support H2.
Hypothesis 3 states that Geographic concentration negatively moderates the
relationship between Stability and innovation performance. Models 4 and 5 depict a
negative and significant interaction effect of Geographic concentration (p < 0.05). I plot
this interaction in Panel B of Figure 3. As can be seen, the effect of stability on the
predicted value of citation-weighted counts net of self-citations is more negative as the
focal firm’s network is highly geographically concentrated, thus providing support for
H3.
As regards multiplicative interaction effects, the effect of Stability on patent
counts further decreases by a factor of 0.29 as Geographic concentration increases by
one unit from zero to one. Hence, if the focal firm is geographically concentrated (or
Geographic concentration = 1) then the effect of Stability is negative: 71.35 percent
decrease in patent counts for each unit increase in Geographic concentration. The effect
is significant with 95 percent two-tailed confidence interval, supporting H3.
To calculate marginal and discrete effects, I use Equations (5) and (6) with
Structural holes replaced by Geographic concentration and vice versa, controlling for all
other regressors at their sample means. Substituting the coefficient estimates from Model
5 and holding all regressors at their sample mean values, the interaction effect of Stability

59
and Geographic concentration on the expected patent count is -13.56. The effect is
significant for two-tailed test at the 10% significance level, marginally confirming the
veracity of my Hypothesis 3. The discrete interaction effect on the expected value of
patent count as Geographic concentration changes from low (10th
percentile) to high (90th
percentile) and Stability changes from low (10th
percentile) to high (10th
percentile) is -
1.48. The effect is significant with 90 percent two-tailed confidence interval. Thus, my
third hypothesis is largely supported.
Robustness Checks
My results are robust to different measures of the dependent variable such as
patents alone, and citations alone net of self-citations. Direct ties (r = 0.69; p < 0.01) and
status (r = 0.66; p < 0.01) might be closely associated with structural holes (Borgatti,
Everett, & Johnson, 2013). In addition, some other control variables are fairly highly
correlated. Direct ties is highly correlated with status (r = 0.80; p < 0.01) and cumulative
alliance experience (r = 0.82; p < 0.01), and status is correlated with partners’ innovation
value (r = 0.72; p < 0.01). I chose to retain them in my main model for four reasons.
First, these controls derive from theory (Ahuja, 2000; Podolny, 1993; Vasudeva et al.,
2012). Second, the overall VIF for the full model is less than ten. Third, my findings are
robust with respect to excluding the direct ties, status, and partners’ innovation value
measure, either one at a time or jointly as shown in Appendix 3 (Models, 2, 3, 4, and 5) at
the end of this chapter. Fourth, high correlation between control variables such as that
between the direct ties and status in and of itself does not affect the “coefficients of the
variables of interest… and the performance of the control variables as controls is not
60
impaired” (Allison, 2012:1) in that multicollinearity may not affect the joint significance
of linear combination of these control variables (Kennedy, 2008).
In addition, firm size might be correlated with both innovation performance and
my network measures. I use size-related measures such as technological base and direct
ties in the main model. My results hold when I introduce an additional control for firm
size using the logged number of employees (not shown). This measure exhibits high
association with my technological base measure (r = 0.74; p < 0.01) indicating, as might
be expected, that larger firms have larger technological bases. Next, in my sample, some
firms do not patent. On the one hand, inclusion of such firms helps mitigate the self-
selection on my dependent variable. On the other hand, such firms might be different
from firms that patent in that such firms might be young with innovations underway. I
categorize firms into innovators and imitators based on whether or not they have patents.
However, my fixed-effects controls for such differences, and STATA omits this
innovator variable. In addition, my results are stable to introducing R&D intensity to
control for such differences in Appendix 3 (Model 6).
The Poisson conditional maximum likelihood estimator (not shown) provides
consistent estimates as those in Model 5 of Table 2 (my main model), confirming the
absence of incidental parameter bias. In Model 6 (Table 3) I use the Poisson-Gamma
random effects estimator to alleviate the concern that the coefficients of some variables
with relatively small within-firm standard deviation may limit their identification (Baum,
2006). The Poisson-Gamma random effects model effectively results in the negative
binomial model (Greene, 2007). Coefficient estimates and their significance for my main
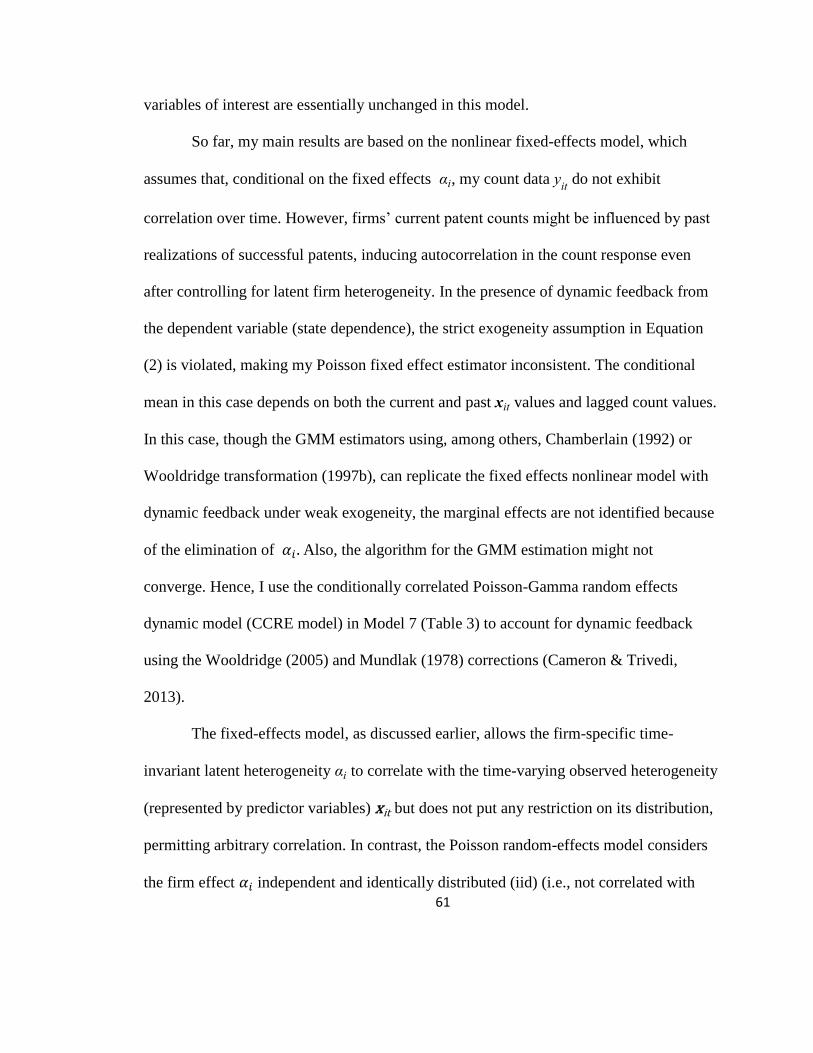
61
variables of interest are essentially unchanged in this model.
So far, my main results are based on the nonlinear fixed-effects model, which
assumes that, conditional on the fixed effects αi, my count data yit do not exhibit
correlation over time. However, firms’ current patent counts might be influenced by past
realizations of successful patents, inducing autocorrelation in the count response even
after controlling for latent firm heterogeneity. In the presence of dynamic feedback from
the dependent variable (state dependence), the strict exogeneity assumption in Equation
(2) is violated, making my Poisson fixed effect estimator inconsistent. The conditional
mean in this case depends on both the current and past xit values and lagged count values.
In this case, though the GMM estimators using, among others, Chamberlain (1992) or
Wooldridge transformation (1997b), can replicate the fixed effects nonlinear model with
dynamic feedback under weak exogeneity, the marginal effects are not identified because
of the elimination of 𝛼𝑖 . Also, the algorithm for the GMM estimation might not
converge. Hence, I use the conditionally correlated Poisson-Gamma random effects
dynamic model (CCRE model) in Model 7 (Table 3) to account for dynamic feedback
using the Wooldridge (2005) and Mundlak (1978) corrections (Cameron & Trivedi,
2013).
The fixed-effects model, as discussed earlier, allows the firm-specific time-
invariant latent heterogeneity αi to correlate with the time-varying observed heterogeneity
(represented by predictor variables) xit but does not put any restriction on its distribution,
permitting arbitrary correlation. In contrast, the Poisson random-effects model considers
the firm effect 𝛼𝑖 independent and identically distributed (iid) (i.e., not correlated with
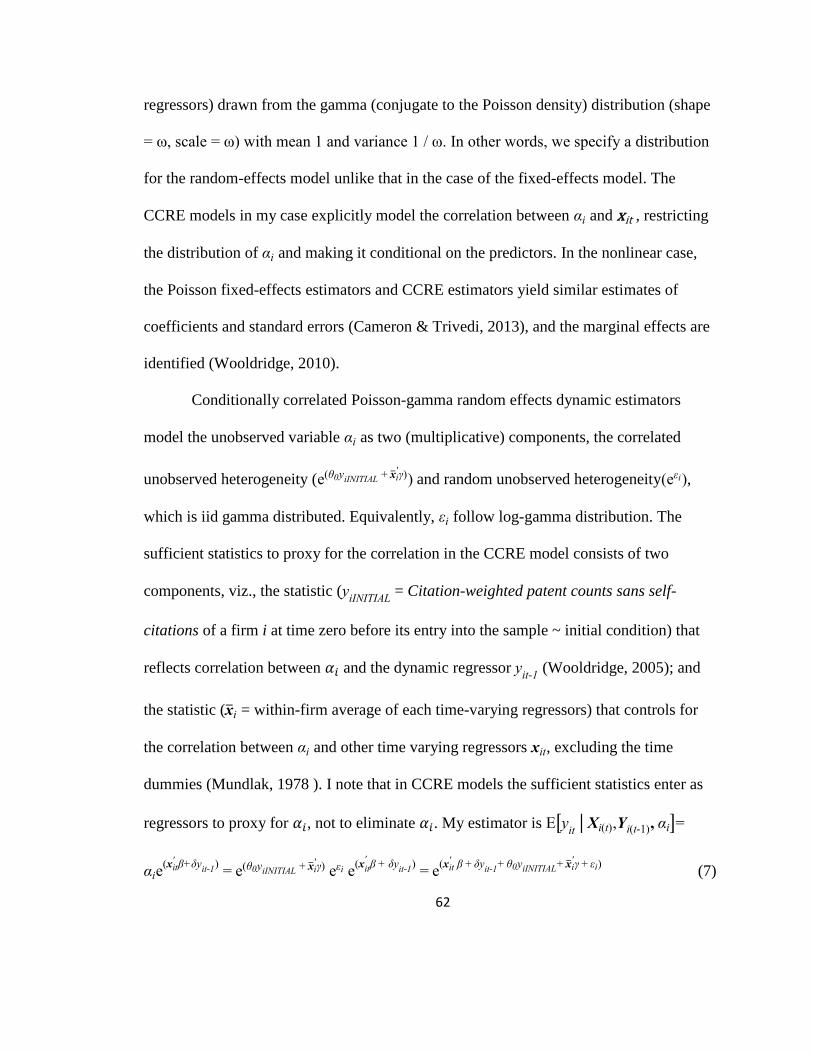
62
regressors) drawn from the gamma (conjugate to the Poisson density) distribution (shape
= ω, scale = ω) with mean 1 and variance 1 / ω. In other words, we specify a distribution
for the random-effects model unlike that in the case of the fixed-effects model. The
CCRE models in my case explicitly model the correlation between αi and xit , restricting
the distribution of αi and making it conditional on the predictors. In the nonlinear case,
the Poisson fixed-effects estimators and CCRE estimators yield similar estimates of
coefficients and standard errors (Cameron & Trivedi, 2013), and the marginal effects are
identified (Wooldridge, 2010).
Conditionally correlated Poisson-gamma random effects dynamic estimators
model the unobserved variable αi as two (multiplicative) components, the correlated
unobserved heterogeneity (e(θ0yiINITIAL + x̅i'γ)) and random unobserved heterogeneity(eεi),
which is iid gamma distributed. Equivalently, εi follow log-gamma distribution. The
sufficient statistics to proxy for the correlation in the CCRE model consists of two
components, viz., the statistic (yiINITIAL
= Citation-weighted patent counts sans self-
citations of a firm i at time zero before its entry into the sample ~ initial condition) that
reflects correlation between 𝛼𝑖 and the dynamic regressor yit-1
(Wooldridge, 2005); and
the statistic (x̅i = within-firm average of each time-varying regressors) that controls for
the correlation between αi and other time varying regressors xit, excluding the time
dummies (Mundlak, 1978 ). I note that in CCRE models the sufficient statistics enter as
regressors to proxy for 𝛼𝑖, not to eliminate 𝛼𝑖. My estimator is E[yit | Xi(t),Yi(t-1), αi]=
αie(xit
' β+δyit-1
) = e(θ0yiINITIAL + x̅i
'γ) eεi e(xit
'β + δy
it-1) = e
(xit' β + δy
it-1+ θ0yiINITIAL+ x̅i
'γ + εi) (7)

63
where Xi(t) = (xi1,xi2,…,xit), Yi(t)= (yi1
,yi2
,…,yit-1
), and is estimated using the Poisson-
gamma random effects estimator (Cameron & Trivedi, 2013). I also note that the
covariates here are weakly exogenous (predetermined). The estimator exhibits
exponential feedback. Though Blundell, Griffith, and Windmeijer (2002) call for linear
feedback to overcome the explosive nature (δyit-1
≥ 0 if δ > 0) of the exponential
estimator, explosiveness is a nonissue in short panels and “the relative ease of
interpretation favors the” exponential feedback model (Cameron & Trivedi, 2013: 371).
I suppress, for brevity, the coefficient estimates of initial conditions and other
sufficient statistics (available upon request). In Model 7 (Table 3), my lagged dependent
variable, Citation-weighted patent count sans self-citations-1 is significant at the 1%
level. Its coefficient estimate is very close to zero (a little greater), making the model
very slightly explosive. Though the coefficient for Geographic concentration is not
significant, it is in the right direction, i.e., negative as hypothesized. Structural holes (p <
0.05), Stability (p < 0.01), the interaction between Structural holes and Stability (p <
0.05), and the interaction term between Geographic concentration and Stability (p <
0.10) have the same signs as those in my main Model 5 in Table 2. Overall, the results
are similar to those in Table 2 and confirm hypotheses support from the main analyses.
Next, I delve into another source of autocorrelation in yit, over and above that
controlling for αi. In Model 8 (Table 3) I test for the possible endogeneity of Structural
holes manifested in the autocorrelation of εit in that firms with more patent counts may be
likelier to span more structural holes. The use of inverse Mills ratio derived from the

64
Heckman’s (1979) method in any fixed-effects nonlinear estimator might result in
inconsistent estimates (Terza, 1998). Hence, I use a two-part approach suited for
nonlinear models known as the Control Function approach for the Poisson fixed-effects
estimator based on the recursive system (Wooldridge, 2015).
E[yit | xit, αi, S.holesit, uit1 ]= αi1e(xit
'β1 + ℵ1S.holesit + ∁1Stability X S.holesit + uit1) (8.1)
S.holesit = z1it' β
2+ z2it
' ξ2 + αi2+ εit2 (reduced-form equation Structural holes) (8.2)
uit1 = ρεit2+ εit (Wooldridge, 1997a) (8.3)
where z1it contains all the exogenous variables from Equation (8.1), i.e., xit (controls,
time dummies, and Stability) and z2it excluded exogenous variables or instruments.
The instrument should capture the variation in Structural holes but should not
influence patent counts directly. I use uncertainty experienced by the focal firm in
innovation as an excluded instrument for Structural holes to capture the firm’s
willingness to engage in an alliance (Pfeffer & Nowak, 1976) and to span structural
holes. Uncertainty faced by the focal firm negatively affects Structural holes (Martin,
Gözübüyük, & Becerra, 2015). When faced with firm-specific uncertainty, the focal firm
would reduce the search costs associated with new potential alter firms and the risk of
opportunistic behavior by members of its ego network. Consequently, it would engage in
fewer structural holes (Gulati, 1995a). I measure uncertainty by the standard deviation of
the rolling five-year window of patent counts of the focal firm until time t (Martin et al.,
2015). I created an additional instrument by multiplying Stability with this uncertainty
measure (Angrist & Pischke, 2009). In the first stage (results available upon request), I
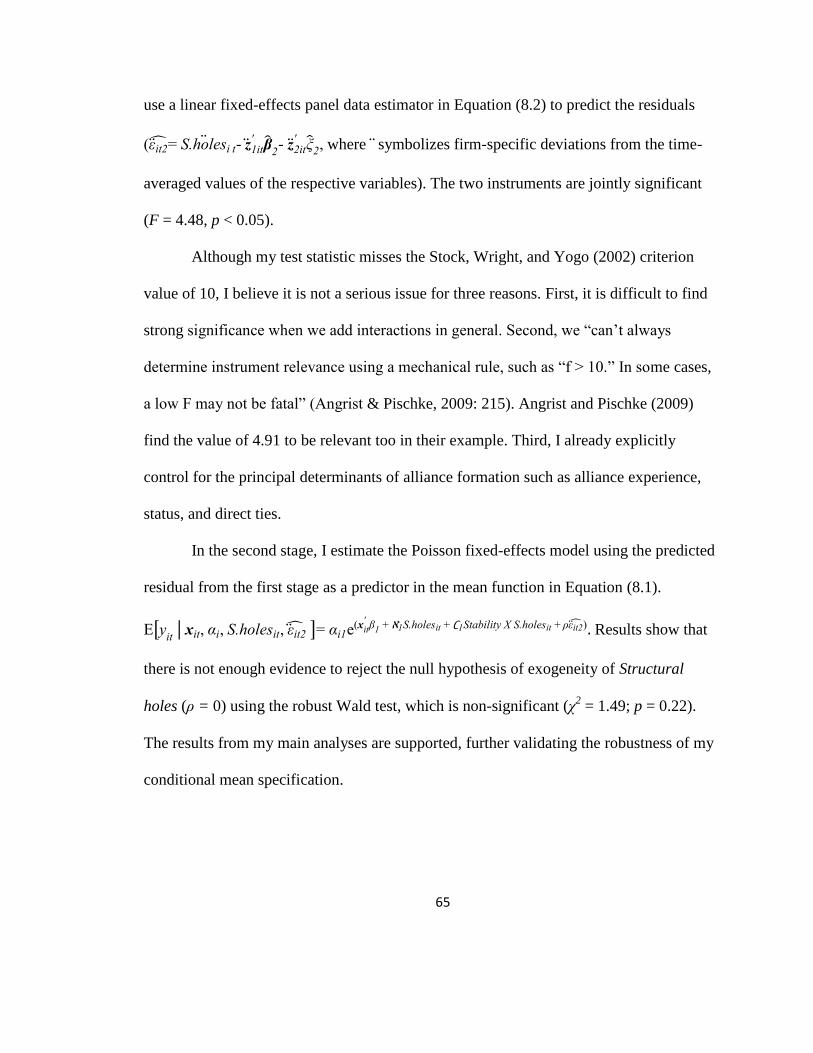
65
use a linear fixed-effects panel data estimator in Equation (8.2) to predict the residuals
(ε̈it2̂= S.holes̈i t- z̈1it
'β̂
2- z̈2it
' ξ̂2, where ̈symbolizes firm-specific deviations from the time-
averaged values of the respective variables). The two instruments are jointly significant
(F = 4.48, p < 0.05).
Although my test statistic misses the Stock, Wright, and Yogo (2002) criterion
value of 10, I believe it is not a serious issue for three reasons. First, it is difficult to find
strong significance when we add interactions in general. Second, we “can’t always
determine instrument relevance using a mechanical rule, such as “f > 10.” In some cases,
a low F may not be fatal” (Angrist & Pischke, 2009: 215). Angrist and Pischke (2009)
find the value of 4.91 to be relevant too in their example. Third, I already explicitly
control for the principal determinants of alliance formation such as alliance experience,
status, and direct ties.
In the second stage, I estimate the Poisson fixed-effects model using the predicted
residual from the first stage as a predictor in the mean function in Equation (8.1).
E[yit | xit, αi, S.holesit, ε̈it2̂ ]= αi1e(xit
'β1 + ℵ1S.holesit + ∁1Stability X S.holesit + ρε̈it2̂). Results show that
there is not enough evidence to reject the null hypothesis of exogeneity of Structural
holes (ρ = 0) using the robust Wald test, which is non-significant (χ2 = 1.49; p = 0.22).
The results from my main analyses are supported, further validating the robustness of my
conditional mean specification.
66
SUMMARY
How does ego-network stability affect innovation performance? A long network
research tradition has mostly argued that the configuration of network structures (e.g.,
structural holes) benefits firms’ innovation performance. However, researchers appear to
have overlooked a fundamental dimension of social structure, its stability. Consistent
with much extant work, my baseline (but not hypothesized) findings indicate that a focal
firm that spans structural holes reaps greater innovation benefits. However, in addition to
the innovation benefits provided by network structure configuration per se, I empirically
disentangle the negative innovation implications of ego-network stability and show how
these effects are contingently influenced by network configurations, specifically,
structural holes. Moreover, I demonstrate how the geographic concentration of the focal
firm’s inventive activities contingently accentuates the negative ego-network stability-
performance relationship.
Specifically, I show that network stability has a detrimental effect on the focal
firm’s innovation performance. The effect, taken together with the mitigating influence of
structural holes spanned by the focal firm, highlights the potentially opposing forces at
play in assessing the value of ego networks. Bringing stability into the picture attenuates
the knowledge benefits of ego networks because of knowledge retrieval difficulties,
relational lock-in, and knowledge redundancy, thus reducing the heterogeneity in
knowledge availability from the firm’s network resources. However, compared to
network closure, when the focal firm spans structural holes, it is able to limit the negative
effects of stability.

67
The focal firm’s geographic concentration, on the other hand, amplifies the
negative impact of ego-network stability. The focal firm that lacks a multicountry
operation is not able to exploit diversity benefits because both knowledge and labor are
geographically constrained, with low mobility across geographic boundaries (Jaffe et al.,
1993). In contrast to high concentration, low geographic concentration (high
internationalization) allows the focal firm to access diverse knowledge from multiple
countries, increasing the likelihood of recombination (Kogut & Zander, 1993).The focal
firm with multicountry presence is able to learn from the different country-specific best
practices for innovation, from the complexity involved in organizing, and from the
ensuing employee diversity (Ghosal & Bartlett, 1988; Westney & Zaheer, 2008;
Østergaard et al., 2011). In addition, multicountry location allows for the institutional
arbitrage in which the focal firm benefits from the intercountry differences in knowledge-
related input factors and output (Zhao, 2006).

68
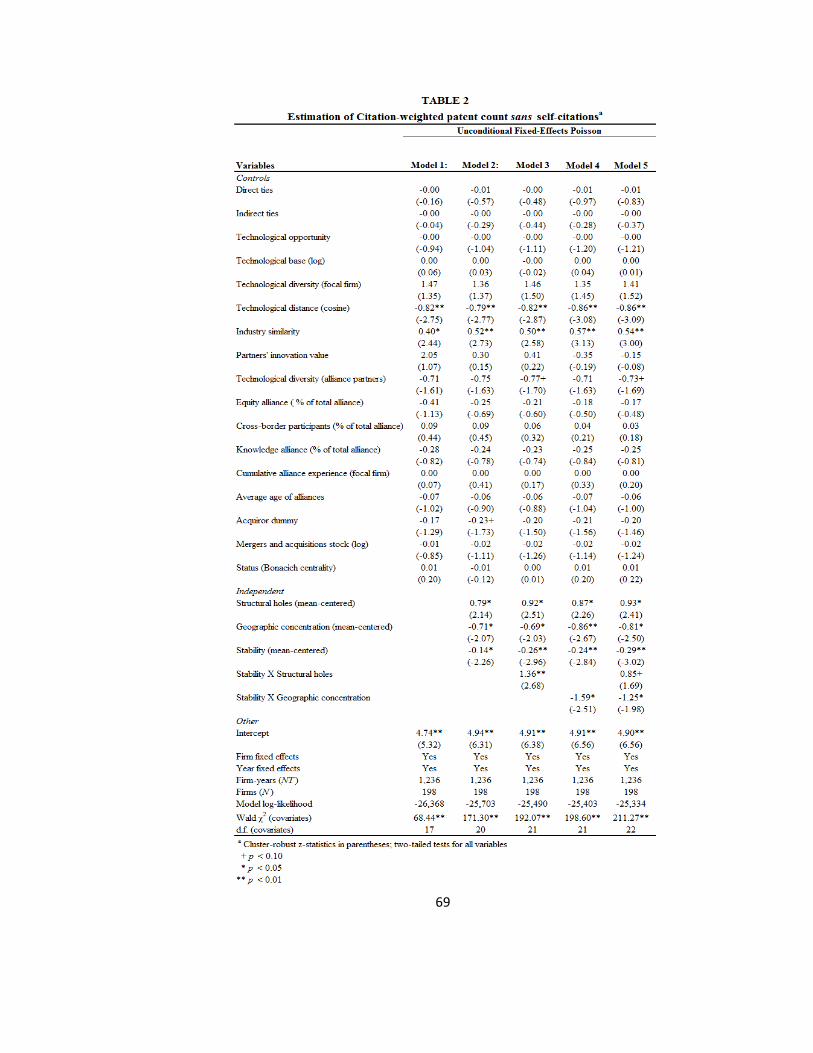
69
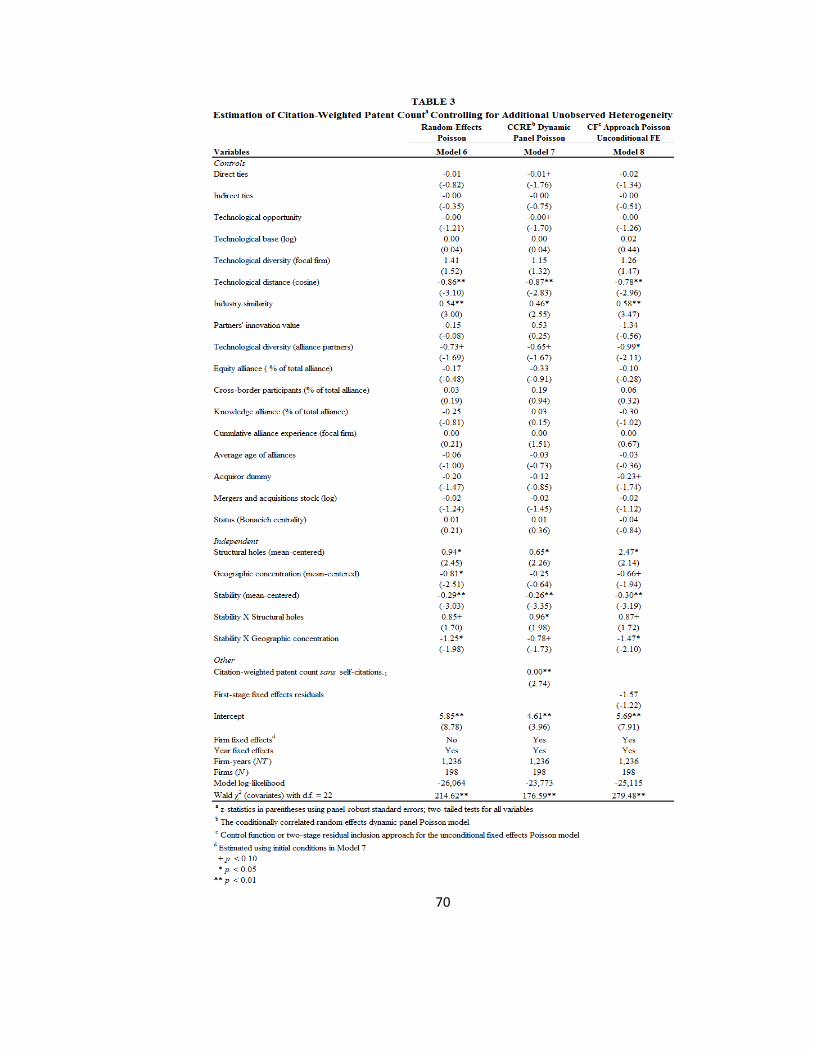
70
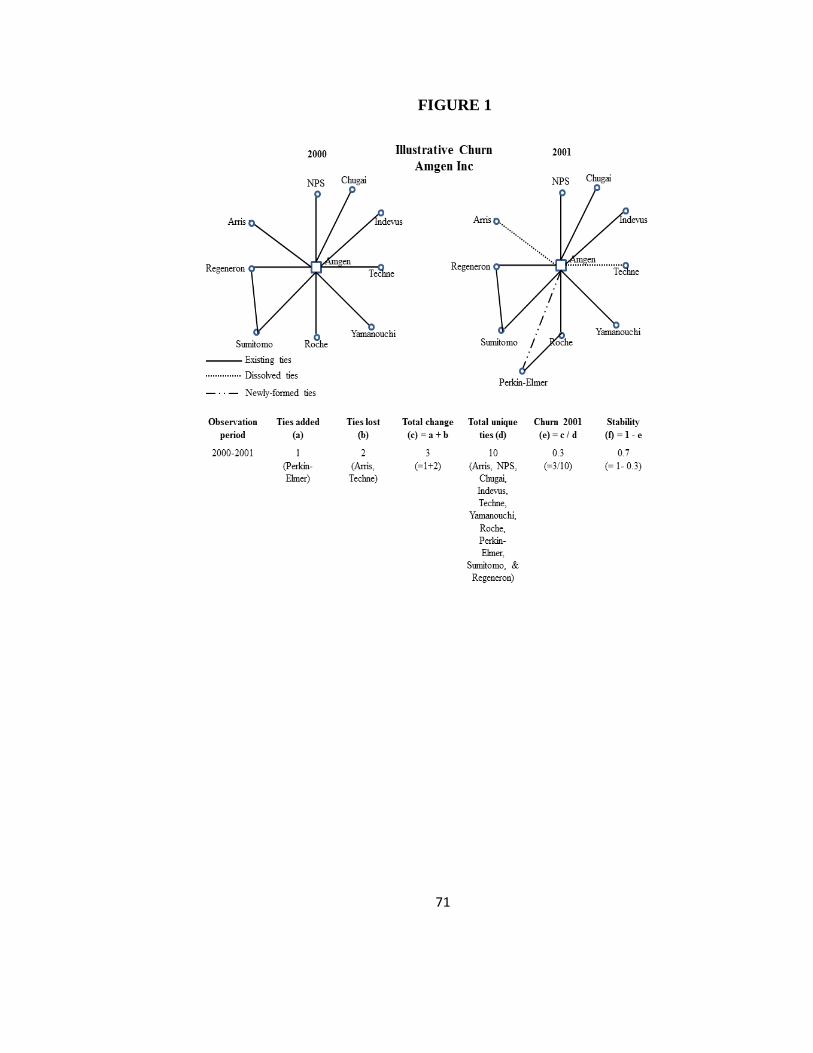
71
FIGURE 1

72
FIGURE 2

73
FIGURE 3
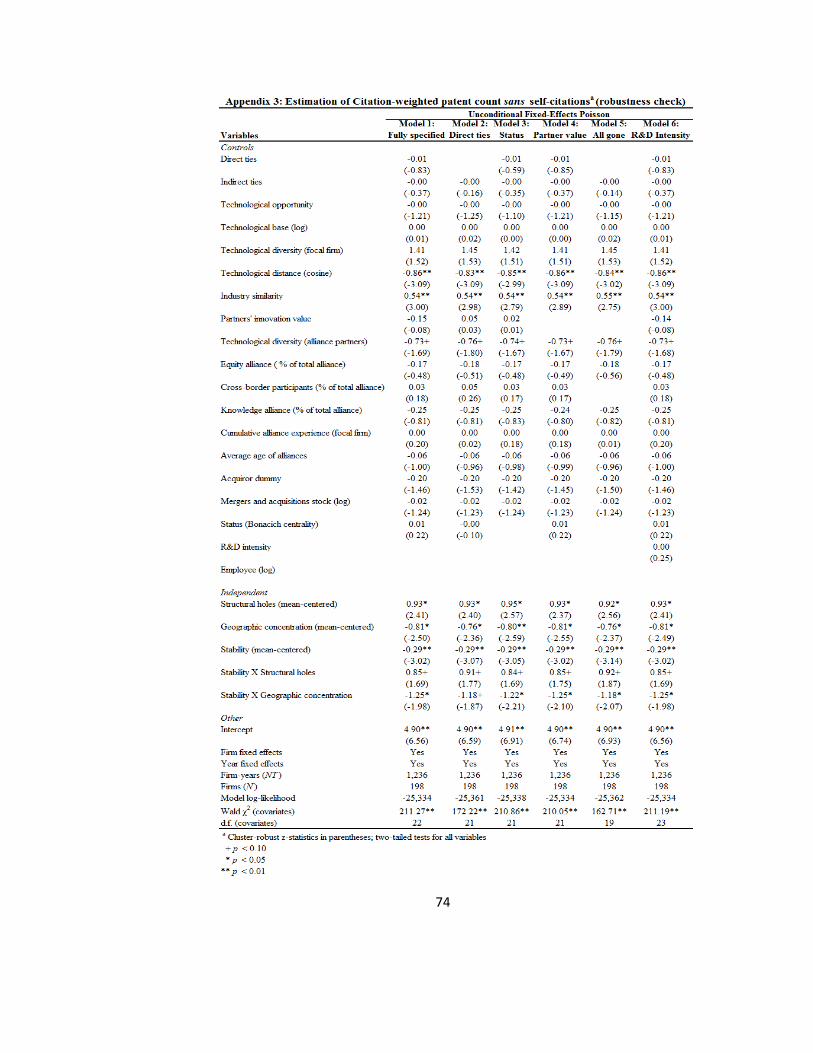
74

75
CHAPTER 3
Origins of Ego-Network Stability: A Deeper Look into Brokerage (Structural Hole)
Stability
That friends, however friends they were,
Still deal with things as things occur,
And that, excepting for the blind,
What’s out of sight is out of mind.
-- The Poems of Arthur Hugh Clough
In the previous chapter, I underscored the salience of network stability in order to
understand better the network structure-performance link. Two key insights from Chapter
2 provide motivation for this chapter. First, stability negatively affects the focal firm’s
innovation performance. Second, spanning structural holes mitigates the negative effect
of stability. Given the importance of structural holes in reducing the negative effect of
stability, I in this follow-up chapter examine what makes structural holes or brokerage
structures stable or persist in the first place. In this regard, in this chapter, I limited the
domain of stability to brokerage stability rather than ego-network stability. This change
in direction from the previous chapter is an essential first step to open the black box of
ego-network stability. My brokerage-stability focus is valuable for further in-depth
examination of basic network structures without confounding the stability arising from
the open or brokerage-structure configurations with that from the closed-structure
configurations. Put another way, the ego-network stability in the previous chapter may
arise from closure as well as brokerage. Since the implications of these two structures are
quite different, a sole focus on the brokerage structure allows me to get directly at the
antecedents of stability, without any ambiguity about whether or not the network

76
structure configuration per se, i.e., brokerage or closure, is the source of stability. I
provide additional theoretical rationale for investigating the antecedents of stability of
these brokerage structures in the following paragraphs.
In general, recent scholarship investigates the formation and outcomes of
organizational networks, but has paid scant attention to the factors that make these
structures dissolve or persist (Watts, 2001; Kim, Oh, & Swaminathan, 2006; see Gulati &
Gargiulo, 1999 for an exception). Emphasizing both network creation and stability in his
early work calling out network evolution, Jarillo (1988: 36) originally raised the question,
“How can a network be created and sustained?” At the same time, in addition to their
embeddedness in social or organizational contexts (Granovetter, 1985), firms and inter-
firm ties are embedded in geographic space, an infrequently examined factor in the
network literature (Ter Wal, 2014; Cattani, Pennings, & Wezel, 2003). By ignoring
geographic embeddeddness, researchers risk misattributing geography’s effect on
network evolution to nodal, structural, or tie attributes (Gastner & Newman, 2006; for
exceptions see Bell & Zaheer, 2007; Whittington, Owen-Smith, & Powell, 2009; Kono,
Palmer, Friedland, & Zafonte, 1998).
In this chapter I address the issue of brokerage stability from the perspective of
the interfirm network’s embeddedness in geographic space. For both theoretical
exposition and empirical validation, I use a structural hole – or brokerage – triad as my
unit of analysis and assess the effects of geography on triadic stability. The triad is often
viewed as the basic building block of a network (Simmel, 1950; Krackhardt, 1999;
Madhavan & Gnyawali, 2004). In structural hole or brokerage triads, a focal firm

77
connects to two disconnected alter firms (Burt, 1992), often acting as a “knowledge
broker” in alliance networks. Much research on inter-organizational alliance network has
shown the unique benefits of brokerage in accessing new knowledge (Hansen, 1999; Bell
& Zaheer, 2007) and good ideas (Burt, 2004).
At the same time, structural holes are believed to be transient (Burt, 2002;
Krackhardt, 1998). Brokerage positions, while allowing for exploitation of information
asymmetries, may also generate distrust towards the broker (Stovel, Golub, & Milgrom,
2011). The broker might choose to play one alter firm off against the other to maximize
“knowledge rents,” in so doing undermine the trust of the alters in the broker. Alters’
effort to reduce unfavorable dependence on the broker once they become aware of each
other, and of the true nature of the broker’s role, might cause the brokerage triad to decay
(Buskens & van de Rijt, 2008). In this study I seek to understand when and why
brokerage triads persist, and conversely, the factors that might hasten their termination in
geographic space, given that knowledge, including knowledge of the broker’s role, as
well as of the potential gains to alters from closing the hole, may be geographically
constrained. Furthermore, recent research shows that technology development triads are
more successful when ‘group cycling’ exists, isolating each dyad to work together at a
time towards the triad’s overall goals (Davis, 2016). Geography may help maintain this
decomposition.
I define a brokerage triad to be stable if there is no change in its membership for a
certain period t. A brokerage triad becomes unstable or decays if any of its members
leave, or if its unconnected members form a new relationship between themselves (Burt,

78
2002). Prior studies examining the role of geographic proximity on networks have
ignored its effect on network change, focusing principally on tie formation (Bossard,
1932; Blau, 1977). With a principal focus on the role of technological regimes, Ter Wal
(2014) examines how effects of geography and triadic closure on tie formation are
modified with a change in the technological regime. Building on these contributions, my
point of departure is the direct effect of geography on brokerage stability.
At the same time, research finds that the membership of firms in network
communities influences their likelihood of forming bridging ties (Sytch, Tatarynowicz, &
Gulati, 2012). Network communities are tightly knit mutually exclusive social
collectivities with increased interdependence and denser ties within the community than
across communities (Hawley, 1950; Tatarynowicz, Sytch, & Gulati, 2016). However, the
issue of triadic stability when the broker and alter firms reside in different network
communities remains an open question. Compared to those from different communities,
alter firms from same network communities might avail brokerage benefits because of
positive network externalities, enhancing brokerage stability (Clement, Shipilov, &
Galunic, 2017). Consistent with the underlying logic, I argue that inter-community
competition places a severe strain on brokerage relationship, reducing triadic stability
(Gomes-Casseres, 1994). In sum, I investigate two related questions: How does
geography affect the stability of brokerage structures? Also, how do firms’ memberships
in network communities affect brokerage stability?
I empirically test my hypotheses with interfirm alliances in the global
pharmaceutical industry context from 1985 to 2005 using 61,495 brokerage triad-year

79
observations and discrete time survival models with complementary log-log estimators.
Consistent with my sample, log-log estimators work well with both high frequency and
rare events data, and are invariant to the choice of the interval to measure survival times
(as I explain in the Methods section) (Allison, 2010). In addition, such models also allow
me to independently analyze different operationalizations of brokerage decay with
competing risk models (Allison, 2014) in robustness checks.
Below, I develop my hypothesis elucidating the link between brokerage stability
and geography in terms of the triadic evolutionary outcome of decay. Thereafter, I
develop arguments and hypothesize about the effect of the broker and alter firms’
embeddedness in different network communities on brokerage stability.
THEORY AND HYPOTHESES
Geographic Distance and Brokerage Stability
Prima facie, geographic distance might seem to reduce brokerage stability
because of the costs associated with distance (Zaheer, 1995). Distance makes it harder to
establish trust between alliance partners. Also, geographic distance might make the
alliance less resilient to ‘shocks’ to relationships, with conflicts more likely to escalate
because of the lack of frequent efficient communication and interaction. However, I
argue that these issues, though relevant, are more critical during the initial decision-
making process about whether or not to form an alliance across distant geographies. Once
partner firms self-select into the alliance relationship, these factors might not reduce
stability because of relationship-specific investments (Subramani & Venkatraman, 2003).

80
Also, at the brokerage-triad level, the presence of the third party changes the dynamics at
the dyad level. Situating dyadic relationships in a triadic context creates “quite dramatic
changes in seemingly stable relations” (Gadde & Mattsson, 1987: 29) and vice versa.
Next, I develop arguments with respect to the effect of geographic distance on the
stability of the brokerage triad through three sets of related arguments: brokerage
awareness; search, monitoring, coordination and communication costs; and knowledge
heterogeneity.
Brokerage awareness. My starting point in this line of argument is that a
brokerage triad is likelier to be stable if alter firms remain unaware of brokerage (Burt,
2005). Otherwise, alter firms might strategically manipulate their networks to increase
the benefits derived from them (Watts, 1999) by either terminating the disadvantageous
alliance with the broker or possibly seeking better collaboration opportunities within and
beyond the triad. In other words, for the brokerage triad to decay, the two alter firms must
be aware of each other’s existence and, subsequently, each other’s relationship with the
broker (Hahl, Kacperczyk, & Davis, 2016).
Lack of geographic proximity decreases the visibility of actors present in the
spatial milieu, reducing chance encounters (Blau, 1977; Hillier & Penn, 1991). Alter
firms might know so little about each other that they are less likely to discover that the
broker firm extracts a surplus from their relationships. Their lack of knowledge about
brokerage is likely to promote the continuity of the status quo in the broker-alter firm
triad. At the same time, the formal and informal interactions between broker and alter

81
firms decrease with geographic distance (Saxenian, 1996a), reducing the chances of
intentional or unintentional leaks of information regarding brokerage. Furthermore,
inventor mobility may be constrained by distance, making it less likely that a scientist
from the broker firm is hired by any of the alter firms (Almeida & Kogut, 1999; Almeida,
Dokko, & Rosenkopf, 2003; Breschi & Lissoni, 2009). In addition, spatially distant
broker and alter firms might not share the same industry and professional associations,
diminishing the possibility of knowing about the brokerage via a third party. Thus, distant
alter firms have little leeway to be cognizant of brokerage, enhancing the stability of the
brokerage triad.
Spatial barriers to the flow of information may seem to be at odds with recent
advances in electronic communication and high speed transportation. However, even
online networks have been shown to be spatially constrained (Liben-Nowell, Novak,
Kumar, Raghavan, & Tomkins, 2005). Goldenberg and Levy (2009) show that, though
the quantum leaps in the information technology have increased the total volume of
communication, local social ties have seen most of the increases in the communication
volume. Allen (2007) finds that the probability of communication between two product
development engineers decreases rapidly with growing distance between their offices.
Locational proximity enhances quick and dynamic feedback mechanism between actors
in which each party is aware of other’s world view (Nohria & Eccles, 1992), thereby
increasing the chances of brokerage detection and the likelihood of brokerage decay.

82
Search, monitoring, coordination, and communication costs. Furthermore, in
light of the well-established findings about the geographically-bounded nature of
knowledge (e.g. Almeida & Kogut, 1999), geography-induced information insulation
increases alter firms’ search costs. Such search costs would constrain firms’ ability to
obtain detailed information about each potential partner’s characteristics relevant for the
new alliance between them even when one alter firm is on the other’s radar (Geertz,
1978). This is even more so for knowledge-based alliances because of the uncertainty
inherent in R&D projects regarding their fruitful completion (Nicholson, Danzon, &
McCullough, 2005). In addition, each alter firm cannot ex ante share each other’s
knowledge to reduce the information uncertainty because doing so might itself
unintendedly reveal proprietary knowledge (Arrow, 1962; Kogut & Zander, 1993).
Geographic distance may also make the ex post monitoring of the partner’s opportunistic
behavior difficult or costly because of information asymmetry, increasing the hazard of
adverse selection in alliance partnering (Reuer & Lahiri, 2014).
Even when alter firms have perfect information about partner attributes, an alter
firm would strategically form a tie with the other unconnected alter firm to gain an
advantage over the broker only when the expected benefits of tie formation and
maintenance in terms of knowledge generation and transfer exceed the expected costs.
Seen through a geography lens, when alter firms form a tie with each other, not only do
they form a social relation but also they connect two different geographies within which
they are situated. There are extra coordination and communication costs to maintaining
83
such a tie that traverses distant geography over and above the costs of ‘regular’ tie
formation and maintenance. Increased geographic distance translates to increased travel
and transportation costs, increasing the costs of maintaining ties across geographies (Bell
& Zaheer, 2007).
More importantly, proximity leads to informal high quality communication
(Hagstrom, 1965). As much of the knowledge relevant for innovation is tacit, proximity
has an advantage in avoiding transmission loss via multiple face-to-face interactions
(Mok, Wellman, & Vasu, 2007). Saxenian (1996a) provides evidence for the relationship
between locational proximity and ease of interaction among knowledge workers in the
Silicon Valley, facilitating knowledge flow and improving their innovativeness relative to
those from Route 128. Thus, physical proximity allows for frequent, high quality
communication at low cost (Kraut, Egido, & Galegher, 1988).
Also, distance adds to the coordination time and the travel time of concerned
parties (Boeh & Beamish, 2012). Jeffrey Kalb, the founder of MasPar Computer
Corporation, in his interview with Saxenian (1996b: x) makes similar arguments: “It’s
not one thing, but if you spend lots of time on airplanes and on the phone, playing phone
tag, you can get an overall 20-30 percent slowdown in time to market.” Thus distance, in
general, increases the cost of tie formation because of coordination costs, reducing the
likelihood of decay.
Knowledge heterogeneity. Further, although prior research has pointed to the
existence of brokerage advantages for the broker firm, the persistence of brokerage

84
advantages is a more subtle and less studied idea. The persistence of brokerage benefits
stems from the continuing heterogeneity in alter knowledge bases, particularly between
alters that are geographically distant. Spatially distant alter firms may exhibit continued
knowledge base heterogeneity for two main reasons. First, alter firms separated by
geographic distance may face idiosyncratic situations arising from distinct local needs
and resource availability (Ahuja & Katila, 2004). Also, geographically separated alter
firms might pursue different trajectories for knowledge development in order to adapt to
differing local cultures, administrations, and economies (Ghemawat, 2001; Abernathy &
Utterback, 1978). Second, knowledge is sticky (von Hippel, 1994), and knowledge
spillovers, though possible, are localized or geographically bounded, with spillover
effects occurring in close geographic proximity to where the knowledge originated (Jaffe,
Trajtenberg & Henderson, 1993; Jaffe, 1989). This knowledge stickiness enables
knowledge diversity to persist between unconnected but distant alter firms. Such
knowledge diversity between broker and alters allows the broker to maintain continued
access to new knowledge over an extended period (Das & Teng, 2003), reducing the
possibility of hole decay.
In sum, geographic distance between alter firms enhances brokerage stability
because it becomes more likely that brokerage remains hidden from the eyes of alter
firms, because it is costly for alters to form a new tie, and because the broker maintains
continued access to knowledge diversity. Thus, I posit that
85
Hypothesis 4. Conditional on firms’ membership in a brokerage triad, the greater
the geographic distance of firms from one another in the brokerage triad, either
a) the geographic distance between alter firms, or b) the geographic distance
between a broker and the alters, the lower the likelihood that the brokerage triad
(structural hole) decays, and therefore, greater the triadic stability.
Membership in Different Communities and Brokerage Stability
Next I develop the rationale for brokerage stability when the brokerage triad’s
members are located in the same network community and conversely, instability when
they are located in different communities. Network communities or “networks within
networks” are mutually exclusive social collectivities with greater tie density within
structural groups than between them (Tatarynowicz et al., 2016). Communities are seen
as “mesolevel” structures that may exist between dyads and networks (Rowley, Greve,
Rao, Baum, & Shipilov, 2005). I use the term “communities” in the same way as
researchers have used “clusters” (Knoke, 2001; 2009), “constellations” (Lorenzoni &
Ornati, 1988), “blocks” (Zhang & Zhang, 2006), “cliques” (Wasserman & Faust, 1994)
and “groups” (Rowley, Baum, Shipilov, Greve, & Rao, 2004) in their analyses of social
systems. I base my theoretical explanation regarding the effect of triad members’
citizenship in both the same and different communities by drawing on recent research on
brokerage as a public good (Clement et al., 2017), the threat of community sanctions, and
the costs imposed by inter-community competition.

86
Brokerage as a public good. When brokers and alter firms are located in the same
community, they form part of a broader cohesive group. In such a group, dense
connections are reinforced by previous joint work experience and interactions (e.g. Singh,
2005).The structural disconnect of the community from other groups and non-group
members in the network structure results in the development of shared norms, language
and routines within the community that are quite different from those within other
communities. Community members identify themselves more as part of the community
than as part of the whole network (Knoke, 2009). They exhibit homophilous tendencies,
mostly limiting their search of opportunities and partners to those within community
boundaries (Gulati & Gargiulo, 1999, Ahuja, Polidoro, & Mitchell, 2009). In this vein,
community members are network neighbors (Paxton & Moody, 2003). Similar identities
and dense ties breed trust within the community (Rowley et al. 2005; Zaheer, McEviley,
& Perrone, 1998).
Seen through a community lens, in a cohesive group with an environment of
reciprocity, a broker might be more willing to share the surplus from brokerage with alter
firms within the network community than it would be had alter firms been located outside
its community. Extant work importantly points out that brokerage is in part a public good
(Fernandez-Mateo, 2007) in that its positive benefits might spill over to the broker’s
network neighborhood (Galunic, Ertug, & Gargiulo, 2012). The positive externalities thus
generated become more salient when alter firms are located within the same community
as the broker’s, especially in the knowledge creation contexts (Clement et al., 2017).

87
Since alter firms are able to tap into the brokerage benefits indirectly via community
linkages, the brokerage triad is less likely to decay.
Threat of sanctions. A cliquish structure among community members enables
more efficient governance and control for those within the group than those outside
(Coleman, 1988). The dense ties among community members and the ensuing social
monitoring weakens the insulation that the brokerage position provides in terms of
playing one alter firm against the other or reducing commitment to any party at will. In
this regard, a broker’s opportunistic behavior might not remain unsanctioned. In other
words, brokerage triad members’ location in the same network neighborhood creates a
reputational lock-in for the broker, reducing its chances of engaging in self-seeking
behavior (Greif, 1989). A related element of triad members’ positioning within the same
community is mutual dependence and a symbiotic relationship (Ryall & Sorenson, 2007;
Sytch et al., 2012). These factors also contribute toward making the triadic relationship
more equitable and, in turn, less likely to decay. The threat of sanctions, exclusion, and
mutual dependence result in keeping the brokerage triad stable.
Inter-community competition. In contrast, competition exists between
communities (Gomes-Casseres, 1994; 1996). In the case of brokerage triad members’
location in different communities, even though the alter firms might not be aware of each
other, they are wary of the broker because of its location in a different community,
affecting the broker’s maneuvering abilities. Intense competition between the broker
firm’s community and alter firm’s communities makes the broker’s task of managing

88
alters from multiple communities more challenging. In this regard, the broker firm’s
embeddedness in a different community might add to the tension the broker already faces
by virtue of spanning a brokerage position between two competing alters. The broker
firm might find itself entangled among the norms and standards of the multiple
communities in which its alters are positioned, affecting its control benefits. Alter firms
are more likely to challenge the broker’s authoritative position which does not derive
from alter firms’ community norms. Thus, alter firms from different communities are
more likely to engage in opportunistic behavior, increasing the cost of maintaining a
brokerage relationship. In the extreme case community authority might trump the
broker’s authority, and the broker’s ability to benefit from being connected to two
unconnected alters might be marred by community-level competition and the ensuing
mistrust. Thus, the location of brokerage triad members in different network communities
makes the cost of maintaining the brokerage relationship excessive, prompting a
breakdown of the brokerage structure. Hence,
Hypothesis 5. Conditional on firms’ membership in a brokerage triad, the
brokerage triad firms’ (broker and alter firms’) membership in different network
communities increases the likelihood of brokerage triad (structural hole) decay,
thereby decreasing triadic stability.
89
METHODS
Data and Sample
Some discussions in this section are repetitions from Chapter 2. However, I
briefly reprise them here to maintain the flow in the story. I use the global pharmaceutical
industry context with 4-digit SIC codes (2833: Medicinal chemicals; 2834:
Pharmaceutical preparations; 2835: Diagnostic substance; 2836: Other biological
products) to test my hypotheses. Pharmaceutical companies invest between $1.5 billion to
$1.8 billion in R&D for a successful drug (DiMasi, Hansen, & Grabowski, 2008) and yet
it takes 10-15 years to successfully develop one (PhRMA, 2013). According to the U.S.
Food and Drug Administration (FDA, 2015), “…only 5 in 5,000 compounds that enter
preclinical testing make it to human testing, and only 1 of those 5 may be safe and
effective enough to reach pharmacy shelves.” Finding a new molecule entails spanning
diverse disciplines as chemistry, biology, and clinical studies (Loging, Harland, &
Williams-Jones, 2007). Under such circumstances it is difficult for any pharmaceutical
firm to undertake the entire discovery project by itself. Alliances, mostly in R&D, are
commonplace in the pharmaceutical industry (Hoang & Rothaermel, 2005), enabling me
to create the alliance brokerage network and extract structural hole triads.
Starting with the Thomson Reuters SDC Platinum database on joint ventures and
alliances, I chose both public and private firms in the global pharmaceutical industry with
at least one alliance announced between 1980 and 2005. Alliances were rare prior to
1980, thus alleviating left censoring bias. I used archival databases such as Factiva,
90
LexisNexis, and SEC-EDGAR to further supplement this information. Next, I set the
network boundary using two criteria (Laumann, Marsden, & Prensky, 1989; Gulati,
1995b). First, both alliance partners must belong to the pharmaceutical industry (Rowley,
Behrens, & Krackhardt, 2000). Second, I required that the alliance context must be
pharmaceutical as determined by its primary four-digit SIC code. I used all alliances
types because any type of alliance relationship might contribute to knowledge transfer
(Schilling & Phelps, 2007). Next, I aggregated the alliance information for all
subsidiaries (at least 50% stock ownership) at the ultimate parent level, and further
adjusted for name changes, mergers and acquisitions, and restructuring using numerous
databases such as Lexis Nexis Corporate Affiliations, Dun & Bradstreet’s Who Owns
Whom, Pharma & MedTech Business Intelligence, Bloomberg, and Thomson Reuters
SDC Platinum Mergers & Acquisitions databases.
To compute alliances’ termination dates, I created a master dataset with detailed
information on alliance deals by combining archival data from multiple sources such as
Factiva, LexisNexis, NASDAQ - Datastore, Bloomberg Professional Terminal, SEC-
EDGAR, and Mergent Online. In addition, I used trade magazines and journals such as
Chemical marketing reporter and Japan Chemical Week; news sources such as Dow
Jones News Service, PR Newswire, BioCentury, PharmaTimes, Strategic Transactions ::
Pharma & Medtech Business Intelligence, and Pharmaceutical Online; and firm
websites. This comprehensive data collection effort helped me drop those alliances that
were announced but did not come to fruition. Also, in case of alliances with multiple

91
partners, it allowed me to delineate whether all of the partners involved had alliances
with each other or just one firm had alliance with all others. Next, I derived termination
dates using a multi-pronged strategy described below.
First, I identified alliance termination dates which were explicitly mentioned in
my deal master dataset. I further searched for alliance extensions or new alliances in
these cases to ascertain when the relationship between two partners actually ended.
Second, in case of open-ended alliances, a majority in my context, with no predetermined
termination dates, I engaged in a deep web search using multiple variants of the word
“end,” “termination,” “dissolve,” “complete,” “break,” “leave,” “withdraw,” along with
partners’ names with or without drug or disease names and, in addition, accounted for
any alliance extensions or additions between partners. It was relatively easy to search for
joint venture termination dates using their names as stated in the deal (Ahuja, 2000).
Third, from my master dataset with deal texts, I identified drug names, brands and
formulations, key pharmaceutical compounds, and disease and used them as search
queries in additional databases such as Adis Insight, treating the date of discontinuation of
a drug or trial by the firm as the alliance termination date if the partners did not form any
new alliance. Fourth, I followed the alliance progress using Factiva, company annual
reports, and SEC filings until these sources stopped mentioning the deal, which then I
record as its termination year. I did not follow this approach when these databases
discussed alliances in only one year without any explicit mention of termination news.
Fifth, I tracked mergers and acquisitions as well as structural reorganizations, and

92
revalidated the alliance’s existence if the new partners continued with the prior
relationship. Sixth, I scanned important life events such as NASDAQ listings and CEO
interviews post award-winning to find deal termination dates. My search followed a
sequential process in that I moved to the next step only when I was not able to find
termination data in the previous step.
Next, based on alliance duration from my termination dataset, for each year I
created symmetric adjacency matrices or networks of alliance ties. From the network thus
created, I extracted structural hole or brokerage triads using a hand-written code in
STATA 13. The results were further validated using Pajek64 4.02. To illustrate by an
example, I evaluate in Figure 4 whether firm B is a broker or not from B’s ego-network
using two different scenarios, 1 and 2. As seen in the figure, in scenario 1, all the alter
firms, A, C, and D, are connected with each other. Hence, firm B is not a broker firm and
will not appear in my final observation. In contrast, in scenario 2, B is a broker because B
spans two open triads ABC and ABD respectively.
Then, I collected data on latitudes and longitudes of all member firms of structural
hole triads to calculate geographic distances. Using firms’ exact addresses, I employed
geocoding to retrieve the latitude and longitude via the Google Geocoding Application
Program Interface. For cases in which the geocoding algorithm did not provide exact
latitude and longitude or only provided location degrees at the country level, I further
hand collected the data inputting firms’ complete addresses in Google maps. In all, my
final sample with complete information on the independent variables consists of 17,212

93
unique brokerage triads with 61,495 triad-year observations involving 329 broker firms
and 680 alter firms over a 21-year period.
Dependent Variable
Decay. My dependent variable Decay is a dummy. Recall that I consider a
brokerage triad to be stable if both the membership of the triad and the linkages among
the triad members stay the same for a certain duration t. As can be seen in Figure 5, the
brokerage triad BAC is stable at time t1 and at t2 because broker firm A continues to
connect to the same unconnected alters B and C, with no change in relationships among
A, B, and C during these two periods. I assign a value of 0 to the dummy if the brokerage
triad appeared for the first time for a particular year. For other years, the dummy retains
the value of zero if the triad appears consecutively in each year since its first appearance.
The triad decays if either its members do not continue the existing relationship or its
unconnected members form a new relationship between them in the next year. I
operationalize Decay as 1 for the year in which the triad decays. To minimize potential
simultaneity, I lag my explanatory variables by one year.
Independent Variables
Alter-alter geographic distance (in thousand miles). I used the spherical law of
cosines formula to calculate the great-circle distance between the two alter firms’
subsidiaries (or the alter firm themselves) which had an alliance with a common broker
firm at time t (Sorenson & Audia, 2000; Funk, 2014; Reuer & Lahiri, 2014).

94
distancepqt=R{arccos[ sin(latpt) sin(latqt) +
cos (latpt
) cos(latqt) cos(longqt
- longpt
)]}
where R =3,956.54 miles is the radius of the earth; latpt and latqt denote latitudes in
radians of the alter firms i and j at time t indirectly connected via a common broker firm;
and longpt and longqt denote longitudes in radians of the alter firms i and j at time t. I
averaged the distance obtained to calculate an aggregate measure of geographic distance
at the ultimate parent level between alter firms i and j at time t. I then divided the
measure by one thousand to obtain the final score in units of thousand miles.
Broker-alter geographic distance (in thousand miles). I used the spherical law of
cosines formula to calculate the great-circle distance between the broker firm’s and each
of the alter firms’ subsidiaries or the firms themselves, whichever was directly involved
in the alliance at time t. Next, I averaged these distances to obtain the distance between
the broker firm and the first alter firm and the distance between the broker firm and the
second alter firm. I then take the mean of these two distances and divide it by a thousand
to obtain my ultimate measure of geographic distance between the broker and alter firms
in thousand mile units.
Different community. I used the community detection method proposed by
Girvan and Newman (2002) and Newman and Girvan (2004) to detect communities and
define modularity M as ∑ (dii-{drandomii})i , where dii is the fraction of ties within the i
th
community and drandomii is the expected fraction of ties within communities using another
95
network with the same number of communities and with the same tie distribution but
with a random connection between nodes (firms). M = 0 indicates that fraction of within-
community ties in the observed network are not different from the expected fraction if the
same quantity in a random network whereas M = 1 suggests a strong community. I then
use the Guimera and Amaral’s (2005) simulated annealing optimization algorithm to find
the partition of firms into communities such that M has the largest value. Recent studies
have used the same approach to detect communities (e.g., Gulati, Sytch, & Tatarynowicz,
2012; Sytch et al., 2012; Tatarynowicz et al., 2016). Next, I code this measure as 1 if all
the three members of the structural hole triad pertain to different communites and 0
otherwise.
Control Variables
Alters’ brokerage experience. I measure the sum of the number of brokerage
triads spanned by the two alter firms before year t for Alters’ brokerage experience
because the structural hole spanning could enhance the ability of alter firms to identify
brokerage relations. The alter firm’s acquaintance with the existence of structural holes
determines whether it would act to reduce the structural benefits reaped by the broker
firm (Hahl et al., 2016). How the alter firm’s managers create mental maps of actual
networks affects the bargaining posture they adopt against the broker firm’s managers
(Krackhardt, 1987; 1990).
Alter-alter past ties. I next control for Alter-alter past ties because alter firms
might know one another because of their past alliances by aggregating all alliances

96
between the two alter firms of a structural hole triad before time t (Levin, Walter, &
Murnighan, 2011). Not controlling for this variable might misattribute structural hole
instability from past alliances to the geographic distance.
Alter-alter knowledge difference. I capture Alter-alter knowledge difference until
time t with the Jaccard coefficient (Yayavaram & Ahuja, 2008) using the formula
1-| Subclassalter1 ∩ Subclassalter2 |
| Subclassalter1 ∪ Subclassalter2 | , where Subclassalter1 and Subclassalter2 are the unique
pharmaceutical patent subclasses that each alter firm patented in until the observation
year t.
Alters’ status difference. In year t, I next control for Alters’ status difference in a
triad using the differences in Bonacich centrality (normalized) (Bonacich, 1972).
Broker's normalized degree. To proxy for the broker firm’s influence in the
overall network, which might influence the number of alternatives available to the broker
and also its power over the alter firms, I use Broker’s normalized degree centrality
(Freeman, 1978). I next control for the number of structural holes spanned by the broker
firm at time t.
Broker’s lack of constraint. I use the Burt’s (1992) constraint measure with
Zaheer and Bell’s (2005) transformation for Broker’s lack of constraint. This measure
captures the autonomy the broker firm has in managing the relationship.
Broker-alter past ties. This measure captures the strength or intensity of
relationships between the broker and alter firm. Strong relationships engender trust

97
(Granovetter, 1973; Brass, Butterfield, & Skaggs, 1998), increasing the opportunity for
the closing of the structural hole or at least less exploitation of surplus by the broker.
First, I measure the number of past alliances between the broker and alter firm 1 and also
the broker and alter firm 2 before time t. Second, I multiply both the values to calculate
the effect of transitivity (Fleming, Mingo, & Chen, 2007).
Broker-alter status difference. I account for the status difference between the
broker firm and each of the alter firms in a triad, Broker-alter status difference, using the
differences in normalized Bonacich centrality (Bonacich, 1972) and taking the mean of
the two differences for the year t.
Broker-alter knowledge difference. I measure Broker-alter knowledge difference
using the Jaccard coefficient (Yayavaram & Ahuja, 2008)
1-| Subclassbroker ∩ (Subclassalter1 ∪ Subclassalter2) |
| Subclassbroker∪ (Subclassalter1 ∪ Subclassalter2) | , where Subclass refers to the unique
pharmaceutical subclasses in which each of the three broker and alter firms patented until
time t.
# of same country dyads. This variable takes a value of 3 if all the three members
of the structural hole triad or their subsidiaries, whichever is directly responsible for the
alliance, belong to the same country because when the triad’s firms are in different
countries, the effects of geography are likely to be stronger. Zero reflects all the members
are located in different countries.

98
# of same SIC dyads. This measure captures the influence of different sub-
industries using this variable. It takes a maximum value of 3 when all the three members
of the brokerage triad operate in the same 4-digit SIC codes, and 0 when none of them
share the same sub-industry.
Triad main component membership. For this variable, I assign a value of 1 to
this dummy variable if all the three broker and alter firms belong to the main component
of the network. Membership in the main component might make it easier for partners to
collaborate and access information, reducing the likelihood of brokerage persistence
(Dahlander & McFarland, 2013).
Model Estimation
I use discrete-time survival method for non-repeated events to empirically test my
hypotheses (Allison, 1982). My event of interest, decay or “death” of the brokerage triad,
is non-repeated in that it occurs only once over the life span of the brokerage triad. In
case of non-repeated events, I do not need any correction for non-independence of
observations for the same brokerage triad (D’ Agostino, Lee, Belanger, Cupples,
Anderson, & Kannel, 1990).
Although a continuous-time proportional hazards model could represent the
underlying data generating process for my estimation sample, I do not have the exact
dates of alliance termination but I do have exact years. In other words, although the
survival time might be continuous, I observe it in (yearly) intervals. Also, for the same
year, I have multiple terminations (Ryu, 1994). In such cases, discrete time survival

99
models are more appropriate than their continuous time counterparts (Allison, 2014).
Under such circumstances, a complementary log-log discrete time survival model is
identically equal to the continuous time Cox proportional hazards model (Allison, 1982).
Also, this model is more robust to the choice of interval length whereas a logit model
changes significantly with the selection of the interval, say triad-years versus triad-
months, making the coefficients from different interval choices incomparable (Allison,
2010).
The complementary log-log model is preferred to logit or probit models in the
case of events in which either failures (deaths) or successes (continuity) are rare (Powers
& Xie, 2000). In other words, the model is suitable when the response variable, y, has a
skewed distribution, with a high percentage of either 1’s or 0’s in the estimation sample
(Cameron & Trivedi, 2010). My estimation sample has 85.57 percent decay cases (14,453
events). Thus, my data exhibits asymmetry. In contrast to the logit or probit models, the
complementary log-log links are asymmetric in that, for hjt (y = 1 | x) = 0.5, the change in
hazard when a covariate x increases by a given amount is different from the change when
the covariate decreases by the same amount (Long, 1997).
In the complementary log-log model, ht (y = 1 | x) = F(Xit β), F(Xit β) is the
cumulative distribution function of the extreme value distribution (Cameron & Trivedi,
2005). An extreme value distribution is the limiting (asymptotic) distribution for the
maximum or the minimum of an extremely large number of random observations drawn
from the same user-specified distribution. I estimate the hazard of brokerage instability

100
using the following complementary log-log regression model. log{- log(1-ht)} = αt+Xitβ,
where ht refers to the hazard of brokerage decay at time t; αt are the survival time period
dummies; and Xit is the set of independent variables including controls and a constant.
Results
Table 4 presents the descriptive statistics and the bivariate correlation matrix for
explanatory variables and controls. The mean variance inflation factor (VIF) for the
variables is 2.27, and none of the variables exceed the VIF limit of 10, suggesting no
significant multicollinearity concerns (Belsey, Kuh, & Welsch, 1980). In Table 5, I
present the results of the discrete time complementary log-log survival model. Model 1 is
my baseline model with only control variables. Next, I add my main theoretical variables
of interest in Models 2, 3, and 4, with Model 4 being my full model.
As predicted in H4a, I see in Model 4 of Table 5 that as the Alter-alter geographic
distance increases by one standard deviation, the hazard of brokerage decay decreases by
9.31 percent (b = -0.04, p = 0.00), keeping other variables constant. Likewise, consistent
with H4b, a one standard deviation increase in the Broker-alter geographic distance
decreases the hazard of decay by 8.85 percent (Model 4: b = -0.05, p = 0.00), thus
providing support for H4b, holding other variables constant at their respective values.
Consistent with H5 about the brokerage triad’s partners’ locations in different
communities, I find that the broker and alter firms’ membership in different communities
increases the hazard of decay by 8.42 percent (Model 4: b = 0.08, p = 0.00).

101
Robustness Checks
My specification of the discrete-time survival model is equivalent to the Cox
proportional hazard model. However, my results are robust to discrete-time equivalent of
exponential, Gompertz, and Weibull models for continuous survival time data. I also ran
a discrete-time survival regression using logistic regression and found similar results
(results available upon request).
I further investigate whether my hypothesized effects change over time. I adopt
two approaches. First, I interacted my independent variables with a continuous measure
of the age of the brokerage (results available upon request). I do not find enough evidence
to reject the null that the effects of Alter-alter geographic distance and the Broker-alter
geographic distance do not vary over time (b = 0.00, p = 0.31; b = 0.00, p = 0.66),
keeping other variables constant. This suggests that knowledge transfer across
geographies remains an issue even with the passage of time. However, the effect of
broker and alter firms’ membership in different communities decreases by a factor of
0.97 for each unit increase in brokerage age. In other words, membership in different
communities reduces the hazard of decay by 2.76 percent as the brokerage age increases
by one year (b = -0.03, p = 0.00). It could be that with time, brokerage across different
communities stabilizes due to the generation of trust between the alter firms and the
broker firm.
Second, I interacted my independent variables with age dummies (results
available upon request). In this case I do not find enough evidence to suggest that

102
brokerage across different communities stabilizes over time. Since I did not find
consistent results across both the approaches, I did not include this interaction in my main
model.
I further tested the robustness of my dependent variable using three alternate
measures of decay. As shown in Figure 6, a brokerage triad can decay or become
unstable (or end) in three different ways. First, in dissolution, either or both of the
existing ties might dissolve. Second, bypassing the broker, the two alter firms might sever
ties with it and form a tie between themselves leading to the broker’s disintermediation.
Lastly, the alter firms might connect with each other while maintaining their relationships
with the broker, resulting in triadic closure.
I assign a value of 0 to the dummy Dissolution if the brokerage triad appeared for
the first time for a particular year and for other consecutive years, if the relationships
continue. The triad dissolves if the broker firm does not partner with either of the alter
firms or vice versa. I operationalize Dissolution as 1 for the year in which the triad
dissipates. I follow the brokerage triad over its life span and use a dummy code of 1 for
Disintermediation to indicate whether the two alter firms connect while dissolving their
tie with or cutting out the broker firm. Likewise, I use a dummy variable to capture the
brokerage triad dissipation via Closure in which two unconnected alter firms connect
while ties with the broker firm stays intact. Closure is coded as 1 for the year in which
the two alter firms form a tie.

103
To test my hypotheses using these three alternative decay measures, I use
discrete-time survival method for non-repeated events of multiple kinds (Allison, 1982).
My event has multiple kinds in that the brokerage triad can decay via dissolution,
disintermediation or closure. My estimation sample comprises of both high-frequency
events (Dissolution – 83.97 percent) and rare events (Disintermediation – 0.57 percent;
Closure – 1.03 percent). Logit models underestimate the probability of rare events (King
& Zeng, 2001). Prior research has used complementary models in the context of extreme
events, highly-frequent or rare (Coff, 2003; Barthélemy, 2017). Similar to my main
model, I estimate the hazard of brokerage instability using the following complementary
log-log regression model log{- log(1-hjt)} = αt+Xitβ, where hjt refers to the three different
hazards of brokerage triad dissolution, disintermediation and closure at time t.
The hazards of dissolution, disintermediation and closure are competing risks
because the decay or death of brokerage triad because of any one type of event, for
example by disintermediation, means that the triad is no longer at risk of other types of
events such as closure, and vice versa. Similar to the continuous time survival models for
competing risks, it is possible to use separate analyses for each type of termination (three
in my case), treating the other types as censored, if we assume that censoring for other
termination types occurs at the beginning of the year in which brokerage triads end
(Allison, 1982; Jenkins, 2005). The maximum likelihood estimator thus generated is
consistent and asymptotically normal (Anderson, 1980). Though it might not be as fully
efficient as a multinomial logit estimator, the estimator consistently estimates the true

104
standard errors (Allison, 1982). Also, the presence of rare events might make the
multinomial logit estimation difficult.
Table 6 shows the estimates of the discrete time complementary log-log survival
model. As Model 5 indicates, a one standard deviation increase in the Alter-alter
geographic distance decreases the hazard of brokerage triad Dissolution by 9.01 percent
(b = -0.04, p = 0.00), keeping other variables constant. Likewise, the hazard of
disintermediation reduces by 21.72 percent (Model 6: b = -0.09, p = 0.05) with a one
standard deviation increase in the Alter-alter geographic distance. Similarly, as the Alter-
alter geographic distance increases by one standard deviation, the hazard of brokerage
triad closure reduces by 22.54 percent (Model 7: b = -0.10, p = 0.01). Thus, the Alter-
alter geographic distance significantly reduces the hazard of decay in all three
operationalizations of the decay measure, namely dissolution, disintermediation, and
closure. Overall, these results are consistent with my principal finding.
Next, as seen in Model 5, a one standard deviation increase in the Broker-alter
geographic distance decreases the hazard of brokerage triad Dissolution by 8.26 percent
(b = -0.05, p = 0.00), holding other variables constant at their respective values.
Similarly, I find that as the Broker-alter geographic distance increases by one standard
deviation, the hazard of disintermediation reduces by 50.55 percent (Model 6: b = -0.39,
p = 0.00), also consistent with my main finding. However, the results from Model 7 do
not provide enough evidence to reject the implied null hypothesis of no significant
relationship between Broker-alter geographic distance and the risk of brokerage triad

105
closure although the (negative) sign is in the right direction (b = -0.05, p = 0.33). Thus,
the Broker-alter geographic distance significantly decreases the hazard of decay in all
operationalizations except for Closure which has a negative but non-significant effect,
mostly supporting my principal results.
Model 5 shows that the broker and alter firms’ membership in different
communities increases the hazard of brokerage triad Dissolution by 7.83 percent (b =
0.08, p = 0.00), providing clear support for H5. Similarly, I find that Different community
increases the hazard of brokerage disintermediation by 60.76 percent using two-sided
10% significance level, providing mild support for H5 (Model 6: b = 0.47, p = 0.06). The
results from Model 7 are not significant (b = 0.21, p = 0.25), although the positive sign is
in the hypothesized direction. Thus, the effect of location of triad members in different
communities finds generally consistent support across the three operationalizations of the
decay measure, with the postulated relationship supported for Dissolution, mildly
supported for Disintermediation, and although the sign is in the right direction, not
statistically significant for Closure. At the same time, I note that when I used the
combined measure of decay in my main analysis, my results unambiguously support the
hypothesis (H5), likely because the combined effects of dissolution and disintermediation
are far stronger than those of closure.
As a further robustness test, I fit the three main models for Dissolution,
Disintermediation, and Closure (Models 5, 6 and 7) simultaneously using the generalized
structural equation estimator (Rabe-Hesketh, Skrondal, & Pickles, 2004). The model

106
assumes a common latent variable affecting all three dependent variables. I get virtually
identical results as regards the direction and significance of the postulated effects (results
on request).
One could argue that, in contrast to Closure, Dissolution and Disintermediation
are similar in nature because in both the cases the broker firm is not in the picture and ties
with respect to the broker does not exist. I re-estimate the discrete time complementary
log-log survival model using a new dependent variable, Death, which takes a value of 1
in the event of either Dissolution or Disintermediation. My results hold (results not
reported for brevity). As predicted in H4a, as the Alter-alter geographic distance
increases by one standard deviation, the hazard of brokerage Death decreases by 9.14
percent (b = -0.04, p = 0.00), keeping other variables constant. Likewise, a one standard
deviation increase in the Broker-alter geographic distance decreases the hazard of decay
by 8.78 percent (b = -0.05, p = 0.00), thus providing further support for H4b, holding
other variables constant at their respective values. In relation to the brokerage triad’s
partners’ locations in different communities, I find that the broker and alter firms’
membership in different communities increases the hazard of decay by 8.16 percent (b =
0.08, p = 0.00), consistent with H5.
SUMMARY
In this chapter I examine the evolution of brokerage, especially its persistence or
its decay, by delving more deeply into the embeddedness of (brokerage) triad members in
geographic, and also network, space. As hypothesized, my results show that geographic

107
distance, either between the alters, or between the broker and the alters, promotes the
persistence of brokerage structures, thereby highlighting the importance of the spatial
embeddedness of network ties. More to the point, when the network tie comprises of the
flow of knowledge resources between alliance partners in a network, the role of distance
matters greatly, given the sensitivity of the flows of information, particularly that of a
tacit nature, across geographic distance.
Interestingly, my supplementary analyses breaking down the construct of
brokerage decay show that for alter-alter distance, structural holes are least likely to
terminate through closure or disintermediation but comparatively more likely to terminate
through dissolution (even though the overall effect for dissolution is also negative). The
findings suggest that greater distance between the alters imposes greater costs of tie
formation between them, either for a disintermediating tie or a closure tie, thereby
skewing the pattern of brokerage evolution away from direct alter ties and toward a
breakdown of the tie. For broker-alter distance, termination through disintermediation is
least likely, partially mirroring the results for alter-alter distance, but suggesting that
when the true nature of brokerage is less accessible to the alters, alter firms also find it
harder to find common ground with each other and form a direct disintermediating tie.
However, they are comparatively likelier to terminate their tie with the broker through
dissolution (even though the effect is negative, or less likely overall). Future research
might examine the contingencies which govern when and why one form of brokerage
termination is less frequent than another.
108
My hypothesis on the impact on persistence of the presence of the triad’s
members in the same or different network communities also found clean support. The
results suggest that the location of the triad’s members within the same community may
attenuate the broker’s self-seeking behavior, lowering the incentives for and the
likelihood of brokerage decay. At the same time, when the triad’s members are located in
different network communities, inter-community competition and greater costs of
spanning community boundaries limit the value from brokerage, prompting brokerage
decay. Interestingly, in light of my first set of results on the enhanced stability of
brokerage from geographic distance, these results might seem counter-intuitive if
network communities are viewed as synonymous with geographic clusters. However, my
results also highlight the essential distinction between network communities and
geographic clusters, playing up the countervailing mechanisms that operate in networks
to maintain stability. However, the mechanisms that promote persistence are quite
different in geographic clusters.
Some research in economic geography hints at how and why the seemingly
counterintuitive results might have come about. Ter Wal and Boschma (2009) suggest
that the assumptions of the geographic cluster literature may not map onto networks
because just by virtue of being in the same geographic cluster, firms are not necessary
connected to one another, and therefore not in the same network community. Thus, when
in the same geographic cluster, firms are only connected to one another through unevenly
distributed networks. My results regarding the stability of brokerage in network
109
communities also supports recent work that brokers may not only be ‘playing nice’ when
they are present in the same network community as their alters but through externalities
may also be sharing the fruits of brokerage more broadly.
In my supplementary analyses splitting apart the decay construct into three
component parts for the network community effects on stability I found, as expected,
statistically significant results for dissolution, suggesting that brokerage termination was
more likely when the triad’s partners were located in different communities. The results
regarding the greater likelihood of disintermediation when partners are located in
different communities are weakly supported, suggesting that brokerage or triadic decay
through alters connecting directly is hampered by the excessive costs of traversing
community boundaries.
My study is not without limitations. I assume that the technological knowledge
attributes do not change over time, or at least change only proportionately, and hence, the
effect of geographic proximity on knowledge transfer is always along the same direction.
To the extent that knowledge characteristics evolve differently over time and the effect of
geographic distance is contingent on how these properties evolve, my conclusions could
be weakened. In addition, it could be that my geographic distance construct is a crude
measure of the underlying differences in time zones, differences in language and
differences in countries. In this regard, future work could explore the black box of
geographic distance. Nevertheless, to the extent that # of same country dyads controls for
such differences, my hypothesized effects can be attributed to geographic distance.

110

111
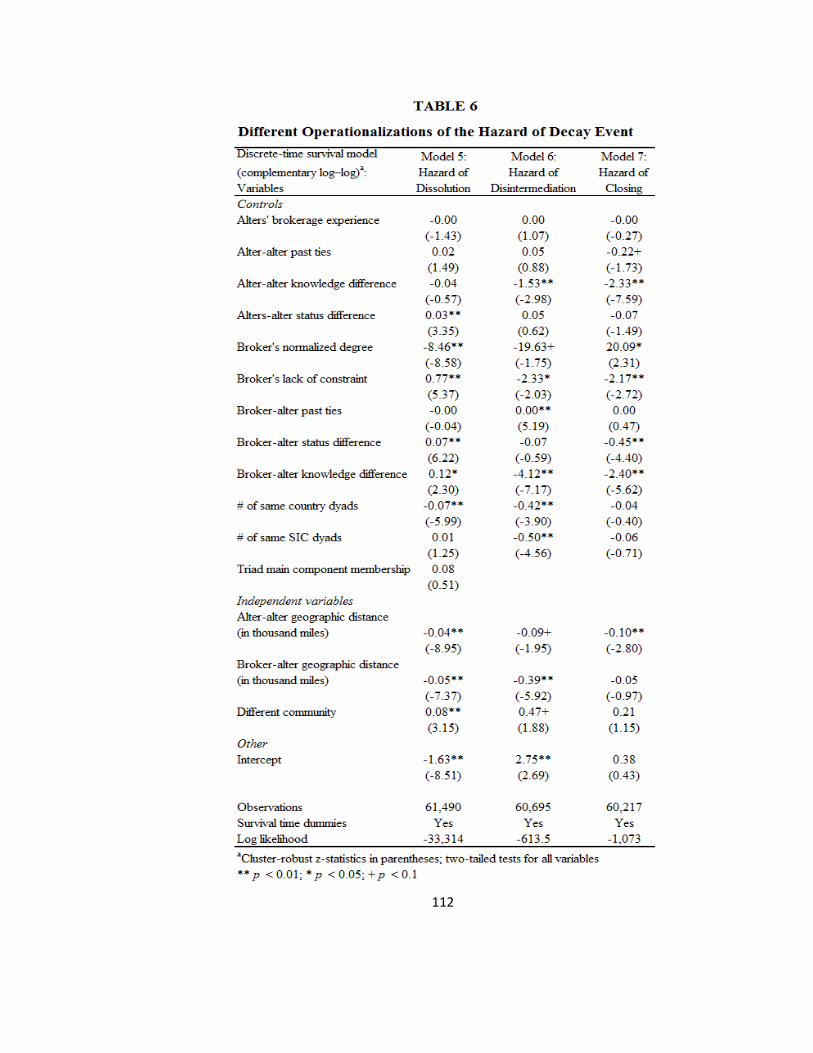
112
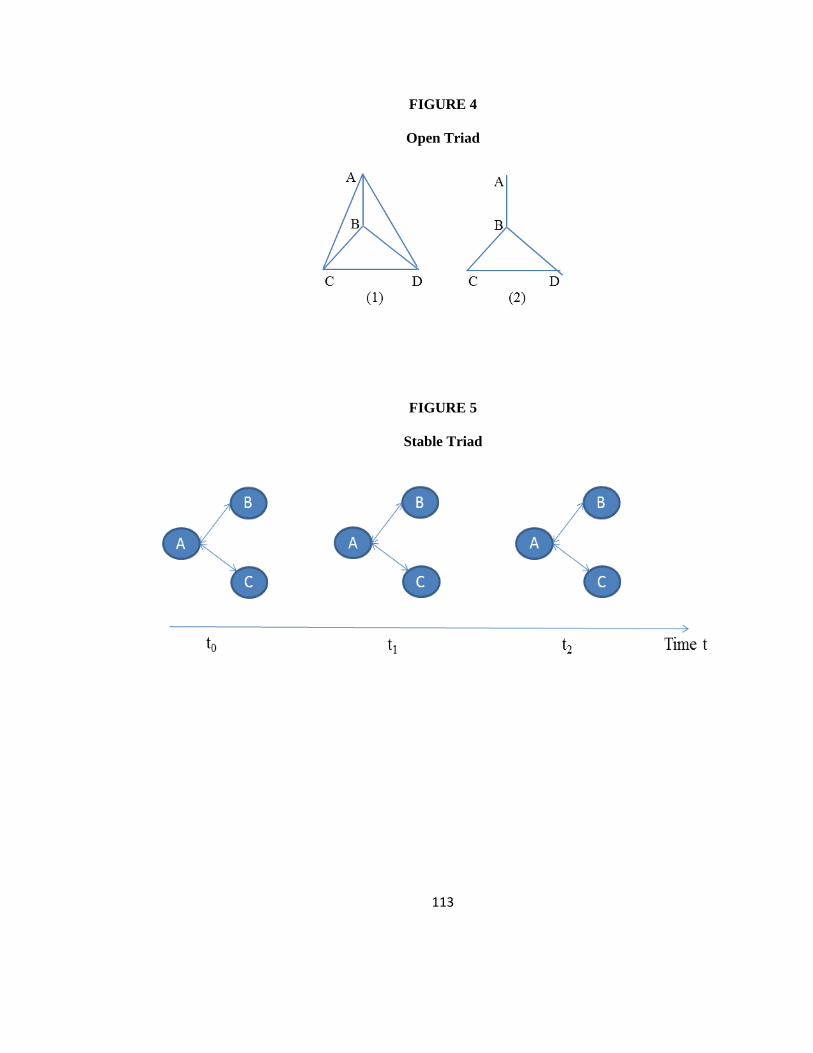
113
FIGURE 4
Open Triad
FIGURE 5
Stable Triad

114
FIGURE 6
Different Types of Decay Events
115
CHAPTER 4
Conclusion
This dissertation focuses on first the consequences and second the antecedents of
network stability. I find that ego-network stability negatively affects the focal firm’s
innovation performance because knowledge is more difficult to retrieve over time,
because the focal firm faces relational lock-in, and because knowledge becomes
redundant in stable networks, thus reducing the overall knowledge heterogeneity in the
firm’s network resources. Spanning structural holes mitigates this negative effect because
holes allow the focal firm to access diversity and timely knowledge. In contrast, the focal
firm’s geographic concentration of inventive activities increases the negative effect of
stability because of the lack of diversity in knowledge environments.
My work speaks to the extensive debate on the innovation value of network-
structure configurations. Though most studies acknowledge that innovation benefits
accrue from open network configurations, i.e., structural holes, both at the inter-firm level
(e.g., Zaheer & Bell, 2005) and at the level of individuals (e.g., Tortoriello & Krackhardt,
2010), some studies have shown the contrary (e.g., Ahuja, 2000). In view of conflicting
results, research has shifted focus to either conditioning variables (e.g., Tan, Zhang, &
Wang, 2015) or hybrid positions that emphasize both structural holes and closure
occurring together (e.g., Baum, van Liere, & Rowley, 2007) to better understand the
relationship between structure and innovation performance. Yet, studies analyzing the
structural determinants of innovation performance have focused mostly on the outcomes
of variations in the configuration of network structures. In that case, not taking ego-

116
network stability into consideration might render empirical models that study the
relationship between network structure and performance underspecified because stability
may be acting as an unobserved variable.
The possibility that stable network structures can get stale and ossified raises an
important question about its implications for network renewal and performance. As firms
evolve their networks, what structures should be retained and what types need to be
reconstituted in order to maintain the highest levels of ego-network performance?
Further, the creation and deletion of network ties, particularly at the interfirm level, are
hardly costless. In this regard, there clearly exists a trade-off between the cost of network
change and its declining innovation value over time. Put another way, at the limit firms,
in order to keep innovation high, may be spending too much in the process of changing
network partners. At the same time, given that firms are known to get locked in with
unproductive partners over time, and alliances may persist beyond their useful life
(Inkpen & Ross, 2001), the challenge of dynamically maintaining an optimally
innovative network presents both an empirical and a substantive opportunity. In sum,
future research examining the dynamics of superior network performance would be
worthwhile.
Another interesting area for future research would be to examine how ego-
network stability, or the stability of a basic network building block, affects the stability of
global network structures and properties such as small-worldliness, overall connectivity,
and centrality. In other words, examining the link between local and global network
stability may produce important insights if the effects are super-additive or substitutive.

117
In this regard, Palla, Barabási and Vicsek’s (2007) work on the stability of network
communities provides a useful exemplar, suggesting that the relationship between local
and global stability varies with network size.
In this essay, controlling for knowledge-based and equity-based alliances, I
assume that relevant knowledge for innovation might come from any type of alliance.
Future studies could further refine our understanding of stability by classifying the
network of relationships based on different activities in the alliance value chain such as
upstream (e.g., research) relationships and downstream (commercialization) relationships
(Stuart, Ozdemir, & Ding, 2007). Research could investigate, for example, if the
innovation effects of stability are the same for these classifications or would a mix of
“unstable” upstream and “stable” downstream ego-network relationships provide the best
recipe for innovation?
In the follow-up essay of my dissertation, I study the origins of stability by
examining the evolution of brokerage, especially its persistence or its decay, by delving
more deeply into the embeddedness of (brokerage) triad members in geographic, and also
network, space. My study elucidates how spatial and community embeddedness at the
macro level influences firms’ behavior at the micro nodal level, affecting the persistence
of brokerage structures. In addition, my focus on the triad for theoretical exposition
underscores the role of collective agency in the context of network longevity and
reorganization. Embeddedness, both geographic and social, may heterogeneously affect
the individual agency of different members in the triad members as regards the
continuity, or lack thereof, of brokerage. The net effect of these individual agencies and

118
their interactions determines the life expectancy of existing brokerage structures. Given
that brokerage structures have been shown to exert such significant effects in alliance
networks, my study becomes salient from both theoretical and empirical perspectives.
I extend recent work on network dynamics by studying the end of brokerage.
Though we know much about network formation (e.g., Gulati & Gargiulo, 1999; Zaheer
& Soda, 2009), little is known about the mechanisms underlying the persistence, and
subsequent termination of, network structures. My emphasis on network structure
termination derives from my belief that, though termination and genesis may seem
different as they pertain to different stages in the life cycle of a network structure, both
could actually be two sides of the same coin. Specifically, knowledge of both yields a
rich picture of network reorganization and change. For example, brokerage decay through
disintermediation or closure that results in the ending of a brokerage structure also marks
the genesis of a new tie between network members, implying thereby the need for a more
holistic study of network reorganization and evolution. Similarly, if we take a Penrosian
view of network relationships as evolving in response to endogenous resource creation by
firms in alliances, then structural hole dissolution might result in a new tie formation with
firms outside of the existing brokerage triad, catalyzing network change. Thus, my
research on brokerage termination is relevant for a more complete understanding of the
genesis, and evolution, of networks.
My theorizing about stability also adds critical nuance to the research on strategic
alliances. This study suggests that the fundamental unit to understand alliance learning
and management may be the ego network or triad and not the dyad, providing support for
119
recent work that views alliances as a portfolio (Lavie, 2007; Vasudeva & Anand, 2011).
Learning under such circumstances is not merely a function of dyadic alliance experience
(Hoang & Rothaermel, 2005) but entails managing possibly conflicting relationship
within the wider alliance portfolio. In addition, alliance research could take into
consideration the stability of the portfolio of relationships (Bakker & Knoben, 2015) to
understand how the focal firm may enhance its knowledge rents. Alliance governance
likely has to be related to network governance, especially when it comes to the selection,
monitoring and termination of structures over time.
My research also highlights the limitations of dyadic analyses in capturing the
complexities of relational stability. Much of the scholarly work investigating stability and
dissolution at the network level has looked into the benefits of having common third
party ties or structural embeddedness (e.g., Gulati & Gargiulo, 1999). The presence of a
common third party aids in maintaining order in the network relationship via social
sanctions. However, extant work provides little theoretical insight into the situation when
the common third party is a broker firm that is willing to withhold information and take
sides for individual profit maximization. Opportunities and constraints available to the
broker and alter firms jointly influence network reorganization and change and might not
always be additive. In sum, in addition to existing theorizing about the “shadow of the
future” (Axelrod, 1984) and the “shadow of others” (Polidoro, Ahuja, & Mitchell, 2011)
emphasizing structural embeddedness in the persistence of network structures, I highlight
the distinct influence of the “shadow of the broker.”
120
My research may also inform practitioners in industry. Managers seeking
innovation using interfirm alliances need to pay attention to both alliance network
configuration and network stability. In situations which necessitate open-ended alliance
relationships, or in uncertain situations in which firms cannot foresee alliance
terminations in the near future, managers might improve their firms’ innovation
performance by spanning more structural holes. In sum, rewiring and refreshing the
network configuration is the recommended course of action. However, when network
stability looms large due to alliance persistence compulsions or other reasons, geographic
dispersion and open structures limit its ill effects. In addition, managers are better off
when they also pay attention to the geographic distance between alliance partners.
Limitations and Future Directions
Although the empirical context for my dissertation is the biopharmaceutical
industry, I believe that my results are likely to hold in other industries with similar
features such as the salience of innovation. Where the importance of innovation is less
critical, or where alliances are used for purposes other than innovation, network stability
may not produce negative effects on innovation. A further potential arena for
generalizability may be to assess whether and when ego-network stability affects
innovation at the level of individual scientists. In addition, a promising avenue for future
studies is to examine the antecedents of overall ego-network stability, given its
implications for performance (e.g., Sasovova et al., 2010). Overall, this study provides
rich prospects for future research.
As regards network dynamics, questions to investigate with future work are: Are

121
alter firms empirically at a disadvantageous position vis-à-vis the broker firm in terms of
returns, or even innovation? Does that disadvantage attenuate post decay? What are the
contingencies in which one manifestation of decay gains prominence over the other? For
example, under what conditions will a disintermediation strategy trump a closure strategy
in terms of knowledge gains for the alter firms? Another area worthy of future
scholarship is a mixed-level study with both a dyadic and a network focus and investigate
if results differ at different levels of analysis.
Extant studies either ignore stability or assume a homogeneous distribution of
stability among structural holes, typically that structural holes are transient and quick to
decay (Burt, 1992: Stovel et al., 2011). I study differences in structural hole stability as a
useful point of departure to theoretically enrich the discussion about the stability
dimension of social capital and its consequences. One future avenue of research in this
domain would be to dig deeper into the broker firm’s motivation and its effect on
stability.
Burt’s theory of structural holes treats broker motivation and brokerage
opportunity generated from the structural hole “as one and the same” and views the
motivation question as a “nonissue” (Burt, 1992: 35). In contrast, one could argue that
broker motivation is relevant because the firm has to decide whether to exploit the
information and control benefits provided by the structural hole or forego some of these
benefits in favor of pursuing more reciprocally-beneficial relationships with alter firms,
which might lower the incentives for alter firms to close the hole, but possibly be
perceived as benefiting the broker firm in the long run.

122
Framed in Burt’s terms, the focal firm can adopt one of two logics of action while
spanning a structural hole: in contrast to Burt’s tertius gaudens logic, or “the third who
enjoys,” there could be an alternative brokerage logic: tertius coordinans or “the third
who coordinates.” In other words, how the focal firm acts as a broker might have
implications for brokerage stability.
The tertius coordinans rationale. While others, such as Obstfeld (2005), have
also suggested alternatives to tertius gaudens, such as tertius iungens, it is important to
recognize that in a tertius iungens setting the broker essentially brings together the two
disconnected alters. My suggestion (for future work) of tertius coordinans differs from
both tertius iungens and tertius gaudens in that unlike iungens the broker keeps the two
alters apart, but unlike gaudens the broker coordinates between the alters rather than
exploiting or controlling them. Thus, the tertius coordinans logic represents an “honest”
broker that stays “passive” despite the two alter firms not connecting directly with each
other. Burt (1992: 34) actually makes a reference to this kind of broker as the “passive
player” who is interested in information but not control benefits, simply coordinating
information or knowledge flow across alters (also see Spiro, Acton, & Butts, 2013). Put
another way, the active, controlling broker, even in Burt’s original theorizing, is but one
manifestation of brokerage, although prominent in the current literature. The broker, on
its part, might benefit through coordination by acting as a channel for knowledge
exchange, and by recombining the knowledge acquired from the two alters. Over time, a
high level of trust builds among the broker and alter firms, which reduces negotiation and
knowledge transfer costs. Agreements are reached more easily and parties can more

123
readily have a “meeting of the minds.” Moreover, trust decreases the propensity to defend
against opportunistic behavior thereby promoting a more stable, long-term view on the
part of all the members of the brokerage triad (Bromiley & Cummings, 1995).
More specifically, such a longer-term brokerage orientation implies that some
brokers may believe that their self-interest is better served by a more reciprocal and
equitable knowledge sharing and coordination approach. This logic is akin to the work of
economist Ernst Fehr and his colleagues, from which I quote below:
A long-standing tradition in economics views human beings as exclusively self-
interested. In most economic accounts of individual behavior and aggregate social
phenomena, the “vast forces of greed” (Arrow, 1980) are put at the center of the
explanation. In economic models human actors are typically portrayed as “self-
interest seeking with guile (which) includes . . . more blatant forms, such as lying,
stealing, and cheating ... (but) more often involves subtle forms of deceit”
(Williamson, 1985: 47). However, as we will document below, many people
deviate from purely self- interested behavior in a reciprocal manner. Reciprocity
means that in response to friendly actions, people are frequently much nicer and
much more cooperative than predicted by the self-interest model…There is
considerable evidence that a substantial fraction of people behave according to
this dictum (Fehr & Gachter, 2000: 159).
Such reciprocity characterizes the “honest broker” and the subsequent trust that
develops between the broker and the alters enables the structural hole to be stable and
persist over time. In this respect, I am not assuming that the broker is “selfless” – rather I
am assuming that the range of broker behaviors might extend beyond the consistent self-
interested exploitation of the brokerage position. Furthermore, I am not implying that all
brokers behave in a reciprocal fashion; just that because some significant proportion
does, we are likely to see variation in the stability of the brokerage triad.
On the other hand, in the case of tertius gaudens, power asymmetries in the triad

124
make conflict or competition for the brokerage position imminent. In such situations,
alter firms may attempt to replicate the structural advantages of the broker, severely
straining the stability of structural holes (Buskens & van de Rijt, 2008) and making the
brokerage structure transient. Also, the broker firm, while engendering competition
among alters, might make the two alter firms aware of their combined bargaining power
against it, eliminating the rents from brokerage. In sum, the coordinative nature of
brokerage in tertius coordinans might increase the stability of the hole in contrast to the
exploitative orientation in tertius gaudens (Simmel, 1950). Thus, because brokerage
motivations might differ from one brokerage triad to the other, future research might look
into how variations in the motivation of brokers affect stability.
125
REFERENCES
Abernathy, W., & Utterback, J. 1978. Patterns of industrial innovation. Technology
Review, 50: 41–47.
Adler, P. S., & Kwon, S. W. 2002. Social capital: Prospects for a new concept. Academy
of Management Review, 27(1): 17–40.
Afshartous, D., & Preston, R. A. 2011. Key results of interaction models with centering.
Journal of Statistics Education, 19(3): 1–24.
Ahuja, G. 2000. Collaboration networks, structural holes, and innovation: A longitudinal
study. Administrative Science Quarterly, 45(3): 425–455.
Ahuja, G., & Katila, R. 2004. Where do resources come from? The role of idiosyncratic
situations. Strategic Management Journal, 25(8–9): 887–907.
Ahuja, G., Polidoro, F., & Mitchell, W. 2009 Structural homophily or social asymmetry?
The formation of alliances by poorly embedded firms. Strategic Management
Journal, 30(9): 941–958.
Ai, C., & Norton, E. C. 2003. Interaction terms in logit and probit models. Economics
Letters, 80(1): 123–129.
Aiken, L. S., & West, S. G. 1991. Multiple regression: Testing and interpreting
interactions. London: Sage Publications.
Allen, T. J. 2007. Architecture and communication among product development
engineers. California Management Review, 49(2): 23–41.
Allison, P. D. 1982. Discrete-time methods for the analysis of event histories.
Sociological Methodology, 13(1): 61–98.
Allison, P. D. 2009. Fixed effects regression models (vol. 160). Washington DC: SAGE
Publications Inc.
Allison, P. D. 2010. Survival analysis using SAS: A practical guide (vol. 2). Cary, NC:
SAS Institute Inc.
Allison, P. D. 2012. When can you safely ignore multicollinearity? https://statisticalhorizons.com/multicollinearity. accessed 09 December 2017.
Allison, P. D. 2014. Event history and survival analysis (2nd
ed.). California: SAGE
Publications Inc.
Almeida, P., Dokko, G., & Rosenkopf, L. 2003. Startup size and the mechanisms of
external learning: increasing opportunity and decreasing ability? Research Policy,
32(2): 301–315.
Almeida, P., & Kogut, B. 1999. Localization of knowledge and the mobility of engineers
in regional networks. Management Science, 45: 905–917.
126
Anand, B. N., & Khanna, T. 2000. Do firms learn to create value? The case of alliances.
Strategic Management Journal, 21(3): 295–315.
Anderson, E. B. 1980. Discrete statistical models with social science applications.
Amsterdam: North-Holland.
Angrist, J. D., & Pischke, J. S. 2009. Mostly harmless econometrics: An empiricist’s
companion. Princeton: Princeton University Press.
Aral, S., & Van Alstyne, M. 2011. The diversity-bandwidth trade-off. American Journal
of Sociology, 117(1): 90–171.
Arrow, K. J. 1962. Economic welfare and the allocation of resources for innovation. In
National Bureau of Economic Research & R. R. Nelson (Eds.), The rate and
direction of inventive activity: Economic and social factors: 609–626. Princeton, NJ:
Princeton University Press.
Arrow, K. 1980. Discrimination in the labour market. In J. E. King (Ed.), Readings in
labour economics: Edited readings with commentaries. Oxford: Oxford University
Press.
Axelrod, R. 1984. The evolution of cooperation. New York: Basic Books.
Baker, W. E. 1990. Market networks and corporate behavior. American Journal of
Sociology, 96(3): 589–625.
Bakker, R. M., & Knoben, J. 2015. Built to last or meant to end: Intertemporal choice in
strategic alliance portfolios. Organization Science, 26(1): 256–276.
Barnett, W. P., Greve, H. R., & Park, D. Y. 1994. An evolutionary model of
organizational performance. Strategic Management Journal, 15(S1):11–28.
Barney, J. 1991. Firm resources and sustained competitive advantage. Journal of
Management, 17(1): 99–120.
Barthélemy, J. 2017. The impact of technical consultants on the quality of their clients’
products: Evidence from the Bordeaux wine industry. Strategic Management
Journal, 38(5): 1174–1190.
Baum, C. F. 2006. An introduction to modern econometrics using Stata. College
Station, TX: Stata Press.
Baum, J. A., Calabrese, T., & Silverman, T. 2000. Don’t go it alone: Alliance network
composition and startups’ performance in Canadian biotechnology. Strategic
Management Journal, 21(3): 267–294.
Baum, J. A., Cowan, R., & Jonard, N. 2014. Does evidence of network effects on firm
performance in pooled cross‐section support prescriptions for network strategy?
Strategic Management Journal, 35(5): 652–667.
127
Baum, J. A., McEvily, B., & Rowley, T. J. 2012. Better with age? Tie longevity and the
performance implications of bridging and closure. Organization Science, 23(2): 529–
546.
Baum, J. A. C., Van Liere, D., & Rowley, T. J. 2007. Between closure and holes: Hybrid
network positions and firm performance. Paper presented at the annual meeting of
the Academy of Management, Philadelphia.
Bell, G. G., & Zaheer, A. 2007. Geography, networks, and knowledge flow.
Organization Science, 18(6): 955–972.
Belsey, D., Kuh, E., & Welsch, R. 1980. Regression diagnostics: Identifying influential
data and sources of collinearity. New York, NY: Wiley.
Blau, P. M. 1977. Inequality and heterogeneity: A primitive theory of social structure
(vol. 7). New York: Free Press.
Blundell, R., Griffith, R., & Van Reenen, J. 1995. Dynamic count data models of
technological innovation. The Economic Journal, 105(429): 333–344.
Blundell, R., Griffith, R., & Windmeijer, F. 2002. Individual effects and dynamics in
count data models. Journal of Econometrics, 108(1): 113–131.
Boeh, K. K., & Beamish, P. W. 2012. Travel time and the liability of distance in foreign
direct investment: Location choice and entry mode. Journal of International
Business Studies, 43(5): 525–535.
Boland Jr, R. J., & Tenkasi, R. V. 1995. Perspective making and perspective taking in
communities of knowing. Organization Science, 6(4): 350–372.
Bonacich, P. 1972. Factoring and weighting approaches to status scores and clique
identification. Journal of Mathematical Sociology, 2: 113–120.
Bonacich, P. 1987. Power and centrality: A family of measures. American Journal of
Sociology, 92(5): 1170–1182.
Bonate, P. L. 1999. The effect of collinearity on parameter estimates in nonlinear mixed
effect models. Pharmaceutical Research, 16(5): 709–717.
Borgatti, S. P. 2014. Is there a “corrected constraint” measure. UCINET FAQ.
https://sites.google.com/site/ucinetsoftware/document/faq/isthereacorrectedconstraint
measure. accessed 01 May 2017.
Borgatti, S. P., Everett, M. G., & Johnson, J. C. 2013. Analyzing social networks.
London: SAGE Publications Limited.
Bossard, J. H. 1932. Residential propinquity as a factor in marriage selection. American
Journal of Sociology, 38(2): 219–224.
Bourdieu, P. 1980. Le capital social. Notes provisoires. Actes de la Recherche en
Sciences Socials, 31: 2–3
128
Bourdieu, P., & Wacquant, L. J. 1992. An invitation to reflexive sociology. Chicago, IL:
University of Chicago press.
Brass, D. J., Butterfield, K. D., & Skaggs, B. C. 1998. Relationships and unethical
behavior: A social network perspective. Academy of Management Review, 23(1):
14–31.
Breschi, S., & Lissoni, F. 2009. Mobility of skilled workers and co-invention networks:
an anatomy of localized knowledge flows. Journal of Economic Geography, 9: 439–
468.
Bromiley, P., & Cummings, L. L. 1995. Transactions costs in organizations with trust. In
R. J. Bies, R. J. Lewicki, & B. H. Sheppard (Eds.), Research on negotiation in
organizations, vol. 5: 219–247. Bingley, United Kingdom: Emerald Group
Publishing Limited.
Buis, M. L. 2010. Stata tip 87: Interpretation of interactions in non-linear models. The
Stata Journal, 10(2): 305–308.
Burt, R. S. 1992. Structural holes: The social structure of competition. Cambridge:
Harvard University Press.
Burt, R. S. 2000. The network structure of social capital. Research in Organizational
Behavior, 22: 345–423.
Burt, R. S. 2001. Structural holes versus network closure as social capital. In N. Lin, K.
Cook, & R. S. Burt (Eds.), Social capital: Theory and research: 31–55. New York:
Aldine de Gruyter.
Burt, R. S. 2002. Bridge decay. Social Networks, 24(4): 333–363.
Burt, R. S. 2004. Structural holes and good ideas. American Journal of Sociology,
110(2): 349–399.
Burt, R. S. 2005. Brokerage and closure: An introduction to social capital. Oxford:
Oxford University Press.
Burt, R. S. 2007. Closure and stability: Persistent reputation and enduring relations
among bankers and analysts. In J. E. Rauch (Ed.), The missing links: Formation and
decay of economic networks: 100–143. New York: Russell Sage Foundation
Burt, R. S., & Merluzzi, J. 2016. Network oscillation. Academy of Management
Discoveries, 2(4): 368–391.
Buskens, V., & Van de Rijt, A. 2008. Dynamics of networks if everyone strives for
structural holes. American Journal of Sociology, 114(2): 371–407.
Cameron, A. C., & Trivedi, P. K. 1986. Econometric models based on count data:
Comparisons and applications of some estimators and tests. Journal of Applied
Econometrics, 1(1): 29–53.
129
Cameron, A. C., & Trivedi, P. K. 2005. Microeconometrics: Methods and applications.
New York, NY: Cambridge university press.
Cameron, A. C., & Trivedi, P. K. 2010. Microeconometrics using stata (vol. 2). College
Station, TX: Stata Press.
Cameron, A. C., & Trivedi, P. K. 2013. Regression analysis of count data. New York:
Cambridge University Press.
Cattani, G., Pennings, J. M., & Wezel, F. C. 2003. Spatial and temporal heterogeneity in
founding patterns. Organization Science, 14(6): 670–685.
Chamberlain, G. 1992. Comment: Sequential moment restrictions in panel data. Journal
of Business & Economic Statistics, 10(1): 20–26.
Choi, T. Y., & Wu, Z. 2009. Taking the leap from dyads to triads: Buyer–supplier
relationships in supply networks. Journal of Purchasing and Supply Management,
15(4): 263–266.
Clement, J., Shipilov, A., & Galunic, D. C. 2017. Brokerage as a public good: The
externalities of network hubs for different formal roles in creative organizations.
Administrative Science Quarterly, XX: 1–36.
Coff, R. 2003. Bidding wars over R&D-intensive firms: Knowledge, opportunism, and
the market for corporate control. Academy of Management Journal, 46(1): 74–85.
Cohen, W. M, & Levinthal, D. A. 1990. Absorptive capacity: a new perspective on
learning and innovation. Administrative Science Quarterly, 35 (1): 128–152.
Coleman, J. S. 1988. Social capital in the creation of human capital. American Journal
of Sociology, 94: S95–S120.
Coleman, J. S. 1990. Foundations of social theory. Cambridge: Harvard University
Press.
Comanor, W. S., & Scherer, F. M. 1969. Patent statistics as a measure of technical
change. Journal of Political Economy, 77(3): 392–398.
Cowan, R., & Jonard, N. 2004. Network structure and the diffusion of knowledge.
Journal of Economic Dynamics and Control, 28(8): 1557–1575.
D’Agostino, R. B., Lee, M. L., Belanger, A. J., Cupples, L. A., Anderson, K., & Kannel,
W. B. 1990. Relation of pooled logistic regression to time dependent Cox regression
analysis: The Framingham heart study. Statistics in Medicine, 9(12): 1501–1515.
Dahlander, L., & McFarland, D. A. 2013. Ties that last: Tie formation and persistence in
research collaborations over time. Administrative Science Quarterly, 58(1): 69–110.
Das, T. K., & Teng, B. S. 2003. Partner analysis and alliance performance. Scandinavian
Journal of Management, 19(3): 279–308.
130
Davis, J. P. 2016. The group dynamics of interorganizational relationships: Collaborating
with multiple partners in innovation ecosystems. Administrative Science Quarterly,
61(4): 621–661.
Dess, G. G., & Shaw, J. D. 2001. Voluntary turnover, social capital, and organizational
performance. Academy of Management Review, 26(3): 446–456.
Dhanaraj, C., Lyles, M. A., Steensma, H. K., & Tihanyi, L. 2004. Managing tacit and
explicit knowledge transfer in IJVs: The role of relational embeddedness and the
impact on performance. Journal of International Business Studies, 35(5): 428–442.
Dhanaraj, C., & Parkhe, A. 2006. Orchestrating innovation networks. Academy of
Management Review, 31(3): 659–669.
DiMasi, J. A., Hansen, R. W., & Grabowski, H. G. 2003. The price of innovation: new
estimates of drug development costs. Journal of Health Economics, 22(2): 151–185.
DiMasi, J. A., Hansen, R. W., & Grabowski, H. G. 2008. Misleading congress about drug
development: Reply. Journal of Health Politics, Policy and Law, 33(2): 319–324.
Doz, Y. L. 1996. The evolution of cooperation in strategic alliances: Initial conditions or
learning processes? Strategic Management Journal, 17(S1): 55–83.
Dyer, J. H., & Nobeoka, K. 2000. Creating and managing a high-performance
knowledge-sharing network: The Toyota case. Strategic Management Journal,
21(3): 345–367.
Dyer, J. H., & Singh, H. 1998. The relational view: Cooperative strategy and sources of
interorganizational competitive advantage. Academy of Management Review, 23:
660–679.
Eisenhardt, K. M. 1989. Making fast strategic decisions in high-velocity environments.
Academy of Management Journal, 32(3): 543–576.
Ertug, G., & Castellucci, F. 2013. Getting what you need: How reputation and status
affect team performance, hiring, and salaries in the NBA. Academy of Management
Journal, 56(2): 407–431.
FDA. 2015. The beginnings: Laboratory and animal studies.
http://www.fda.gov/Drugs/ResourcesForYou/Consumers/ucm143475.htm. accessed
27 February 2016.
Fehr, E., & Gächter, S. 2000. Fairness and retaliation: The economics of reciprocity. The
Journal of Economic Perspectives, 14(3): 159–181.
Feld, S.L., Suitor, J.J, & Hoegh, J.G. Describing changes in personal networks over time.
Field Methods, 19(2): 218–236.

131
Feldman, M. P., & Audretsch, D. B. 1999. Innovation in cities: Science-based diversity,
specialization and localized competition. European Economic Review, 43(2): 409–
429.
Fernandez-Mateo, I. 2007. Who pays the price of brokerage? Transferring constraint
through price setting in the staffing sector. American Sociological Review, 72(2):
291–317.
Fernández-Val, I. 2009. Fixed effects estimation of structural parameters and marginal
effects in panel probit models. Journal of Econometrics, 150(1): 71–85.
Fleming, L. 2001. Recombinant uncertainty in technological search. Management
Science, 47: 117–132.
Fleming, L., Mingo, S., & Chen, D. 2007. Collaborative brokerage, generative creativity, and
creative success. Administrative Science Quarterly, 52: 443–475.
Freeman, L. C. 1978. Centrality in social networks conceptual clarification. Social
Networks, 1(3): 215–239.
Funk, R. J. 2014. Making the most of where you are: Geography, networks, and
innovation in organizations. Academy of Management Journal, 57(1): 193–222.
Gadde, L. E., & Mattsson, L. G. 1987. Stability and change in network relationships.
International Journal of Research in Marketing, 4(1): 29–41.
Galunic, C., Ertug, G., & Gargiulo, M. 2012. The positive externalities of social capital:
Benefiting from senior brokers. Academy of Management Journal, 55: 1213–1231.
Gargiulo, M., & Bernassi, M. 1999. The dark side of social capital. In R. Th. A. J.
Leenders, & S. M. Gabbay (Eds.), Corporate social capital and liability: 298–322.
Boston: Kluwer.
Gargiulo, M., & Ertug, G.2006. The dark side of trust. In R. Bachmann & A. Zaheer
(Eds.), The handbook of trust research: 165–183. Northampton, MA: Edward Elgar.
Gargiulo, M., & Ertug, G. 2014. The power of the weak. In D. J. Brass , G. Labianca, A.
Mehra, D. S. Halgin, & S. P. Borgatti (Eds.), Contemporary perspectives on
organizational social networks (research in the sociology of organizations), vol. 40:
179–198. Bingley, UK: Emerald Group Publishing Limited.
Gastner, M. T., & Newman, M. E. 2006. The spatial structure of networks. The
European Physical Journal B-Condensed Matter and Complex Systems, 49(2):
247–252.
Geertz, C. 1978. The bazaar economy: Information and search in peasant marketing.
American Economic Review, 68: 28–32.
Ghemawat, P. 2001. Distance still matters. Harvard Business Review, 79(8): 137–145.
Ghemawat, P. 2003. The forgotten strategy. Harvard Business Review, 81(11): 76–84.
132
Ghoshal, S., & Bartlett, C. A. 1988. Creation, adoption, and diffusion of innovations by
subsidiaries of multinational corporations. Journal of International Business
Studies, 19: 365–388.
Girvan, M., & Newman, M. E. 2002. Community structure in social and biological
networks. Proceedings of the National Academy of Sciences, 99(12): 7821–7826.
Goerzen, A. 2007. Alliance networks and firm performance: The impact of repeated
partnerships. Strategic Management Journal, 28(5): 487–509.
Goldenberg, J., & Levy, M. 2009. Distance is not dead: Social interaction and
geographical distance in the internet era. arXiv, 0906.3202.
Gomes-Casseres, B. 1994. Group versus group: How alliance networks compete.
Harvard Business Review, 72(4): 62–66.
Gomes-Casseres, B., 1996. The alliance revolution: The new shape of business rivalry.
Cambridge, MA: Harvard University Press.
Google. 2015. Geocoding API.
https://developers.google.com/maps/documentation/geocoding/ accessed 21
December 2015.
Gourieroux, C., Monfort, A., & Trognon, A. 1984. Pseudo maximum likelihood methods:
Applications to Poisson models. Econometrica: Journal of the Econometric Society,
52(3): 701–720.
Granovetter, M. S. 1973. The strength of weak ties. American Journal of Sociology,
78(6): 1360–1380.
Granovetter, M. S. 1985. Economic action and social structure: The problem of
embeddedness. American Journal of Sociology, 91(3): 481–510.
Greene, W. H. 2002. The bias of the fixed effects estimator in nonlinear models.
Unpublished Manuscript, Stern School of Business, NY.
Greene, W. H. 2004a. The behaviour of the maximum likelihood estimator of limited
dependent variable models in the presence of fixed effects. The Econometrics
Journal, 7(1): 98–119.
Greene, W. H. 2004b. Fixed effects and bias due to the incidental parameters problem in
the Tobit model. Econometric Reviews, 23(2): 125–147.
Greene, W. H. 2007. Fixed and random effects models for count data.
http://archive.nyu.edu/bitstream/2451/26046/2/7-16.pdf. accessed 10 June 2016.
Greif, A. 1989. Reputation and coalitions in medieval trade: Evidence on the Maghribi
traders. The Journal of Economic History, 49(4): 857–882.
Guimera, R., & Amaral, L. A. N. 2005. Functional cartography of complex metabolic
networks. Nature, 433(7028): 895–900.
133
Gulati, R. 1995a. Does familiarity breed trust? The implications of repeated ties for
contractual choice in alliances. Academy of Management Journal, 38(1): 85–112.
Gulati, R. 1995b. Social structure and alliance formation patterns: A longitudinal
analysis. Administrative Science Quarterly, 40: 619–652.
Gulati, R. 1999. Network location and learning: The influence of network resources and
firm capabilities on alliance formation. Strategic Management Journal, 20(5): 397–
420.
Gulati, R. 2007. Managing Network Resources: Alliances, affiliations, and other
relational assets. New York: Oxford University Press.
Gulati, R., & Gargiulo, M. 1999. Where do interorganizational networks come from?
American Journal of Sociology, 104(5): 1439–1493.
Gulati, R., Nohria, N., & Zaheer, A. 2000. Strategic networks. Strategic Management
Journal, 21(3), 203–215.
Gulati, R., & Sytch, M. 2008. Does familiarity breed trust? Revisiting the antecedents of
trust. Managerial and Decision Economics, 29: 165–190.
Gulati, R., Sytch, M., & Tatarynowicz, A. 2012. The rise and fall of small worlds:
Exploring the dynamics of social structure. Organization Science, 23(2): 449–471.
Gulati, R., & Westphal, J. D. 1999. Cooperative or controlling? The effects of CEO-
board relations and the content of interlocks on the formation of joint ventures.
Administrative Science Quarterly, 44(3): 473–506.
Hagstrom, W. O. 1965. The scientific community (vol. 304). New York: Basic books.
Hahl, O., Kacperczyk, A. O., & Davis, J. P. 2016. Knowledge asymmetry and brokerage:
Linking network perception to position in structural holes. Strategic Organization,
14(2):118–143.
Halgin, D. S., & Borgatti, S. P. 2012. An introduction to personal network analysis and
tie churn statistics using E-NET. Connections, 32(1): 37–48.
Hall, B. H. 2008. The patent name-matching project.
https://eml.berkeley.edu/~bhhall/pat/namematch.html. accessed 10 January 2014
Hall, B. H., Jaffe, A. B., & Trajtenberg, M. 2001. The NBER patent citation data file:
Lessons, insights and methodological tools. Working paper no. w8498, National
Bureau of Economic Research.
Hall, B. H., Jaffe, A. B., & Trajtenberg, M. 2005. Market value and patent citations. The
RAND Journal of Economics, 36(1): 16–38.
Hansen, M. T. 1999. The search-transfer problem: The role of weak ties in sharing
knowledge across organization subunits. Administrative Science Quarterly, 44: 82–
111.
134
Hargadon, A. 2002. Brokering knowledge: Linking learning and innovation. In B. M.
Staw & R. M. Kramer (Eds.), Research in Organizational Behavior, vol.24: 41–85.
Greenwich, CT: JAI Press.
Hargadon, A., & Sutton, R. I. 1997. Technology brokering and innovation in a product
development firm. Administrative Science Quarterly, 42(4): 716–749.
Harrison, J. S., Hitt, M. A., Hoskisson, R. E., & Ireland, R. D. 2001. Resource
complementarity in business combinations: Extending the logic to organizational
alliances. Journal of Management, 27(6): 679–690.
Hawley, A. H. 1950. Human ecology: A theory of community structure. New York:
Ronald Press Co.
Heckman, J. J. 1979. Sample selection bias as specification error. Econometrica, 45:
153–161.
Henderson, R. M. 1994. The evolution of integrative capability: Innovation in
cardiovascular drug discovery. Industrial and Corporate Change, 3(3): 607–630.
Henderson, R. M., & Clark, K. B. 1990. Architectural innovation: The reconfiguration of
existing product technologies and the failure of established firms. Administrative
Science Quarterly, 35(S1): 9–30.
Henderson, R., & Cockburn, I. 1994. Measuring competence? Exploring firm effects in
pharmaceutical research. Strategic Management Journal, 15(S1): 63–84.
Hilbe, J. M. 2011. Negative binomial regression. New York: Cambridge University
Press.
Hillier, B., & Penn, A. 1991. Visible colleges: structure and randomness in the place of
discovery. Science in Context, 4(1): 23–50.
Hitt, M. A., Hoskisson, R. E., & Kim, H. 1997. International diversification: Effects on
innovation and firm performance in product-diversified firms. Academy of
Management Journal, 40(4): 767–798.
Hoang, H., & Rothaermel, F. T. 2005. The effect of general and partner-specific alliance
experience on joint R&D project performance. Academy of Management Journal,
48(2): 332–345.
Hoetker, G. 2005. How much you know versus how well I know you: Selecting a
supplier for a technically innovative component. Strategic Management Journal,
26(1):75–96.
Hofmann, D. A., & Gavin, M. B. 1998. Centering decisions in hierarchical linear models:
Implications for research in organizations. Journal of Management, 24(5): 623–641.
Holloway, S. S., & Parmigiani, A. 2016. Friends and profits don’t mix: The performance
implications of repeated partnerships. Academy of Management Journal, 59(2):
460–478.

135
Hsiao, C. 2014. Analysis of panel data (vol. 54). New York: Cambridge University
Press.
Inkpen, A. C., & Currall, S. C. 2004. The coevolution of trust, control, and learning in
joint ventures. Organization Science, 15(5): 586–599.
Inkpen, A. C., & Ross, J. 2001. Why do some strategic alliances persist beyond their
useful life? California Management Review, 44(1): 132–148.
Inkpen, A. C., & Tsang, E. W. 2005. Social capital, networks, and knowledge transfer.
Academy of Management Review, 30(1): 146–165.
Jaccard, J., Wan, C. K., & Turrisi, R. 1990. The detection and interpretation of interaction
effects between continuous variables in multiple regression. Multivariate Behavioral
Research, 25(4): 467–478.
Jaffe, A. B. 1986. Technological opportunity and spillovers of R&D: Evidence from
firms’ patents, profits and market value. The American Economic Review, 76(5):
984–1001
Jaffe, A.B., 1989. Real effects of academic research. American Economic Review, 79:
957–970.
Jaffe, A. B., Trajtenberg, M., & Henderson, R. 1993. Geographic localization of
knowledge spillovers as evidenced by patent citations. The Quarterly Journal of
Economics, 108(3): 577–598.
Jarillo, J. C. 1988. On strategic networks. Strategic Management Journal, 9(1): 31–41.
Jenkins, S. P. 2005. Survival analysis. Unpublished manuscript, Institute for Social and
Economic Research, University of Essex, Colchester, UK.
Jiang, R. J., Tao, Q. T., & Santoro, M. D. 2010. Alliance portfolio diversity and firm
performance. Strategic Management Journal, 31(10): 1136–1144.
Johnson, R. A., & Greening, D. W. 1999. The effects of corporate governance and
institutional ownership types on corporate social performance. Academy of
Management Journal, 42(5): 564–576.
Kale, P., Dyer, J. H., & Singh, H. 2002. Alliance capability, stock market response, and
long-term alliance success: The role of the alliance function. Strategic Management
Journal, 23(8): 747–767.
Kennedy, P. 2008. A guide to econometrics (6th ed.). Hoboken, NJ: Wiley-Blackwell.
Kim, T. Y., Oh, H., & Swaminathan, A. 2006. Framing interorganizational network
change: A network inertia perspective. Academy of Management Review, 31(3):
704–720.

136
King, G. 1988. Statistical models for political science event counts: bias in conventional
procedures and evidence for the exponential Poisson regression model. American
Journal of Political Science, 32(3): 838–863.
King, G., & Zeng, L. 2001. Logistic regression in rare events data. Political Analysis,
9(2): 137–163.
Kleinbaum, D. G., Kupper, L. L., & Muller, K. E. 1988. Applied regression analysis and
other multivariate analysis methods. Boston: PWS-Kent Publishing Company.
Knoke, D. 2001. Changing organizations: Business networks in the new political
economy. Boulder: Westview Press.
Knoke, D. 2009. Playing well together: Creating corporate social capital in strategic
alliance networks. American Behavioral Scientist, 52(12): 1690–1708.
Kogan, L., Papanikolaou, D., Seru, A., & Stoffman, N. 2012. Technological innovation,
resource allocation, and growth. Working paper no. w17769, National Bureau of
Economic Research.
Kogut, B. 2000. The network as knowledge: Generative rules and the emergence of
structure. Strategic Management Journal, 21(3): 405–425.
Kogut, B., & Zander, U. 1993. Knowledge of the firm and the evolutionary theory of the
multinational corporation. Journal of International Business Studies, 24(4): 625–
645.
Kono, C., Palmer, D., Friedland, R., & Zafonte, M. 1998. Lost in space: The geography
of corporate interlocking directorates. American Journal of Sociology, 103(4): 863–
911.
Kossinets, G., & Watts D. J. 2006. Empirical analysis of an evolving social network.
Science, 311: 88–90.
Kotabe, M., Martin, X., & Domoto, H. 2003. Gaining from vertical partnerships:
Knowledge transfer, relationship duration, and supplier performance improvement in
the U.S. and Japanese automotive industries. Strategic Management Journal, 24(4):
293–316.
Kotha, R., Zheng, Y., & George, G. 2011. Entry into new niches: The effects of firm age
and the expansion of technological capabilities on innovative output and impact.
Strategic Management Journal, 32(9): 1011–1024.
Krackhardt, D. 1987. Cognitive social structures. Social Networks, 9(2): 109–134.
Krackhardt, D. 1990. Assessing the political landscape: Structure, cognition, and power
in organizations. Administrative Science Quarterly, 35: 342–369.
Krackhardt, D. 1992. The strength of strong ties: The importance of philos in
organizations. In N. Nohria & R. G. Eccles (Eds.), Networks and organizations:
Structure, form, and action: 216–239. Boston: Harvard Business School Press.

137
Krackhardt, D. 1998. Super strong and sticky. In R. M. Kramer & M. A. Neale (Eds.),
Power and influence in organizations: 21–39. Thousand Oaks, CA: SAGE
Publications.
Krackhardt, D. 1999. The ties that torture: Simmelian tie analysis in organizations. In S.
B. Andrews, & D. Knoke (Eds.), Research in the sociology of organizations: Networks in and around Organizations, vol. 16: 183–210. Stamford, CT: Jai Press
Inc
Kraut, R., Egido, C., & Galegher, J. 1988. Patterns of contact and communication in
scientific research collaboration. ACM, 0-89791-282-9/88/0001: 1–12
Lai, R., D’Amour, A., Yu A., Sun, Y., & Fleming, L. 2011. Disambiguation and co-
authorship networks of the US patent inventor database (1975–2010). Harvard
Dataverse, V5. http://hdl.handle.net/1902.1/15705. accessed 10 June 2016.
Lancaster, T. 2002. Orthogonal parameters and panel data. The Review of Economic
Studies, 69(3): 647–666.
Laumann, E. O., Marsden, P. V., & Prensky, D. 1989. The boundary specification
problem in network analysis. In L. C. Freeman, D. R. White, & A. K. Romney (Eds.),
Research methods in social network analysis: 61–87. New Brunswick, NJ:
Transaction Publishers.
Lavie, D. 2007. Alliance portfolios and firm performance: A study of value creation and
appropriation in the U.S. software industry. Strategic Management Journal, 28(12):
1187–1212.
Lavie, D., & Miller, S. R. 2008. Alliance portfolio internationalization and firm
performance. Organization Science, 19(4): 623–646.
Lee, Y., & Cavusgil, S. T. 2006. Enhancing alliance performance: The effects of
contractual-based versus relational-based governance. Journal of Business Research,
59(8): 896–905.
Levin, D. Z., Walter, J., & Murnighan, J. K. 2011. Dormant ties: The value of
reconnecting. Organization Science, 22(4): 923–939.
Levin, R. C. 1986. A new look at the patent system. The American Economic Review,
76(2): 199–202.
Liben-Nowell, D., Novak, J., Kumar, R., Raghavan, P., & Tomkins, A. 2005. Geographic
routing in social networks. Proceedings of the National Academy of Sciences of the
United States of America, 102(33): 11623–11628.
Lin, N. 1982. Social resources and instrumental action. In P. Marsden & N. Lin (Eds.),
Social structure and network analysis: 131–145. Beverly Hills, CA: Sage.

138
Lin, N. 1990. Social resources and social mobility: A structural theory of status
attainment. In R. Breiger (Ed.), Social mobility and social structure: 247–271. New
York: Cambridge University Press.
Lin, N., Ensel, W. M., & Vaughn, J. C. 1981. Social resources and strength of ties:
Structural factors in occupational status attainment. American Sociological Review,
46(4): 393–405.
Locke, E. A. 1999. Some reservations about social capital. Academy of Management
Review, 24: 8–9
Loging, W., Harland, L., & Williams-Jones, B. 2007. High-throughput electronic
biology: Mining information for drug discovery. Nature Reviews Drug discovery,
6(3): 220–230.
Long, S.J. 1997. Regression models for categorical and limited dependent variables.
Thousand Oaks, CA: Sage Publications.
Long, J. S., & Freese, J. 2014. Regression models for categorical dependent variables
using Stata. College Station, TX: Stata Press Publication.
Lorenzoni, G., & Ornati, O. A. 1988. Constellations of firms and new ventures. Journal
of Business Venturing, 3(1): 41–57.
Luo, Y. 2005. How important are shared perceptions of procedural justice in cooperative
alliances? Academy of Management Journal, 48(4): 695–709.
Maddala, G. S. 1983. Limited-dependent and qualitative variables in econometrics.
Cambridge: Cambridge University Press.
Madhavan, R., & Gnyawali, D. R., & He, J. 2004. Two’s company, three’s a crowd?
Triads in cooperative-competitive networks. Academy of Management Journal,
47(6): 918–927.
Majumdar, S. K., & Venkataraman, S. 1998. Network effects and the adoption of new
technology: Evidence from the U. S. telecommunications industry. Strategic
Management Journal, 19(11): 1045–1062.
Manning, W. G. 1998. The logged dependent variable, heteroscedasticity, and the
retransformation problem. Journal of Health Economics, 17(3): 283–295.
Manning, W. G., & Mullahy, J. 2001. Estimating log models: To transform or not to
transform? Journal of Health Economics, 20(4): 461–494.
Martin, G., Gözübüyük, R., & Becerra, M. 2015. Interlocks and firm performance: The
role of uncertainty in the directorate interlock‐performance relationship. Strategic
Management Journal, 36(2): 235–253.
McClelland, G. H., & Judd, C. M. 1993. Statistical difficulties of detecting interactions
and moderator effects. Psychological Bulletin, 114(2): 376–390.
139
Mjoen, H., & Tallman, S. 1997. Control and performance in international joint ventures.
Organization science, 8(3): 257–274.
Mok, D., Wellman, B, & Basu, R. 2007. Did distance matter: A pre-Internet analysis.
Social Networks, 29(3): 430–462.
Moorman, C., Zaltman, G., & Deshpande, R. 1992. Relationships between providers and
users of market research: The dynamics of trust within and between organizations.
Journal of Marketing Research, 29(3): 314–328.
Moody, J., McFarland, D. A., & Bender-deMoll S. 2005. Dynamic network visualization.
American Journal of Sociology, 110: 1206–1241.
Morris, J. H., Sherman, J. D., & Mansfield, E. R. 1986. Failures to detect moderating
effects with ordinary least squares-moderated multiple regression: Some reasons and
a remedy. Psychological Bulletin, 99(2): 282–288.
Mowery, D. C., Oxley, J. E., & Silverman, B.S., 1996. Strategic alliances and interfirm
knowledge transfer. Strategic Management Journal, Winter Special Issue 17: 77–91
Mundlak, Y. 1978. On the pooling of time series and cross section data. Econometrica,
46(1): 69–85.
Nahapiet, J., Ghoshal, S. 1998. Social capital, intellectual capital, and the organizational
advantage. Academy of Management Review, 23(2): 242–266.
Nandkumar, A., & Srikanth, K. 2016. Right person in the right place: How the host
country IPR influences the distribution of inventors in offshore R&D projects of
multinational enterprises. Strategic Management Journal, 37(8): 1715–1733.
Nathan, M. 2015. Same difference? Minority ethnic inventors, diversity and innovation in
the UK. Journal of Economic Geography, 15(1): 129–168.
Nelson, R. R. 1991. Why do firms differ, and how does it matter? Strategic Management
Journal, 12(S2): 61–74.
Nerkar, A., & Roberts, P. W. 2004. Technological and product‐market experience and the
success of new product introductions in the pharmaceutical industry. Strategic
Management Journal, 25(8‐9): 779–799.
Newman, M. E., & Girvan, M. 2004. Finding and evaluating community structure in
networks. Physical Review, 69(026113): 1–15.
Nicholson, S., Danzon, P. M., & McCullough, J. 2005. Biotech-pharmaceutical alliances
as a signal of asset and firm quality. The Journal of Business, 78(4): 1433–1464.
Nohria, N., & Eccles, R. G. 1992. Face-to-Face: Making Network Organizations Work.
In N. Nohria & R. G. Eccles (Eds.), Networks and organizations: Structure, form,
and action: 288–308. Boston: Harvard Business School Press.

140
Norton, E. C., Wang, H., & Ai, C. 2004. Computing interaction effects and standard
errors in logit and probit models. The Stata Journal, 4(2): 154–167.
Obstfeld, D. 2005. Social networks, the tertius iungens orientation, and involvement in
innovation. Administrative Science Quarterly, 50(1): 100–130.
O’hara, R. B., & Kotze, D. J. 2010. Do not log‐transform count data. Methods in Ecology
and Evolution, 1(2): 118–122.
Østergaard, C. R., Timmermans, B., & Kristinsson, K. 2011. Does a different view create
something new? The effect of employee diversity on innovation. Research Policy,
40(3): 500–509.
Osterman, P. 1987. Turnover, employment security, and the performance of the firm. In
M. Kleiner (Ed.), Human resources and the performance of the firm: 275–317.
Madison, WI: Industrial Relations Research Association.
Owen-Smith, J., & Powell, W. W. 2004. Knowledge networks as channels and conduits:
The effects of spillovers in the Boston biotechnology community. Organization
Science, 15(1): 5–21.
Palla, G., Barabási, A. L., & Vicsek, T. 2007. Quantifying social group evolution.
Nature, 446(7136): 664–667.
Paruchuri, S. 2009. Intraorganizational networks, interorganizational networks, and the
impact of central inventors: A longitudinal study of pharmaceutical firms.
Organization Science, 21(1): 63–80.
Paxton, P., & Moody, J. 2003. Structure and sentiment: Explaining emotional attachment
to group. Social Psychology Quarterly, 66(1): 34–47.
Penrose, E. 1959. The theory of the growth of the firm. Oxford: Basil Blackwell.
Pfeffer, J., & Nowak, P. 1976. Joint ventures and interorganizational interdependence.
Administrative Science Quarterly, 21(3): 398–418.
PhRMA. 2013. 2013 Profile biopharmaceutical research industry.
http://www.phrma.org/sites/default/files/pdf/PhRMA%20Profile%202013.pdf.
accessed 28 December 2016.
Phelps, C. C. 2010. A longitudinal study of the influence of alliance network structure
and composition on firm exploratory innovation. Academy of Management Journal,
53(4): 890–913.
Podolny, J. M. 1993. A status-based model of market competition. American Journal of
Sociology, 98(4): 829–872.
Podolny, J. M. 2001. Networks as the pipes and prisms of the market. American Journal
of Sociology, 107(1): 33–60.
141
Podolny, J. M., Stuart, T. E., & Hannan, M. T. 1996. Networks, knowledge, and niches:
Competition in the worldwide semiconductor industry, 1984-1991. American
Journal of Sociology, 102(3): 659–689.
Polidoro, F., Ahuja, G., & Mitchell, W. 2011. When the social structure overshadows
competitive incentives: The effects of network embeddedness on joint venture
dissolution. Academy of Management Journal, 54(1): 203–223.
Porter, M. E. 1979. The structure within industries and companies’ performance. The
Review of Economics and Statistics, 61(2): 214–227.
Portes, A., & Landolt, P. 1996. The downside of social capital. The American Prospect,
94(26): 18–21.
Powell, W. W., Koput, K. W., & Smith-Doerr, L. 1996. Interorganizational collaboration
and the locus of innovation: Networks of learning in biotechnology. Administrative
Science Quarterly, 41(1): 116–145.
Powers, D., & Xie, Y. 2000. Statistical models for categorical data analysis. San Diego,
CA: Academic Press.
Rabe-Hesketh, S., Skrondal, A., Pickles, A. 2004. Generalized multilevel structural
equation modeling. Psychometrika, 69(2): 167–190.
Reagans, R., & McEvily, B. 2003. Network structure and knowledge transfer: The effects
of cohesion and range. Administrative Science Quarterly, 48(2): 240–267.
Reagans, R., Zuckerman, E., & McEvily, B. 2004. How to make the team: Social
networks vs. demography as criteria for designing effective teams. Administrative
Science Quarterly, 49(1): 101–133.
Reinholt, M. I. A., Pedersen, T., & Foss, N. J. 2011. Why a central network position isn’t
enough: the role of motivation and ability for knowledge sharing in employee
networks. Academy of Management Journal, 54(6): 1277–1297.
Reuer, J. J., & Lahiri, N. 2014. Searching for alliance partners: Effects of geographic
distance on the formation of R&D collaborations. Organization Science, 25(1): 283–
298.
Rodan, S. 2010. Structural holes and managerial performance: Identifying the underlying
mechanisms. Social Networks, 32(3): 168-179.
Rodan, S., & Galunic, C. 2004. More than network structure: How knowledge
heterogeneity influences managerial performance and innovativeness. Strategic
Management Journal, 25(6): 541–562.
Rowley, T. J., Baum, J. A., Shipilov, A. V., Greve, H. R., & Rao, H. 2004. Competing in
groups. Managerial and Decision Economics, 25(6‐7): 453–471.
142
Rowley, T., Behrens, D., & Krackhardt, D. 2000. Redundant governance structures: An
analysis of structural and relational embeddedness in the steel and semiconductor
industries. Strategic Management Journal, 21(3): 369–386.
Rowley, T. J., Greve, H. R., Rao, H., Baum, J. A., & Shipilov, A. V. 2005. Time to break
up: Social and instrumental antecedents of firm exits from exchange cliques.
Academy of Management Journal, 48(3): 499–520.
Ryall, M. D., & Sorenson, O. 2007. Brokers and competitive advantage. Management
Science, 53(4): 566–583.
Ryu, K. 1994. Group duration analysis of the proportional hazard model – Minimum chi-
squared estimators and specification tests. Journal of the American Statistical
Association, 89(428): 1386–1397.
Sampson, R. C. 2007. R&D alliances and firm performance: The impact of technological
diversity and alliance organization on innovation. Academy of Management Journal,
50(2): 364–386.
Sapienza, H. J., Autio, E., George, G., & Zahra, S. A. 2006. A capabilities perspective on
the effects of early internationalization on firm survival and growth. Academy of
Management Review, 31(4): 914–933.
Sasovova, Z., Mehra, A., Borgatti, S. P., & Schippers, M. C. 2010. Network churn: The
effects of self-monitoring personality on brokerage dynamics. Administrative Science
Quarterly, 55(4): 639–670.
Saunders, D. R. 1955. The “moderator variable” as a useful tool in prediction. In
Proceedings of the ETS invitational conference on testing problems: 54–58.
Princeton, NJ: Educational Testing Service.
Saxenian, A. 1996a. Inside-out: Regional networks and industrial adaptation in Silicon
Valley and Route 128. Cityscape: A Journal of Policy Development and Research,
2(2): 41–60
Saxenian, A. 1996b. Regional advantage: Culture and competition in Silicon Valley
and Route 128. Cambridge, MA: Harvard University Press.
Schildt, H., Keil, T., & Maula, M. 2012. The temporal effects of relative and firm‐level
absorptive capacity on interorganizational learning. Strategic Management Journal,
33(10): 1154–1173.
Schilling, M. A., & Phelps, C. C. 2007. Interfirm collaboration networks: The impact of
large-scale network structure on firm innovation. Management Science, 53(7): 1113–
1126.
Schweizer, L. 2005. Organizational integration of acquired biotechnology companies into
pharmaceutical companies: the need for a hybrid approach. Academy of Management
Journal, 48(6): 1051–1074.
143
Shaver, J. M. 2007. Interpreting empirical results in strategy and management research.
In D. J. Ketchen & D. D. Bergh (Eds.), Research methodology in strategy and
management, vol. 4: 273–293. Bingley, United Kingdom: Emerald Group Publishing
Limited.
Simmel, G. 1950. The sociology of Georg Simmel (K. H. Wolff, Trans.). Glencoe, IL:
The Free Press.
Singh, J. 2005. Collaborative networks as determinants of knowledge diffusion patterns.
Management Science, 51(5): 756–770.
Soda, G., Usai, A., & Zaheer, A. 2004. Network memory: The influence of past and
current networks on performance. Academy of Management Journal, 47(6): 893–
906.
Sorenson, O., & Audia, P. G. 2000. The social structure of entrepreneurial activity:
Geographic concentration of footwear production in the United States, 1940-1989.
American Journal of Sociology, 106(2): 424-462.
Spiro, E. S., Acton, R. M., & Butts, C. T. 2013. Extended structures of mediation: Re-
examining brokerage in dynamic networks. Social Networks, 35(1): 130-143.
Stock, J. H., Wright, J. H., & Yogo, M. 2002. A survey of weak instruments and weak
identification in generalized method of moments. Journal of Business & Economic
Statistics, 20(4): 518–529.
Stovel, K., Golub, B., & Milgrom, E. M. M. 2011. Stabilizing brokerage. Proceedings of
the National Academy of Sciences, 108(S4): 21326–21332.
Stuart, T. E., Ozdemir, S. Z., & Ding, W. W. 2007. Vertical alliance networks: The case
of university–biotechnology–pharmaceutical alliance chains. Research Policy, 36(4):
477–498.
Subramani, M. R., & Venkatraman, N. 2003. Safeguarding investments in asymmetric
interorganizational relationships: Theory and evidence. Academy of Management
Journal, 46(1): 46–62.
Suzuki, J., & Kodama, F., 2004. Technological diversity of persistent innovators in
Japan: two case studies of large Japanese firms. Research Policy, 33: 531–549.
Sytch, M., & Tatarynowicz, A. 2014. Exploring the locus of invention: The dynamics of
network communities and firms’ invention productivity. Academy of Management
Journal, 57(1): 249–279.
Sytch, M., Tatarynowicz, A., & Gulati, R. 2012. Toward a theory of extended contact:
The incentives and opportunities for bridging across network communities.
Organization Science, 23(6), 1658–1681.
Tan, J., Zhang, H., & Wang, L. 2015. Network Closure or Structural Hole? The
Conditioning Effects of Network Level Social Capital on Innovation Performance.
144
Entrepreneurship Theory and Practice, 39(5): 1189–1212.
Tatarynowicz, A., Sytch, M., & Gulati, R. 2016. Environmental Demands and the
Emergence of Social Structure Technological Dynamism and Interorganizational
Network Forms. Administrative Science Quarterly, 61(1): 52–86.
Ter Wal, A. L. 2014. The dynamics of the inventor network in German biotechnology:
geographic proximity versus triadic closure. Journal of Economic Geography, 14:
589–620.
Ter Wal, A. L., Boschma, R. A. 2009. Applying social network analysis in economic
geography: Framing some key analytic issues. The Annals of Regional Science,
43(3): 739–756.
Terza, J. V. 1998. Estimating count data models with endogenous switching: Sample
selection and endogenous treatment effects. Journal of Econometrics, 84: 129–154.
The Economist. 1999. Innovation in industry: Industry gets religion.
https://www.economist.com/node/186620. accessed 22 March 2018.
Time. 2013. Lipitor already cheaper after patent expiration.
http://business.time.com/2011/12/01/lipitor-patent-expiration-wont-mean-cheaper-
generics-yet/. accessed 12 January 2015.
Tortoriello, M., & Krackhardt, D. 2010. Activating cross-boundary knowledge: The role
of Simmelian ties in the generation of innovations. Academy of Management
Journal, 53(1): 167–181.
Tortoriello, M., McEvily, B., & Krackhardt, D. 2014. Being a catalyst of innovation: the
role of knowledge diversity and network closure. Organization Science, 26(2): 423–
438.
Trajtenberg, M. 1990. A penny for your quotes: patent citations and the value of
innovations. The RAND Journal of Economics, 21(1): 172–187.
Utterback, J. M. 1971. The process of technological innovation within the firm. Academy
of Management Journal, 14(1): 75–88.
Utterback, J. M. 1994. Mastering the dynamics of innovation: How companies can seize
opportunities in the face of technological change. University of Illinois at Urbana-
Champaign’s Academy for Entrepreneurial Leadership Historical Research Reference
in Entrepreneurship. Available at SSRN: https://ssrn.com/abstract=1496719
Uzzi, B. 1997. Social structure and competition in interfirm networks: The paradox of
embeddedness. Administrative Science Quarterly, 42(1): 35–67.
Van Wijk, R., Van den Bosch, F. A. J., & Volberda, H. K. 2001.The impact of
knowledge depth and breadth of absorbed knowledge on levels of exploration and
exploitation. Paper presented at the annual meeting of the Academy of Management,
Washington, DC.
145
Vasudeva, G., & Anand, J. 2011. Unpacking absorptive capacity: A study of knowledge
utilization from alliance portfolios. Academy of Management Journal, 54(3): 611–
623.
Vasudeva, G., Zaheer, A., & Hernandez, E. 2012. The embeddedness of networks:
Institutions, structural holes, and innovativeness in the fuel cell industry.
Organization Science, 24(3): 645–663.
Vissa, B., & Bhagavatula, S. 2012. The causes and consequences of churn in
entrepreneurs’ personal networks. Strategic Entrepreneurship Journal, 6(3): 273–
289.
Von Hippel, E. 1994. “Sticky information” and the locus of problem solving:
implications for innovation. Management science, 40(4): 429–439.
Walker, G., Kogut, B., & Shan, W. 1997. Social capital, structural holes and the
formation of an industry network. Organization Science, 8(2): 109–125.
Wasserman, S., & Faust, K. 1994. Social network analysis: Methods and applications.
New York: Cambridge University Press.
Watts, A. 2001. A dynamic model of network formation. Games and Economic
Behavior, 34: 331–341.
Watts, D. J. 1999. Networks, dynamics, and the small‐world phenomenon. American
Journal of Sociology, 105(2): 493–527.
Wellman, B., Renita, Y. W., David T., & Nancy, N. 1997. A decade of network change:
Turnover, persistence, and stability in personal communities. Social Networks, 19:
27–50
Westney, E., & Zaheer, S. 2008. The multinational enterprise as an organization. In A.
Rugman (Ed.), Oxford Handbook of International Business: 341–366. New York:
Oxford University Press.
Whittington, K. B., Owen-Smith, J., & Powell, W. W. 2009. Networks, propinquity, and
innovation in knowledge-intensive industries. Administrative Science Quarterly,
54(1): 90–122.
Wiersema, M., & Bantel, K. 1992. Top management team demography and corporate
strategic change. Academy of Management Journal, 35 (1): 91–121.
Williamson, O. 1985. The economic institutions of capitalism. New York: The Free
Press.
Winkelmann, R. 2008. Econometric analysis of count data. New York: Springer.
Wooldridge, J. M. 1997a. Quasi-likelihood methods for count data. In M. H. Pesaran &
P. Schmidt (Eds.), Handbook of applied econometrics: Microeconomics, vol. 2:
321–368. Oxford: Blackwell Publishers

146
Wooldridge, J. M. 1997b. Multiplicative panel data models without the strict exogeneity
assumption. Econometric Theory, 13(05): 667–678.
Wooldridge, J. M. 1999. Distribution-free estimation of some nonlinear panel data
models. Journal of Econometrics, 90(1): 77–97.
Wooldridge, J. M. 2005. Simple solutions to the initial conditions problem in dynamic,
nonlinear panel data models with unobserved heterogeneity. Journal of Applied
Econometrics, 20(1): 39–54.
Wooldridge, J. M. 2010. Econometric analysis of cross section and panel data.
Cambridge: The MIT press.
Wooldridge, J. M. 2015. Testing and correcting for endogeneity in nonlinear
unobserved effects models. Presented at IAAE Lecture 21st International Panel Data
Conference. http://paneldataconference2015.ceu.hu/Program/Jeff-Slides.pdf. accessed
10 June 2016.
Yayavaram, S., & Ahuja, G. 2008. Decomposability in knowledge structures and its
impact on the usefulness of inventions and knowledge-base malleability.
Administrative Science Quarterly, 53(2): 333–362.
Zaheer, S. 1995. Overcoming the liability of foreignness. Academy of Management
Journal, 38(2): 341–363.
Zaheer, A., & Bell, G. G. 2005. Benefiting from network position: firm capabilities,
structural holes, and performance. Strategic Management Journal, 26(9): 809–825.
Zaheer, A., McEvily, B., & Perrone, V. 1998. Does trust matter? Exploring the effects of
interorganizational and interpersonal trust on performance. Organization Science,
9(2): 141–159.
Zaheer, A., & Soda, G. 2009. Network evolution: The origins of structural holes.
Administrative Science Quarterly, 54(1): 1–31.
Zelner, B. A. 2009. Using simulation to interpret results from logit, probit, and other
nonlinear models. Strategic Management Journal, 30(12): 1335–1348.
Zhao, M. 2006. Conducting R&D in countries with weak intellectual property rights
protection. Management Science, 52(8): 1185–1199.
Zhang, Y., Li, H., Li, Y., & Zhou, L. A. 2010. FDI spillovers in an emerging market: The
role of foreign firms’ country origin diversity and domestic firms’ absorptive
capacity. Strategic Management Journal, 31(9): 969–989.
Zhang, A., & Zhang, Y. 2006. Rivalry between strategic alliances. International Journal
of Industrial Organization, 24(2): 287–301.
Zollo, M., Reuer, J. J., & Singh, H. 2002. Interorganizational routines and performance in
strategic alliances. Organization Science, 13(6): 701 –713.

147
APPENDIX 1

148
APPENDIX 2
Exemplars for Each Step in the Flowchart
STEP 1: DOES THE ALLIANCE EXIST IN REALITY? THREE EXEMPLARS
(CASES) OF ALLIANCES THAT I DROPPED (1.88%)
Case 1: Advanced Magnetics, Inc., and Matritech, Inc. [01Aug1991]
“Advanced Magnetics signed an agreement with Matritech to distribute jointly developed
cell death detection products.” - SDC
My conclusion: The alliance might not exist. I could not find any news or description
pertaining to this alliance. The 10-K and 10-Q reports of Matritech, Inc., are available at
http://www.getfilings.com/comp/k0000884847.html from 1996 to 2005. None of these
documents discuss the alliance of 1991 or mention Advanced Magnetics, Inc., in a new
alliance. Likewise, I know that Advanced Magnetics, Inc. (NASDAQ: AMAG) changed
its name to AMAG Pharmaceuticals, Inc., in 2007 (https://www.amagpharma.com/ ) but
again no information about the alliance exist.
Case 2: Green Cross, Corp., and Oxford Virology, Ltd., (Oxford Virology, P.L.C.)
[01Jun1990]
“Green Cross Corp signed an agreement with Oxford Virology Ltd to market their
vaccine Hepavax.” - SDC
My conclusion: The alliance might not exist. I could not find any news or description
pertaining to this alliance. Furthermore, Oxford Virology, P.L.C., which was
incorporated on 20 April 1989 is dissolved with latest accounts filed only till 30 Sep
1990. Next filing of accounts was due on 30 Jun 1992 but was not filed according to
https://companycheck.co.uk/company/02374305/OXFORD-VIROLOGY-
PLC/companies-house-data. Given that the alliance was announced on 01 Jun 1990 but
no news exist, and Oxford was dissolved with a year or so with last account filing till 30
Sep 1990, I cannot conclude that the alliance exist in reality.
Case 3: HBT Holland Biotechnology, B.V., and Diagnostica Stago, S.A.S.
[01Jan1991]
“HBT Holland biotechnology B.V. signed an agreement with Diagnostica Stago for
Diagnostica to distribute Hbt’s IFN-related products in the German market.” - SDC

149
My conclusion: The alliance might not exist. I could not find any news or description
pertaining to this alliance. HBT Holland Biotechnology, B.V., is located in Leiden in the
Netherlands and Diagnostica Stago in Cedex, France. Even local searches such as those
using google.fr and google.nl yielded no results.
STEP 2: IS THE ALLIANCE TERMINATION DATE GIVEN? CHECK FOR
ANY EXTENSION OR NEW ALLIANCE BETWEEN THE TWO PARTNERS
AND USE THE FINAL ALLIANCE ENDING DATE AS THE TERMINATION
DATE. THREE EXEMPLARS (CASES) (TERMINATION DATES FOUND IN
9.81% OF THE CASES)
Case 1: Axcan Pharma, Inc., and Grupo Ferrer Internacional, S.A. [20 Jul 2000]
“Axcan Pharma (AP) and Grupo Ferrer International (GF) planned to form a strategic
alliance wherein AP sublicensed to GF the rights to distribute PHOTOFRIN in Spain,
Portugal, Greece as well as in all Central and South America countries (original length =
5 years)” (emphasis mine). - SDC
https://www.thefreelibrary.com/Axcan+and+Grupo+Ferrer+to+form+Strategic+Alliance
+for+the...-a063583153
“Axcan and Grupo Ferrer to form Strategic Alliance for the Distribution of Photofrin in
Europe, Central and South America.
MONT SAINT-HILAIRE, Quebec, July 20 /CNW-PRN/ -
…Under the terms of the proposed agreement expected to be executed in October 2000,
Grupo Ferrer will assume responsibility for completing the registration of
PHOTOFRIN(R) in all countries that are part of its exclusive territory. Axcan will also
benefit from a right of first refusal granted for a five-year period with respect to the
distribution of a gastro-intestinal product developed or acquired by Grupo Ferrer in
Canada and the United States. Other terms were not disclosed...” (emphasis mine).
My conclusion: I reconfirm that the alliance existed in reality and its original length was
five years.
http://www.secinfo.com/dVut2.25Hk.d.htm
“Axcan Pharma Inc – ‘40-F/A’ for 9/30/02 – EX-1
In January 2002, Axcan entered into a sublicense agreement for a 10-year period with
Grupo Ferrer International, S.A. (“Grupo Ferrer”), a Spanish company based in
Barcelona, for the distribution of PHOTOFRIN in Spain, Portugal and Greece” (emphasis
mine).
150
My conclusion: I further checked for any extension or new alliance and find that the
relationship between Axcan and Grupo Ferrer was further extended from a five-year
duration to a ten-year duration in 2002. Thus, the alliance existed at least till 2005, my
last period of observation. I further validated that these parties did not terminate this
alliance till 2005 because no such news exist.
Case 2: Discovery Partners International, Inc., and Pfizer, Inc. [20 Dec 2001]
“Discovery Partners International Inc(DO) and Pfizer Inc(PI) planned to form a strategic
alliance to manufacture and develop libraries of high purity chemical compounds to be
used in PI’s drug discovery programs in the United States. The estimated potential value
of this 4-year collaboration was to reach $95 mil US. Financial terms were not disclosed
(original length = 4 years).” - SDC
http://www.thepharmaletter.com/article/discovery-partners-int-expands-pfizer-deal
“Discovery Partners Int expands Pfizer deal
01-03-2004
Discovery Partners International has signed a multi-year strategic chemistry agreement
with drug major Pfizer, expanding the scope of their current collaboration which was
initiated in December 2001…, the company expects at least $43-$46 million from Pfizer
over the next two years” (emphasis mine).
My conclusion: I reconfirm that the alliance existed in reality in 2001 and existed at least
till 2006 because the news is from 2004 and Discovery Partners expects payment from
Pfizer over the next two years.
http://www.prnewswire.com/news-releases/discovery-partners-international-announces-
termination-of-new-collaboration-discussions-with-pfizer-inc-and-consolidation-of-
chemistry-operations-55733102.html
“Discovery Partners International Announces Termination of New Collaboration
Discussions With Pfizer Inc and Consolidation of Chemistry Operations
Nov 29, 2005, 00:00 ET from Discovery Partners International, Inc.
SAN DIEGO, Nov. 29 /PRNewswire-FirstCall/ -- Discovery Partners International, Inc.
(Nasdaq: DPII) announced today that the Company and Pfizer Inc have terminated
discussions regarding a potential new collaboration to replace the Company’s existing
agreement with Pfizer that expires on January 5, 2006” (emphasis mine).
My conclusion: I further verified and found that the relationship was terminated on
January 5, 2006.

151
Case 3: Corixa, Corp., and GlaxoSmithKline Biologicals, S.A. [26 Jul 2004]
“Corixa Corp (CC) and GlaxoSmithKline Biologicals (GB), a unit of GlaxoSmithKline
PLC, formed an 8-year strategic alliance to manufacture as well as wholesale and supply
adjuvant, monophosphoryl lipid A or MPL(R).;CC’s MPL adjuvant, a component in
GB’s novel, proprietary adjuvant systems used in the development of future vaccines
currently undergoing clinical trials or awaiting regulatory approval. Under terms of the
agreement, CC agreed to expand cGMP compliant MPL production capacity in
association with anticipated approvals of GB vaccines that contain MPL adjuvant
(original length = 8 years).” - SDC
www.outsourcing-pharma.com/Preclinical-Research/GSK-acquires-Corixa-for-233m
“GSK acquires Corixa for €233m
May 2, 2005
GlaxoSmithKline has announced plans to acquire the Corixa Corporation...”
My conclusion: Even though SDC shows that the alliance duration is eight years or till
2012, I find that the alliance ended in 2005 because GlaxoSmithKline acquired Corixa on
12 July 2005.
STEP 3: CAN WE SEARCH THE TERMINATION DATE USING PARTNER
NAMES WITH THE WORD “TERMINATE,” “END” ETC., WITH/WITHOUT
DRUGS OR DISEASE NAMES? FURTHER CHECK FOR ANY EXTENSION OR
NEW ALLIANCE BETWEEN THE TWO PARTNERS AND USE THE FINAL
ALLIANCE ENDING DATE AS THE TERMINATION DATE. SEVEN
EXEMPLARS (CASES) (TERMINATION DATES FOUND FOR 69.17% OF THE
CASES)
Case 1: Incara Pharmaceuticals, Corp., and Elan Corp, P.L.C. [28 Dec 2000]
“Incara Pharmaceuticals Corp (IP) and Elan Corp PLC(EC) completed their joint venture.
In December 2000, IP and EC announced plans to form a joint venture named Incara
Development Ltd to develop Herparin products using EC’s medipad delivery system for
treatment of inflammatory bowel disease. ID was to be owned 80% by IP, with EC
owning the remaining 20% with an option to own 50% within the next six years. As part
of the agreement, EC was to make a $4 mil US investment in IC.” - SDC
https://www.sec.gov/Archives/edgar/data/1261734/000119312504138007/d424b3.htm
“Aeolus Pharmaceuticals, Inc.
(f/k/a Incara Pharmaceuticals Corporation)

152
Prospectus Supplement No. 5 dated August 11, 2004
(To Prospectus dated May 27, 2004)
In January 2001,…, Elan and the Company formed a Bermuda corporation, Incara
Development, Ltd., to develop deligoparin,...In September 2002, Incara Development
ended its Phase 2/3 clinical trial and the development of deligoparin due to an analysis of
the clinical trial results, which showed that treatment with deligoparin did not meet the
primary or secondary endpoints of the study. The results of the trial did not justify further
development of deligoparin for treatment of ulcerative colitis and the development of
deligoparin was terminated. Elan and the Company ended their collaboration in the joint
venture in November 2003 and the Company became the sole owner of Incara
Development” (emphasis mine).
My conclusion: Even though the two partners formed a joint venture, which are supposed
to be relatively stable, I find this partnership lasted only three years till November 2003.
https://www.sec.gov/Archives/edgar/data/1261734/000095016204000670/0000950162-
04-000670.txt
“CONFORMED SUBMISSION TYPE: SC 13D/A
FILED AS OF DATE: 20040527
COMPANY CONFORMED NAME: INCARA PHARMACEUTICALS CORP
FILED BY:
COMPANY CONFORMED NAME: ELAN INTERNATIONAL SERVICES LTD
13. Termination Agreement, made the 19th day of November, 2003 (filed herewith)”
(emphasis mine).
My conclusion: Incara and Elan terminated their partnership on 19 Nov 2003. I further
find no new relationships were formed between the two parties.
http://adisinsight.springer.com/drugs/800006120
“Most Recent Events
OP2000
17 Sep 2002 Discontinued - Phase-III for Ulcerative colitis in USA (SC)
29 Aug 2002 Incara has completed patient enrolment in its phase II/III trial of deligoparin
for the treatment of ulcerative colitis
20 Mar 2002 A study has been added to the Inflammatory Bowel Disorders therapeutic
trials section”
My conclusion: I don’t need this information because I already determined the
153
termination date. Note that Incara’s drug was discontinued on 17 Sep 2002 and the
alliance terminated by next year. Thus, drug discontinuity date is a close proxy for
determining alliance duration, though not a focus of this section.
Case 2: Eisai, Inc., and Pfizer, Inc. [25 Jul 2002]
“Eisai Inc, a unit of Eisai Co Ltd, and Pfizer Inc formed a strategic alliance to
manufacture and market Cerebyx, used for the treatment of epilepsy. Financial terms
were not disclosed” (emphasis mine). - SDC
http://www.prnewswire.com/news-releases/eisai-inc-assumes-us-distribution-
responsibilities-for-aciphexr-58749807.html
“Jan 07, 2004, 00:00 ET from Eisai Inc.
…Last year, Eisai acquired exclusive U.S. rights to promote Pfizer’s Cerebyx(R)
(fosphenytoin sodium injection)” (emphasis mine).
My conclusion: Eisai and Pfizer were partners at least till 2003.
http://www.eisai.com/pdf/eir/emat/4523_070515e.pdf
“FY2006
Financial Results
Presentation
May 15, 2007
Eisai Co., Ltd.
Expanded product portfolio:
…5. Cerebyx
® (Status epilepticus control agent)” (emphasis mine).
My conclusion: Eisai and Pfizer were partners at least till 2005, my last year of
observation because Esai still has Cerebyx in its portfolio in 2006.
Case 3: Sonus Pharmaceuticals, Inc., and Sicor, Inc. [01Jul 2002]
“Sonus Pharmaceuticals Inc (SP) and Gensia Sicor Pharmaceuticals Inc formed a
strategic alliance to manufacture and supply SP’s TOCOSOL(TM) Paclitaxel to support
advanced clinical development of cancer therapy product in the United States” (emphasis
mine). - SDC
http://ir.oncogenex.com/releasedetail.cfm?ReleaseID=265742
“July 1, 2002

154
Sonus Pharmaceuticals Announces TOCOSOL Paclitaxel Manufacturing and Supply
Agreement with Gensia Sicor Pharmaceuticals” (emphasis mine).
https://www.sec.gov/Archives/edgar/data/949858/000089256903002113/a92469b3e424b
3.htm
“SONUS PHARMACEUTICALS, INC.
PROSPECTUS
August 28, 2003
SICOR Pharmaceuticals, Inc. is our primary manufacturer of TOCOSOL Paclitaxel for
clinical studies and has also agreed to manufacture TOCOSOL Paclitaxel for
commercialization” (emphasis mine).
My conclusion: Sonus and Sicor were partners at least till 2003.
http://files.shareholder.com/downloads/SNUS/0x0xS1104659-07-
19876/949858/filing.pdf
“FORM 10-K
SONUS PHARMACEUTICALS INC
(Annual Report)
Filed 3/16/2007 For Period Ending 12/31/2006
In mid-2002, we entered into a manufacturing and supply agreement with Sicor
Pharmaceutical Sales, Inc. (Sicor is now known as TEVA Pharmaceuticals USA). During
2003, in collaboration with TEVA Pharmaceuticals USA, we completed scale-up of …
“ MSA ” means the Manufacturing and Supply Agreement between Sonus and Gensia
Sicor Pharmaceutical Sales, Inc. (now known as Sicor Pharmaceuticals, Inc.), effective as
of June 26, 2002.
“ Quality Agreement ” means the Quality Agreement for the Manufacturing and Supply
of Tocosol® Paclitaxel Injectable Emulsion between Sonus and Sicor Pharmaceuticals,
Inc., effective as of February 1, 2005. A complete copy of the Quality Agreement is
attached hereto as Exhibit A” (emphasis mine).
My conclusion: Sonus and Sicor were partners at least till 2005. Note that Sicor was
acquired by Teva in 2004 (from my research on acquisitions). Hence, from 2002 to 2004
Sonus and Sicor were partners, and from 2004 to 2005 Sonus and Teva were partners.
Case 4: Human Genome Sciences, Inc., and Genentech, Inc. [20 Apr 1994]
“Human Genome Sciences Inc entered into a strategic alliance with Genentech Inc, a unit
of Roche Holding, in which Human Genome Sciences granted Genentech an exclusive
license to its Heart/Lung Selective DNase gene and recombinant DNA products derived

155
from the gene. Genentech intended to use the gene in the development of a treatment for
cystic fibrosis. Financial terms were not disclosed.” - SDC
“HD Human Genome Sciences and Genentech to collaborate
WC 271 words
PD 20 April 1994
SN Business Wire
SC BWR
LA English
CY (Copyright (c) 1994, Business Wire)
LP
ROCKVILLE, Md.--(BUSINESS WIRE)--April 20, 1994--Human Genome Sciences Inc.
(HGS) (NASDAQ:HGSI) announced Wednesday that it has granted Genentech Inc.
(NYSE:GNE) an exclusive option to license its recently discovered human Heart/Lung
Selective DNase (HL-DNase) gene and recombinant DNA products derived from the
gene” (emphasis mine). - Factiva
“HD Genentech Terminates HL-DNase Pact With Human Genome Sciences
WC 83 words
PD 3 March 1995
ET 04:09 PM GMT
SN Dow Jones News Service
SC DJ
LA English
CY (Copyright (c) 1995, Dow Jones & Co., Inc.)
LP
ROCKVILLE, Md. -DJ- Human Genome Sciences Inc. (HGSI) said Genentech Inc.
(GNE) terminated its previously announced option and evaluation agreement with
Human Genome for heart-lung selective human HL-DNase.
TD
Genentech found the protein difficult to express in the systems used, Human Genome
said.
(END) DOW JONES NEWS 03-03-95” (emphasis mine). - Factiva
My conclusion: Human Genome and Genentech terminated the relationship on 3 March
1995.

156
Case 5: Ciba-Geigy, A.G., and CoCensys, Inc. [17 May1994]
“Ciby-Geigy AG and CoCensys Inc have agreed to jointly develop in the US a
therapeutic for the treatment of strokes and head trauma. The jointly developed drug was
known as Acea 1021. Under the terms of the agreement, Ciba agreed to make an initial
investment in CoCensys, with additional payments to be made in the future. In return,
Ciba received the right to develop and market Acea 1021 outside the US. Ciba was also
slated to take an equity stake in CoCensys. CoCensys also entered into a marketing
agreement with Ciba-Geigy Corp, Ciba’s unit in Summit, New Jersey, at the same time as
this agreement” (emphasis mine). - SDC
http://www.biocentury.com/biotech-pharma-news/strategy/1997-05-05/noteworthy-how-
cocensys-plans-life-after-novartis-a4
“How CoCensys plans life after Novartis
By Ilan Zipkin
Staff Writer
Published on Monday, May 5, 1997
Finding opportunity in adversity is critical to running a sustainable company. CoCensys
Inc. (COCN, Irvine, Calif.) is trying to do just that after partner Novartis Pharma AG
(Basel, Switzerland) said it would drop development of COCN’s ACEA 1021 NMDA-
receptor antagonist for stroke and head injury. …The compound was originally licensed
to Ciba-Geigy (now part of Novartis) in 1994 from Acea Pharmaceuticals Inc., at the
same time that COCN acquired Acea and the rights to 1021 (see BioCentury May 23,
1994)” (emphasis mine).
My conclusion: CoCensys and Ciba-Geigy partnership lasted till 1995. In 1996 Ciba-
Geigy and Sandoz formed Novartis (my research on acquisitions).Cocensys and Novartis
alliance continued from 1996 to 1997. Note Novartis terminated the alliance after the
merger.
Case 6 Yamanouchi Pharmaceutical Co., Ltd., and Warner-Lambert Co. [10
May2000]
“Yamanouchi Pharmaceutical Co Ltd (YP) and Warner-Lambert Co (WL) formed a
strategic alliance to manufacture and wholesale Lipitor tablets, a lipid-loweing agent, in
Japan. Lipitor was developed by WL and was co-promoted by YP in Japan” (emphasis
mine). – SDC

157
https://www.marketwatch.com/story/astellas-japan-license-for-lipitor-to-run-to-2021-
2012-03-28
“Astellas: Japan license for Lipitor to run to 2021
Published: Mar 28, 2012 10:35 p.m. ET
TOKYO (MarketWatch) -- Astellas Pharma Inc. (4503.TO) said Thursday it has reached
an agreement to extend its contract to sell Pfizer Inc.’s PFE, +1.43% cholesterol drug
Lipitor in Japan until March 2021 from 2016.
The drug maker said in a statement it will initially pay Pfizer a sum of Y1 billion. The
two firms also agreed to extend their co-promotion agreement until November 2013”
(emphasis mine).
My conclusion: Note that Pfizer acquired Warner-Lambert Co., in 2000 (my research on
acquisitions). The correct ultimate parent of Warner-Lambert is Pfizer, and I corrected
it.Yamanouchi and Pfizer had an alliance from 2002 to 2004. Yamanouchi and Fujisawa
merged to form Astella in 2005 (my research on acquisitions). Astella and Pfizer had an
alliance in 2005. Unlike case 5, alliance continued after the merger.
Case 7: Vical, Inc., and Merck & Co, Inc. [04 May1994]
“Merck & Co and Vical Inc entered into an agreement which stated that Vical Inc granted
Merck & Co an exclusive license for the use of Vical Inc’s gene technology used in the
treatment of tuberculosis. Under the terms of the agreement, Merck also exercised its
options to license Vical’s technology to integrate two vaccine targets, hepatitis C and
human papiloma viruses. The agreement stated that Merck extended its exclusive option
for Vical’s technology to integrate with viral vaccine targets, hepatitis B and herpes
simplex. Merck & Co was required to exercise its remaining options with Vical by mid-
1995 for hepatitis B and herpes and by mid-1996 for Vical’s tuberculosis {TB} vaccine.
On May 1, 1995, Merck exercised its remaining three options to Vical’s naked DNA
vaccine technology. The agreement stated that Merck & Co paid a total of $3.0 mil US
for licensing fees and option rights. The agreement also stated that Vical Inc would
receive milestone payments and royalties licensed vaccine-related products developed by
Merck & Co” (emphasis mine). - SDC
http://www.wikinvest.com/stock/Vical_(VICL)/Merck
“These excerpts taken from the VICL 10-K filed Mar 3, 2009.
Merck
In 2003, the Company amended the agreement, providing Merck options for rights to use
the Company’s core DNA delivery technology for three cancer targets. In addition,
Merck returned rights to the Company for Certain infectious disease vaccines. Merck has
158
retained rights to use the licensed technology for HIV, hepatitis C virus, and hepatitis B
virus. In June 2005, Merck exercised options related to three cancer targets that were
granted under the 2003 amendment” (emphasis mine).
My conclusion: Vical and Merck partnership lasted at least till 2005, the last year of my
observation.
STEP 4: WAS THE DRUG OR CLINICAL TRIAL DISCONTINUED? FURTHER
CHECK FOR ANY EXTENSION OR NEW ALLIANCE BETWEEN THE TWO
PARTNERS. IN CASE OF A NEGATIVE, USE THE DISCONTINUITY DATE AS
THE TERMINATION DATE; ELSE USE THE FINAL ALLIANCE ENDING
DATE. FIVE EXEMPLARS (CASES) (TERMINATION DATES WERE FOUND
FOR 2.37% OF THE CASES)
Case 1: American Home Products, Corp., and Eisai & Co., Ltd. [01 Oct 1991]
“American Home Products Corp and Eisai Co., Ltd formed a joint marketing venture
with American Home Products owning 50.1% and Eisai owning the rest. The new
company, Wyeth-Eisai Co. Ltd., was to develop pharmaceutical and nutritional products
made by American Home Products. American Home Products would provide the venture
with marketing and clinical development personnel, while Eisai was to handle
management. Both companies were to contribute $7.4 million to the new company. The
new company expected first year sales to reach $74.1 million.” - SDC
“HD Eisai, American Home to establish joint firm
WC 103 words
PD 11 September 1991
SN Agence France-Presse
SC AFPR
LA English
CY (Copyright 1991)” - Factiva
http://www.eisai.com/news/news199601.html
“March 1, 1996
AHP and Eisai End their Joint Venture Partnership
…AHP will purchase Eisai’s shares Wyeth-Eisai (49.99%) … today (March 1, 1996).
… Although the joint venture partnership is ending, AHP and Eisai will maintain an
amicable relationship” (emphasis mine).

159
My conclusion: AHP and Esai ended their JV in 1996. I further validate whether new
alliances were formed between the two.
http://www.eisai.com/news/news199705.html
“March 5, 1997 - Eisai Co., Ltd. of Tokyo (President and CEO: Haruo Naito) today
announced that Wyeth-Ayerst, a subsidiary of American Home Products Corporation,
filed a new drug application with the Mexican Ministry of Health on January 17, 1997 for
Eisai’s new Alzheimer’s disease treatment, donepezil hydrochloride or E2020 under the
trademark of ERANZ(TM) in Mexico.
In February 1995, Eisai Co., Ltd. concluded a license agreement with American Home
Products Corporation for E2020, an Alzheimer’s disease treatment in Latin America.
Applications for registration in other major Latin American countries will be submitted
later this year by Wyeth-Ayerst” (emphasis mine).
My conclusion: Even though the J.V. ended in 1996, AHP and Esai are still partners
because of the other existing relationship about donepezil or Eranz that started in 1995
and existed at least till 1997.
“HD Alzheimer’s Exelon Patch Enters Costa Rican Pharma Market
BY Denise Claux
WC 282 words
PD 23 February 2009
SN Global Insight Daily Analysis
SC WDAN
LA English
CY Copyright 2009, Global Insight Limited. All Rights Reserved.
LP
As reported by La Nacion, Exelon was introduced last year as an oral medication in the
form of pills in Costa Rica, where Reminyl (galantamine; Shire, U.K.) and Eranz
(donepezil; Wyeth, U.S.) are also available” (emphasis mine). - Factiva
My conclusion: AHP and Esai relationships continued at least till 2005 because Wyeth
(new name of AHP) was responsible for Esai’s Eranz in Costa Rica up until 2009.
Case 2: Genentech, Inc., and SmithKline Beecham Biologicals, S.A., (SmithKline
Beecham P.L.C.) [31Dec1989]
“Genentech granted SmithKline Beecham Biologicals a license for its herpes
vaccine.” - SDC

160
“Herpes simplex glycoprotein vaccine - GlaxoSmithKline – AdisInsight”
http://adisinsight.springer.com/drugs/800006502
“The vaccine, Simplirix™, was originally developed by Genentech, but was licensed to
SmithKline Beecham (now GSK) for development outside Japan” (emphasis mine).
My conclusion: Further check Simplirix.
http://adisinsight.springer.com/drugs/800006502
“Herpes simplex glycoprotein vaccine – GlaxoSmithKline
Originator Genentech
Developer GlaxoSmithKline; National Institute of Allergy and Infectious Diseases
Class Protein-vaccines; Viral vaccines
Highest Development Phases
Discontinued Herpes simplex virus infections
Most Recent Events
30 Sep 2010 Discontinued - Phase-III for Herpes simplex virus infections in Canada
(IM)
30 Sep 2010 Discontinued - Phase-III for Herpes simplex virus infections in European
Union (IM)
30 Sep 2010 Discontinued - Phase-III for Herpes simplex virus infections in USA (IM)”
(emphasis mine).
My conclusion: The relationship continued till 2010, hence, at least till 2005. Roche
acquired Genentech in 1990 (my research on acquisitions).Thus, SmithKline Beecham
and Genentech had an alliance in 1989. SmithKline Beecham and Roche had an alliance
from 1990 to 1999. SmithKline Beecham and Glaxo Wellcome PLC merged to form
GlaxoSmithKline in 2000 (my research on acquisitions). GlaxoSmithKline and Roche
had an alliance from 2000 at least till 2005.
Case 3: Mylan Laboratories, Inc., and Grupo Ferrer Internacional, S.A., [20
Apr1993]
“Mylan Laboratories received an exclusive license from Ferrer Internacional for all rights
to Ferrer’s patented Dotarizine for the United States and Canada. Mylan was responsible
for developing the drug in North America and had the right of first refusal on all
derivatives of Dotarizine” (emphasis mine). - SDC
http://adisinsight.springer.com/drugs/800003533
“Dotarizine
Originator Ferrer

161
Developer Azwell; Ferrer; Kayaku; Mylan Laboratories
Class Antimigraines; Piperazines
Highest Development Phases
Discontinued Migraine; Stroke; Vertigo
Most Recent Events
18 Jan 2001Discontinued-II for Migraine in USA (Unknown route)
18 Jan 2001Discontinued-III for Migraine in Switzerland (Unknown route)
18 Jan 2001Discontinued-preregistration for Migraine in Spain (Unknown route)”
(emphasis mine).
My conclusion: The relationship between Mylan and Ferrer ended in 2001. Based on
further search, no new relationship was formed.
Case 4: Synsorb Biotech, Inc., and Takeda Pharmaceutical Co., Ltd., [29 Nov 1996]
“Synsorb Biotech Inc granted Takeda Chemical Industries Ltd an exclusive license to
develop manufacture, and market Synsorb’s Synsorb PK therapeutic in Japan. Under the
terms of the agreement, the Synsorb PK application was a preventative therapeutic used
in the treatment of Hemohytic Uremic Syndrome, a serious complication which resulted
from E. Col infections, commonly known as "Hamburger disease" in North America.
Synsorb Biotech would receive a licensing fee of $3 mil US (40.83 mil Japanese yen) and
an undisclosed amount of milestone payments from Takeda Chemical. Additionally,
Takeda was to provide all pre-clinical and clinical trial expenses in Japan” (emphasis
mine). - SDC
“HD Synsorb Biotech Begins Phase III SYNSORB Trial In Japan
WC 254 words
PD 13 June 1997
ET 12:06 PM GMT
SN Dow Jones News Service
SC DJ
LA English
CY (Copyright (c) 1997, Dow Jones & Company, Inc.)
LP
CALGARY, June 13 /CNW/ - Synsorb Biotech Inc. (T.SYB) said it has begun a multi-
center Phase III clinical trial in Japan sponsored by its corporate partner, Takeda
Chemical Industries Ltd., for its SYNSORB Pk product…
162
TD
Synsorb said that, at current enrollment levels, both the Japanese and North American
trials are expected to be completed by the end of 1997” (emphasis mine). - Factiva
My conclusion: The relationship between Synsorb and Takeda lasted at least till 1997.
“HD oligosaccharide matrix complex Takeda clinical data
WC 111 words
PD 7 September 1998
SN R & D Focus Drug News
SC RDFN
PG N/A
VOL ISSN: 1350-1135
LA English
CY Copyright 1998 Gale Group Inc. All rights reserved.
LP
Takeda has released preliminary results from a phase III trial completed in Japan, which
demonstrate that SYNSORB Pk can be safely coadministered with antibiotics in children
infected with verotoxigenic Escherichia coli (E coli O157:H7). The open label trial was
conducted June-November 1997 following an outbreak of E coli O157:H7 in Japan, and
the full trial results will be presented by the company in November 1998. Phase III trials
with this agent are being conducted in the USA, Canada and Argentina by SYNSORB
Biotech” (emphasis mine). - Factiva
My conclusion: The relationship between Synsorb and Takeda lasted at least till 1998.
Also note that trials in other countries such as Canada are conducted by Synsorb alone
and with Takeda in Japan.
“HD Synsorb Biotech Inc - Results from Japanese Synsorb-Pk study
WC 746 words
PD 23 November 1998
SN Canada Stockwatch
SC CNSW
LA English
CY (c) 1998 Canjex Publishing Ltd.
LP
Mr. David Cox reports
Synsorb Biotech has received the results from an open-label clinical study of Synsorb Pk
(TAK-751S in Japan) co-administered with antibiotics. The study was part of a global

163
effort focused on the development of Synsorb Pk…(including E. coli O157:H7).
TD
The study was sponsored and conducted by the companies Japanese marketing and
distribution partner for Synsorb Pk, Takeda Chemical Industries Ltd. … The study was
carried out in Japan from June 1997 to February 1998” (emphasis mine). - Factiva
My conclusion: The relationship between Synsorb and Takeda ended in 1998 because the
study is over and I do not find evidence of any new relationship or extensions based on
my search.
“HD SYNSORB Biotech Inc. Announces Outcome Of Interim Analysis of SYNSORB
Pk Phase III Trial
WC 885 words
PD 12 July 2000
ET 08:55 PM GMT
SN Business Wire
SC BWR
LA English
CY (Copyright (c) 2000, Business Wire)
LP
CALGARY, Alberta--(BUSINESS WIRE)--July 12, 2000--SYNSORB Biotech Inc.
(Nasdaq:SYBB)(TSE:SYB.) today announced the outcome of an interim analysis of the
SYNSORB Pk(R) Phase III trial….
In the overall patient population of 526 children treated within 5 days of the onset of
symptoms, the data showed a limited trend toward efficacy, and did not successfully meet
the defined protocol objectives” (emphasis mine). - Factiva
My conclusion: I further checked and find that even the trials conducted by Synsorb in
Canada failed and did not go further, further validating my termination argument.
Case 5: Serono International, S.A., and Amgen, Inc., [13 Nov2002]
“Serono SA (SS) and Amgen Inc (AI) formed a strategic alliance whereby AI granted SS
license for its multiple sclerosis drug Novantrone. Financial terms were not disclosed”
(emphasis mine). - SDC
https://www.ftc.gov/news-events/press-releases/2002/07/resolving-anticompetitive-
concerns-ftc-clears-16-billion
“Resolving Anticompetitive Concerns, FTC Clears $16 Billion Acquisition of Immunex
Corp. By Amgen Inc.
164
Companies Required to Implement Divestiture and Licensing Remedies in Three
Biopharmaceutical Markets
July 12, 2002
Under the terms of a proposed consent agreement announced today, the Federal Trade
Commission would allow Amgen Inc.’s (Amgen) proposed $16 billion acquisition of
Immunex Corporation (Immunex) to proceed….The order also would require the
companies to grant a license to certain intellectual property rights related to TNF
inhibitors to Serono S.A. (Serono)…”
http://www.wikinvest.com/stock/OSI_Pharmaceuticals_(OSIP)/Novantrone
“OSI Pharmaceuticals (OSIP)
This excerpt taken from the OSIP 10-K filed Mar 1, 2007.
Novantrone
… We market and promote Novantrone for these approved oncology indications in the
United States pursuant to a co-promotion agreement with an affiliate of Merck Serono,
S.A. signed in March 2003. We receive commissions from Merck Serono on net
oncology sales in this market. The patent for Novantrone expired in April 2006, which
resulted in the loss of market exclusivity for Novantrone. Following the patent expiration,
we experienced an anticipated significant decrease in our commissions related to
Novantrone as a result of a large decrease in oncology sales due to generic competition.
Under our agreement with Merck Serono, we are also no longer obligated to pay fees
associated with the sales and marketing of Novantrone” (emphasis mine).
My conclusion: The relationship between Serono and Amgen existed at least till 2005,
my last period of observation because the Novantrone patent expired in April 2006, and
MerckSerono still had rights as evidenced in OSI Pharmaceuticals 10K.
STEP 5.1: IS THE ALLIANCE FORMATION MENTIONED IN SEC OR
FACTIVA?
IN SEC, TRACK THE ALLIANCE EACH YEAR TILL NO MENTION EXISTS.
CHECK FOR FURTHER ALLIANCE EXTENSIONS BETWEEN TWO
ALLIANCE PARTNERS. IN CASE OF NEGATIVE, USE THE “NO MENTION”
DATE AS THE TERMINATION DATE. FOUR EXEMPLARS (CASES) (4.22%
OF THE CASES)
Case 1: Ortho Diagnostic Systems, Inc., and Corvas, Inc. [01 Jul 1992]
“Ortho Diagnostics, a division of Johnson and Johnson, and Corvas International agreed
to extend their 1991 co-development agreement to a worldwide licensing agreement.
165
Under the new agreement, Ortho agreed to manufacture and distribute prothrombin time
(PT) blood clotting tests that incorporated Corvas’ recombinant human tissue factor
(rTF). In addition, Corvas agreed to produce rTF for Ortho in exchange for licensing fees
and royalties expected to total $1.5 million through 1995. Corvas held an exclusive
license for in vitro diagnostic usage of rTF from the Scripps Research Institute.” - SDC
https://www.sec.gov/Archives/edgar/data/882100/0001019687-99-000151.txt
“CONFORMED PERIOD OF REPORT: 19981231
COMPANY CONFORMED NAME: CORVAS INTERNATIONAL INC
In November 1998, the Company entered into exclusive license agreements with two
affiliates of Johnson & Johnson, Ortho-Clinical Diagnostics Inc….These agreements
…supercede earlier agreements entered in June 1992” (emphasis mine).
My conclusion: The relationship existed at least till 1998.
http://www.getfilings.com/o0001019687-00-000326.html
“For the fiscal year ended December 31, 1999
CORVAS INTERNATIONAL, INC.
In November 1998, we entered into license agreements with two affiliates of Johnson &
Johnson, Ortho-Clinical Diagnostics Inc. and LifeScan, Inc….The new agreements
continue to provide for royalties to be paid based on unit sales of tissue factor.”
My conclusion: The relationship existed at least till 1999.
http://www.getfilings.com/o0001019687-01-000430.html
“For the fiscal year ended December 31, 2000
Net product sales attributable to affiliates of Johnson & Johnson for the year ended
December 31, 1998 were $26,000. The agreements continue to provide for royalties to be
paid based on unit sales of tissue factor” (emphasis mine).
My conclusion: The relationship existed at least till 2000.
http://www.getfilings.com/o0001019687-02-000466.html
“For the fiscal year ended December 31, 2001
Revenues from royalties of $117,000, $167,000 and $190,000 were recognized in 2001,
2000 and 1999, respectively, associated with license agreements with two Johnson &
Johnson subsidiaries for sales of recombinant tissue factor.”
My conclusion: The relationship existed at least till 2001.

166
http://www.getfilings.com/o0001019687-03-000502.html
“For the fiscal year ended December 31, 2002
These agreements continue to provide for royalties to be paid to the Company based on
unit sales of tissue factor. For the years ended December 31, 2002, 2001 and 2000, these
royalties amounted to $142,000, $117,000 and $167,000, respectively.”
My conclusion: The relationship existed at least till 2002.
http://www.getfilings.com/o0001019687-03-000945.html
“For the quarterly period ended March 31, 2003
FORM 1O-Q
My conclusion: The relationship between Johnson & Johnson and Corvas ended in 2003
because neither the agreement nor J&J finds mention in the filings of Corvas. Also,
according to Bloomberg, Corvas went out of business in October 2005.”
Case 2: Human Genome Sciences, Inc., and MedImmune, Inc. [31 Jul 1995]
“Human Genome Sciences Inc(HGS) and MedImmune Inc formed a joint venture to
develop and commercialize anti-infective agents which used the genetic structures of
infectious microbes. Under the terms of the agreement, HGS was to supply the bacterial
genomes for the joint venture. MedImmune was to be responsible for the development
and commercialization of products produced by the joint venture. The partners were to
initially focus on the development of vaccines and antibody-based drug products. No
financial details were disclosed.” - SDC
https://www.sec.gov/Archives/edgar/data/901219/000095013306001228/0000950133-
06-001228.txt
“CONFORMED PERIOD OF REPORT: 20051231
COMPANY CONFORMED NAME: HUMAN GENOME SCIENCES INC
We entered into a collaboration and license agreement with MedImmune in July 1995,
which we amended in March and December 1997...We are entitled to a portion of the
payments received by MedImmune under its sub-license...Through 2003, we have
received $1.1 million from MedImmune.”
My conclusion: The relationship between MedImmune and Human Genome Sciences
lasted at least till 2005 because Human Genome received payments till 2003 and the
alliance is still discussed in the annual report for the 2005 period. But I check further.
167
https://www.sec.gov/Archives/edgar/data/901219/000095013307000843/0000950133-
07-000843.txt
“CONFORMED PERIOD OF REPORT: 20061231
COMPANY CONFORMED NAME: HUMAN GENOME SCIENCES INC
The Company has entered into a number of other agreements. These include agreements
with…MedImmune, Inc. and others.”
My conclusion: The relationship between MedImmune and Human Genome Sciences
lasted at least till 2005 and the link above further recognizes the ongoing nature of
collaboration with Medimmune.
Case 3: T Cell Sciences, Inc., and Astra, A.B. [06 Nov 1991]
“T Cell Sciences, Inc. and Astra AB signed an agreement to develop and market
therapeutic products that result from T Cell Sciences’ antigen receptor(TCAR)
technology. The partners were to develop monoclonal antibodies and protein-derived
immunomodulators, which are recombinantly produced proteins identical to certain T cell
antigen receptor regions on T cells, that have efficacy in treating autoimmune diseases
such as rheumatoid arthritis, multiple sclerosis, Crohn’s disease and sarcoidois. The
partners disclosed their goal was to use the antibody and immunomodulator products to
activate the immune system to eliminate specific T cells implicated as casual agents in
autoimmune diseases. The agreement called for Astra to invest US$15 mil over the initial
two years, with another US$17 mil invested by Astra pursuant to options over the
duration after the first two years. The agreement also stipulated T Cell Sciences will be
the sole supplier of the products. Both partners have signed an amended agreement, in
which Astra reaffirmed its original funding and has agreed to increase its commitment to
the program by assuming responsibility from T Cell Sciences for future development and
manufacturing of two monoclonal antibodies, TM27 and TM29” (emphasis mine). - SDC
http://www.prnewswire.com/news-releases/t-cell-sciences-announces-progress-in-phase-
i-multiple-sclerosis-trial-with-astra-ab-76852102.html
“T Cell Sciences Announces Progress in Phase I Multiple Sclerosis Trial with Astra AB
Feb 23, 1998, 00:00 ET from T Cell Sciences, Inc.
NEEDHAM, Mass., Feb. 23 /PRNewswire/ -- T Cell Sciences, Inc.
(Nasdaq: TCEL) today announced positive progress from a Phase I clinical trial of the
humanized monoclonal antibody, ATM027, in patients with multiple sclerosis. ATM027,

168
which has been exclusively licensed by Astra AB, is one of the products derived from the
Company’s T Cell Antigen Receptor (TCAR) program” (emphasis mine).
My conclusion: The relationship between T Cell Sciences, Inc. and Astra AB lasted at
least till 1998
http://media.corporate-ir.net/media_files/irol/93/93243/reports/199910k.pdf
“FORM 10-K
For the fiscal year ended December 31, 1999
AVANT IMMUNOTHERAPEUTICS, INC.
(f/k/a T Cell Sciences, Inc.)
In early 1992, we entered into a joint development program with AstraZeneca plc
(“Astra”) to develop products resulting from our proprietary TCAR technology….The
original agreement was modified in 1993 with Astra...By the end of 1995, we had
received substantially all of the original funding payments. In 1996, we amended the
agreement with Astra to transfer some of our rights to the TCAR technology, including
two therapeutic products, ATM-027 and ATP-012, to Astra, which is solely responsible
for further clinical development and commercialization. Under the amended agreement,
we could receive royalties from product sales, as well as milestone payments which may
total up to $4 million as specific clinical milestones are achieved. In 1997, we received a
milestone payment from Astra because one of the products derived from our TCAR
program entered clinical trials for the treatment of multiple sclerosis. In 1998, Astra
announced that Phase I data from these trials had shown an effect on the target cells and
that there had been no serious adverse effects in the study to date, and initiated a Phase II
study. In 1999, we announced results of the Phase II study of the TCAR monoclonal
antibody (ATM-027) being developed by Astra for the treatment of multiple sclerosis.
The results showed that ATM-027 was safe and well tolerated, however, in the view of
Astra the reduction of disease activity in the study population did not reach a level that
would be of value for those patients. Therefore, Astra made the decision to stop further
development of ATM-027 for multiple sclerosis but is reviewing development of the TCAR
peptide, ATP-012, as a vaccine for multiple sclerosis under the terms of the TCAR
agreement” (emphasis mine).
My conclusion: The relationship between T Cell Sciences and Astra AB ended in 1999
because Astra stopped the development and none of the annual reports of Avant ever
mention Astra. Note that T Cell merged with Virus Research in 1998 to form Avant
Immunotherapeutics Inc. Also, Astra merged with Zeneca to form AstraZeneca in 1999.
Thus, the alliance between T Cell Sciences and Astra lasted from 1991 to 1997. Avant
and Astra allied in 1998, and Avant and AstraZeneca in 1999.

169
Case 4: IVAX, Corp., and SS Pharmaceutical Co., Ltd. [01 Apr 1991]
“Ivax Corp and SS Pharmaceutical Co. signed a series of licensing agreements whereby
Ivax subsidiaries licensed SS Pharmaceutical’s anti-inflammatory drug (unspecified) and
SS Pharmaceuticals received rights to market Ivax’s nalmefene. In exchange for an up-
front license fee and royalties on sales, SS Pharmaceutical Co. had exclusive rights to
oral nalmefene in Japan and Korea. Ivax subsidiary, Baker Cummins was to market SS
Pharmaceutical’s anti-inflammatory drug in North America, and another Ivax subsidiary,
Waterford, was to distribute the product in the UK, Ireland, Israel, Iran, and certain parts
of Africa. Ivax and SS. became R&D partners in 1989. SS. owns 3.3% of Ivax
outstanding shares.” - SDC
“HD Ivax acquisitions, not development, pay the way
BY By David Poppe
WC 2401 words
PD 5 February 1993
SN Miami Review
SC MIAM
In 1988, when Ivax was barely more than a concept, Japanese drug maker SS
Pharmaceutical Co. invested nearly $12 million and Schiapperelli Corp., an Italian
company, invested $10 million. Both investments have more than quadrupled in five
years.” - Factiva
My conclusion: The relationship between Ivax Corp and SS Pharmaceutical started in
1988 (I fix this in the dataset) and lasted at least till 1993.
http://www.getfilings.com/comp/k0000772197.html
I note that none of the annual reports mention SS or Japan
My conclusion: The relationship between Ivax Corp and SS Pharmaceutical lasted from
1988 to 1994 because none of the filings from 1995 to 2005 mention SS or Japan. Also,
there is no news in Factiva about the relationship after 1993.

170
STEP 5.2: IS THE ALLIANCE FORMATION MENTIONED IN SEC OR
FACTIVA? IN FACTIVA, TRACK THE ALLIANCE EACH YEAR TILL NO
MENTION EXISTS. CHECK FOR FURTHER ALLIANCE EXTENSIONS
BETWEEN TWO ALLIANCE PARTNERS. IN CASE OF NEGATIVE, USE THE
“NO MENTION” DATE AS THE TERMINATION DATE. FOUR EXEMPLARS
(CASES) (5.56% OF THE CASES)
Case 1: Enzon, Inc., and Emisphere Technologies, Inc. [09 Jul 1992]
“Enzon, Inc. and Emisphere Technologies, Inc. signed an agreement to jointly develop
orally administered pharmaceutical products. The collaboration focused on combining
proteins modified through Enzon’s Pegnology drug delivery technology, which reduces
the quantity and frequency of doses and lowers the allergic reactions of proteins used as
therapeutic agents, and Emisphere’s Oral Drug System technology, which shields
therapeutic agents by encapsulating them in microspheres composed of amino acids. The
products that are developed as a result of the collaboration are expected to last longer in
the bloodstream, have protection from gastrointestinal acids, and exhibit fewer allergic
reactions.” - SDC
“HD Emisphere FY 92 Results
WC 132 words
PD 1 November 1992
SN Applied Genetics News Business Communications Company, Inc.
SC AGNW
VOL Vol. 13, No. 4 ISSN: 0271-7107
LA English
CY COPYRIGHT 1992 by Business Communications Company, Inc.
LP
Emisphere Technologies, Inc. reports total revenues for its complete fiscal year ended
July 31, 1992...The company…has development agreements with The Upjohn Company,
Sandoz Pharmaceutical, Schering-Plough, Enzon and J3 Biologics” (emphasis
mine). - Factiva
My conclusion: The relationship between Enzon and Emisphere was at least till July 31
1992. Note the Emisphere lists firm names with development agreements.
“HD EMISPHERE REPORTS 1993 4TH QUARTER AND YEAR END RESULTS
WC 602 words
PD 21 October 1993
SN PR Newswire
SC PRN
LA English

171
CY (Copyright (c) 1993, PR Newswire)
HAWTHORNE, N.Y. Oct. 21 /PRNewswire/ -- Emisphere Technologies, Inc.
(NASDAQ: EMIS) today reported financial results for the fourth quarter and year ended
July 31, 1993…The company has development agreements with a number of companies,
including The Upjohn Company(NYSE: UPJ), Schering-Plough Corporation(NYSE:
SGP) and Enzon, Inc.(NASDAQ-NMS: ENZN)” (emphasis mine). - Factiva
My conclusion: The relationship between Enzon and Emisphere was at least till July 31
1993. Note the Emisphere lists firm names with development agreements and Enzon is
there.
“HD EMISPHERE REPORTS FIRST QUARTER FISCAL 1994 RESULTS
WC 466 words
PD 8 December 1993
SN PR Newswire
SC PRN
LA English
CY (Copyright (c) 1993, PR Newswire)
LP
HAWTHORNE, N.Y., Dec. 8 /PRNewswire/ -- Emisphere Technologies, Inc.
(NASDAQ: EMIS) today reported financial results for the first quarter of fiscal 1994
ended Oct. 31, 1993…The company has development agreements with a number of
companies, including The Upjohn Company and the Schering-Plough Corporation”
(emphasis mine). - Factiva
My conclusion: The relationship between Enzon and Emisphere ended on October 31,
1993. Note the Emisphere lists firm names with development agreements and Enzon is
not there now. I further validate it from the news below.
“HD Organogenesis Optimistic About Skin Product
WC 316 words
PD 1 January 1994
SN Applied Genetics News Business Communications Company, Inc
SC AGNW
VOL Vol. 14, No. 6 ISSN: 0271-7107
LA English
CY Copyright 1994 Business Communications Company, Inc.
Emisphere (Hawthorne, NY) reports revenues in the quarter ended October 31, all of
which came from R&D contracts, of $85,000, but a net loss of $1.6 million. The
company hopes its research investment in an oral drug delivery system will pay off, as do
its backers, Schering-Plough and Upjohn.” - Factiva
My conclusion: Further confirms the alliance is gone because Enzon does not find any
mention.
172
Case 2: Monoclonal Antibodies, Inc., and Fujirebio, Inc. [01 Mar1988]
“Fujirebio Inc licensed Monoclonal Antibodies Inc’s allergy and autoimmune diagnostics
product line.” - SDC
“HD CEO Interview QUIDEL CORP. (QDEL)
WC 6576 words
PD 26 October 1992
SN The Wall Street Transcript
SC TWST
VOL Vol. CXVIII, No. 04
LA English
CY (Copyright 1992)
LP
QUIDEL CORPORATION (QDEL)
We made the acquisition of Cytotech in 1989 followed by a merger with Monoclonal
Antibodies, Inc. in January 1991. We’re very happy with the business in Japan and our
ventures with Fujirebio, Inc. and Takeda Pharmaceuticals, but we believe that we can
grow in the European market with our own presence” (emphasis mine). - Factiva
My conclusion: Quidel acquires Monoclonal in 1991 and continues its alliance with
Fujirebio.
“HD QUIDEL FILES FOR FDA MARKETING CLEARANCE FOR RAPID FECAL
OCCULT BLOOD TEST
WC 388 words
PD 1 April 1993
SN Biotech Business Worldwide Videotex
SC BTBU
VOL Vol. 6, No. 4
LA English
CY COPYRIGHT 1993 Worldwide Videotex
LP
QUIDEL Corporation (NASDAQ: QDEL), of San Diego, CA, has filed a 510(k)
submission with the U.S. Food and Drug Administration...We are pleased to have
developed this test in conjunction with our Japanese partner, Fujirebio, Inc. and look
forward to their successful market launch In Japan while we market the test in the United
States and Europe through our own professional sales force and distribution
network.” - Factiva
My conclusion: Quidel’s alliance with Fujirebio lasted at least till 1 April 1993. I impute
1993 is the end date for two reasons. First, I do not find any relevant news after this year.
Second, I find that, on an average, if the acquirer is not interested in continuing the
alliance initiated by the acquired party it does so within one to two years. Thus, I believe

173
Monoclonal Antibodies Inc and Fujirebio Inc had partnership from 1988 to 1990 and
Quidel and Fujirebio Inc from 1991 to 1993. I further try to validate this as shown below.
https://www.sec.gov/Archives/edgar/data/353569/0000936392-97-000871.txt
I note that the1997 10k does not mention Fujirebio.
http://www.prnewswire.com/news-releases/quidels-quickvuer-influenza-test-launched-in-
japan-73581357.html
“Quidel’s QuickVue(R) Influenza Test Launched in Japan
Oct 10, 2001, 01:00 ET from Quidel Corporation
SAN DIEGO, Oct. 10 /PRNewswire/ -- Quidel Corporation (Nasdaq: QDEL), a leading
provider of rapid point-of-care (POC) diagnostic tests, today announced that its
QuickVue(R) Influenza test product is now being sold throughout Japan by the
Company’s exclusive Japanese distributor, Sumitomo Seiyaku Biomedical Co., Ltd., ...”
My conclusion: I find that the exclusive distributor for Japan is Sumitomo not Fujirebio
for Quidel’s QuickVue(R) further confirming my suspicion that Quidel changed the
distributor.
Case 3: Lidak Pharmaceuticals, Inc., and Chiron, Corp. [15 Apr 1992]
“Lidak Pharmaceuticals, Inc. and Chiron Corp. signed an agreement to jointly develop
and test potentially new immune therapies against AIDS. The agreement was based on
Lidak’s proprietary human immune system-reconstituted severe combined immune
deficiency(SCID) mouse technology. In this process, mice with SCID are grafted with
mature human peripheral blood cells to create hu-PBL-SCID mice. The grafted human
cells make the mice susceptible to HIV infection, and useful in the testing of ant-AIDS
compounds. Chiron contributed its proprietary vaccines directed against certain
properties of HIV.” - SDC
“HD Corporate Activities (Part 5 of "Review of 1992")
WC 1071 words
PD 1 January 1993
SN Antiviral Agents Bulletin Biotechnology Information Institute
SC AVAB
VOL Vol. 6, No. 1
LA English
CY COPYRIGHT 1993 by Biotechnology Information Institute
LIDAK Pharmaceuticals raised capital for development of LIDAKOL, a long-chain
alcohol formulation, for treatment of herpes, HIV and other indications. LIDAK formed a
collaboration with Chiron Corp. for testing of Chiron’s HIV vaccines in the company’s
hu-PBL-SCID immune deficient mice with reconstituted human immune
systems.” - Factiva
174
My conclusion: Lidak and Chiron collaborated at least till 1993. I believe the
collaboration ended in 1993 because I do not find any news of the collaboration after that.
I further searched for relevant news and find Lidak tied up with an Israeli firm in 1993
and Chiron halted the application for vaccine approval in 1996.
“HD News Capsule
WC 484 words
PD 1 August 1993
SN Applied Genetics News Business Communications Company, Inc.
SC AGNW
VOL Vol. 14, No. 1 ISSN: 0271-7107
LA English
CY COPYRIGHT 1993 by Business Communications Company, Inc.
Lidak (La Jolla, CA) says its topical anti-herpes drug candidate, LIDAKOL, has
completed a Phase II pilot study. The antiviral agent in the product is docosonol. The
company has licensed the product to CTS Chemical Industries (Kiryat Malachi, Israel)
for manufacture and marketing in Israel” (emphasis mine). - Factiva
http://www.bioinfo.com/aabtext.html
“December 1996 Antiviral Agents Bulletin news stories
Herpes Simplex Virus Subunit Vaccine Development Halted by Chiron
Chiron Corp. (Emeryville, CA) has announced that it has halted development of its
bivalent recombinant herpes simplex virus type 2 (HSV-2) subunit vaccine after
preliminary data from Phase III clinical trials for genital herpes prophylaxis failed to
indicate efficacy for this product. Chiron will not apply for approval of the vaccine”
(emphasis mine).
Case 4: Cortecs, Ltd., and Roche Holding, A.G. [31 Aug 1990]
“Cortecs and Roche formed a strategic alliance to manufacture and develop an oral form
of Roche’s Roferon as a potential treatment for AIDS-related Kaposi’s Sarcoma, hairy-
cell leukemia, chronic hepatitis, colorectal cancer, and lung cancer. Under the agreement,
Cortecs was to manufacture the final products using its Macromol delivery system. The
system prevented the breakdown of the drug by the digestive system with a “water-in-oil”
microemulsion. Cortecs was to retain manufacturing rights once the product was
commercialized.” - SDC
“HD HOFFMAN, WESTERN CAPITOL AND CORTECS FORM VENTURE FOR
RESEARCH INTO ORAL FORM OF ALPHA-INTERFERON.
WC 139 words
PD 3 January 1991
SN Manufacturing Chemist
SC MCHMDI
PG 13

175
LA English
CY Copyright Miller Freeman 1991
LP
Preliminary studies are to be carried out by Cortecs, using Roche’s human interferon
alpha-2a drug, Roferon-A, and WCL’s drug delivery systems” (emphasis mine). - Factiva
My conclusion: Cortecs and Roche collaborated at least till 1991.
“HD F HOFFMAN-LA ROCHE AND CORTECS LIMITED ORAL ALPHA-
INTERFERON ANNOUNCEMENT
WC 128 words
PD 27 February 1991
SN PR Newswire
SC PRN
LA English
CY (Copyright (c) 1991, PR Newswire)
LP
LONDON, Feb. 27 /PRNewswire/ -- Cortecs Limited today issued the following
statement regarding a joint oral Alpha-Interferon study with Hoffman-La Roche:
Following initial positive results from a joint study at the Macromolecular Clinical
Research Centre in Korea, the companies are now planning a confirmatory trial in
Caucasian subjects in Europe.” - Factiva
“HD Clinical Trial Milestones (Review of 1992. Part 4 of 9)
WC 609 words
PD 1 January 1992
Cortecs Ltd. in collaboration with Hoffmann-La Roche began trials of oral liposomal-
encapsulated alpha-interferon. Roche has also initiated oral interferon trials in the
U.S.S.R.” - Factiva
“HD Cortecs and Roche Halt Development of Oral Interferon
WC 138 words
PD 1 September 1992
SN Antiviral Agents Bulletin Biotechnology Information Institute
SC AVAB
VOL Vol. 5, No. 9
LA English
CY COPYRIGHT 1992 by Biotechnology Information Institute
LP
Cortecs Ltd. (Isleworth, UK) and Hoffmann-La Roche (Basel, Switzerland) have
suspended their collaborative development of oral formulations of alpha-interferon.
Clinical trials in Switzerland and the U.K. failed to confirm the positive results reported
from an earlier trial conducted by the Macromolecular Clinical Research Centre (Korea)
which had reported that lipid-encapsulated orally administered interferon could pass
176
through the stomach and intestinal linings and enter the bloodstream without excessive
protein digestion. Cortecs had earlier reported about 30% bioavailability and
irregularities in manufacturing for the product produced in Korea. The material used in
the recent clinical trials was formulated by Cortecs itself using a different production
process. Cortecs and Roche may restart the oral interferon project if Cortec’s oral insulin
formuation shows significant bioavailability in upcoming clinical trials” (emphasis
mine). - Factiva
My conclusion: Cortecs and Roche collaboration ended on 1 Sep 1992 because Roche
suspended the collaborative development and I did not find any news about them after
this.
STEP 6.1: DID ANY OF THE PARTNERS GO BANKRUPT OR MERGE?
USE THE BANKRUPTCY DATE AS THE TERMINATION DATE. FOUR
EXEMPLARS (CASES) (1.32% OF THE CASES)
Case 1: deCode Genetics, Inc., and Elitra Pharmaceuticals, Inc. [01 Jul 2002]
“deCODE genetics and Elitra Pharmaceuticals Inc formed a strategic alliance to provide
research and development of new antibiotics to combat drug-resistant bacteria in the
United States.” - SDC
https://www.bloomberg.com/research/stocks/private/snapshot.asp?privcapId=27991
“November 14, 2016 6:10 AM ET
Biotechnology
Company Overview of Elitra Pharmaceuticals
Elitra Pharmaceuticals went out of business. Elitra Pharmaceuticals, Inc. engages in
discovering, developing, and commercializing the next generation of antimicrobial drugs
that target essential gene products of pathogenic organisms. Elitra has research
collaborations with Merck & Co., LG Life Sciences, bioLeads, and deCODE genetics to
discover new antimicrobials” (emphasis mine).
My conclusion: deCODE genetics and Elitra Pharmaceuticals ended the relationship
because Elitra went out of business. I further investigate below.
http://www.fiercebiotech.com/special-report/elitra-pharmaceuticals-2003-fierce-15-
revisited
“Elitra Pharmaceuticals
What happened: Elitra found itself among a number of antibiotics developers struggling
to stay afloat...In late 2004, Elitra cut its workforce of about 70 and sold its assets to
Merck. The drug giant also paid San Diego State University for the rights to the patents
on which Elitra was founded” (emphasis mine).
My conclusion: deCODE genetics and Elitra Pharmaceuticals ended the relationship in
2004 because Elitra went out of business and Merck acquired its assets in 2004.

177
http://www.evaluategroup.com/Universal/View.aspx?type=Story&id=58645
“deCODE and Merck & Co., Inc. Form Broad Drug Development Alliance
Reykjavik, Iceland -- February 26, 2004 -- deCODE genetics (Nasdaq:DCGN) today
announced the formation of a seven-year alliance with Merck & Co ., Inc. (NYSE:MRK)
under which deCODE will conduct information-rich clinical trials on a range of Merck’s
developmental compounds.”
My conclusion: Interestingly Merck which acquired Elitra’s assets in 2004 broadens its
alliance in 2004, further confirming that deCODE might have continued working with
Elitra till Elitra went out of business.
Case 2: Essential Therapeutics, Inc., and Fujisawa Pharmaceutical Co., Ltd. [09
Aug 2002]
“Essential Therapeutics Inc (ET) and Fujisawa Pharmaceutical Co Ltd (FT) planned to
form a strategic alliance in which ET was to utilize its technology to develop assay
systems for the discovery of novel antibiotics, and was to perform high-throughput
screening of the compounds in FP’s library through its subcontractor. FP will conduct
lead generation and lead optimization, and was to exclusively develop, manufacture and
market the resulting products on a worldwide basis. ET was to retain rights to develop the
compounds under certain conditions and will receive funding and potential milestone and
royalty payments.” - SDC
https://www.sec.gov/Archives/edgar/data/1010915/000092701603001554/d10k.htm
“10-K 1 d10k.htm FORM 10-K
FOR THE FISCAL YEAR ENDED DECEMBER 31, 2002
ESSENTIAL THERAPEUTICS, INC.
The employees remaining in California will either assist with the closure of certain
California facilities or assist in the performance of the Company’s obligations under its
collaborative agreement with Fujisawa Pharmaceutical Co., Ltd, which is expected to
conclude in the third quarter of 2003” (emphasis mine).
My conclusion: Essential Therapeutics and Fujisawa ended the alliance in the third
quarter of 2003. I further investigated and find that Essential filed for bankruptcy in May
2003 as shown below. Also, I did not find any news pertaining to any new relationship
between the companies.
https://www.myglobalbizz.com/ms/manufacture/essential-therapeutics-inc/
“ESSENTIAL THERAPEUTICS INC
In May 2003, the company and its wholly owned subsidiaries, Maret Corporation and
Althexis, filed a voluntary petition for protection under Chapter 11 of the United States
Bankruptcy Code. The plan of reorganization for the company became effective in
October 2003 by order of the U.S. Bankruptcy Court for the District of Delaware, and the
company was renamed Trine Pharmaceuticals, Inc. in November 2003” (emphasis mine).

178
Case 3: VivoRx Pharmaceuticals, Inc., and HemoCleanse, Inc. [24 Oct 1994]
“VivoRx Pharmaceuticals Inc entered into a joint venture agreement with;HemoCleanse
Inc to develop a bioartificial liver. The new joint venture firm was called HepatoCell Inc.
VivoRx would contribute its cell separation and encapsulation technologies to the
venture, while HemoCleanse would contribute its extracorporeal device and sorbent
chemical technologies. HepatoCell would combined the technologies to create a
bioartificial liver to provide artificial liver support for severe liver failure patients.
HepatoCell was still in the development and clinical testing stage of the bioartificial liver.
Financial details were not disclosed.” - SDC
“HD Monsanto Licenses Artificial Liver Tech To HemoCleanse >MTC
WC 257 words
PD 10 January 1997
ET 12:05 PM GMT
SN Dow Jones News Service
SC DJ
LA English
CY (Copyright (c) 1997, Dow Jones & Company, Inc.)
LP
TD
HemoCleanse also has a joint development and marketing agreement with VivoRx
Pharmaceuticals Inc. for the supply of hepatocytes for this device.” - Factiva
My conclusion: HemoCleanse and VivoRx have an alliance at least till Jan 1997.
“HD HemoCleanse Receives Grant From the National Institutes of Health for
Development of Bioartificial Liver
WC 530 words
PD 20 August 1997
ET 08:06 PM GMT
SN Business Wire
SC BWR
LA English
CY (Copyright (c) 1997, Business Wire)
LP” - Factiva
My conclusion: HemoCleanse and VivoRx partnership ended in Aug 1997 because the
news no longer mentions VivoRx and, also, HemoCleanse ran out of funds in 17 July
1998 as shown below.
“HD Promising Purdue-based company runs out of funds
WC 559 words
PD 17 July 1998

179
ET 07:51 PM GMT
SN Associated Press Newswires
SC APRS
LA English
CY (c) 1998. The Associated Press. All Rights Reserved.
LP
WEST LAFAYETTE, Ind. (AP) - A biomedical company that developed a promising
blood treatment for liver failure has laid off all of its 26 employees after running out of
financing. HemoCleanse Inc. has fallen victim, at least temporarily, to the high costs
associated with the health care industry, its top executive said” (emphasis
mine). - Factiva
Case 4: Alpha-Beta Technology, Inc., and IDEXX Laboratories, Inc. [22 Oct 1998]
“Alph-Beta Technology Inc(AB) and Idexx Laboratories Inc(IL) agreed to form a
strategic alliance to collaborate on the commercialization of therapeutic and diagnostic
products for the veterinary, environmental and food markets. AB and IL was to co-
develop products for these markets based on AB’s technology. Also as part of the
agreement, IL was to have exclusive marketing and distribution rights to Alpha-Beta’s
beta-glucan immunomoldulatory compunds and fungal detection technology. Financial
terms were not disclosed.” - SDC
“HD Alpha-Beta seeks liquidation.
WC 173 words
PD 28 January 1999
ET 11:46 PM GMT
SN Reuters News
SC LBA
LA English
CY (c) 1999 Reuters Limited
LP
WORCESTER, Mass., Jan 28 (Reuters) - Alpha-Beta Technology Inc. said Thursday it
would seek an out-of-court liquidation of assets following its decision to abandon its
Phase III clinical trial of Betafectin PGG-glucan, a drug designed to prevent infections in
upper gastrointestinal surgery patients. The company also said its stock would be delisted
from the Nasdaq Stock Market on Friday” (emphasis mine). - Factiva
My conclusion: Alpha-Beta Technology and IDEXX ended the alliance on 28 Jan 1999
because Alpha-Beta Technology abandoned Phase III TRIAL and was also seeking
liquidation of assets.

180
STEP 6.2: DID ANY OF THE PARTNERS GO BANKRUPT OR MERGE?
USE THE MERGER DATE AS THE TERMINATION DATE. THREE
EXEMPLARS (CASES) (5.63%OF THE CASES)
Case 1: Delsys Pharmaceutical, Corp., and Elan Pharmaceutical Technologies. [27
Nov 2000]
“Delsys Pharmaceutical Corp and Elan Pharmaceutical Techologies fomed a;stratgic
alliance to develop oral controlled release products. The company will also established
R&D collaborations to develop solid oral dose products with Pfizer, SmithKline
Beecham, and Johnson & Johnson.” - SDC
http://www.bloomberg.com/research/stocks/private/snapshot.asp?privcapId=27477
“As of September 2001, Delsys Pharmaceutical Corporation was acquired by Elan Corp.
plc” (emphasis mine).
My conclusion: Delsys and Elan alliance that started in 2000 ended in 2001 because Elan
acquired Delsys.
Case 2: AcroMetrix, Corp., and Nabi Biopharmaceuticals. [31Jan 2003]
“AcroMetrix Corp (AC) and Nabi Biopharmaceuticals (NB) formed a strategic alliance to
manufacture and develop ViroSure quality control products for infectious diseases testing
to clinical laboratories and blood screening organizations in the United States. NB was
expected to develop and manufacture the products while AC aimed to focus on marketing
and distribution services. Financial details were not disclosed” (emphasis mine). - SDC
http://www.prnewswire.com/news-releases/acrometrix-corporation-completes-
acquisition-of-virosure-product-line-59040592.html
“AcroMetrix Corporation Completes Acquisition of Virosure Product Line
Jan 28, 2004, 00:00 ET from AcroMetrix
BENICIA, Calif., Jan. 28 /PRNewswire/ -- AcroMetrix announced today that it has
completed the acquisition of the ViroSure product line previously manufactured by Nabi
Biopharmaceutical’s antibody business and other assets related to its diagnostics
business” (emphasis mine).
My conclusion: AcroMetrix Corp and Nabi alliance ended in 2004 because AcroMetrix
acquired ViroSure product line and related assets from Nabi.
Case 3: Elan Corp., P.L.C and Rorer Group, Inc. [30 Sep 1986]
“Elan licensed its once-daily nifedipine product to the Rorer Group for the United
Kingdom. Nifedipine, a calcium antagonist, was used to treat angina and hypertension.
Elan also licensed the product to Farmitalia Carlo Erba, Green Cross, and Pfizer”
(emphasis mine). - SDC

181
http://www.prnewswire.com/news-releases/elan-announces-steps-to-consolidate-and-
build-its-uk-and-irish-pharmaceutical-businesses-77671542.html
“Oct 21, 1997, 01:00 ET from Elan Corporation, plc
DUBLIN, Ireland, Oct. 21 /PRNewswire/ -- Elan Corporation, plc (NYSE: ELN)
In a separate transaction, Elan also announced that it had reached agreement with Rhone-
Poulenc Rorer Limited (“RPR”) to acquire Univer(R) (controlled-release verapamil) and
Nifensar(R) (controlled-release nifedipine) for the U.K., and Nifensar for Ireland. Univer
and Nifensar are products for the treatment of hypertension and angina that utilize Elan’s
proprietary drug delivery technologies and were originally licensed to RPR by Elan in
1987” (emphasis mine).
My conclusion: Elan and Rorer ended the alliance in 1997 because Elan acquired alliance
related assets from Rorer. Rorer was part of Rhone-Poulenc SA in 1990 (my research on
acquisitions). Hence, Elan and Rorer had an alliance from 1986 to 1989, and Elan and
Rhone Poulenc had an alliance from 1990 to 1997.