Innovation and productivity in SMEs: empirical evidence for...
21
Innovation and productivity in SMEs: empirical evidence for Italy Bronwyn H. Hall Francesca Lotti Jacques Mairesse Accepted: 1 February 2009 / Published online: 9 May 2009 Ó Springer Science+Business Media, LLC. 2009 Abstract Innovation in SMEs exhibits some pecu- liar features that most traditional indicators of innovation activity do not capture. Therefore, in this paper, we develop a structural model of innovation that incorporates information on innovation success from firm surveys along with the usual R&D expenditures and productivity measures. We then apply the model to data on Italian SMEs from the ‘‘Survey on Manufacturing Firms’’ conducted by Mediocredito-Capitalia covering the period 1995– 2003. The model is estimated in steps, following the logic of firms’ decisions and outcomes. We find that international competition fosters R&D intensity, especially for high-tech firms. Firm size and R&D intensity, along with investment in equipment, enhances the likelihood of having both process and product innovation. Both these kinds of innovation have a positive impact on firm’s productivity, espe- cially process innovation. Among SMEs, larger and older firms seem to be less productive. Keywords R&D Innovation Productivity SMEs Italy JEL Classifications L26 L60 O31 O33 1 Introduction In the past decade, labor productivity growth in Italy has been one of the lowest in the EU; low growth has been particularly strong in manufacturing, where the growth rate even turned negative in the period from 2000 to 2005 (see Fig. 1). Such a poor performance raises unavoidable policy concerns about the under- lying reasons for it. Is the labor productivity slow- down due to the decline in total factor productivity B. H. Hall Department of Economics, University of California at Berkeley, 549 Evans Hall, Berkeley, CA 94720-3880, USA e-mail: [email protected] B. H. Hall J. Mairesse UNU-MERIT, Maastricht University, Maastricht, The Netherlands B. H. Hall J. Mairesse NBER, Cambridge, MA, USA B. H. Hall IFS, London, UK F. Lotti (&) Economic Research Department, Bank of Italy, Via Nazionale 91, 00184 Rome, Italy e-mail: [email protected] J. Mairesse CREST (ENSAE, Paris), 15, Boulevard Gabriel Peri, 92245 Malakoff Cedex, France e-mail: [email protected] 123 Small Bus Econ (2009) 33:13–33 DOI 10.1007/s11187-009-9184-8
Transcript of Innovation and productivity in SMEs: empirical evidence for...
Innovation and productivity in SMEs: empirical evidencefor Italy
Bronwyn H. Hall Æ Francesca Lotti Æ Jacques Mairesse
Accepted: 1 February 2009 / Published online: 9 May 2009
� Springer Science+Business Media, LLC. 2009
Abstract Innovation in SMEs exhibits some pecu-
liar features that most traditional indicators of
innovation activity do not capture. Therefore, in this
paper, we develop a structural model of innovation
that incorporates information on innovation success
from firm surveys along with the usual R&D
expenditures and productivity measures. We then
apply the model to data on Italian SMEs from the
‘‘Survey on Manufacturing Firms’’ conducted by
Mediocredito-Capitalia covering the period 1995–
2003. The model is estimated in steps, following the
logic of firms’ decisions and outcomes. We find that
international competition fosters R&D intensity,
especially for high-tech firms. Firm size and R&D
intensity, along with investment in equipment,
enhances the likelihood of having both process and
product innovation. Both these kinds of innovation
have a positive impact on firm’s productivity, espe-
cially process innovation. Among SMEs, larger and
older firms seem to be less productive.
Keywords R&D � Innovation � Productivity �SMEs � Italy
JEL Classifications L26 � L60 �O31 � O33
1 Introduction
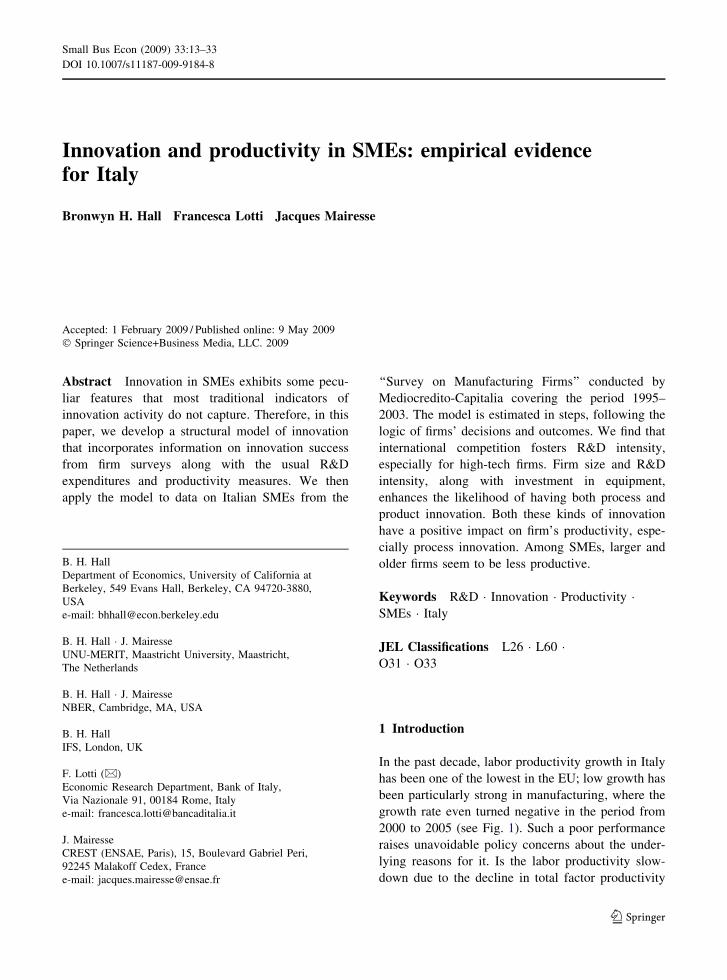
In the past decade, labor productivity growth in Italy
has been one of the lowest in the EU; low growth has
been particularly strong in manufacturing, where the
growth rate even turned negative in the period from
2000 to 2005 (see Fig. 1). Such a poor performance
raises unavoidable policy concerns about the under-
lying reasons for it. Is the labor productivity slow-
down due to the decline in total factor productivity
B. H. Hall
Department of Economics, University of California at
Berkeley, 549 Evans Hall, Berkeley, CA 94720-3880,
USA
e-mail: [email protected]
B. H. Hall � J. Mairesse
UNU-MERIT, Maastricht University, Maastricht,
The Netherlands
B. H. Hall � J. Mairesse
NBER, Cambridge, MA, USA
B. H. Hall
IFS, London, UK
F. Lotti (&)
Economic Research Department, Bank of Italy,
Via Nazionale 91, 00184 Rome, Italy
e-mail: [email protected]
J. Mairesse
CREST (ENSAE, Paris), 15, Boulevard Gabriel Peri,
92245 Malakoff Cedex, France
e-mail: [email protected]
123
Small Bus Econ (2009) 33:13–33
DOI 10.1007/s11187-009-9184-8
(see Daveri and Jona-Lasinio 2005)? Or, more
precisely, is it a consequence of the exhaustion of
the so-called ‘‘capital deepening’’ phase that sup-
ported labor productivity growth during the 1980s (as
documented by Pianta and Vaona 2007)? Alterna-
tively, is it simply due to input reallocation following
a change in the relative price of labor with respect to
capital after the labor market reforms of the early
1990s (Brandolini et al. 2007)? Or does the expla-
nation lie in the evergreen motto that Italian firms
exhibit insufficient R&D investment (European Com-
mission 2006)?
The latter aspect has been largely explained by the
unquestionable fragmentation of the Italian produc-
tion system. According to the latest available data
from the Census, more than 99% of active firms (out
of 4 million) have fewer than 250 employees (95%
have fewer than 10 employees, see Fig. 2). If there
were a positive relationship between innovation
activity—including R&D—and firm size, the size
distribution of Italian firms could help to explain why
Italy is lagging behind in terms of aggregate R&D
investment.
Nevertheless, many scholars have argued that
small firms are the engines of technological change
and innovative activity, at least in certain industries
(see the series of works by Acs and Audretsch 1988,
1990). But at the same time, innovation in small and
medium enterprises exhibits some peculiar features
that most traditional indicators of innovation activity
would not capture, incurring the risk of underesti-
mating their innovation effort. In fact, innovation
often occurs without the performance of formal
R&D, and this is particularly true for SMEs. Despite
the existence of a large number of policies designed
to promote and facilitate the operation of the
innovation process within SMEs, especially in Italy,
the knowledge about how SMEs actually undertake
innovative activities remains quite limited, causing a
significant bias in the treatment of the R&D-
innovation relationship (see Hoffman et al. 1998
for a literature review on this topic in the UK).
This paper is not an attempt to verify or disprove
the Schumpeterian hypothesis, i.e., to study the
relationships between firm size and innovative activ-
ity at the firm level; instead it investigates how and
when innovation takes place in SMEs and whether—
and how—innovation outcomes impact SME firms’
productivity. We caution the reader that because we
rely mainly on dummy variables for the presence of
innovation success, we are in fact unable to say very
much about the size-innovation relationship per se. In
general, larger firms have more than one innovative
activity, which implies a higher probability that at
least one of them is successful and that the innovation
dummy is one.
The remainder of the paper is organized as
follows. In Sect. 2 we put our modeling approach
-2
0
2
4
6
8
10
12
Slovak
Rep
ublic
Poland
Korea
Hunga
ry
Sweden
Czech
Rep
ublic
United
Sta
tes
Finlan
d
Norway
United
King
dom
Japa
n
Franc
e
Nethe
rland
s
Austri
a
Denm
ark
Germ
any
Greec
e
Portu
gal
Belgium
Luxe
mbo
urg
Canad
aSpa
inIta
ly
2000-2005 1995-2000
Fig. 1 Value added per employee. Percentage change, annual rate (1995–2000 and 2000–2005). Total manufacturing. Source:
OECD Factbook, April 2008. Permanent link http://dx.doi.org/10.1787/271772787380
14 B. H. Hall et al.
123

and our results into perspective by giving a sum-
mary—far from being exhaustive—of the previous
empirical studies on the R&D innovation-productiv-
ity relationships. In Sect. 3, we first explain our data
and how we bring them into play in our modeling
approach; we then present in turn our main results on
the R&D investment equations, the innovation equa-
tions and the productivity equation; finally, we
discuss and give evidence on the robustness of these
results and compare them to the comparable findings
of Griffith et al. (2006). In Sect. 4 we conclude with a
discussion of the results and with directions for
further research.
2 Previous studies of the innovation-productivity
link
Measuring the effects of innovative activities on
firms’ productivity has been an active area for
research for several decades, both as a policy concern
and as a challenge for econometric applications. The
large number of empirical studies available notwith-
standing, measuring the effect of innovation (product
and process) on productivity at the firm level (see
Griliches 1995), the literature still does not provide a
unique answer in terms of the magnitude of this
impact. Because of the variability and uncertainty
that is inherent in innovation, this fact is not
unexpected: at best, economic research should give
us a distribution of innovation outcomes and tell us
how they have changed over time. Recent firm level
studies, including Lichtenberg and Siegel (1991) on
the US, Hall and Mairesse (1995) and Mairesse and
Mohnen (2005) on France, Harhoff (1998) and Bonte
(2003) on Germany, Klette and Johansen (1996) on
Norway, Van Leeuwen and Klomp (2006) on The
Netherlands, Janz et al. (2004) on Germany and
Sweden, Loof and Heshmati (2002) on Sweden, Lotti
and Santarelli (2001) and Parisi et al. (2006) on Italy,
find that the effect of R&D on productivity is
positive,1 although some have suggested that the
returns to R&D have declined over time (Klette and
Kortum 2004). The majority of the empirical analyses
rely on an extended production-function approach,
which includes R&D (or alternative measures of
innovation effort) as another input to production.
However, it is widely recognized that R&D does
not capture all aspects of innovation, which often
occurs through other channels. This is particularly
true for small and medium-size firms and could lead
to a severe underestimation of the impact of innova-
tion on productivity. In order to overcome this
problem, subsequent studies have moved from an
input definition of innovation activities to an output
approach, by including in the regressions the out-
come of the innovation process rather than its input.
The rationale behind this line of reasoning is simple:
if it is not possible to measure the innovative effort a
firm exerts because of the presence of latent and
unobservable variables, one should look at the results
of R&D investment: training, technology adoption
and sales of products new to the market or the firm.
95.0
4.50.5 0.10
33
55
72
0.0
10.0
20.0
30.0
40.0
50.0
60.0
70.0
80.0
90.0
100.0
>25050-24910-49<10
Size class
% of firms (Census data)
% of firms with innovation(CIS survey on firms withmore than 10 employees)
Fig. 2 Size distribution of
Italian firms (2001) and
share of firms with
innovation by size class
(2002–2004). Source:
National Institute of
Statistics (ISTAT). Census
of Manufacturing and
Services (2001) for the size
distribution. Community
innovation survey (CIS) for
the presence of innovation
activity (2002–2004)
1 For a survey of previous empirical results, see Mairesse and
Sassenou (1991); Griliches (1998).
Innovation and productivity in SMEs 15
123

All these activities may be signs of successful
innovative effort, but if one considers R&D only, a
lot of this informal activity is going to be missing
from the analysis (Blundell et al. 1993, Crepon et al.
1998). As suggested by Kleinknecht (1987), official
R&D measures for SMEs may underestimate their
innovation activities, and the underestimate is likely
to be larger at the left end of the firm size distribution.
Crepon et al. (1998) take a further step in this
literature, combining the aforementioned approaches.
They propose and estimate a model—CDM model
hereafter—that establishes a relationship among
innovation input (mostly, but not limited, to R&D),
innovation output and productivity. This structural
model allows a closer look at the black box of the
innovation process at the firm level: it not only
analyzes the relationship between innovation input
and productivity, but it also sheds some light on the
process in between the two.
The CDM approach is based on a simple three-step
modeling of the logic of firms’ innovation decisions
and outcomes. The first step corresponds to the firm
decision whether to engage in R&D or not and on
how many resources to invest. Given the firm’s
decision to invest in innovation, the second step
consists of a knowledge production function (as in
Pakes and Griliches 1984), which relates innovation
output to innovation input and other factors. In the
third step, an innovation augmented Cobb-Douglas
production function specifies the effect of innovative
output on the firm’s productivity. The model is
tailored to take advantage of innovation survey data,
which provide measures of other aspects of innova-
tion and not only on R&D expenditures. Given the
increased diffusion of this type of micro data across
countries and among scholars, many empirical explo-
rations of the impact of innovation on productivity
have relied on the CDM framework.2
In particular, Parisi et al. (2006) apply a modified
version of the CDM model to a sample of Italian
firms (using two consecutive waves of the Mediocr-
edito-Capitalia survey, the same source we are using
in our empirical analysis), enriching the specification
with a time dimension.3 They find that process
innovation has a large and significant impact on
productivity and that R&D is positively associated
with the probability of introducing a new product,
while the likelihood of having process innovation is
directly linked to a firm’s investment in fixed capital.
In comparing those results to the ones we obtain in
this paper, one has to keep in mind that, due to the
design of the survey itself, the panel used by Parisi,
Schiantarelli and Sembenelli is tilted towards med-
ium and large firms much more than the original
Mediocredito-Capitalia sample.
To our knowledge, none of the empirical papers
investigating the relationship between innovation and
productivity has dealt specifically with small and
medium-sized firms. On one hand, this paper is aimed
at filling this gap, since innovation in SMEs is even
more difficult to measure; on the other, like Griffith
et al. (2007), we try to improve on the CDM original
specification by considering separately both product
and process innovation.
3 Data and main results
3.1 Descriptive statistics
The data we use come from the seventh, eighth and
ninth waves of the ‘‘Survey on Manufacturing Firms’’
conducted by Mediocredito-Capitalia (an Italian
commercial bank). These three surveys were carried
out in 1998, 2001 and 2004, respectively, using
questionnaires administered to a representative sam-
ple of Italian manufacturing firms. Each survey
covered the 3 years immediately prior (1995–1997,
1998–2000, 2001–2003), and although the survey
questionnaires were not identical in all three of the
surveys, the questions providing the information used
in this work were unaffected. All firms with more
than 500 employees were included, whereas smaller
firms were selected using a sampling design stratified
by geographical area, industry and firm size. We2 See Hall and Mairesse (2006) for a comprehensive survey.
Recent papers based on the CDM model include Benavente
(2006) on Chile, Heshmati and Loof (2006) on Sweden,
Jefferson et al. (2006) on China, Klomp and Van Leeuwen
(2001) on The Netherlands, Mohnen et al. (2006) on seven
European countries and Griffith et al. (2006) on four European
countries.
3 Although the Mediocredito-Capitalia survey is not a panel
itself, it contains repeated observation for a number of firms,
which is enough to allow the estimation of a dynamic
framework. See Sect. 3 of this paper for further information
on the data.
16 B. H. Hall et al.
123

merged the data from these three surveys, excluding
firms with incomplete information or with extreme
observations for the variables of interest.4 We focus
on SMEs, which represent nearly 90% of the whole
sample, imposing a threshold of 250 employees, in
line with the definition of the European Commission;
we end up with an overall unbalanced panel of 9,674
observations on 7,375 firms, of which only 361 are
present in all three waves. Table 1 contains some
descriptive statistics for both the unbalanced and the
balanced panel. Not surprisingly, in both cases, the
firm size distribution is skewed to the right, with an
average of respectively 50 and 53 employees and a
median of respectively 32 and 36. Firms in the low-
tech sector tend to be slightly smaller, with average
employment of 47 and median employment of 30
(Table 2).5 In the unbalanced sample, 62% of the
firms have successful product and/or process innova-
tion, but only 41% invest in R&D. Such a difference
is evidence for the importance of informal innovation
activities. Although a sizeable share of firms invests
in R&D, only a small fraction seems to do it
continuously: out of 361 firms in our balanced panel,
34% invested in R&D in every period under exam-
ination. For 21% of the firms, product and process
innovations go together, while 27% are process
innovators only. Concerning competition, more than
42% of the firms in the sample have national compet-
itors, while 18% and 14% have European and
international competitors, respectively. Interestingly,
low-tech firms tend to compete more within the
national boundaries, while almost half of the high-
tech firms operate in European or international mar-
kets, in line with Janz et al. (2004).
For comparability with the samples used by
Griffith et al. (2006) for France, Germany, Spain
and the UK, in Table 7 of the Appendix we show the
means for our entire sample, including non-SMEs
and excluding firms with fewer than 20 employees.
Even if the share of innovators—product and pro-
cess—are not dissimilar, Italian firms display a
significantly lower R&D intensity but roughly com-
parable investment intensities. These figures can be
partially explained by the different firm size distri-
bution within each country: around 60 of the firms in
the Italian sample for the year 2000 belong to the
smaller class size (20–49 employees), a figure much
larger than that for other countries.6 Interestingly,
labor productivity is somewhat higher for the Italian
firms.
3.2 Data and model specification
As discussed earlier, in order to analyze the relation-
ship among R&D, innovation and productivity at the
firm level, we relied on a modified version of the model
proposed by Crepon et al. (1998). This model—
specifically tailored for innovation survey data and
built to take into account the econometric issues that
arise in this context—is made up of three building
blocks, following the sequence of firms’ decisions in
terms of innovation activities and outcomes. The first
one concerns R&D activities, i.e., the process that
leads the firm to decide whether to undertake R&D
projects or not and how much to invest on R&D. The
second one consists of a two-equation knowledge
production function in which R&D is one of the inputs,
and process and product innovation are two outputs.
The third consists of a simple extended production
function in which knowledge (i.e., process and product
innovation) is an input.
We perform our analysis for the whole sample of
firms, and for high- and low-tech firms, since the
effect of R&D on productivity can vary a lot with the
technological content of an industry (see Verspagen
1995 for a cross-country, cross-sector study and,
4 We require that sales per employee be between 2,000 and 10
million euros, growth rates of employment and sales of old and
new products between -150% and 150%, and the R&D
employment share less than 100%. We also replaced R&D
employment share with the R&D to sales ratio for the few
observations where it was missing. For further details, see Hall
et al. (2008). In addition, we restrict the sample by excluding a
few observations with zero or missing investment.5 We adopt the OECD definition for high- and low-tech
industries. High-tech industries encompass high and medium-
high technology industries (chemicals; office accounting and
computer machinery; radio, TV and telecommunication instru-
ments; medical, precision and optical instruments; electrical
machinery and apparatus, n.e.c.; machinery and equipment;
railroad and transport equipment, n.e.c.). Low-tech industriesencompass low and medium-low technology industries (rubber
and plastic products; coke, refined petroleum products; other
non-metallic mineral products; basic metals and fabricated
metal products; manufacturing, n.e.c.; wood, pulp and paper;
food, beverages and tobacco products; textile, textile products,
leather and footwear).
6 We do not yet know how much of the difference is due to
differences in sampling strategy across the different countries.
Innovation and productivity in SMEs 17
123

more recently, an analysis based on micro data by
Potters et al. 2008).
Because of the way our data, and innovation
survey data in general, were collected, our analysis
here is essentially cross-sectional. Although there are
three surveys covering 9 years, the sampling meth-
odology was such that few firms appeared in more
than one survey (as we saw in Table 1, fewer than 5%
of the firms and about 10% of the observations are in
the balanced panel). Due to the resulting small
sample size and very limited information in the time
series dimension, we found that controlling for fixed
firm effects was not really possible in practice. Other
difficulties arise from the fact that the process and
product innovation indicators are defined over 3-year
periods, while the income statement data, when
available, are on a yearly basis. As a robustness
check we estimated the same three-equation
model using lagged R&D intensity instead of
contemporaneous R&D intensity in order to account
for a plausible delay between R&D and innovation
output. Given the low volatility of R&D investment
over time, the results were very similar to those
reported below.7
3.3 The R&D equations
The firm R&D decisions can be modeled in terms of
two equations: a selections equation and an intensity
equation. The selection equation can be specified as:
RDIi ¼1 if RDI�i ¼ wiaþ ei [ �c0 if RDI�i ¼ wiaþ ei� �c
�ð1Þ
where RDIi is an (observable) indicator function that
takes value 1 if firm i has (or reports) positive R&D
Table 1 Descriptive
statistics, unbalanced and
balanced sample
a Units are logs of euros
(2000) per employee
Period: 1995–2003 Unbalanced sample Balanced sample
Number of observations (firms) 9,674 (7,375) 1,083 (361)
Continuous R&D engagement (%) 41.49 26.04
R&D intensity (for R&D doing firms, in logs)a 1.08 1.02
Innovator (process and/or product, %) 62.05 66.39
Process innovation (%) 50.75 53.65
Product innovation (%) 34.85 40.63
Process and product innovation (%) 20.94 25.39
Process innovation only (%) 27.21 25.76
Share of sales with new products (%) 22.16 22.98
Labor productivity: mean/mediana 4.99/4.94 4.94/4.85
Investment intensity: mean/mediana 7.90/4.05 6.92/4.01
Public support (%) 45.49 50.51
Regional competitors (%) 16.84 14.87
National competitors (%) 42.24 41.37
European competitors (%) 17.53 18.10
International (non EU) competitors (%) 13.56 17.17
Large competitors (%) 36.18 34.16
Percentage of firm in size class (11–20) 30.04 19.67
Percentage of firm in size class (21–50) 38.85 44.04
Percentage of firm in size class (51–250) 31.11 36.29
Percentage of firm in age class (\15 years) 32.45 24.10
Percentage of firm in age class (15–25 years) 30.48 31.12
Percentage of firm in age class ([25) 37.07 44.78
Number of employees: mean/median 49.45/32 53.48/36
Group (%) 20.07 16.25
7 Although we did not include these results in the paper for the
sake of brevity, they are available from the authors.
18 B. H. Hall et al.
123

expenditures, RDIi* is a latent indicator variable such
that firm i decides to perform (or to report) R&D
expenditures if they are above a given threshold �c, wi
is a set of explanatory variables affecting R&D and ei
the error term.
The R&D intensity equation can be specified as:
RDi ¼RD�i ¼ zibþ ei if RDIi ¼ 1
0 if RDIi ¼ 0
�ð2Þ
where RDi* is the unobserved latent variable account-
ing for firm’s innovative effort, and zi is a set of
determinants of R&D expenditures. Assuming that
the error terms in (1) and (2) are bivariate normal
with zero mean and variance equal to unity, the
system of Eq. 1 and 2 can be estimated by maximum
likelihood. In the literature, this model is sometimes
referred to as a Heckman selection model (Heckman
1979) or Tobit type II model (Amemiya 1984).
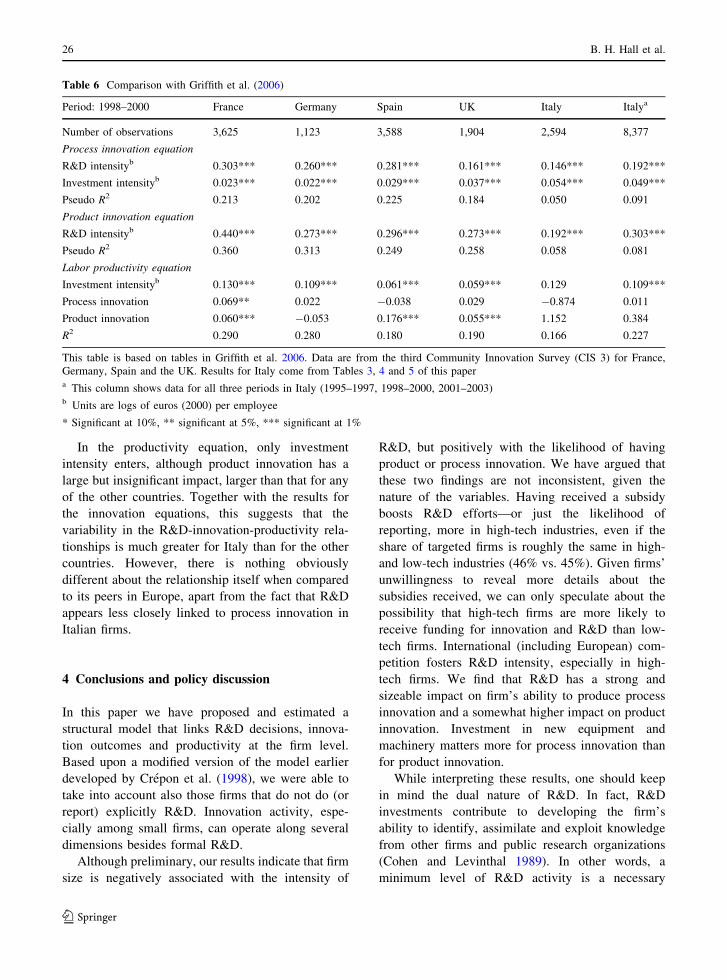
Before estimating the selection model, we per-
formed a non-parametric test for the presence of
selection bias in the R&D intensity equation (see Das
et al. 2003; Vella 1998 for a survey). In so doing, we
first estimate a probit model in which the presence of
positive R&D expenditures is regressed on a set of
firm characteristics: firm size, age and their squares, a
set of dummies indicating competitors’ size and
location, dummy variables indicating (1) whether the
firm received government subsidies and (2) whether
the firm belongs to an industrial group; the results are
reported in Table 8 in the Appendix. From this result,
we recovered for each firm the predicted probability
of having R&D and the corresponding Mills’ ratio,
and then we estimated a simple linear regression (by
OLS) for R&D intensity, including in this regression
the predicted probabilities from the R&D decision
equation, the Mills’ ratio, their squares and
Table 2 Descriptive
statistics, high-tech and
low-tech industries
a Units are logs of euros
(2000) per employee
Period: 1995–2003 High-tech firms Low-tech firms
Number of observations (firms) 2,870 (2,165) 6,804 (5,210)
Continuous R&D engagement (%) 58.75 34.22
R&D intensity (for R&D doing firms, in logs)a 1.20 0.98
Innovator (process and/or product, %) 69.41 58.95
Process innovation (%) 54.25 49.28
Product innovation (%) 43.80 31.06
Process and product innovation (%) 25.57 18.72
Process innovation only (%) 26.20 27.90
Share of sales with new products (%) 22.63 21.88
Labor productivity: mean/mediana 4.93/4.89 5.02/4.96
Investment intensity: mean/mediana 6.22/3.36 8.62/4.38
Public support (%) 46.27 45.16
Regional competitors (%) 12.30 18.75
National competitors (%) 36.45 44.68
European competitors (%) 25.40 14.21
International (non EU) competitors (%) 19.86 10.91
Large competitors (%) 42.54 33.50
Percentage of firm in size class (11–20) 27.25 31.22
Percentage of firm in size class (21–50) 36.86 39.68
Percentage of firm in size class (51–250) 35.89 29.10
Percentage of firm in age class (\15 years) 32.79 32.30
Percentage of firm in age class (15–25 years) 31.67 29.98
Percentage of firm in age class ([25) 35.54 37.71
Number of employees: mean/median 54.17/35 47.46/30
Group (%) 25.26 17.89
Innovation and productivity in SMEs 19
123

interaction terms. The presence of selectivity bias is
tested for by looking at the significance of those
‘‘probability terms.’’8 The results are reported in
Table 8 in the Appendix. As one can see, the
probability terms are never significant, either singly
or jointly. Therefore, we adopted the linear regression
(OLS) specification for the R&D intensity decision
without any correction for selectivity bias. In Table 3
we report the estimates performed using the pooled
overall high- and low-tech samples, and including the
regression year and two-digit industry dummies as
well as ‘‘wave dummies’’ as controls. Wave dummies
are a set of indicators for firm’s presence or absence
in the three waves of the survey.9
Table 3 shows that the presence of EU and
international competitors is strongly positively
related to R&D effort: engaging in exporting activity
implies investing more in R&D (see Baldwin et al.
2002 and Baldwin and Gu 2003 for an exploration
using Canadian data), and this effect is particularly
strong for high-tech firms, where competing interna-
tionally is associated with a doubling of R&D
intensity. Non-exporting firms, i.e., those operating
in a market that is mainly local, have, on average,
lower R&D intensity.
We also found that having received a subsidy
significantly boosts R&D intensity, as could be
expected.10 Being part of an industrial group
increases R&D intensity, but the coefficient is barely
statistically significant.
We also included age class dummies in the
regression (the base group is younger firms, defined
as those with fewer than 15 years): although the
coefficients are not statistically significant, they seem
to indicate that older firms may have a slightly lower
incentive to do R&D than younger firms. We find
also that ‘‘other things being equal,’’ larger firms tend
to do relatively less R&D per employee than small
firms (the 11–20 size class), and this is particularly
true for low-tech firms (for a discussion of the
relationship between size and R&D investment at the
firm level, see Cohen and Klepper 1996).
3.4 Innovation equations
In order to account for firm innovations that are not
necessarily based on formal R&D activities, which
are likely to be especially important for SMEs, we do
not restrict estimation to R&D performing firms only.
Following the original CDM model, we thus specify
the innovation equation in terms of the latent R&D
intensity variable and not the observed R&D inten-
sity. Also, like in Griffith et al. (2006), we specify
separately an equation for product innovation and one
for process innovation, which can thus be written as:
PRODi ¼ RD�i cþ xidþ u1i
PROCi ¼ RD�i cþ xidþ u2i
�ð3Þ
where RDi* is the latent innovation effort proxied by
the predicted value of R&D intensity from the first
step model, xi a set of covariates and u1i and u2i the
error terms such that Cov(u1i, u2i) = q. Including the
predicted R&D intensity in the regression accounts
for the fact that all firms may have some kind of
innovative effort, although only some of them invest
in R&D and report it. Using the predicted value
instead of the realized value is also a sensible way to
instrument the innovative effort in the knowledge
production function in order to deal with the simul-
taneity problem between R&D effort and the expec-
tation of innovative success.
Equation 3 is estimated as a bivariate probit
model, assuming that most of the firm characteristics
that affect product and process innovation are the
same, although of course their impacts may differ.
The only exception is the investment rate, which is
assumed to be related to process innovation but not to
product innovation. Table 4 (as in Table 3) reports
the results from the overall, and the high-tech and
low-tech sample. The estimated correlation coeffi-
cient q is always positive and significant, which
implies that process and product innovation are
influenced to some extent by the same unobservable
factors. Marginal effects are reported in square
brackets. For an example of how to interpret these
effects, the first two columns indicate that a doubling
8 Note that this is a generalization of Heckman’s two-step
procedure for estimation when the error terms in the two
equations are jointly normally distributed. The test here is valid
even if the distribution is not normal.9 For instance, a firm present in all three waves will have a
‘‘111’’ code, ‘‘100’’ if present in the first only, ‘‘110’’ if in the
first and in the second only, and so forth. These codes are
transformed into a set of six dummies (23 = 8 minus the 000
case and the exclusion restriction).10 Because of the large number of missing observations, we
could not use a narrower definition of subsidies.
20 B. H. Hall et al.
123

of predicted R&D intensity is associated with a 0.19
increase in the probability of process innovation and
a 0.25 increase in the probability of product
innovation.
As expected, the R&D intensity predicted by the
first equation has a positive and sizeable impact on
the likelihood of having product and process innova-
tion, which is higher for product innovation for all
three groups of firms. Interestingly, the impact of
R&D on process innovation in low-tech firms is more
than double that for high-tech firms (0.24 vs. 0.10).
Firms in low-tech industries, on average, have lower
R&D intensity, but their R&D effort leads to a higher
probability of having at least one process innovation
when compared to high-tech firms. A number of
interpretations suggest themselves: one possibility is
that innovating in this sector takes less R&D because
it involves changes to the organization of production
that are not especially technology-linked. A second
related interpretation is provided by the dual role of
R&D (Cohen and Levinthal 1989): investment in
research is fundamental for product innovation, but at
the same time, it increases firm’s ability to absorb and
adopt those technologies developed somewhere else,
which are likely to become process innovation.
As suggested in the introduction, firm size is
strongly associated with innovative success, espe-
cially among low-tech firms. Note that this result
does not contradict that for R&D intensity, because
innovation is measured by a dummy variable.
Although larger firms may have a somewhat lower
R&D effort given their size, in absolute terms they do
more R&D, so they have a higher probability of
innovative success. Finally, with the exception of
product innovation in firms older than 25 years, the
age of the firm is not particularly associated with
innovation of either kind.
We also note that investment intensity is positively
associated with process innovation in both high- and
low-tech firms. We defer a fuller discussion of the
Table 3 R&D intensity
(STEP 1): OLS model
(dependent variable, R&D
intensity)
Coefficients and their
standard errors are shown
The standard errors are
robust to heteroskedasticity
and clustered at the firm
level
Industry, wave and time
dummies are included in all
equations
Reference groups: D
(provincial competitors);
size class (11–50
employees); age class
(\15 years)
* Significant at 10%,
** significant at 5%,
*** significant at 1%
R&D expenditure per employee
(in logarithms)
All firms High tech Low tech
D (Large firm competitors) 0.062
(0.073)
0.197
(0.109)
-0.028
(0.098)
D (Regional competitors) 0.094
(0.167)
0.548
(0.320)
-0.049
(0.197)
D (National competitors) 0.138
(0.147)
0.638*
(0.290)
-0.037
(0.172)
D (European competitors) 0.511***
(0.154)
0.834**
(0.287)
0.448*
(0.187)
D (International competitors) 0.570***
(0.159)
1.034***
(0.296)
0.357
(0.195)
D (Received subsidies) 0.389***
(0.072)
0.619***
(0.111)
0.213*
(0.095)
D (Member of a group) 0.198*
(0.084)
0.247
(0.128)
0.165
(0.114)
Size class (21–50 employees) -0.271**
(0.104)
-0.141
(0.164)
-0.349**
(0.134)
Size class (51–250 employees) -0.271*
(0.109)
-0.123
(0.167)
-0.379**
(0.145)
Age class (15–25 years) -0.009
(0.094)
0.032
(0.141)
-0.032
(0.127)
Age class ([25 years) -0.061
(0.090)
-0.147
(0.135)
-0.003
(0.120)
R2 0.061 0.065 0.038
Number of observations 4,015 1,687 2,328
Innovation and productivity in SMEs 21
123

Ta
ble
4A
biv
aria
tep
rob
itfo
rp
roce
ssan
dp
rod
uct
inn
ov
atio
nd
um
mie
s(S
TE
P2
):al
lfi
rms,
hig
h-
and
low
-tec
hfi
rms
All
firm
sH
igh
-tec
hfi
rms
Lo
w-t
ech
firm
s
(1)
(1a)
(2)
(2a)
(3)
(3a)
Pro
cess
inn
ov
atio
nP
rod
uct
inn
ov
atio
nP
roce
ssin
no
vat
ion
Pro
du
ctin
no
vat
ion
Pro
cess
inn
ov
atio
nP
rod
uct
inn
ov
atio
n
Pre
dic
ted
R&
Din
ten
sity
(in
log
s)0
.48
3*
**
[0.1
93
]
(0.0
45
)
0.6
86
**
*[0
.25
0]
(0.0
45
)
0.2
56
**
*[0
.10
2]
(0.0
56
)
0.4
99
**
*[0
.19
6]
(0.0
56
)
0.6
02
**
*[0
.24
0]
(0.0
69
)
0.7
49
**
*[0
.26
1]
(0.0
69
)
Inv
estm
ent
per
emp
loy
ee(i
nlo
gs)
0.1
25
**
*[0
.05
0]
(0.0
11
)
0.1
20
**
*[0
.04
7]
(0.0
21
)
0.1
29
**
*[0
.05
1]
(0.0
13
)
Siz
ecl
ass
(21
–5
0em
plo
yee
s)0
.25
5*
**
[0.1
01
]
(0.0
33
)
0.3
10
**
*[0
.11
5]
(0.0
35
)
0.1
59
*[0
.06
3]
(0.0
62
)
0.1
26
*[0
.05
0]
(0.0
63
)
0.3
50
**
*[0
.13
9]
(0.0
43
)
0.4
31
**
*[0
.15
3]
(0.0
46
)
Siz
ecl
ass
(51
–2
50
emp
loy
ees)
0.4
46
**
*[0
.17
5]
(0.0
37
)
0.5
04
**
*[0
.18
9]
(0.0
38
)
0.2
76
**
*[0
.10
8]
(0.0
68
)
0.2
99
**
*[0
.11
8]
(0.0
67
)
0.6
06
**
*[0
.23
7]
(0.0
48
)
0.6
79
**
*[0
.24
8]
(0.0
49
)
Ag
ecl
ass
(15
–2
5y
ears
)0
.00
9[0
.00
4]
(0.0
34
)
0.0
50
[0.0
18
]
(0.0
34
)
0.0
04
[0.0
01
]
(0.0
61
)
0.0
36
[0.0
14
]
(0.0
61
)
0.0
20
[0.0
08
]
(0.0
40
)
0.0
58
[0.0
20
]
(0.0
42
)
Ag
ecl
ass
([2
5y
ears
)-
0.0
03
[-0
.00
1]
(0.0
33
)
0.1
29
**
*[0
.04
7]
(0.0
34
)
0.0
94
[0.0
37
]
(0.0
62
)
0.1
57
*[0
.06
2]
(0.0
62
)
-0
.06
7[-
0.0
26
]
(0.0
39
)
0.0
94
*[0
.03
3]
(0.0
41
)
Rh
o0
.40
0*
**
0.3
45
**
*0
.43
0*
**
Pse
ud
oR
20
.10
0.0
80
.09
0.0
80
.10
0.0
6
Nu
mb
ero
fo
bse
rvat
ion
s(fi
rms)
9,6
74
(7,3
75
)2
,87
0(2
,16
5)
6,8
04
(5,2
10
)
Co
effi
cien
ts,
mar
gin
alef
fect
san
dst
and
ard
erro
rsar
esh
ow
n
Mar
gin
alef
fect
sar
ein
squ
are
bra
cket
s
Th
est
and
ard
erro
rsar
ero
bu
stto
het
ero
sked
asti
city
and
clu
ster
edat
the
firm
lev
el
Ind
ust
ry,
wav
ean
dti
me
du
mm
ies
are
incl
ud
edin
all
equ
atio
ns
Ref
eren
ceg
rou
ps:
D(p
rov
inci
alco
mp
etit
ors
),si
zecl
ass
(11
–5
0em
plo
yee
s),
age
clas
s(\
15
yea
rs)
*S
ign
ifica
nt
at1
0%
,*
*si
gn
ifica
nt
at5
%,
**
*si
gn
ifica
nt
at1
%
22 B. H. Hall et al.
123

issues associated with the presence of investment in
the process innovation equation (and also in the
product innovation equation) until after we present
the productivity results.
3.5 The productivity equation
The productivity equation is specified as a simple
Cobb–Douglas technology with constant returns to
scale, and with labor, capital and knowledge inputs,
which can be written as:
yi ¼ p1ki þ p2PRODi þ p3PROCi þ vi ð4Þ
where yi is labor productivity (real sales per employee,
in logs); ki is investment intensity, our proxy for
physical capital; PRODi and PROCi are knowledge
inputs, proxied by the predicted probability of product
and process innovation. Using these predicted proba-
bilities instead of the observed indicators is a way to
address the issue of potential endogeneity (and mea-
surement errors in variables) of the knowledge inputs.
We thus generate the two predicted probabilities of
innovation from the two estimated innovation equa-
tions as being respectively the probability of process
innovation alone and the probability of product
innovation, whether or not it is accompanied by
process innovation.11 Results are reported in Table 5
for specifications with and without investment as a
proxy for capital; as before, estimates are reported
separately for all firms and for firms in high- and low-
tech industries. Our preferred specifications, in col-
umns (1a), (2a) and (3a), include investment intensity.
When investment is not included in the regression,
i.e., in columns (1a), (2a) and (3a), process innova-
tion displays a sizeable and positive impact on
productivity. Process innovators have a productivity
level approximately two and one half times that of
non-innovators, ceteris paribus. On the contrary,
when investment is included, the coefficients of
process innovation are not significant. These differ-
ences clearly arise from the inclusion of the same
investment variable in the process innovation equa-
tion with the consequence that process innovation in
the productivity equation already encompasses the
effect of investment in new machinery and equip-
ment. However, since the investment rate is a better
measure than the process innovation dummy, when
both variables are included its effect tends to
dominate.
Product innovation enhances productivity consid-
erably, although to a lesser extent than process
innovation when investment is included in the
productivity equation. The impact is slightly stronger
for firms in the high-tech firms than in the low-tech
industries. Because in particular, much of product
innovation is directed towards higher quality products
and product differentiation, it is not surprising that it
shows up quite differently than process innovation in
the productivity relation. Table 9 in the Appendix
confirms that the contribution of product innovation
to productivity is much more robust to the inclusion
of investment intensity in the productivity equation
included in the product and process innovation
equations.
Another interesting and robust finding is that
among SMEs relatively larger firms seem to be
significantly less productive than smaller ones. It is
also noteworthy that age impacts productivity nega-
tively for firms in the high-tech industries.
3.6 Investment and innovation
In our preferred specification in Table 4, we assumed
that capital investment—which to a great extent
means the purchase of new equipment—should
contribute significantly to process innovation, but
not to product innovation. In fact, we found a small
marginal impact of investment on process innovation
that was approximately the same for high- and low-
tech industries (0.05).
Because the assumption that investment is associ-
ated with process and not with product innovation
may be somewhat arbitrary, we performed some
robustness checks reported in Table 9 in the Appen-
dix, experimenting with different alternatives. Col-
umns (1)–(4) of that Table reports all the possible
combinations in the second step: whether investment
is devoted to process innovation only (column 1), to
product innovation only (column 2), to both (column
3) or to none (column 4). In the same columns we
show the productivity equation, estimated using each
of these different models to predict the probability of
process and product innovation. In the bottom panel
11 The first is estimated probability of process and not product
from the bivariate probit model in Table 4, and the second is
the marginal probability of product innovation from the same
model.
Innovation and productivity in SMEs 23
123

of the Table, we also report an alternative specifica-
tion of the productivity equation without investment.
Although column (1) still represents our preferred
specification, column (3) suggests that physical
investment has a small (0.02) positive impact on
product innovation as well. Turning to the produc-
tivity equation, it can be noted that the inclusion of
investment wipes out the significance of process
innovation, since investment is one of its main
determinants, but not of product innovation, which
is more dependent on R&D investment. Excluding
investment from the productivity equation reveals
that the process innovation associated with invest-
ment is more relevant for productivity than predicted
product innovation (compare the process innovation
coefficients for step 3 in columns 1 and 3).
3.7 Further robustness checks
The estimation method used in the body of the paper
is sequential, with three steps: (1) the R&D intensity
equation estimated only on firms that report doing
R&D continuously; (2) a bivariate probit for process
and product innovation that contains R&D predicted
by the first step for all firms; (3) a productivity
equation that contains the predicted probabilities for
process innovation alone and product innovation with
or without process innovation. Because the last two
steps contain fitted or predicted values, their standard
errors will be underestimated by our sequential
estimation method. In order to assess the magnitude
of this underestimation, we re-estimated our preferred
model specification (1a) on all firms simultaneously
using maximum likelihood.
The likelihood function consists of the sum of a
normal density for the R&D equation, a bivariate
probit for process and product innovation, and a
normal density for the productivity equation; it does
not allow for correlation of the disturbances among
the three blocks, although the resulting standard
errors are robust to such correlation. In this likelihood
function, the equation for R&D is directly entered
Table 5 Production function (STEP 3): all firms, high- and low-tech firms
Dependent variable: labor
productivity (sales per
employee in logs)
All firms High-tech firms Low-tech firms
(1) (1a) (2) (2a) (3) (3a)
Predicted probability of
process innovation only
2.624***
(0.146)
0.193
(0.267)
2.742***
(0.304)
0.664
(0.512)
2.797***
(0.171)
0.063
(0.391)
Predicted probability of
product innovation
0.961***
(0.083)
0.597***
(0.093)
1.314***
(0.149)
0.700***
(0.200)
0.900***
(0.118)
0.708***
(0.122)
Investment per employee
(in logs)
0.099***
(0.010)
0.073***
(0.015)
0.109***
(0.015)
Size class (21–50
employees)
-0.184***
(0.016)
-0.136***
(0.017)
-0.140***
(0.029)
-0.085**
(0.031)
-0.204***
(0.020)
-0.163***
(0.021)
Size class (51–250
employees)
-0.313***
(0.023)
-0.243***
(0.024)
-0.177***
(0.037)
-0.116**
(0.038)
-0.391***
(0.031)
-0.321***
(0.032)
Age class (15–25 years) -0.006
(0.016)
-0.017
(0.016)
-0.0579*
(0.026)
-0.064*
(0.026)
0.0174
(0.020)
0.005
(0.020)
Age class ([25 years) 0.008
(0.016)
-0.038*
(0.016)
-0.0764**
(0.027)
-0.069**
(0.027)
0.0469*
(0.020)
-0.036
(0.022)
R2 0.209 0.219 0.194 0.201 0.227 0.226
Number of observations
(firms)
9,674 (7,375) 2,870 (2,165) 6,804 (5,210)
Coefficients and their standard errors are shown
The standard errors are robust to heteroskedasticity and clustered at the firm level
Industry, wave and time dummies are included in all equations
Reference groups: D (provincial competitors); size class (11–50 employees); age class (\15 years)
* Significant at 10%, ** significant at 5%, *** significant at 1%
24 B. H. Hall et al.
123

into the innovation equations and that for innovation
probability directly into the productivity equation, so
the coefficient standard errors take account of the
estimation uncertainty in the first two stages.
The results of estimation on the pooled model are
shown in column (2) of Table 10 in the Appendix,
with the sequential estimation results in column (1)
for comparison.12 Although the results for the key
coefficients are similar and have approximately the
same significance, the standard errors from pooled
maximum likelihood are considerably larger, espe-
cially for the predicted process and product proba-
bilities. So this should be kept in mind when
interpreting the results in the tables of the paper.
Table 10 also shows the results of another exper-
iment—in this paper we chose to proxy capital
intensity by investment intensity, in order to be
comparable to the results in Griffith et al. 2006.
However, in our data we also have a measure of
capital available, constructed from investment using
the usual declining balance method with a depreci-
ation rate of 5% and an initial stock from the balance
sheet of the firm in 1995 or the year it entered the
survey. Columns (3)–(5) of the table show the results
of estimating specifications containing capital stock
at the beginning of the period and using the pooled
maximum likelihood method. Column (3) simply
replaces investment with capital stock, while column
(4) uses investment as an instrument for process
innovation, but capital in the production function.
Column (5) includes both investment and capital in
both equations.
The results are somewhat encouraging: capital
stock is clearly preferred in the production function.
In fact, when it is included, investment enters only
via its impact on process innovation. On the other
hand, investment is a better predictor of process
innovation, although capital still plays a role. How-
ever, recall that innovation is measured over the
preceding 3 years, so that some of the investment
associated with process innovation is likely to be
already included in beginning of year capital. Our
conclusion is that there is a strong association of
process innovation with capital investment and that
such process innovation has a large impact on
productivity.
3.8 Comparison to Griffith et al. 2006
The results shown in the previous section can help in
shedding some light on the R&D-innovation-produc-
tivity relationship in Italian firms. Interesting insights
can be gained from the differential impact of R&D on
process and product innovation, as well as their
different impact on productivity. Nevertheless, at this
point, it is worth asking a further question: is the
R&D-innovation-productivity link different for Ital-
ian firms when they are compared to other European
countries? In order to answer this question, we built a
slightly different sample of firms from our data that
removed firms with fewer than 20 employees and
included firms with more than 250 employees.13
Using this sample, we are able to compare our
estimates to those for France, Germany, Spain and the
UK (Griffith et al. 2006). Table 6 presents the results
of this comparison.14 The last two columns are for
Italy, the column before the last being for the same
period (1998–2000), and the last one for our overall
sample for the three periods 1995–1997, 1998–2000
and 2001–2003 pooled together.
The Table shows that the results for Italy are
roughly comparable with those for the other coun-
tries, but that the period (1998–2000) seems to be a
bit of an outlier. We do not have an explanation for
this fact other than to point out that this period
corresponds to the introduction of the euro. We
therefore focus on the results for the overall sample.
R&D intensity is somewhat more strongly associated
with process innovation than in the UK and much less
strongly than in the other countries. Investment
intensity is more strongly related to process innova-
tion than in the other countries. Also noteworthy is
that for Italy, the explanatory power of the innova-
tions equations is considerably lower.
12 The sample size in this table is 9,014, reduced from 9,674 in
the main tables of the paper due to the absence of lagged
capital (beginning of year capital) for some of the observations.
13 The overlap of this sample with the sample used in the main
body of the paper is 75%.14 For precise comparability with the earlier paper, in this table
we estimated the process and product innovation equations
using single probits rather than a bivariate probit. This is
consistent, but not efficient, given the correlation between the
two equations.
Innovation and productivity in SMEs 25
123
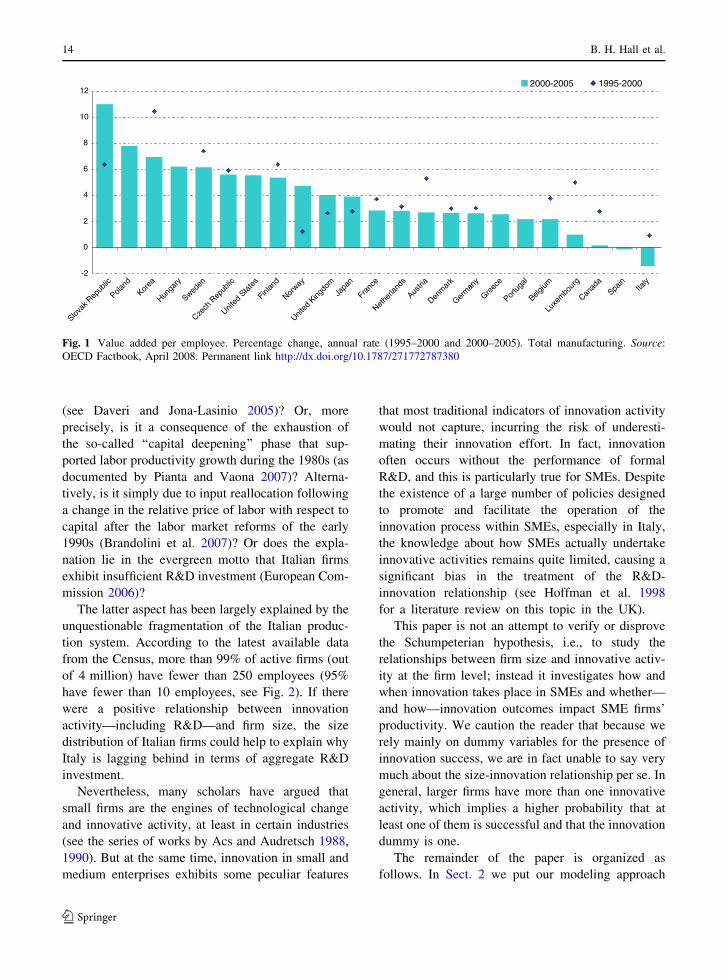
In the productivity equation, only investment
intensity enters, although product innovation has a
large but insignificant impact, larger than that for any
of the other countries. Together with the results for
the innovation equations, this suggests that the
variability in the R&D-innovation-productivity rela-
tionships is much greater for Italy than for the other
countries. However, there is nothing obviously
different about the relationship itself when compared
to its peers in Europe, apart from the fact that R&D
appears less closely linked to process innovation in
Italian firms.
4 Conclusions and policy discussion
In this paper we have proposed and estimated a
structural model that links R&D decisions, innova-
tion outcomes and productivity at the firm level.
Based upon a modified version of the model earlier
developed by Crepon et al. (1998), we were able to
take into account also those firms that do not do (or
report) explicitly R&D. Innovation activity, espe-
cially among small firms, can operate along several
dimensions besides formal R&D.
Although preliminary, our results indicate that firm
size is negatively associated with the intensity of
R&D, but positively with the likelihood of having
product or process innovation. We have argued that
these two findings are not inconsistent, given the
nature of the variables. Having received a subsidy
boosts R&D efforts—or just the likelihood of
reporting, more in high-tech industries, even if the
share of targeted firms is roughly the same in high-
and low-tech industries (46% vs. 45%). Given firms’
unwillingness to reveal more details about the
subsidies received, we can only speculate about the
possibility that high-tech firms are more likely to
receive funding for innovation and R&D than low-
tech firms. International (including European) com-
petition fosters R&D intensity, especially in high-
tech firms. We find that R&D has a strong and
sizeable impact on firm’s ability to produce process
innovation and a somewhat higher impact on product
innovation. Investment in new equipment and
machinery matters more for process innovation than
for product innovation.
While interpreting these results, one should keep
in mind the dual nature of R&D. In fact, R&D
investments contribute to developing the firm’s
ability to identify, assimilate and exploit knowledge
from other firms and public research organizations
(Cohen and Levinthal 1989). In other words, a
minimum level of R&D activity is a necessary
Table 6 Comparison with Griffith et al. (2006)
Period: 1998–2000 France Germany Spain UK Italy Italya
Number of observations 3,625 1,123 3,588 1,904 2,594 8,377
Process innovation equation
R&D intensityb 0.303*** 0.260*** 0.281*** 0.161*** 0.146*** 0.192***
Investment intensityb 0.023*** 0.022*** 0.029*** 0.037*** 0.054*** 0.049***
Pseudo R2 0.213 0.202 0.225 0.184 0.050 0.091
Product innovation equation
R&D intensityb 0.440*** 0.273*** 0.296*** 0.273*** 0.192*** 0.303***
Pseudo R2 0.360 0.313 0.249 0.258 0.058 0.081
Labor productivity equation
Investment intensityb 0.130*** 0.109*** 0.061*** 0.059*** 0.129 0.109***
Process innovation 0.069** 0.022 -0.038 0.029 -0.874 0.011
Product innovation 0.060*** -0.053 0.176*** 0.055*** 1.152 0.384
R2 0.290 0.280 0.180 0.190 0.166 0.227
This table is based on tables in Griffith et al. 2006. Data are from the third Community Innovation Survey (CIS 3) for France,
Germany, Spain and the UK. Results for Italy come from Tables 3, 4 and 5 of this papera This column shows data for all three periods in Italy (1995–1997, 1998–2000, 2001–2003)b Units are logs of euros (2000) per employee
* Significant at 10%, ** significant at 5%, *** significant at 1%
26 B. H. Hall et al.
123

condition to benefit from spillovers and to appropriate
public knowledge. On the other hand, more recent
studies have suggested the emergence of a different
knowledge paradigm, i.e., the one of innovation
without research, particularly well suited for SMEs
(Cowan and van de Paal 2000), based on ‘‘the
recombination and re-use of known practices’’ (David
and Foray 1995).
Finally, we find that product innovation has a
positive impact on firms’ labor productivity, but that
process innovation has a larger effect via the
associated investment. Moreover, larger and older
firms seem to be, to a certain extent, less productive,
ceteris paribus.
With respect to the broader questions that moti-
vated this investigation, we note that in most respects
Italian firms resemble those in other large European
countries. However, they do somewhat less R&D, and
their R&D is less tightly linked to process innovation,
but they are no less innovative, at least according to
their own reports. Surprisingly, the firms in our
sample are more rather than less productive than firms
in other countries. Like Italian industry as a whole,
they experienced a negative labor productivity growth
during the 2000–2003 period, but apparently with no
consequences on innovation activity and its estimated
impact on productivity. Thus, we do not find any
strong evidence of innovation ‘‘underperformance,’’
other than the observation that those firms in our
sample that do R&D do somewhat less on average
than firms in comparable European countries.
In general, ‘‘underinvestment’’ relative to others
may be due to demand factors (perceived market size,
consumer tastes, etc.) and supply factors (high costs
of capital or other inputs, availability of inputs and
the regulatory environment). Stepping outside tradi-
tional economic analysis, factors such as having goals
other than profit maximization, limited information
about opportunities, or even social and cultural norms
can also influence investment in innovation. Choos-
ing among these alternatives definitively is beyond
the scope of this paper, but we can offer a few
tentative thoughts.
There is limited evidence that lower rates of R&D
investment in larger Italian firms are due to the fact
that they face a higher cost of capital than other firms
in continental Europe. In a comparative analysis, Hall
and Oriani (2006) find high marginal stock market
values for Italian R&D investment in large firms that
do not have a majority shareholder, which suggests a
high required rate of return and therefore a high cost
of capital. However for the other firms (closely held),
R&D is not valued at all, which carries the implica-
tion that investment in these firms may not be profit
driven. These conclusions suggest that a ‘‘bank-
centered’’ capital market system, such as the Italian
one, with a shortage of specialized suppliers, like
venture capitalists (Rajan and Zingales 2003), is less
capable of valuing R&D projects (Hall 2002).
Smaller firms and those that are family-controlled
with a pyramidal structure, which are quite common
in Italy, are likely to be affected by credit rationing
problems and/or to have goals other than profit
maximization. But this is to some extent speculative,
and we hope to explore the question further in the
future.
Acknowledgements We would like to thank the Mediocredito-
Capitalia (now Unicredit) research department for having kindly
supplied firm level data for this project. We thank also Susanto
Basu, Ernie Berndt, Piergiuseppe Morone, Stephane Robin, Mike
Scherer, Enrico Santarelli, Alessandro Sembenelli, Marco
Vivarelli and participants at the NBER Productivity Seminars,
at the workshop ‘‘Drivers and Impacts of Corporate R&D in
SMEs’’ held in Seville at IPTS. The views expressed by the
authors do not necessarily reflect those of the Bank of Italy.
Appendix: variable definitions and supplementary
tables
R&D engagement: dummy variable that takes value 1
if the firm has positive R&D expenditures over the
3 years of each wave of the survey.
R&D intensity: R&D expenditures per employee,
in real terms and in logs.
Process innovation: dummy variable that takes
value 1 if the firm declares to have introduced a
process innovation during the 3 years of the survey.
Product innovation: dummy variable that takes
value 1 if the firm declares to have introduced a
product innovation during the 3 years of the survey.
Innovator: dummy variable that takes value 1 if
the firm has process or product innovation.
Share of sales with new products: percentage of
the sales in the last year of the survey coming from
Innovation and productivity in SMEs 27
123

new or significantly improved products (in
percentage).
Labor productivity: real sales per employee, in logs.
Investment intensity: investment in machinery per
employee, in logs.
Public support: dummy variable that takes value 1
if the firm has received a subsidy during the 3 years
of the survey.
Regional–national–European–international (non
EU) competitors: dummy variables to indicate the
location of the firm’s competitors.
Large competitors: dummy variable that takes value
1 if the firm declares to have large firms as competitors.
Employees: number of employees, headcount.
Age: firm’s age (in years).
Size classes: [11–20], [21–50], [51–250]
employees.
Age classes: [\15], [15–25], [[25] years.
Industry dummies: a set of indicators for a two-
digit industry classification.
Time dummies: a set of indicators for the year of
the survey.
Wave dummies: a set of indicators for firm’s
presence or absence in the three waves of the survey.
High-tech firms: encompasses high and medium-
high technology industries (chemicals; office
accounting and computer machinery; radio, TV and
telecommunication instruments; medical, precision
and optical instruments; electrical machinery and
apparatus, n.e.c.; machinery and equipment; railroad
and transport equipment, n.e.c.).
Low-tech firms: encompasses low and medium-
low technology industries (rubber and plastic prod-
ucts; coke, refined petroleum products; other non-
metallic mineral products; basic metals and fabri-
cated metal products; manufacturing, n.e.c.; wood,
pulp and paper; food, beverages and tobacco
products; textile, textile products, leather and
footwear).
Capital stock: fixed capital stock, in real terms,
computed by a perpetual inventory method with
constant depreciation rate (d = 0.05). The starting
value is the accounting value as reported in firm’s
balance sheets (see Tables 7, 8 9 and 10).
Table 7 A comparison of selected variables for France, Germany, Spain, the UK and Italy
Period: 1998–2000 France Germany Spain UK Italy Italyb
Number of observations (firms) 3,625 1,123 3,588 1,904 2,594 8,377
Continuous R&D engagement (%) 35.0 39.5 20.9 26.7 49.8 48.9
R&D per employee (for R&D-doers, mean)c 6.9 5.2 4.3 3.6 2.9 2.4
Innovator (process and/or product, %) 52.9 65.8 51.2 41.5 54.7 66.9
Process innovation (%) 32.3 42.3 34.7 27.1 44.7 55.4
Product innovation (%) 44.6 54.7 33.6 28.6 33.3 39.9
Share of sales with new products for firms with
product innovation (%)
16.5 29.5 32.7 30.8 32.2 22.5
Labor productivity (mean)c 165.3 145.6 137.7 143.4 173.8 187.1
Investment per employee (mean)c 6.0 8.3 8.3 6.3 8.0 7.9
Public support for innovation (%)
Local 5.5 15.8 14.0 4.5
National 15.4 21.2 12.5 3.6 49.9 a 50.6 a
EU 5.1 8.1 3.3 1.7
Percentage of firm in size class (20–49) 30.4 28.8 47.8 38.6 60.6 44.9
Percentage of firm in size class (50–250) 39.6 42.8 37.5 39.3 27.8 36.7
Percentage of firm in size class ([250) 30.0 28.5 14.7 22.1 11.1 18.4
This table is a slightly modified version of Table 3 in Griffith et al. 2006. Data are from the third Community Innovation Survey
(CIS 3) for France, Germany, Spain and the UK. Data for Italy are from the Mediocredito Surveys. Among the several variables
included in the original table, we selected only those comparable to our data. Data are not population-weighteda This figure encompasses all the subsidies, regardless of their sourceb This column shows data for all three periods in Italy (1995–1997, 1998–2000, 2001–2003)c Units are logs of euros (2000) per employee
28 B. H. Hall et al.
123
Table 8 A non-parametric
selectivity test
Standard errors are robust
and clustered at the firm
level
From this probit model we
computed, for each
observation in the sample,
the inverse Mills’ ratio, the
predicted probability of
having positive R&D and
their quadratic and
interaction termsa This figure encompasses
all the subsidies, regardless
of their source
* Significant at 10%,
** significant at 5%,
*** significant at 1%
Dependent variable Probability (R&D [ 0) R&D expenditure
per employee
D (Large firms) 0.150***
(0.030)
0.305
(0.436)
D (Regional) -0.138*
(0.056)
-0.230
(0.408)
D (National) 0.012
(0.051)
0.0879
(0.085)
D (European) 0.339***
(0.057)
0.826
(0.988)
D (International) 0.391***
(0.060)
0.927
(1.142)
D (Public subsidies for innovation)a 0.324***
(0.028)
0.761
(0.943)
Group 0.145***
(0.037)
0.339
(0.423)
Size class (21–50 employees) 0.147***
(0.035)
0.200
(0.431)
Size class (51–250 employees) 0.482***
(0.040)
0.759
(1.402)
Age class (15–25 years) 0.022
(0.036)
0.0258
(0.089)
Age class ([25 years) 0.064
(0.036)
0.0684
(0.197)
Constant -0.563***
(0.163)
499.4
(424.583)
Predicted probability (R&D [ 0) 157.1
(130.890)
Inverse Mill’s ratio 92.21
(81.214)
Square predicted probability (R&D [ 0) -399.9
(336.616)
Square inverse Mill’s ratio 183.7
(152.908)
Predicted probability (R&D [ 0) * inverse
Mill’s ratio
499.4
(424.583)
Industry, time and wave dummies Yes Yes
R2 or pseudo R2 0.114 0.143
Number of observations 9,674 9,674
Innovation and productivity in SMEs 29
123

Ta
ble
9R
ob
ust
nes
sch
eck
for
step
2an
d3
(1)
(2)
(3)
(4)
Ste
p2
—P
roce
ssin
no
vat
ion
Pre
dic
ted
R&
Din
ten
sity
0.4
83
**
*[0
.19
3]
(0.0
45
)
0.5
44
**
*[0
.21
7]
(0.0
45
)
0.4
76
**
*[0
.19
0]
(0.0
45
)
0.5
47
**
*[0
.21
8]
(0.0
45
)
Inv
estm
ent
inte
nsi
ty0
.12
5*
**
[0.0
50
]
(0.0
11
)
–0
.13
7*
**
[0.0
55
]
(0.0
11
)
–
Ste
p2
—P
rod
uct
inn
ov
atio
n
Pre
dic
ted
R&
Din
ten
sity
0.6
86
**
*[0
.25
0]
(0.0
45
)
0.6
77
**
*[0
.24
7]
(0.0
46
)
0.6
60
**
*[0
.24
1]
(0.0
46
)
0.6
91
**
*[0
.25
2]
(0.0
45
)
Inv
estm
ent
inte
nsi
ty–
0.0
21
*[0
.00
8]
(0.0
11
)
0.0
55
**
*[0
.02
0]
(0.0
11
)
–
Ste
p3
—P
rod
uct
ivit
yin
clu
din
gin
ves
tmen
tin
the
equ
atio
n
Pre
dic
ted
pro
cess
inn
ov
atio
n0
.19
3
(0.2
67
)
-0
.39
5
(0.2
75
)
0.0
10
(0.2
55
)
-0
.43
2
(0.2
77
)
Pre
dic
ted
pro
du
ctin
no
vat
ion
0.5
97
**
*
(0.0
93
)
0.5
54
**
*
(0.0
87
)
0.5
99
**
*
(0.0
95
)
0.5
38
**
*
(0.0
86
)
Inv
estm
ent
inte
nsi
ty0
.09
9*
**
(0.0
10
)
0.0
99
**
*
(0.0
06
)
0.0
93
**
*
(0.0
09
)
0.1
05
**
*
(0.0
06
)
Ste
p3
—P
rod
uct
ivit
yw
ith
ou
tin
ves
tmen
tin
the
equ
atio
n
Pre
dic
ted
pro
cess
inn
ov
atio
n2
.62
4*
**
(0.1
46
)
-1
.31
8*
**
(0.2
79
)
2.2
86
**
*
(0.1
68
)
-0
.17
1
(0.2
80
)
Pre
dic
ted
pro
du
ctin
no
vat
ion
0.9
61
**
*
(0.0
83
)
0.8
95
**
*
(0.0
87
)
1.1
33
**
*
(0.0
79
)
0.7
73
**
*
(0.0
87
)
Co
effi
cien
ts,
mar
gin
alef
fect
sfo
rst
ep2
insq
uar
eb
rack
ets
and
stan
dar
der
rors
are
sho
wn
Th
est
and
ard
erro
rsar
ero
bu
stto
het
ero
sked
asti
city
and
clu
ster
edat
the
firm
lev
el
Ind
ust
ry,
wav
ean
dti
me
du
mm
ies
are
incl
ud
edin
all
equ
atio
ns
Ref
eren
ceg
rou
ps:
D(p
rov
inci
alco
mp
etit
ors
);si
zecl
ass
(11
–5
0em
plo
yee
s);
age
clas
s(\
15
yea
rs)
Sp
ecifi
cati
on
s(1
)–(4
)en
com
pas
sal
tern
ativ
eas
sum
pti
on
sfo
rin
ves
tmen
t,w
het
her
itis
dev
ote
dto
pro
cess
or
pro
du
ctin
no
vat
ion
,n
eith
ero
rb
oth
*S
ign
ifica
nt
at1
0%
,*
*si
gn
ifica
nt
at5
%,
**
*si
gn
ifica
nt
at1
%
30 B. H. Hall et al.
123

References
Acs, Z. J., & Audretsch, D. B. (1988). Innovation in large and
small firms: An empirical analysis. American EconomicReview, 78(4), 678–690.
Acs, Z. J., & Audretsch, D. B. (1990). Innovation and smallfirms. Cambridge, MA: MIT Press.
Amemiya, T. (1984). Tobit models: A survey. Journal ofEconometrics, 24(1–2), 3–61.
Baldwin, J. R., Beckstead, D., & Caves, R. (2002). Changes in
the diversification of Canadian manufacturing firms
(1973–1997): A move to specialization. Research PaperSeries 11F0019MIE2002179, Statistics Canada.
Baldwin, J. R., & Gu, W. (2003). Participation in export
markets and productivity performance in Canadian
manufacturing. Canadian Journal of Economics, 36(3),
634–657.
Benavente, J. M. (2006). The role of research and innovation in
promoting productivity in Chile. Economics of Innovationand New Technology, 15(4/5), 301–315.
Blundell, R., Griffith, R., & Van Reenen, J. (1993). Knowledge
stocks, persistent innovation and market dominance:
Evidence from a panel of British manufacturing firms.
Institute for Fiscal Studies, working paper N. W93/19.
Bonte, W. (2003). R&D and productivity: Internal vs. external
R&D—evidence from West German manufacturing
industries. Economics of Innovation and New Technology,12, 343–360.
Brandolini, A., Casadio, P., Cipollone, P., Magnani, M.,
Rosolia, A., & Torrini, R. (2007). Employment growth in
Table 10 Robustness check using lagged capital and ML estimation (9,014 observations)
Method of estimation: (1) (2) (3) (4) (5)
With
investment
Sequential
With
investment
pooled ML
With capital
pooled MLInvestment in process,
capital in productivity
pooled ML
With both
pooled ML
Step 2—Process innovation
Predicted R&D intensity 0.440***
(0.048)
0.400***
(0.074)
0.416***
(0.078)
0.399***
(0.073)
0.389***
(0.075)
Log investment per employee 0.131***
(0.011)
0.142***
(0.013)
0.145***
(0.011)
0.120***
(0.013)
Log capital stock per employeea 0.098***
(0.013)
0.041***
(0.014)
Step 2—Product innovation
Predicted R&D intensity 0.652***
(0.047)
0.656***
(0.094)
0.655***
(0.094)
0.658***
(0.093)
0.661***
(0.095)
Step 3—Productivity equation
Predicted process innovation without
product innovation
0.517*
(0.279)
0.712*
(0.443)
0.902*
(0.515)
1.108***
(0.159)
0.855*
(0.477)
Predicted product innovation 0.677***
(0.108)
1.081***
(0.310)
0.792**
(0.337)
0.881***
(0.314)
0.830**
(0.370)
Log investment per employee 0.081***
(0.011)
0.072***
(0.017)
0.018
(0.015)
Log capital stock per employee 0.108***
(0.016)
0.111***
(0.007)
0.101***
(0.010)
Log likelihood -27,119.9 -27,110.0 -26,979.0 -26,908.5 -26,901.3
The method of estimation is pooled maximum likelihood applied to the three steps, with the coefficient constraints imposed but
without allowing for correlation among their disturbances. This method yields standard errors that account for the use of predicted
variables in steps 2 and 3
Coefficients and their standard errors are shown. The standard errors are robust to heteroskedasticity and clustered at the firm level.
Marginal effects in square brackets
Industry, wave and time dummies are included in all equations
Reference groups: D (provincial competitors); size class (11–50 employees); age class (\15 years)a Capital measured at the beginning of the period
* Significant at 10%, ** significant at 5%, *** significant at 1%
Innovation and productivity in SMEs 31
123

Italy in the 1990s: Institutional arrangements and market
forces. In: N. Acocella & R. Leoni (Eds.), Social pacts,employment and growth. Heidelberg: Physica-Verlag.
Cohen, W. M., & Klepper, S. (1996). A reprise of size and
R&D. The Economic Journal, 106(437), 925–951.
Cohen, W. M., & Levinthal, D. A. (1989). Innovation and
learning: The two faces of R&D. The Economic Journal,99(397), 569–596.
Cowan, R., & van de Paal, G. (2000). Innovation policy in theknowledge-based economy. Brussels: European Commis-
sion DG-Enterprise.
Crepon, B., Duguet, E., & Mairesse, J. (1998). Research,
innovation and productivity: An econometric analysis at
the firm level. Economics of Innovation and New Tech-nology, 7(2), 115–158.
Das, M., Newey, W. K., & Vella, F. (2003). Nonparametric
estimation of sample selection models. Review of Eco-nomic Studies, 70(1), 33–58.
Daveri, F., & Jona-Lasinio, C. (2005). Italy’s decline: Getting
the facts right. Giornale degli Economisti, 64(4), 365–
410.
David, P., & Foray, D. (1995). Accessing and expanding the
science and technology knowledge base. STI Review, 16,
16–38.
European Commission. (2006). European trend chart oninnovation. Country Report, Italy. Enterprise Directorate-
General.
Griffith, R., Huergo, E., Mairesse, J., & Peters, B. (2006).
Innovation and productivity across four European coun-
tries. Oxford Review of Economic Policy, 22(4), 483–498.
Griliches, Z. (1995). R&D and productivity: Econometric
Results and Measurement Issues. In P. Stoneman (Ed.),
Handbook of the economics of innovation and techno-logical change (pp. 52–89). Oxford: Blackwell.
Griliches, Z. (1998). R&D and productivity: The econometricevidence. Chicago: Chicago University Press.
Hall, B. H. (2002). The financing of Research and Develop-
ment. Oxford Review of Economic Policy, 18(1), 35–51.
Hall, B. H., Lotti, F., & Mairesse, J. (2008). Employment,
innovation and productivity: Evidence from Italian mi-
crodata. Industrial and Corporate Change, 17, 813–839.
Hall, B. H., & Mairesse, J. (1995). Exploring the relationship
between R&D and productivity in French manufacturing
firms. Journal of Econometrics, 65(1), 263–293.
Hall, B. H., & Mairesse, J. (2006). Empirical studies of inno-
vation in the knowledge-driven economy. Economics ofInnovation and New Technology, 15(4/5), 289–299.
Hall, B. H., & Oriani, R. (2006). Does the market value R&D
investment by European firms? Evidence from a panel of
manufacturing firms in France, Germany, and Italy.
International Journal of Industrial Organization, 24(5),
971–993.
Harhoff, D. (1998). R&D and productivity in German manu-
facturing firms. Economics of Innovation and New Tech-nology, 6(1), 29–49.
Heckman, J. (1979). Sample selection bias as a specification
error. Econometrica, 47(1), 153–161.
Heshmati, A., & Loof, H. (2006). On the relation between inno-
vation and performance: A sensitivity analysis. Economics ofInnovation and New Technology, 15(4/5), 317–344.
Hoffman, K., Parejo, M., Bessant, J., & Perren, L. (1998).Small firms, R&D, technology and innovation in the UK:
A literature review. Technovation, 18(1), 39–55.
Janz, N., Loof, H., & Peters, A. (2004). Firm level innovation
and productivity—is there a common story across coun-
tries? Problems and Perspectives in Management, 2,
1–22.
Jefferson, G. H., Huamao, B., Xiaojing, G., & Xiaoyun, Y.
(2006). R&D performance in Chinese industry. Econom-ics of Innovation and New Technology, 15(4/5), 345–366.
Kleinknecht, A. (1987). Measuring R&D in small firms: How
much are we missing? The Journal of Industrial Eco-nomics, 36(2), 253–256.
Klette, T. J., & Johansen, F. (1996). Accumulation of R&D
capital and dynamic firm performance: A not-so-fixed
effect model. Discussion papers 184, Research Depart-
ment of Statistics Norway.
Klette, T. J., & Kortum, S. (2004). Innovating firms and
aggregate innovation. Journal of Political Economy,112(5), 986–1018.
Klomp, L., & Van Leeuwen, G. (2001). Linking innovation and
firm performance: A new approach. International Journalof the Economics of Business, 8(3), 343–364.
Lichtenberg, F. R., & Siegel, D. (1991). The impact of R&D
investment on productivity: New evidence using linked
R&D-LRD data. Economic Inquiry, 29(2), 203–228.
Loof, H., & Heshmati, A. (2002). Knowledge capital and
performance heterogeneity: A firm level innovation study.
International Journal of Production Economics, 76(1),
61–85.
Lotti, F., & Santarelli, E. (2001). Linking knowledge to pro-
ductivity: A Germany–Italy comparison using the CIS
database. Empirica, 28, 293–317.
Mairesse, J., & Mohnen, P. (2005). The importance of R&D for
innovation: A reassessment using French Survey Data.
The Journal of Technology Transfer, 30(1–2), 183–197
(special issue in memory of Edwin Mansfield).
Mairesse, J., & Sassenou, M. (1991). R&D productivity: A
survey of econometric studies at the firm level. NBER
working paper no. 3666.
Mohnen, P., Mairesse, J., & Dagenais, M. (2006). Innovativity:
A Comparison across seven European countries. Eco-nomics of Innovation and New Technology, 15(4/5), 391–
413.
Pakes, A., & Griliches, Z. (1984). Patents and R&D at the firm
level: A first look. In Z. Griliches (Ed.), R&D, patents,and productivity (pp. 55–71). Chicago: University of
Chicago Press.
Parisi, M. L., Schiantarelli, F., & Sembenelli, A. (2006). Pro-
ductivity innovation and R&D: Micro evidence for Italy.
European Economic Review, 50, 2037–2061.
Pianta, M., & Vaona, A. (2007). Innovation and productivity in
European industries. Economics of Innovation and NewTechnology, 16(7), 485–499.
Potters, L., Ortega-Argiles, R., & Vivarelli, M. (2008). R&D
and productivity: Testing sectoral peculiarities using
micro data. IZA discussion paper no. 3338.
Rajan, R. G., & Zingales, L. (2003). Banks and markets: The
changing character of European finance. NBER working
paper no. 9595.
32 B. H. Hall et al.
123

Van Leeuwen, G., & Klomp, L. (2006). On the contribution of
innovation to multi-factor productivity growth. Economicsof Innovation and New Technology, 15(4/5), 367–390.
Vella, F. (1998). Estimating models with sample selection bias: A
survey. The Journal of Human Resources, 33(1), 127–169.
Verspagen, B. (1995). R&D and productivity: A broad cross-
section cross-country look. Journal of Productivity Anal-ysis, 6, 117–135.
Innovation and productivity in SMEs 33
123