Innovating for Tomorrow - Kirloskar Brothers€¦ · Innovating for Tomorrow KIRLOSKAR BROTHERS...
86
Sustainability Report 2012-13 Innovating for Tomorrow KIRLOSKAR BROTHERS LIMITED
Transcript of Innovating for Tomorrow - Kirloskar Brothers€¦ · Innovating for Tomorrow KIRLOSKAR BROTHERS...
Sustainability Report 2012-13
Innovating for Tomorrow
KIRLOSKAR BROTHERS LIMITED

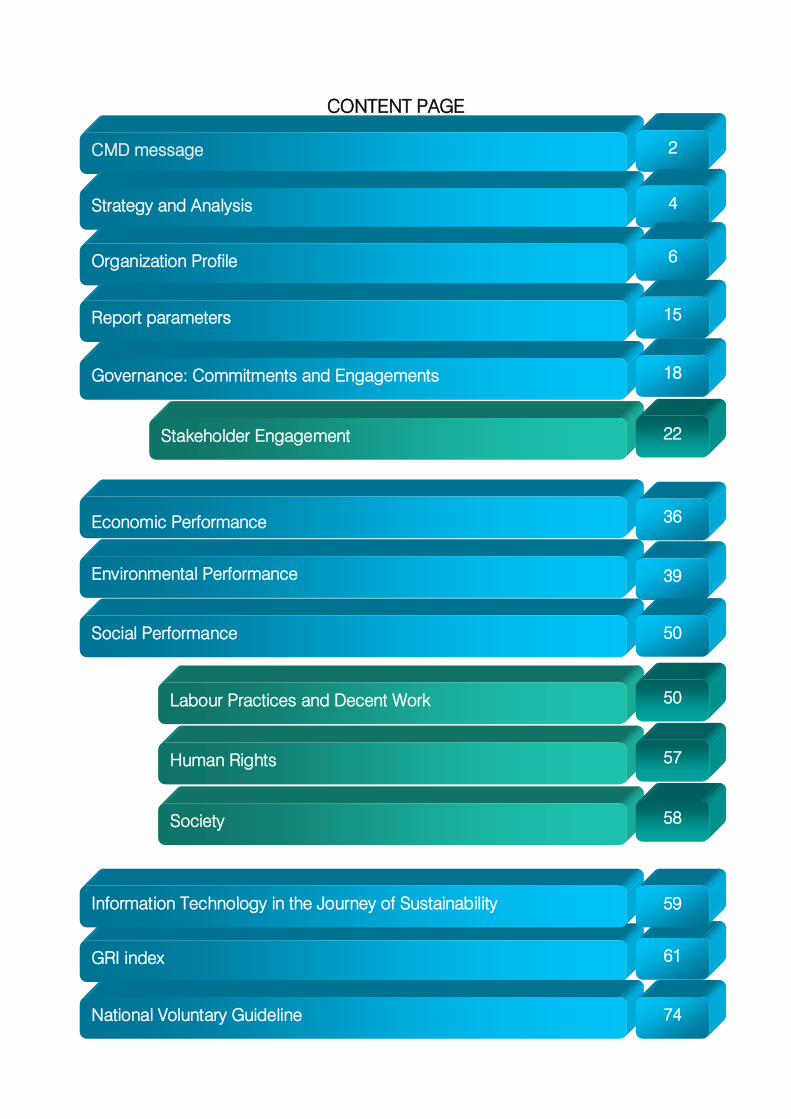
CONTENT PAGE
CMD message 2
Strategy and Analysis 4
Organization Profile 6
Report parameters 15
Governance: Commitments and Engagements 18
Stakeholder Engagement 22
Economic Performance
Environmental Performance
Social Performance
39
36
50
Labour Practices and Decent Work
Human Rights
Society
50
57
58
GRI index 61
National Voluntary Guideline 74
Information Technology in the Journey of Sustainability 59
2
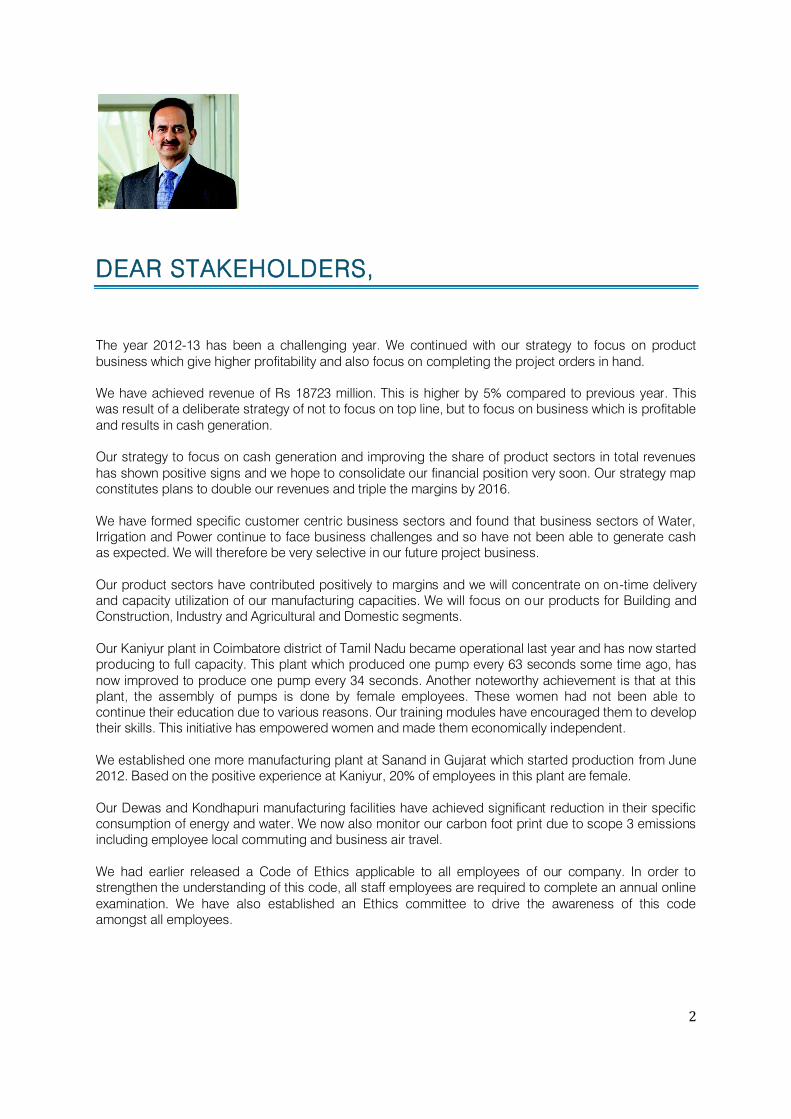
DEAR STAKEHOLDERS,
The year 2012-13 has been a challenging year. We continued with our strategy to focus on product
business which give higher profitability and also focus on completing the project orders in hand.
We have achieved revenue of Rs 18723 million. This is higher by 5% compared to previous year. This
was result of a deliberate strategy of not to focus on top line, but to focus on business which is profitable
and results in cash generation.
Our strategy to focus on cash generation and improving the share of product sectors in total revenues
has shown positive signs and we hope to consolidate our financial position very soon. Our strategy map
constitutes plans to double our revenues and triple the margins by 2016.
We have formed specific customer centric business sectors and found that business sectors of Water,
Irrigation and Power continue to face business challenges and so have not been able to generate cash
as expected. We will therefore be very selective in our future project business.
Our product sectors have contributed positively to margins and we will concentrate on on-time delivery
and capacity utilization of our manufacturing capacities. We will focus on our products for Building and
Construction, Industry and Agricultural and Domestic segments.
Our Kaniyur plant in Coimbatore district of Tamil Nadu became operational last year and has now started
producing to full capacity. This plant which produced one pump every 63 seconds some time ago, has
now improved to produce one pump every 34 seconds. Another noteworthy achievement is that at this
plant, the assembly of pumps is done by female employees. These women had not been able to
continue their education due to various reasons. Our training modules have encouraged them to develop
their skills. This initiative has empowered women and made them economically independent.
We established one more manufacturing plant at Sanand in Gujarat which started production from June
2012. Based on the positive experience at Kaniyur, 20% of employees in this plant are female.
Our Dewas and Kondhapuri manufacturing facilities have achieved significant reduction in their specific
consumption of energy and water. We now also monitor our carbon foot print due to scope 3 emissions
including employee local commuting and business air travel.
We had earlier released a Code of Ethics applicable to all employees of our company. In order to
strengthen the understanding of this code, all staff employees are required to complete an annual online
examination. We have also established an Ethics committee to drive the awareness of this code
amongst all employees.
[SUSTAINABILITY REPORT] 2012-13
3
Training and up gradation of our people is vital to ensure success of our strategies. Intensive training is
organized in the area of leadership, communication and project management.
We believe in providing a healthy and safe environment to our employees. We monitor our safety
performance and take steps to improve the same. Our Dewas plant has won the first prize, presented by
“Manufacturing Today” for Excellence in Safety. We also conduct various health awareness programmes
for our employees.
Change as they say, is only constant and change is vital. We believe that improvement is the logical form
of change. We will therefore always strive for improvement whether it is for product or process.
We have focused on customer service to become the preferred choice of our customers. In the current
year we established refurbishment centres at 5 locations across India. These centres will provide our
customers convenient, comprehensive and quality service with genuine spare parts.
Continuing with tradition, our employees and pool of volunteers have contributed more than 39000 hours
to community and support initiatives in the area of Health, Education and Environment this year. Our
Dewas plant has won „The Best Corporate Social Responsibility Practices‟ award presented by Global
CSR Excellence and Leadership Awards (Blue Dart World CSR Day). More than 500 companies from 35
countries had participated for these awards. Kirloskarvadi plant was runner up in the “Excellence in CSR-
Large Enterprises” awards presented by Manufacturing Today.
We will continue our journey towards sustainable development by focusing on economic, environmental
and social aspects of our business.
I am pleased to place before you our Sustainability Report for this year 2012-13.
Sanjay C. Kirloskar
Chairman and Managing Director
[SUSTAINABILITY REPORT] 2012-13
4
STRATEGY AND ANALYSIS
Impact
In 2012-13, the strategy of focussing on our own manufactured products yielded good results. The
infrastructure business was plagued by the issues like cash crunch and policy issues. The thermal power
projects are facing issues like higher raw material cost because of rise in prices of imported coal. The
new coal mines were not developed because they were in reserved forest areas. We continue to be
selective in bidding for projects. The industrial pump business was affected on account of overall
business slowdown.
Risks
The company has a risk management committee which undertakes evaluation of possible risks to the
business and develops mitigation plans. The following major risks were identified and mitigation plans
implemented to reduce the impact on the business:
a. The slowdown in infrastructure related projects of power and irrigation segment is a cause of
concern. The situation may affect liquidation of work in progress of receivables. Earlier, payments
were delayed on account of policy issues facing infrastructure sector in the country.
b. The segments of power, steel, large irrigation schemes, coal, petrochemicals and refinery may
witness slower growth owning to the factors like slower execution and overall negative business
sentiment.
c. The sharp decline in revenue collection by urban local bodies will hamper central project funding
through Jawaharlal Nehru National Urban Renewal Mission / Urban Infrastructure Development
Scheme for Small and Medium Towns. The result has been frequent delays in job execution
d. The forthcoming elections in some states and later in the center may lead to delay in project
funding and finalization. The political instability might affect Government and Institutional sales
e. Free power given to farmers in some states, acts as a deterrent to the adoption of energy-efficient
technologies and solutions.
f. The coal scarcity may lead to the demand for fuels like natural gas for generation of electricity.
Coal as a fuel is subject to criticisms because of the environmental concerns.
Opportunit ies
Growth Drivers: We have identified following growth drivers for our business which we expect will provide
opportunities for economic sustainability:
• Indian economy is expected to grow by 6% to 6.5 % in 2013-14
• Target for infrastructure investment in the 12th Plan Period is set at US$ 1 trillion. Announcement of
investments worth $1 trillion into the infrastructure sector in the Twelfth Five-year Plan will boost the
demand for pumps in key end-use sectors
• The World Pump Market in 2011 was US $ 38508 Million and expected to reach US $ 55279 Million
in 2017 at a Compounded Annual Growth Rate (CAGR) of 5.6%
• Average crude oil prices expected to drop by around 4% in 2013-14
• The segments of Chemicals, Sugar, Commercial Real Estate, Infrastructure, Agro Chemicals, and
Manufacturing are forecast to grow.
Demand for Wastewater Management solutions owing to the legal norms and environmental
concerns.
[SUSTAINABILITY REPORT] 2012-13
5
Rising price of fossil fuels and electricity will lead to the demand for renewable energy sources for
various needs and applications. It will provide us opportunity to promote solar pumping systems.
The demand for agricultural pumps may increase on account of the planned investments in the
agriculture sector.
Rising energy costs will drive the energy efficient pumping solution and LLC pumps in industry
sector. As also the energy labelling will provide market for star rated pumps.
More focus on Nagarpalika and Panchayats in JNNURM may provide more funds for water supply
systems and related projects.
Contamination of inland water due to industrialization and stringent environmental pollution norms
has renewed thrust on the sewage treatment and recycling projects.
States of Odisha, Bihar, Madhya Pradesh and Karnataka are coming up with new projects in Water
Supply and Waste Water Management.
Water scarcity led to the emphasis on finding new sources of water. The sources such as deep
water tables and desalination projects will create demand for pumps offering increased capacity and
efficiency.
The increase in urban density is fuelling the growth in the residential and commercial markets which
is expected to grow at 9-10 per cent over the period of 5 to 6 years. The development has resulted in
demand for water supply solutions meant for the domestic market.
Opportunity to provide fire fighting pumps in all metro projects planned in cities. KBL has already
established itself in metro projects of Mumbai and Delhi.
Steps taken by the company to address risks and opportunities
We have established our latest manufacturing facility at Sanand, Ahmedabad. The targeted
production capacity is 500 submersible pumps per day.
We received the N and NPT Certificates of Authorization from the American Society of Mechanical
Engineers (ASME), USA for pumps to be manufactured at the Kirloskarvadi plant. We are the only
Indian pump manufacturing company and one amongst nine global pump companies to acquire the
N and NPT certification.
The capacity of small and medium pump division (SMPD) at Kirloskarvadi increased from 1500
Units/month in 2011-12 to 3,000 Units/month in 2012-13. The actual despatched quantity in SMPD
increased from 1500 units/month to 1800 units/month in the same period.
Project Management Office (PMO) is established to ensure implementation of project management
practices
[SUSTAINABILITY REPORT] 2012-13
6
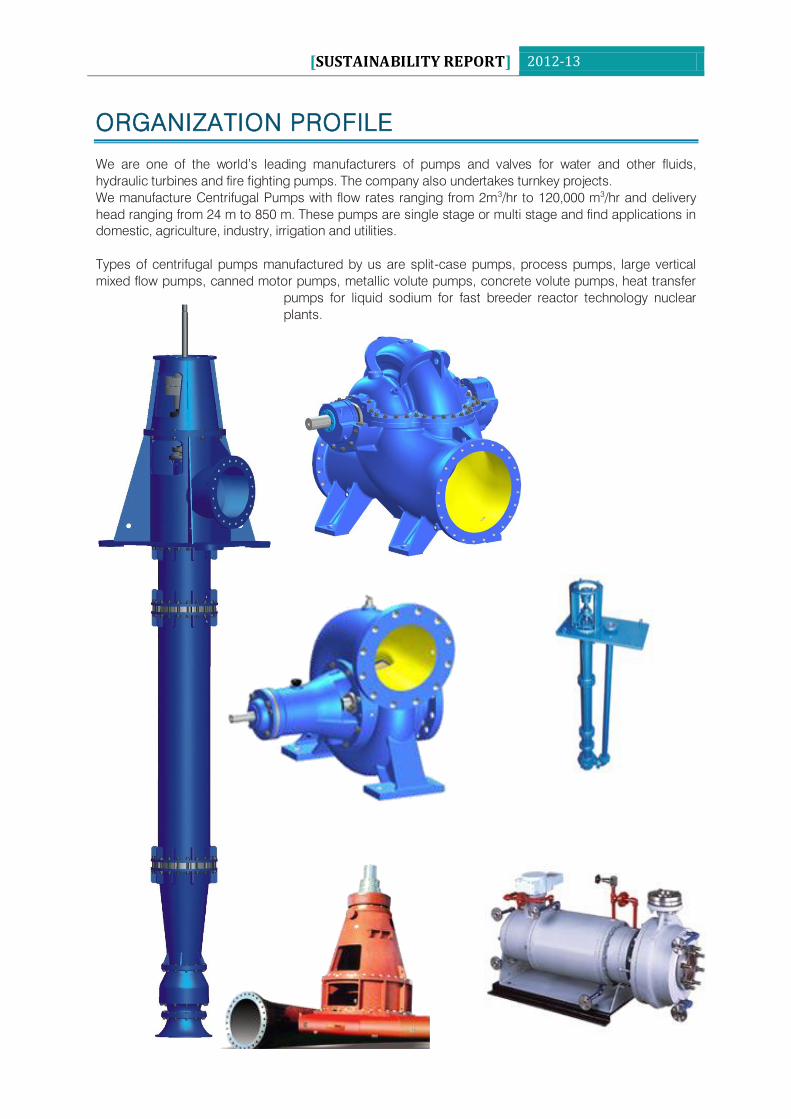
ORGANIZATION PROFILE
We are one of the world‟s leading manufacturers of pumps and valves for water and other fluids,
hydraulic turbines and fire fighting pumps. The company also undertakes turnkey projects.
We manufacture Centrifugal Pumps with flow rates ranging from 2m3/hr to 120,000 m
3/hr and delivery
head ranging from 24 m to 850 m. These pumps are single stage or multi stage and find applications in
domestic, agriculture, industry, irrigation and utilities.
Types of centrifugal pumps manufactured by us are split-case pumps, process pumps, large vertical
mixed flow pumps, canned motor pumps, metallic volute pumps, concrete volute pumps, heat transfer
pumps for liquid sodium for fast breeder reactor technology nuclear
plants.
[SUSTAINABILITY REPORT] 2012-13
7
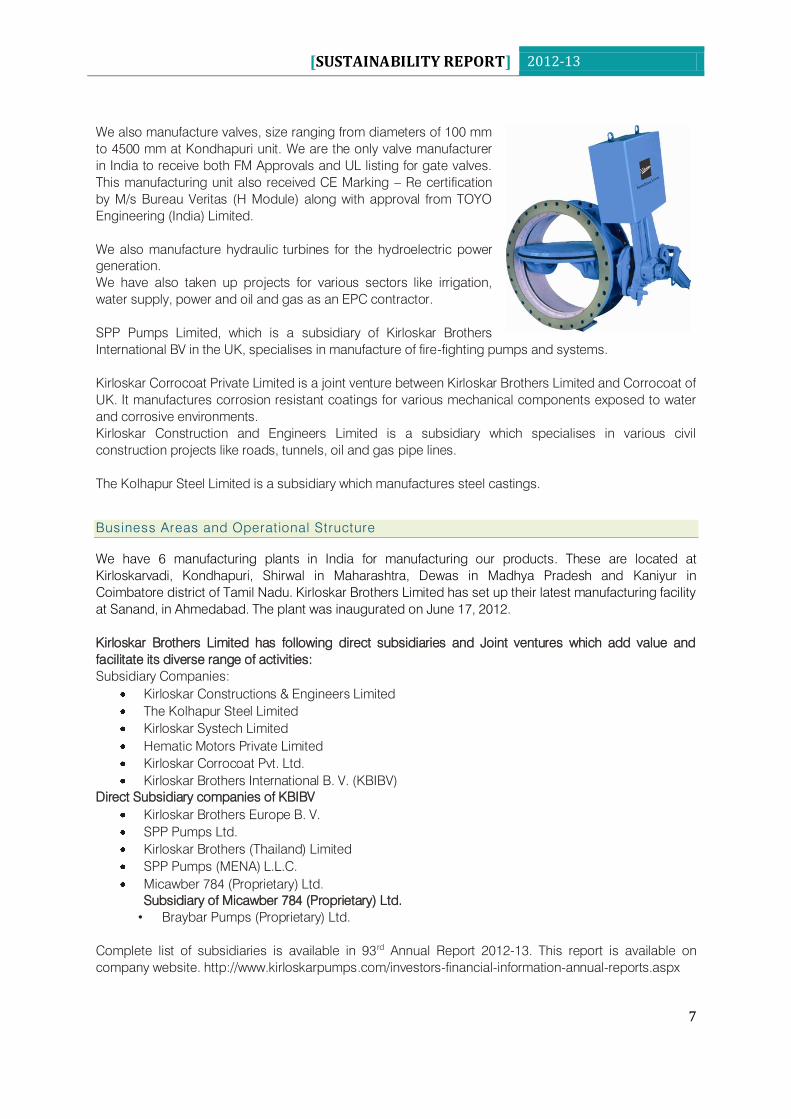
We also manufacture valves, size ranging from diameters of 100 mm
to 4500 mm at Kondhapuri unit. We are the only valve manufacturer
in India to receive both FM Approvals and UL listing for gate valves.
This manufacturing unit also received CE Marking – Re certification
by M/s Bureau Veritas (H Module) along with approval from TOYO
Engineering (India) Limited.
We also manufacture hydraulic turbines for the hydroelectric power
generation.
We have also taken up projects for various sectors like irrigation,
water supply, power and oil and gas as an EPC contractor.
SPP Pumps Limited, which is a subsidiary of Kirloskar Brothers
International BV in the UK, specialises in manufacture of fire-fighting pumps and systems.
Kirloskar Corrocoat Private Limited is a joint venture between Kirloskar Brothers Limited and Corrocoat of
UK. It manufactures corrosion resistant coatings for various mechanical components exposed to water
and corrosive environments.
Kirloskar Construction and Engineers Limited is a subsidiary which specialises in various civil
construction projects like roads, tunnels, oil and gas pipe lines.
The Kolhapur Steel Limited is a subsidiary which manufactures steel castings.
Business Areas and Operational Structure
We have 6 manufacturing plants in India for manufacturing our products. These are located at
Kirloskarvadi, Kondhapuri, Shirwal in Maharashtra, Dewas in Madhya Pradesh and Kaniyur in
Coimbatore district of Tamil Nadu. Kirloskar Brothers Limited has set up their latest manufacturing facility
at Sanand, in Ahmedabad. The plant was inaugurated on June 17, 2012.
Kirloskar Brothers Limited has following direct subsidiaries and Joint ventures which add value and
facilitate its diverse range of activities:
Subsidiary Companies:
Kirloskar Constructions & Engineers Limited
The Kolhapur Steel Limited
Kirloskar Systech Limited
Hematic Motors Private Limited
Kirloskar Corrocoat Pvt. Ltd.
Kirloskar Brothers International B. V. (KBIBV)
Direct Subsidiary companies of KBIBV
Kirloskar Brothers Europe B. V.
SPP Pumps Ltd.
Kirloskar Brothers (Thailand) Limited
SPP Pumps (MENA) L.L.C.
Micawber 784 (Proprietary) Ltd.
Subsidiary of Micawber 784 (Proprietary) Ltd.
• Braybar Pumps (Proprietary) Ltd.
Complete list of subsidiaries is available in 93rd
Annual Report 2012-13. This report is available on
company website. http://www.kirloskarpumps.com/investors-financial-information-annual-reports.aspx
[SUSTAINABILITY REPORT] 2012-13
8
Significant Changes during the report ing period regarding size, structure or ownership
During the year, Scheme of Arrangement and Amalgamation of Hematic Motors Private Limited with
Kirloskar Constructions and Engineers Limited was filed with the Hon‟ble High Courts of Judicature at
Bombay and Madras.
The Board of Directors of the Company have passed the resolution on November 29, 2012 approving the
scheme of merger between Hematic Motors Private Limited with Kirloskar Constructions and Engineers
Limited. The appointed date in terms of the scheme is April 1, 2012. The scheme has been approved by
Honourable Bombay High Court and approval from Honourable Madras High Court is awaited. The
effect of the scheme will be taken into consideration from the appointed date after approval from
Honourable Madras High Court.
Joint Ventures
Kirloskar Brothers Limited has following Joint Ventures
Kirloskar Ebara Pumps Limited
Kirloskar Corrocoat Private Limited
Nature of Ownership and Legal form
Kirloskar Brothers Limited is a public limited company listed on 2 stock exchanges; Bombay Stock
Exchange and National Stock Exchange of India Limited.
Markets Served
Kirloskar Brothers Limited has major operations in India with export to more than 90 countries. This
report gives details of the Indian operations.
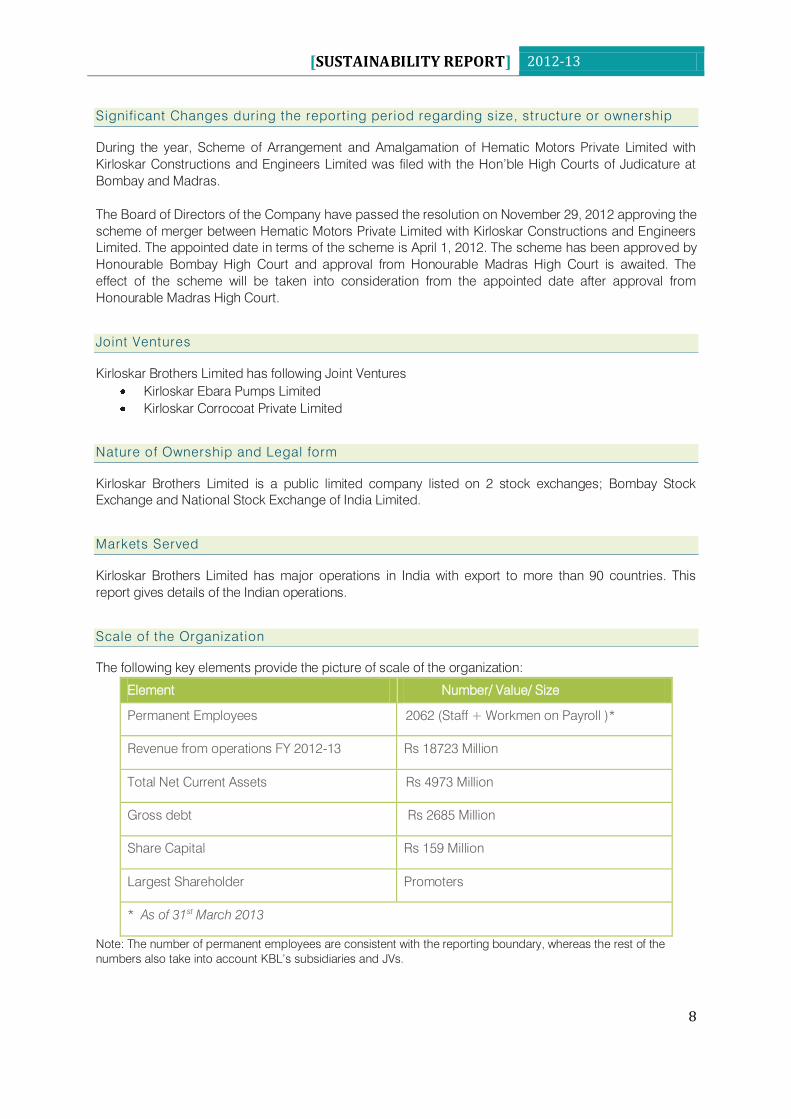
Scale of the Organization
The following key elements provide the picture of scale of the organization:
Element Number/ Value/ Size
Permanent Employees 2062 (Staff + Workmen on Payroll )*
Revenue from operations FY 2012-13 Rs 18723 Million
Total Net Current Assets Rs 4973 Million
Gross debt Rs 2685 Million
Share Capital Rs 159 Million
Largest Shareholder Promoters
* As of 31st March 2013
Note: The number of permanent employees are consistent with the reporting boundary, whereas the rest of the
numbers also take into account KBL‟s subsidiaries and JVs.

[SUSTAINABILITY REPORT] 2012-13
9
Types and number of products sold during the reporting period
Kirloskarvadi
Kirloskarvadi plant manufactures industrial pumps categorised as small, medium and large size pumps.
It also manufactures pumps which are designed as per customer requirements. These find application in
various projects related to Water, Irrigation, Power and Building and Construction sectors. This plant also
manufactures hydraulic turbines used in hydroelectric power generating stations. The number of pumps
and turbines sold from Kirloskarvadi plant by type are given below
Kondhapuri
Kondhapuri plant manufactures valves which intend to meet increasing demands of various kinds of
valves from water supply and sewerage boards of different states. The number of valves sold from
Kondhapuri plant is provided below.
31730 3331128912
0
5000
10000
15000
20000
25000
30000
35000
2010-11 2011-12 2012-13
2010-11 2011-12 2012-13
476
547
262
0
100
200
300
400
500
600
2010-11 2011-12 2012-13
Large Pumps (Nos.)
29259 29877
25013
0
5000
10000
15000
20000
25000
30000
35000
2010-11 2011-12 2012-13
Small and Medium Pumps (Nos.)
5
8
2
0
2
4
6
8
10
2010-112011-122012-13
Turbines (Nos.)
[SUSTAINABILITY REPORT] 2012-13
10
http://www.kirloskarpumps.com/contact-global-presence.aspx
Kirloskar Brothers Limited
Yamuna Survey No. 98 (3-7)
Baner, Pune 411 045
(Maharashtra) INDIA
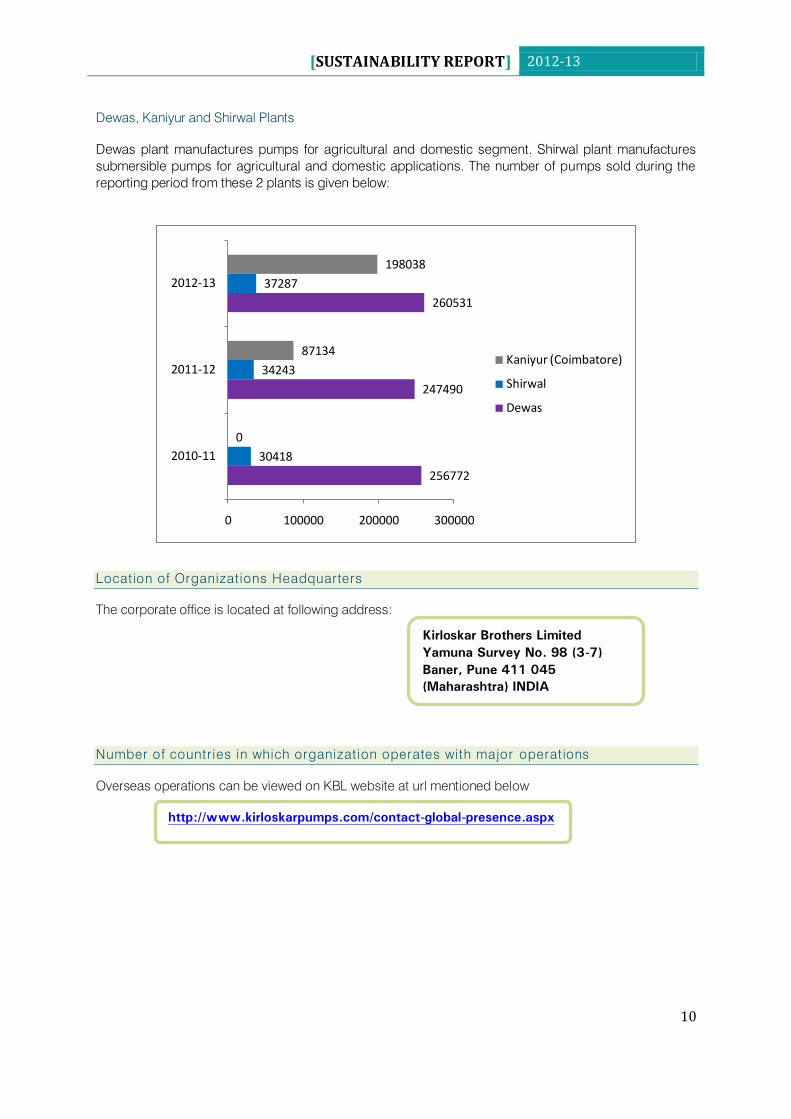
Dewas, Kaniyur and Shirwal Plants
Dewas plant manufactures pumps for agricultural and domestic segment. Shirwal plant manufactures
submersible pumps for agricultural and domestic applications. The number of pumps sold during the
reporting period from these 2 plants is given below:
Location of Organizations Headquarters
The corporate office is located at following address:
Number of countr ies in which organization operates with major operations
Overseas operations can be viewed on KBL website at url mentioned below
256772
247490
260531
30418
34243
37287
0
87134
198038
0 100000 200000 300000
2010-11
2011-12
2012-13
Kaniyur (Coimbatore)
Shirwal
Dewas
[SUSTAINABILITY REPORT] 2012-13
11
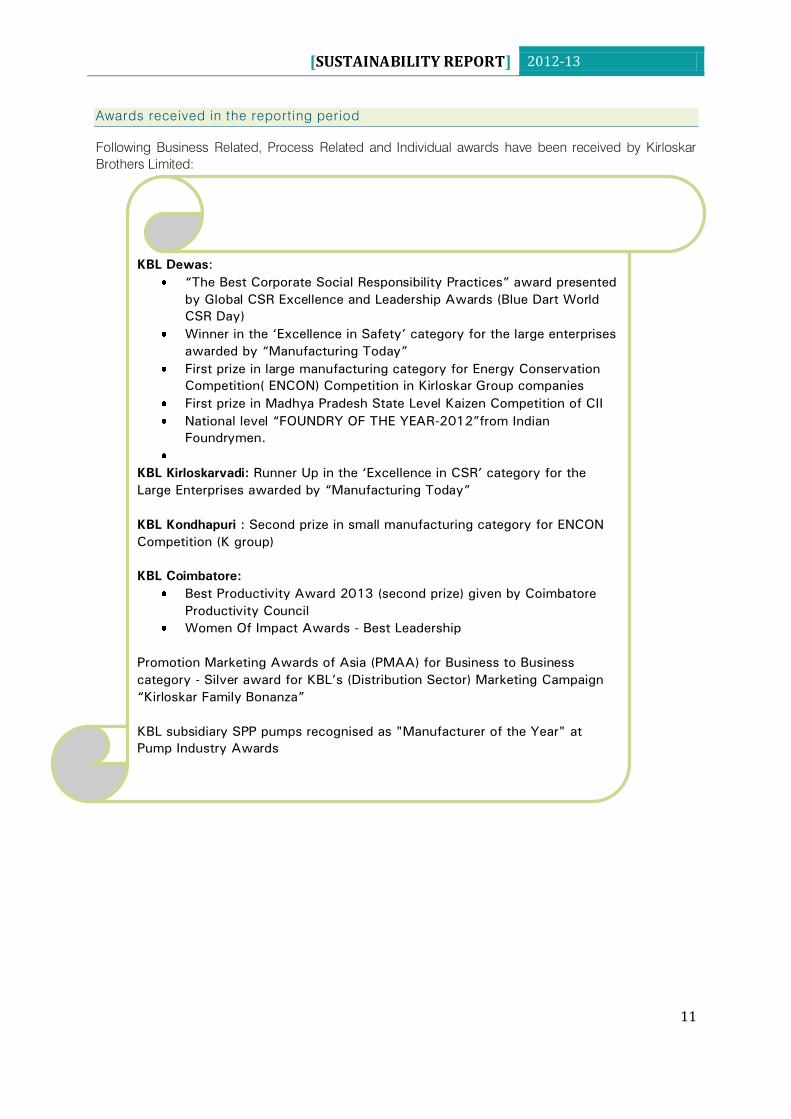
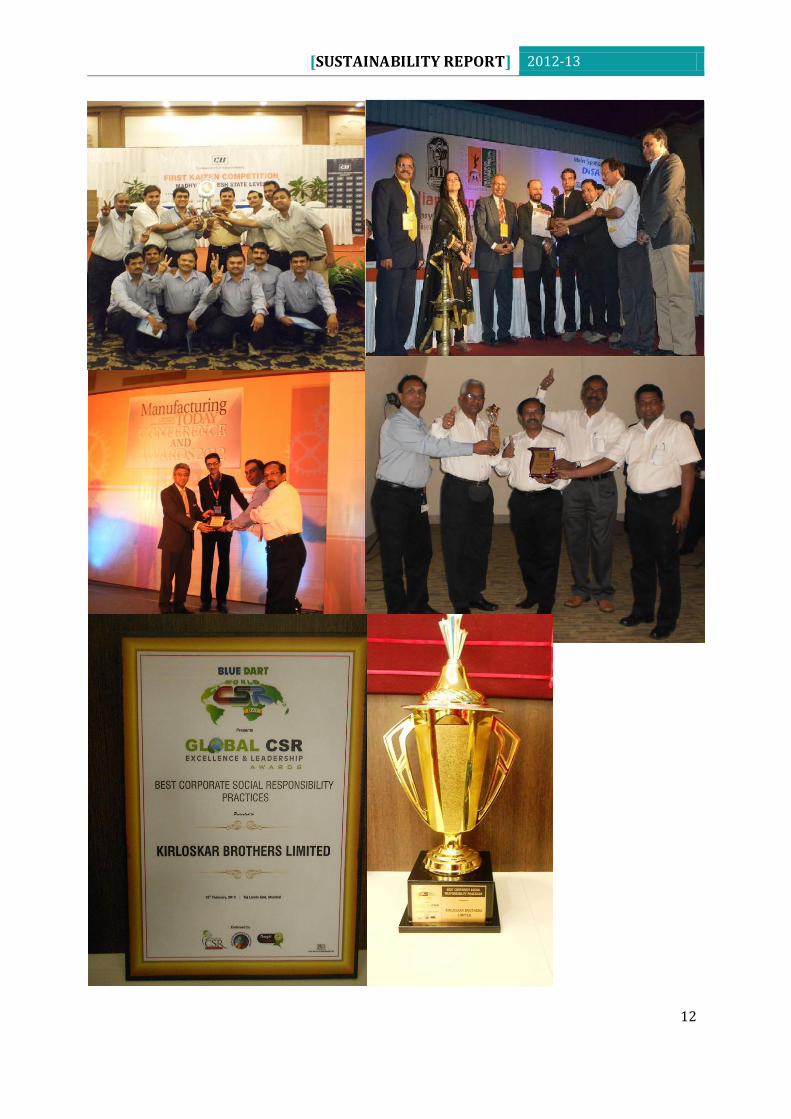
KBL Dewas:
“The Best Corporate Social Responsibility Practices” award presented
by Global CSR Excellence and Leadership Awards (Blue Dart World
CSR Day)
Winner in the „Excellence in Safety‟ category for the large enterprises
awarded by “Manufacturing Today”
First prize in large manufacturing category for Energy Conservation
Competition( ENCON) Competition in Kirloskar Group companies
First prize in Madhya Pradesh State Level Kaizen Competition of CII
National level “FOUNDRY OF THE YEAR-2012”from Indian
Foundrymen.
KBL Kirloskarvadi: Runner Up in the „Excellence in CSR‟ category for the
Large Enterprises awarded by “Manufacturing Today”
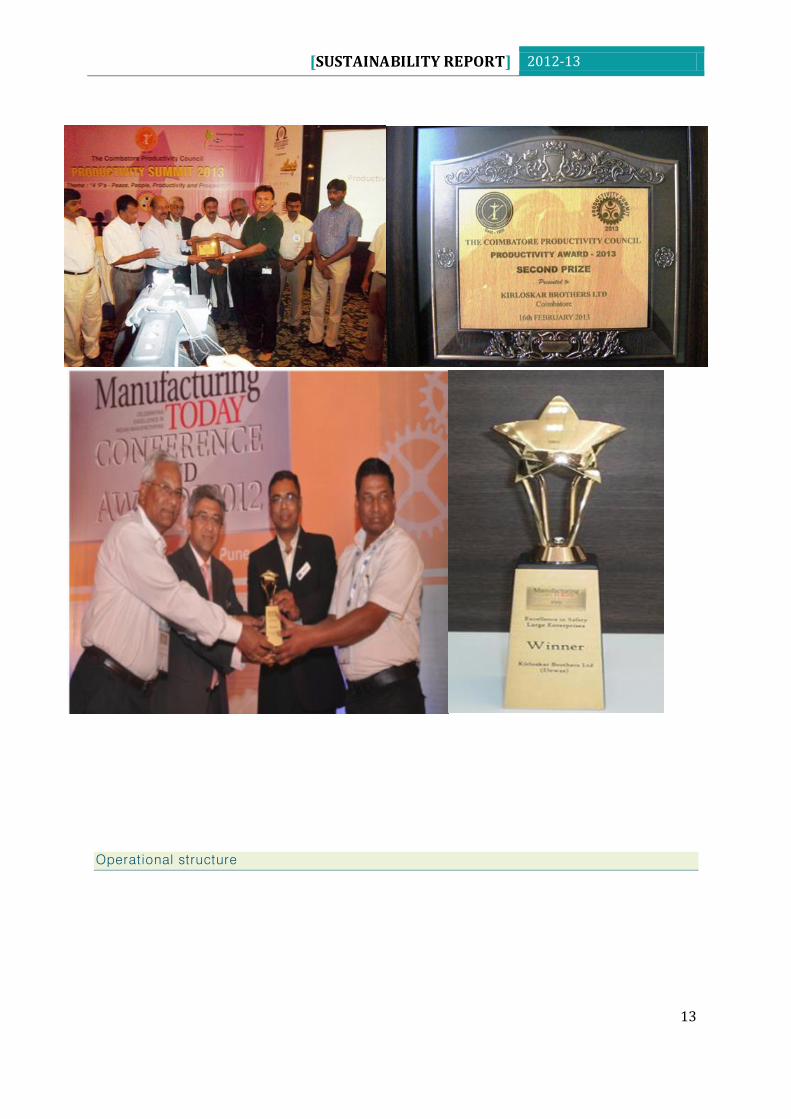
KBL Kondhapuri : Second prize in small manufacturing category for ENCON
Competition (K group)
KBL Coimbatore:
Best Productivity Award 2013 (second prize) given by Coimbatore
Productivity Council
Women Of Impact Awards - Best Leadership
Promotion Marketing Awards of Asia (PMAA) for Business to Business
category - Silver award for KBL‟s (Distribution Sector) Marketing Campaign
“Kirloskar Family Bonanza”
KBL subsidiary SPP pumps recognised as "Manufacturer of the Year" at
Pump Industry Awards
Awards received in the report ing period
Following Business Related, Process Related and Individual awards have been received by Kirloskar
Brothers Limited:
[SUSTAINABILITY REPORT] 2012-13
12
[SUSTAINABILITY REPORT] 2012-13
13
Operational structure
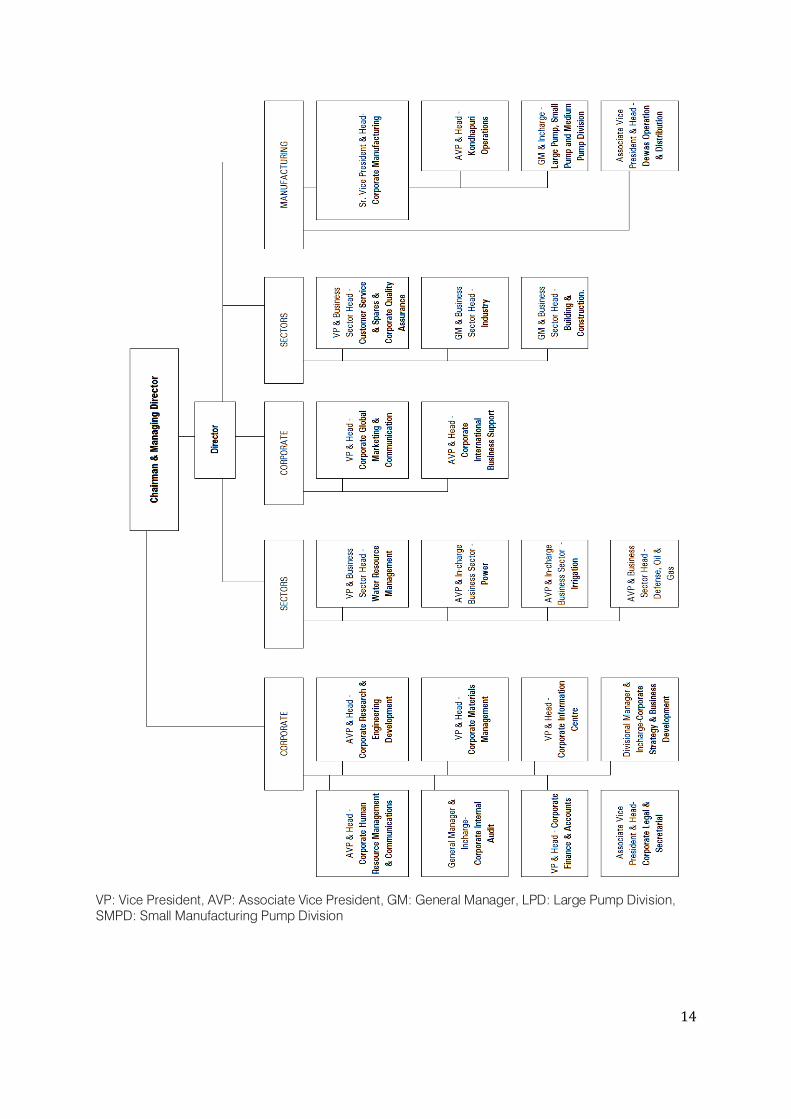
14
VP: Vice President, AVP: Associate Vice President, GM: General Manager, LPD: Large Pump Division,
SMPD: Small Manufacturing Pump Division
[SUSTAINABILITY REPORT] 2012-13
15
REPORT PARAMETERS
Report ing details
The information provided in this report is for the financial year 2012-13 (i.e. 1st April 2012 to 31st
March 2013). The previous report was published in February 2013 for financial year April 2011 to March
2012. This report is released annually.
The report includes 55 core key performance indicators and 29 additional performance indicators of
Global Reporting Initiative Generation 3.1 (GRI- G3.1) guidelines, as applicable to the Company with an
application level of „A+‟. The report has undergone external assurance by an independent assurer
namely Ernst & Young LLP. They have provided the assurance statement which forms part of this report
and placed at the end of the report after GRI Index.
Companies Economic, Environmental and Social responsibility performance is reflected in this report. It
also gives the priority areas of organisations working. These priority areas are identified and incorporated
in the annual plan of all the departments. Based on this, each department works on the materiality topics
for the entire year. The report is for all those stakeholders who may directly or indirectly get affected by
our company‟s products or services. The report is for all our stakeholders, regulatory authorities as well
as individuals and organizations interested in our performance on environmental, social and economic
aspects.
Contact points for questions regarding the report or its contents
Ms. Sheetal Nagare
Assistant Manager
Business Excellence
E-mail: [email protected]
Boundary of the report
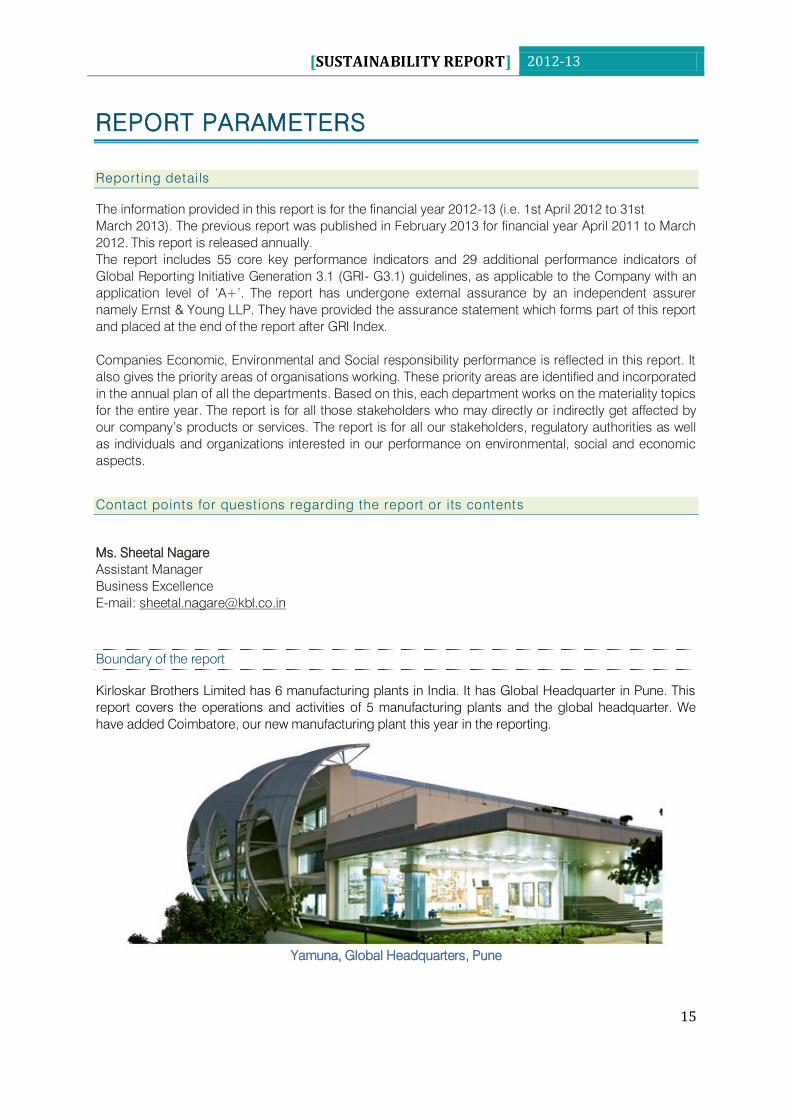
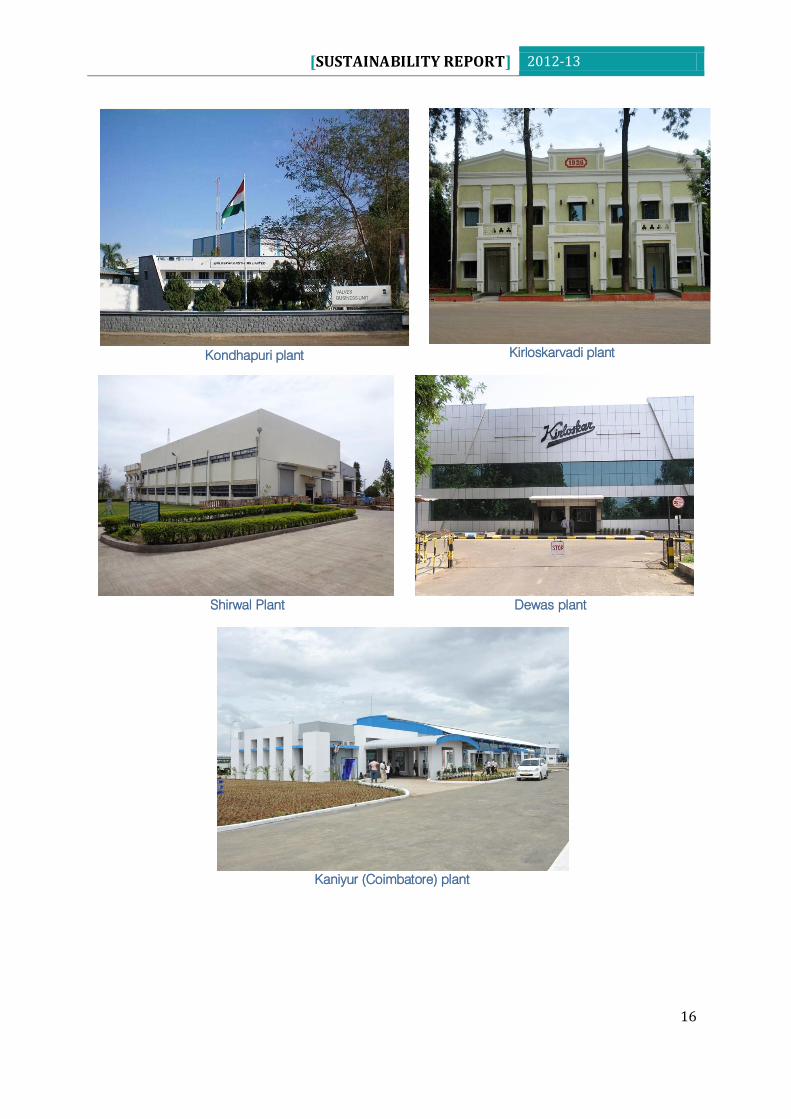
Kirloskar Brothers Limited has 6 manufacturing plants in India. It has Global Headquarter in Pune. This
report covers the operations and activities of 5 manufacturing plants and the global headquarter. We
have added Coimbatore, our new manufacturing plant this year in the reporting.
Yamuna, Global Headquarters, Pune
[SUSTAINABILITY REPORT] 2012-13
16
Kondhapuri plant
Kirloskarvadi plant
Shirwal Plant
Dewas plant
Kaniyur (Coimbatore) plant
[SUSTAINABILITY REPORT] 2012-13
17
Specific limitations on the scope or boundary of the report
Our Sanand plant (Ahmedabad) has started its operations in June 2012 and therefore it has not been
included in the scope for this report. This will be included in our subsequent sustainability reports.
(However the economic performance includes products produced and sold at Sanand plant)
Basis for reporting on joint ventures, subsidiaries, leased facilities, outsourced operations, and other
entities that can significantly affect comparability from period to period and/or between organizations
Most of the information for this report is sourced from the Annual Report 2012-13. Other data is based on
regular tracking for the reviews by the management.
Data measurement techniques and the bases of calculations
We have implemented SAP enterprise Resource Management System. Various modules related to
Finance, Production Planning, Materials Management, Sales and Distribution and Quality Management
are implemented. The financial data has been sourced from the Annual Report. The financial processes
and management processes related Quality Management System (ISO 9001), Environment Management
System (ISO 14001) and Occupational Health and Safety Assessment Series (OHSAS 18001) are
audited by the internal as well as external auditors. Wherever necessary, we have explained the
assumptions and/or exceptions while reporting on the GRI key performance indicators. For certifications
please refer our website http://www.kirloskarpumps.com/we-are-kbl-quality-policy.aspx. Other
assumptions and bases of calculations are given in respective sections.
[SUSTAINABILITY REPORT] 2012-13
18
GOVERNANCE: COMMITMENTS AND
ENGAGEMENTS
Governance Structure
The terms of reference of the audit and finance committee have been provided in the report on
Corporate Governance Appearing in the Annual Report 2012-13.
Structure of committees (as on 31st March 2013)
Audit / Finance: 4 Independent Directors
Remuneration: 3 Independent Directors
Shareholder / Investors greivance: 1 Independent Director and 1 Executive Director
The respective committee independently functions in the area assigned to them. Executive Committee
(called Committee of Directors) consists of the Chairman & Managing Director and the one Whole-Time
Directors. We have developed cross functional teams at each plant location who are working towards
sustainability and the activities are coordinated by sustainability team in corporate office „Yamuna‟. We
have monthly meetings which are reviewed by the CMD. The reviews are minuted for reference.
Additionally monthly monitoring results are shared with the top management in monthly review meetings.
Composition of board of directors by age and gender is as given under
Age 21-30 41-50 51-60 61-70 71-80 81-90 Total
Male 1 1 2 4 1 1 10
Female 0 0 0 1 0 0 1
Total directors (as on 31.03.2013) 11
Presently board has a female member, as minority representation. Further details about the broad
members are available in the Annual Report.
Highest governance body
The Board comprises an optimal complement of independent professionals as well as Company
Executives with in-depth knowledge of business. As on the date of this report, there are Eleven Directors
of whom one is Managing Director, one is Whole Time Director and Nine (82%) are non Executive
Directors of whom six (55%) are independent directors. There are 6 independent and non-executive
members on the Board of Directors of the company.
Details on the same are provide in 93rd
Annual report 2012-13 http://www.kirloskarpumps.com/investors-
financial-information-annual-reports.aspx
NAME OF THE
COMMITTEE ROLE
STATUS ON
INDEPENDENCE
Audit Committee The Audit Committee functions according to its
terms of references containing its powers, scope
and role in accordance with the provisions of
Companies Act, 1956, listing requirements
applicable to the Company. The same is reviewed
from time to time. Whilst, the full terms of references
are available in Annual report which is displayed on
The Committee has
an independence for
functioning
[SUSTAINABILITY REPORT] 2012-13
19
Company‟s website.
Remuneration
Committee
The Remuneration Committee of the Company is
empowered to review and decide the remuneration
of the Managing Director and the Executive
Directors. Suggested disclosures as per clause 49
of the Listing agreement are made in the Annual
Report
The Committee has
an independence for
functioning
Shareholders‟/
Investors‟ grievance
Committee
The Investors‟ Grievance Committee of the Board is
empowered to oversee the redressal of investors‟
complaints pertaining to share transfers, non receipt
of annual reports, dividend payments, issue of
duplicate certificates, transmission (with and without
legal representation) of shares and other
miscellaneous complaints. The status of complaints
and their redressal is disclosed in the Annual Report.
The Committee has
an independence for
functioning
Executive
Committee of the
Board (Committee
of Directors)
The Executive Committee of Board reviews major
business transactions/ strategies i.e. capital and
revenue budgets, long-term business strategies and
plans, the organisational structure of the Company,
real estate and investment transactions, allotment of
shares, borrowing and other routine matters.
The committee
reports to the board
Compensation for members of the highest governance body
The performances of the Whole-Time Directors are evaluated / reviewed by the Remuneration
Committee. The Company pays remuneration by way of salary, perquisites and allowances (fixed
component), incentive remuneration and commission. The Report on Corporate Governance in the
Annual Report contains details of the remuneration drawn by the Whole-Time Directors. The
remuneration by way of commission paid to the Non Executive Directors is decided by the Board of
Directors. Approval of the shareholders is taken for payment of commission to Non-Executive Directors
which is within the limits prescribed under the Companies Act, 1956. Appropriate disclosures are made
in the notice of the General Meetings. The Annual Report also contains details of the remuneration paid
to both Executive and Non-Executive Directors. Currently the compensation of the Board members is not
based on the environmental or social performance.
Confl icts of interest
To ensure that no conflict of interests arise among the highest governing body, transparency in
operations, is maintained with the help of various disclosures under governance. Proper and timely
disclosures are made to public through stock exchanges and circulation in news papers. Every year the
Board members and senior management personnel provide declaration on their compliance with the
Code of conduct.
Selection of Directors
The Directors are selected based on the following criteria:
Qualification and Expertise in the field
Business experience and achievements
Ability to bring in the external perspective
[SUSTAINABILITY REPORT] 2012-13
20
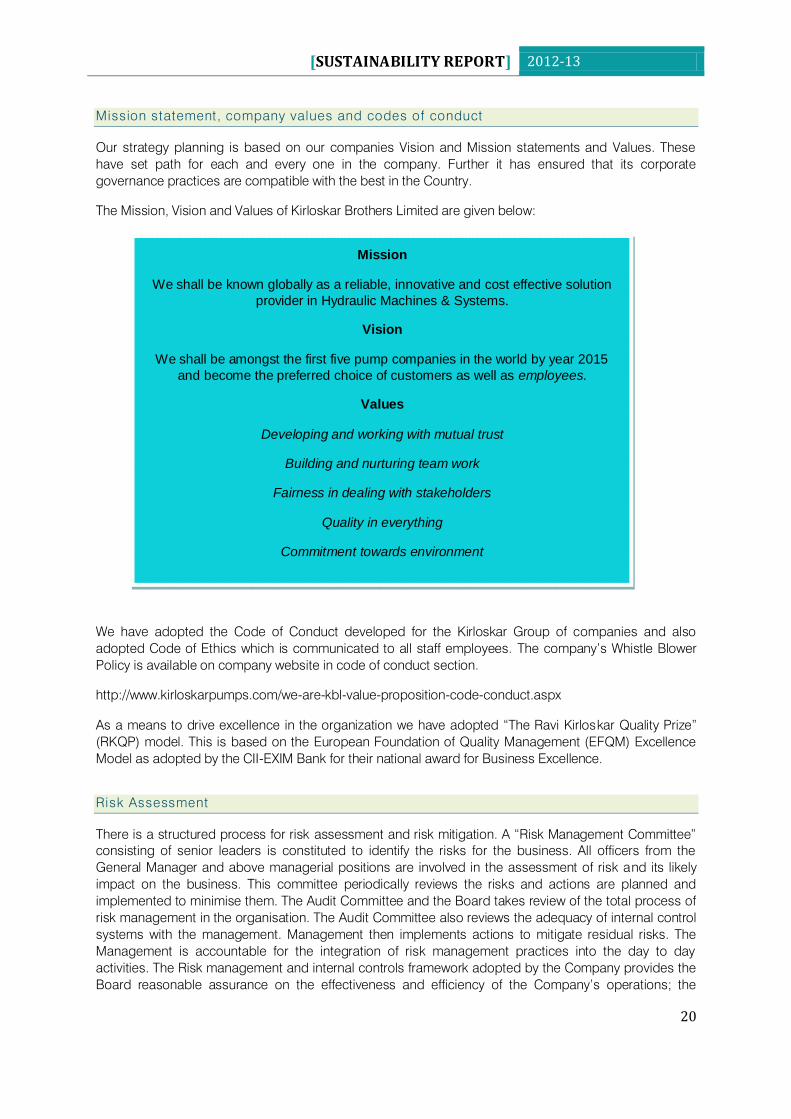
Mission statement, company values and codes of conduct
Our strategy planning is based on our companies Vision and Mission statements and Values. These
have set path for each and every one in the company. Further it has ensured that its corporate
governance practices are compatible with the best in the Country.
The Mission, Vision and Values of Kirloskar Brothers Limited are given below:
We have adopted the Code of Conduct developed for the Kirloskar Group of companies and also
adopted Code of Ethics which is communicated to all staff employees. The company‟s Whistle Blower
Policy is available on company website in code of conduct section.
http://www.kirloskarpumps.com/we-are-kbl-value-proposition-code-conduct.aspx
As a means to drive excellence in the organization we have adopted “The Ravi Kirloskar Quality Prize”
(RKQP) model. This is based on the European Foundation of Quality Management (EFQM) Excellence
Model as adopted by the CII-EXIM Bank for their national award for Business Excellence.
Risk Assessment
There is a structured process for risk assessment and risk mitigation. A “Risk Management Committee”
consisting of senior leaders is constituted to identify the risks for the business. All officers from the
General Manager and above managerial positions are involved in the assessment of risk and its likely
impact on the business. This committee periodically reviews the risks and actions are planned and
implemented to minimise them. The Audit Committee and the Board takes review of the total process of
risk management in the organisation. The Audit Committee also reviews the adequacy of internal control
systems with the management. Management then implements actions to mitigate residual risks. The
Management is accountable for the integration of risk management practices into the day to day
activities. The Risk management and internal controls framework adopted by the Company provides the
Board reasonable assurance on the effectiveness and efficiency of the Company‟s operations; the
Mission
We shall be known globally as a reliable, innovative and cost effective solution
provider in Hydraulic Machines & Systems.
Vision
We shall be amongst the first five pump companies in the world by year 2015
and become the preferred choice of customers as well as employees.
Values
Developing and working with mutual trust
Building and nurturing team work
Fairness in dealing with stakeholders
Quality in everything
Commitment towards environment
[SUSTAINABILITY REPORT] 2012-13
21
safeguarding of the Company‟s assets and the Company‟s compliance with laws and regulations. While
developing the strategy or planning for the projects social and environment aspect are considered.
Performance with respect to economic, environmental, and social
We have adopted balanced score card methodology which was developed with the help of an external
consultant on strategy development for all the employees. It included the development of perspectives
related to the Financial, Customer, Internal Process and Learning and Capability Development. Based on
this methodology the strategy map is prepared for the organisation to achieve its Vision. The company
level objectives are taken to the employees of the company. Based on this principle evaluation is done
for department heads and their subordinates. The economic performance of the company is evaluated
and audited by corporate financial accounts department. Related policy framework and strategy
development is undertaken.
Corporate Human Resource and Communication (CHRM&C) department along with safety managers
lays down the Environment, Health and Safety policy. We conduct periodic audits of all our
manufacturing units and all our project sites including the corporate office. The audit outcomes are
converted into action plans, implemented and periodically reviewed. CHRM & C coordinates company‟s
involvement with the society through its CSR activities. Kirloskar Foundation and Vikas Charitable Trust
are supporting us in these initiatives. Along with this, we also conduct society perception surveys, results
of which are presented to the top management and respective plant heads/project managers. Updates
of the activities are shared with the management regularly.
Implementation of the precautionary principle
We have formed a Risk Management Committee to identify risks at the company level. The risks are
prioritised and risk owners are assigned the actions to be taken to mitigate the risks and reduce the
impact and likelihood of these risks. We have implemented the review of projects for significant concerns
related to cost, quality or time and these are addressed at the highest level of the management.
The Corporate Research and Development department along with product engineering develop new
products based on customer expectations, performance of existing products and market analysis. Each
business sector has developed the new product development plans and the contribution of new
products as a % of sales.
Externally developed economic, environmental, and social charters, principles, or other
init iatives to which the organizat ion subscribes or endorses
We have mapped National Voluntary Guidelines (NVG) released by Ministry of Corporate Affairs India to
this report.
Kirloskar Brothers Limited has signed following
Code of Affirmative Action for the underprivileged class.
CII Code for Ecologically Sustainable Business Growth
Memberships in associations and/or national/international advocacy organizations;
Public Affairs Forum of India
Federation of Andhra Pradesh Chambers of Commerce and Industry
[SUSTAINABILITY REPORT] 2012-13
22
Fire and Security Association of India
Confederation of Indian Industry (CII) - Western Region
Federation of Indian Chambers of Commerce and Industry (FICCI)
Indo American Chamber - Of Commerce
Indian Council of Arbitration
Mahratta Chambers of Commerce Industries and Agriculture (MCCIA)
Engineering Export Promotion Council
Indian Pump Manufacturers Association
Stakeholder Engagement
KBL strongly believes in the definition that an excellent organization is one which achieves superior levels
of performance that meet or exceed the needs and expectations of all its stakeholders. We have
developed mechanisms to interact with our stakeholders to understand their needs and expectations.
We use ongoing interactions, meetings, surveys and questionnaires, seminars and conferences, audits
and our annual and sustainability reports for our stakeholder engagement process. These become part
of the vital input for development of strategy and action plans for sustainable growth and sustainable
benefit to our stakeholders.
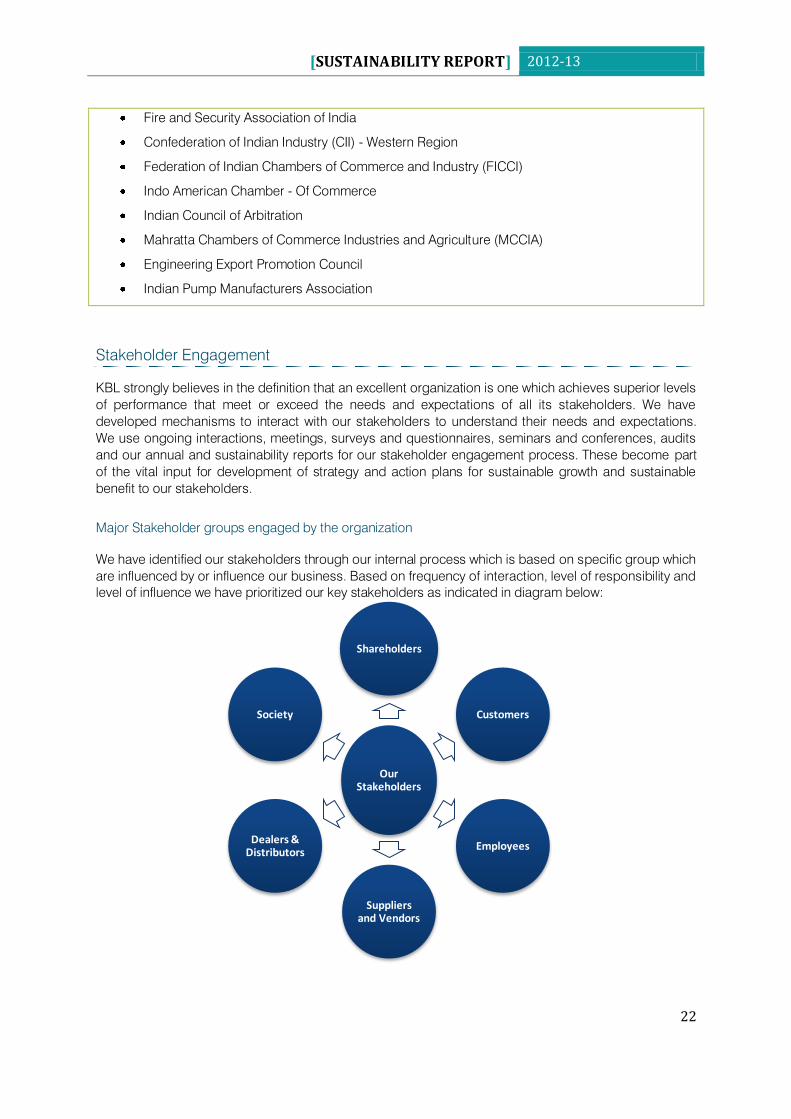
Major Stakeholder groups engaged by the organization
We have identified our stakeholders through our internal process which is based on specific group which
are influenced by or influence our business. Based on frequency of interaction, level of responsibility and
level of influence we have prioritized our key stakeholders as indicated in diagram below:
Our Stakeholders
Shareholders
Customers
Employees
Suppliers and Vendors
Dealers & Distributors
Society
[SUSTAINABILITY REPORT] 2012-13
23
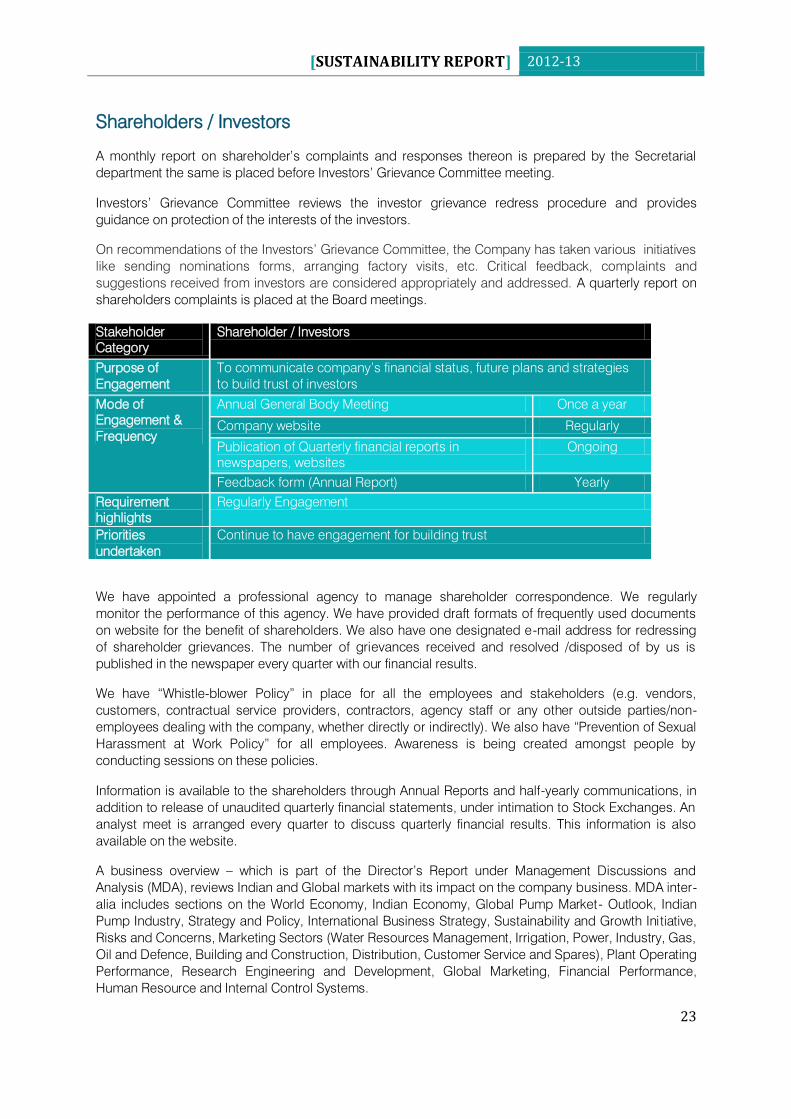
Shareholders / Investors
A monthly report on shareholder‟s complaints and responses thereon is prepared by the Secretarial
department the same is placed before Investors‟ Grievance Committee meeting.
Investors‟ Grievance Committee reviews the investor grievance redress procedure and provides
guidance on protection of the interests of the investors.
On recommendations of the Investors‟ Grievance Committee, the Company has taken various initiatives
like sending nominations forms, arranging factory visits, etc. Critical feedback, complaints and
suggestions received from investors are considered appropriately and addressed. A quarterly report on
shareholders complaints is placed at the Board meetings.
Stakeholder
Category
Shareholder / Investors
Purpose of
Engagement
To communicate company‟s financial status, future plans and strategies
to build trust of investors
Mode of
Engagement &
Frequency
Annual General Body Meeting Once a year
Company website Regularly
Publication of Quarterly financial reports in
newspapers, websites
Ongoing
Feedback form (Annual Report) Yearly
Requirement
highlights
Regularly Engagement
Priorities
undertaken
Continue to have engagement for building trust
We have appointed a professional agency to manage shareholder correspondence. We regularly
monitor the performance of this agency. We have provided draft formats of frequently used documents
on website for the benefit of shareholders. We also have one designated e-mail address for redressing
of shareholder grievances. The number of grievances received and resolved /disposed of by us is
published in the newspaper every quarter with our financial results.
We have “Whistle-blower Policy” in place for all the employees and stakeholders (e.g. vendors,
customers, contractual service providers, contractors, agency staff or any other outside parties/non-
employees dealing with the company, whether directly or indirectly). We also have “Prevention of Sexual
Harassment at Work Policy” for all employees. Awareness is being created amongst people by
conducting sessions on these policies.
Information is available to the shareholders through Annual Reports and half-yearly communications, in
addition to release of unaudited quarterly financial statements, under intimation to Stock Exchanges. An
analyst meet is arranged every quarter to discuss quarterly financial results. This information is also
available on the website.
A business overview – which is part of the Director‟s Report under Management Discussions and
Analysis (MDA), reviews Indian and Global markets with its impact on the company business. MDA inter-
alia includes sections on the World Economy, Indian Economy, Global Pump Market- Outlook, Indian
Pump Industry, Strategy and Policy, International Business Strategy, Sustainability and Growth Initiative,
Risks and Concerns, Marketing Sectors (Water Resources Management, Irrigation, Power, Industry, Gas,
Oil and Defence, Building and Construction, Distribution, Customer Service and Spares), Plant Operating
Performance, Research Engineering and Development, Global Marketing, Financial Performance,
Human Resource and Internal Control Systems.
[SUSTAINABILITY REPORT] 2012-13
24
In addition to this, to achieve excellence in Corporate Governance, certain additional disclosures have
been given in the Annual Report viz. Top ten shareholders, Change in Equity Capital during the financial
year, Vision Mission statements. Further, during the year, the Board has adopted certain policies viz.
Code of Corporate Governance, Corporate Disclosure Policy, Dividend Policy and Policy for placing
Action Taken Report / Implementation Report at the Board Meeting.
Customers:
In line with our companies vision we want to be the preferred choice of our customers. Feedbacks and
suggestions from our customers help us develop new products and improve our services.
Stakeholder
Category
Customers
Purpose of
Engagement
Understand needs and expectations of customers
Mode of
Engagement &
Frequency
KBL top management interacts with the customers Once a year
Sales and marketing teams interact with customers regularly Regularly
Customer Perception Survey once a year
Interaction points also include special events, seminars,
exhibitions and meets.
Ongoing
Special Market research projects are conducted to understand
the market and customers
As per the
requirement
Special surveys to understand the voice of customer As per the
requirement
Visits of customers to our premises once a year
Toll Free Tatkal Seva Everyday
Requirement
highlights
Order execution and delivery, Service and Maintenance, technology up-gradation
(energy efficient products), Business and Commercial Support, Sales Team,
Sustainability assessment
Priorities
undertaken
Project Management Office, Link intelliquip to sharepoint office library, Refurbishment
Centres, increase in service centres, Warehouse facility at Kirloskarvadi,
Implementation of Customer Relationship Management (CRM) 7.1, Increase Spares
and Service Dealers, Specialized trainings, On Site customer training module,
Sustainability reporting
The major areas undertaken for improvement are after sales service, timely availability of support team,
improvement in response time, and technical competency of sales team. As a collaborative approach
towards sustainability, our customers also value us based on our sustainability approach. Sustainability
reporting addresses the same.
We have emphasized on creating awareness on technical aspects of our products through onsite
training to customers, updating operation and maintenance manuals and development of online
searchable diagnostic tools. This has facilitated our customers in using our products safely and
efficiently with optimal energy consumption.
Some selected initiatives towards product responsibility are highlighted below.
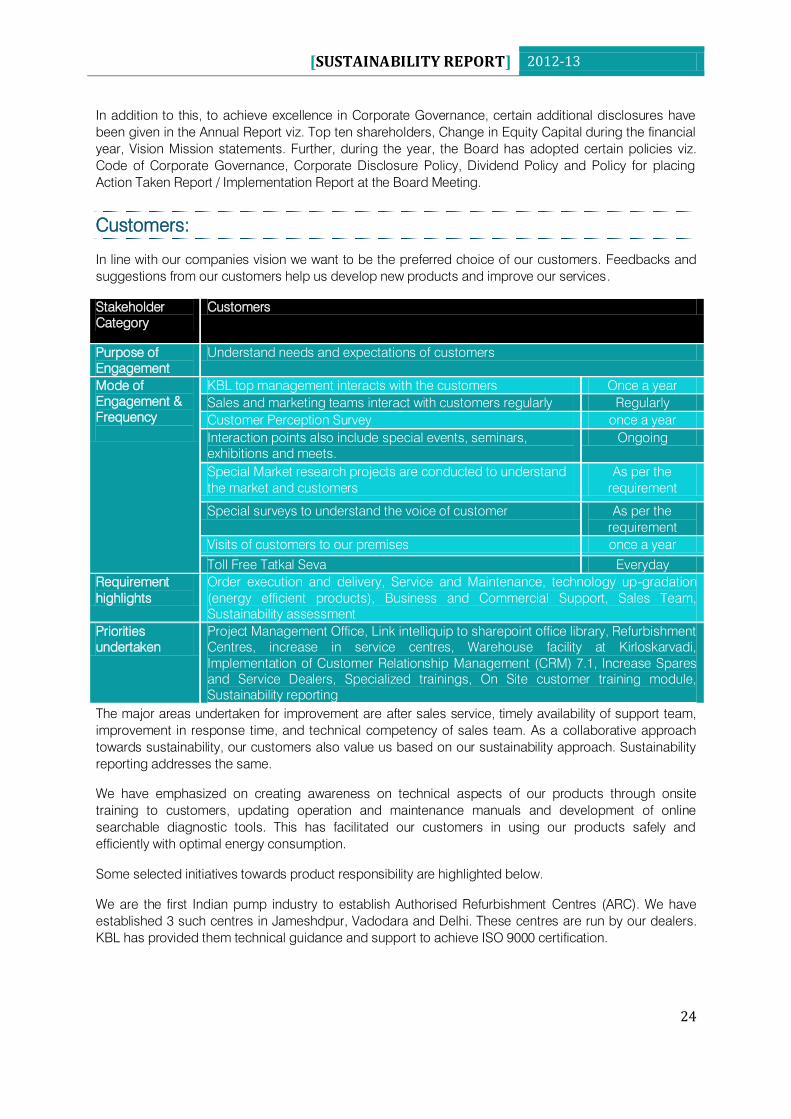
We are the first Indian pump industry to establish Authorised Refurbishment Centres (ARC). We have
established 3 such centres in Jameshdpur, Vadodara and Delhi. These centres are run by our dealers.
KBL has provided them technical guidance and support to achieve ISO 9000 certification.
[SUSTAINABILITY REPORT] 2012-13
25
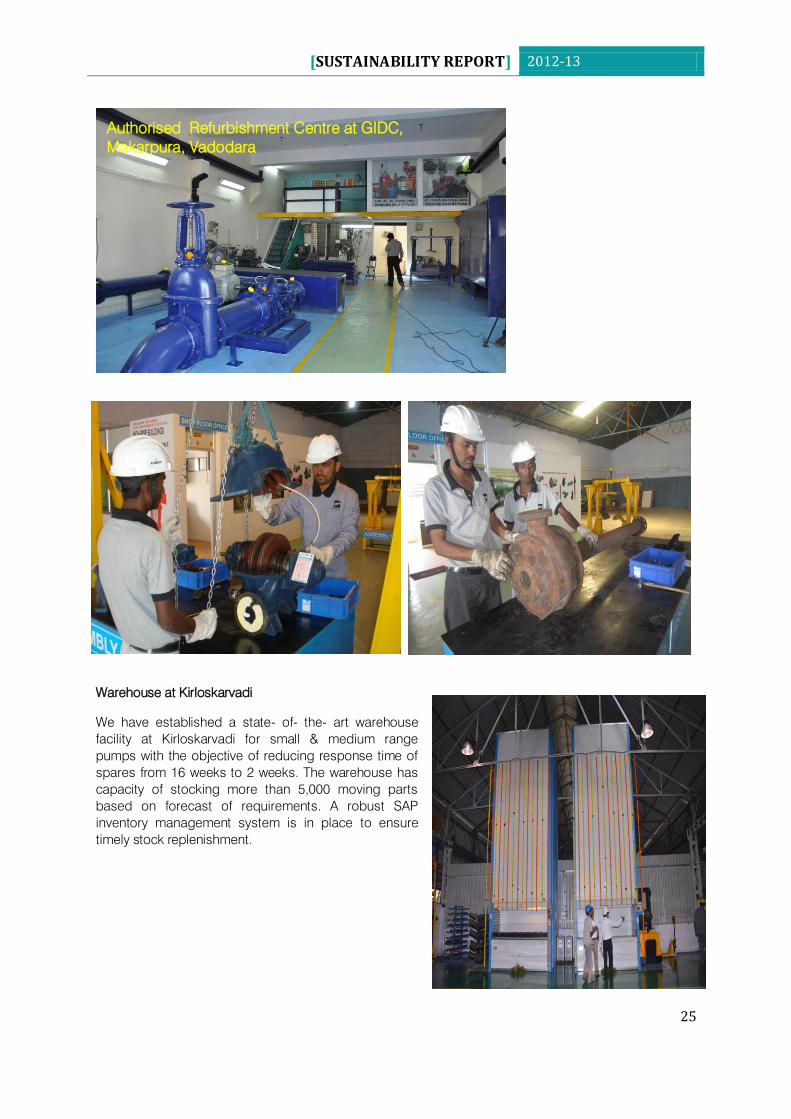
Warehouse at Kirloskarvadi
We have established a state- of- the- art warehouse
facility at Kirloskarvadi for small & medium range
pumps with the objective of reducing response time of
spares from 16 weeks to 2 weeks. The warehouse has
capacity of stocking more than 5,000 moving parts
based on forecast of requirements. A robust SAP
inventory management system is in place to ensure
timely stock replenishment.
Authorised Refurbishment Centre at GIDC,
Makarpura, Vadodara
[SUSTAINABILITY REPORT] 2012-13
26
Mr. Customer
In order to build strong and long term relationships with customers and to enhance the quality of service
we have implemented concept of “Mr. Customer”. In this programme, each KBL Sales & Service
Engineer is made responsible for a particular customer. This Service Engineer called “Mr Customer”
becomes a single point of contact to cater to all requirements for service, spares, enquiries and
complaints related to specific customer. The feedback of every Mr. Customer is evaluated for
improvements in parameters of service response and quality of
service.
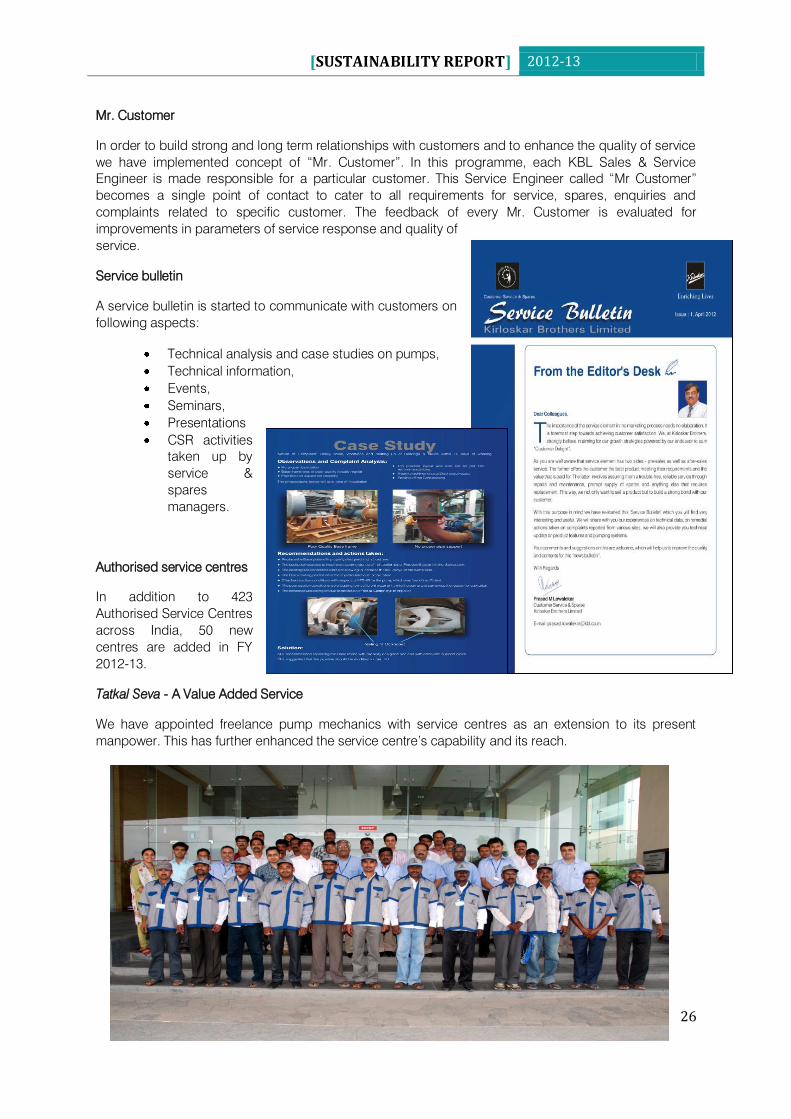
Service bulletin
A service bulletin is started to communicate with customers on
following aspects:
Technical analysis and case studies on pumps,
Technical information,
Events,
Seminars,
Presentations
CSR activities
taken up by
service &
spares
managers.
Authorised service centres
In addition to 423
Authorised Service Centres
across India, 50 new
centres are added in FY
2012-13.
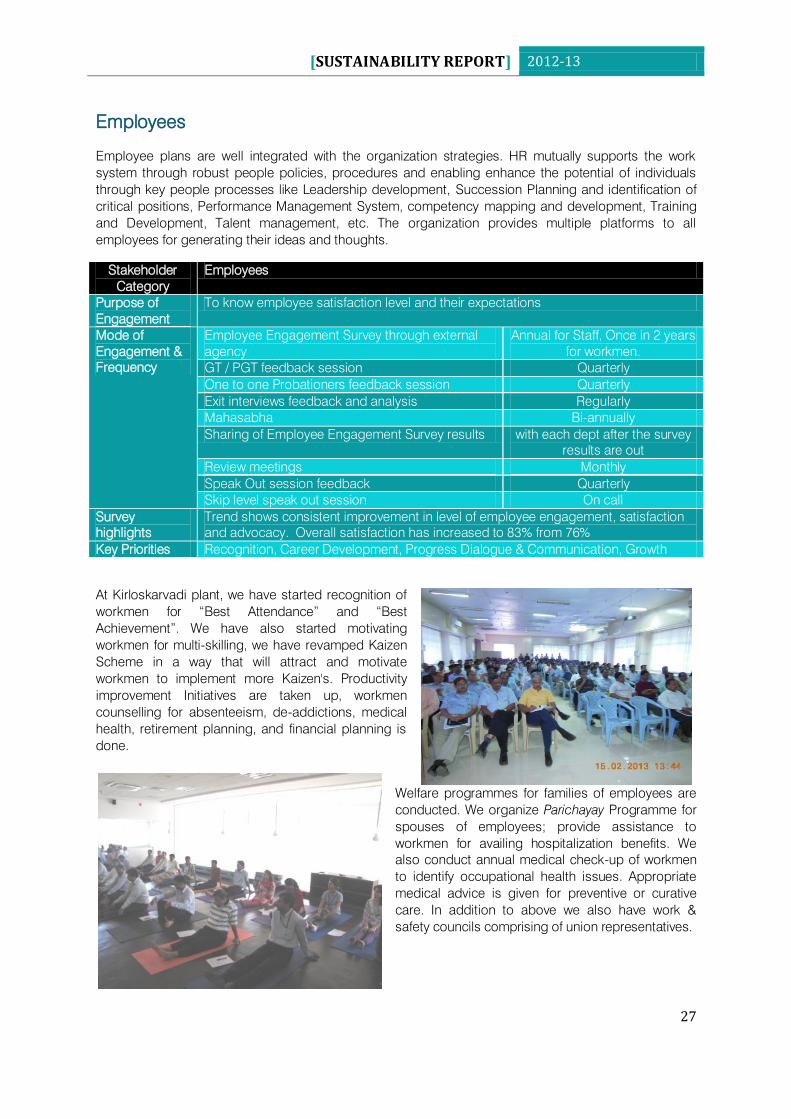
Tatkal Seva - A Value Added Service
We have appointed freelance pump mechanics with service centres as an extension to its present
manpower. This has further enhanced the service centre‟s capability and its reach.
[SUSTAINABILITY REPORT] 2012-13
27
Employees
Employee plans are well integrated with the organization strategies. HR mutually supports the work
system through robust people policies, procedures and enabling enhance the potential of individuals
through key people processes like Leadership development, Succession Planning and identification of
critical positions, Performance Management System, competency mapping and development, Training
and Development, Talent management, etc. The organization provides multiple platforms to all
employees for generating their ideas and thoughts.
Stakeholder
Category
Employees
Purpose of
Engagement
To know employee satisfaction level and their expectations
Mode of
Engagement &
Frequency
Employee Engagement Survey through external
agency
Annual for Staff, Once in 2 years
for workmen.
GT / PGT feedback session Quarterly
One to one Probationers feedback session Quarterly
Exit interviews feedback and analysis Regularly
Mahasabha Bi-annually
Sharing of Employee Engagement Survey results with each dept after the survey
results are out
Review meetings Monthly
Speak Out session feedback Quarterly
Skip level speak out session On call
Survey
highlights
Trend shows consistent improvement in level of employee engagement, satisfaction
and advocacy. Overall satisfaction has increased to 83% from 76%
Key Priorities Recognition, Career Development, Progress Dialogue & Communication, Growth
At Kirloskarvadi plant, we have started recognition of
workmen for “Best Attendance” and “Best
Achievement”. We have also started motivating
workmen for multi-skilling, we have revamped Kaizen
Scheme in a way that will attract and motivate
workmen to implement more Kaizen's. Productivity
improvement Initiatives are taken up, workmen
counselling for absenteeism, de-addictions, medical
health, retirement planning, and financial planning is
done.
Welfare programmes for families of employees are
conducted. We organize Parichayay Programme for
spouses of employees; provide assistance to
workmen for availing hospitalization benefits. We
also conduct annual medical check-up of workmen
to identify occupational health issues. Appropriate
medical advice is given for preventive or curative
care. In addition to above we also have work &
safety councils comprising of union representatives.
[SUSTAINABILITY REPORT] 2012-13
28
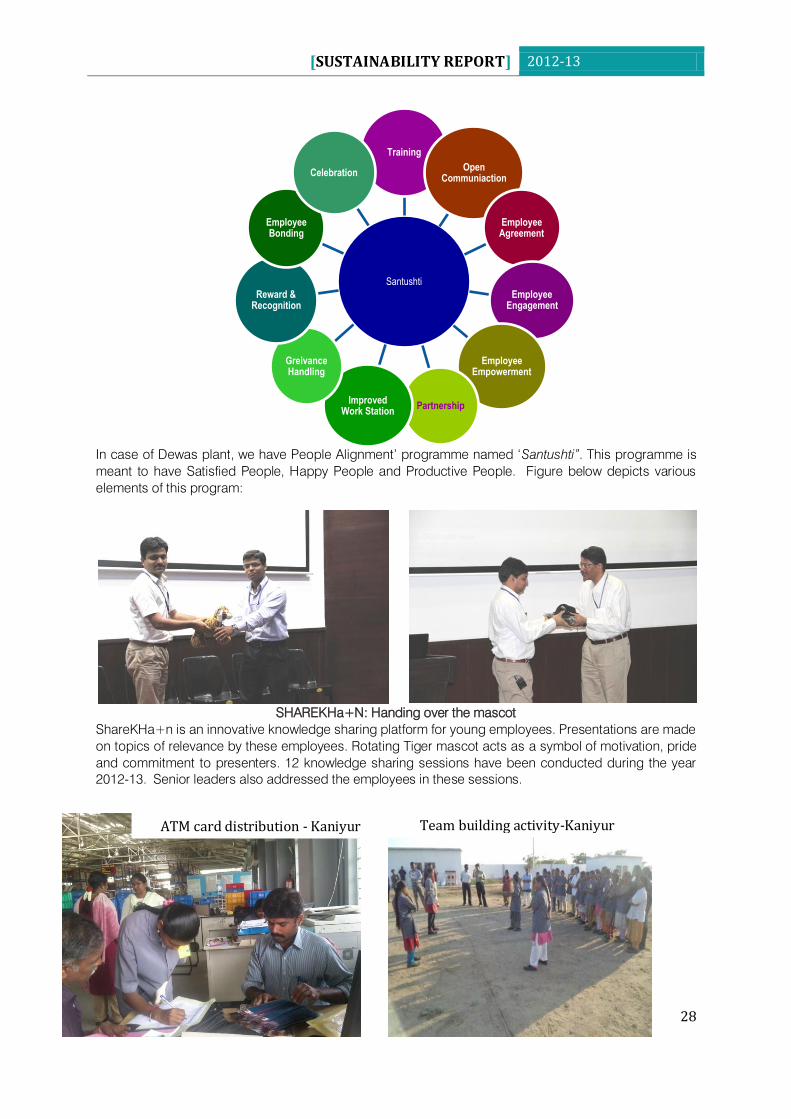
In case of Dewas plant, we have People Alignment‟ programme named „Santushti”. This programme is
meant to have Satisfied People, Happy People and Productive People. Figure below depicts various
elements of this program:
SHAREKHa+N: Handing over the mascot
ShareKHa+n is an innovative knowledge sharing platform for young employees. Presentations are made
on topics of relevance by these employees. Rotating Tiger mascot acts as a symbol of motivation, pride
and commitment to presenters. 12 knowledge sharing sessions have been conducted during the year
2012-13. Senior leaders also addressed the employees in these sessions.
Santushti
Training
Open Communiaction
Employee Agreement
Employee Engagement
Employee Empowerment
PartnershipImproved
Work Station
Greivance Handling
Reward & Recognition
Employee Bonding
Celebration
ATM card distribution - Kaniyur Team building activity-Kaniyur
[SUSTAINABILITY REPORT] 2012-13
29
Vendors /Suppliers:
We have Vendor Management Cell at Corporate office, Pune and Vendor Development Cells at units
to look after Supplier management and partnerships. The objective of this team is to
Improve vendor relationship.
Identify the parameters that contribute to vendor satisfaction and increases performance.
Evaluate the Vendor Satisfaction Index (VSI) and company performance with industry standards
Analyse the qualitative response obtained from vendors/suppliers and present them on a
structured format so as to develop strategies/ plan on further improvement
Review supplier coverage.
Initiate programmes and devise mechanism to improve supplier quality and productivity.
To identify suppliers which are critical for business and enter into partnerships with them.
We have more than 40 suppliers who are supplying us material for over 20 years. Some of the suppliers
are supplying for more than 40 years. In order to continue mutual benefit association, we organize
surveys and vendors meets where they can communicate with senior management and share their
thoughts and inputs.
Stakeholder
Category
Suppliers and vendors
Purpose of
Engagement
Understand needs and expectations of suppliers/ vendors, communicate vendor
performance and create awareness on customer requirements and market
updates.
Mode of
Engagement
Vendor
Satisfaction
Surveys
Workplace
assessments
One-to-one
meetings
Vendor
meet
Senior
leaders
visit
Frequency Annually 6 months Ongoing
process
Once a year As per the
plan
Expectation
highlights
Payment as per agreed norms. Vendor Meets - Rewards / Reorganisation,
Evaluation of Performances. Periodic Performance Feedback to vendors. Timely
response to the queries and suggestions by vendor. Timely Receipt of Purchase
Orders or schedules to vendors. Centralised contact for vendor interaction in
execution.
Priority undertaken E- Portal where payment status is available to suppliers. Web Portal based on
share point for monitoring of entire procurement activities. RTGS transfers
system to be used for payments in suppliers. Centralised Performance
Evaluation system for suppliers. Create preferred vendor list based on
performance and increase business share with these vendors
As mentioned above, based on the detailed expectations of the vendors, actions were planned and this
year we continue the execution of the same. Highlights of these initiatives are mentioned below.
Centralised Performance Evaluation system: We have developed new criteria for evaluation of
vendors/suppliers. Re-evaluation of 157 pump component suppliers is done and results are
communicated to them.
Centralised contact for vendor interaction:
Vendor portal: We had last year started this online portal to simplify and improved process
related to purchasing activity, to improve our communication with vendors, provide platform to
vendors for giving innovative ideas, for updating their profile etc. More than 500 vendors are
enjoying the benefits like 24 hours on line SAP reports on Pending Purchase orders, Goods
Receipts Report, Pending Payment Report, Cleared Payment Report etc. We have given training
[SUSTAINABILITY REPORT] 2012-13
30
to around 300 vendors on use of this portal and seen improvement in our dealings. 526
numbers of vendors are enrolled with this portal.
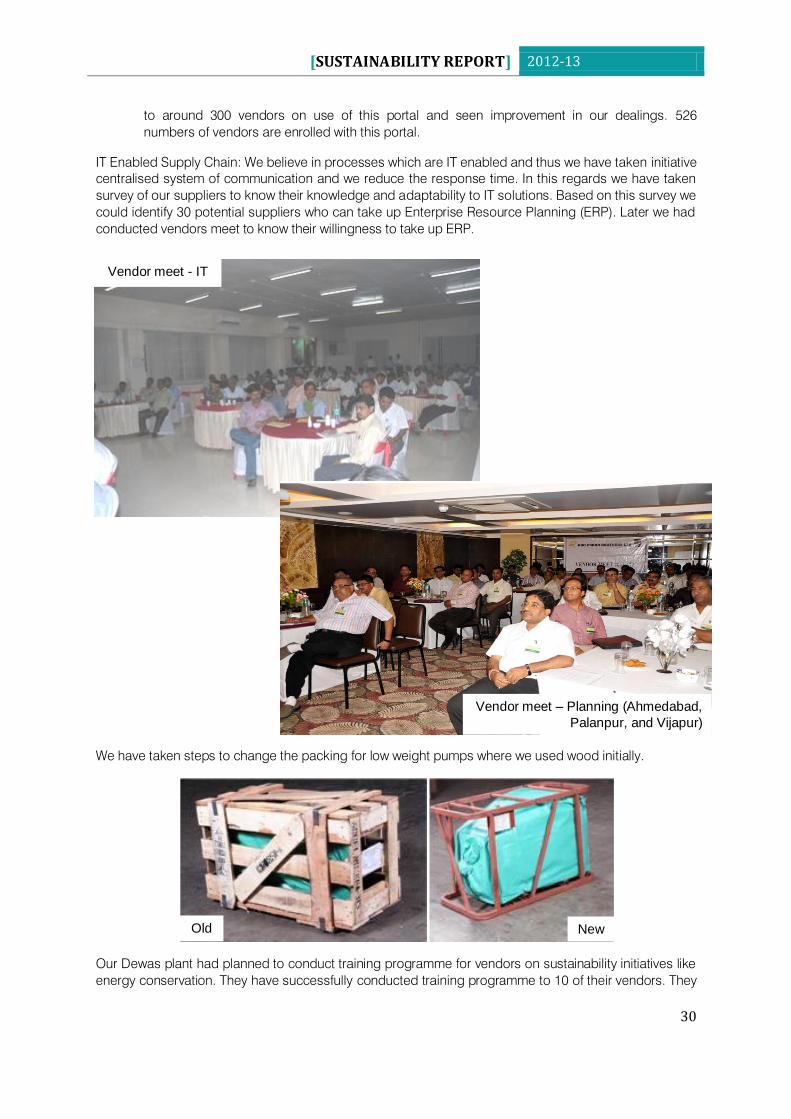
IT Enabled Supply Chain: We believe in processes which are IT enabled and thus we have taken initiative
centralised system of communication and we reduce the response time. In this regards we have taken
survey of our suppliers to know their knowledge and adaptability to IT solutions. Based on this survey we
could identify 30 potential suppliers who can take up Enterprise Resource Planning (ERP). Later we had
conducted vendors meet to know their willingness to take up ERP.
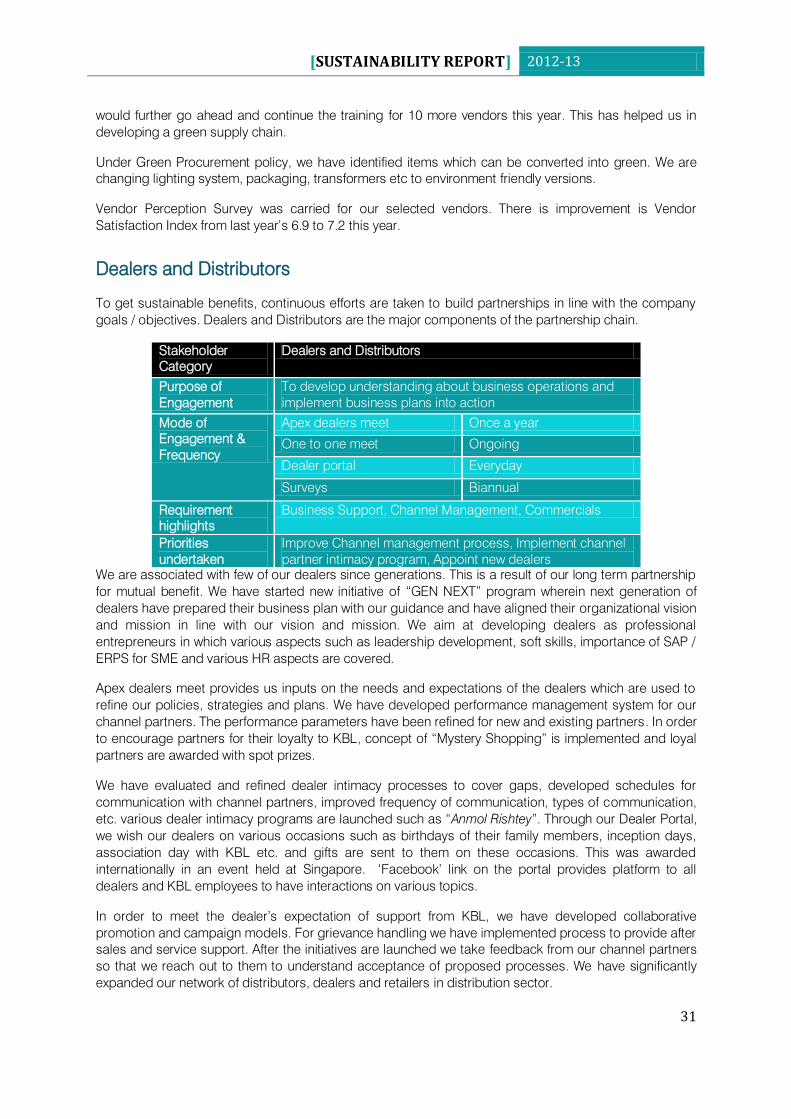
We have taken steps to change the packing for low weight pumps where we used wood initially.
Our Dewas plant had planned to conduct training programme for vendors on sustainability initiatives like
energy conservation. They have successfully conducted training programme to 10 of their vendors. They
Vendor meet - IT
Vendor meet – Planning (Ahmedabad,
Palanpur, and Vijapur)
Old New
[SUSTAINABILITY REPORT] 2012-13
31
would further go ahead and continue the training for 10 more vendors this year. This has helped us in
developing a green supply chain.
Under Green Procurement policy, we have identified items which can be converted into green. We are
changing lighting system, packaging, transformers etc to environment friendly versions.
Vendor Perception Survey was carried for our selected vendors. There is improvement is Vendor
Satisfaction Index from last year‟s 6.9 to 7.2 this year.
Dealers and Distributors
To get sustainable benefits, continuous efforts are taken to build partnerships in line with the company
goals / objectives. Dealers and Distributors are the major components of the partnership chain.
Stakeholder
Category
Dealers and Distributors
Purpose of
Engagement
To develop understanding about business operations and
implement business plans into action
Mode of
Engagement &
Frequency
Apex dealers meet Once a year
One to one meet Ongoing
Dealer portal Everyday
Surveys Biannual
Requirement
highlights
Business Support, Channel Management, Commercials
Priorities
undertaken
Improve Channel management process, Implement channel
partner intimacy program, Appoint new dealers
We are associated with few of our dealers since generations. This is a result of our long term partnership
for mutual benefit. We have started new initiative of “GEN NEXT” program wherein next generation of
dealers have prepared their business plan with our guidance and have aligned their organizational vision
and mission in line with our vision and mission. We aim at developing dealers as professional
entrepreneurs in which various aspects such as leadership development, soft skills, importance of SAP /
ERPS for SME and various HR aspects are covered.
Apex dealers meet provides us inputs on the needs and expectations of the dealers which are used to
refine our policies, strategies and plans. We have developed performance management system for our
channel partners. The performance parameters have been refined for new and existing partners. In order
to encourage partners for their loyalty to KBL, concept of “Mystery Shopping” is implemented and loyal
partners are awarded with spot prizes.
We have evaluated and refined dealer intimacy processes to cover gaps, developed schedules for
communication with channel partners, improved frequency of communication, types of communication,
etc. various dealer intimacy programs are launched such as “Anmol Rishtey”. Through our Dealer Portal,
we wish our dealers on various occasions such as birthdays of their family members, inception days,
association day with KBL etc. and gifts are sent to them on these occasions. This was awarded
internationally in an event held at Singapore. „Facebook‟ link on the portal provides platform to all
dealers and KBL employees to have interactions on various topics.
In order to meet the dealer‟s expectation of support from KBL, we have developed collaborative
promotion and campaign models. For grievance handling we have implemented process to provide after
sales and service support. After the initiatives are launched we take feedback from our channel partners
so that we reach out to them to understand acceptance of proposed processes. We have significantly
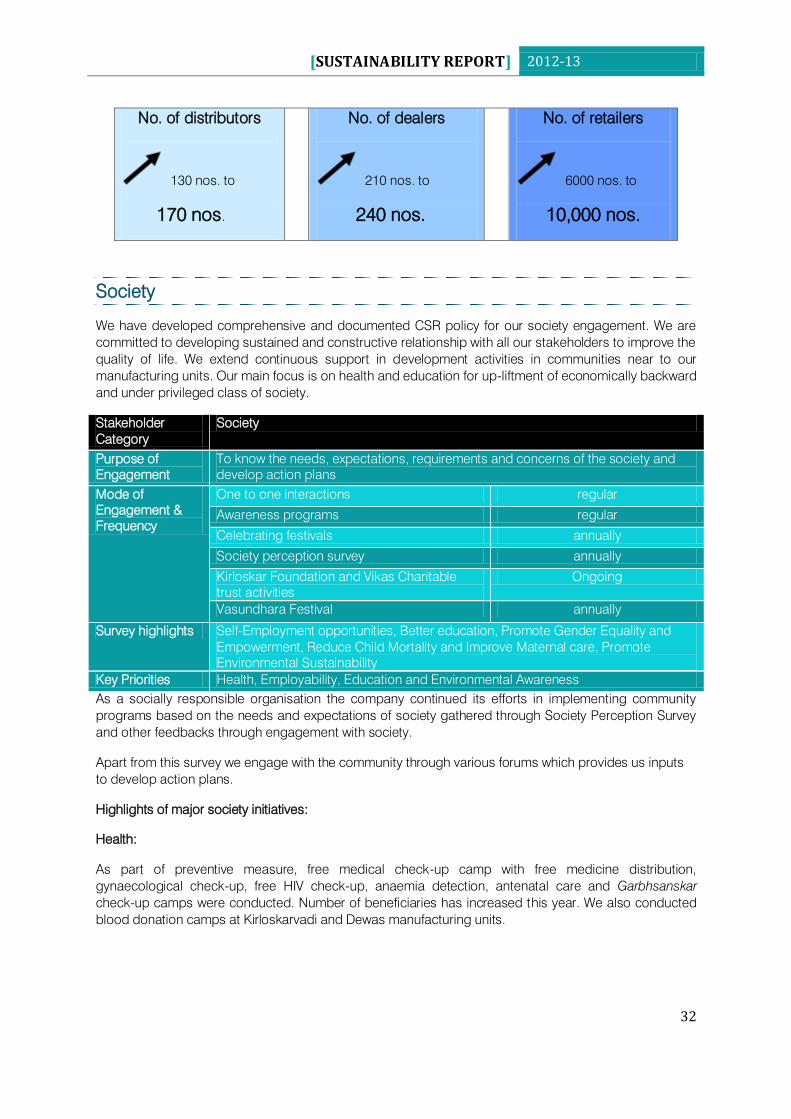
expanded our network of distributors, dealers and retailers in distribution sector.
[SUSTAINABILITY REPORT] 2012-13
32
No. of distributors
130 nos. to
170 nos.
No. of dealers
210 nos. to
240 nos.
No. of retailers
6000 nos. to
10,000 nos.
Society
We have developed comprehensive and documented CSR policy for our society engagement. We are
committed to developing sustained and constructive relationship with all our stakeholders to improve the
quality of life. We extend continuous support in development activities in communities near to our
manufacturing units. Our main focus is on health and education for up-liftment of economically backward
and under privileged class of society.
Stakeholder
Category
Society
Purpose of
Engagement
To know the needs, expectations, requirements and concerns of the society and
develop action plans
Mode of
Engagement &
Frequency
One to one interactions regular
Awareness programs regular
Celebrating festivals annually
Society perception survey annually
Kirloskar Foundation and Vikas Charitable
trust activities
Ongoing
Vasundhara Festival annually
Survey highlights Self-Employment opportunities, Better education, Promote Gender Equality and
Empowerment, Reduce Child Mortality and Improve Maternal care, Promote
Environmental Sustainability
Key Priorities Health, Employability, Education and Environmental Awareness
As a socially responsible organisation the company continued its efforts in implementing community
programs based on the needs and expectations of society gathered through Society Perception Survey
and other feedbacks through engagement with society.
Apart from this survey we engage with the community through various forums which provides us inputs
to develop action plans.
Highlights of major society initiatives:
Health:
As part of preventive measure, free medical check-up camp with free medicine distribution,
gynaecological check-up, free HIV check-up, anaemia detection, antenatal care and Garbhsanskar
check-up camps were conducted. Number of beneficiaries has increased this year. We also conducted
blood donation camps at Kirloskarvadi and Dewas manufacturing units.
[SUSTAINABILITY REPORT] 2012-13
33
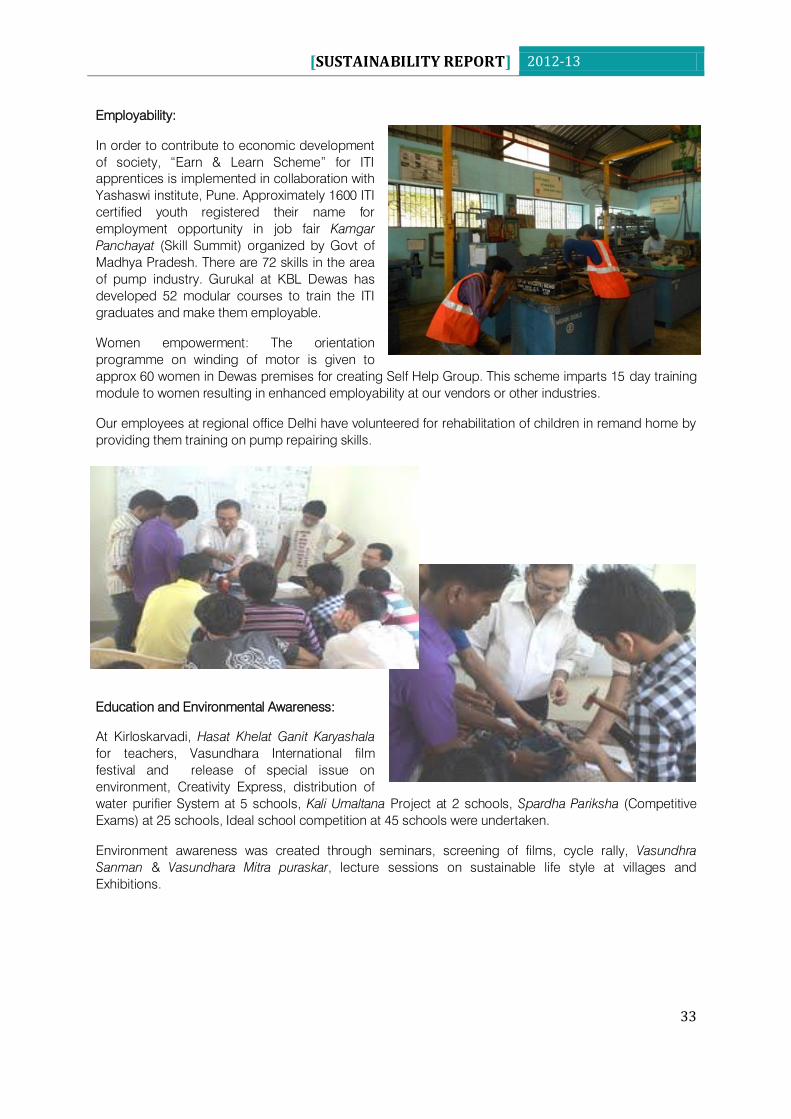
Employability:
In order to contribute to economic development
of society, “Earn & Learn Scheme” for ITI
apprentices is implemented in collaboration with
Yashaswi institute, Pune. Approximately 1600 ITI
certified youth registered their name for
employment opportunity in job fair Kamgar
Panchayat (Skill Summit) organized by Govt of
Madhya Pradesh. There are 72 skills in the area
of pump industry. Gurukal at KBL Dewas has
developed 52 modular courses to train the ITI
graduates and make them employable.
Women empowerment: The orientation
programme on winding of motor is given to
approx 60 women in Dewas premises for creating Self Help Group. This scheme imparts 15 day training
module to women resulting in enhanced employability at our vendors or other industries.
Our employees at regional office Delhi have volunteered for rehabilitation of children in remand home by
providing them training on pump repairing skills.
Education and Environmental Awareness:
At Kirloskarvadi, Hasat Khelat Ganit Karyashala
for teachers, Vasundhara International film
festival and release of special issue on
environment, Creativity Express, distribution of
water purifier System at 5 schools, Kali Umaltana Project at 2 schools, Spardha Pariksha (Competitive
Exams) at 25 schools, Ideal school competition at 45 schools were undertaken.
Environment awareness was created through seminars, screening of films, cycle rally, Vasundhra
Sanman & Vasundhara Mitra puraskar, lecture sessions on sustainable life style at villages and
Exhibitions.
[SUSTAINABILITY REPORT] 2012-13
34
Scholarships were given to the girls of blind school
run by Madhya Pradesh welfare association for the
Blind. Submersible Pump was donated to
Government Primary Higher Secondary School in
Dewas. A talk show was organized on the issue of
female infanticide, jointly by KBL-Dewas, ESIC and
Department of Women and Child Development,
Govt. of M.P. The contribution of Bal Vadi workers
in “Save the Girl Child” (Beti Bachao Abhiyan) and
for playing a vital role in reducing the rate of female
infanticide were appreciated in this event.
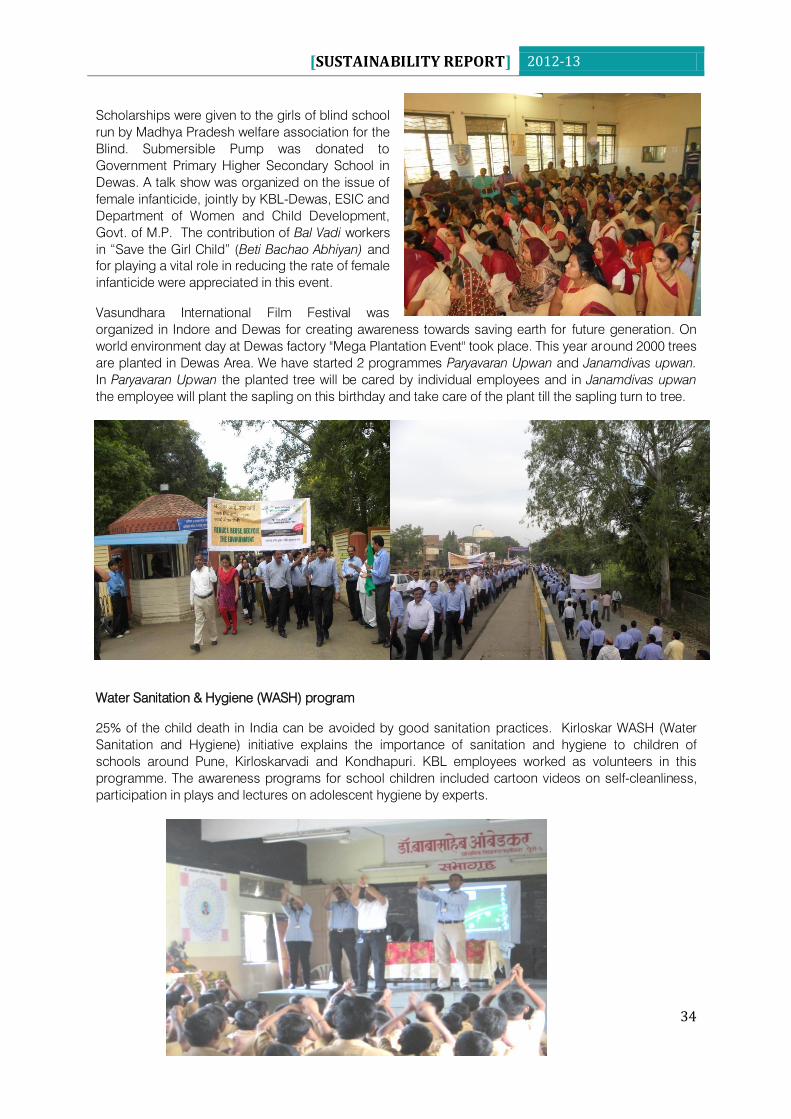
Vasundhara International Film Festival was
organized in Indore and Dewas for creating awareness towards saving earth for future generation. On
world environment day at Dewas factory "Mega Plantation Event" took place. This year around 2000 trees
are planted in Dewas Area. We have started 2 programmes Paryavaran Upwan and Janamdivas upwan.
In Paryavaran Upwan the planted tree will be cared by individual employees and in Janamdivas upwan
the employee will plant the sapling on this birthday and take care of the plant till the sapling turn to tree.
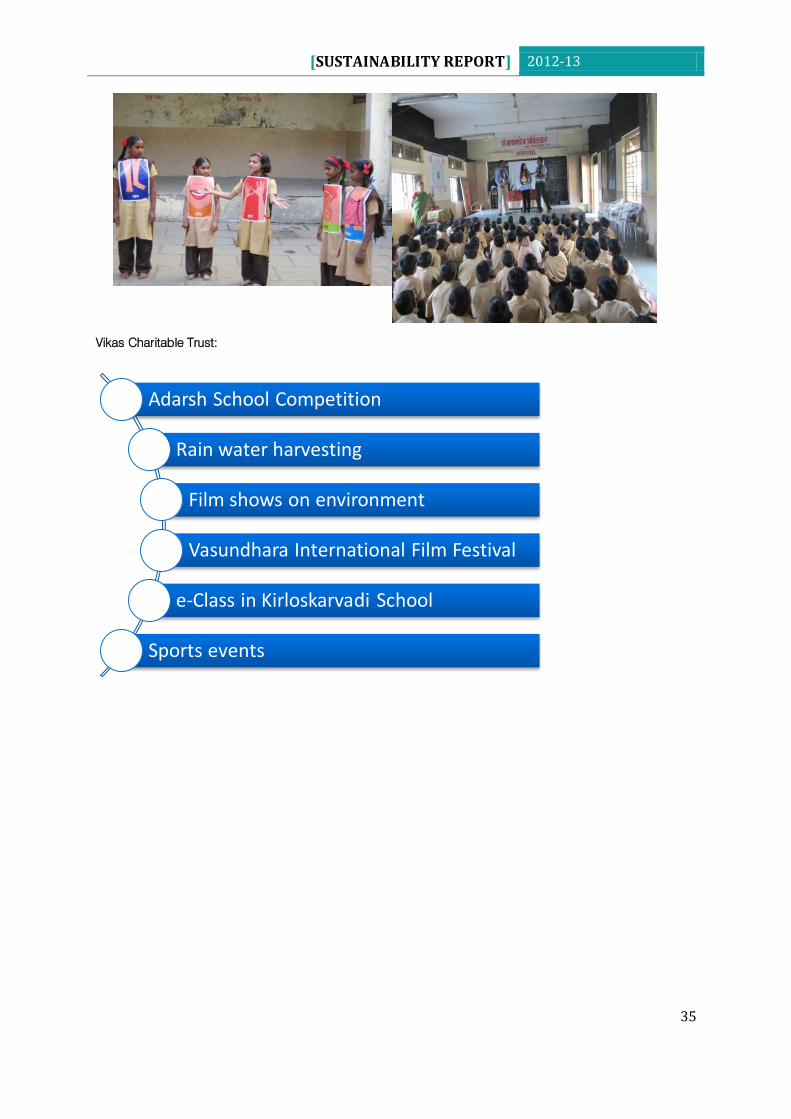
Water Sanitation & Hygiene (WASH) program
25% of the child death in India can be avoided by good sanitation practices. Kirloskar WASH (Water
Sanitation and Hygiene) initiative explains the importance of sanitation and hygiene to children of
schools around Pune, Kirloskarvadi and Kondhapuri. KBL employees worked as volunteers in this
programme. The awareness programs for school children included cartoon videos on self-cleanliness,
participation in plays and lectures on adolescent hygiene by experts.
[SUSTAINABILITY REPORT] 2012-13
35
Vikas Charitable Trust:
Adarsh School Competition
Rain water harvesting
Film shows on environment
Vasundhara International Film Festival
e-Class in Kirloskarvadi School
Sports events
[SUSTAINABILITY REPORT] 2012-13
36
ECONOMIC PERFORMANCE
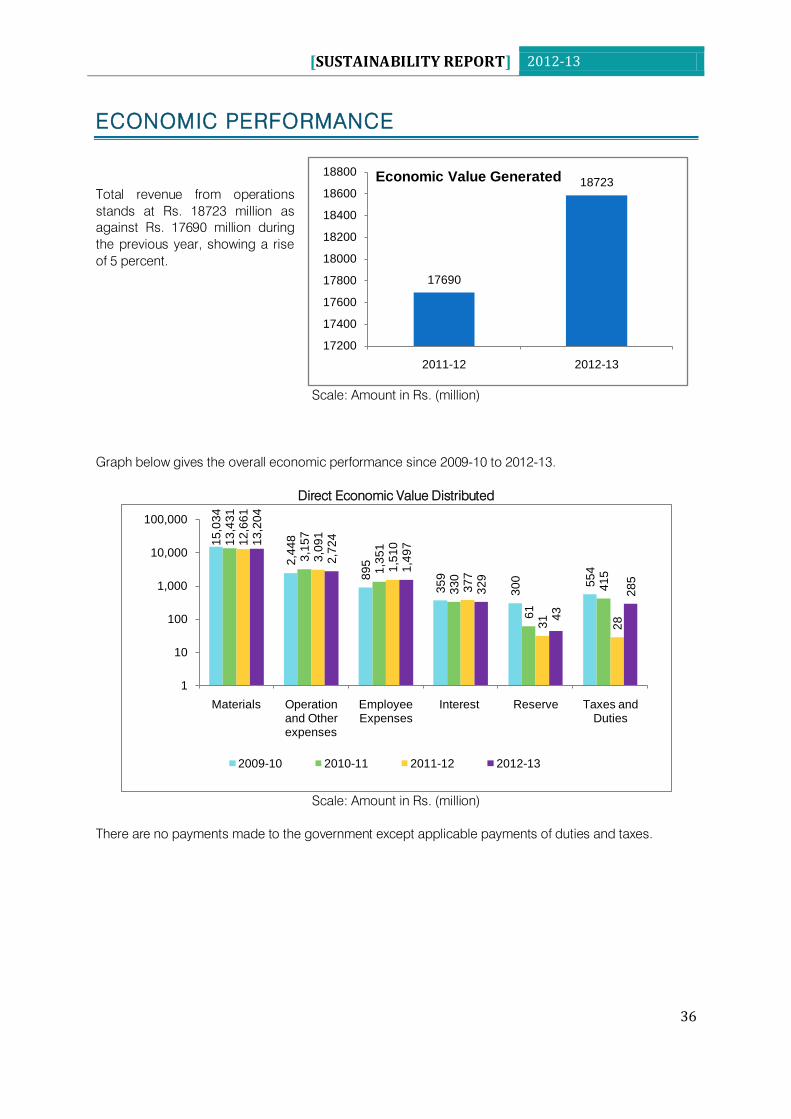
Total revenue from operations
stands at Rs. 18723 million as
against Rs. 17690 million during
the previous year, showing a rise
of 5 percent.
Scale: Amount in Rs. (million)
Graph below gives the overall economic performance since 2009-10 to 2012-13.
Direct Economic Value Distributed
Scale: Amount in Rs. (million)
There are no payments made to the government except applicable payments of duties and taxes.
15
,03
4
2,4
48
89
5
35
9
30
0 55
4
13
,43
1
3,1
57
1,3
51
33
0
61
41
5
12
,66
1
3,0
91
1,5
10
37
7
31
28
13
,20
4
2,7
24
1,4
97
32
9
43
28
5
1
10
100
1,000
10,000
100,000
Materials Operation and Other expenses
Employee Expenses
Interest Reserve Taxes and Duties
2009-10 2010-11 2011-12 2012-13
17690
18723
17200
17400
17600
17800
18000
18200
18400
18600
18800
2011-12 2012-13
Economic Value Generated
[SUSTAINABILITY REPORT] 2012-13
37
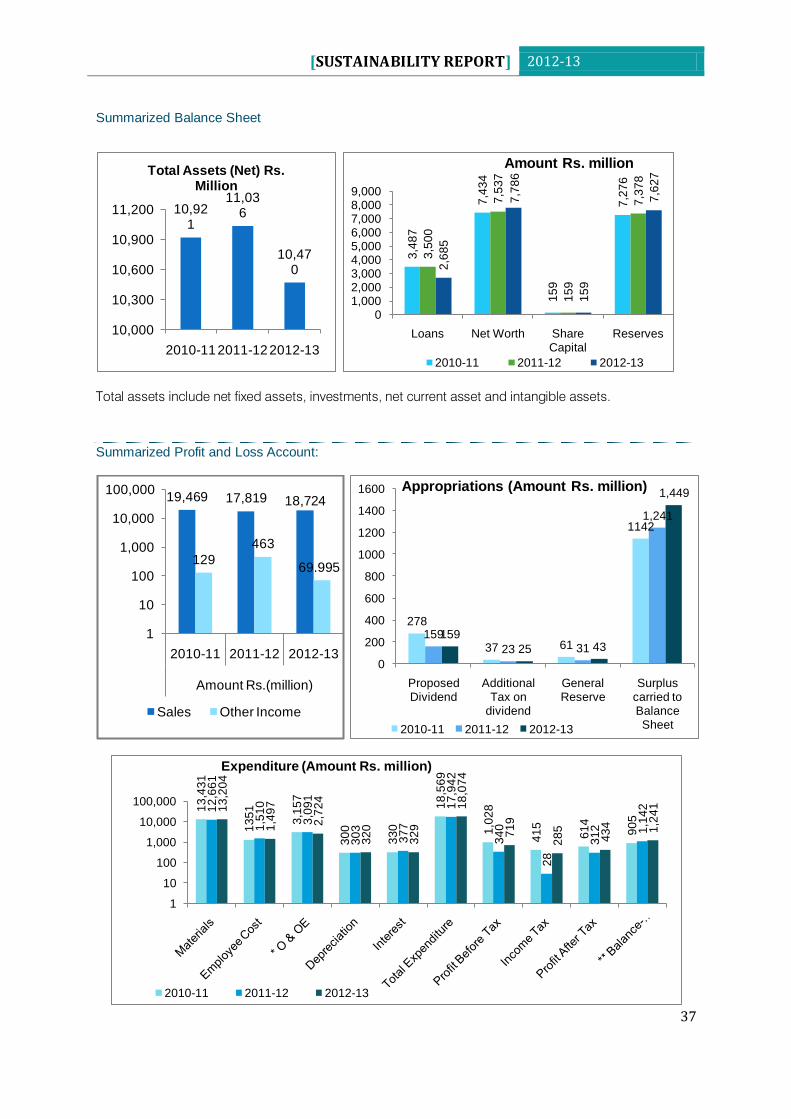
Summarized Balance Sheet
Total assets include net fixed assets, investments, net current asset and intangible assets.
Summarized Profit and Loss Account:
19,469 17,819 18,724
129
463
69.995
1
10
100
1,000
10,000
100,000
2010-11 2011-12 2012-13
Amount Rs.(million)
Sales Other Income
13
,43
1
13
51
3,1
57
30
0
33
0
18
,56
9
1,0
28
41
5
61
4
90
5
12
,66
1
1,5
10
3,0
91
30
3
37
7
17
,94
2
34
0
28
31
2 1,1
4213
,20
4
1,4
97
2,7
24
32
0
32
9
18
,07
4
71
9
28
5
43
4 1,2
41
1
10
100
1,000
10,000
100,000
Expenditure (Amount Rs. million)
2010-11 2011-12 2012-13
10,921
11,036
10,470
10,000
10,300
10,600
10,900
11,200
2010-112011-122012-13
Total Assets (Net) Rs. Million
3,4
87
7,4
34
15
9
7,2
76
3,5
00
7,5
37
15
9
7,3
78
2,6
85
7,7
86
15
9
7,6
27
01,0002,0003,0004,0005,0006,0007,0008,0009,000
Loans Net Worth Share Capital
Reserves
Amount Rs. million
2010-11 2011-12 2012-13
278
37 61
1142
159
23 31
1,241
159
25 43
1,449
0
200
400
600
800
1000
1200
1400
1600
Proposed Dividend
Additional Tax on
dividend
General Reserve
Surplus carried to Balance Sheet
Appropriations (Amount Rs. million)
2010-11 2011-12 2012-13
[SUSTAINABILITY REPORT] 2012-13
38
Risks and opportunit ies for the organization‟s activit ies due to climate change
Rapid depletion of water tables in some states may lead to need for deep bore a well pump
which is an opportunity. However total lack of availability of water is detrimental to pump
business.
Demand for water is increasing however due to climate change the availability of water is scarce.
This requires recycling of water through treatment of waste water. This will be an opportunity to
provide pumping systems for waste water treatment plants. Scarcity of water also results in
development of desalination plants, providing business opportunity for pumping systems.
Development of infrastructure investments and services for public benefit
Details of Economic value generated and distributed are presented in EC1 section. In addition to this we
have also done investments in infrastructure and services for the benefit of local communities. We have
approximately invested 4.31 million INR for public benefit. Our employees have contributed around
38032 man-hours for society development ativities.
[SUSTAINABILITY REPORT] 2012-13
39
ENVIRONMENTAL PERFORMANCE
M A T E R I A L S
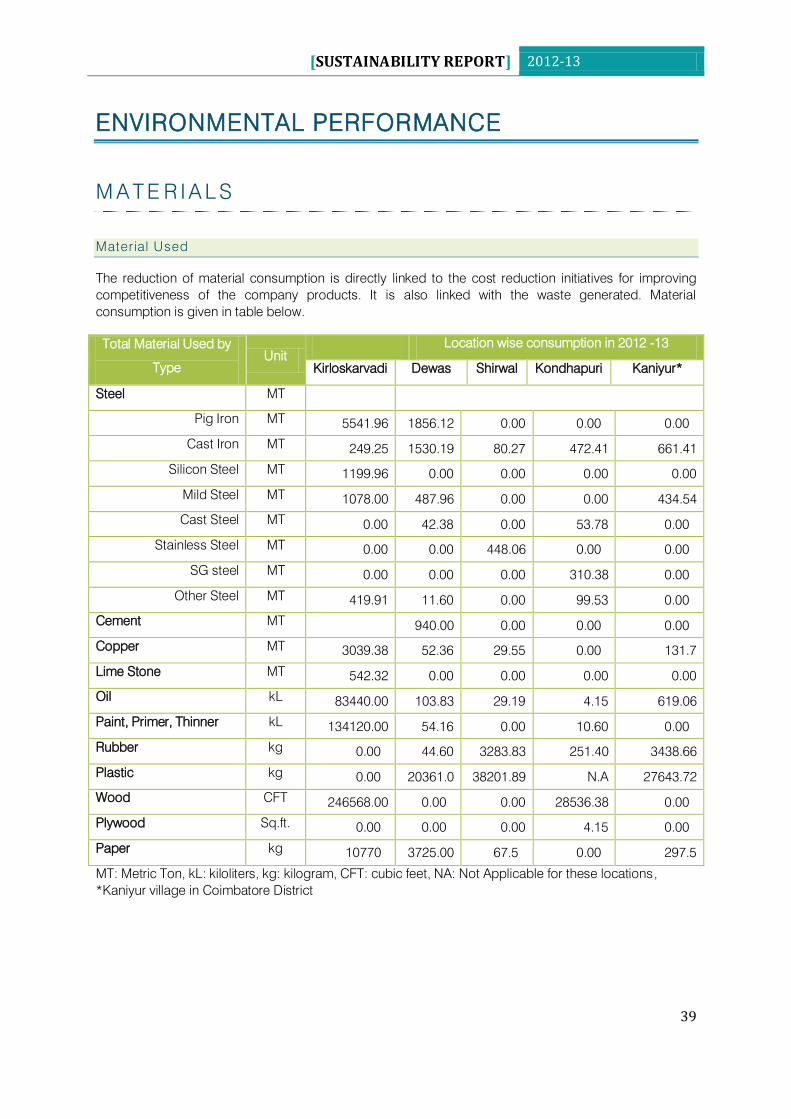
Material Used
The reduction of material consumption is directly linked to the cost reduction initiatives for improving
competitiveness of the company products. It is also linked with the waste generated. Material
consumption is given in table below.
Total Material Used by
Type
Unit
Location wise consumption in 2012 -13
Kirloskarvadi Dewas Shirwal Kondhapuri Kaniyur*
Steel MT
Pig Iron MT 5541.96 1856.12 0.00 0.00 0.00
Cast Iron MT 249.25 1530.19 80.27 472.41 661.41
Silicon Steel MT 1199.96 0.00 0.00 0.00 0.00
Mild Steel MT 1078.00 487.96 0.00 0.00 434.54
Cast Steel MT 0.00 42.38 0.00 53.78 0.00
Stainless Steel MT 0.00 0.00 448.06 0.00 0.00
SG steel MT 0.00 0.00 0.00 310.38 0.00
Other Steel MT 419.91 11.60 0.00 99.53 0.00
Cement MT
940.00 0.00 0.00 0.00
Copper MT 3039.38 52.36 29.55 0.00 131.7
Lime Stone MT 542.32 0.00 0.00 0.00 0.00
Oil kL 83440.00 103.83 29.19 4.15 619.06
Paint, Primer, Thinner kL 134120.00 54.16 0.00 10.60 0.00
Rubber kg 0.00 44.60 3283.83 251.40 3438.66
Plastic kg 0.00 20361.0 38201.89 N.A 27643.72
Wood CFT 246568.00 0.00 0.00 28536.38 0.00
Plywood Sq.ft. 0.00 0.00 0.00 4.15 0.00
Paper kg 10770 3725.00 67.5 0.00 297.5
MT: Metric Ton, kL: kiloliters, kg: kilogram, CFT: cubic feet, NA: Not Applicable for these locations,
*Kaniyur village in Coimbatore District
[SUSTAINABILITY REPORT] 2012-13
40
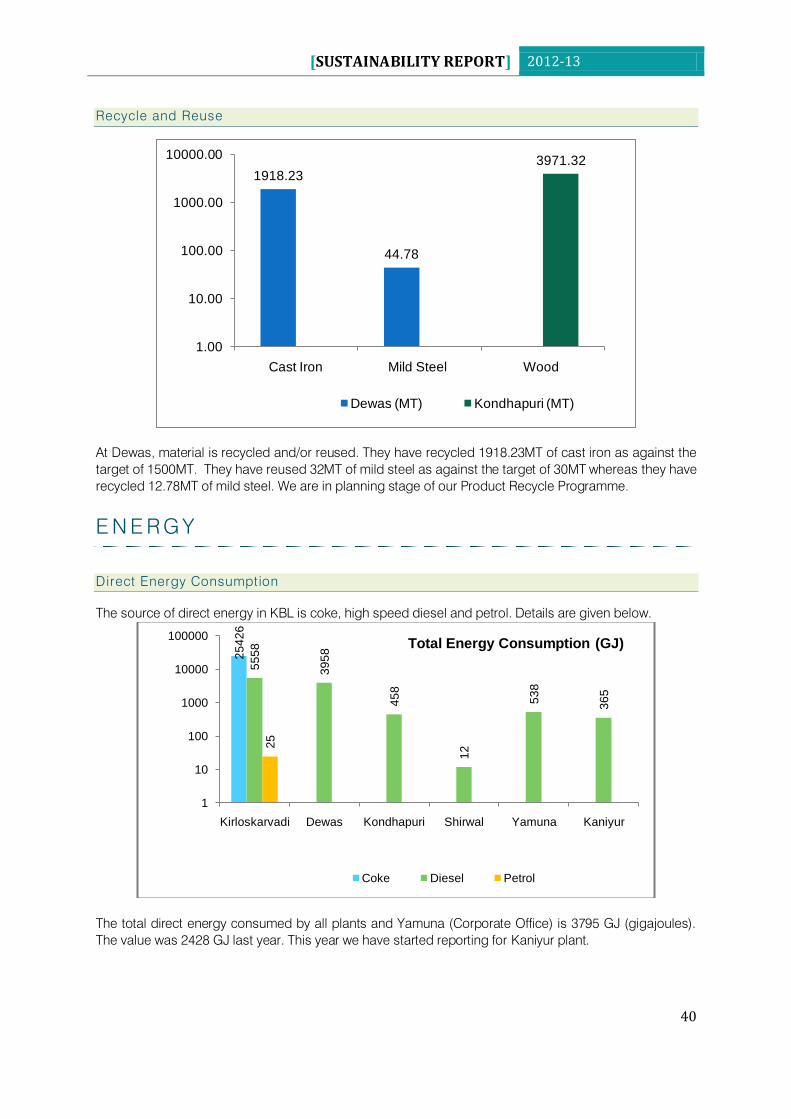
Recycle and Reuse
At Dewas, material is recycled and/or reused. They have recycled 1918.23MT of cast iron as against the
target of 1500MT. They have reused 32MT of mild steel as against the target of 30MT whereas they have
recycled 12.78MT of mild steel. We are in planning stage of our Product Recycle Programme.
E N E R G Y
Direct Energy Consumption
The source of direct energy in KBL is coke, high speed diesel and petrol. Details are given below.
The total direct energy consumed by all plants and Yamuna (Corporate Office) is 3795 GJ (gigajoules).
The value was 2428 GJ last year. This year we have started reporting for Kaniyur plant.
1918.23
44.78
3971.32
1.00
10.00
100.00
1000.00
10000.00
Cast Iron Mild Steel Wood
Dewas (MT) Kondhapuri (MT)
25
42
6
55
58
39
58
45
8
12
53
8
36
5
25
1
10
100
1000
10000
100000
Kirloskarvadi Dewas Kondhapuri Shirwal Yamuna Kaniyur
Total Energy Consumption (GJ)
Coke Diesel Petrol
[SUSTAINABILITY REPORT] 2012-13
41
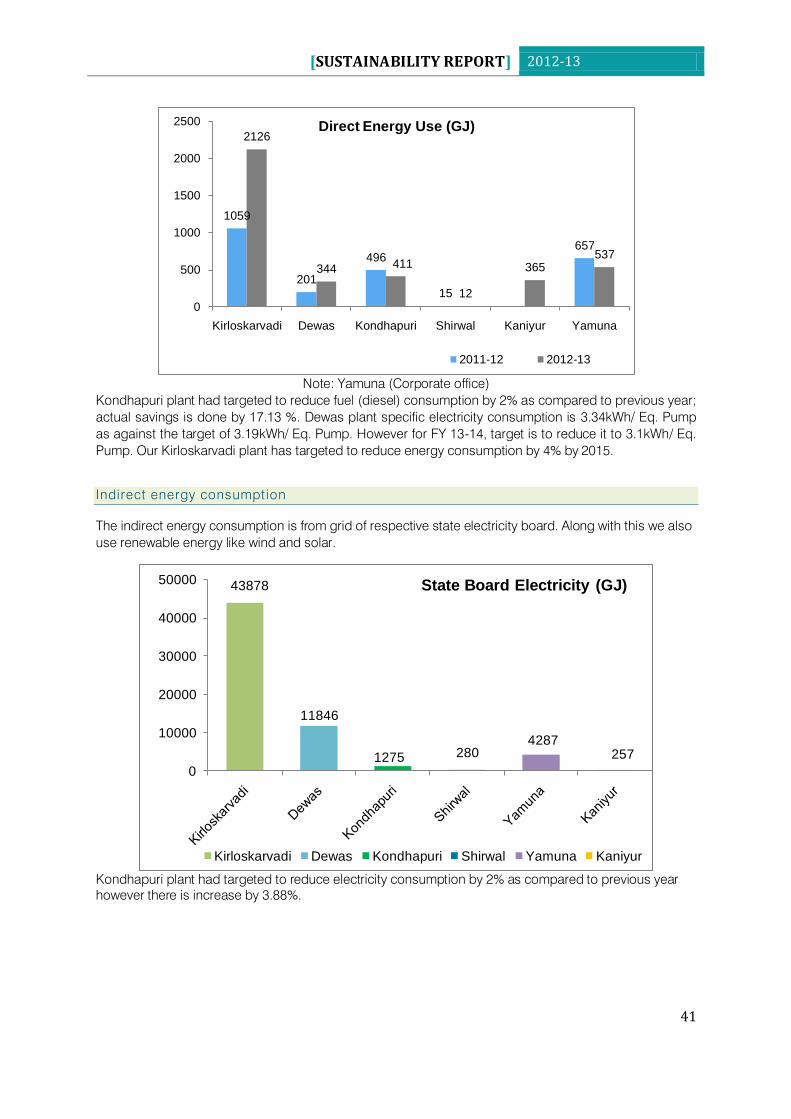
Note: Yamuna (Corporate office)
Kondhapuri plant had targeted to reduce fuel (diesel) consumption by 2% as compared to previous year;
actual savings is done by 17.13 %. Dewas plant specific electricity consumption is 3.34kWh/ Eq. Pump
as against the target of 3.19kWh/ Eq. Pump. However for FY 13-14, target is to reduce it to 3.1kWh/ Eq.
Pump. Our Kirloskarvadi plant has targeted to reduce energy consumption by 4% by 2015.
Indirect energy consumption
The indirect energy consumption is from grid of respective state electricity board. Along with this we also
use renewable energy like wind and solar.
Kondhapuri plant had targeted to reduce electricity consumption by 2% as compared to previous year
however there is increase by 3.88%.
1059
201
496
15
657
2126
344 411
12
365537
0
500
1000
1500
2000
2500
Kirloskarvadi Dewas Kondhapuri Shirwal Kaniyur Yamuna
Direct Energy Use (GJ)
2011-12 2012-13
43878
11846
1275 2804287
257
0
10000
20000
30000
40000
50000 State Board Electricity (GJ)
Kirloskarvadi Dewas Kondhapuri Shirwal Yamuna Kaniyur
[SUSTAINABILITY REPORT] 2012-13
42
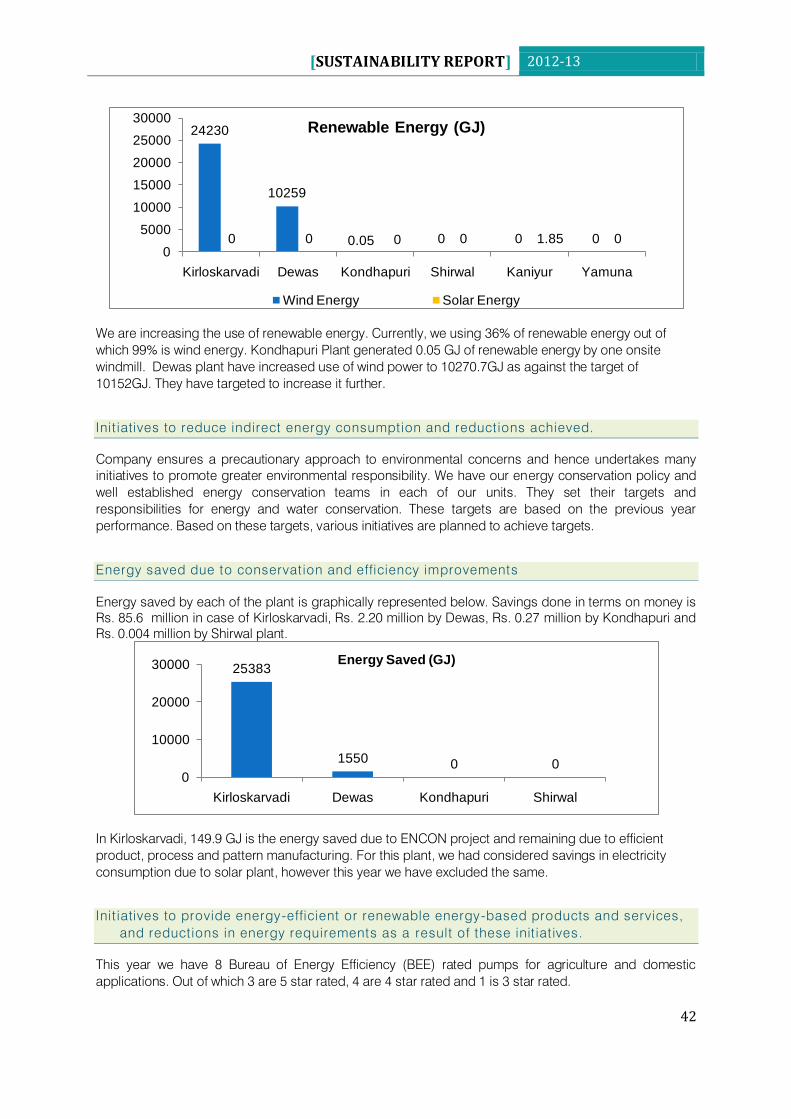
We are increasing the use of renewable energy. Currently, we using 36% of renewable energy out of
which 99% is wind energy. Kondhapuri Plant generated 0.05 GJ of renewable energy by one onsite
windmill. Dewas plant have increased use of wind power to 10270.7GJ as against the target of
10152GJ. They have targeted to increase it further.
Init iatives to reduce indirect energy consumption and reductions achieved.
Company ensures a precautionary approach to environmental concerns and hence undertakes many
initiatives to promote greater environmental responsibility. We have our energy conservation policy and
well established energy conservation teams in each of our units. They set their targets and
responsibilities for energy and water conservation. These targets are based on the previous year
performance. Based on these targets, various initiatives are planned to achieve targets.
Energy saved due to conservation and efficiency improvements
Energy saved by each of the plant is graphically represented below. Savings done in terms on money is
Rs. 85.6 million in case of Kirloskarvadi, Rs. 2.20 million by Dewas, Rs. 0.27 million by Kondhapuri and
Rs. 0.004 million by Shirwal plant.
In Kirloskarvadi, 149.9 GJ is the energy saved due to ENCON project and remaining due to efficient
product, process and pattern manufacturing. For this plant, we had considered savings in electricity
consumption due to solar plant, however this year we have excluded the same.
Init iatives to provide energy-efficient or renewable energy-based products and services,
and reductions in energy requirements as a result of these init iat ives.
This year we have 8 Bureau of Energy Efficiency (BEE) rated pumps for agriculture and domestic
applications. Out of which 3 are 5 star rated, 4 are 4 star rated and 1 is 3 star rated.
24230
10259
0.05 0 0 00 0 0 0 1.85 00
5000
10000
15000
20000
25000
30000
Kirloskarvadi Dewas Kondhapuri Shirwal Kaniyur Yamuna
Renewable Energy (GJ)
Wind Energy Solar Energy
25383
1550 0 00
10000
20000
30000
Kirloskarvadi Dewas Kondhapuri Shirwal
Energy Saved (GJ)
[SUSTAINABILITY REPORT] 2012-13
43
W A T E R
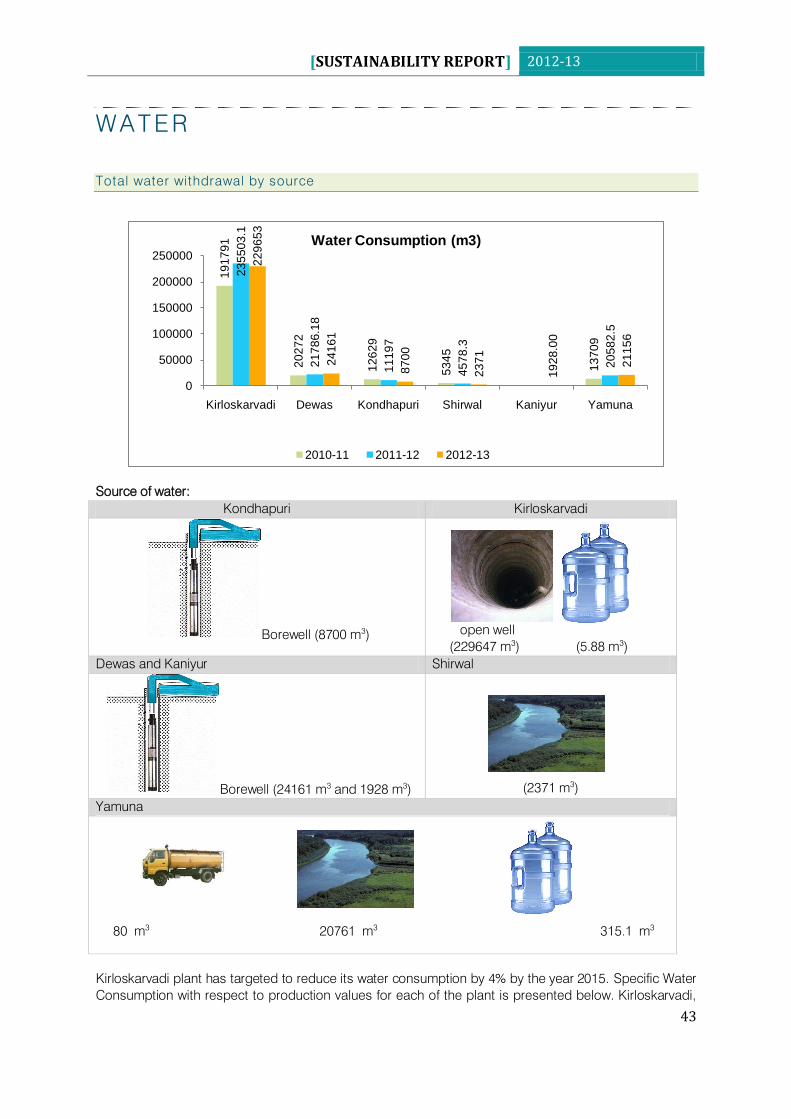
Total water withdrawal by source
Source of water:
Kondhapuri Kirloskarvadi
Borewell (8700 m3)
open well
(229647 m3) (5.88 m
3)
Dewas and Kaniyur Shirwal
Borewell (24161 m3 and 1928 m
3)
(2371 m3)
Yamuna
80 m3 20761 m
3 315.1 m
3
Kirloskarvadi plant has targeted to reduce its water consumption by 4% by the year 2015. Specific Water
Consumption with respect to production values for each of the plant is presented below. Kirloskarvadi,
19
17
91
20
27
2
12
62
9
53
45
13
70
9
23
55
03
.1
21
78
6.1
8
11
19
7
45
78
.3
20
58
2.5
22
96
53
24
16
1
87
00
23
71
19
28
.00
21
15
6
0
50000
100000
150000
200000
250000
Kirloskarvadi Dewas Kondhapuri Shirwal Kaniyur Yamuna
Water Consumption (m3)
2010-11 2011-12 2012-13
[SUSTAINABILITY REPORT] 2012-13
44
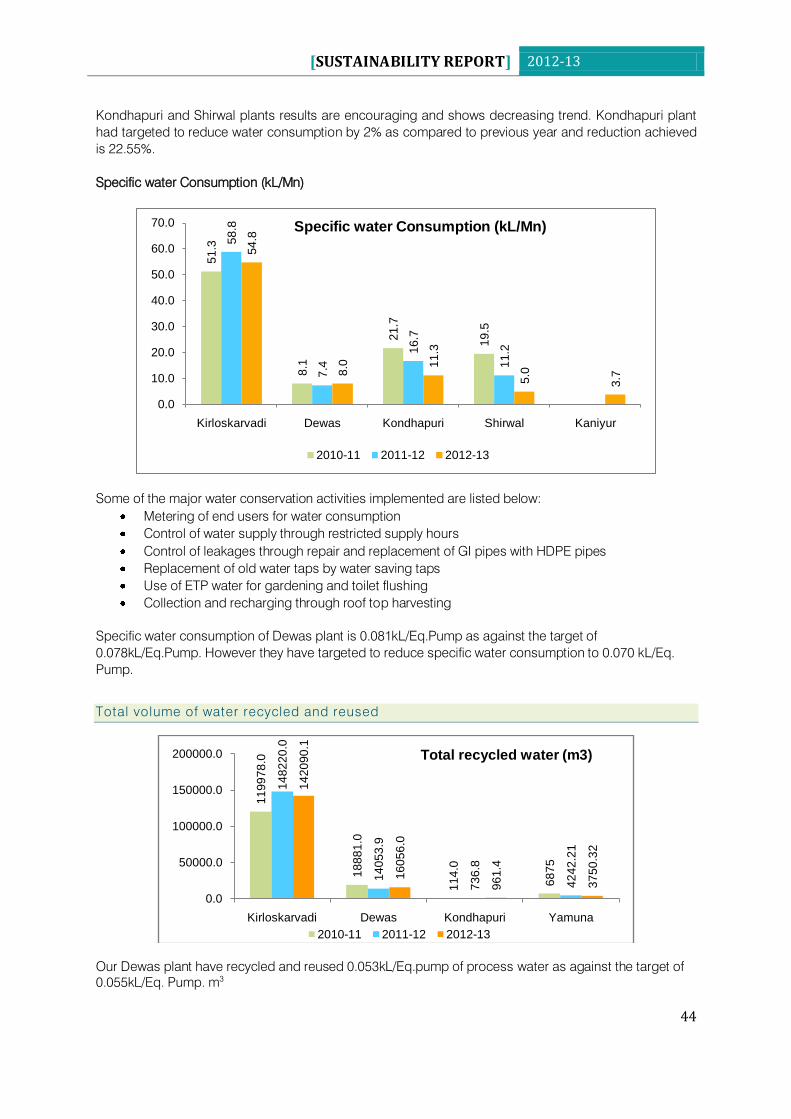
Kondhapuri and Shirwal plants results are encouraging and shows decreasing trend. Kondhapuri plant
had targeted to reduce water consumption by 2% as compared to previous year and reduction achieved
is 22.55%.
Specific water Consumption (kL/Mn)
Some of the major water conservation activities implemented are listed below:
Metering of end users for water consumption
Control of water supply through restricted supply hours
Control of leakages through repair and replacement of GI pipes with HDPE pipes
Replacement of old water taps by water saving taps
Use of ETP water for gardening and toilet flushing
Collection and recharging through roof top harvesting
Specific water consumption of Dewas plant is 0.081kL/Eq.Pump as against the target of
0.078kL/Eq.Pump. However they have targeted to reduce specific water consumption to 0.070 kL/Eq.
Pump.
Total volume of water recycled and reused
Our Dewas plant have recycled and reused 0.053kL/Eq.pump of process water as against the target of
0.055kL/Eq. Pump. m3
51
.3
8.1
21
.7
19
.5
58
.8
7.4
16
.7
11
.2
54
.8
8.0 1
1.3
5.0
3.7
0.0
10.0
20.0
30.0
40.0
50.0
60.0
70.0
Kirloskarvadi Dewas Kondhapuri Shirwal Kaniyur
Specific water Consumption (kL/Mn)
2010-11 2011-12 2012-13
11
99
78
.0
18
88
1.0
11
4.0
68
75
14
82
20
.0
14
05
3.9
73
6.8
42
42
.21
14
20
90
.1
16
05
6.0
96
1.4
37
50
.32
0.0
50000.0
100000.0
150000.0
200000.0
Kirloskarvadi Dewas Kondhapuri Yamuna
Total recycled water (m3)
2010-11 2011-12 2012-13
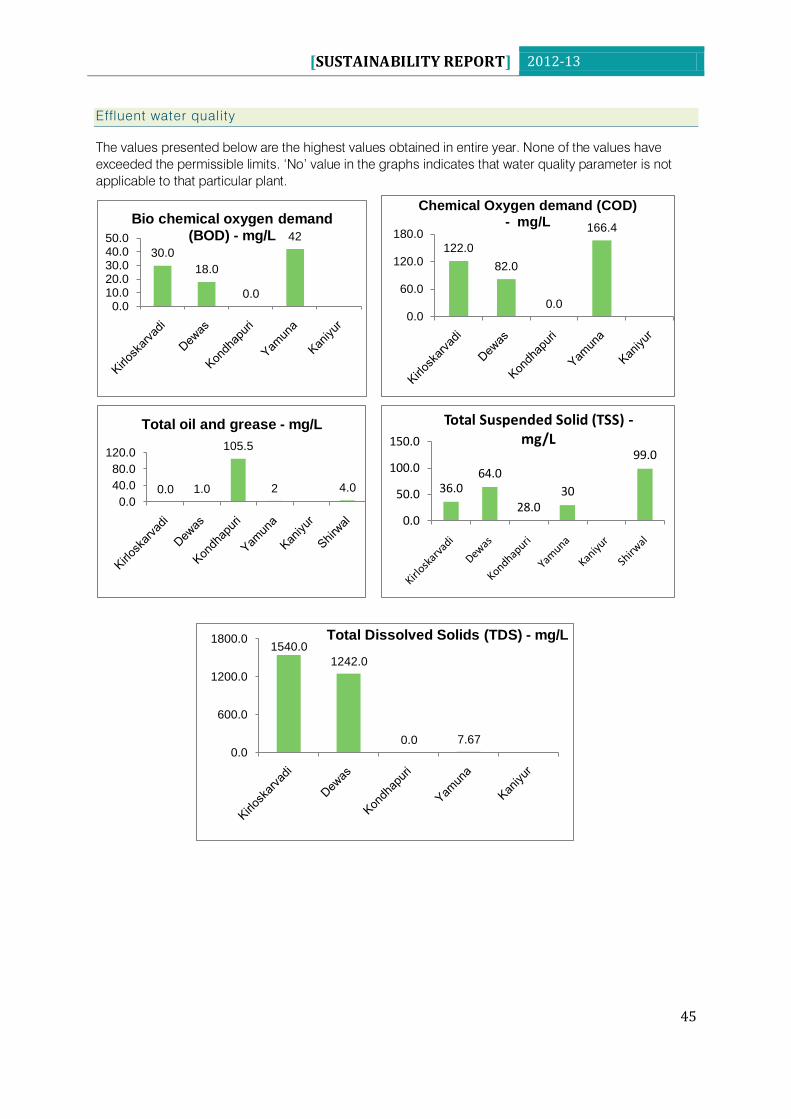
[SUSTAINABILITY REPORT] 2012-13
45
Effluent water quality
The values presented below are the highest values obtained in entire year. None of the values have
exceeded the permissible limits. „No‟ value in the graphs indicates that water quality parameter is not
applicable to that particular plant.
36.064.0
28.030
99.0
0.0
50.0
100.0
150.0
Total Suspended Solid (TSS) -mg/L
30.0
18.0
0.0
42
0.010.020.030.040.050.0
Bio chemical oxygen demand (BOD) - mg/L
1540.0
1242.0
0.0 7.670.0
600.0
1200.0
1800.0 Total Dissolved Solids (TDS) - mg/L
122.0
82.0
0.0
166.4
0.0
60.0
120.0
180.0
Chemical Oxygen demand (COD) - mg/L
0.0 1.0
105.5
2 4.0
0.0
40.0
80.0
120.0
Total oil and grease - mg/L
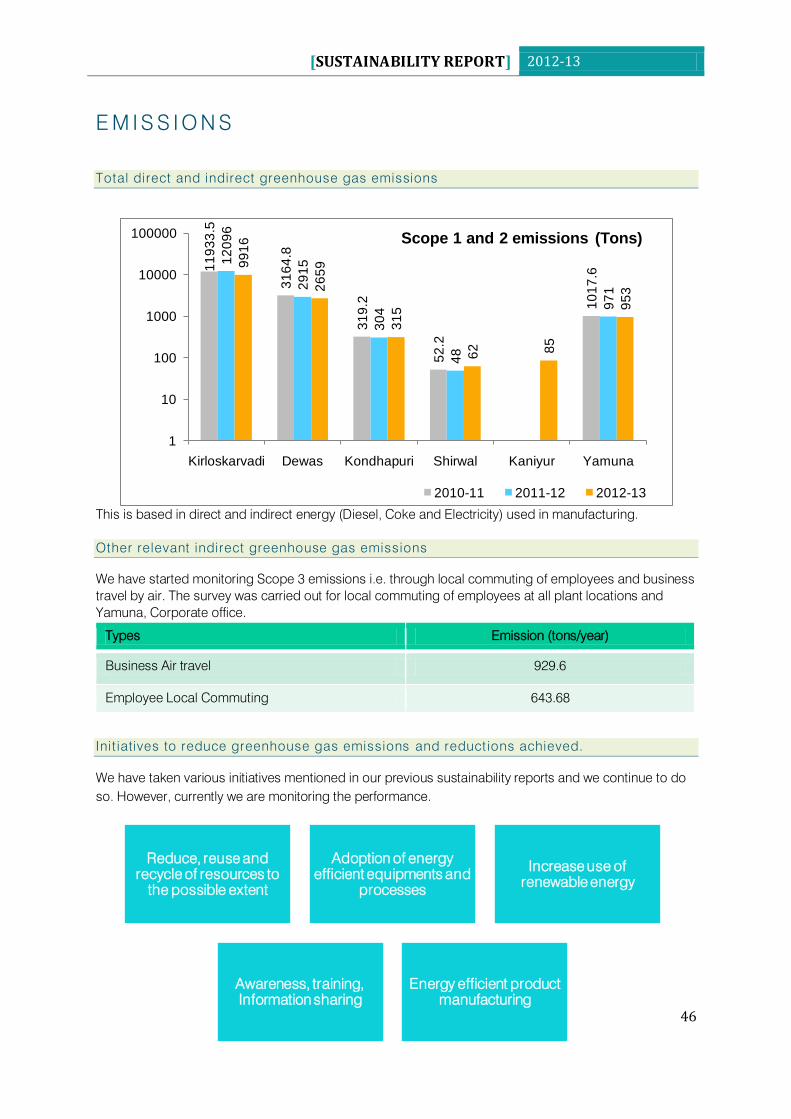
[SUSTAINABILITY REPORT] 2012-13
46
E M I S S I O N S
Total direct and indirect greenhouse gas emissions
This is based in direct and indirect energy (Diesel, Coke and Electricity) used in manufacturing.
Other relevant indirect greenhouse gas emissions
We have started monitoring Scope 3 emissions i.e. through local commuting of employees and business
travel by air. The survey was carried out for local commuting of employees at all plant locations and
Yamuna, Corporate office.
Types Emission (tons/year)
Business Air travel 929.6
Employee Local Commuting 643.68
Init iatives to reduce greenhouse gas emissions and reductions achieved.
We have taken various initiatives mentioned in our previous sustainability reports and we continue to do
so. However, currently we are monitoring the performance.
11
93
3.5
31
64
.8
31
9.2
52
.2
10
17
.6
12
09
6
29
15
30
4
48
97
1
99
16
26
59
31
5
62 85
95
3
1
10
100
1000
10000
100000
Kirloskarvadi Dewas Kondhapuri Shirwal Kaniyur Yamuna
Scope 1 and 2 emissions (Tons)
2010-11 2011-12 2012-13
Reduce, reuse and
recycle of resources to
the possible extent
Adoption of energy
efficient equipments and
processes
Increase use of
renewable energy
Awareness, training,
Information sharing
Energy efficient product
manufacturing
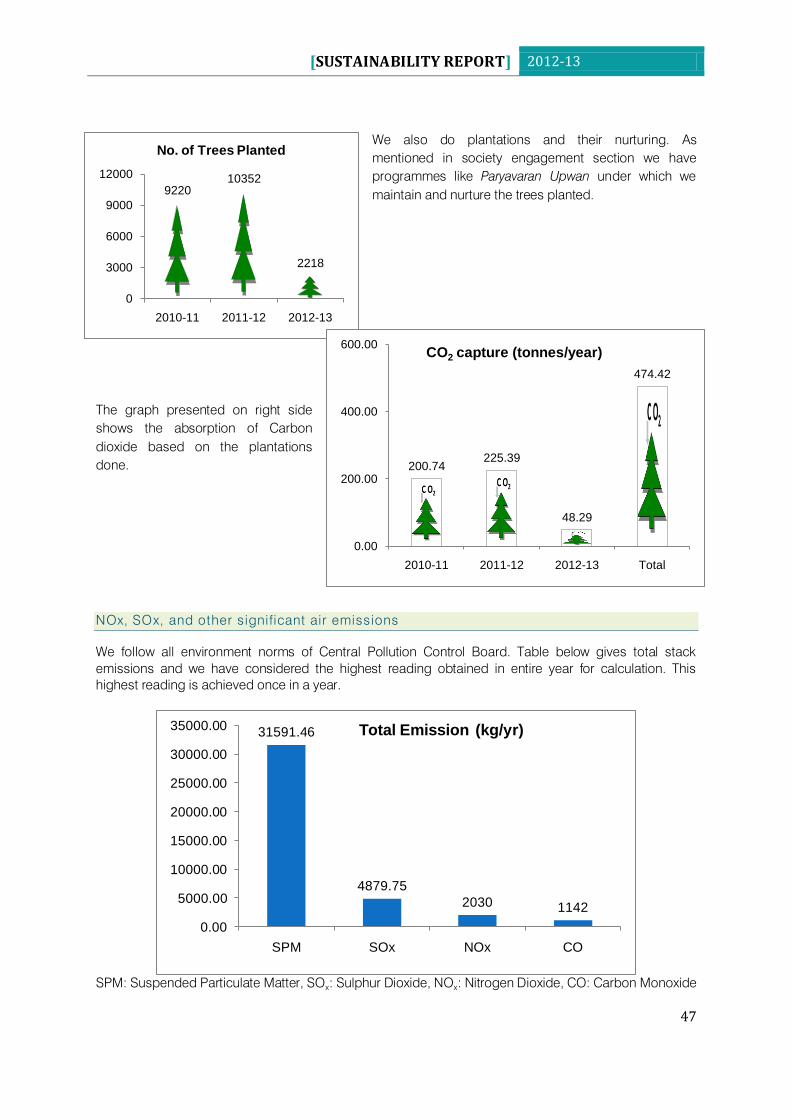
[SUSTAINABILITY REPORT] 2012-13
47
922010352
2218
0
3000
6000
9000
12000
2010-11 2011-12 2012-13
No. of Trees Planted
200.74225.39
48.29
474.42
0.00
200.00
400.00
600.00
2010-11 2011-12 2012-13 Total
CO2 capture (tonnes/year)
We also do plantations and their nurturing. As
mentioned in society engagement section we have
programmes like Paryavaran Upwan under which we
maintain and nurture the trees planted.
The graph presented on right side
shows the absorption of Carbon
dioxide based on the plantations
done.
NOx, SOx, and other significant air emissions
We follow all environment norms of Central Pollution Control Board. Table below gives total stack
emissions and we have considered the highest reading obtained in entire year for calculation. This
highest reading is achieved once in a year.
SPM: Suspended Particulate Matter, SOx: Sulphur Dioxide, NO
x: Nitrogen Dioxide, CO: Carbon Monoxide
31591.46
4879.75
2030 1142
0.00
5000.00
10000.00
15000.00
20000.00
25000.00
30000.00
35000.00
SPM SOx NOx CO
Total Emission (kg/yr)
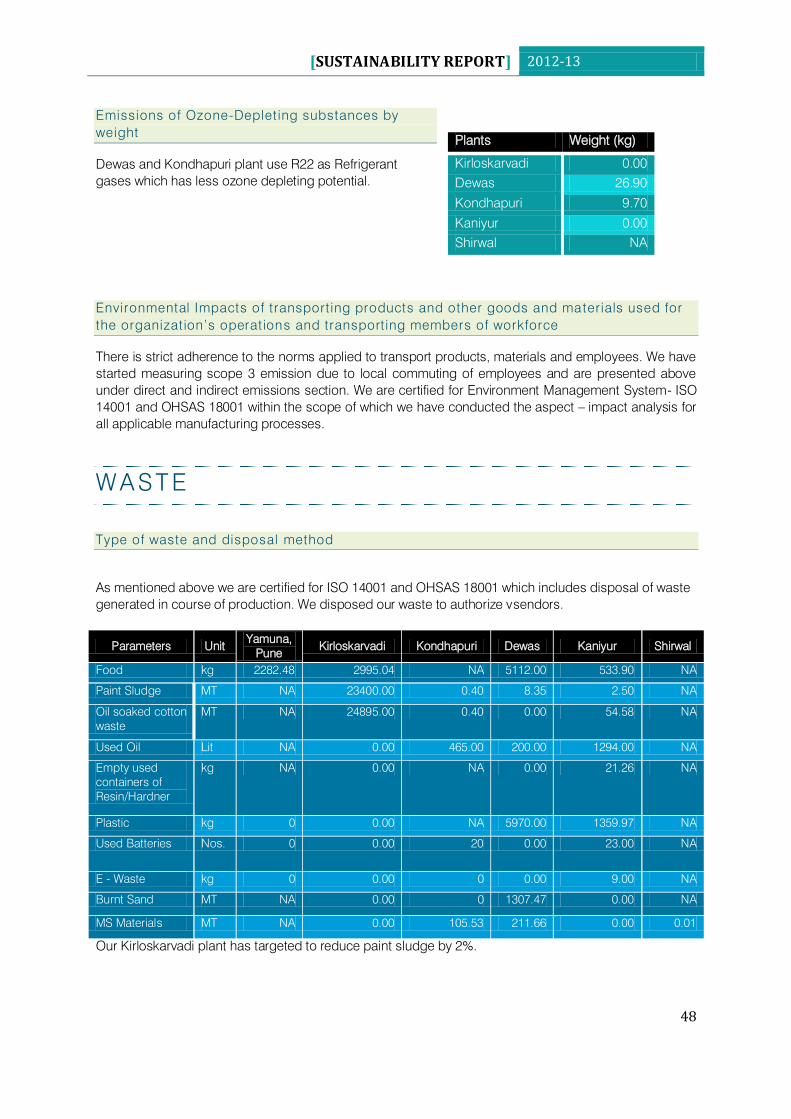
[SUSTAINABILITY REPORT] 2012-13
48
Emissions of Ozone-Depleting substances by
weight
Dewas and Kondhapuri plant use R22 as Refrigerant
gases which has less ozone depleting potential.
Environmental Impacts of transport ing products and other goods and materials used for
the organization‟s operations and transport ing members of workforce
There is strict adherence to the norms applied to transport products, materials and employees. We have
started measuring scope 3 emission due to local commuting of employees and are presented above
under direct and indirect emissions section. We are certified for Environment Management System- ISO
14001 and OHSAS 18001 within the scope of which we have conducted the aspect – impact analysis for
all applicable manufacturing processes.
W A ST E
Type of waste and disposal method
As mentioned above we are certified for ISO 14001 and OHSAS 18001 which includes disposal of waste
generated in course of production. We disposed our waste to authorize vsendors.
Parameters Unit Yamuna,
Pune Kirloskarvadi Kondhapuri Dewas Kaniyur Shirwal
Food kg 2282.48 2995.04 NA 5112.00 533.90 NA
Paint Sludge MT NA 23400.00 0.40 8.35 2.50 NA
Oil soaked cotton
waste
MT NA 24895.00 0.40 0.00 54.58 NA
Used Oil Lit NA 0.00 465.00 200.00 1294.00 NA
Empty used
containers of
Resin/Hardner
kg NA 0.00 NA 0.00 21.26 NA
Plastic kg 0 0.00 NA 5970.00 1359.97 NA
Used Batteries Nos. 0 0.00 20 0.00 23.00 NA
E - Waste kg 0 0.00 0 0.00 9.00 NA
Burnt Sand MT NA 0.00 0 1307.47 0.00 NA
MS Materials MT NA 0.00 105.53 211.66 0.00 0.01
Our Kirloskarvadi plant has targeted to reduce paint sludge by 2%.
Plants Weight (kg)
Kirloskarvadi 0.00
Dewas 26.90
Kondhapuri 9.70
Kaniyur 0.00
Shirwal NA
[SUSTAINABILITY REPORT] 2012-13
49
Weight of transported, imported, exported or treated waste deemed hazardous under the
terms of Basel Convention
No hazardous wastes were imported or exported. However hazardous wastes generated in various
production processes like waste or used oil, non - ferrous metal, hazardous waste as defined in
Schedule - 4 of Hazardous waste (management & handling) Amendment Rules 2003 are sold to the
Ministry of Environment and Forests (MoEF) / Central Pollution Control Board (CPCB) registered cyclers/
re-refiners/re-processors only.
Percentage of products sold and their packaging materials that are reclaimed by
category
The company manufactures large variety of pumps from very small pumps for domestic applications to
custom designed pumps for large projects. We are making efforts to increase the use of packaging
material which are recyclable. We have started using such recyclable products for packaging in our
plants. Our products are serviceable and in case of operational problems either these are repaired at
ARC or authorised service centres. Such repairs result in most of the pump components reused and only
the defective parts are replaced. We have not reclaimed packaging material of our product. However, we
plan to establish a product recycle programme which will be extended to reclaiming of packaging
material as well.

[SUSTAINABILITY REPORT] 2012-13
50
SOCIAL PERFORMANCE
LABOUR PRACTICES AND DECENT WORK
Workforce
We strongly believe that people
development is organisational
development. We have integrated our
people plans with our strategies.
Human Resource team mutually supports
the work system through robust people
policies and procedures.
The number of total workforce is shown in
graph. Details of workforce by
employment type and location are
presented in table below:
Location
Employment
type
Kirloskarvadi Dewas Kondhapuri Kaniyur Shirwal Yamuna,
Pune
Staff 351 142 53 11 7 476
Workmen 501 451 29 0 25 17
Trainees 20 8 5 0 0 16
Temporary 2 9 19 7 0 7
Apprentice 116 20 16 0 3 0
Operator
Trainees
2 0 0 0 0 0
Earn &
Learn
265 0 7 0 0 0
Trainee
Sales
Officer
0 3 0 0 0 8
Contract
Manpower
703 176 30 41 24 65
Campus recruitment is also done from different parts of the country. Employees coming from different
geographical locations work on different projects. We have incorporated equal opportunity clause in
Code of Conduct. The year wise trend by employment type is given in the graph below:
3577
3635
3540
3560
3580
3600
3620
3640
2011-12 2012-13
Total Workforce (no.s)
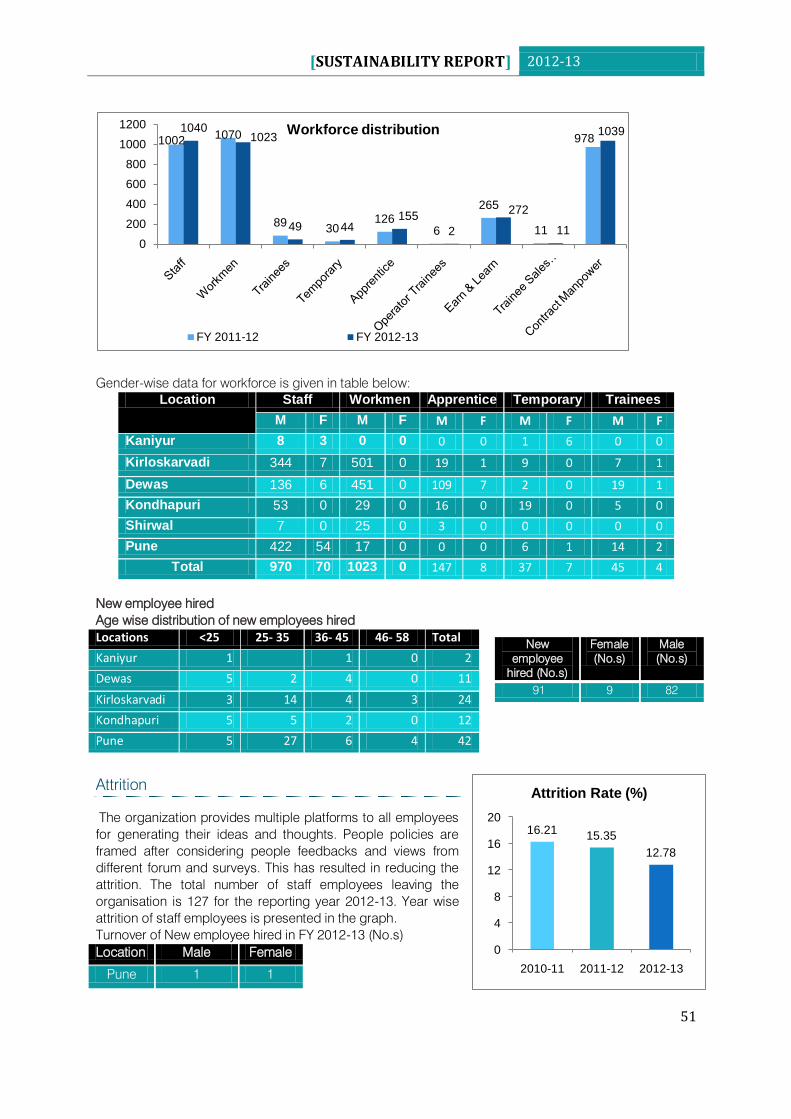
[SUSTAINABILITY REPORT] 2012-13
51
Gender-wise data for workforce is given in table below:
Location Staff Workmen Apprentice Temporary Trainees
M F M F M F M F M F
Kaniyur 8 3 0 0 0 0 1 6 0 0
Kirloskarvadi 344 7 501 0 19 1 9 0 7 1
Dewas 136 6 451 0 109 7 2 0 19 1
Kondhapuri 53 0 29 0 16 0 19 0 5 0
Shirwal 7 0 25 0 3 0 0 0 0 0
Pune 422 54 17 0 0 0 6 1 14 2
Total 970 70 1023 0 147 8 37 7 45 4
New employee hired
Age wise distribution of new employees hired
Locations <25 25- 35 36- 45 46- 58 Total
Kaniyur 1 1 0 2
Dewas 5 2 4 0 11
Kirloskarvadi 3 14 4 3 24
Kondhapuri 5 5 2 0 12
Pune 5 27 6 4 42
Attrition
The organization provides multiple platforms to all employees
for generating their ideas and thoughts. People policies are
framed after considering people feedbacks and views from
different forum and surveys. This has resulted in reducing the
attrition. The total number of staff employees leaving the
organisation is 127 for the reporting year 2012-13. Year wise
attrition of staff employees is presented in the graph.
Turnover of New employee hired in FY 2012-13 (No.s)
Location Male Female
Pune 1 1
New
employee
hired (No.s)
Female
(No.s)
Male
(No.s)
91 9 82
16.2115.35
12.78
0
4
8
12
16
20
2010-11 2011-12 2012-13
Attrition Rate (%)
10021070
8930
1266
265
11
9781040
1023
49 44155
2
272
11
1039
0
200
400
600
800
1000
1200 Workforce distribution
FY 2011-12 FY 2012-13
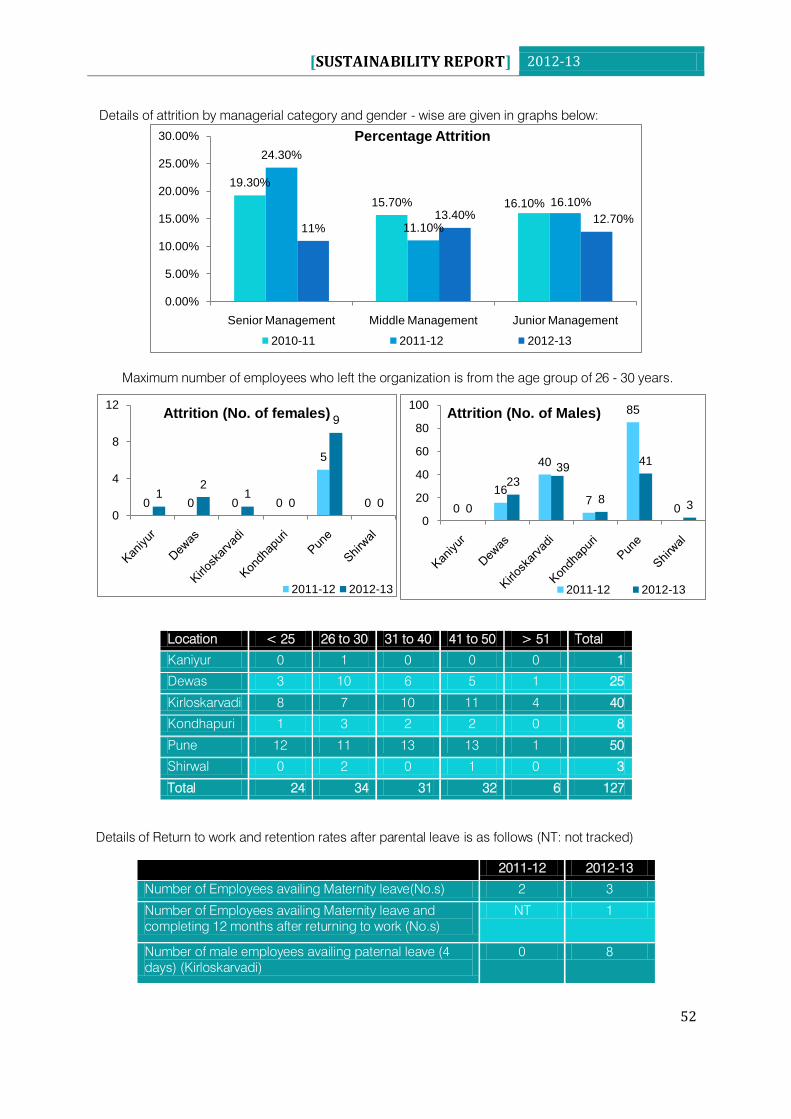
[SUSTAINABILITY REPORT] 2012-13
52
Details of attrition by managerial category and gender - wise are given in graphs below:
Maximum number of employees who left the organization is from the age group of 26 - 30 years.
Location < 25 26 to 30 31 to 40 41 to 50 > 51 Total
Kaniyur 0 1 0 0 0 1
Dewas 3 10 6 5 1 25
Kirloskarvadi 8 7 10 11 4 40
Kondhapuri 1 3 2 2 0 8
Pune 12 11 13 13 1 50
Shirwal 0 2 0 1 0 3
Total 24 34 31 32 6 127
Details of Return to work and retention rates after parental leave is as follows (NT: not tracked)
19.30%
15.70% 16.10%
24.30%
11.10%
16.10%
11%13.40% 12.70%
0.00%
5.00%
10.00%
15.00%
20.00%
25.00%
30.00%
Senior Management Middle Management Junior Management
Percentage Attrition
2010-11 2011-12 2012-13
2011-12 2012-13
Number of Employees availing Maternity leave(No.s) 2 3
Number of Employees availing Maternity leave and
completing 12 months after returning to work (No.s)
NT 1
Number of male employees availing paternal leave (4
days) (Kirloskarvadi)
0 8
0 0 0 0
5
01
21
0
9
00
4
8
12Attrition (No. of females)
2011-12 2012-13
0
16
40
7
85
00
23
39
8
41
3
0
20
40
60
80
100Attrition (No. of Males)
2011-12 2012-13
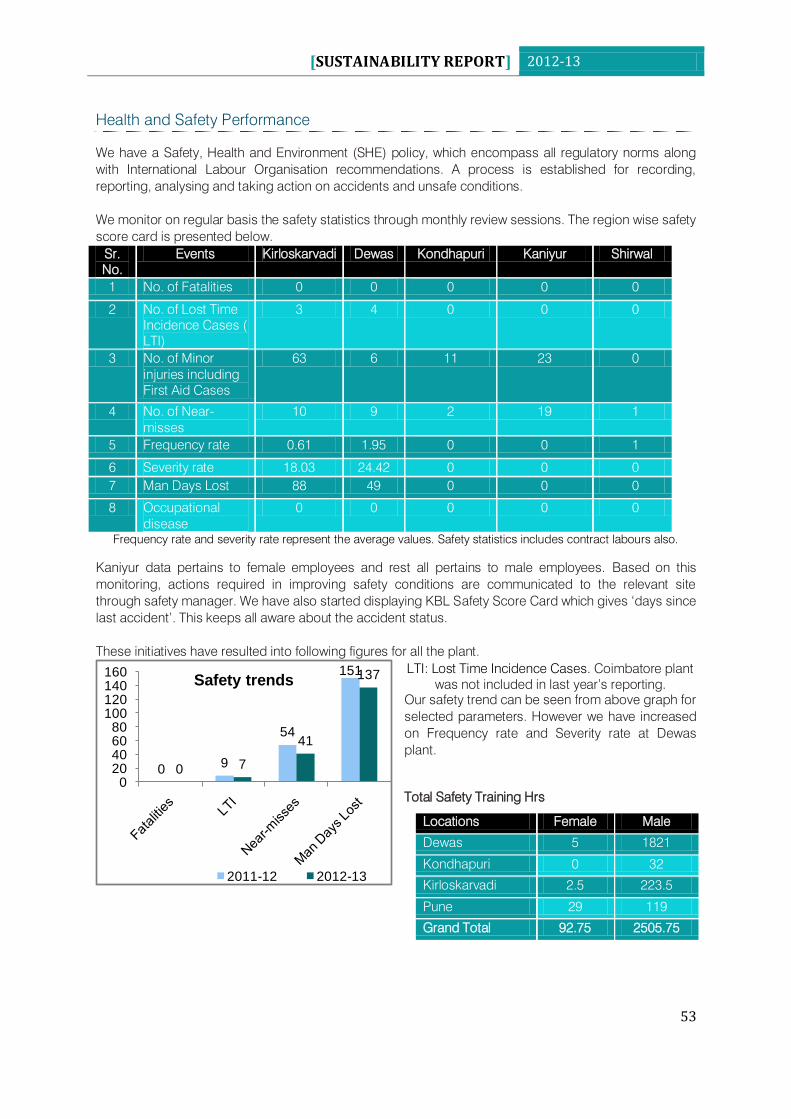
[SUSTAINABILITY REPORT] 2012-13
53
Health and Safety Performance
We have a Safety, Health and Environment (SHE) policy, which encompass all regulatory norms along
with International Labour Organisation recommendations. A process is established for recording,
reporting, analysing and taking action on accidents and unsafe conditions.
We monitor on regular basis the safety statistics through monthly review sessions. The region wise safety
score card is presented below.
Sr.
No.
Events Kirloskarvadi Dewas Kondhapuri Kaniyur Shirwal
1 No. of Fatalities 0 0 0 0 0
2 No. of Lost Time
Incidence Cases (
LTI)
3 4 0 0 0
3 No. of Minor
injuries including
First Aid Cases
63 6 11 23 0
4 No. of Near-
misses
10 9 2 19 1
5 Frequency rate 0.61 1.95 0 0 1
6 Severity rate 18.03 24.42 0 0 0
7 Man Days Lost 88 49 0 0 0
8 Occupational
disease
0 0 0 0 0
Frequency rate and severity rate represent the average values. Safety statistics includes contract labours also.
Kaniyur data pertains to female employees and rest all pertains to male employees. Based on this
monitoring, actions required in improving safety conditions are communicated to the relevant site
through safety manager. We have also started displaying KBL Safety Score Card which gives „days since
last accident‟. This keeps all aware about the accident status.
These initiatives have resulted into following figures for all the plant.
LTI: Lost Time Incidence Cases. Coimbatore plant
was not included in last year‟s reporting.
Our safety trend can be seen from above graph for
selected parameters. However we have increased
on Frequency rate and Severity rate at Dewas
plant.
Total Safety Training Hrs
Locations Female Male
Dewas 5 1821
Kondhapuri 0 32
Kirloskarvadi 2.5 223.5
Pune 29 119
Grand Total 92.75 2505.75
0 9
54
151
0 7
41
137
020406080
100120140160
Safety trends
2011-12 2012-13
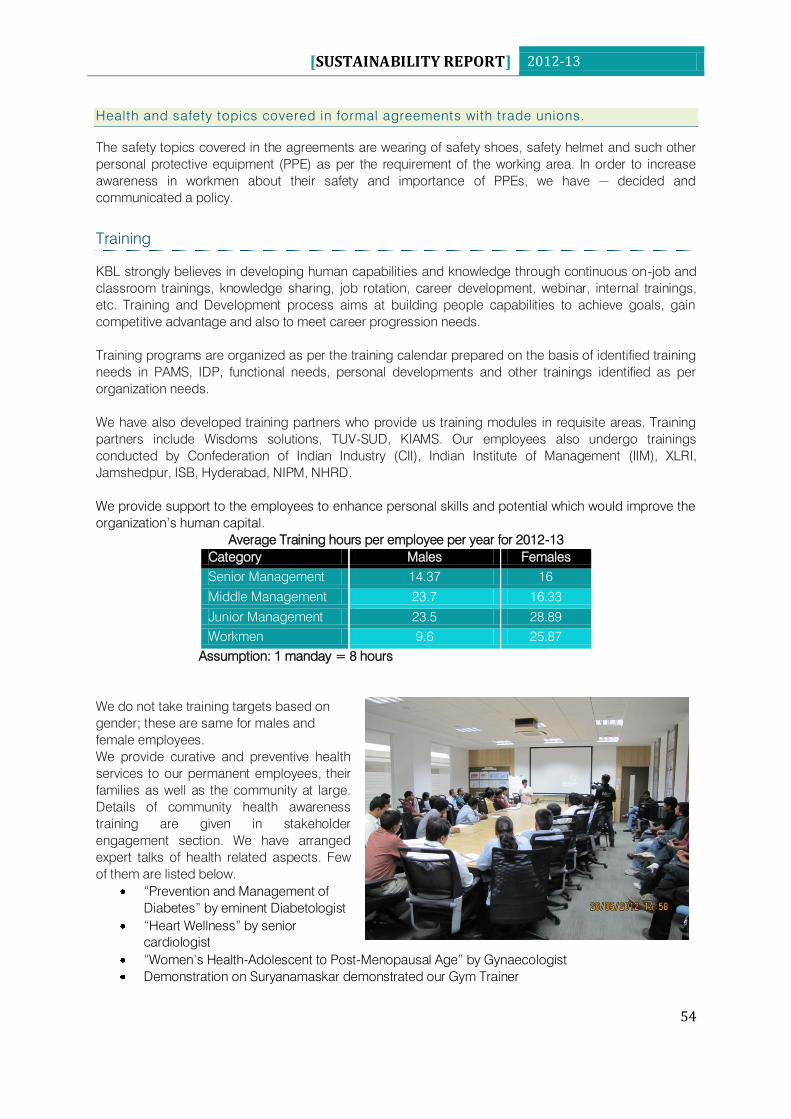
[SUSTAINABILITY REPORT] 2012-13
54
Health and safety topics covered in formal agreements with trade unions.
The safety topics covered in the agreements are wearing of safety shoes, safety helmet and such other
personal protective equipment (PPE) as per the requirement of the working area. In order to increase
awareness in workmen about their safety and importance of PPEs, we have decided and
communicated a policy.
Training
KBL strongly believes in developing human capabilities and knowledge through continuous on-job and
classroom trainings, knowledge sharing, job rotation, career development, webinar, internal trainings,
etc. Training and Development process aims at building people capabilities to achieve goals, gain
competitive advantage and also to meet career progression needs.
Training programs are organized as per the training calendar prepared on the basis of identified training
needs in PAMS, IDP, functional needs, personal developments and other trainings identified as per
organization needs.
We have also developed training partners who provide us training modules in requisite areas. Training
partners include Wisdoms solutions, TUV-SUD, KIAMS. Our employees also undergo trainings
conducted by Confederation of Indian Industry (CII), Indian Institute of Management (IIM), XLRI,
Jamshedpur, ISB, Hyderabad, NIPM, NHRD.
We provide support to the employees to enhance personal skills and potential which would improve the
organization‟s human capital.
Average Training hours per employee per year for 2012-13
Category Males Females
Senior Management 14.37 16
Middle Management 23.7 16.33
Junior Management 23.5 28.89
Workmen 9.6 25.87
Assumption: 1 manday = 8 hours
We do not take training targets based on
gender; these are same for males and
female employees.
We provide curative and preventive health
services to our permanent employees, their
families as well as the community at large.
Details of community health awareness
training are given in stakeholder
engagement section. We have arranged
expert talks of health related aspects. Few
of them are listed below.
“Prevention and Management of
Diabetes” by eminent Diabetologist
“Heart Wellness” by senior
cardiologist
“Women‟s Health-Adolescent to Post-Menopausal Age” by Gynaecologist
Demonstration on Suryanamaskar demonstrated our Gym Trainer
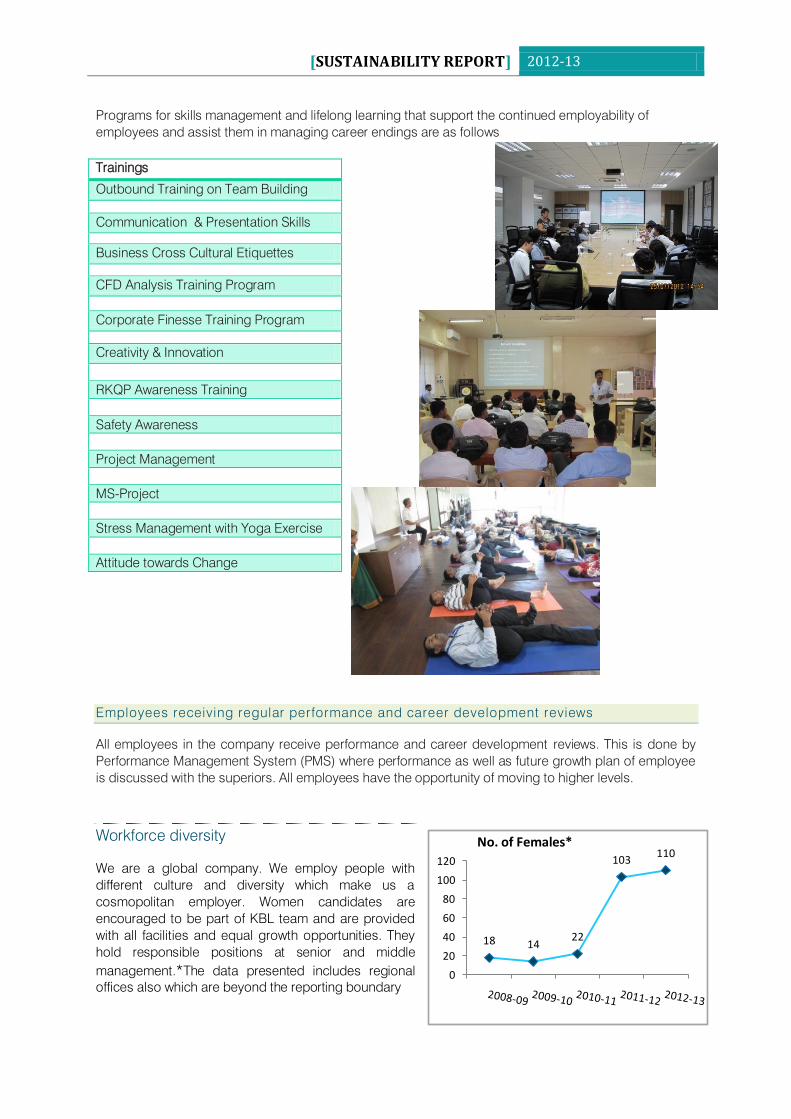
[SUSTAINABILITY REPORT] 2012-13
55
Programs for skills management and lifelong learning that support the continued employability of
employees and assist them in managing career endings are as follows
Employees receiving regular performance and career development reviews
All employees in the company receive performance and career development reviews. This is done by
Performance Management System (PMS) where performance as well as future growth plan of employee
is discussed with the superiors. All employees have the opportunity of moving to higher levels.
Workforce diversity
We are a global company. We employ people with
different culture and diversity which make us a
cosmopolitan employer. Women candidates are
encouraged to be part of KBL team and are provided
with all facilities and equal growth opportunities. They
hold responsible positions at senior and middle
management.*The data presented includes regional
offices also which are beyond the reporting boundary
Trainings
Outbound Training on Team Building
Communication & Presentation Skills
Business Cross Cultural Etiquettes
CFD Analysis Training Program
Corporate Finesse Training Program
Creativity & Innovation
RKQP Awareness Training
Safety Awareness
Project Management
MS-Project
Stress Management with Yoga Exercise
Attitude towards Change
18 1422
103110
0
20
40
60
80
100
120
No. of Females*
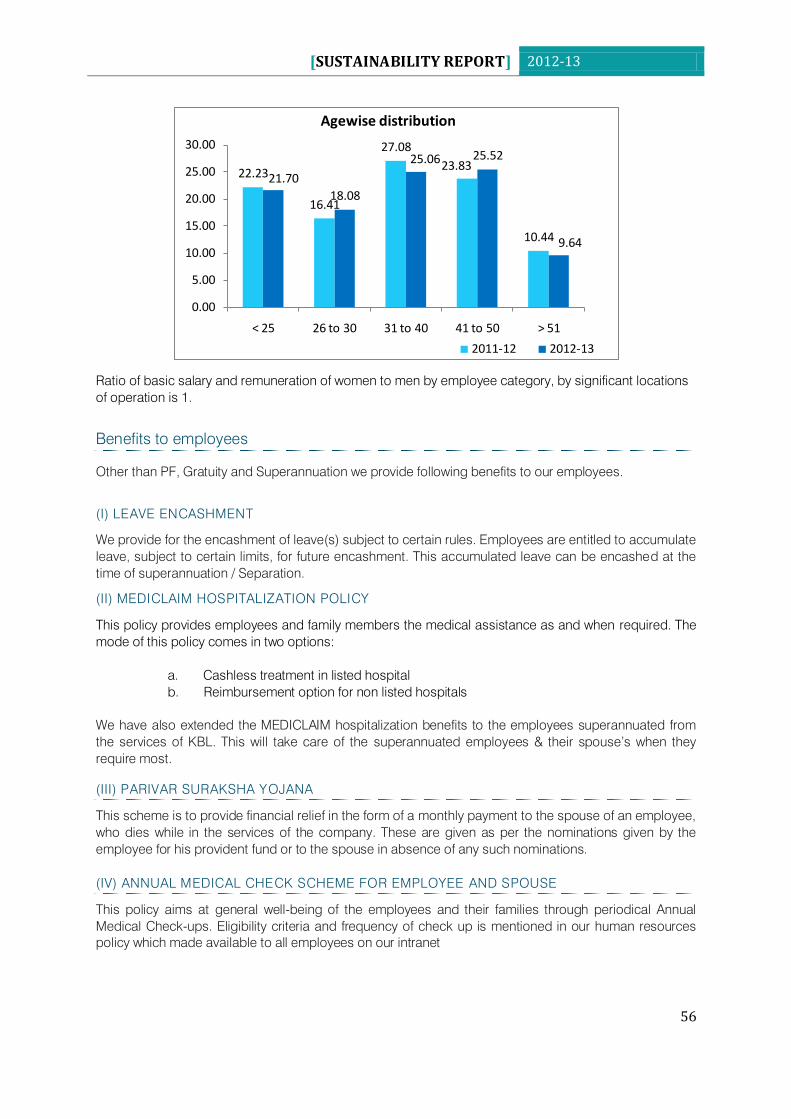
[SUSTAINABILITY REPORT] 2012-13
56
Ratio of basic salary and remuneration of women to men by employee category, by significant locations
of operation is 1.
Benefits to employees
Other than PF, Gratuity and Superannuation we provide following benefits to our employees.
(I) LEAVE ENCASHMENT
We provide for the encashment of leave(s) subject to certain rules. Employees are entitled to accumulate
leave, subject to certain limits, for future encashment. This accumulated leave can be encashed at the
time of superannuation / Separation.
(II) MEDICLAIM HOSPITALIZATION POLICY
This policy provides employees and family members the medical assistance as and when required. The
mode of this policy comes in two options:
a. Cashless treatment in listed hospital
b. Reimbursement option for non listed hospitals
We have also extended the MEDICLAIM hospitalization benefits to the employees superannuated from
the services of KBL. This will take care of the superannuated employees & their spouse‟s when they
require most.
(III) PARIVAR SURAKSHA YOJANA
This scheme is to provide financial relief in the form of a monthly payment to the spouse of an employee,
who dies while in the services of the company. These are given as per the nominations given by the
employee for his provident fund or to the spouse in absence of any such nominations.
(IV) ANNUAL MEDICAL CHECK SCHEME FOR EMPLOYEE AND SPOUSE
This policy aims at general well-being of the employees and their families through periodical Annual
Medical Check-ups. Eligibility criteria and frequency of check up is mentioned in our human resources
policy which made available to all employees on our intranet
22.23
16.41
27.08
23.83
10.44
21.70
18.08
25.06 25.52
9.64
0.00
5.00
10.00
15.00
20.00
25.00
30.00
< 25 26 to 30 31 to 40 41 to 50 > 51
Agewise distribution
2011-12 2012-13
[SUSTAINABILITY REPORT] 2012-13
57
(V) HEALTH CLUB
Company encourage employees to maintain good health by using the facilities at health clubs. All
confirmed employees in the Bands A to H at Pune, Dewas, Shirwal, Kondhapuri and Area Offices can
avail this facility. The band wise annual eligibility for health club membership is defined in which 80%
amount is company contribution and 20% amount is employee contribution on at actual annual amount
of membership charges.
(VI) TRANSPORT FACILITY
We provide bus facility for our employees to travel from Corporate office, Pune to manufacturing units in
the proximity. This facilitates our workforce for easy, comfortable and safe business commuting.
Some other benefits advanced to the permanent employees are: 20% discount on pathological tests in
selected pathology laboratory, Allowances like Conveyance Allowance, Education Allowance and Leave
Travel Assistance.
HUMAN RIGHTS
Support to Freedom of Associat ion and Collective Bargaining
Most individual and collective grievances can be resolved through bipartite forums; hence workmen are
free to join Trade Unions,
Approximately 1023 workmen of the permanent category, who come under the unionised group, are
covered by Collective Bargaining Agreements. These agreements include Health and Safety provisions
along with compensation structures in the form of a Memorandum of Understanding (MoU) between the
management and the recognised Union as per the provisions of the applicable labour legislations. These
MoUs are signed every three years, after negotiations between representative committees of the Union
and the Management. While the union membership may vary from each location, all eligible employees,
irrespective of his membership, enjoy the benefits as agreed in the MoU.
Human Rights Screening for Operations, Suppliers and Contractors
We have Supplier assessment process to take care of issues related to social aspects before doing
business with them. This includes aspects on human rights. All these requirements need to be fulfilled
before final selection or else they are rejected. We have established Ethics Committee and appointed
Head Ethics Counsellor and Regional Ethics Counsellors. They look after the implementation of Code of
ethics amongst employees. Our code of ethics includes all human rights aspects.
Discrimination
In addition to Code of Conduct which covers the aspect of non-discrimination, the company has
implemented a Whistle Blower Policy. The policy explicitly mentions pre-requisites to ensure that the
identity of the whistle blower is kept confidential. No incidents have been reported under this policy for
the year 2012-13.
Child labour, Forced and Compulsory Labour
We uphold the law of not employing children in any of its factories. It is bound by statutory legislation
(Factories Act, 1948) and proper records are maintained in this regard. Every plant location displays
board of “no child labour” in there campus. We strictly adhere to the laws of the land with regard to
forced and compulsory labour, which are prohibited under various acts and statutes.
[SUSTAINABILITY REPORT] 2012-13
58
SOCIETY
Percentage of operations with implemented local community engagement, impact
assessments, and development programs
Local community engagement is done at all our manufacturing locations. Based on the feedbacks
actions are planned. Details of these are given in stakeholder engagement, society engagement section.
Prevention of corruption
We have Board of Directors audit/finance committee which meets regularly and monitors the working.
We circulate a booklet on Code of Conduct to all our new employees. We also have our Whistle Blower
Policy. Employees are explained about this policy in specific sessions. The Policy is displayed on our
website.
http://www.kirloskarpumps.com/we-are-kbl-value-proposition-code-conduct.aspx
All employees are trained in organisation‟s anti-corruption policies and procedures through Code of
Ethics. This year through our e-learning portal we have conducted Code of Ethics examination. Annual
performance of employees is affected by result of this examination. Code of ethics covers guidelines on
anticorruption, anti-competitive behaviour, legal compliance, public policy, fairness in dealing with all our
stakeholders etc The document is available publicly on our website.
http://www.kirloskarpumps.com/we-are-kbl-value-proposition-code-ethics-e-book.aspx
We have established Ethics Committee and appointed Head Ethics Counsellor and Regional Ethics
Counsellors. They look after the implementation of Code of ethics amongst employees. Our code of
ethics includes anti-corruption aspect. There are no incidents of corruption reported during the year
2012-13.
Legal actions if any
No legal actions have been filed against the company. No misleading statements have been made
about our competitor's products and services.
Any information regarding competitors is collected only through legally permitted sources. The Company
does not engage in activities which generate or support the formation of monopolies, dominant market
positions, cartels or any other unfair trade practices.
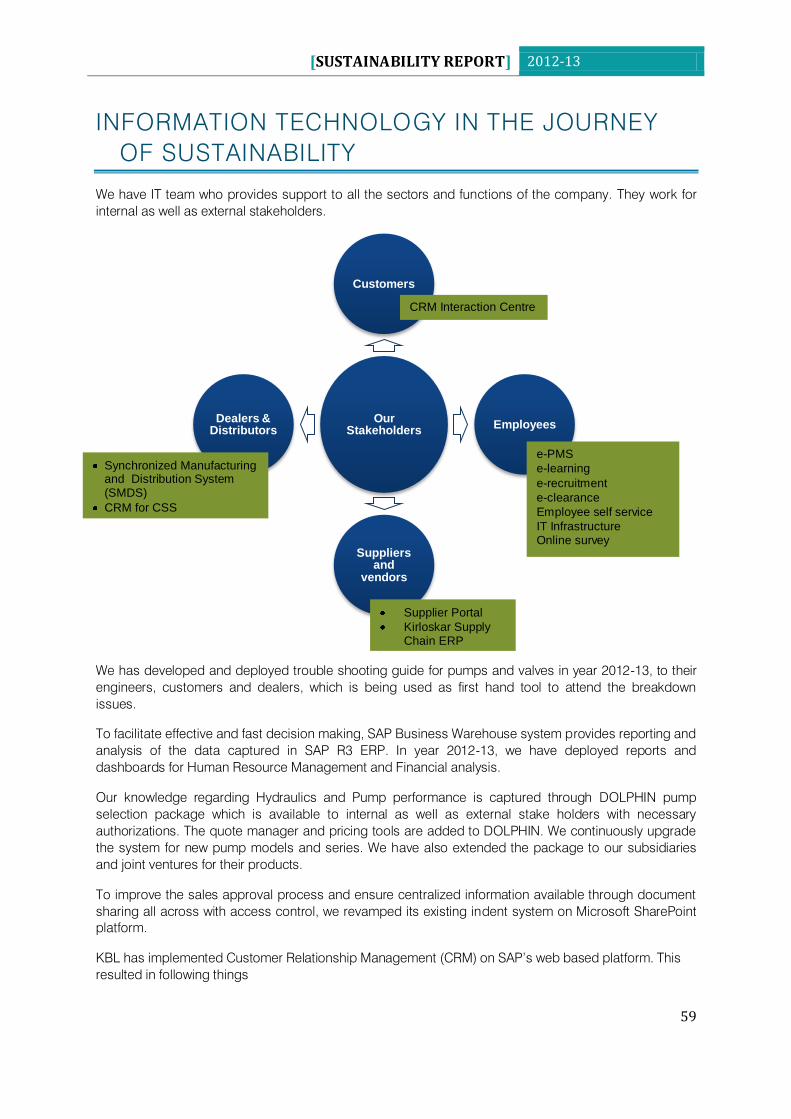
[SUSTAINABILITY REPORT] 2012-13
59
INFORMATION TECHNOLOGY IN THE JOURNEY
OF SUSTAINABILITY
We have IT team who provides support to all the sectors and functions of the company. They work for
internal as well as external stakeholders.
We has developed and deployed trouble shooting guide for pumps and valves in year 2012-13, to their
engineers, customers and dealers, which is being used as first hand tool to attend the breakdown
issues.
To facilitate effective and fast decision making, SAP Business Warehouse system provides reporting and
analysis of the data captured in SAP R3 ERP. In year 2012-13, we have deployed reports and
dashboards for Human Resource Management and Financial analysis.
Our knowledge regarding Hydraulics and Pump performance is captured through DOLPHIN pump
selection package which is available to internal as well as external stake holders with necessary
authorizations. The quote manager and pricing tools are added to DOLPHIN. We continuously upgrade
the system for new pump models and series. We have also extended the package to our subsidiaries
and joint ventures for their products.
To improve the sales approval process and ensure centralized information available through document
sharing all across with access control, we revamped its existing indent system on Microsoft SharePoint
platform.
KBL has implemented Customer Relationship Management (CRM) on SAP‟s web based platform. This
resulted in following things
Our Stakeholders
Customers
Employees
Suppliers and
vendors
Dealers & Distributors
e-PMS
e-learning
e-recruitment
e-clearance
Employee self service
IT Infrastructure Online survey
Supplier Portal
Kirloskar Supply Chain ERP
CRM Interaction Centre
Synchronized Manufacturing and Distribution System (SMDS)
CRM for CSS
[SUSTAINABILITY REPORT] 2012-13
60
All the stakeholders are brought on a single platform
Capturing and nurturing customers‟ needs effectively so as to implement innovative solutions
Improving service to customers and strengthening the engagement.
Integration of CRM processes with Toll Free which has increased the customer reach.
We have implemented SMDS (Synchronized Manufacturing and Distribution System) to improve the
availability of domestic and agriculture pumps to distributors and dealers. This would drastically reduce
the loss of sales at all supply chain points.
To strengthen KBL Supply Chain, we have decided to extend the IT support to our vendors. This would
include evaluation of IT systems, implementation and support.
E learning
Code of Ethics document is shared on portal for knowledge. Online examination for all the
employees was conducted.
IRC online portal
Online surveys: We developed various online surveys for aspects mentioned below, which has drastically
reduce paper consumption and improve analysis
Employee feedback (software hardware solutions) service provided by us
Scope 3 emission survey for staff
Carbon Footprint survey.
Effective Communication:
Deployment of Office Communications Server with federation with KBL Subsidiaries,
Vendor Portal for Corporate Global Sourcing,
Deployment of Document Management System on MS SharePoint platform to Business sectors
& Corporate functions,
E-recruitment
Infrastructure:
We have taken following initiative in terms of energy conservation and e-waste disposal
Blade servers (energy efficient server platform) standardized on blade platform servers since
past five years. Approximately power saved is 40% against the standard rack mount server.
Total server count is 47 nos.
Virtualization (consolidation of physical servers for optimal utilization of hardware). To utilize high
compute power available with new servers we have started the consolidation of servers which
results into saving of physical server per application. Virtual Machine count is 44 nos.
Standardize on LED technology for monitor, laptop screen to save on electrical energy. LED
display panel saves 60 % power compare to CRT monitor. Also produces less heat results in to
lesser load on HVAC systems. LED displays do not use mercury (used in cathode lamps in LCD
backlight) hence they are environment friendly
Use of LED panel large screen monitors instead of projectors to save on electrical power. 40%
power is saved with LED display compared with projector and this result in less head load on
HVAC system. This result in energy saving.
Power saving policy deployed for computing workstations. Policy enables the monitor to be put
in standby mode and hard disk stop spinning after 15 mins, after 30 min hard disk stop spinning
and system goes to sleep mode to save on the power.
Centralize UPS deployment (replacing all standalone UPS). To address the power factor issue of
standalone ups systems which results in to power losses.
E-waste disposal process followed for the computer hardware. Disposing the e-waste of
computer hardware thru central pollution control board certified vendor and maintain the log for
the disposed item for total weight.
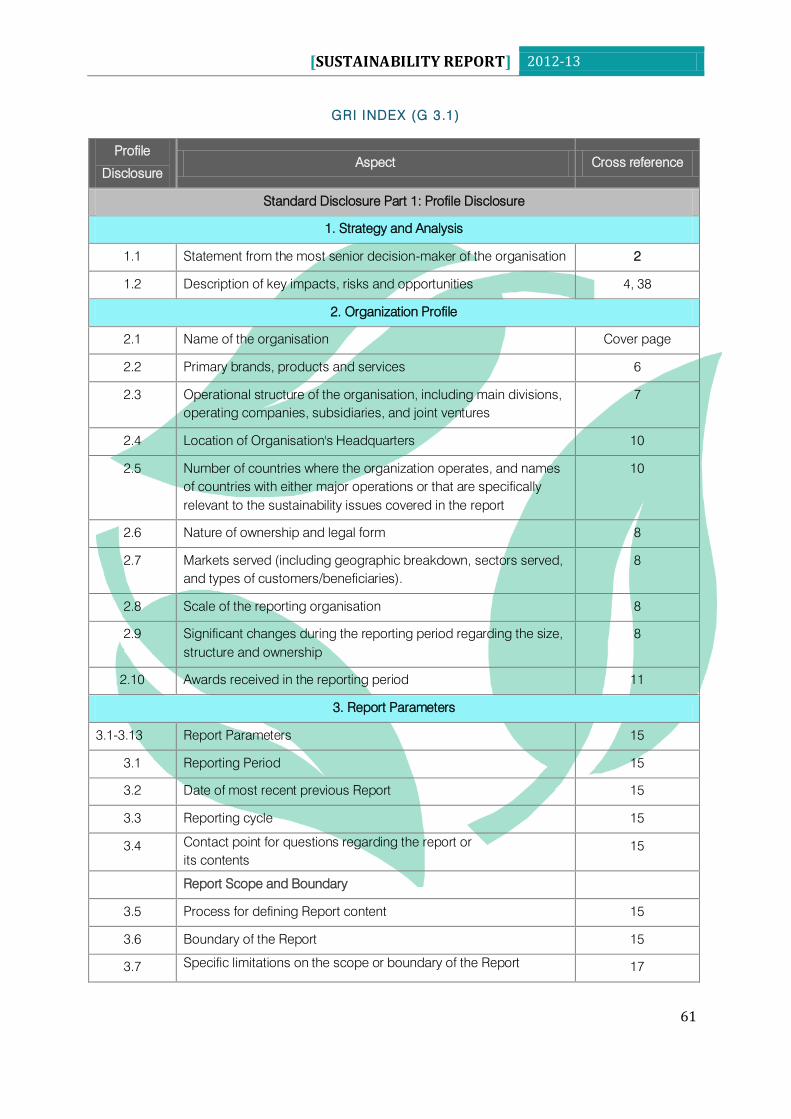
[SUSTAINABILITY REPORT] 2012-13
61
GRI INDEX (G 3.1)
Profile
Disclosure
Aspect Cross reference
Standard Disclosure Part 1: Profile Disclosure
1. Strategy and Analysis
1.1 Statement from the most senior decision-maker of the organisation 2
1.2 Description of key impacts, risks and opportunities 4, 38
2. Organization Profile
2.1 Name of the organisation Cover page
2.2 Primary brands, products and services 6
2.3 Operational structure of the organisation, including main divisions,
operating companies, subsidiaries, and joint ventures
7
2.4 Location of Organisation's Headquarters 10
2.5 Number of countries where the organization operates, and names
of countries with either major operations or that are specifically
relevant to the sustainability issues covered in the report
10
2.6 Nature of ownership and legal form 8
2.7 Markets served (including geographic breakdown, sectors served,
and types of customers/beneficiaries).
8
2.8 Scale of the reporting organisation 8
2.9 Significant changes during the reporting period regarding the size,
structure and ownership
8
2.10 Awards received in the reporting period 11
3. Report Parameters
3.1-3.13 Report Parameters 15
3.1 Reporting Period 15
3.2 Date of most recent previous Report 15
3.3 Reporting cycle 15
3.4 Contact point for questions regarding the report or
its contents
15
Report Scope and Boundary
3.5 Process for defining Report content 15
3.6 Boundary of the Report 15
3.7 Specific limitations on the scope or boundary of the Report
17
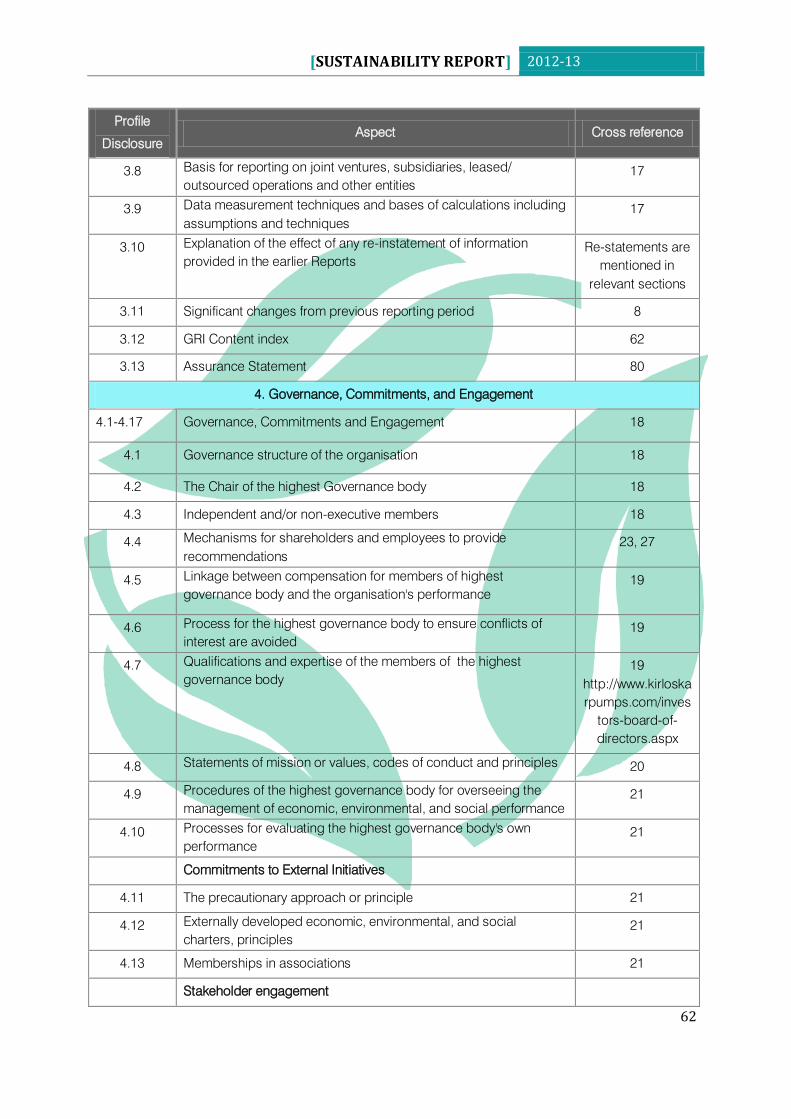
[SUSTAINABILITY REPORT] 2012-13
62
Profile
Disclosure
Aspect Cross reference
3.8 Basis for reporting on joint ventures, subsidiaries, leased/
outsourced operations and other entities
17
3.9 Data measurement techniques and bases of calculations including
assumptions and techniques
17
3.10 Explanation of the effect of any re-instatement of information
provided in the earlier Reports
Re-statements are
mentioned in
relevant sections
3.11 Significant changes from previous reporting period 8
3.12 GRI Content index 62
3.13 Assurance Statement 80
4. Governance, Commitments, and Engagement
4.1-4.17 Governance, Commitments and Engagement 18
4.1 Governance structure of the organisation 18
4.2 The Chair of the highest Governance body 18
4.3 Independent and/or non-executive members 18
4.4 Mechanisms for shareholders and employees to provide
recommendations
23, 27
4.5 Linkage between compensation for members of highest
governance body and the organisation's performance
19
4.6 Process for the highest governance body to ensure conflicts of
interest are avoided
19
4.7 Qualifications and expertise of the members of the highest
governance body
19
http://www.kirloska
rpumps.com/inves
tors-board-of-
directors.aspx
4.8 Statements of mission or values, codes of conduct and principles
20
4.9 Procedures of the highest governance body for overseeing the
management of economic, environmental, and social performance
21
4.10 Processes for evaluating the highest governance body's own
performance
21
Commitments to External Initiatives
4.11 The precautionary approach or principle 21
4.12 Externally developed economic, environmental, and social
charters, principles
21
4.13 Memberships in associations 21
Stakeholder engagement
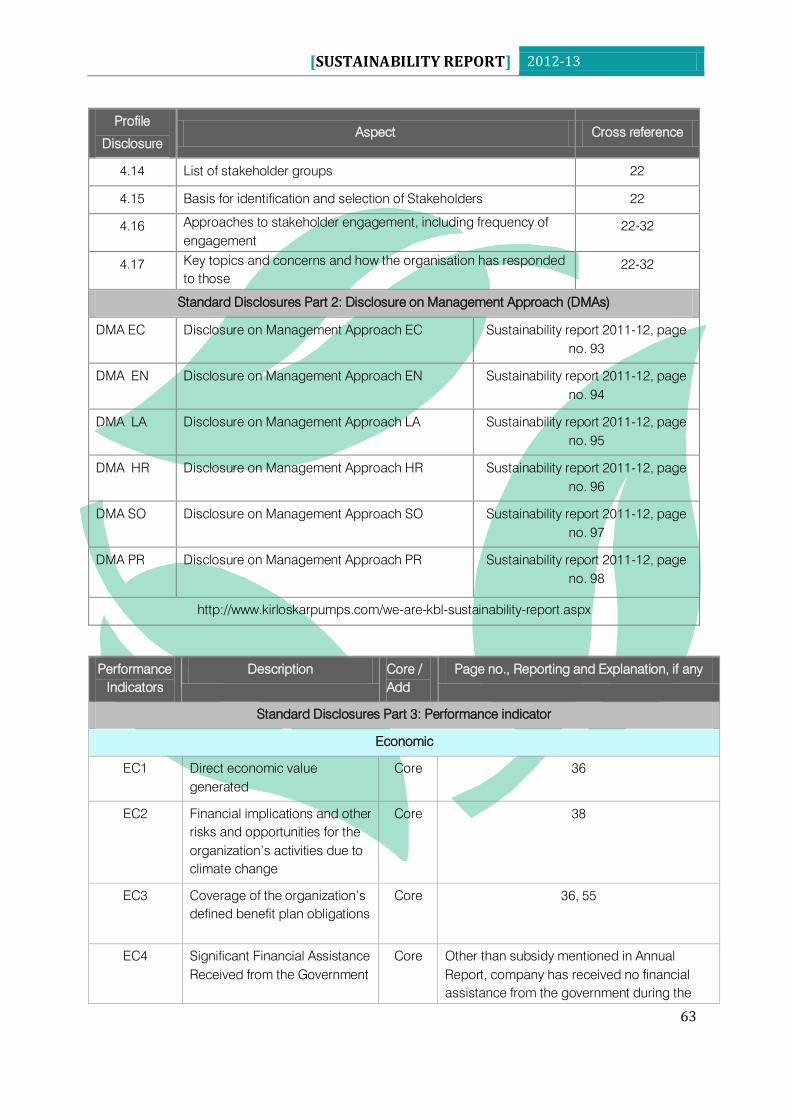
[SUSTAINABILITY REPORT] 2012-13
63
Profile
Disclosure
Aspect Cross reference
4.14 List of stakeholder groups 22
4.15 Basis for identification and selection of Stakeholders 22
4.16 Approaches to stakeholder engagement, including frequency of
engagement
22-32
4.17 Key topics and concerns and how the organisation has responded
to those
22-32
Standard Disclosures Part 2: Disclosure on Management Approach (DMAs)
DMA EC Disclosure on Management Approach EC Sustainability report 2011-12, page
no. 93
DMA EN Disclosure on Management Approach EN Sustainability report 2011-12, page
no. 94
DMA LA Disclosure on Management Approach LA Sustainability report 2011-12, page
no. 95
DMA HR Disclosure on Management Approach HR Sustainability report 2011-12, page
no. 96
DMA SO Disclosure on Management Approach SO Sustainability report 2011-12, page
no. 97
DMA PR Disclosure on Management Approach PR
Sustainability report 2011-12, page
no. 98
http://www.kirloskarpumps.com/we-are-kbl-sustainability-report.aspx
Performance
Indicators
Description Core /
Add
Page no., Reporting and Explanation, if any
Standard Disclosures Part 3: Performance indicator
Economic
EC1 Direct economic value
generated
Core 36
EC2 Financial implications and other
risks and opportunities for the
organization‟s activities due to
climate change
Core 38
EC3 Coverage of the organization‟s
defined benefit plan obligations
Core 36, 55
EC4 Significant Financial Assistance
Received from the Government
Core Other than subsidy mentioned in Annual
Report, company has received no financial
assistance from the government during the
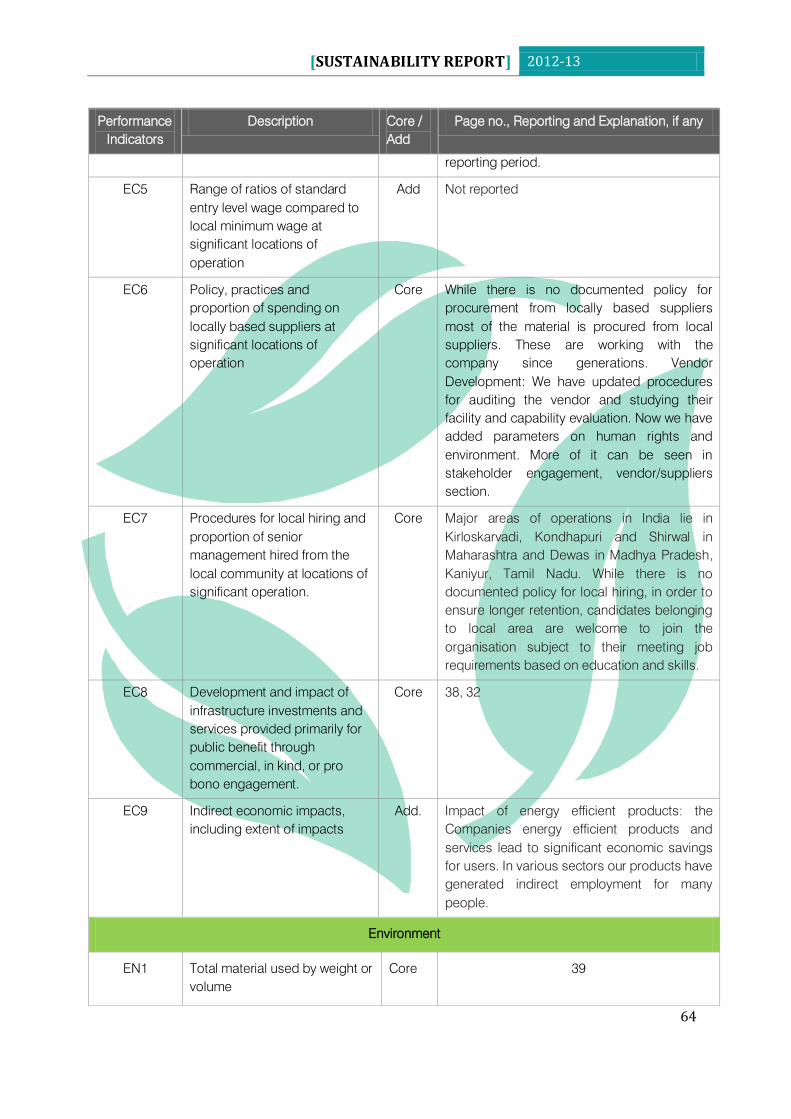
[SUSTAINABILITY REPORT] 2012-13
64
Performance
Indicators
Description Core /
Add
Page no., Reporting and Explanation, if any
reporting period.
EC5 Range of ratios of standard
entry level wage compared to
local minimum wage at
significant locations of
operation
Add Not reported
EC6
Policy, practices and
proportion of spending on
locally based suppliers at
significant locations of
operation
Core While there is no documented policy for
procurement from locally based suppliers
most of the material is procured from local
suppliers. These are working with the
company since generations. Vendor
Development: We have updated procedures
for auditing the vendor and studying their
facility and capability evaluation. Now we have
added parameters on human rights and
environment. More of it can be seen in
stakeholder engagement, vendor/suppliers
section.
EC7 Procedures for local hiring and
proportion of senior
management hired from the
local community at locations of
significant operation.
Core Major areas of operations in India lie in
Kirloskarvadi, Kondhapuri and Shirwal in
Maharashtra and Dewas in Madhya Pradesh,
Kaniyur, Tamil Nadu. While there is no
documented policy for local hiring, in order to
ensure longer retention, candidates belonging
to local area are welcome to join the
organisation subject to their meeting job
requirements based on education and skills.
EC8 Development and impact of
infrastructure investments and
services provided primarily for
public benefit through
commercial, in kind, or pro
bono engagement.
Core 38, 32
EC9 Indirect economic impacts,
including extent of impacts
Add. Impact of energy efficient products: the
Companies energy efficient products and
services lead to significant economic savings
for users. In various sectors our products have
generated indirect employment for many
people.
Environment
EN1 Total material used by weight or
volume
Core 39
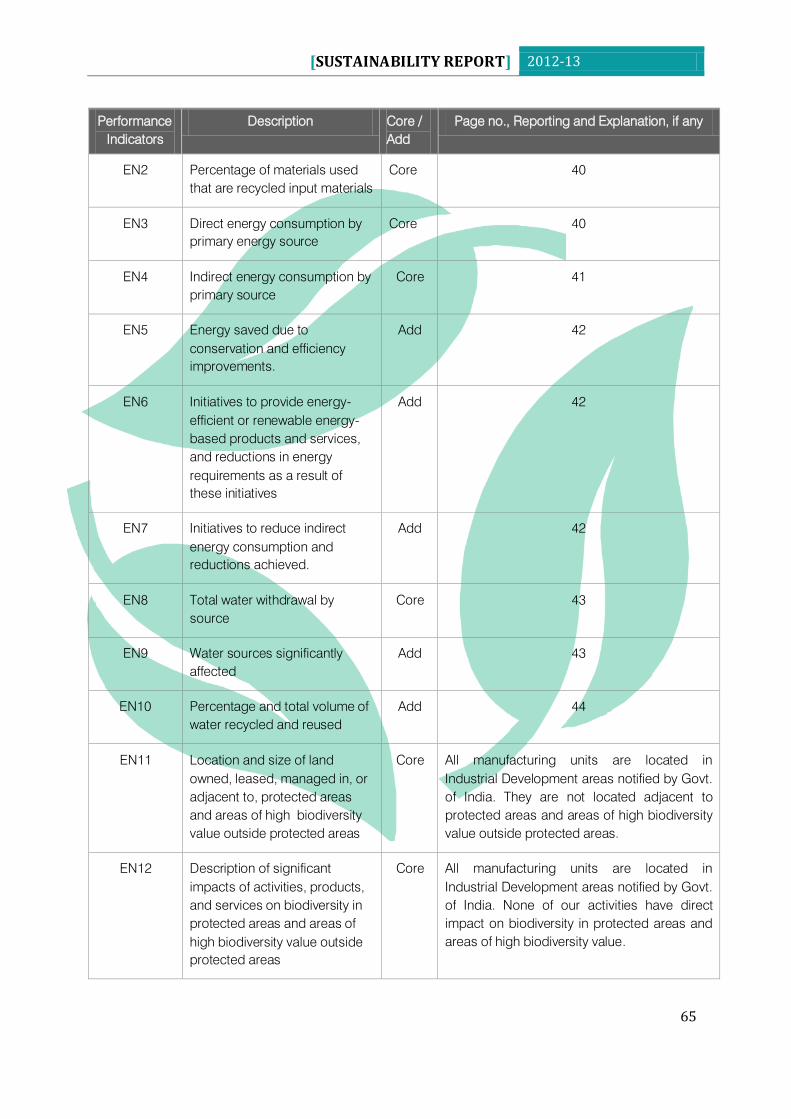
[SUSTAINABILITY REPORT] 2012-13
65
Performance
Indicators
Description Core /
Add
Page no., Reporting and Explanation, if any
EN2 Percentage of materials used
that are recycled input materials
Core 40
EN3 Direct energy consumption by
primary energy source
Core 40
EN4 Indirect energy consumption by
primary source
Core 41
EN5 Energy saved due to
conservation and efficiency
improvements.
Add 42
EN6 Initiatives to provide energy-
efficient or renewable energy-
based products and services,
and reductions in energy
requirements as a result of
these initiatives
Add 42
EN7 Initiatives to reduce indirect
energy consumption and
reductions achieved.
Add 42
EN8 Total water withdrawal by
source
Core 43
EN9 Water sources significantly
affected
Add 43
EN10 Percentage and total volume of
water recycled and reused
Add 44
EN11 Location and size of land
owned, leased, managed in, or
adjacent to, protected areas
and areas of high biodiversity
value outside protected areas
Core All manufacturing units are located in
Industrial Development areas notified by Govt.
of India. They are not located adjacent to
protected areas and areas of high biodiversity
value outside protected areas.
EN12 Description of significant
impacts of activities, products,
and services on biodiversity in
protected areas and areas of
high biodiversity value outside
protected areas
Core All manufacturing units are located in
Industrial Development areas notified by Govt.
of India. None of our activities have direct
impact on biodiversity in protected areas and
areas of high biodiversity value.
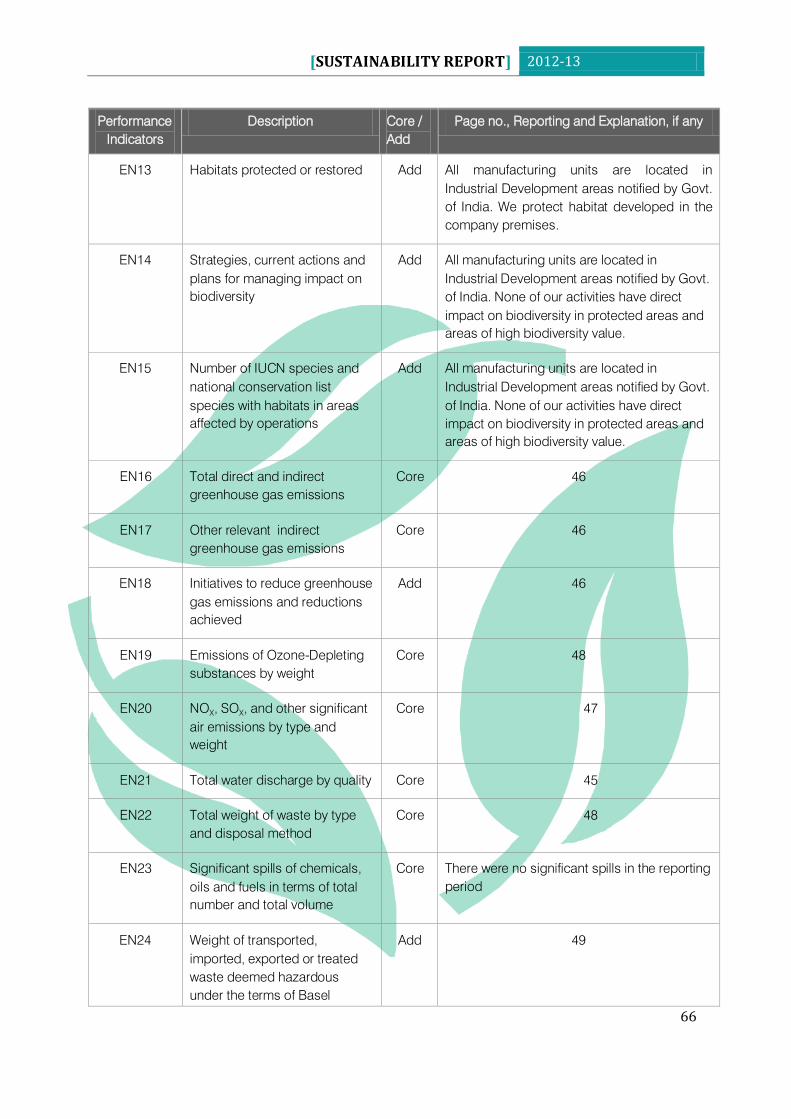
[SUSTAINABILITY REPORT] 2012-13
66
Performance
Indicators
Description Core /
Add
Page no., Reporting and Explanation, if any
EN13 Habitats protected or restored Add All manufacturing units are located in
Industrial Development areas notified by Govt.
of India. We protect habitat developed in the
company premises.
EN14 Strategies, current actions and
plans for managing impact on
biodiversity
Add All manufacturing units are located in
Industrial Development areas notified by Govt.
of India. None of our activities have direct
impact on biodiversity in protected areas and
areas of high biodiversity value.
EN15 Number of IUCN species and
national conservation list
species with habitats in areas
affected by operations
Add All manufacturing units are located in
Industrial Development areas notified by Govt.
of India. None of our activities have direct
impact on biodiversity in protected areas and
areas of high biodiversity value.
EN16 Total direct and indirect
greenhouse gas emissions
Core 46
EN17 Other relevant indirect
greenhouse gas emissions
Core 46
EN18 Initiatives to reduce greenhouse
gas emissions and reductions
achieved
Add 46
EN19 Emissions of Ozone-Depleting
substances by weight
Core 48
EN20 NOX, SO
X, and other significant
air emissions by type and
weight
Core 47
EN21 Total water discharge by quality Core 45
EN22 Total weight of waste by type
and disposal method
Core 48
EN23 Significant spills of chemicals,
oils and fuels in terms of total
number and total volume
Core There were no significant spills in the reporting
period
EN24 Weight of transported,
imported, exported or treated
waste deemed hazardous
under the terms of Basel
Add 49
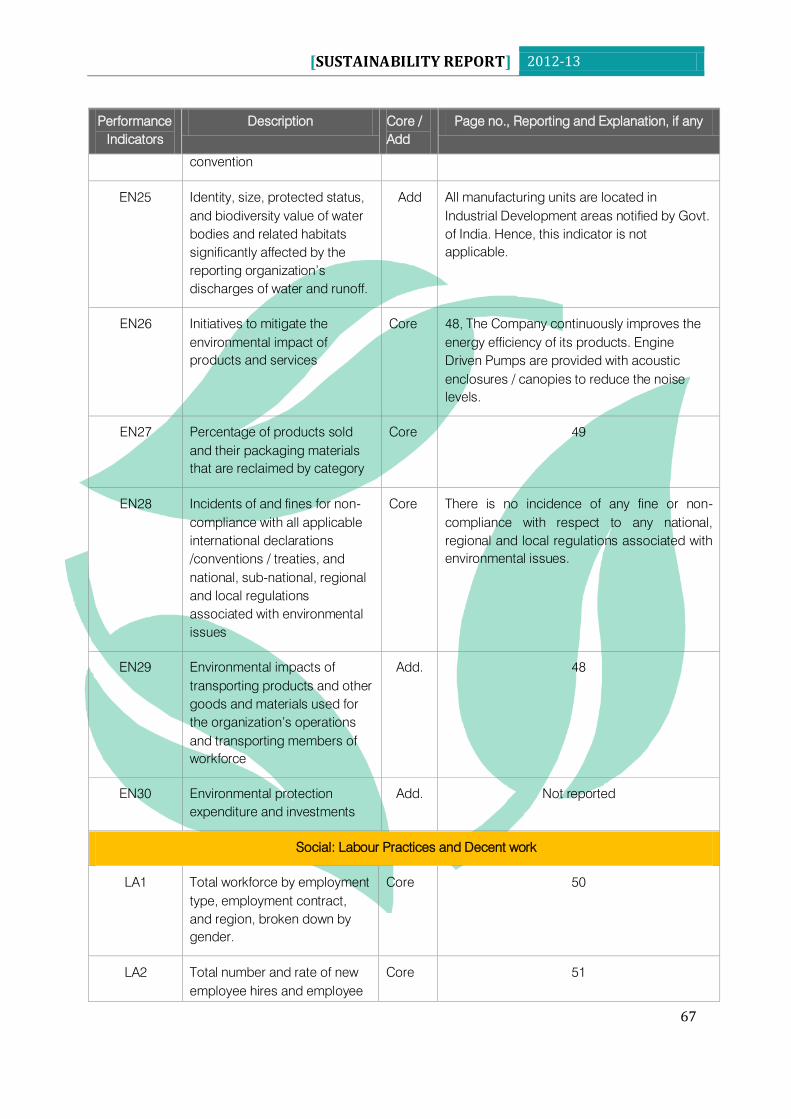
[SUSTAINABILITY REPORT] 2012-13
67
Performance
Indicators
Description Core /
Add
Page no., Reporting and Explanation, if any
convention
EN25 Identity, size, protected status,
and biodiversity value of water
bodies and related habitats
significantly affected by the
reporting organization‟s
discharges of water and runoff.
Add All manufacturing units are located in
Industrial Development areas notified by Govt.
of India. Hence, this indicator is not
applicable.
EN26 Initiatives to mitigate the
environmental impact of
products and services
Core 48, The Company continuously improves the
energy efficiency of its products. Engine
Driven Pumps are provided with acoustic
enclosures / canopies to reduce the noise
levels.
EN27 Percentage of products sold
and their packaging materials
that are reclaimed by category
Core 49
EN28 Incidents of and fines for non-
compliance with all applicable
international declarations
/conventions / treaties, and
national, sub-national, regional
and local regulations
associated with environmental
issues
Core There is no incidence of any fine or non-
compliance with respect to any national,
regional and local regulations associated with
environmental issues.
EN29 Environmental impacts of
transporting products and other
goods and materials used for
the organization‟s operations
and transporting members of
workforce
Add. 48
EN30 Environmental protection
expenditure and investments
Add. Not reported
Social: Labour Practices and Decent work
LA1 Total workforce by employment
type, employment contract,
and region, broken down by
gender.
Core 50
LA2 Total number and rate of new
employee hires and employee
Core 51
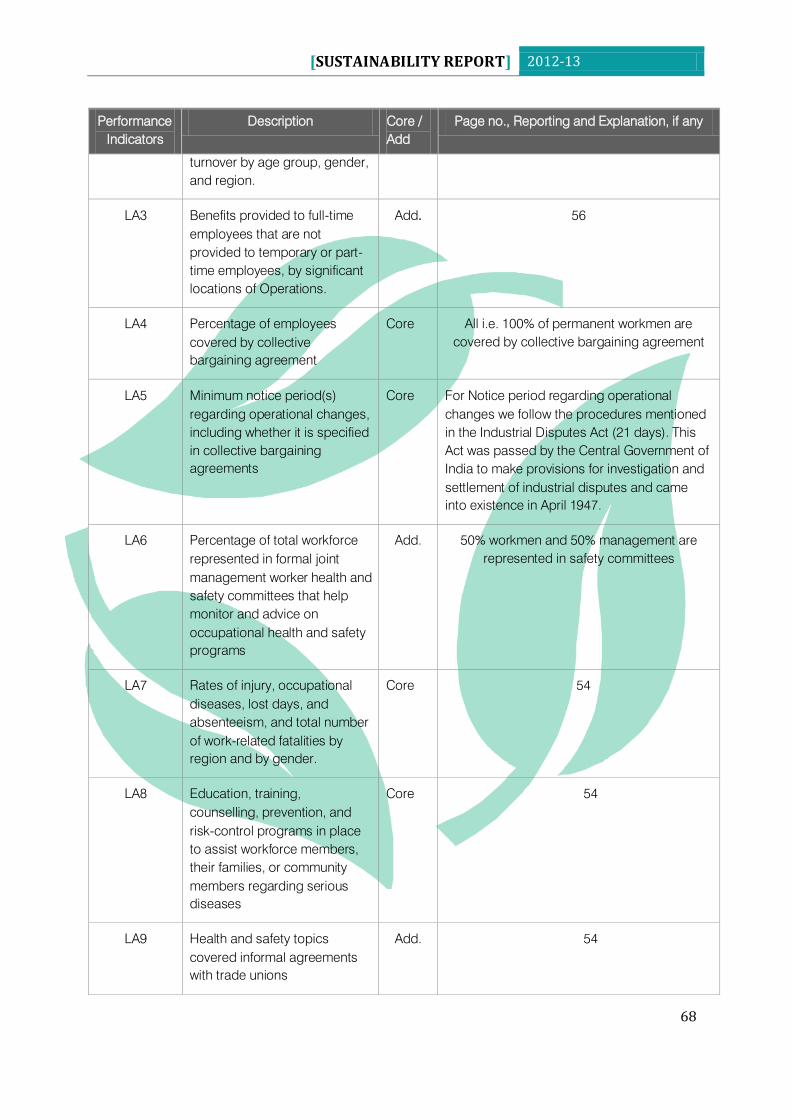
[SUSTAINABILITY REPORT] 2012-13
68
Performance
Indicators
Description Core /
Add
Page no., Reporting and Explanation, if any
turnover by age group, gender,
and region.
LA3 Benefits provided to full-time
employees that are not
provided to temporary or part-
time employees, by significant
locations of Operations.
Add. 56
LA4 Percentage of employees
covered by collective
bargaining agreement
Core All i.e. 100% of permanent workmen are
covered by collective bargaining agreement
LA5 Minimum notice period(s)
regarding operational changes,
including whether it is specified
in collective bargaining
agreements
Core For Notice period regarding operational
changes we follow the procedures mentioned
in the Industrial Disputes Act (21 days). This
Act was passed by the Central Government of
India to make provisions for investigation and
settlement of industrial disputes and came
into existence in April 1947.
LA6 Percentage of total workforce
represented in formal joint
management worker health and
safety committees that help
monitor and advice on
occupational health and safety
programs
Add. 50% workmen and 50% management are
represented in safety committees
LA7 Rates of injury, occupational
diseases, lost days, and
absenteeism, and total number
of work-related fatalities by
region and by gender.
Core 54
LA8 Education, training,
counselling, prevention, and
risk-control programs in place
to assist workforce members,
their families, or community
members regarding serious
diseases
Core 54
LA9 Health and safety topics
covered informal agreements
with trade unions
Add. 54
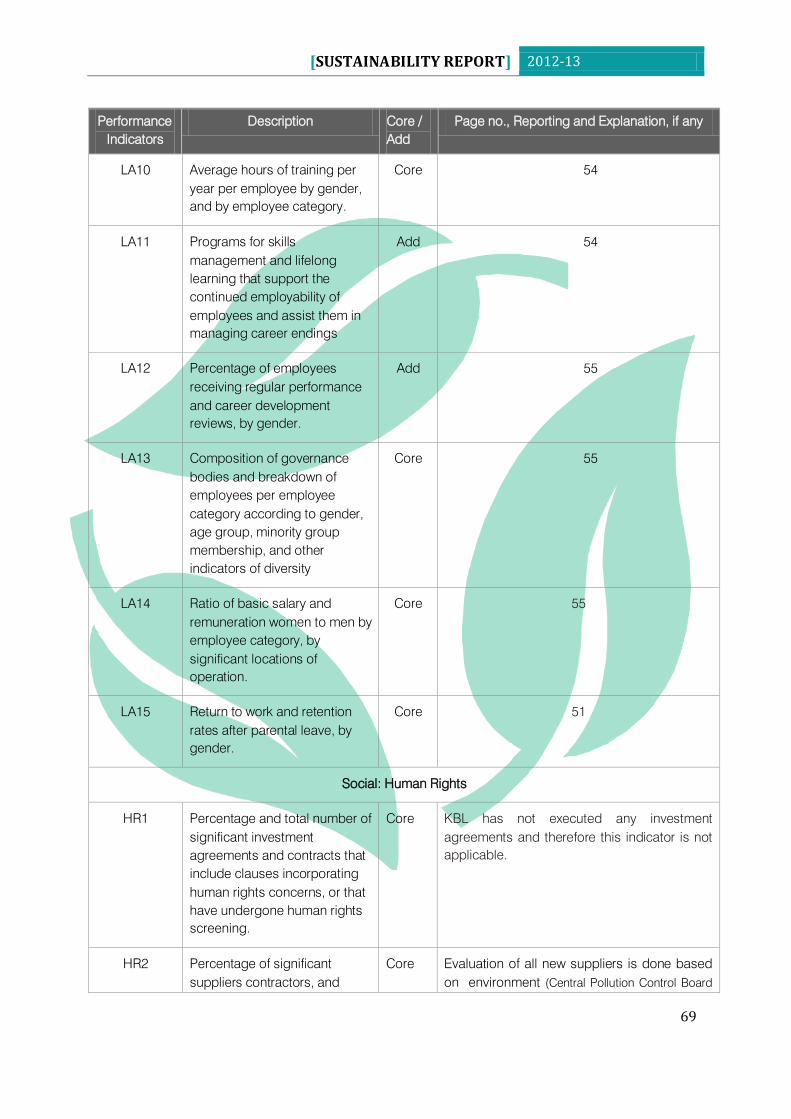
[SUSTAINABILITY REPORT] 2012-13
69
Performance
Indicators
Description Core /
Add
Page no., Reporting and Explanation, if any
LA10 Average hours of training per
year per employee by gender,
and by employee category.
Core 54
LA11 Programs for skills
management and lifelong
learning that support the
continued employability of
employees and assist them in
managing career endings
Add 54
LA12 Percentage of employees
receiving regular performance
and career development
reviews, by gender.
Add 55
LA13 Composition of governance
bodies and breakdown of
employees per employee
category according to gender,
age group, minority group
membership, and other
indicators of diversity
Core 55
LA14 Ratio of basic salary and
remuneration women to men by
employee category, by
significant locations of
operation.
Core 55
LA15 Return to work and retention
rates after parental leave, by
gender.
Core 51
Social: Human Rights
HR1 Percentage and total number of
significant investment
agreements and contracts that
include clauses incorporating
human rights concerns, or that
have undergone human rights
screening.
Core KBL has not executed any investment
agreements and therefore this indicator is not
applicable.
HR2 Percentage of significant
suppliers contractors, and
Core Evaluation of all new suppliers is done based
on environment (Central Pollution Control Board
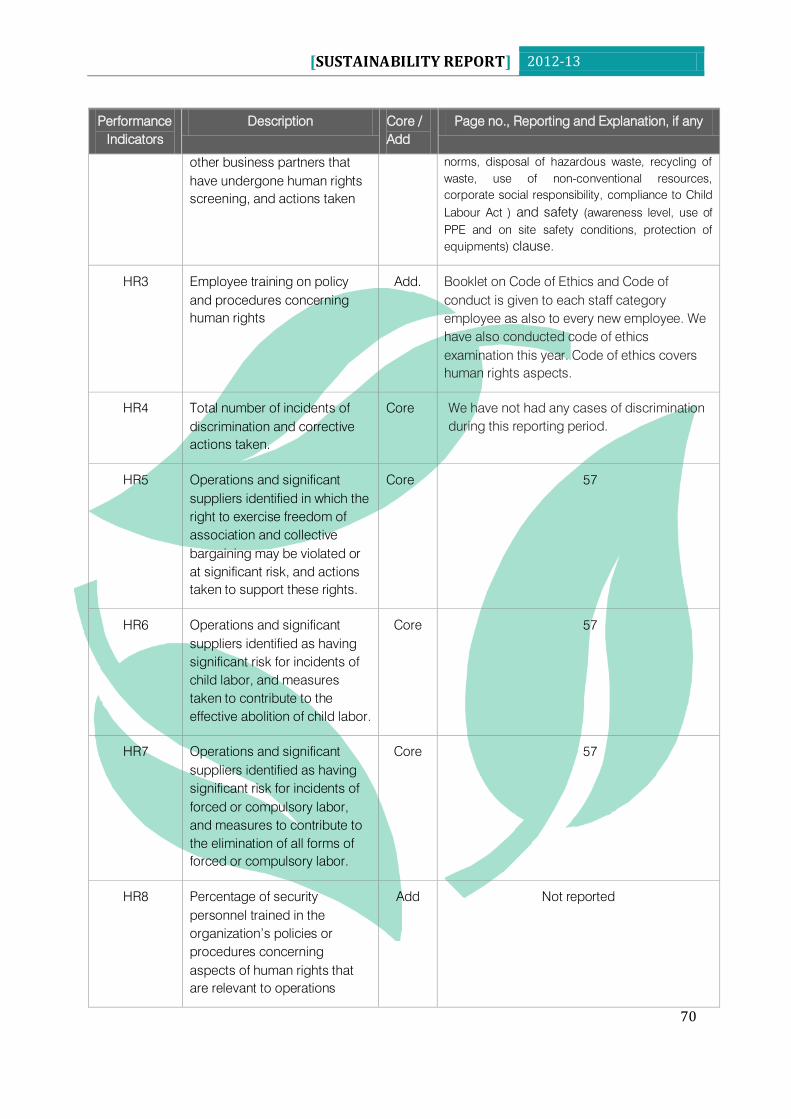
[SUSTAINABILITY REPORT] 2012-13
70
Performance
Indicators
Description Core /
Add
Page no., Reporting and Explanation, if any
other business partners that
have undergone human rights
screening, and actions taken
norms, disposal of hazardous waste, recycling of
waste, use of non-conventional resources,
corporate social responsibility, compliance to Child
Labour Act ) and safety (awareness level, use of
PPE and on site safety conditions, protection of
equipments) clause.
HR3 Employee training on policy
and procedures concerning
human rights
Add. Booklet on Code of Ethics and Code of
conduct is given to each staff category
employee as also to every new employee. We
have also conducted code of ethics
examination this year. Code of ethics covers
human rights aspects.
HR4 Total number of incidents of
discrimination and corrective
actions taken.
Core We have not had any cases of discrimination
during this reporting period.
HR5 Operations and significant
suppliers identified in which the
right to exercise freedom of
association and collective
bargaining may be violated or
at significant risk, and actions
taken to support these rights.
Core 57
HR6 Operations and significant
suppliers identified as having
significant risk for incidents of
child labor, and measures
taken to contribute to the
effective abolition of child labor.
Core 57
HR7 Operations and significant
suppliers identified as having
significant risk for incidents of
forced or compulsory labor,
and measures to contribute to
the elimination of all forms of
forced or compulsory labor.
Core 57
HR8 Percentage of security
personnel trained in the
organization‟s policies or
procedures concerning
aspects of human rights that
are relevant to operations
Add Not reported
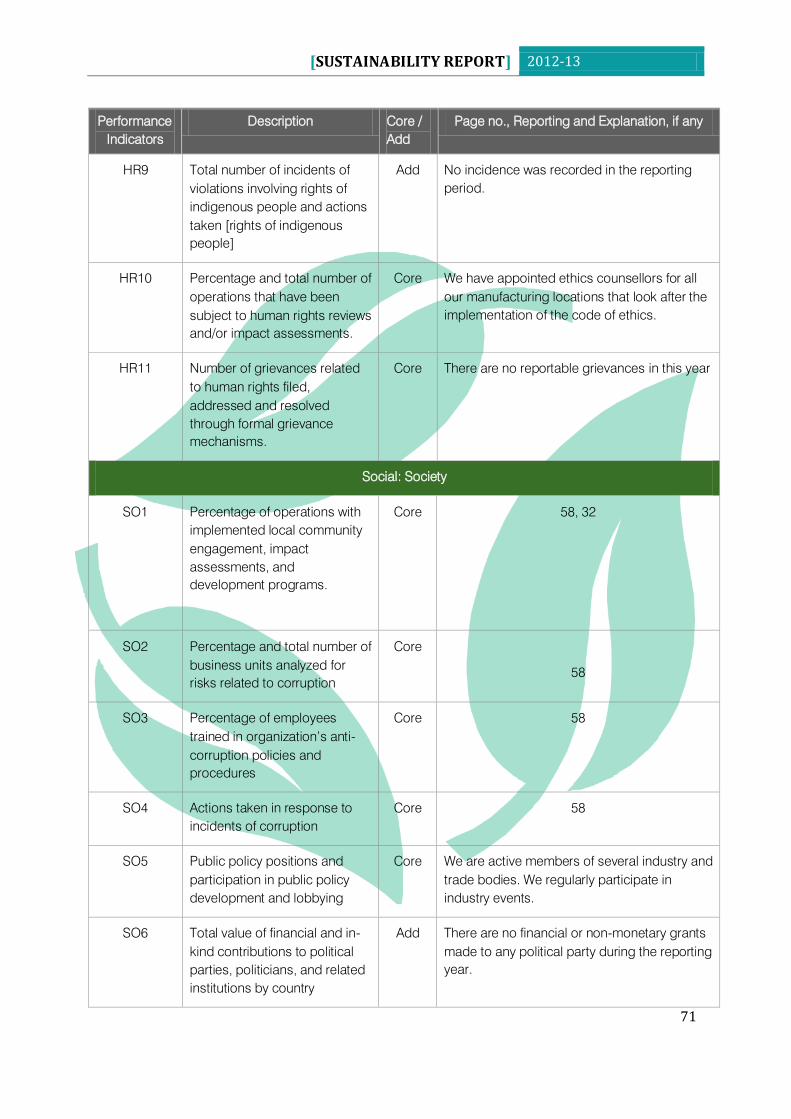
[SUSTAINABILITY REPORT] 2012-13
71
Performance
Indicators
Description Core /
Add
Page no., Reporting and Explanation, if any
HR9 Total number of incidents of
violations involving rights of
indigenous people and actions
taken [rights of indigenous
people]
Add No incidence was recorded in the reporting
period.
HR10 Percentage and total number of
operations that have been
subject to human rights reviews
and/or impact assessments.
Core We have appointed ethics counsellors for all
our manufacturing locations that look after the
implementation of the code of ethics.
HR11 Number of grievances related
to human rights filed,
addressed and resolved
through formal grievance
mechanisms.
Core There are no reportable grievances in this year
Social: Society
SO1 Percentage of operations with
implemented local community
engagement, impact
assessments, and
development programs.
Core 58, 32
SO2 Percentage and total number of
business units analyzed for
risks related to corruption
Core
58
SO3 Percentage of employees
trained in organization‟s anti-
corruption policies and
procedures
Core 58
SO4 Actions taken in response to
incidents of corruption
Core 58
SO5 Public policy positions and
participation in public policy
development and lobbying
Core We are active members of several industry and
trade bodies. We regularly participate in
industry events.
SO6 Total value of financial and in-
kind contributions to political
parties, politicians, and related
institutions by country
Add There are no financial or non-monetary grants
made to any political party during the reporting
year.
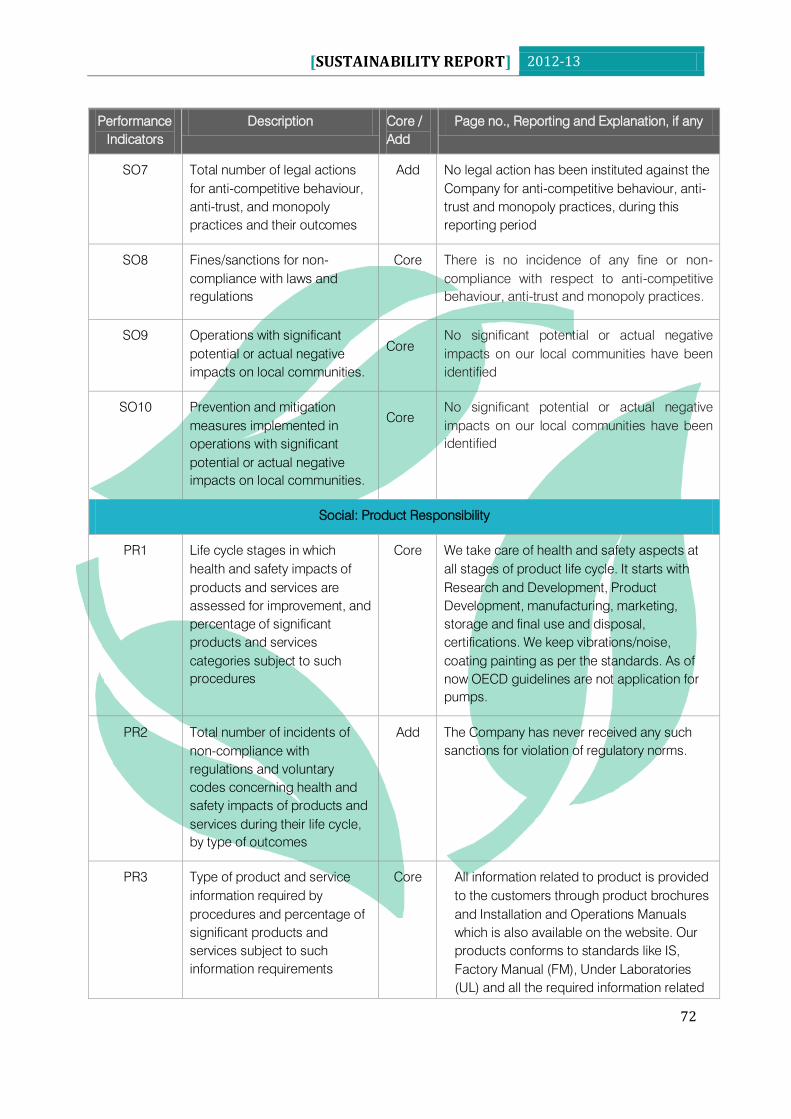
[SUSTAINABILITY REPORT] 2012-13
72
Performance
Indicators
Description Core /
Add
Page no., Reporting and Explanation, if any
SO7 Total number of legal actions
for anti-competitive behaviour,
anti-trust, and monopoly
practices and their outcomes
Add No legal action has been instituted against the
Company for anti-competitive behaviour, anti-
trust and monopoly practices, during this
reporting period
SO8 Fines/sanctions for non-
compliance with laws and
regulations
Core There is no incidence of any fine or non-
compliance with respect to anti-competitive
behaviour, anti-trust and monopoly practices.
SO9 Operations with significant
potential or actual negative
impacts on local communities.
Core
No significant potential or actual negative
impacts on our local communities have been
identified
SO10 Prevention and mitigation
measures implemented in
operations with significant
potential or actual negative
impacts on local communities.
Core
No significant potential or actual negative
impacts on our local communities have been
identified
Social: Product Responsibility
PR1 Life cycle stages in which
health and safety impacts of
products and services are
assessed for improvement, and
percentage of significant
products and services
categories subject to such
procedures
Core We take care of health and safety aspects at
all stages of product life cycle. It starts with
Research and Development, Product
Development, manufacturing, marketing,
storage and final use and disposal,
certifications. We keep vibrations/noise,
coating painting as per the standards. As of
now OECD guidelines are not application for
pumps.
PR2 Total number of incidents of
non-compliance with
regulations and voluntary
codes concerning health and
safety impacts of products and
services during their life cycle,
by type of outcomes
Add The Company has never received any such
sanctions for violation of regulatory norms.
PR3 Type of product and service
information required by
procedures and percentage of
significant products and
services subject to such
information requirements
Core All information related to product is provided
to the customers through product brochures
and Installation and Operations Manuals
which is also available on the website. Our
products conforms to standards like IS,
Factory Manual (FM), Under Laboratories
(UL) and all the required information related
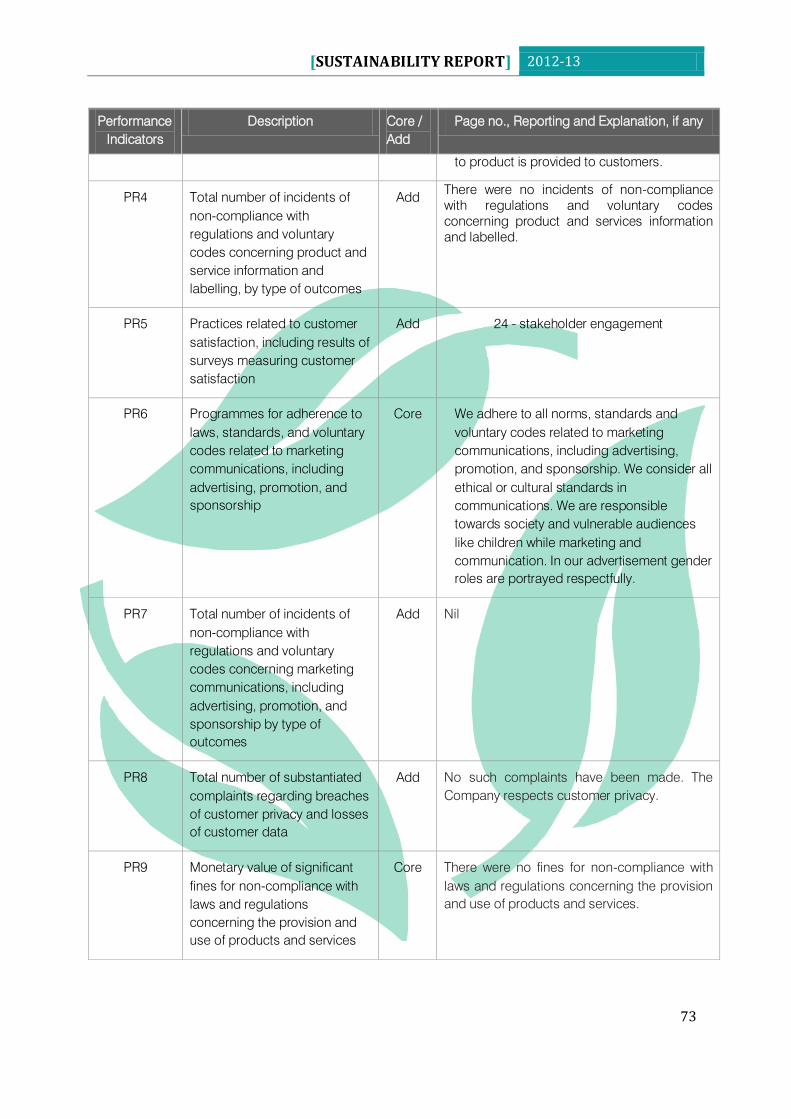
[SUSTAINABILITY REPORT] 2012-13
73
Performance
Indicators
Description Core /
Add
Page no., Reporting and Explanation, if any
to product is provided to customers.
PR4 Total number of incidents of
non-compliance with
regulations and voluntary
codes concerning product and
service information and
labelling, by type of outcomes
Add There were no incidents of non-compliance
with regulations and voluntary codes
concerning product and services information
and labelled.
PR5 Practices related to customer
satisfaction, including results of
surveys measuring customer
satisfaction
Add 24 - stakeholder engagement
PR6 Programmes for adherence to
laws, standards, and voluntary
codes related to marketing
communications, including
advertising, promotion, and
sponsorship
Core We adhere to all norms, standards and
voluntary codes related to marketing
communications, including advertising,
promotion, and sponsorship. We consider all
ethical or cultural standards in
communications. We are responsible
towards society and vulnerable audiences
like children while marketing and
communication. In our advertisement gender
roles are portrayed respectfully.
PR7 Total number of incidents of
non-compliance with
regulations and voluntary
codes concerning marketing
communications, including
advertising, promotion, and
sponsorship by type of
outcomes
Add Nil
PR8 Total number of substantiated
complaints regarding breaches
of customer privacy and losses
of customer data
Add No such complaints have been made. The
Company respects customer privacy.
PR9 Monetary value of significant
fines for non-compliance with
laws and regulations
concerning the provision and
use of products and services
Core There were no fines for non-compliance with
laws and regulations concerning the provision
and use of products and services.
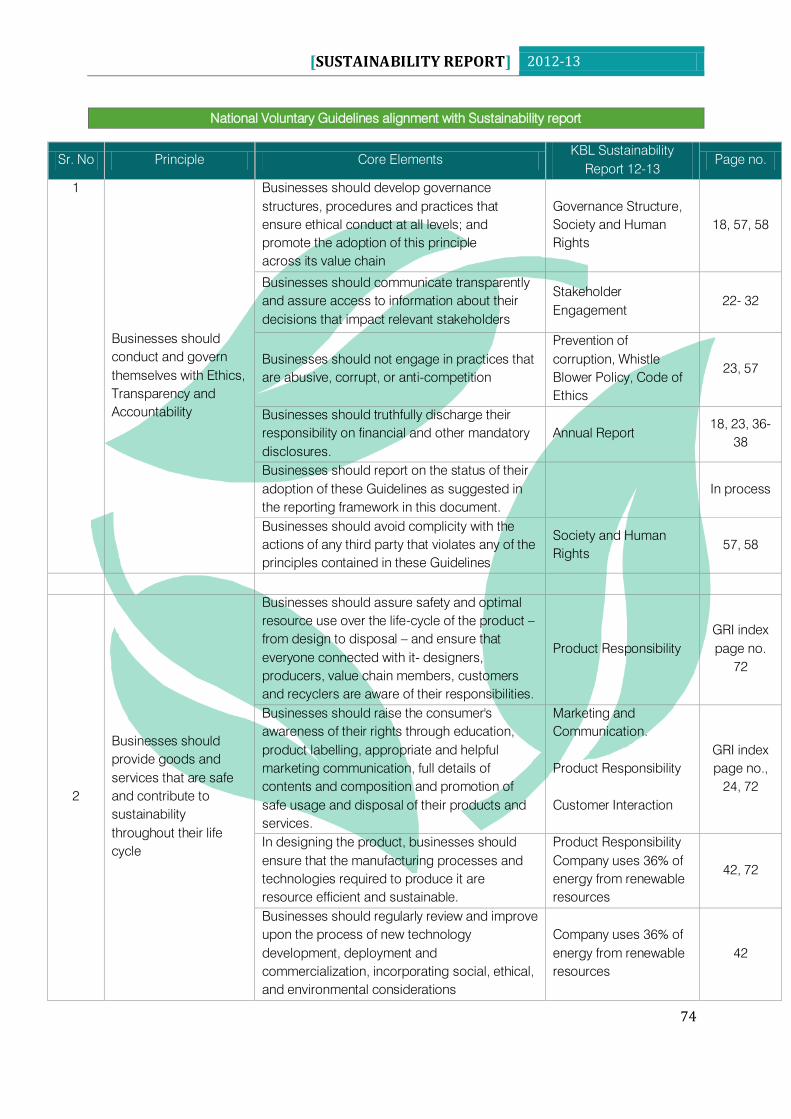
[SUSTAINABILITY REPORT] 2012-13
74
National Voluntary Guidelines alignment with Sustainability report
Sr. No Principle Core Elements
KBL Sustainability
Report 12-13
Page no.
1
Businesses should
conduct and govern
themselves with Ethics,
Transparency and
Accountability
Businesses should develop governance
structures, procedures and practices that
ensure ethical conduct at all levels; and
promote the adoption of this principle
across its value chain
Governance Structure,
Society and Human
Rights
18, 57, 58
Businesses should communicate transparently
and assure access to information about their
decisions that impact relevant stakeholders
Stakeholder
Engagement
22- 32
Businesses should not engage in practices that
are abusive, corrupt, or anti-competition
Prevention of
corruption, Whistle
Blower Policy, Code of
Ethics
23, 57
Businesses should truthfully discharge their
responsibility on financial and other mandatory
disclosures.
Annual Report
18, 23, 36-
38
Businesses should report on the status of their
adoption of these Guidelines as suggested in
the reporting framework in this document.
In process
Businesses should avoid complicity with the
actions of any third party that violates any of the
principles contained in these Guidelines
Society and Human
Rights
57, 58
2
Businesses should
provide goods and
services that are safe
and contribute to
sustainability
throughout their life
cycle
Businesses should assure safety and optimal
resource use over the life-cycle of the product –
from design to disposal – and ensure that
everyone connected with it- designers,
producers, value chain members, customers
and recyclers are aware of their responsibilities.
Product Responsibility
GRI index
page no.
72
Businesses should raise the consumer's
awareness of their rights through education,
product labelling, appropriate and helpful
marketing communication, full details of
contents and composition and promotion of
safe usage and disposal of their products and
services.
Marketing and
Communication.
Product Responsibility
Customer Interaction
GRI index
page no.,
24, 72
In designing the product, businesses should
ensure that the manufacturing processes and
technologies required to produce it are
resource efficient and sustainable.
Product Responsibility
Company uses 36% of
energy from renewable
resources
42, 72
Businesses should regularly review and improve
upon the process of new technology
development, deployment and
commercialization, incorporating social, ethical,
and environmental considerations
Company uses 36% of
energy from renewable
resources
42
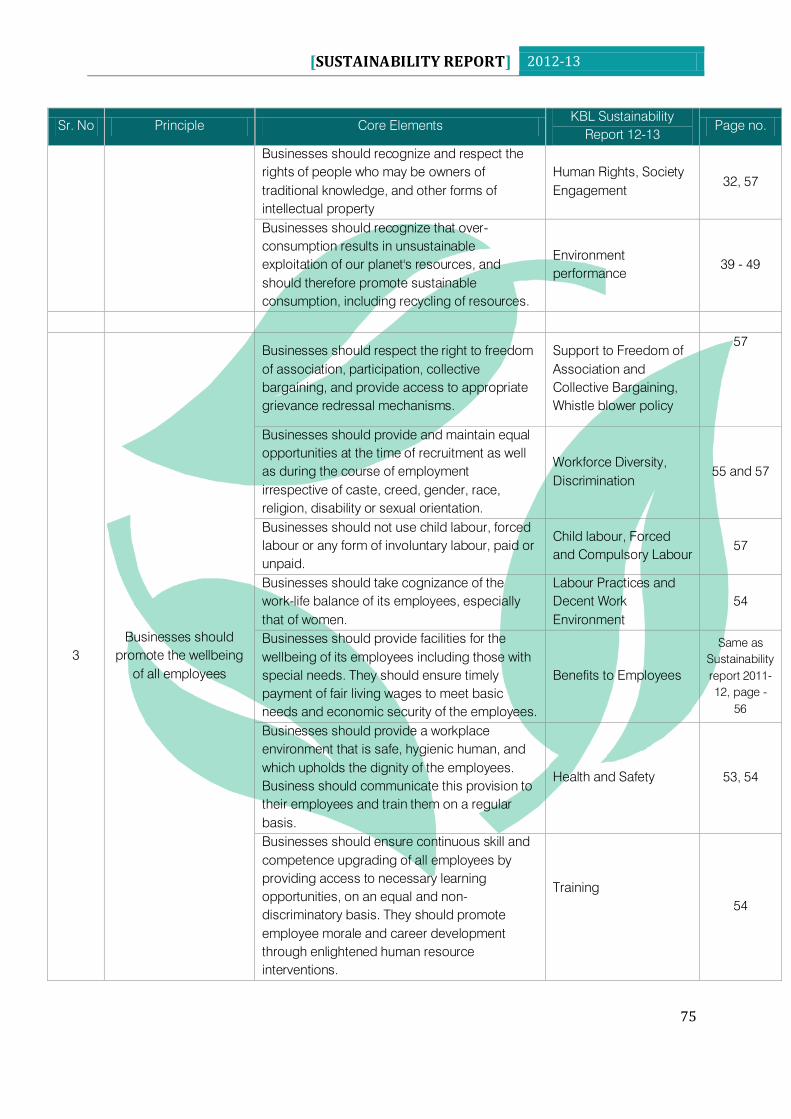
[SUSTAINABILITY REPORT] 2012-13
75
Sr. No Principle Core Elements
KBL Sustainability
Report 12-13
Page no.
Businesses should recognize and respect the
rights of people who may be owners of
traditional knowledge, and other forms of
intellectual property
Human Rights, Society
Engagement
32, 57
Businesses should recognize that over-
consumption results in unsustainable
exploitation of our planet's resources, and
should therefore promote sustainable
consumption, including recycling of resources.
Environment
performance
39 - 49
3
Businesses should
promote the wellbeing
of all employees
Businesses should respect the right to freedom
of association, participation, collective
bargaining, and provide access to appropriate
grievance redressal mechanisms.
Support to Freedom of
Association and
Collective Bargaining,
Whistle blower policy
57
Businesses should provide and maintain equal
opportunities at the time of recruitment as well
as during the course of employment
irrespective of caste, creed, gender, race,
religion, disability or sexual orientation.
Workforce Diversity,
Discrimination
55 and 57
Businesses should not use child labour, forced
labour or any form of involuntary labour, paid or
unpaid.
Child labour, Forced
and Compulsory Labour
57
Businesses should take cognizance of the
work-life balance of its employees, especially
that of women.
Labour Practices and
Decent Work
Environment
54
Businesses should provide facilities for the
wellbeing of its employees including those with
special needs. They should ensure timely
payment of fair living wages to meet basic
needs and economic security of the employees.
Benefits to Employees
Same as
Sustainability
report 2011-
12, page -
56
Businesses should provide a workplace
environment that is safe, hygienic human, and
which upholds the dignity of the employees.
Business should communicate this provision to
their employees and train them on a regular
basis.
Health and Safety 53, 54
Businesses should ensure continuous skill and
competence upgrading of all employees by
providing access to necessary learning
opportunities, on an equal and non-
discriminatory basis. They should promote
employee morale and career development
through enlightened human resource
interventions.
Training
54
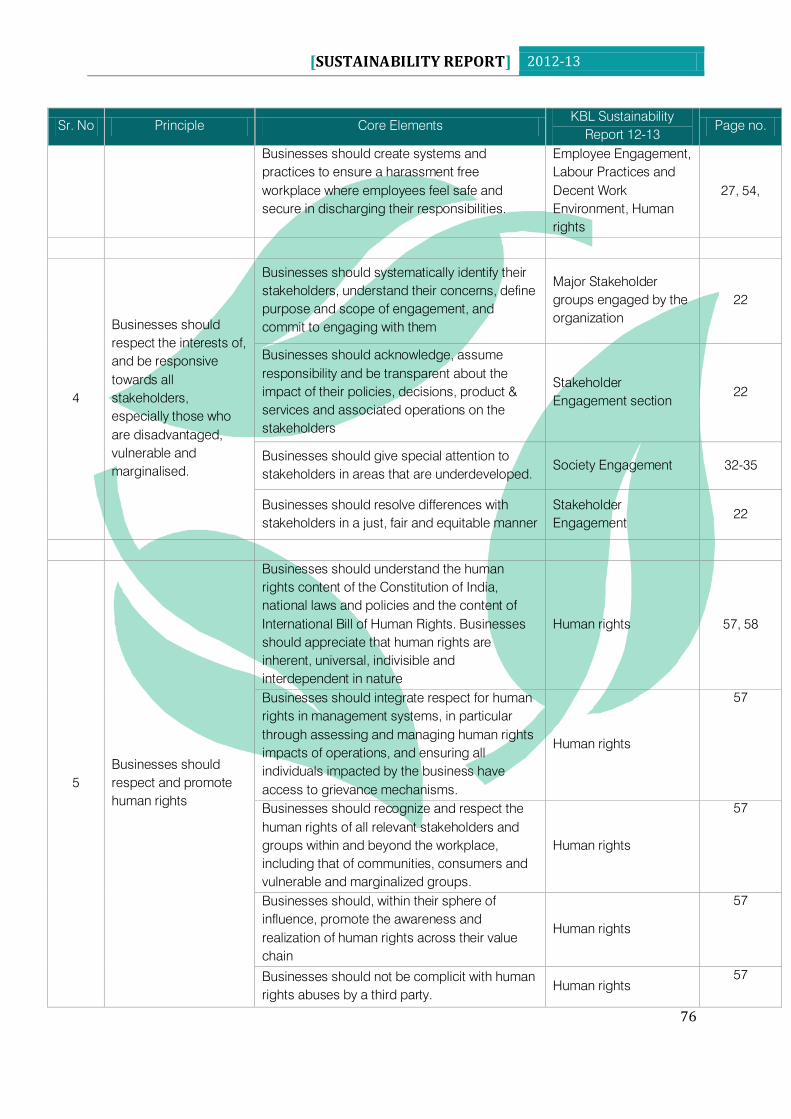
[SUSTAINABILITY REPORT] 2012-13
76
Sr. No Principle Core Elements
KBL Sustainability
Report 12-13
Page no.
Businesses should create systems and
practices to ensure a harassment free
workplace where employees feel safe and
secure in discharging their responsibilities.
Employee Engagement,
Labour Practices and
Decent Work
Environment, Human
rights
27, 54,
4
Businesses should
respect the interests of,
and be responsive
towards all
stakeholders,
especially those who
are disadvantaged,
vulnerable and
marginalised.
Businesses should systematically identify their
stakeholders, understand their concerns, define
purpose and scope of engagement, and
commit to engaging with them
Major Stakeholder
groups engaged by the
organization
22
Businesses should acknowledge, assume
responsibility and be transparent about the
impact of their policies, decisions, product &
services and associated operations on the
stakeholders
Stakeholder
Engagement section
22
Businesses should give special attention to
stakeholders in areas that are underdeveloped.
Society Engagement 32-35
Businesses should resolve differences with
stakeholders in a just, fair and equitable manner
Stakeholder
Engagement
22
5
Businesses should
respect and promote
human rights
Businesses should understand the human
rights content of the Constitution of India,
national laws and policies and the content of
International Bill of Human Rights. Businesses
should appreciate that human rights are
inherent, universal, indivisible and
interdependent in nature
Human rights 57, 58
Businesses should integrate respect for human
rights in management systems, in particular
through assessing and managing human rights
impacts of operations, and ensuring all
individuals impacted by the business have
access to grievance mechanisms.
Human rights
57
Businesses should recognize and respect the
human rights of all relevant stakeholders and
groups within and beyond the workplace,
including that of communities, consumers and
vulnerable and marginalized groups.
Human rights
57
Businesses should, within their sphere of
influence, promote the awareness and
realization of human rights across their value
chain
Human rights
57
Businesses should not be complicit with human
rights abuses by a third party.
Human rights
57
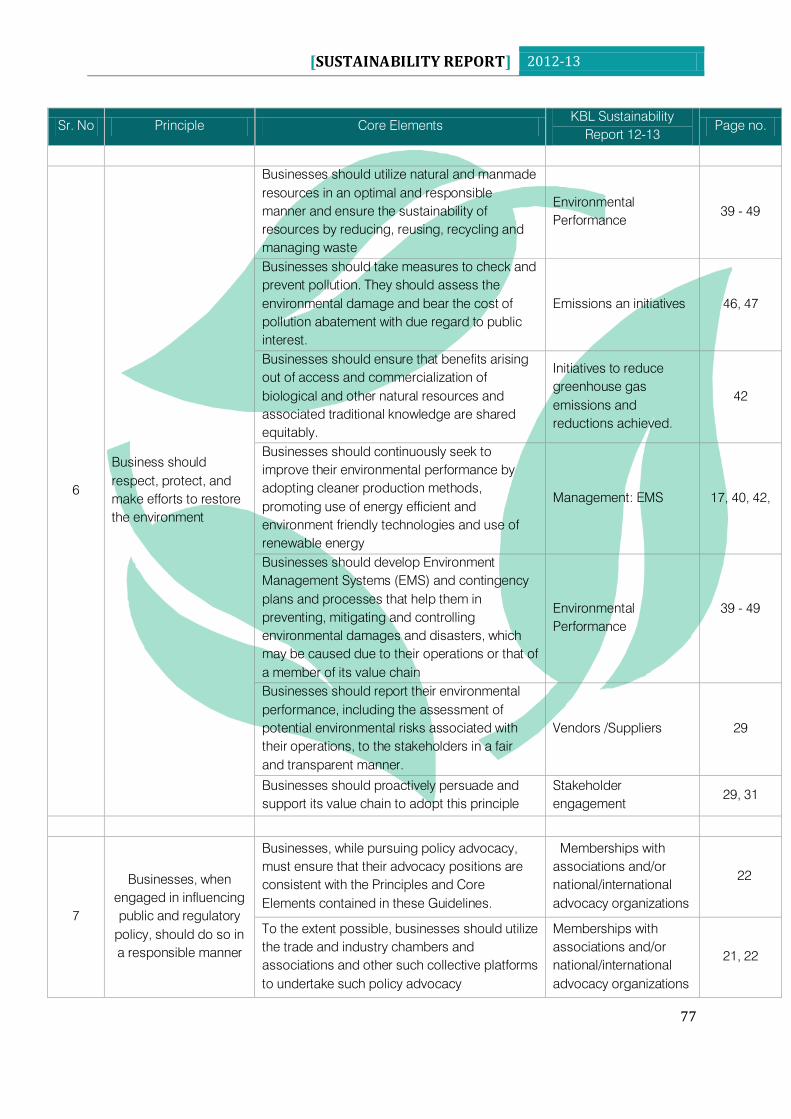
[SUSTAINABILITY REPORT] 2012-13
77
Sr. No Principle Core Elements
KBL Sustainability
Report 12-13
Page no.
6
Business should
respect, protect, and
make efforts to restore
the environment
Businesses should utilize natural and manmade
resources in an optimal and responsible
manner and ensure the sustainability of
resources by reducing, reusing, recycling and
managing waste
Environmental
Performance
39 - 49
Businesses should take measures to check and
prevent pollution. They should assess the
environmental damage and bear the cost of
pollution abatement with due regard to public
interest.
Emissions an initiatives 46, 47
Businesses should ensure that benefits arising
out of access and commercialization of
biological and other natural resources and
associated traditional knowledge are shared
equitably.
Initiatives to reduce
greenhouse gas
emissions and
reductions achieved.
42
Businesses should continuously seek to
improve their environmental performance by
adopting cleaner production methods,
promoting use of energy efficient and
environment friendly technologies and use of
renewable energy
Management: EMS 17, 40, 42,
Businesses should develop Environment
Management Systems (EMS) and contingency
plans and processes that help them in
preventing, mitigating and controlling
environmental damages and disasters, which
may be caused due to their operations or that of
a member of its value chain
Environmental
Performance
39 - 49
Businesses should report their environmental
performance, including the assessment of
potential environmental risks associated with
their operations, to the stakeholders in a fair
and transparent manner.
Vendors /Suppliers 29
Businesses should proactively persuade and
support its value chain to adopt this principle
Stakeholder
engagement
29, 31
7
Businesses, when
engaged in influencing
public and regulatory
policy, should do so in
a responsible manner
Businesses, while pursuing policy advocacy,
must ensure that their advocacy positions are
consistent with the Principles and Core
Elements contained in these Guidelines.
Memberships with
associations and/or
national/international
advocacy organizations
22
To the extent possible, businesses should utilize
the trade and industry chambers and
associations and other such collective platforms
to undertake such policy advocacy
Memberships with
associations and/or
national/international
advocacy organizations
21, 22
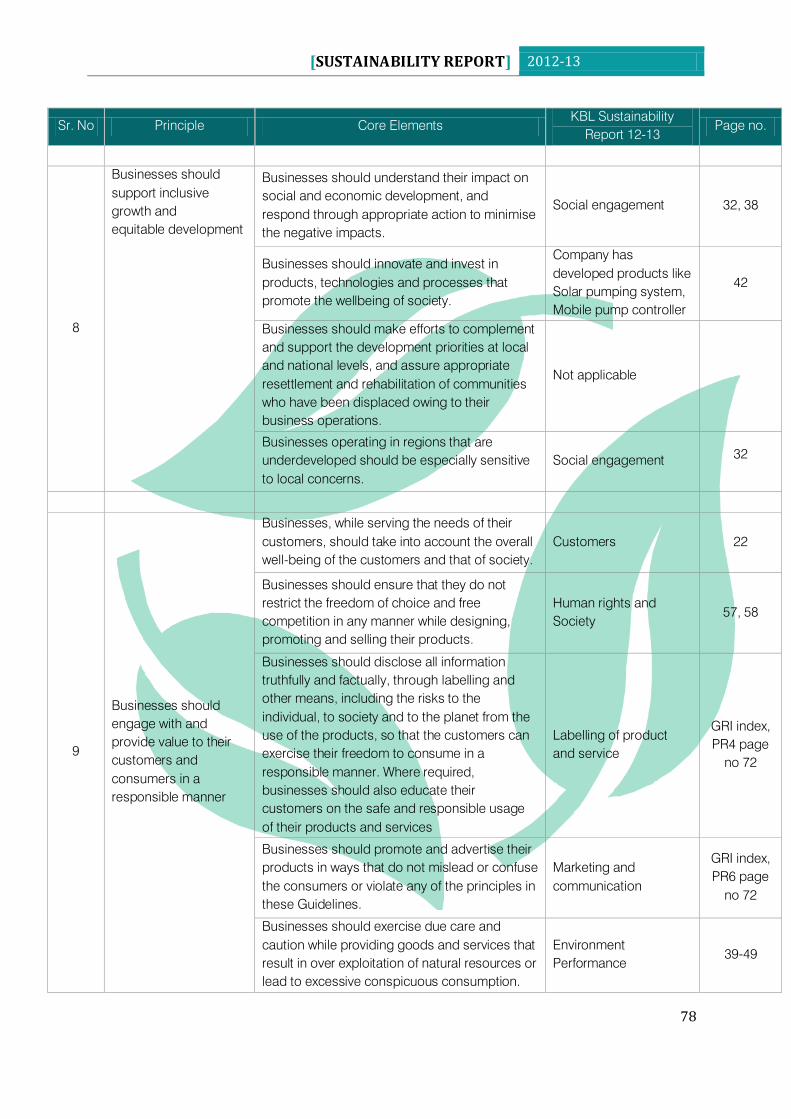
[SUSTAINABILITY REPORT] 2012-13
78
Sr. No Principle Core Elements
KBL Sustainability
Report 12-13
Page no.
8
Businesses should
support inclusive
growth and
equitable development
Businesses should understand their impact on
social and economic development, and
respond through appropriate action to minimise
the negative impacts.
Social engagement 32, 38
Businesses should innovate and invest in
products, technologies and processes that
promote the wellbeing of society.
Company has
developed products like
Solar pumping system,
Mobile pump controller
42
Businesses should make efforts to complement
and support the development priorities at local
and national levels, and assure appropriate
resettlement and rehabilitation of communities
who have been displaced owing to their
business operations.
Not applicable
Businesses operating in regions that are
underdeveloped should be especially sensitive
to local concerns.
Social engagement 32
9
Businesses should
engage with and
provide value to their
customers and
consumers in a
responsible manner
Businesses, while serving the needs of their
customers, should take into account the overall
well-being of the customers and that of society.
Customers 22
Businesses should ensure that they do not
restrict the freedom of choice and free
competition in any manner while designing,
promoting and selling their products.
Human rights and
Society
57, 58
Businesses should disclose all information
truthfully and factually, through labelling and
other means, including the risks to the
individual, to society and to the planet from the
use of the products, so that the customers can
exercise their freedom to consume in a
responsible manner. Where required,
businesses should also educate their
customers on the safe and responsible usage
of their products and services
Labelling of product
and service
GRI index,
PR4 page
no 72
Businesses should promote and advertise their
products in ways that do not mislead or confuse
the consumers or violate any of the principles in
these Guidelines.
Marketing and
communication
GRI index,
PR6 page
no 72
Businesses should exercise due care and
caution while providing goods and services that
result in over exploitation of natural resources or
lead to excessive conspicuous consumption.
Environment
Performance
39-49
[SUSTAINABILITY REPORT] 2012-13
79
Sr. No Principle Core Elements
KBL Sustainability
Report 12-13
Page no.
Businesses should provide adequate grievance
handling mechanisms to address customer
concerns and feedback. Customer Engagement 24
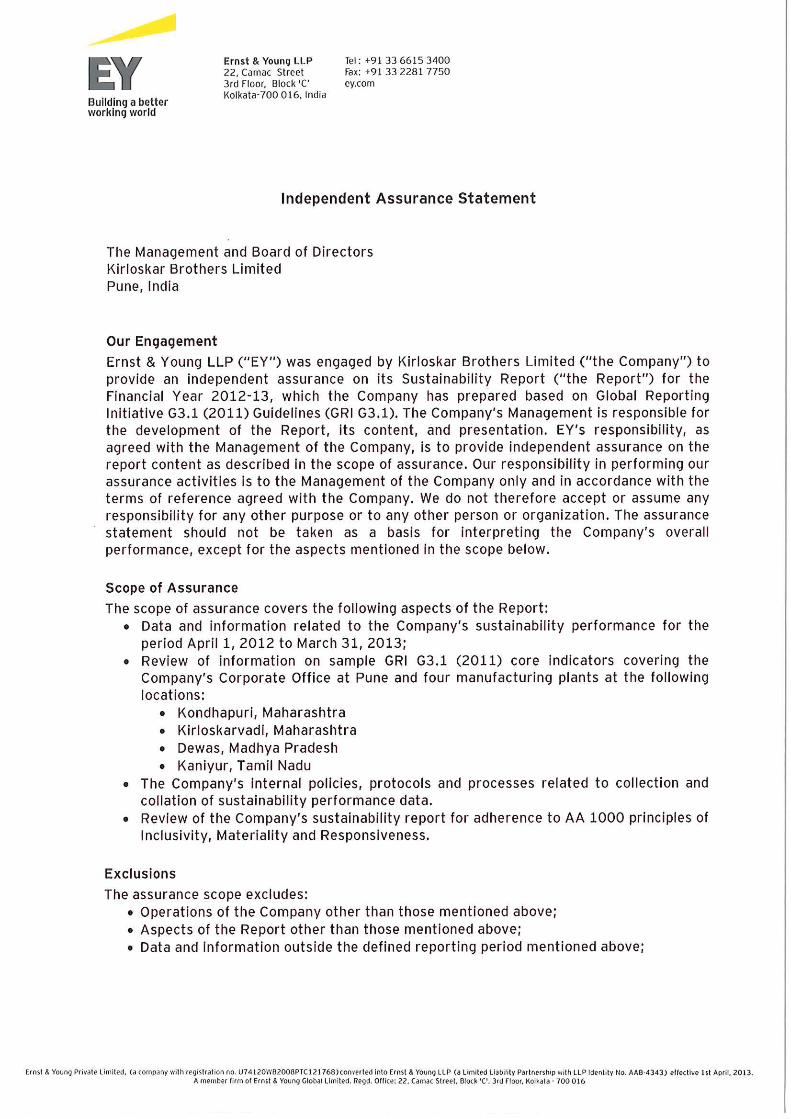
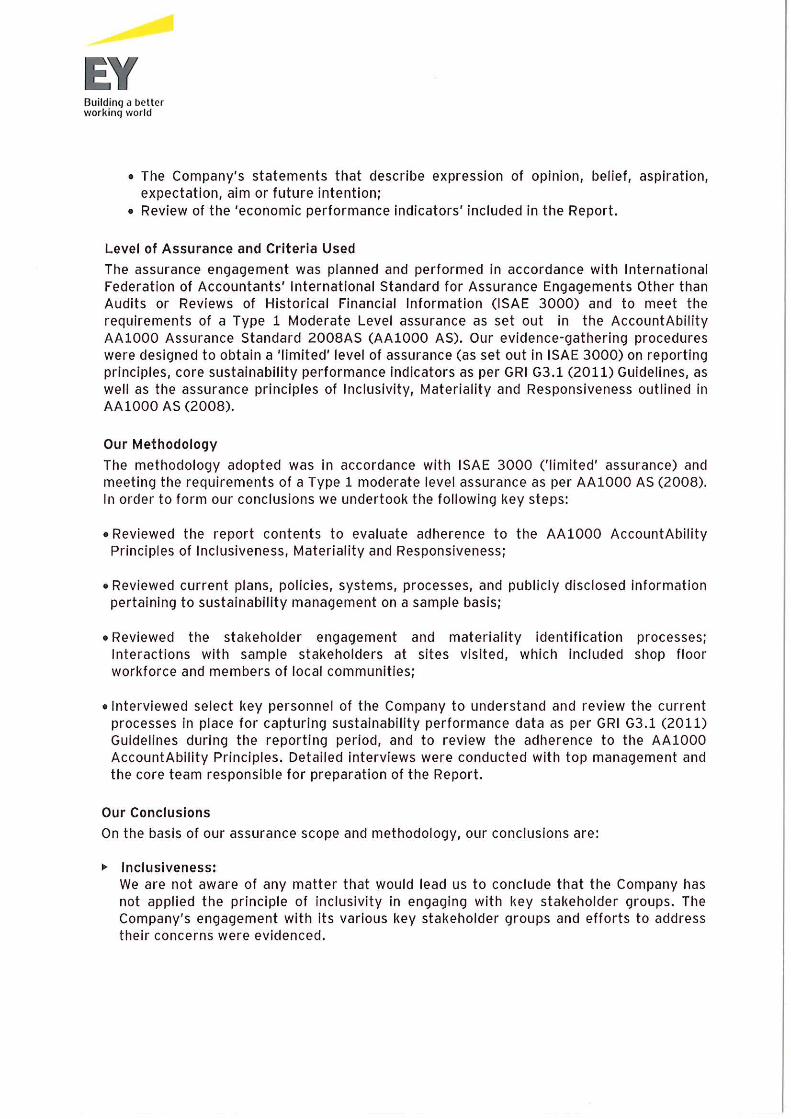
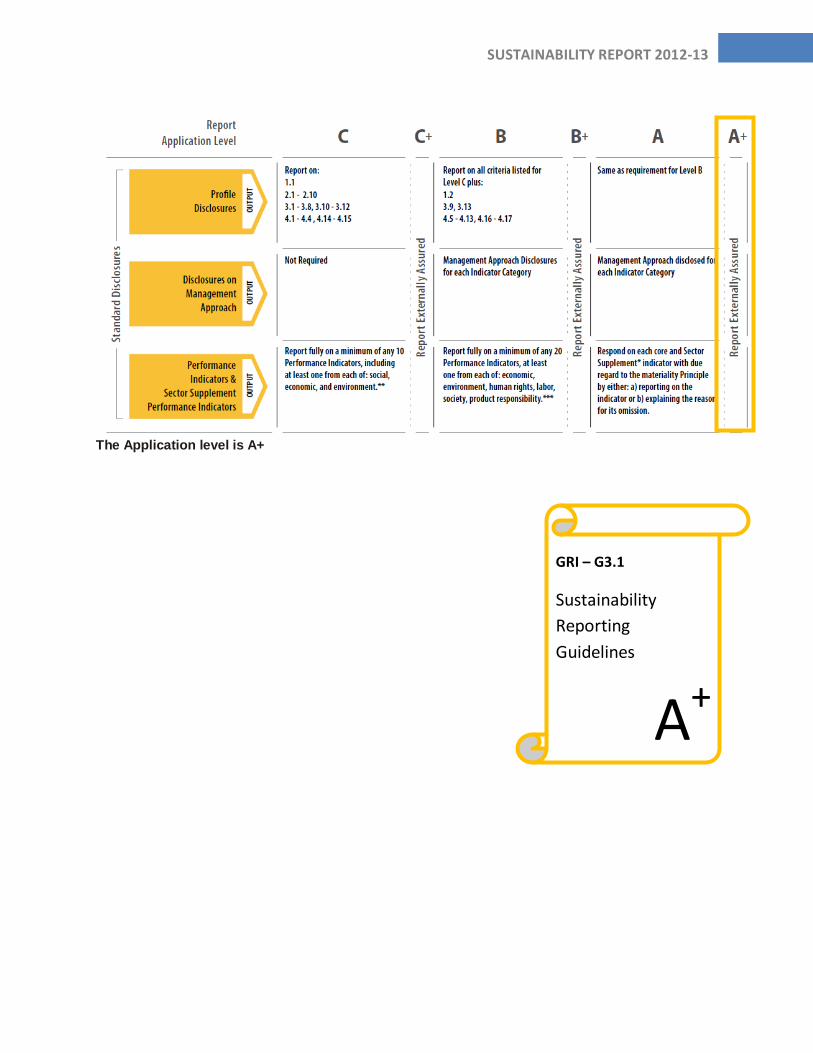
SUSTAINABILITY REPORT 2012-13
The Application level is A+
GRI – G3.1
Sustainability
Reporting
Guidelines
A+

FEEDBACK FORM FOR SUSTAINABILITY REPORT 2012-13
This is the second Sustainability report published by Kirloskar Brothers Limited. We
welcome your suggestions to improve our performance and reporting in the future
reports. Please spare few minutes of your valuable time and give us your feedback.
1. Relevance of Economic, Environment & Social issues covered in the report
High Medium Low
2. Clarity of information provided on above issues in the report
High Medium Low
3. Quality of design, Layout and presentation of the report
High Medium Low
4. Suggest any other issue which should be covered in the next sustainability report
Name :
Designation :
Organization :
Contact Address :
Email :
Please mail your feedback to: