Inland Empire Real Estate Market Update | December 2015
53
DECEMBER 2015
-
Upload
first-team -
Category
Documents
-
view
214 -
download
1
description
Riverside and San Bernardino County real estate market report including the latest December 2015 data straight from the MLS.
Transcript of Inland Empire Real Estate Market Update | December 2015

DECEMBER 2015
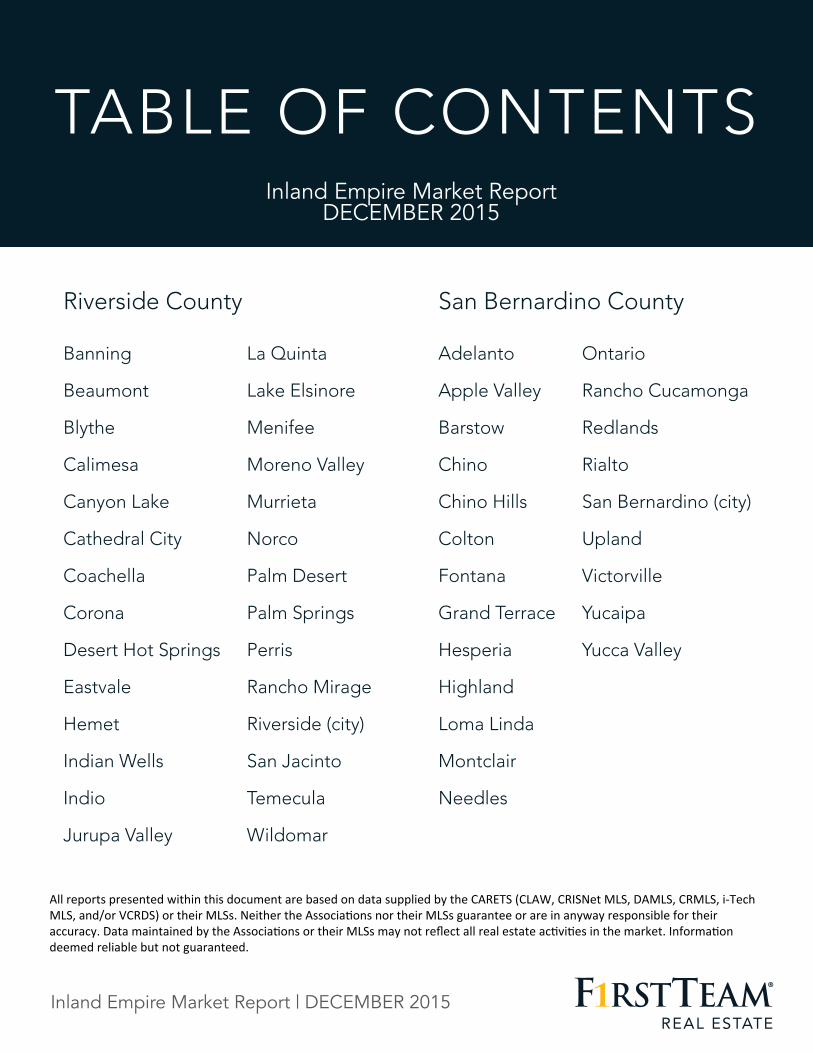
Inland Empire Market Report DECEMBER 2015
Riverside County San Bernardino County
Banning La Quinta Adelanto Ontario
Beaumont Lake Elsinore Apple Valley Rancho Cucamonga
Blythe Menifee Barstow Redlands
Calimesa Moreno Valley Chino Rialto
Canyon Lake Murrieta Chino Hills San Bernardino (city)
Cathedral City Norco Colton Upland
Coachella Palm Desert Fontana Victorville
Corona Palm Springs Grand Terrace Yucaipa
Desert Hot Springs Perris Hesperia Yucca Valley
Eastvale Rancho Mirage Highland
Hemet Riverside (city) Loma Linda
Indian Wells San Jacinto Montclair
Indio Temecula Needles
Jurupa Valley Wildomar
TABLE OF CONTENTS
All reports presented within this document are based on data supplied by the CARETS (CLAW, CRISNet MLS, DAMLS, CRMLS, i-‐Tech MLS, and/or VCRDS) or their MLSs. Neither the AssociaGons nor their MLSs guarantee or are in anyway responsible for their accuracy. Data maintained by the AssociaGons or their MLSs may not reflect all real estate acGviGes in the market. InformaGon deemed reliable but not guaranteed.
Inland Empire Market Report | DECEMBER 2015

BANNING Single Family Residence
BANNING
0
30
60
90
120
150
180
12 Months Ago 6 Months Ago 3 Months Ago Last Month
Active Inventory Pending Inventory
Sold Inventory Days on Market
Single Family Residence
12 Months Ago 6 Months Ago 3 Months Ago Last Month
Active Inventory 171 142 141 151
Pending Inventory 37 57 56 29
Sold Inventory 29 43 42 31
Average Sale Price $198,748 $237,607 $200,440 $198,001
Days on Market 111 64 82 50
Inland Empire Market Report | DECEMBER 2015

BEAUMONT
View homes for sale in Aliso Viejo >>
0
60
120
180
240
300
12 Months Ago 6 Months Ago 3 Months Ago Last Month
Active Inventory Pending Inventory
Sold Inventory Days on Market
Single Family Residence BEAUMONT
12 Months Ago 6 Months Ago 3 Months Ago Last Month
Active Inventory 223 224 239 198
Pending Inventory 82 116 92 83
Sold Inventory 51 88 63 61
Average Sale Price $241,871 $272,799 $284,978 $278,774
Days on Market 79 55 46 64
Inland Empire Market Report | DECEMBER 2015

BLYTHE
View homes for sale in Aliso Viejo >>
0
25
50
75
100
125
150
12 Months Ago 6 Months Ago 3 Months Ago Last Month
Active Inventory Pending Inventory
Sold Inventory Days on Market
BLYTHE Single Family Residence
12 Months Ago 6 Months Ago 3 Months Ago Last Month
Active Inventory 52 42 38 39
Pending Inventory 13 14 10 14
Sold Inventory 5 12 5 4
Average Sale Price $139,180 $161,143 $101,564 $67,250
Days on Market 134 102 93 108
Inland Empire Market Report | DECEMBER 2015

CALIMESA
0
20
40
60
80
100
120
12 Months Ago 6 Months Ago 3 Months Ago Last Month
Active Inventory Pending Inventory
Sold Inventory Days on Market
CALIMESA Single Family Residence
12 Months Ago 6 Months Ago 3 Months Ago Last Month
Active Inventory 15 40 34 37
Pending Inventory 8 12 19 9
Sold Inventory 6 11 9 7
Average Sale Price $271,317 $277,196 $247,444 $358,264
Days on Market 103 50 59 84
Inland Empire Market Report | DECEMBER 2015

CANYON LAKE
0 20 40 60 80
100 120 140 160 180
12 Months Ago 6 Months Ago 3 Months Ago Last Month
Active Inventory Pending Inventory
Sold Inventory Days on Market
CANYON LAKE Single Family Residence
12 Months Ago 6 Months Ago 3 Months Ago Last Month
Active Inventory 129 164 136 94
Pending Inventory 35 35 28 21
Sold Inventory 12 22 31 13
Average Sale Price $320,366 $372,220 $469,931 $405,377
Days on Market 64 84 114 167
Inland Empire Market Report | DECEMBER 2015
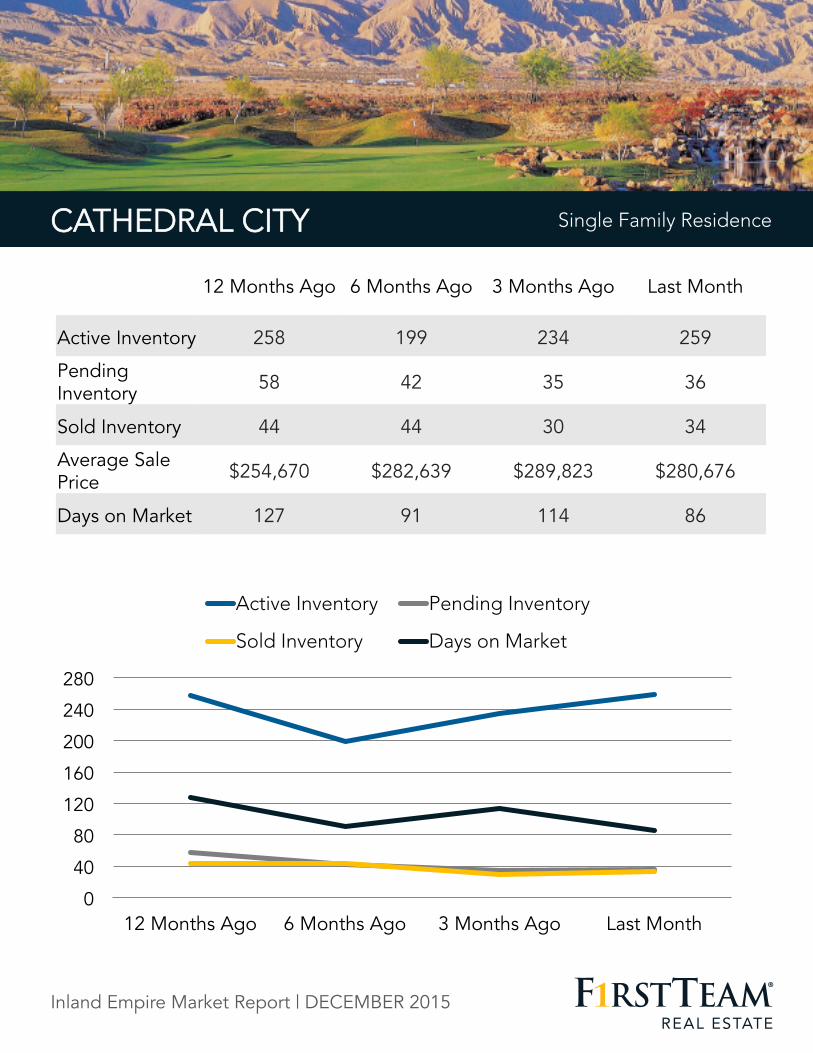
CATHEDRAL CITY
0
40
80
120
160
200
240
280
12 Months Ago 6 Months Ago 3 Months Ago Last Month
Active Inventory Pending Inventory
Sold Inventory Days on Market
Single Family Residence CATHEDRAL CITY Single Family Residence
12 Months Ago 6 Months Ago 3 Months Ago Last Month
Active Inventory 258 199 234 259
Pending Inventory 58 42 35 36
Sold Inventory 44 44 30 34
Average Sale Price $254,670 $282,639 $289,823 $280,676
Days on Market 127 91 114 86
Inland Empire Market Report | DECEMBER 2015

COACHELLA
0
20
40
60
80
100
120
12 Months Ago 6 Months Ago 3 Months Ago Last Month
Active Inventory Pending Inventory
Sold Inventory Days on Market
Single Family Residence COACHELLA Single Family Residence
12 Months Ago 6 Months Ago 3 Months Ago Last Month
Active Inventory 67 103 90 77
Pending Inventory 13 21 23 23
Sold Inventory 12 17 19 11
Average Sale Price $203,667 $222,559 $212,500 $202,011
Days on Market 111 96 88 87
Inland Empire Market Report | DECEMBER 2015

CORONA
0 100 200 300 400 500 600 700 800
12 Months Ago 6 Months Ago 3 Months Ago Last Month
Active Inventory Pending Inventory
Sold Inventory Days on Market
CORONA Single Family Residence
12 Months Ago 6 Months Ago 3 Months Ago Last Month
Active Inventory 595 666 690 598
Pending Inventory 230 290 238 156
Sold Inventory 119 227 176 179
Average Sale Price $409,209 $460,633 $441,816 $449,545
Days on Market 76 68 98 79
Inland Empire Market Report | DECEMBER 2015

DESERT HOT SPRINGS
0
50
100
150
200
250
300
350
12 Months Ago 6 Months Ago 3 Months Ago Last Month
Active Inventory Pending Inventory
Sold Inventory Days on Market
DESERT HOT SPRINGS Single Family Residence
12 Months Ago 6 Months Ago 3 Months Ago Last Month
Active Inventory 300 231 251 278
Pending Inventory 39 79 56 51
Sold Inventory 37 68 38 29
Average Sale Price $144,734 $161,085 $167,276 $166,316
Days on Market 122 126 94 66
Inland Empire Market Report | DECEMBER 2015

EASTVALE
0 30 60 90
120 150 180 210 240
12 Months Ago 6 Months Ago 3 Months Ago Last Month
Active Inventory Pending Inventory
Sold Inventory Days on Market
Single Family Residence EASTVALE Single Family Residence
12 Months Ago 6 Months Ago 3 Months Ago Last Month
Active Inventory 164 201 194 161
Pending Inventory 55 68 65 33
Sold Inventory 37 64 42 38
Average Sale Price $469,973 $503,734 $495,310 $493,153
Days on Market 95 66 86 60
Inland Empire Market Report | DECEMBER 2015
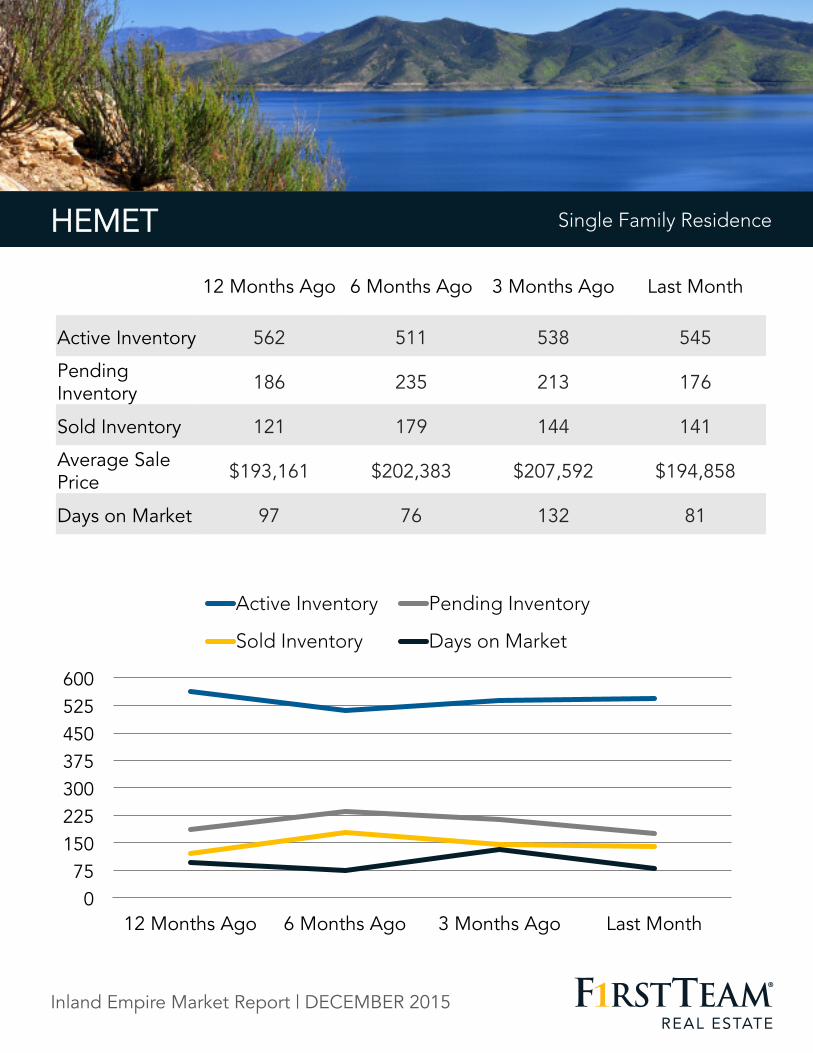
HEMET
0 75
150 225 300 375 450 525 600
12 Months Ago 6 Months Ago 3 Months Ago Last Month
Active Inventory Pending Inventory
Sold Inventory Days on Market
Single Family Residence HEMET Single Family Residence
12 Months Ago 6 Months Ago 3 Months Ago Last Month
Active Inventory 562 511 538 545
Pending Inventory 186 235 213 176
Sold Inventory 121 179 144 141
Average Sale Price $193,161 $202,383 $207,592 $194,858
Days on Market 97 76 132 81
Inland Empire Market Report | DECEMBER 2015

INDIAN WELLS
0
50
100
150
200
250
300
12 Months Ago 6 Months Ago 3 Months Ago Last Month
Active Inventory Pending Inventory
Sold Inventory Days on Market
Single Family Residence INDIAN WELLS Single Family Residence
12 Months Ago 6 Months Ago 3 Months Ago Last Month
Active Inventory 244 138 191 241
Pending Inventory 7 8 3 6
Sold Inventory 9 16 11 7
Average Sale Price $1,432,611 $1,348,828 $975,932 $789,857
Days on Market 208 194 138 120
Inland Empire Market Report | DECEMBER 2015

INDIO
0
100
200
300
400
500
600
700
12 Months Ago 6 Months Ago 3 Months Ago Last Month
Active Inventory Pending Inventory
Sold Inventory Days on Market
Single Family Residence INDIO Single Family Residence
12 Months Ago 6 Months Ago 3 Months Ago Last Month
Active Inventory 652 525 592 608
Pending Inventory 87 72 70 73
Sold Inventory 77 94 98 53
Average Sale Price $295,871 $296,945 $289,251 $332,890
Days on Market 109 127 109 115
Inland Empire Market Report | DECEMBER 2015

JURUPA VALLEY
0
20
40
60
80
100
120
12 Months Ago 6 Months Ago 3 Months Ago Last Month
Active Inventory Pending Inventory
Sold Inventory Days on Market
Single Family Residence JURUPA VALLEY Single Family Residence
12 Months Ago 6 Months Ago 3 Months Ago Last Month
Active Inventory 95 106 99 114
Pending Inventory 33 65 56 32
Sold Inventory 17 32 24 30
Average Sale Price $318,412 $373,914 $413,381 $353,207
Days on Market 61 53 104 72
Inland Empire Market Report | DECEMBER 2015

LA QUINTA
0
150
300
450
600
750
900
1050
12 Months Ago 6 Months Ago 3 Months Ago Last Month
Active Inventory Pending Inventory
Sold Inventory Days on Market
Single Family Residence LA QUINTA Single Family Residence
12 Months Ago 6 Months Ago 3 Months Ago Last Month
Active Inventory 903 642 798 934
Pending Inventory 67 79 79 68
Sold Inventory 65 109 75 62
Average Sale Price $821,111 $481,739 $633,000 $638,570
Days on Market 116 139 152 118
Inland Empire Market Report | DECEMBER 2015
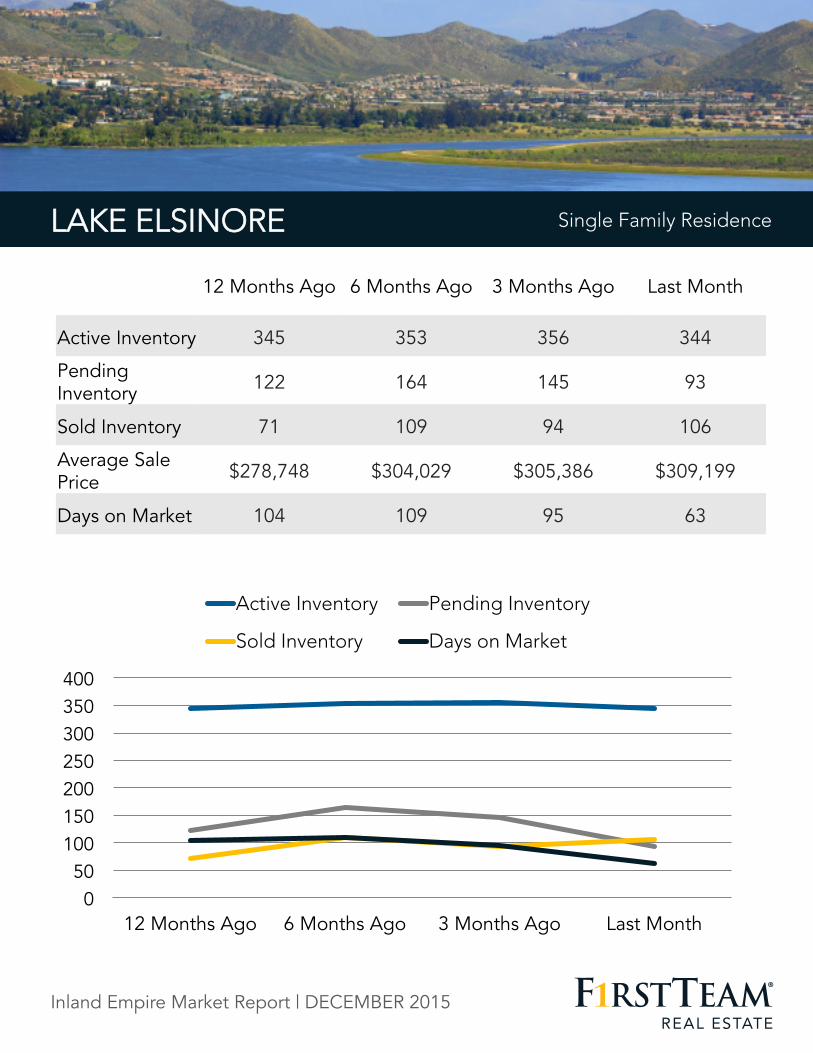
LAKE ELSINORE
0 50
100 150 200 250 300 350 400
12 Months Ago 6 Months Ago 3 Months Ago Last Month
Active Inventory Pending Inventory
Sold Inventory Days on Market
Single Family Residence LAKE ELSINORE Single Family Residence
12 Months Ago 6 Months Ago 3 Months Ago Last Month
Active Inventory 345 353 356 344
Pending Inventory 122 164 145 93
Sold Inventory 71 109 94 106
Average Sale Price $278,748 $304,029 $305,386 $309,199
Days on Market 104 109 95 63
Inland Empire Market Report | DECEMBER 2015

MENIFEE
0 50
100 150 200 250 300 350 400
12 Months Ago 6 Months Ago 3 Months Ago Last Month
Active Inventory Pending Inventory
Sold Inventory Days on Market
Single Family Residence MENIFEE Single Family Residence
12 Months Ago 6 Months Ago 3 Months Ago Last Month
Active Inventory 337 379 379 336
Pending Inventory 151 195 200 142
Sold Inventory 77 128 130 119
Average Sale Price $278,043 $303,496 $312,613 $308,633
Days on Market 63 62 72 76
Inland Empire Market Report | DECEMBER 2015

MORENO VALLEY
0 75
150 225 300 375 450 525 600
12 Months Ago 6 Months Ago 3 Months Ago Last Month
Active Inventory Pending Inventory
Sold Inventory Days on Market
Single Family Residence MORENO VALLEY Single Family Residence
12 Months Ago 6 Months Ago 3 Months Ago Last Month
Active Inventory 567 464 476 432
Pending Inventory 223 331 253 203
Sold Inventory 121 217 181 152
Average Sale Price $248,397 $268,788 $276,927 $275,951
Days on Market 77 58 43 59
Inland Empire Market Report | DECEMBER 2015

MURRIETA
0
100
200
300
400
500
600
700
12 Months Ago 6 Months Ago 3 Months Ago Last Month
Active Inventory Pending Inventory
Sold Inventory Days on Market
Single Family Residence MURRIETA Single Family Residence
12 Months Ago 6 Months Ago 3 Months Ago Last Month
Active Inventory 561 594 529 475
Pending Inventory 236 276 243 178
Sold Inventory 119 228 185 136
Average Sale Price $362,225 $391,215 $390,911 $398,578
Days on Market 88 78 70 66
Inland Empire Market Report | DECEMBER 2015
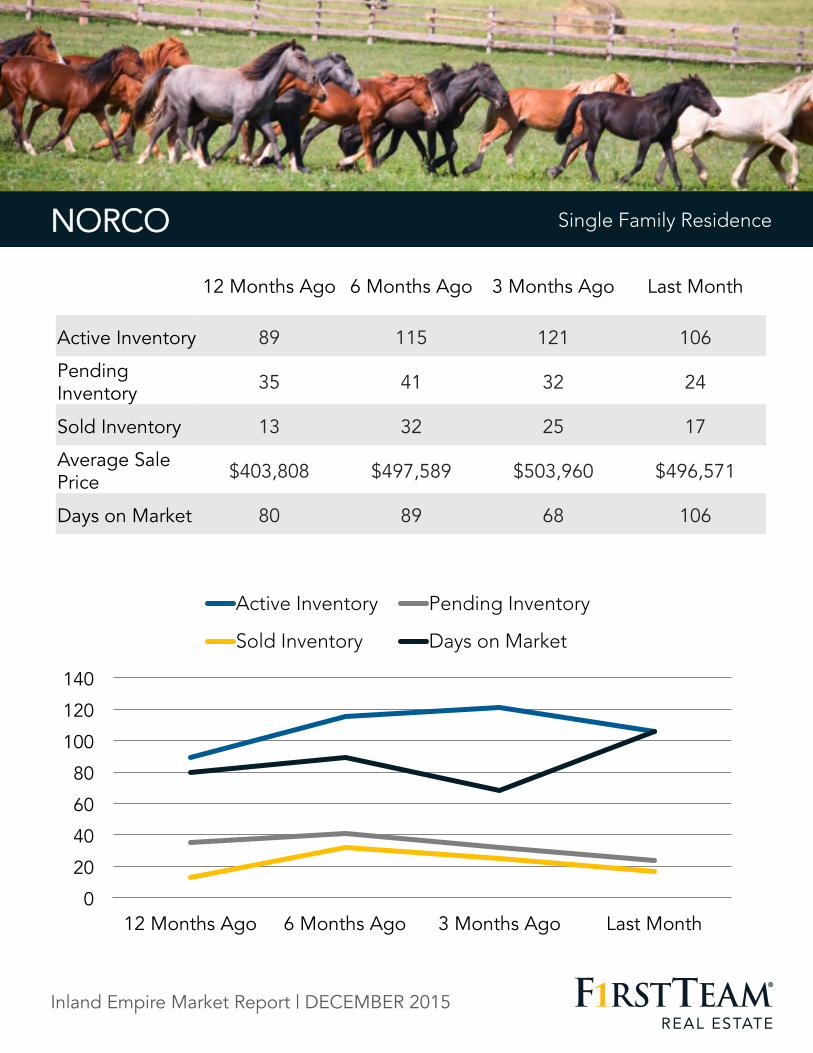
NORCO
0
20
40
60
80
100
120
140
12 Months Ago 6 Months Ago 3 Months Ago Last Month
Active Inventory Pending Inventory
Sold Inventory Days on Market
Single Family Residence NORCO Single Family Residence
12 Months Ago 6 Months Ago 3 Months Ago Last Month
Active Inventory 89 115 121 106
Pending Inventory 35 41 32 24
Sold Inventory 13 32 25 17
Average Sale Price $403,808 $497,589 $503,960 $496,571
Days on Market 80 89 68 106
Inland Empire Market Report | DECEMBER 2015

PALM DESERT
0 100 200 300 400 500 600 700 800
12 Months Ago 6 Months Ago 3 Months Ago Last Month
Active Inventory Pending Inventory
Sold Inventory Days on Market
Single Family Residence PALM DESERT Single Family Residence
12 Months Ago 6 Months Ago 3 Months Ago Last Month
Active Inventory 675 518 630 732
Pending Inventory 58 48 48 31
Sold Inventory 74 83 89 53
Average Sale Price $511,321 $489,594 $409,060 $362,513
Days on Market 113 145 113 97
Inland Empire Market Report | DECEMBER 2015

PALM SPRINGS
0
100
200
300
400
500
600
12 Months Ago 6 Months Ago 3 Months Ago Last Month
Active Inventory Pending Inventory
Sold Inventory Days on Market
Single Family Residence PALM SPRINGS Single Family Residence
12 Months Ago 6 Months Ago 3 Months Ago Last Month
Active Inventory 495 397 435 481
Pending Inventory 81 106 92 50
Sold Inventory 57 71 66 70
Average Sale Price $581,621 $602,313 $579,827 $587,975
Days on Market 116 79 124 71
Inland Empire Market Report | DECEMBER 2015

PERRIS
0 40 80
120 160 200 240 280 320
12 Months Ago 6 Months Ago 3 Months Ago Last Month
Active Inventory Pending Inventory
Sold Inventory Days on Market
Single Family Residence PERRIS Single Family Residence
12 Months Ago 6 Months Ago 3 Months Ago Last Month
Active Inventory 280 241 246 235
Pending Inventory 127 138 127 103
Sold Inventory 58 90 74 72
Average Sale Price $258,511 $248,016 $244,366 $264,257
Days on Market 66 81 78 63
Inland Empire Market Report | DECEMBER 2015

RANCHO MIRAGE
0
75
150
225
300
375
450
525
12 Months Ago 6 Months Ago 3 Months Ago Last Month
Active Inventory Pending Inventory
Sold Inventory Days on Market
Single Family Residence RANCHO MIRAGE Single Family Residence
12 Months Ago 6 Months Ago 3 Months Ago Last Month
Active Inventory 436 304 383 441
Pending Inventory 27 30 24 25
Sold Inventory 25 25 19 19
Average Sale Price $636,272 $709,901 $741,207 $888,632
Days on Market 112 184 168 136
Inland Empire Market Report | DECEMBER 2015

RIVERSIDE (city)
0
150
300
450
600
750
900
1050
12 Months Ago 6 Months Ago 3 Months Ago Last Month
Active Inventory Pending Inventory
Sold Inventory Days on Market
Single Family Residence RIVERSIDE (city) Single Family Residence
12 Months Ago 6 Months Ago 3 Months Ago Last Month
Active Inventory 874 966 917 866
Pending Inventory 348 510 400 271
Sold Inventory 188 342 273 235
Average Sale Price $331,792 $365,913 $361,400 $373,944
Days on Market 85 87 74 67
Inland Empire Market Report | DECEMBER 2015

SAN JACINTO
0 30 60 90
120 150 180 210 240
12 Months Ago 6 Months Ago 3 Months Ago Last Month
Active Inventory Pending Inventory
Sold Inventory Days on Market
Single Family Residence SAN JACINTO Single Family Residence
12 Months Ago 6 Months Ago 3 Months Ago Last Month
Active Inventory 216 212 196 202
Pending Inventory 79 104 87 78
Sold Inventory 41 73 69 45
Average Sale Price $206,733 $223,909 $212,773 $209,792
Days on Market 72 52 71 53
Inland Empire Market Report | DECEMBER 2015

TEMECULA TEMECULA
0 100 200 300 400 500 600 700 800
12 Months Ago 6 Months Ago 3 Months Ago Last Month
Active Inventory Pending Inventory
Sold Inventory Days on Market
Single Family Residence
12 Months Ago 6 Months Ago 3 Months Ago Last Month
Active Inventory 569 687 571 501
Pending Inventory 225 292 256 178
Sold Inventory 114 255 154 150
Average Sale Price $403,619 $445,173 $475,440 $473,454
Days on Market 78 81 74 99
Inland Empire Market Report | DECEMBER 2015

WILDOMAR WILDOMAR
0
20
40
60
80
100
120
140
12 Months Ago 6 Months Ago 3 Months Ago Last Month
Active Inventory Pending Inventory
Sold Inventory Days on Market
Single Family Residence
12 Months Ago 6 Months Ago 3 Months Ago Last Month
Active Inventory 128 118 116 105
Pending Inventory 51 72 54 36
Sold Inventory 26 56 31 40
Average Sale Price $306,225 $332,449 $306,444 $320,843
Days on Market 74 46 67 82
Inland Empire Market Report | DECEMBER 2015

ADELANTO
0 40 80
120 160 200 240 280 320
12 Months Ago 6 Months Ago 3 Months Ago Last Month
Active Inventory Pending Inventory
Sold Inventory Days on Market
Single Family Residence ADELANTO Single Family Residence
12 Months Ago 6 Months Ago 3 Months Ago Last Month
Active Inventory 134 107 112 98
Pending Inventory 32 59 48 54
Sold Inventory 19 36 33 27
Average Sale Price $144,692 $154,564 $156,571 $158,300
Days on Market 75 66 55 59
Inland Empire Market Report | DECEMBER 2015

APPLE VALLEY
0 50
100 150 200 250 300 350 400
12 Months Ago 6 Months Ago 3 Months Ago Last Month
Active Inventory Pending Inventory
Sold Inventory Days on Market
Single Family Residence APPLE VALLEY Single Family Residence
12 Months Ago 6 Months Ago 3 Months Ago Last Month
Active Inventory 269 335 330 273
Pending Inventory 69 100 88 60
Sold Inventory 43 72 78 55
Average Sale Price $209,935 $223,555 $212,923 $215,185
Days on Market 125 80 89 100
Inland Empire Market Report | DECEMBER 2015

BARSTOW
0
20
40
60
80
100
120
140
12 Months Ago 6 Months Ago 3 Months Ago Last Month
Active Inventory Pending Inventory
Sold Inventory Days on Market
Single Family Residence BARSTOW Single Family Residence
12 Months Ago 6 Months Ago 3 Months Ago Last Month
Active Inventory 51 59 49 44
Pending Inventory 9 16 15 14
Sold Inventory 4 7 6 7
Average Sale Price $75,500 $87,499 $99,634 $105,557
Days on Market 82 93 116 92
Inland Empire Market Report | DECEMBER 2015

CHINO
0 30 60 90
120 150 180 210 240
12 Months Ago 6 Months Ago 3 Months Ago Last Month
Active Inventory Pending Inventory
Sold Inventory Days on Market
Single Family Residence CHINO Single Family Residence
12 Months Ago 6 Months Ago 3 Months Ago Last Month
Active Inventory 155 227 189 180
Pending Inventory 55 87 83 44
Sold Inventory 32 58 65 58
Average Sale Price $470,867 $443,730 $444,431 $482,643
Days on Market 80 72 94 92
Inland Empire Market Report | DECEMBER 2015

CHINO HILLS
0
50
100
150
200
250
300
350
12 Months Ago 6 Months Ago 3 Months Ago Last Month
Active Inventory Pending Inventory
Sold Inventory Days on Market
Single Family Residence CHINO HILLS Single Family Residence
12 Months Ago 6 Months Ago 3 Months Ago Last Month
Active Inventory 205 298 247 217
Pending Inventory 80 90 83 42
Sold Inventory 42 73 84 61
Average Sale Price $614,901 $678,596 $653,731 $664,170
Days on Market 81 69 74 88
Inland Empire Market Report | DECEMBER 2015

COLTON
0
20
40
60
80
100
120
140
12 Months Ago 6 Months Ago 3 Months Ago Last Month
Active Inventory Pending Inventory
Sold Inventory Days on Market
Single Family Residence COLTON Single Family Residence
12 Months Ago 6 Months Ago 3 Months Ago Last Month
Active Inventory 99 82 118 104
Pending Inventory 49 70 58 54
Sold Inventory 32 46 40 35
Average Sale Price $229,997 $221,920 $283,499 $254,524
Days on Market 59 45 40 59
Inland Empire Market Report | DECEMBER 2015

FONTANA
0
100
200
300
400
500
600
12 Months Ago 6 Months Ago 3 Months Ago Last Month
Active Inventory Pending Inventory
Sold Inventory Days on Market
Single Family Residence FONTANA Single Family Residence
12 Months Ago 6 Months Ago 3 Months Ago Last Month
Active Inventory 540 508 477 472
Pending Inventory 231 292 245 164
Sold Inventory 142 205 124 157
Average Sale Price $317,255 $346,082 $338,125 $348,136
Days on Market 63 52 48 58
Inland Empire Market Report | DECEMBER 2015

GRAND TERRACE
0
10
20
30
40
50
60
70
12 Months Ago 6 Months Ago 3 Months Ago Last Month
Active Inventory Pending Inventory
Sold Inventory Days on Market
Single Family Residence GRAND TERRACE Single Family Residence
12 Months Ago 6 Months Ago 3 Months Ago Last Month
Active Inventory 23 24 27 29
Pending Inventory 17 9 7 6
Sold Inventory 7 14 11 5
Average Sale Price $299,645 $329,564 $352,454 $298,380
Days on Market 64 46 52 51
Inland Empire Market Report | DECEMBER 2015

HESPERIA
0 40 80
120 160 200 240 280 320
12 Months Ago 6 Months Ago 3 Months Ago Last Month
Active Inventory Pending Inventory
Sold Inventory Days on Market
Single Family Residence HESPERIA Single Family Residence
12 Months Ago 6 Months Ago 3 Months Ago Last Month
Active Inventory 281 251 263 240
Pending Inventory 79 139 95 80
Sold Inventory 51 89 80 68
Average Sale Price $186,540 $218,223 $210,649 $219,164
Days on Market 75 51 58 74
Inland Empire Market Report | DECEMBER 2015

HIGHLAND
0 20 40 60 80
100 120 140 160
12 Months Ago 6 Months Ago 3 Months Ago Last Month
Active Inventory Pending Inventory
Sold Inventory Days on Market
Single Family Residence HIGHLAND Single Family Residence
12 Months Ago 6 Months Ago 3 Months Ago Last Month
Active Inventory 150 130 132 125
Pending Inventory 65 59 63 44
Sold Inventory 32 45 40 47
Average Sale Price $251,328 $253,371 $266,047 $308,591
Days on Market 62 49 44 80
Inland Empire Market Report | DECEMBER 2015

LOMA LINDA
0 20 40 60 80
100 120 140 160
12 Months Ago 6 Months Ago 3 Months Ago Last Month
Active Inventory Pending Inventory
Sold Inventory Days on Market
Single Family Residence LOMA LINDA Single Family Residence
12 Months Ago 6 Months Ago 3 Months Ago Last Month
Active Inventory 45 44 39 28
Pending Inventory 14 22 22 16
Sold Inventory 5 20 7 14
Average Sale Price $334,800 $358,485 $377,114 $347,286
Days on Market 74 71 136 80
Inland Empire Market Report | DECEMBER 2015

MONTCLAIR
0 10 20 30 40 50 60 70 80 90
12 Months Ago 6 Months Ago 3 Months Ago Last Month
Active Inventory Pending Inventory
Sold Inventory Days on Market
Single Family Residence MONTCLAIR Single Family Residence
12 Months Ago 6 Months Ago 3 Months Ago Last Month
Active Inventory 48 45 57 65
Pending Inventory 15 22 29 21
Sold Inventory 12 21 14 17
Average Sale Price $339,545 $360,381 $356,046 $345,565
Days on Market 56 77 37 51
Inland Empire Market Report | DECEMBER 2015

NEEDLES
0 50
100 150 200 250 300 350 400 450
12 Months Ago 6 Months Ago 3 Months Ago Last Month
Active Inventory Pending Inventory
Sold Inventory Days on Market
Single Family Residence NEEDLES Single Family Residence
12 Months Ago 6 Months Ago 3 Months Ago Last Month
Active Inventory 25 27 30 33
Pending Inventory 1 5 1 1
Sold Inventory 2 2 2 2
Average Sale Price $100,500 $91,250 $110,000 $103,700
Days on Market 192 151 386 11
Inland Empire Market Report | DECEMBER 2015

ONTARIO
0
40
80
120
160
200
240
280
12 Months Ago 6 Months Ago 3 Months Ago Last Month
Active Inventory Pending Inventory
Sold Inventory Days on Market
Single Family Residence ONTARIO Single Family Residence
12 Months Ago 6 Months Ago 3 Months Ago Last Month
Active Inventory 262 257 257 252
Pending Inventory 98 160 135 93
Sold Inventory 56 96 89 80
Average Sale Price $334,087 $349,265 $359,565 $371,871
Days on Market 44 53 50 61
Inland Empire Market Report | DECEMBER 2015

RANCHO CUCAMONGA
0
75
150
225
300
375
450
525
12 Months Ago 6 Months Ago 3 Months Ago Last Month
Active Inventory Pending Inventory
Sold Inventory Days on Market
Single Family Residence RANCHO CUCAMONGA Single Family Residence
12 Months Ago 6 Months Ago 3 Months Ago Last Month
Active Inventory 354 430 348 357
Pending Inventory 143 169 153 104
Sold Inventory 94 140 121 93
Average Sale Price $493,446 $520,706 $520,844 $549,304
Days on Market 104 57 67 75
Inland Empire Market Report | DECEMBER 2015

REDLANDS
0
40
80
120
160
200
240
280
12 Months Ago 6 Months Ago 3 Months Ago Last Month
Active Inventory Pending Inventory
Sold Inventory Days on Market
Single Family Residence REDLANDS Single Family Residence
12 Months Ago 6 Months Ago 3 Months Ago Last Month
Active Inventory 188 246 245 211
Pending Inventory 74 108 77 54
Sold Inventory 36 82 66 55
Average Sale Price $384,078 $375,961 $432,912 $371,713
Days on Market 73 55 87 83
Inland Empire Market Report | DECEMBER 2015

RIALTO
0
40
80
120
160
200
240
280
12 Months Ago 6 Months Ago 3 Months Ago Last Month
Active Inventory Pending Inventory
Sold Inventory Days on Market
Single Family Residence RIALTO Single Family Residence
12 Months Ago 6 Months Ago 3 Months Ago Last Month
Active Inventory 231 169 184 180
Pending Inventory 108 128 114 95
Sold Inventory 39 88 62 71
Average Sale Price $257,050 $288,525 $279,985 $291,314
Days on Market 74 42 72 53
Inland Empire Market Report | DECEMBER 2015

SAN BERNARDINO (city)
0 75
150 225 300 375 450 525 600
12 Months Ago 6 Months Ago 3 Months Ago Last Month
Active Inventory Pending Inventory
Sold Inventory Days on Market
Single Family Residence SAN BERNARDINO (city) Single Family Residence
12 Months Ago 6 Months Ago 3 Months Ago Last Month
Active Inventory 551 479 507 503
Pending Inventory 210 350 279 213
Sold Inventory 146 185 172 148
Average Sale Price $212,197 $219,167 $229,346 $240,953
Days on Market 69 56 63 61
Inland Empire Market Report | DECEMBER 2015

UPLAND
0
40
80
120
160
200
240
12 Months Ago 6 Months Ago 3 Months Ago Last Month
Active Inventory Pending Inventory
Sold Inventory Days on Market
Single Family Residence UPLAND Single Family Residence
12 Months Ago 6 Months Ago 3 Months Ago Last Month
Active Inventory 162 221 207 191
Pending Inventory 59 83 79 46
Sold Inventory 44 88 53 43
Average Sale Price $469,061 $555,411 $593,574 $505,837
Days on Market 72 75 86 77
Inland Empire Market Report | DECEMBER 2015

VICTORVILLE
0
80
160
240
320
400
480
560
12 Months Ago 6 Months Ago 3 Months Ago Last Month
Active Inventory Pending Inventory
Sold Inventory Days on Market
Single Family Residence VICTORVILLE Single Family Residence
12 Months Ago 6 Months Ago 3 Months Ago Last Month
Active Inventory 469 483 428 389
Pending Inventory 154 214 191 142
Sold Inventory 94 129 112 113
Average Sale Price $184,595 $202,028 $203,483 $191,215
Days on Market 82 80 70 85
Inland Empire Market Report | DECEMBER 2015

YUCAIPA
0
30
60
90
120
150
180
210
12 Months Ago 6 Months Ago 3 Months Ago Last Month
Active Inventory Pending Inventory
Sold Inventory Days on Market
Single Family Residence YUCAIPA Single Family Residence
12 Months Ago 6 Months Ago 3 Months Ago Last Month
Active Inventory 168 189 192 186
Pending Inventory 60 103 81 44
Sold Inventory 44 61 52 47
Average Sale Price $309,039 $344,856 $344,764 $336,845
Days on Market 80 120 79 60
Inland Empire Market Report | DECEMBER 2015

YUCCA VALLEY
0
50
100
150
200
250
300
12 Months Ago 6 Months Ago 3 Months Ago Last Month
Active Inventory Pending Inventory
Sold Inventory Days on Market
Single Family Residence YUCCA VALLEY Single Family Residence
12 Months Ago 6 Months Ago 3 Months Ago Last Month
Active Inventory 235 244 221 193
Pending Inventory 51 51 51 40
Sold Inventory 31 46 44 36
Average Sale Price $152,494 $163,197 $152,154 $166,091
Days on Market 92 98 169 187
Inland Empire Market Report | DECEMBER 2015

Contact one of our local neighborhood experts for more exclusive market data, or to help you get started with buying or selling your next home.
Email: [email protected]
Phone: 888-870-1142
Web: FirstTeam.com
Connect With Us!
WANT MORE INFO?
Inland Empire Market Report | DECEMBER 2015