Inland Empire Food Pantries in Relation to Social ...
33
Inland Empire Food Pantries in Relation to Social Vulnerability, Poverty, Homelessness & COVID- 19 Cases MPP Capstone Presented by: Larysha Green & María Botero Omary June 14, 2020 School of Public Policy University of California, Riverside
Transcript of Inland Empire Food Pantries in Relation to Social ...

Inland Empire Food Pantries in
Relation to Social Vulnerability,
Poverty, Homelessness & COVID-
19 Cases
MPP Capstone
Presented by:
Larysha Green & María Botero Omary
June 14, 2020
School of Public Policy
University of California, Riverside

1
Table of Contents
ABSTRACT 2
INTRODUCTION 3
LITERATURE REVIEW 4
METHODS 14
RESULTS AND KEY FINDINGS 21
LIMITATIONS 30
CONCLUSIONS & FUTURE RESEARCH 31

2
ABSTRACT
Spatial analysis was conducted to find hot spots for availability of food pantry resources to at-risk
populations due to social vulnerability, poverty, homelessness, and COVID-19 cases in the Inland
Empire, to help identify vulnerable cities within the region and to propose target cities for San
Bernardino and Riverside Counties to increase food pantry resources to these communities. Food
pantry data for the IE was mainly obtained from the San Bernardino County Public Health
Department. Social vulnerability and below-poverty data were collected from the Centers for
Disease Control and Prevention website, and Point-In-Time homeless data and COVID-19 case
data were collected from the Department of Housing and Human Development and the Public
Health Departments for San Bernardino and Riverside Counties, respectively. Food pantry
addresses for both counties were assigned a spatial location in a map (geocoded), rates of social
vulnerability, poverty, homeless count, and COVID-19 cases per food pantry were calculated, and
hot spot analyses were conducted. The null hypothesis of the study states the complete spatial
randomness of the values associated with each of the data sets used. Western region cities were
more food pantry-rich in comparison to Eastern region cities. Some Eastern region cities, despite
their affluence, lacked food pantry resources to assist poor people, homeless people, and those
affected by COVID-19, in particular, Desert Hot Springs, Cathedral City, Palm Springs, and
Rancho Mirage. Far Eastern cities such as Blythe and Needles showed greater challenges to
respond to public health crises such as COVID-19. Consequently, food pantry resources through
relief packages and/or funding to non-profit organizations in Eastern region cities are needed.
Local churches in this region shall be engaged and supported to develop food pantry infrastructure,
and more mobile food pantries to serve remote communities should be promoted.

3
INTRODUCTION
According to the Centers for Disease Control and Prevention, minorities and low
socioeconomic status populations are more socially vulnerable because of poverty, education
levels, housing quality, and lack of transportation among other factors. The COVID-19 pandemic
has mostly affected the health and finances of minority communities and those with low SES. Over
20 million jobs were lost in the U.S. by early May, resulting in a national unemployment rate of
14.7%1, a level not seen since the Great Depression. In California, 4.8 million people applied for
unemployment since March 12, resulting in about a 25% unemployment rate2. Given this sharp
increase in unemployment and economic upheaval, the federal government issued the Federal
Coronavirus Aid, Relief, and Economic Security (CARES) Act3 to help individuals, small
businesses, hospitals and struggling corporations among others. The aid included stimulus checks
and expanded unemployment benefits to eligible individuals, grants and loans along with an
eviction moratorium for homeowners and renters until July 25, 2020. The federal assistance did
not include assistance to undocumented immigrants, which constitutes about over 2 million people
in California4. To address this issue the State of California has recently approved a relief package
of $75 million for undocumented adults5, who are not eligible for other forms of government
assistance, such as unemployment benefits and federal stimulus checks. Even with this assistance,
many individuals may experience an increase in food insecurity and homelessness. To that end,
the State of California, with an already existing homeless crisis pre-COVID-19 that reached
151,000 in 2019, a 16% increase from 20186, established some protections to homeowners and
renters. Over 150 cities and counties including Riverside and San Bernardino have enacted local
eviction moratoriums protecting tenants until the end of the statewide emergency7. Despite these
protections, evictions have taken place and a potential increase in homelessness may be imminent
upon lifting of emergency rules in California and put increased pressure on food banks. Also,
Inland Empire legal residents who are yet to become U.S. citizens may not be applying for
unemployment benefits in fear of being disqualified during the citizenship application process
because of the current public charge rule although it does not apply to them8. According to the
Food Rescue Anti-Hunger Coalition of the San Bernardino County Department of Public Health,
food insecurity will become one of the many aftermaths of COVID-199, resulting in a drastic
demand at food banks.
The present study used hot spot analysis to identify at-risk populations within the Inland
Empire (IE) due to social vulnerability, poverty, homelessness, and COVID-19 cases, and to
establish target cities to increase food pantry resources for these communities. Some Eastern
region cities, despite their affluence, lacked food pantry resources to assist poor people, homeless
1 April Unemployment Rate Rose to a Record 14.7% 2 California Gov. Newsom: Federal Government Has Responsibility To Help States Recover 3 The CARES Act Works for All Americans | US Department of the Treasury 4 California Offers First Covid-19 Cash Aid to Undocumented Immigrants 5 Governor Newsom Announces New Initiatives to Support California Workers Impacted by COVID-19 6 California fast-tracks plans to house homeless residents amid COVID-19 outbreak 7 California Eviction Bans | Coronavirus 8 The USCIS “Public Charge” Barrier: Legal Immigration Just Got Tougher 9 https://www.kvcrnews.org/post/latest-covid-19-updates-inland-empire#stream/0

4
people, and those affected by COVID-19, in particular, Desert Hot Springs, Cathedral City, Palm
Springs, and Rancho Mirage. Far Eastern cities such as Blythe and Needles showed greater
challenges to respond to public health crises such as COVID-19.
LITERATURE REVIEW
Food Insecurity
Food security “exists when all people, at all times, have physical and economic access to
sufficient, safe and nutritious food to meet their dietary needs and food preferences for an active
and healthy life” according to a worldwide definition of food security based on the Plan of Action
of the Rome Declaration, adopted at the 1996 World Food Summit10. The concept is based on four
different dimensions including food availability, access to food, food utilization, and food stability.
Food availability refers to “sufficient quantities of safe and nutritious food are consistently
available to individuals within a country, are in a reasonable proximity to them or are within their
reach”, access to food refers to having adequate resources to obtaining appropriate food for a
nutritious diet by households and all individuals within them, food utilization deals with proper
biological use of food, requiring a diet that provides sufficient energy and essential nutrients,
potable water and adequate sanitation”, and stability of food supply entails a ‘reliable supply of
food products available for all people at all times.” Besides, two key concepts affecting the risk of
food insecurity among people including vulnerability and resilience are used11. The former refers
to people presently capable of maintaining an adequate level of food intake but at risk of becoming
food insecure in the future due to natural, health, life cycle, social, economic, political and/or
environmental causes. Resilience, on the other hand, has several definitions depending on the
agency. The United States Agency for International Development defines resilience as “the ability
of people, households, communities, countries, and systems to mitigate, adapt to and recover from
shocks and stresses in a manner that reduces the chronic vulnerability and facilitates inclusive
growth.”
There are different levels of food security including global, national/regional, household
and individual and a paradigm shift in food security levels from the 1970s12. In the 1970s, the
emphasis was on supply, national self-sufficiency, and world food stocks or import stabilization
schemes. In the 1980s, the focus was on access and entitlement but there were ambiguities about
whether the unit of analysis should be the individual or the household. Finally, since the 1990s,
priority has been given to access to food by individuals in the household and intra-household
resource allocation. Furthermore, food insecurity can be chronic, when there is long-term
inadequate access to enough food, transitory, when there is inadequate but temporary access to
food. More specifically, transitory includes temporary food insecurity, which is due to household
entitlements being affected by sudden and unpredictable shocks, and cyclical food insecurity,
where a regular pattern of inadequate access to food exists.
10 Maria Sassi Key Features, Indicators, and Response Design 11 Ibid., 10. 12 Ibid., 10.

5
Regarding the severity of food insecurity, there are multiple classifications, scales and
phases being used to identify the intensity of food insecurity13. For instance, the Integrated Food
Security Phase Classification (IPC), part of a global effort to develop a common approach to food
security analysis and response, undertaken by 12 agencies including the FAO, and the World Food
Programme among others14 provides a common approach to classifying the severity and magnitude
of acute food insecurity cases. It categorizes the severity of acute food insecurity at the household
by area level and with five phases including none or minimal, stressed, crisis, emergency, and
humanitarian catastrophe or famine, the most extreme situation.
In the U.S., the United States Department of Agriculture (USDA) uses two food insecurity
labels including low and very low food security15. Low food security formerly known as food
insecurity without hunger refers to reduced quality, variety, or desirability of diet, with little or no
indication of reduced food intake. Very low food security, on the other hand, previously known as
food insecurity with hunger depicts multiple indications of disrupted eating patterns and reduced
food intake. At the same time, “food-insecure households are uncertain of having, or unable to
acquire, at some time during the year, enough food to meet the needs of all their members because
they had insufficient money or other resources for food”. Both low food security and very low
food security are included in the definition of food insecurity. Also, “households with very low
food security are food insecure to the extent that normal eating patterns of some household
members are disrupted at times during the year, with self-reported food intake below levels
considered adequate.”
According to the United Nations Global Food Programme in its Global Report on Food
Crises16, the current COVID19 pandemic affecting not only the U.S. but also the rest of the world
will double the number of people facing food scarcity. In the Inland Empire, there has been an
increase in food insecurity with over 10,000 households needing assistance in San Bernardino
county due to the pandemic, most of them who did not need assistance before17.
The Household Food Security in the United States in 2018 report18 issued by the USDA’s
Economic Research Service based on data collected in the Food Security Supplement to the
Current Population Survey (CPS)19,20 (n=37,300 households responded), showed a decrease in
food insecurity in U.S. households from 11.8% in 2017 to 11.1% in 2018, returning to the 2007
pre-recession levels. Thus, 14.3 million U.S. households were food insecure at least some time
during 2018, mainly due to a lack of financial resources. In the same year, 5.6 U.S. million
households (4.3%) had very low food security, which remained unchanged compared to 2017.
13 Ibid., 10. 14 www.ipcinfo.org/ipcinfo-about/ipcinfo-partnership/en/ 15 Definitions of Food Security 16 2020 GLOBAL REPORT ON FOOD CRISES 17https://iecn.com/community%e2%80%88action-partnership-of-san-bernardino-county-receives-100000-donation-
provides-food-boxes-to-2100-families/#.XrNl5e8o4FU 18 Household Food Security in the United States in 2018 19 Homeless families and individuals were not included in these statistics. 20 10 questions were asked of households without children and 18 questions were asked only if households included
children age 0-17.

6
Relative to unemployment and poverty, other measures of hardship, food insecurity took
longer to return to pre-recession levels. See Figure 1.
Figure 1. Trends in prevalence rates of food insecurity and very low food security in
U.S. households, 1995-201821.
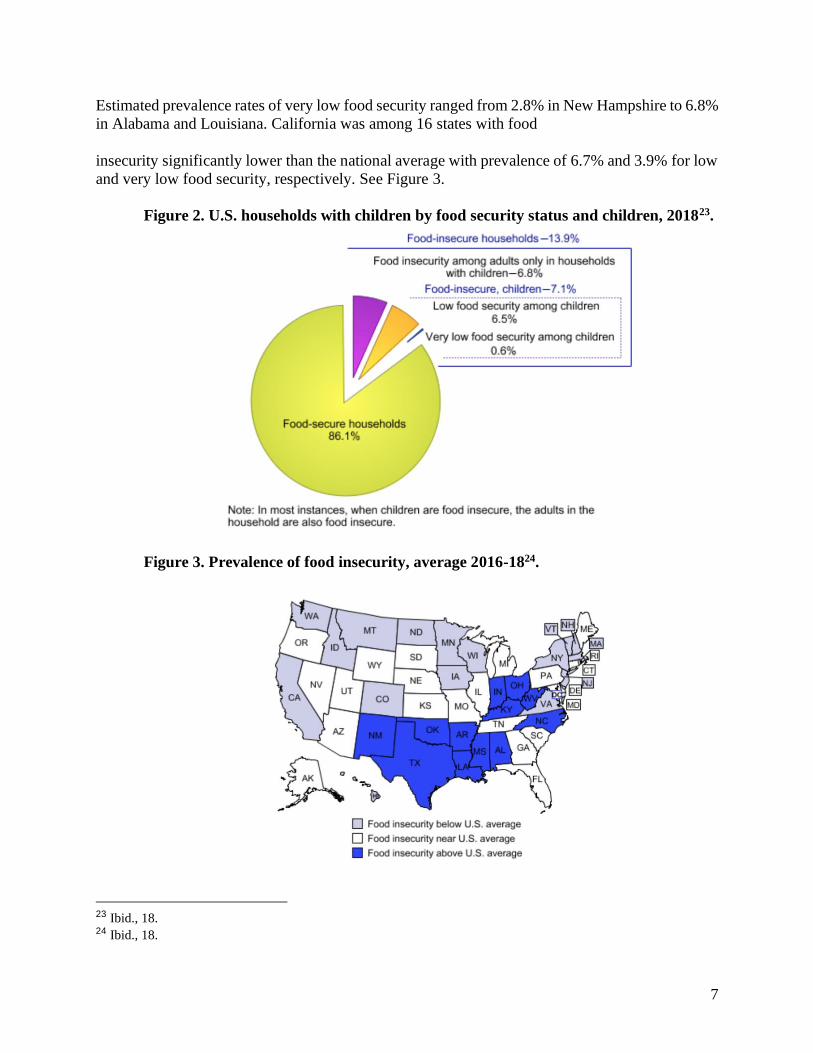
In 2018, 37.2 million people (13.9%) lived in food-insecure households including 26.2
million adults and 11.2 million children, while 2.7 million children in those households (7.1%) did
not receive nutritious food at times. Among households with children experiencing very low food
security22 (0.6 % or 220,000 households), both adults and children faced hunger, skipped meals
and were unable to eat for whole days due to a lack of money. See Figure 2.
Although overall food insecurity levels decreased in 2018, some segments of the
population continue to face higher than average food insecurity rates including households with
annual incomes 185% below the Federal poverty line (35.3%), single mother households with
children (27.8%), single father households with children (15.9%), Black, non-Hispanic households
(21.2%) and Hispanic households (16.2%).
Comparisons among states showed relevant differences due to State-level characteristics,
such as average wages, cost of housing, unemployment, and State-level policies impacting
unemployment insurance, the State Earned Income Tax Credit, and nutrition assistance programs.
Differences for 2016-2018 data ranged from 7.8% in New Hampshire to 16.8% in New Mexico.
21 Ibid., 18. 22 “Households with children are classified as food insecure if they report 3 or more indications of food insecurity in
response to the entire set of 18 questions; they are classified as having very low food security if they report 8 or
more food-insecure conditions in response to the entire set of 18 questions.”
7
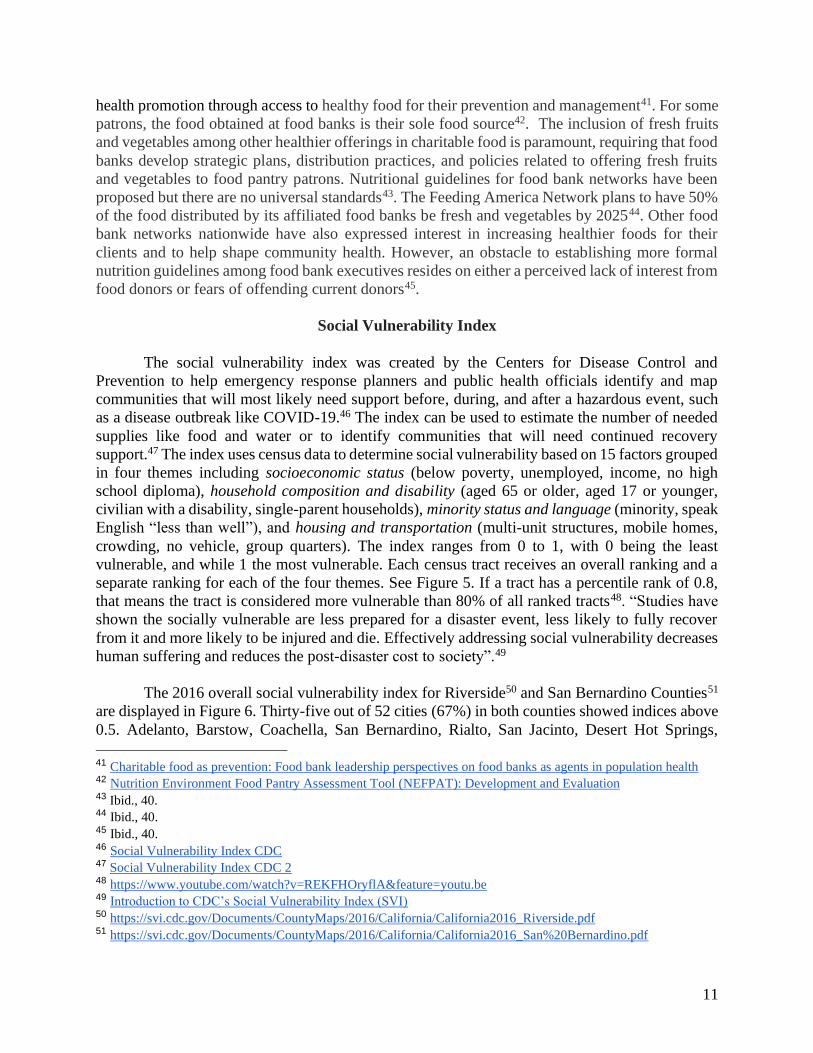
Estimated prevalence rates of very low food security ranged from 2.8% in New Hampshire to 6.8%
in Alabama and Louisiana. California was among 16 states with food
insecurity significantly lower than the national average with prevalence of 6.7% and 3.9% for low
and very low food security, respectively. See Figure 3.
Figure 2. U.S. households with children by food security status and children, 201823.
Figure 3. Prevalence of food insecurity, average 2016-1824.
23 Ibid., 18. 24 Ibid., 18.

8
Regarding Federal nutrition assistance participation and food spending, on average 56% of
food-insecure households reported having participated, in one or more of the three largest Federal
nutrition assistance programs (Supplemental Nutrition Assistance Program (SNAP); Special
Supplemental Nutrition Program for Women, Infants, and Children (WIC); and National School
Lunch Program); and the “typical (median) food-secure household spent 21% more for food than
the typical food-insecure household of the same size and composition. These estimates include
food purchases made with SNAP benefits.”
According to the Feeding America network25, the nation’s largest domestic hunger-relief
organization working alongside individuals, charities, businesses, and government to end hunger,
households with children are more likely to experience food insecurity, and many households that
face food insecurity, do not qualify for federal nutrition programs and rely on local food banks and
other hunger relief organizations for support. The same agency states that families experiencing
food insecurity come from both suburban and rural communities. The Inland Empire (IE) located
east of Los Angeles encompasses both suburban and rural areas in a region spanning Riverside
and San Bernardino Counties26, with an area of 27,000 square miles and a population of about 4
million people.
People living in rural areas face hunger at a higher rate due to increased potential of food
deserts, remote access to food banks located hours away, low-wage jobs, increased unemployment,
and underemployment27. About 2.3 million households in rural communities are dealing with
hunger, with the same communities making 63% of U.S. counties and 78% of counties reflecting
the highest rates of overall food insecurity. Sadly, the same rural communities experiencing food
insecurity are where crops are grown. Compared to urban areas where food insecurity was 10.8%
in the USDA’s 2018 Household Food Security report, food insecurity in rural areas was 12.7%
due to increased poverty28. The use of SNAP and WIC is higher among rural communities, and a
greater number of food banks and food pantries have been reported for rural areas compared to
urban areas. Although the study did not study California per se, it included Texas, which is a State
like California regarding its Latino heritage, migration pattern, and agricultural activities among
other characteristics, and Oregon, a bordering State to California. The study reported significant
struggles to food-insecure rural households including family financial challenges, along with the
distance from low-cost and healthy options. Living in rural areas provides limited employment
opportunities, a lack of safe and affordable housing, a lack of organized activities for children after
school hours, and in some cases increased crime, violence, and drugs over time. Agricultural
workers experience unemployment during the off-seasons and single-parent households and lack
of child support payments were commonplace. Participation in federal nutrition assistance
programs and charitable food assistance programs was challenging when limited access to
transportation. Dealing with SNAP customer service was difficult for participants in contrast to
WIC. For those having access to school summer meals, participating in summer schools was an
added benefit given the distance some of them had to travel. For those using food pantries, having
25 Hunger in America 26 About the Inland Empire 27 Ibid., 25. 28 Examining Food Insecurity in the Rural United States: A Qualitative Study

9
more access to meats and fresh fruits and vegetables and more conveniently located banks was
more desirable. Other issues raised to using charitable food assistance programs included quality
and quantity of food, hours of operation, paperwork, and perception linked to stigma and pride.
Using food assistance programs synergistically was reported since respondents participated in
multiple assistance programs thus, they used WIC for staple items, SNAP for preferred items, and
patronized food pantries and church programs towards the end of the month when SNAP benefits
were diminishing. Participants expressed the need for an increased number of food pantries with
improved quality of food, along with more accessibility and better directions to applying to SNAP
benefits, having elected officials recognizing the issue of food insecurity in their communities and
increased access to jobs.
Food insecurity and poverty are interrelated concepts, with the former being a cause and
manifestation of the latter. See Figure 4 for the interdependency between food insecurity and
poverty, affecting productivity and physical and cognitive development. Fighting food insecurity
involves the eradication of poverty29.
Figure 4. Interdependency between food insecurity and poverty30.
Food Banks & Food Pantries
A food bank is a non-profit that stores millions of pounds of food to be delivered to local
food programs, like a food pantry. They store food donated from local neighbors, retailers, grocery
stores, and restaurants, and vary in size, with some of them being double the size of an average
wholesale club. A food pantry, on the other hand, receives food from a food bank and is a
29 Ibid., 10. 30 Ibid., 10.

10
distribution center where hundreds of families and individuals can receive food per week31. Food
banks and food pantries are necessary community resources and play a critical role in California’s
food safety net, reaching over five million people in need, including children, seniors, the working
poor, disabled, homeless, and veterans32.
The California Association of Food Banks (CAFB) represents over 40 food banks
throughout California. They provide members with programs and services including helping food
banks build capacity, providing funding opportunities and food resources, strengthening local
advocacy programs, networking and advocating for anti-hunger programs and policies at the
federal, state and local levels, collaborating with other agencies to improve the Cal Fresh system,
provide funding and program guidance to local food banks and nonprofits that conduct Cal Fresh
Outreach programs, and through the Farm to Family program, which works with growers and
packers to provide fresh produce to food banks33.
The Feeding America network is the largest domestic hunger-relief organization. It works
with 200 food banks and 60,000 food pantries and meal programs nationwide and serves 1 out of
7 Americans34. The IE branch serves Riverside and San Bernardino counties (FARSB)35 and it is
the largest hunger-relief organization in the region. It started in 1980 and currently partners with
over 250 local nonprofit agencies and monthly distributes over 2 million pounds of food to over
100,000 people. According to their statistics, over 800,000 people are living below the poverty
line in the IE with over 400,000 food-insecure people. Besides, “compared to the U.S., a higher
share of the IE's poverty-stricken are of Hispanic origin and reside in households with heads who
are non-citizens, jobless, and with heads who are single mothers, and who lack a high school
degree. Poverty in the IE is higher than it is in the U.S., and California.”
The current COVID-19 pandemic has increased food insecurity among Californians to 31%
levels and the demand for food banks and food pantries in the IE3637. To help alleviate the pressure
on state revenues and increased need for vital public programs and services, Governor Newson
released a revised 2020-2021 budget to close the deficit and meet the demands for the COVID-19
response aid. To that end, a $30 million funding increase to the Department of Social Services was
added to assist food banks for total funding of $50 million38.
Dietary Food Quality of Food Banks: Research studies indicate that the dietary intake of most
food pantry users does not meet recommendations3940. Clients of charitable food programs may be
at higher risk for chronic diseases including diabetes, hypertension, and obesity if the emphasis of
food banks is not shifted from hunger and malnutrition alleviation through shelf-stable foods to
31 Our Work 32 California Association of Food Banks | 33 Ibid., 31. 34 Ibid., 30. 35 Inland Empire Food Bank 36 CA's May Budget Revise Provides Critical Investment in Emergency Food Program 37 Food Banks Respond to CA's 2020-21 Fiscal Statement 38 Social services including Preschool Development Grant, ECPC Council, & CalWORKs 39 The Dietary Quality of Food Pantry Users: A Systematic Review of Existing Literature 40 https://pubmed.ncbi.nlm.nih.gov/27727101/
11
health promotion through access to healthy food for their prevention and management41. For some
patrons, the food obtained at food banks is their sole food source42. The inclusion of fresh fruits
and vegetables among other healthier offerings in charitable food is paramount, requiring that food
banks develop strategic plans, distribution practices, and policies related to offering fresh fruits
and vegetables to food pantry patrons. Nutritional guidelines for food bank networks have been
proposed but there are no universal standards43. The Feeding America Network plans to have 50%
of the food distributed by its affiliated food banks be fresh and vegetables by 202544. Other food
bank networks nationwide have also expressed interest in increasing healthier foods for their
clients and to help shape community health. However, an obstacle to establishing more formal
nutrition guidelines among food bank executives resides on either a perceived lack of interest from
food donors or fears of offending current donors45.
Social Vulnerability Index
The social vulnerability index was created by the Centers for Disease Control and
Prevention to help emergency response planners and public health officials identify and map
communities that will most likely need support before, during, and after a hazardous event, such
as a disease outbreak like COVID-19.46 The index can be used to estimate the number of needed
supplies like food and water or to identify communities that will need continued recovery
support.47 The index uses census data to determine social vulnerability based on 15 factors grouped
in four themes including socioeconomic status (below poverty, unemployed, income, no high
school diploma), household composition and disability (aged 65 or older, aged 17 or younger,
civilian with a disability, single-parent households), minority status and language (minority, speak
English “less than well”), and housing and transportation (multi-unit structures, mobile homes,
crowding, no vehicle, group quarters). The index ranges from 0 to 1, with 0 being the least
vulnerable, and while 1 the most vulnerable. Each census tract receives an overall ranking and a
separate ranking for each of the four themes. See Figure 5. If a tract has a percentile rank of 0.8,
that means the tract is considered more vulnerable than 80% of all ranked tracts48. “Studies have
shown the socially vulnerable are less prepared for a disaster event, less likely to fully recover
from it and more likely to be injured and die. Effectively addressing social vulnerability decreases
human suffering and reduces the post-disaster cost to society”.49
The 2016 overall social vulnerability index for Riverside50 and San Bernardino Counties51
are displayed in Figure 6. Thirty-five out of 52 cities (67%) in both counties showed indices above
0.5. Adelanto, Barstow, Coachella, San Bernardino, Rialto, San Jacinto, Desert Hot Springs,
41 Charitable food as prevention: Food bank leadership perspectives on food banks as agents in population health 42 Nutrition Environment Food Pantry Assessment Tool (NEFPAT): Development and Evaluation 43 Ibid., 40. 44 Ibid., 40. 45 Ibid., 40. 46 Social Vulnerability Index CDC 47 Social Vulnerability Index CDC 2 48 https://www.youtube.com/watch?v=REKFHOryflA&feature=youtu.be 49 Introduction to CDC’s Social Vulnerability Index (SVI) 50 https://svi.cdc.gov/Documents/CountyMaps/2016/California/California2016_Riverside.pdf 51 https://svi.cdc.gov/Documents/CountyMaps/2016/California/California2016_San%20Bernardino.pdf

12
Hemet, Victorville, Blythe, Yucca Valley, Needles, and Twenty-nine Palms showed very high
social vulnerability with indices above 0.75. See Table 1 under Methods for more details on
indices for all 52 cities in the IE.
Figure 5. Social vulnerability index factors and themes52.
Figure 6. Overall social vulnerability indices for Riverside and San Bernardino Counties
in 20165354.
Riverside County San Bernardino County
52 Ibid., 48. 53 Ibid., 50. 54 Ibid., 51.

13
Poverty in the Inland Empire
According to the Public Policy Institute of California (PPIC)55, the average poverty rate
between 2015-2017 for Riverside and San Bernardino counties were 17.6% and 17.2%,
respectively (Figure 7). This rate is based on the California Poverty Measure, a joint research effort
between PPIC and the Stanford Center on Poverty and Inequality, and considers the cost of living
and resources from social safety net programs, unlike the official poverty measure. The
unemployment rate for the IE increased from 5.2% in March 2020 before the pandemic was
declared to 14.4% in April56, with Desert Hot Springs, East Hemet, Highgrove, and Coachella
showing the highest unemployment rates ranging from 22.65 and 21.5% as compared to 16.1% for
the State of California in the same month and according to the California Employment
Development Department. This dramatic increase in the unemployment rate for the IE due to the
COVID-19 pandemic may result in increased poverty levels among its vulnerable population.
Figure 7. Average poverty rate between 2015-2017 based on the California Poverty
Measure.57
Homelessness in the Inland Empire
Homelessness in the county of San Bernardino increased to 19.9% based on the January
23, 2020, Point-In-Time Count, with 3,125 people counted as homeless compared to the 2,607
people identified in 2019. The additional 518 homeless counted included 470 unsheltered
individuals and 48 sheltered individuals temporarily housed in shelters, motels, or through
transitional housing programs. The City of San Bernardino had the highest number of homeless
individuals at 1,056, followed by Victorville at 451, Redlands at 186, Colton at 136, and Fontana
55 California Poverty by County and Legislative District 56https://www.nbclosangeles.com/news/coronavirus/riverside-countys-unemployment-rate-hits-record-high-of-15-3-
in-april/2367538/ 57 Ibid., 52.

14
at 11658. Homelessness in Riverside increased 5% from 2,045 in 2019 to 2,155 in January of 2020
before the pandemic was declared59. The cities with the largest counts were Riverside at 587, and
Moreno Valley at 165, which quadrupled its count from the year before. The number of homeless
individuals for the IE is expected to increase given the increased unemployment rate in the region,
and the lack of a region-wide measures to prevent evictions past May 31, 2020, when the statewide
moratorium expired. There are some exceptions including the city of Riverside that extended the
moratorium for both residential and commercial renters for six months.
COVID-19 Cases in the Inland Empire
Public health crises like the COVID-19 pandemic dramatically impact the health of socially
vulnerable communities60. According to the California Health and Human Services open data
portal61, as of June 12, 2020, there were 10,616 confirmed cases and 383 deaths in Riverside
County, and 6,707 confirmed cases and 229 deaths in San Bernardino County. In Riverside
County62, the city of Riverside has shown the highest number of confirmed cases (1,670), followed
by Moreno Valley (943), Indio (688), Coachella (615), Corona (483), Jurupa Valley (440), Perris
(375), Hemet (304), Cathedral City (281) and Palm Desert (243) to name but a few. For San
Bernardino County63, on the other hand, the city of San Bernardino has shown the highest number
of confirmed cases (1,112) followed by Chino (978), Fontana (751), Ontario (639), Rialto (372),
Redlands (324), Rancho Cucamonga (321), Victorville (293), Colton (281), and Yucaipa (239) to
mention but a few. According to the LA Times coronavirus tracking system64, the number of cases
in Riverside County is declining, while they are stable in San Bernardino County.
POLICY ISSUE, RESEARCH QUESTION & OBJECTIVE
Policy issue: Availability of food pantry resources to vulnerable populations due to poverty,
homelessness, and/or COVID-19.
Research question: Which cities in the Inland Empire need to be targeted for food pantry
resources?
Objective: To propose target cities for San Bernardino & Riverside Counties to increase food
pantry resources.
58 Homelessness in San Bernardino County up 19.9% 59 https://www.pe.com/2020/05/06/riverside-countys-homeless-population-climbs-5/ 60 https://www.sciencedirect.com/science/article/pii/S0749379720302592 61 California COVID-19 Hospital Data and Case Statistics - California Health and Human Services Open Data Portal 62 https://www.latimes.com/projects/california-coronavirus-cases-tracking-outbreak/riverside-county/ 63 https://www.latimes.com/projects/california-coronavirus-cases-tracking-outbreak/san-bernardino-county/ 64 https://www.latimes.com/projects/california-coronavirus-cases-tracking-outbreak/

15
METHODS
Data Collection
This study utilizes data from multiple sources, including San Bernardino County
Department of Public Health, Riverside County Department of Public Health, the Department of
Housing and Urban Development point-in-time count, the Southern California Association of
Governments, and the Centers for Disease Control and Prevention.
Food Pantries: Point data for food pantries/resources was collected from the Food Rescue Anti-
Hunger Coalition compiled by San Bernardino County Department of Public Health Nutrition,
which was updated in March of 2020. The data was compiled as an “Inland Empire Food
Assistance Resource List,” which includes food assistance programs and services in San
Bernardino and Riverside Counties. The list of food pantries and resources was the most
comprehensive data available, but it is not exhaustive, and was used as a starting point for data
collection. Food pantries at colleges in the IE were added to the dataset. The dataset used has 581
food pantry/resource addresses in total. The food pantry/resource points were aggregated by city
in an excel file.
Social Vulnerability Index: The social vulnerability index from the Centers for Disease Control
and Prevention uses census data to determine social vulnerability. The social vulnerability index
was downloaded as a shapefile and added to ArcMap (ArcGIS, 10.8). The tracts in each city were
summarized to show the overall social vulnerability index for each city on a 0 to 100 scale.
Poverty: The number of individuals living 100% below the federal poverty level was included in
the social vulnerability index data from the Centers for Disease Control and Prevention. This data
was originally collected from the census. The tracts in each city were summarized to show the
overall number of individuals living 100% below the federal poverty level in each city.
Homelessness: The homelessness data was collected from the 2019 San Bernardino County Point-
In-Time count and the County of Riverside 2019 Point-In-Time count6566. The homeless Point-In-
Time count is federally mandated by the United States Department of Housing and Urban
Development to count the homeless population in cities throughout the nation. Homeless is defined
as adults, children, and unaccompanied children who, on the night of the count, are living in
shelters for the homeless; and those who reside in places not meant for human habitation, such as
cars, parks, sidewalks, abandoned buildings, or on the street.67 The homelessness counts were
downloaded from San Bernardino County and Riverside County Point-In-Time count reports and
aggregated into an excel file by city.
65 RivCoPIT2019 66 SBCoPIT2019 67 RivCoPIT2019 2

16
COVID-19 Cases: COVID-19 cases by city were updated on April 20th, 2020 and collected from
the Riverside County Public Health Department and the San Bernardino County Public Health
Department6869. The COVID-19 cases by city were aggregated into an excel file.
Inland Empire Cities: A shapefile of California cities was downloaded from the Southern
California Association of Governments (SCAG)70 website, and utilized to map the data by cities
in the Inland Empire.71 SCAG is the nation's largest metropolitan planning organization (MPO),
which encompasses six counties, 191 cities and more than 19 million residents. They are involved
in planning and policy initiatives for Southern California. The SCAG shapefile was downloaded
from their website and uploaded into ArcGIS. The following data was joined onto the SCAG
shapefile: (1) A count of total food pantries/resources as of March 2020, (2) a count of COVID-
19 cases as of April 2020, (3) a count of homeless individuals as of 2019, (4) and a social
vulnerability index from the 2010 census.
Data Cleaning
To connect our variables to food pantries, the field calculator tool in ArcGIS was utilized
to calculate rates per food pantry for the SVI score, poverty, number of homeless, and COVID-19
cases. In order to eliminate 0 division, 1 was added to any variable with a 0 value. Below are the
field calculations utilized:
● After selecting fields with “0” data points, field calculator: [variable] +1
● Field calculator: [SVI*100 / food pantry count]
● Field calculator: [poverty / food pantry count]
● Field calculator: [homelessness / food pantry count]
● Field calculator: [covid cases / food pantry count]
Upon creating the rates for each variable, a statistical analysis of the data to determine
which cities of the IE need more food pantries or food resources was performed.
Data Analysis
Hot Spot Analysis: This analysis will establish the availability of food pantry resources to at-risk
populations due to social vulnerability, poverty, homelessness, and COVID-19 cases in the Inland
Empire, to help identify vulnerable cities within the region and to propose target cities for San
Bernardino and Riverside Counties to increase food pantry resources to these communities through
spatial analysis. The Getis-Ord local clustering method was applied to find statistically significant
68 RivCoPH COVID 69 SBCoPH COVID 70 SCAG 71 US Census Cartographic Boundary Files

17
“hot” and “cold” spots.72 A local statistic, Gi*, was calculated for each feature within the context
of its neighbors. It also determines whether a local pattern is statistically significant from the global
pattern, in this case, a comparison of IE cities.
The standardized Gi* is a Z-score associated with statistical significance.73 “Hotspots” are
cities that have a significantly higher value than expected.74
“The Gi*(d) is the local G statistic for a feature i within a distance (d), and Wij (d) is the
spatial weight for the target-neighbor i and j pair. Ord and Getis developed a z-transformed form
of Gi* to improve statistical testing.75 The statistical significance and degree of clustering is
evaluated according to the confidence level and on the Z-scores. The statistical significance and
degree of clustering is evaluated according to the confidence level and on the Z-scores. If Z (Gi*)
has a positive value and significant, it means that the pixel has a relatively high frequency of being
a hot spot area. Otherwise, if Z(Gi*) has a negative value and is significant, the pixel has a high
frequency of being a cold spot area”76. “The z-scores and p-values are measures of statistical
significance that tell you whether or not to reject the null hypothesis. They indicate whether the
observed spatial clustering of high or low values is more pronounced than one would expect in a
random distribution of those same values.”77 Confidence levels or p values used were 1%, 5% and
10%. Clusters with positive z values for these p values were considered hot spots, while clusters
with negative values at the same p values were considered cold spots.
Hypothesis testing:
● Null hypothesis: There is complete spatial randomness of the values associated with each
of the data sets used.
● Alternative hypothesis: There is spatial clustering of the values associated with each of the
data sets used.
Contiguity edges and corners for the conceptualization of the spatial relationship parameter
were used. This was chosen based on how the features interact with each other in space. The
polygon features, in this case cities, that share a boundary, influence computations for the target
polygon feature. It is best to utilize contiguity conceptualizations with polygon features in cases
when modeling contagious processes or continuous data represented as polygons, which are
cities.78
72 Getis Ord 1992 73 http://onlinepubs.trb.org/onlinepubs/conferences/2011/RSS/2/Manepalli,UR.pdf 74 Hakkert and Mahalel, 1978 75 Getis Ord 1995 76 J. Navarro-Estupiñan, et al 77 Z-scores and P-values 78 Modeling spatial relationships

18
SVI score/food pantry: Hot spots indicate cities where the social vulnerability is high in relation
to the number of pantries. These are cities where temporary pantries are needed during hazardous
outbreaks such as COVID-19. In contrast, cold spots are located in cities where vulnerability in
relation to the number of food pantries tends to be low.
Number of people below poverty/food pantry: Hot spots indicate cities where the number of people
in poverty is high in relation to the number of pantries. These are cities where temporary pantries
are needed during hazardous outbreaks such as COVID-19. In contrast, cold spots are located in
cities where the number of people in poverty in relation to the number of food pantries tends to be
low.
Number of homeless/food pantry: Hot spots indicate cities where the number of homeless people
is high in relation to the number of pantries. These are cities where temporary pantries are needed
during hazardous outbreaks such as COVID-19. In contrast, cold spots are located in cities where
the number of homeless people in relation to the number of food pantries tends to be low.
COVID-19 cases/food pantry: Hot spots indicate cities where the number of COVID-19 cases is
high in relation to the number of pantries. These are cities where temporary pantries are needed
during hazardous outbreaks such as COVID-19. In contrast, cold spots are located in cities where
the number of COVID-19 cases in relation to the number of food pantries tends to be low.
Table 1 contains information on all cities in the IE along with their respective food pantry count,
social vulnerability index, social vulnerability score per food pantry, poverty count, poverty count
per food pantry, homeless count79, homeless count per food pantry, COVID-19 cases80, and
COVID-19 cases per food pantry.
79 2019 Point-In-Time count. 80 April 20, 2020 data.

19
TABLE 1. Cities in Riverside (R) and San Bernardino (SB) counties, food pantry count,
social vulnerability index (SVI), social vulnerability score (SVS) per food pantry, poverty
count, poverty count per food pantry, homeless count, homeless count per food pantry,
COVID-19 cases and COVID-19 cases per food pantry. *2019, April 20, 2020**
CITY COUNTY
FOOD
PANTR
Y
COUNT SVI
SVS/FOOD
PANTRY
POVERT
Y COUNT
POVERTY
COUNT
/FOOD
PANTRY
HOMELES
S COUNT*
HOMELESS
COUNT
/FOOD
PANTRY
COVID19
CASES**
COVID19
CASES/FOOD
PANTRY
Canyon Lake R 0 0.50 49.82 7499 7499 0 0 8 8
Cathedral
City R 0 0.58 58.17 15884 15884 82 82 65 65
Eastvale R 0 0.39 39.15 6955 6955 0 0 50 50
La Quinta R 0 0.51 50.97 12434 12434 9 9 46 46.00
Wildomar R 0 0.52 52.21 9409 9409 13 13 31 31.00
Blythe R 1 0.77 76.76 4580 4580 48 48 1 1.00
Calimesa R 1 0.38 38.00 3957 3957 16 16 16 16.00
Chino Hills SB 1 0.30 29.93 12245 12245 4 4 51 51.00
Indian Wells R 1 0.33 32.54 5063 5063 2 2 10 10.00
Needles SB 1 0.76 76.09 1520 1520 29 29 0 0.00
Palm
Springs R 1 0.54 54.18 15522 15522 196 196 82 82.00
Rancho
Mirage R 1 0.39 38.62 5903 5903 6 6 22 22.00
Coachella R 2 0.81 40.56 13010 6505 51 26 90 45.00
Grand
Terrace SB 2 0.63 31.74 4862 2431 1 1 16 8.00
Yucca
Valley SB 2 0.76 38.22 8446 4223 72 36 12 6.00
Desert Hot
Springs R 3 0.78 26.16 12559 4186 45 15 27 9.00
Lake
Elsinore R 3 0.69 22.96 19694 6565 66 22 78 26.00
Palm Desert R 3 0.34 11.18 11345 3782 23 8 75 25.00
Perris R 3 0.75 24.83 27556 9185 77 26 117 39.00
Twentynine
Palms SB 3 0.75 25.06 6034 2011 40 13 8 2.67
Loma Linda SB 4 0.56 14.06 7651 1913 25 6 24 6.00

20
CITY COUNTY
FOOD
PANTR
Y
COUNT SVI
S790oVS/F
OOD
PANTRY
POVERT
Y COUNT
POVERTY
COUNT
/FOOD
PANTRY
HOMELES
S COUNT*
HOMELESS
COUNT
/FOOD
PANTRY
COVID-19
CASES**
COVID-19
CASES/FOOD
PANTRY
Menifee R 4 0.50 12.47 13866 3467 17 4 85 21.25
Montclair SB 4 0.72 17.95 18749 4687 24 6 20 5.00
Beaumont R 5 0.53 10.50 10388 2078 15 3 71 14.20
Big Bear L SB 5 0.43 8.66 3589 718 39 8 4 0.80
San Jacinto R 5 0.79 15.74 17095 3419 48 10 36 7.20
Temecula R 5 0.38 7.60 11084 2217 59 12 85 17.00
Adelanto SB 6 0.89 14.77 19415 3236 14 2 11 1.83
Banning R 6 0.60 9.96 10443 1741 39 7 18 3.00
Barstow SB 6 0.83 13.86 12791 2132 62 10 10 1.67
Highland SB 6 0.71 11.75 24307 4051 72 12 60 10.00
Norco R 6 0.42 6.96 5745 958 11 2 17 2.83
Hesperia SB 7 0.71 10.19 25976 3711 24 3 39 5.57
Indio R 7 0.60 8.62 22514 3216 52 7 106 15.14
Murrieta R 8 0.46 5.69 14183 1773 17 2 77 9.63
Apple Valley SB 9 0.70 7.72 20038 2226 23 3 18 2.00
Hemet R 9 0.78 8.66 28023 3114 112 12 138 15.33
Upland SB 9 0.45 5.04 17959 1995 58 6 47 5.22
Chino SB 10 0.54 5.45 14783 1478 23 2 77 7.70
Redlands SB 10 0.45 4.47 16957 1696 183 18 73 7.30
Corona R 11 0.46 4.16 24719 2247 164 15 141 12.82
Rancho
Cucamonga SB 12 0.42 3.48 24089 2007 58 5 83 6.92
Yucaipa SB 12 0.45 3.79 9100 758 16 1 148 12.33
Jurupa
Valley R 13 0.67 5.17 24612 1893 139 11 80 6.15
Colton SB 14 0.71 5.05 22952 1639 58 4 36 2.57
21
CITY COUNTY
FOOD
PANTR
Y
COUNT SVI SVS/FOOD
PANTRY POVERT
Y COUNT
POVERTY
COUNT
/FOOD
PANTRY HOMELES
S COUNT*
HOMELESS
COUNT
/FOOD
PANTRY COVID-19
CASES**
COVID-19
CASES/FOOD
PANTRY
Ontario SB 18 0.66 3.68 37619 2090 128 7 77 4.28
Victorville SB 19 0.78 4.10 45708 2406 333 18 67 3.53
Moreno
Valley R 23 0.72 3.12 35455 1542 38 2 303 13.17
Rialto SB 24 0.79 3.29 30760 1282 133 6 59 2.46
Fontana SB 28 0.69 2.45 45049 1609 94 3 155 5.54
Riverside R 46 0.63 1.38 62578 1360 439 10 477 10.37
San
Bernardino SB 100 0.80 0.80 92886 929 890 9 159 1.59
RESULTS AND KEY FINDINGS
The results of this study provide possible target cities that may need an increase of food
resources or food pantry pop-ups currently, or during the COVID-19 pandemic.
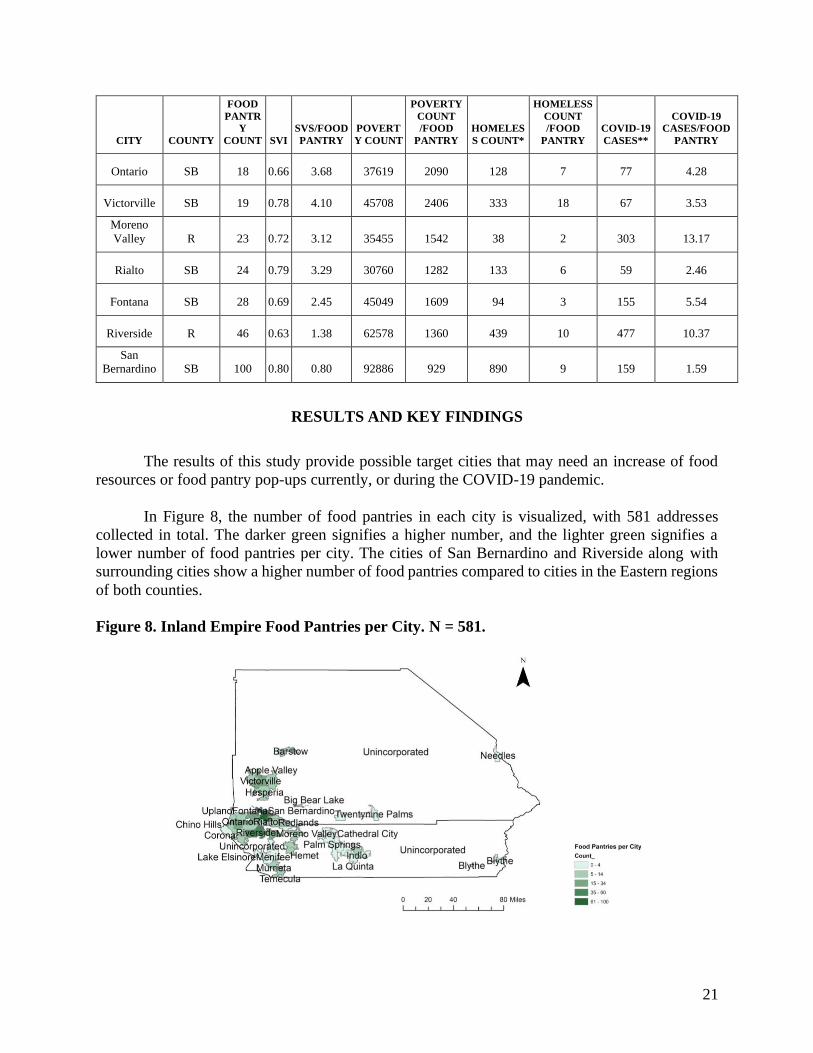
In Figure 8, the number of food pantries in each city is visualized, with 581 addresses
collected in total. The darker green signifies a higher number, and the lighter green signifies a
lower number of food pantries per city. The cities of San Bernardino and Riverside along with
surrounding cities show a higher number of food pantries compared to cities in the Eastern regions
of both counties.
Figure 8. Inland Empire Food Pantries per City. N = 581.

22
Using the GIS Hot Spot Analysis tool with the Getis-Ord Gi* statistical tool, analyses of
each city in reference to its social vulnerability score per food pantry, the number of people below
100% poverty level per food pantry, the number of homeless people per food pantry, and the
number of COVID-19 cases per food pantry were conducted.
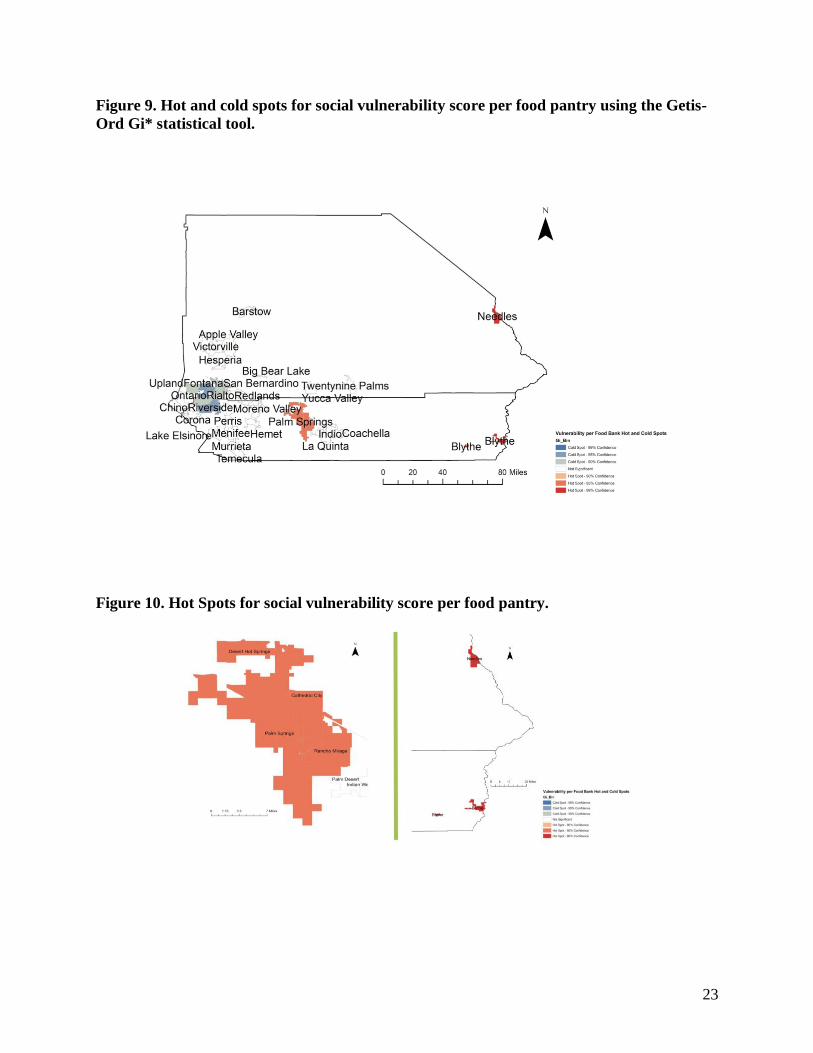
Figure 9 shows hot and cold spots of each city's social vulnerability score per food pantry.
Cities in orange and red have significantly higher positive z scores and low p values resulting in
hotspots. Cities in blue have significantly higher negative z scores and low p values resulting in
cold spots. The z-scores, p-values, and confidence level bins for each city are provided in Table 2.
The Gi_Bin field classifies the data into a range from -3 (Cold Spot – 99% Confidence) to 3 (Hot
Spot – 99% Confidence). Not significant cities are not included in Table 2.81
Cities like Blythe and Needles have a high vulnerability score and may be limited in their
ability to respond to hazardous events such as disease outbreak, and in terms of providing food
resources, they do not have enough food pantries. Similarly, Desert Hot Springs, Cathedral City,
Palm Springs, and Rancho Mirage have a statistically significant high social vulnerability score
and low number of food pantries. As you can see in the legend in Figure 10, the red cities have a
99% confidence level, and the orange cities have 95% confidence level.
On the contrary, Rialto and Riverside show significant clustering for low values (cold
spots). These cities have a high number of food pantries in relation to their vulnerability scores
(Figure 11). These cities may not need an influx of pantries and food resources during disastrous
times. However, vulnerability only provides context for the overall risk during a disaster. To
determine which cities may need an increase of food pantries or food resources, it is necessary to
know how many people need food pantries in each city. A similar analysis in terms of the number
of people in poverty per food bank was completed.
Figure 12 shows statistically significant hot and cold spots of each city's number of
individuals below the federal poverty level per food pantry. Hot spots are shown in Figure 13 for
Desert Hot Springs, Cathedral City, Palm Springs, Rancho Mirage, Indio, and Menifee. Indio for
example has around 23,000 individuals living below the federal poverty level with only 7 food
pantries. While in Figure 14, cold spot cities, like Colton also have around 23,000 people living
below the poverty level, with 14 food pantries. Other statistically significant cold spot cities
include Riverside and Rialto. Hot spot cities have higher ratios of people living in poverty in
relation to how many food pantries they have. These hot spot cities are potentially target cities for
an increase of food pantries or food resources during a disaster that impacts those in poverty; for
instance, during the COVID-19 outbreak since many have lost their jobs. Table 3 contains
high/low spatial clustering for poverty level per food pantry for the IE.
Considering the 100% below the poverty level used, an even deeper examination was
carried out using the homeless Point-In-Time count to determine if enough food pantries for
homeless individuals in each city were available.
81 https://glenbambrick.com/2016/01/21/hotspot-analysis-using-arcgis/
23
Figure 9. Hot and cold spots for social vulnerability score per food pantry using the Getis-
Ord Gi* statistical tool.
Figure 10. Hot Spots for social vulnerability score per food pantry.

24
Figure 11. Cold spots for social vulnerability score per food pantry.
Table 2. High/low spatial clustering for social vulnerability score (SVS) per
food pantry for Inland Empire cities using Getis-Ord Gi* statistics.
FID City
SVS/Food
Pantry Z Score P Value NNeighbors Gi_Bin Spot
3 Colton 5 -1.67 0.10 7 -1 Cold
10 Rialto 3 -2.03 0.04 5 -2 Cold
11 Fontana 2 -1.99 0.05 5 -2 Cold
14
Rancho
Cucamonga 3 -1.76 0.08 4 -1 Cold
16 San Bernardino 1 -1.82 0.07 6 -1 Cold
28 Riverside 1 -2.12 0.03 6 -2 Cold
43 Jurupa Valley 5 -1.86 0.06 8 -1 Cold
5 Needles 76 2.85 0.00 1 3 Hot
35 Desert Hot Springs 26 2.34 0.02 3 2 Hot

25
FID City
SVS/Food
Pantry Z Score P Value NNeighbors Gi_Bin Spot
37 Rancho Mirage 39 2.13 0.03 4 2 Hot
45 Cathedral City 58 2.53 0.01 4 2 Hot
46 Blythe 77 2.89 0.00 1 3 Hot
49 Palm Springs 54 2.53 0.01 4 2 Hot
Figure 12. Hot and cold spots for poverty level per food pantry using the Getis-Ord Gi*
statistical tool.
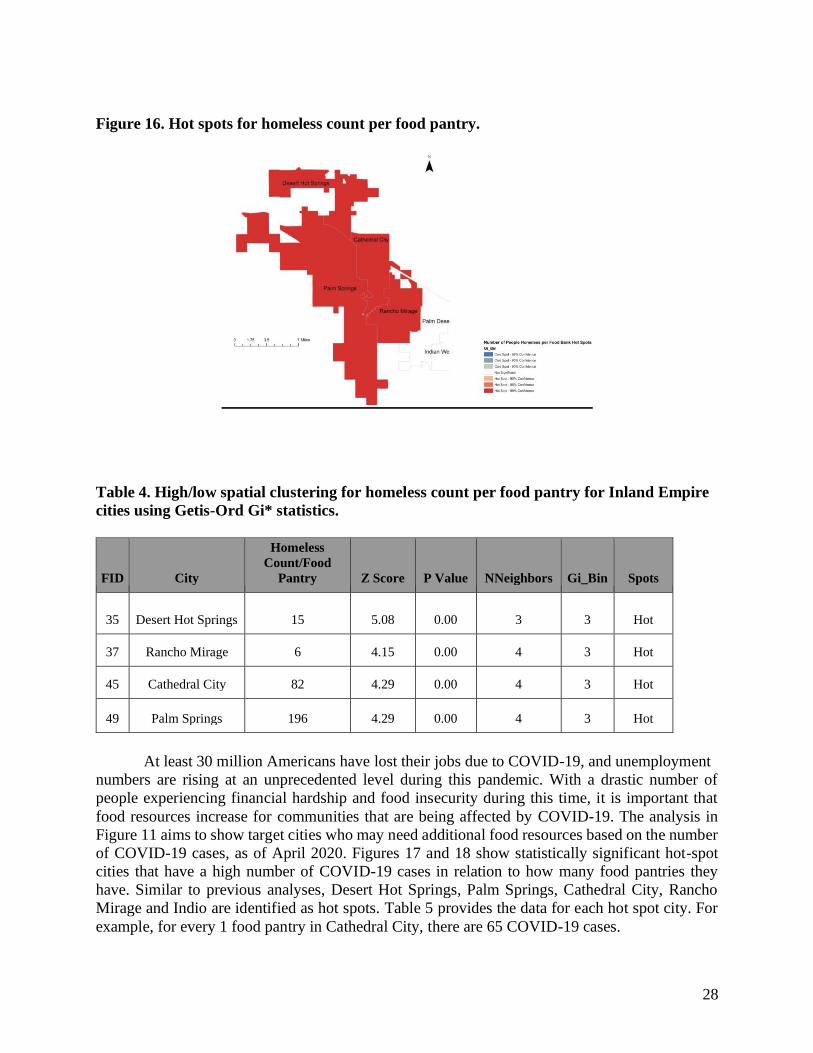
Figures 15 and 16 show a hot spot analysis of each city’s homeless counts in relation to the
number of food pantries they have. There are no cold spots that resulted from this analysis. Only
not significant cities, and significant hotspot cities with 99% confidence. Desert Hot Springs,
Cathedral City, Palm Springs, and Rancho Mirage have a statistically high number of
homelessness in relation to their number of food pantries (p<0.01). Table 4 provides the spatial
clustering for homeless count per food pantry for IE cities. For example, for every 1 food pantry
in Palm Springs, there are 196 homeless individuals.

26
Figure 13. Hot spots for poverty level per food pantry.
Figure 14. Cold spots for poverty level per food pantry.

27
Table 3. High/low Spatial clustering for poverty level per food pantry for Inland
Empire cities using Getis-Ord Gi* statistics.
FID City
Poverty
Level/Food
Pantry Z Score P Value NNeighbors Gi_Bin Spot
3 Colton 1639 -1.90 0.06 7 -1 Cold
10 Rialto 1282 -1.68 0.09 5 -1 Cold
28 Riverside 1360 -1.76 0.08 6 -1 Cold
35 Desert Hot Springs 4186 3.90 0.00 3 3 Hot
37 Rancho Mirage 5903 3.62 0.00 4 3 Hot
40 Menifee 3467 1.66 0.10 6 1 Hot
45 Cathedral City 15884 3.68 0.00 4 3 Hot
48 Indio 3216 1.67 0.10 3 1 Hot
49 Palm Springs 15522 3.68 0.00 4 3 Hot
Figure 15. Hot spots for homeless count per food pantry using the Getis-Ord Gi* statistical
tool.
28
Figure 16. Hot spots for homeless count per food pantry.
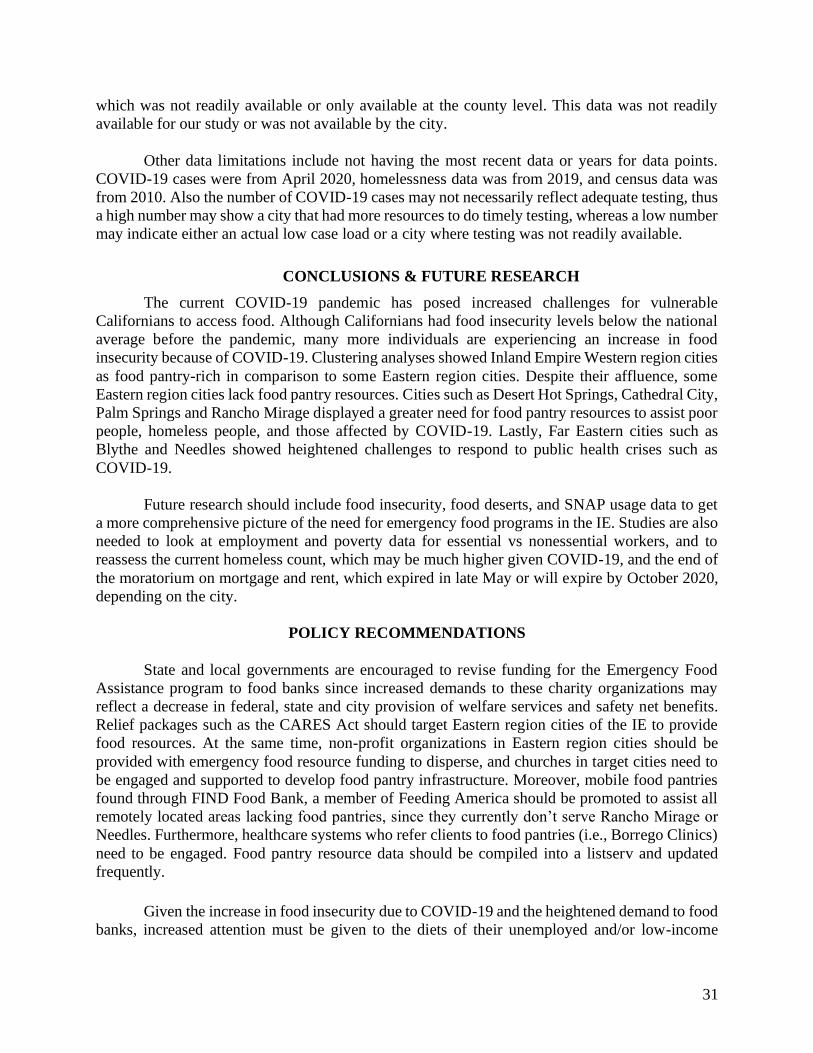
Table 4. High/low spatial clustering for homeless count per food pantry for Inland Empire
cities using Getis-Ord Gi* statistics.
FID City
Homeless
Count/Food
Pantry Z Score P Value NNeighbors Gi_Bin Spots
35 Desert Hot Springs 15 5.08 0.00 3 3 Hot
37 Rancho Mirage 6 4.15 0.00 4 3 Hot
45 Cathedral City 82 4.29 0.00 4 3 Hot
49 Palm Springs 196 4.29 0.00 4 3 Hot
At least 30 million Americans have lost their jobs due to COVID-19, and unemployment
numbers are rising at an unprecedented level during this pandemic. With a drastic number of
people experiencing financial hardship and food insecurity during this time, it is important that
food resources increase for communities that are being affected by COVID-19. The analysis in
Figure 11 aims to show target cities who may need additional food resources based on the number
of COVID-19 cases, as of April 2020. Figures 17 and 18 show statistically significant hot-spot
cities that have a high number of COVID-19 cases in relation to how many food pantries they
have. Similar to previous analyses, Desert Hot Springs, Palm Springs, Cathedral City, Rancho
Mirage and Indio are identified as hot spots. Table 5 provides the data for each hot spot city. For
example, for every 1 food pantry in Cathedral City, there are 65 COVID-19 cases.

29
Figure 17. Hot spots for COVID-19 cases per food pantry using the Getis-Ord Gi* statistical
tool.
Figure 18. Hot spots for COVID-19 cases per food pantry.

30
Table 5. High/low spatial clustering for COVID-19 cases per food pantry for Inland
Empire cities using Getis-Ord Gi* statistics.
FID CITY
COVID-19
Cases/Food
Pantry Z Score P Value NNeighbors Gi_Bin Spots
35 Desert Hot Springs 9 3.73 0.00 3 3 Hot
37 Rancho Mirage 22 3.94 0.00 4 3 Hot
45 Cathedral City 65 3.47 0.00 4 3 Hot
48 Indio 15 2.05 0.04 3 2 Hot
49 Palm Springs 82 3.47 0.00 4 3 Hot
Summary of Findings:
After conducting spatial analysis to identify hot spots for availability of food pantry resources to
at-risk populations due to social vulnerability, poverty, homelessness, and COVID-19 cases in the
Inland Empire, to help identify vulnerable cities within the region, the following target cities are
proposed for San Bernardino and Riverside Counties:
1. Social vulnerability: Needles, Blythe, Desert Hot Springs, Cathedral City Palm Springs and
Rancho Mirage,
2. Poverty: Desert Hot Springs, Cathedral City, Palm Springs, Rancho Mirage, Indio and
Menifee,
3. Homelessness: Desert Hot Springs, Cathedral City, Palm Springs and Rancho Mirage,
4. COVID-19 Cases: Desert Hot Springs, Palm Springs, Cathedral City, Rancho Mirage and
Indio Hot Spots.
LIMITATIONS
There is a common theme amongst Eastern Riverside cities. A surface level analysis points
to these cities not having enough food resources. However, upon a deeper dive, we found that this
area was utilizing mobile delivery services that may not have been present in our data set since
they do not have physical addresses. Also, we recently learned of immediate funds that have been
dispersed to widen the outreach to remote rural areas, specifically in the Eastern Coachella Valley.
Considering that we pulled data on food banks from multiple data sources, we urge future
research to engage organizations such as 211.org, ConnectIE, Foodbank.org, Foodbanks.net, and
Feeding America to create a comprehensive list of food pantries and food resources for Inland
Empire residents. Our analysis did not include food insecurity, food deserts, and SNAP usage data,
31
which was not readily available or only available at the county level. This data was not readily
available for our study or was not available by the city.
Other data limitations include not having the most recent data or years for data points.
COVID-19 cases were from April 2020, homelessness data was from 2019, and census data was
from 2010. Also the number of COVID-19 cases may not necessarily reflect adequate testing, thus
a high number may show a city that had more resources to do timely testing, whereas a low number
may indicate either an actual low case load or a city where testing was not readily available.
CONCLUSIONS & FUTURE RESEARCH
The current COVID-19 pandemic has posed increased challenges for vulnerable
Californians to access food. Although Californians had food insecurity levels below the national
average before the pandemic, many more individuals are experiencing an increase in food
insecurity because of COVID-19. Clustering analyses showed Inland Empire Western region cities
as food pantry-rich in comparison to some Eastern region cities. Despite their affluence, some
Eastern region cities lack food pantry resources. Cities such as Desert Hot Springs, Cathedral City,
Palm Springs and Rancho Mirage displayed a greater need for food pantry resources to assist poor
people, homeless people, and those affected by COVID-19. Lastly, Far Eastern cities such as
Blythe and Needles showed heightened challenges to respond to public health crises such as
COVID-19.
Future research should include food insecurity, food deserts, and SNAP usage data to get
a more comprehensive picture of the need for emergency food programs in the IE. Studies are also
needed to look at employment and poverty data for essential vs nonessential workers, and to
reassess the current homeless count, which may be much higher given COVID-19, and the end of
the moratorium on mortgage and rent, which expired in late May or will expire by October 2020,
depending on the city.
POLICY RECOMMENDATIONS
State and local governments are encouraged to revise funding for the Emergency Food
Assistance program to food banks since increased demands to these charity organizations may
reflect a decrease in federal, state and city provision of welfare services and safety net benefits.
Relief packages such as the CARES Act should target Eastern region cities of the IE to provide
food resources. At the same time, non-profit organizations in Eastern region cities should be
provided with emergency food resource funding to disperse, and churches in target cities need to
be engaged and supported to develop food pantry infrastructure. Moreover, mobile food pantries
found through FIND Food Bank, a member of Feeding America should be promoted to assist all
remotely located areas lacking food pantries, since they currently don’t serve Rancho Mirage or
Needles. Furthermore, healthcare systems who refer clients to food pantries (i.e., Borrego Clinics)
need to be engaged. Food pantry resource data should be compiled into a listserv and updated
frequently.
Given the increase in food insecurity due to COVID-19 and the heightened demand to food
banks, increased attention must be given to the diets of their unemployed and/or low-income
32
patrons considering that food banks operate on donations and surplus food and to address issues
with hunger, malnutrition and/or obesity. Collaborations between public health stakeholders and
leadership within the charitable food sector are encouraged to enhance the quality of food bank
offerings to include fresh foods, and the implementation of community health improvement plans
to assist their patrons. Nutrition education programs that meet specific nutrition and health-related
needs of pantry participants need to be developed. Management, staff and volunteers at food banks
and food pantries need to be trained on these nutrition programs, and on management of chronic
disease and its relationship to nutrition. The identification and distribution of pantry foods that
provide positive health benefits should be a high priority. Lastly, consumer publications focused
on selecting and preparing pantry foods to maintain a healthy diet, manage a limited food budget
and/or manage chronic diseases should be available in all food pantries.