Inland Aquaculture in Thailand
18
Inland Aquaculture in Thailand
Transcript of Inland Aquaculture in Thailand

Inland Aquaculture in Thailand
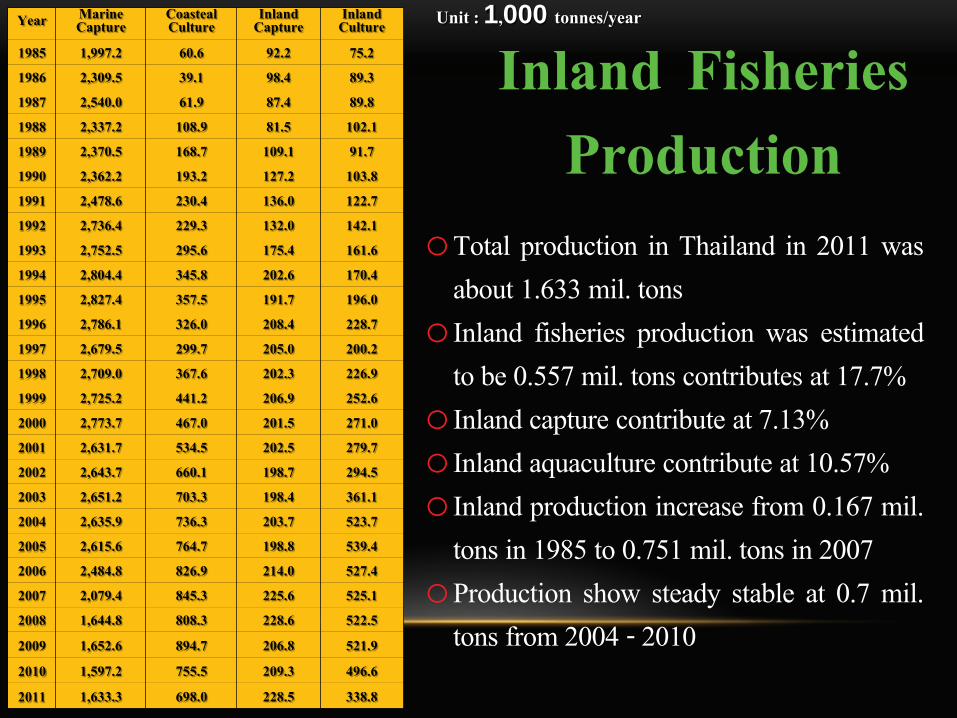
oTotal production in Thailand in 2011 was about 1.633 mil. tons
o Inland fisheries production was estimated to be 0.557 mil. tons contributes at 17.7%
o Inland capture contribute at 7.13% o Inland aquaculture contribute at 10.57% o Inland production increase from 0.167 mil.
tons in 1985 to 0.751 mil. tons in 2007 oProduction show steady stable at 0.7 mil.
tons from 2004 - 2010
Unit : 1,000 tonnes/year
Inland Fisheries Production
Year Marine Capture
Coasteal Culture
Inland Capture
Inland Culture
1985 1,997.2 60.6 92.2 75.2
1986 2,309.5 39.1 98.4 89.3
1987 2,540.0 61.9 87.4 89.8
1988 2,337.2 108.9 81.5 102.1
1989 2,370.5 168.7 109.1 91.7
1990 2,362.2 193.2 127.2 103.8
1991 2,478.6 230.4 136.0 122.7
1992 2,736.4 229.3 132.0 142.1
1993 2,752.5 295.6 175.4 161.6
1994 2,804.4 345.8 202.6 170.4
1995 2,827.4 357.5 191.7 196.0
1996 2,786.1 326.0 208.4 228.7
1997 2,679.5 299.7 205.0 200.2
1998 2,709.0 367.6 202.3 226.9
1999 2,725.2 441.2 206.9 252.6
2000 2,773.7 467.0 201.5 271.0
2001 2,631.7 534.5 202.5 279.7
2002 2,643.7 660.1 198.7 294.5
2003 2,651.2 703.3 198.4 361.1
2004 2,635.9 736.3 203.7 523.7
2005 2,615.6 764.7 198.8 539.4
2006 2,484.8 826.9 214.0 527.4
2007 2,079.4 845.3 225.6 525.1
2008 1,644.8 808.3 228.6 522.5
2009 1,652.6 894.7 206.8 521.9
2010 1,597.2 755.5 209.3 496.6
2011 1,633.3 698.0 228.5 338.8

0
500
1,000
1,500
2,000
2,500
3,000
3,500
4,000
4,500
1981
1983
1985
1987
1989
1991
1993
1995
1997
1999
2001
2003
2005
2007
2009
2011
Prod
uctio
n (1
,000 t
onne
s)
Inland CultureInland CaptureCoasteal CultureMarine Capture
50.97 %
10.57 %
21.78 %
7.13 %
o Total production in Thailand in 2011 was about 1.633 mil. tons o Inland fisheries production was estimated to be 0.557 mil. tons contributes at 17.7% o Inland capture contribute at 7.13% and Inland aquaculture contribute at 10.57% o Inland production increase from 0.167 mil. tons in 1985 to 0.751 mil. tons in 2007 o Production show steady stable at 0.7 mil. tons from 2004 - 2010
Fisheries production in Thailand
0
100
200
300
400
500
600
700
800
1981
1983
1985
1987
1989
1991
1993
1995
1997
1999
2001
2003
2005
2007
2009
2011
Prod
uctio
n (k
g/ye
ar)
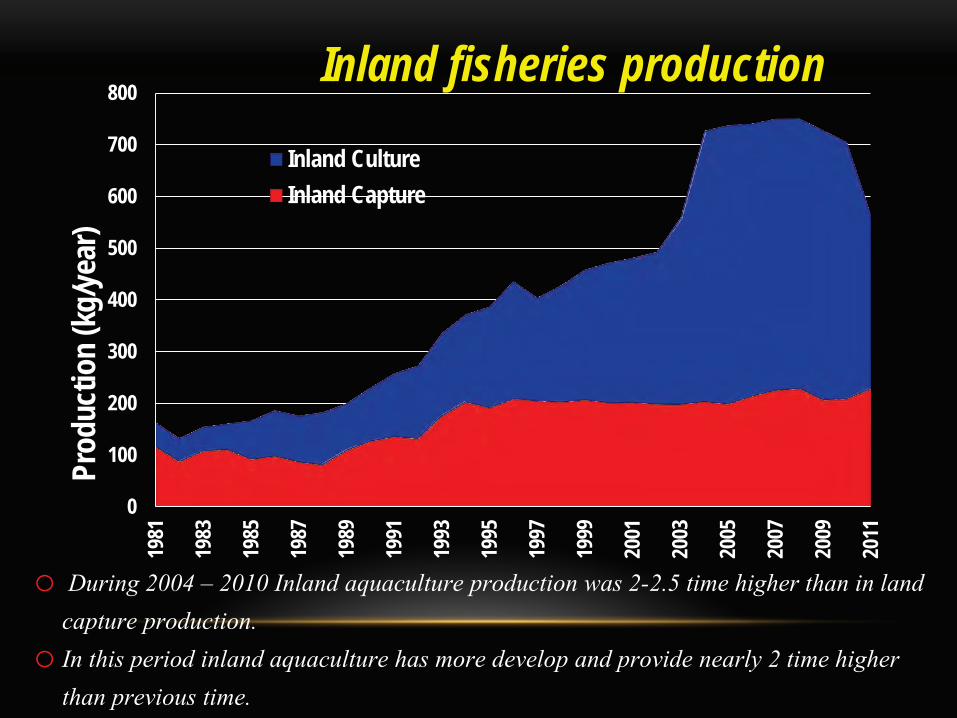
Inland fisheries production
Inland CultureInland Capture
o During 2004 – 2010 Inland aquaculture production was 2-2.5 time higher than in land capture production.
o In this period inland aquaculture has more develop and provide nearly 2 time higher than previous time.

INLAND AQUACULTURE PRODUCTION
Region No of Farm
Area (rai)
Production (tons/yr)
Value (mil B/yr)
Northern 134,193 141,946 122,587 5,239,105
Northeast 275,326 334,533 95,856 4,486,039
Central plain 26,604 78,839 64,202 2,290,552
Eastern 22,459 184,606 78,339 3,484,250
Western 25,443 198,473 83,947 5,418,724
Southern 48,462 69,311 51,667 2,626,252
Total 532,487 1,007,709 496,599 23,544,922
In 2009 By Region

Aquaculture system
in 2009
Area
(rai)
Percentage
(%)
Pond culture 946,735 91.69
Paddy Field 73,601 7.13
Ditch culture 12,677 1.23
Cage culture 549 0.05
Total 1,032,561 100
INLAND AQUACULTURE
Area of Fish Farm by aquaculture system

SPECIES PRODUCTION FROM AQUACULTURE (TONS/YEAR IN 2009)
42%
25%9%
7%6% 5% 6%
ปลานลิ ปลาดุก ปลาตะเพียน ปลาสลิด
ปลาสวาย กุ้งก้ามกราม สัตว์น�ําอื�นๆ- Tilapia 221,042 tons
- Clarias 130,064 tons
- Silver barb 47,231 tons
- Gourami 34,220 tons
- Pangasius 30,200 tons
- Giant Prawn 26,785 tons
- Misc. 32,338 tons
Total 521,880 tons
Tilapia Clarias Silver barb Gourami
Pangasius Giant prawn Misc. sp
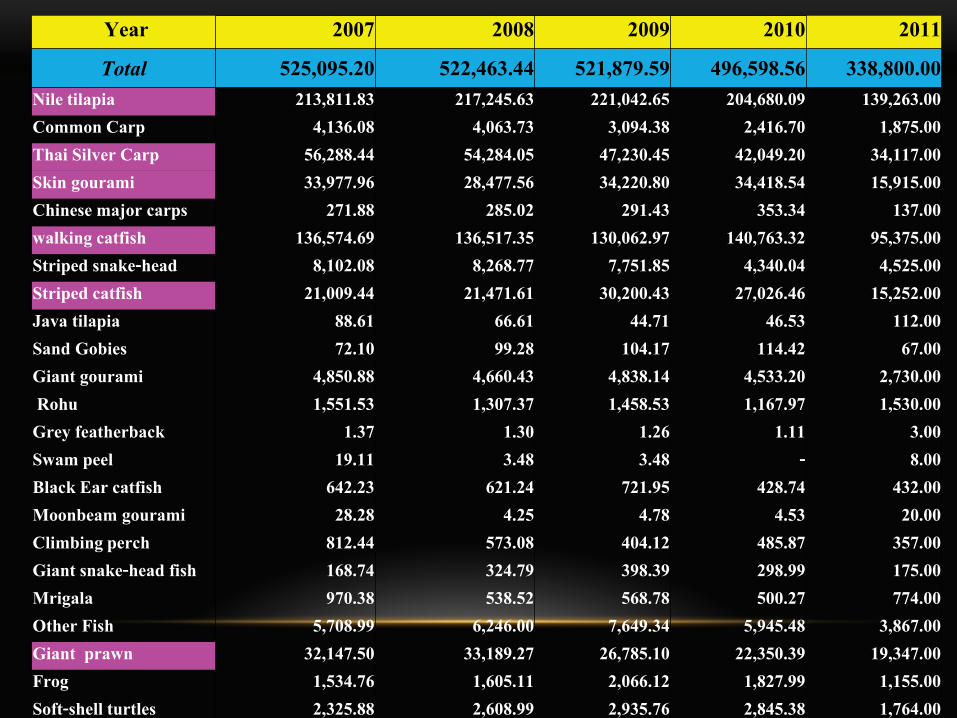
Year 2007 2008 2009 2010 2011
Total 525,095.20 522,463.44 521,879.59 496,598.56 338,800.00 Nile tilapia 213,811.83 217,245.63 221,042.65 204,680.09 139,263.00 Common Carp 4,136.08 4,063.73 3,094.38 2,416.70 1,875.00 Thai Silver Carp 56,288.44 54,284.05 47,230.45 42,049.20 34,117.00 Skin gourami 33,977.96 28,477.56 34,220.80 34,418.54 15,915.00 Chinese major carps 271.88 285.02 291.43 353.34 137.00 walking catfish 136,574.69 136,517.35 130,062.97 140,763.32 95,375.00 Striped snake-head 8,102.08 8,268.77 7,751.85 4,340.04 4,525.00 Striped catfish 21,009.44 21,471.61 30,200.43 27,026.46 15,252.00 Java tilapia 88.61 66.61 44.71 46.53 112.00 Sand Gobies 72.10 99.28 104.17 114.42 67.00 Giant gourami 4,850.88 4,660.43 4,838.14 4,533.20 2,730.00 Rohu 1,551.53 1,307.37 1,458.53 1,167.97 1,530.00 Grey featherback 1.37 1.30 1.26 1.11 3.00 Swam peel 19.11 3.48 3.48 - 8.00 Black Ear catfish 642.23 621.24 721.95 428.74 432.00 Moonbeam gourami 28.28 4.25 4.78 4.53 20.00 Climbing perch 812.44 573.08 404.12 485.87 357.00 Giant snake-head fish 168.74 324.79 398.39 298.99 175.00 Mrigala 970.38 538.52 568.78 500.27 774.00 Other Fish 5,708.99 6,246.00 7,649.34 5,945.48 3,867.00 Giant prawn 32,147.50 33,189.27 26,785.10 22,350.39 19,347.00 Frog 1,534.76 1,605.11 2,066.12 1,827.99 1,155.00 Soft-shell turtles 2,325.88 2,608.99 2,935.76 2,845.38 1,764.00

2011 Production %Pond %Paddy field %Ditch %Cage Total 338,800 87.21 3.94 2.28 6.57 Nile tilapia 139,263 82.23 2.49 0.84 14.44 Common Carp 1,875 89.95 9.91 0.13 0.01 Thai Silver Carp 34,117 82.55 3.33 13.73 0.39 Skin gourami 15,915 55.44 44.37 0.14 0.05 Chinese major carps 137 93.40 6.34 0.26 walking catfish 95,375 97.28 0.12 1.43 1.17 Striped snake-head 4,525 99.25 0.51 0.24 Striped catfish 15,252 98.41 0.02 0.94 0.64 Giant prawn 19,347 100 Sand Gobies 67 56.31 43.69 Giant gourami 2,730 92.53 3.07 4.40 Rohu 1,530 90.80 0.91 8.22 0.08 Other Fish 4,299 88.48 0.78 1.54 9.20 Climbing perch 357 84.23 12.23 3.52 0.03 Giant snake-head 175 95.00 0.02 4.98 Mrigala 774 95.63 0.11 2.87 1.39
Inland aquaculture production in 4 system

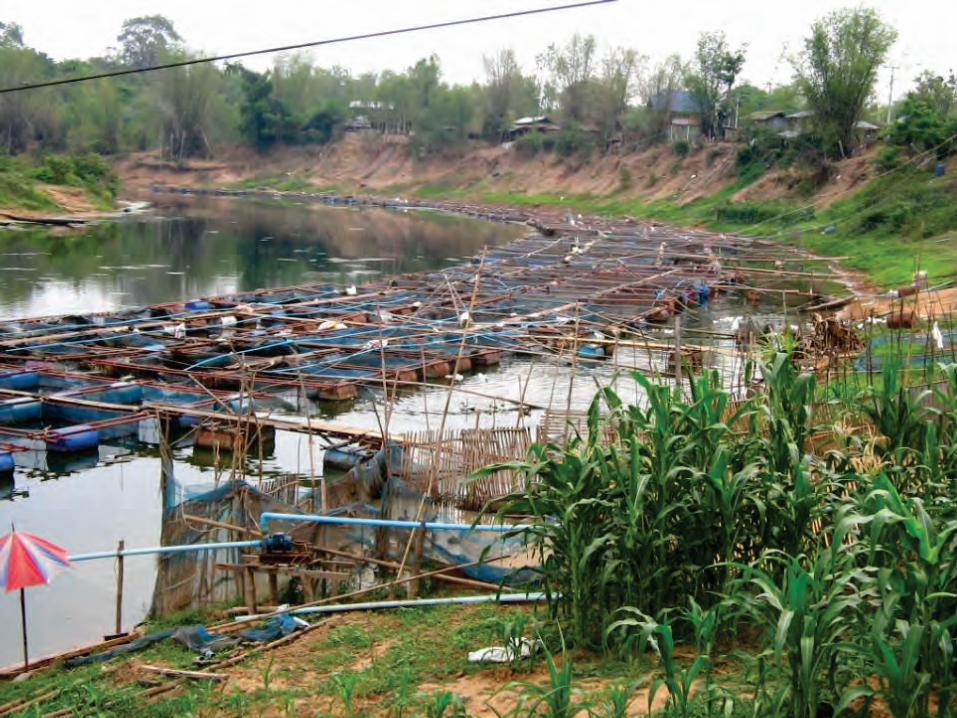
Tilapia Cage Culture
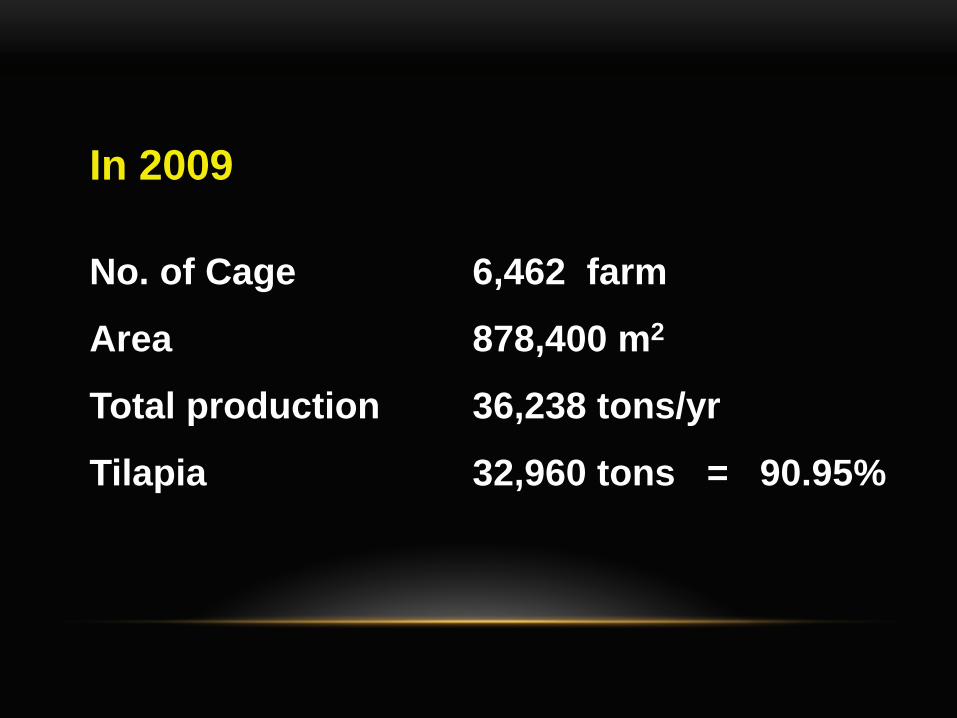
In 2009 No. of Cage 6,462 farm
Area 878,400 m2
Total production 36,238 tons/yr
Tilapia 32,960 tons = 90.95%
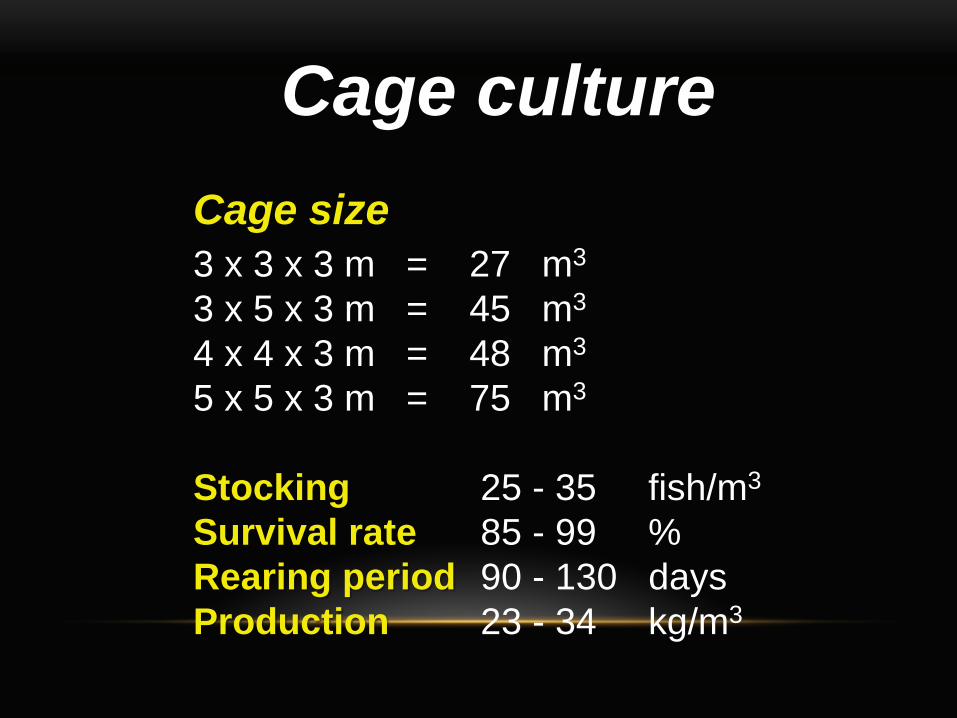
Cage culture
3 x 3 x 3 m = 27 m3 3 x 5 x 3 m = 45 m3 4 x 4 x 3 m = 48 m3 5 x 5 x 3 m = 75 m3 Stocking 25 - 35 fish/m3
Survival rate 85 - 99 % Rearing period 90 - 130 days Production 23 - 34 kg/m3
Cage size

บ้านเลิงใต้
สาหร่าย
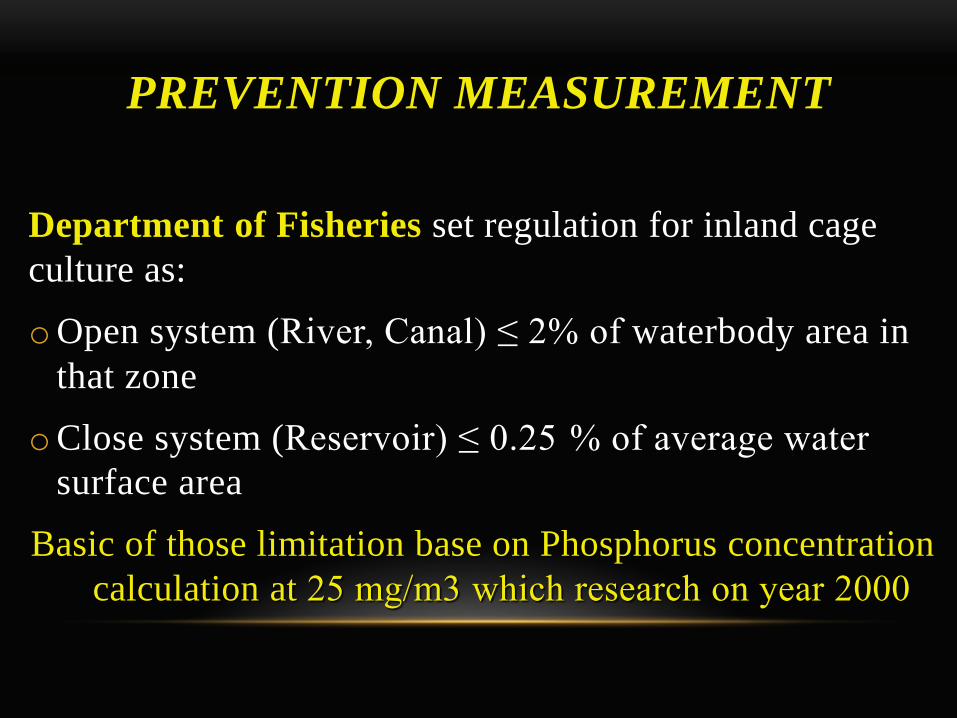
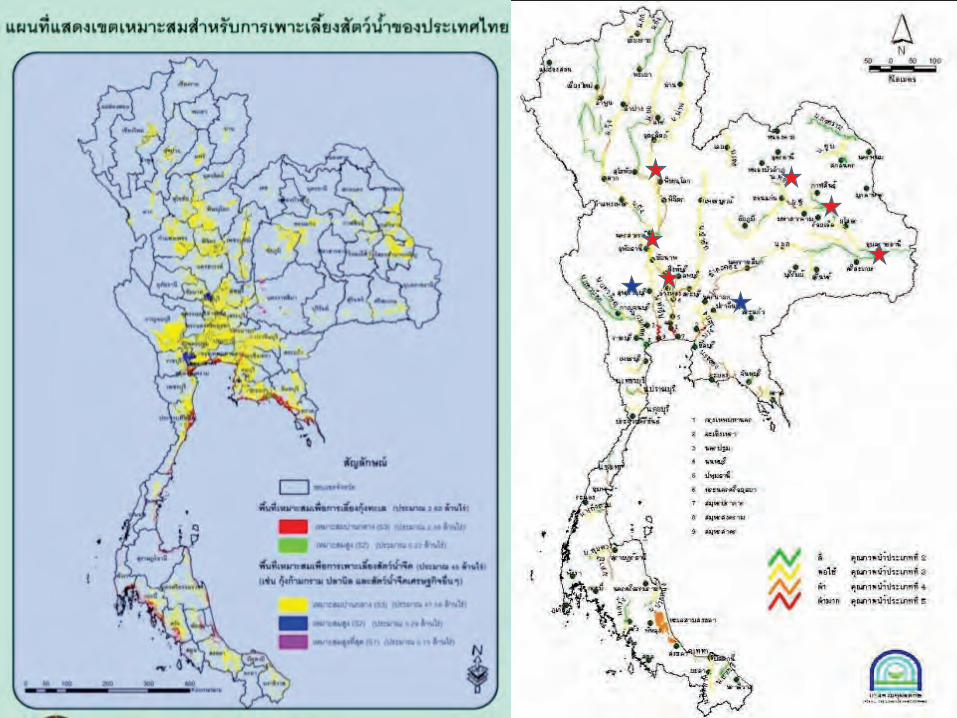
PREVENTION MEASUREMENT
Department of Fisheries set regulation for inland cage culture as:
o Open system (River, Canal) ≤ 2% of waterbody area in that zone
o Close system (Reservoir) ≤ 0.25 % of average water surface area
Basic of those limitation base on Phosphorus concentration calculation at 25 mg/m3 which research on year 2000

DEPARTMENT OF POLLUTION CONTROL
Inland aquaculture farm area >10 rais have to treated their water before drained out to the natural water body
Standard of waste water control from aquaculture
BOD ≤ 20 mg/L
Total Nitrogen ≤ 4.0 mgN/L
Total Phosphorus ≤ 0.5 mgP/L
Suspended Solid ≤ 80 mg/L
DPC set regulation of waste water from inland aquaculture

Thank you for your attention