
Injury Statistics January - May 2011. 2011 = 3.1 2010= 3.5 Member firm injury May 2011.
20
Injury Statistics January - May 2011
-
Upload
jonas-thornton -
Category
Documents
-
view
216 -
download
0
Transcript of Injury Statistics January - May 2011. 2011 = 3.1 2010= 3.5 Member firm injury May 2011.

Injury Statistics January - May 2011

2011 = 3.1 2010= 3.5
Agrium
Boart Brigus Dumas Kidd KLG LS-Gold
N'gate Liberty
RTM PGM Redpath
SAS0
5
10
15
0 0
8.5
3.7
0.8
2.6
5.9 5.8
7
0
2.8
3.8
00
6.15.4
6.6
10.6
7
9.7
1.81.7
6.4
2.3
TOTAL MEDICAL INJURY FREQUENCY - PNOMSGJanuary – May 2011
2011 YTD 2010
Inju
rie
s/2
00
,00
0 e
mp
. hrs
.
Member firm injury May 2011

Agrium
Boart Brigus Dumas Kidd KLG LS Gold
Liberty
N'gate RTM PGM Redpath
SAS0
0.5
1
1.5
2
2.5
3
3.5
4
4.5
5
0 0 0 0 0
0.7 0.6
0 0 0
1.6
3.8
00 0 0
0.5
0.2 0.2
1.2
3
0
0.5
4.3
0
LOST TIME INJURY FREQUENCY - PNOMSG
January – May 20112011 May 2010
Inju
ries
/200
,000
em
p. h
rs.
2010 = 0.6 2011 = 0.5
Member firm injury May 2011

Agrium
Boart Brigus Dumas Kidd KLG LS Gold
Liberty
N'gate RTM PGM Redpath
SAG0
10
20
30
40
50
60
70
80
90
100
0 0 0 0 0
914
0 0 0
239122656
00 0 0
30
814
3
143
03
56
0
SEVERITY RATE - PNOMSG January - May 2011
2011 YTD 2010
Day
s lo
st/2
00,0
00 e
mp
. hrs
.
143 2391 22656 2011 = 807
2010= 15
Member firm injury Statistics May 2011

Porcupine Safety Group Injury Experience1970, 1984, 1990, 1999 – 2010
1970 1984 1990 1999 2000 2001 2002 2003 2004 2005 2006 2007 2008 2009 20100
5
10
15
20
25
6.8
2.8 2.41 1 0.9 0.9 0.5
0.700000000000001
0.600000000000001
0.30.60000000000000
1 0.4 0.40.60000000000000
1
18.918.1
12.4
10.311.4 11.4
7.4 7.7 7.9
6.26.4
5.1 4.8
3.5
TMIF PNOMSG. LTIF PNOMSGTMIF industry LTIF industry
Inju
ries/
200,
000
emp.
hrs
.
Source: WSN report MS 0101.1

Mining Sector UpdateJune 2011
6
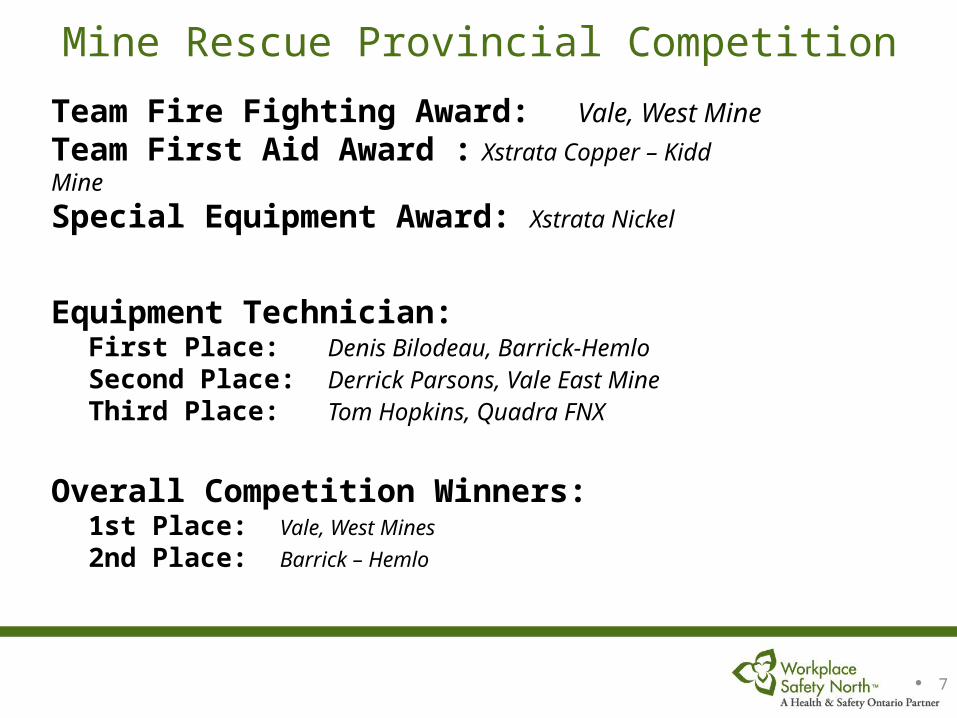
Mine Rescue Provincial Competition
7
Team Fire Fighting Award: Vale, West MineTeam First Aid Award : Xstrata Copper – Kidd Mine
Special Equipment Award: Xstrata Nickel
Equipment Technician:First Place: Denis Bilodeau, Barrick-HemloSecond Place: Derrick Parsons, Vale East MineThird Place: Tom Hopkins, Quadra FNX
Overall Competition Winners:1st Place: Vale, West Mines2nd Place: Barrick – Hemlo

99
Mining Sector Update
Products & programs
• New WHMIS half-day training program• Mock trial Timmins September/October• Revamped web site:
• http://www.healthandsafetyontario.ca/WSN• May issue of Link Line mine rescue newsletter posted • 2nd issue of Every Worker magazine due in June
• Focus is vehicle hazards• Watch for young worker safety campaign “Think Again” on
the web

10
Mining Sector Update
Ground Control Committee
Project:• Quality control of ground support installations

11
Mining Sector Update
Mine Rescue
Projects:• Launched an Emergency Preparedness and Planning Audit.• Preparing a “Ground Fall Re-entry protocols” Module for M/R
Teams. • Finalizing a Mutual Aid Agreement guideline.• Launched an updated Mine Rescue Handbook. • Introduced a hydration mask for hot mines
Research:• Participating in heat stress related research with University of
Ottawa.

12
Mining Sector Update
Mining Equipment Committee
Project: • Technical Report: Track Haulage Safety – in progress
WSIB-sponsored research: • Whole-Body Vibration, evaluation of seat performance
o measuring effectiveness of several mining equipment seats• Multi-piece rim and wheel assembly
o evaluating opportunities for safer use
13
Mining Sector Update
Safety & Loss Control Committee
Project: • Overview of Safety Management Systems that lead to Zero
Harm
14
Mining Sector Update
Workplace Environment Committee
Project: • Hazards to nursing mothers and pregnant workers

Ontario Mining, Steel & Other Smelting & Refining Industries FTE Workers, Lost-time Injuries 2010 and 2009 comparisons
Rate Group2010 YTD
FTE Workers
2009 YTD FTE
Workers
% change 2010 to
2009 FTE Workers
# Lost-time
Injuries 2010**
# Lost-time
Injuries 2009
2010 YTD Lost-time
Injury Rate
2009 YTD Lost-time
Injury Rate*
% imp. 2010 to 2009 LTI
rate
110 - Gold Mines 7,057 5,799 21.7% 51 49 0.72 0.85 15.3%113 - Nickel Mines 5,947 6,520 -8.8% 41 44 0.69 0.67 -3.0%119 - Other Mines 6,685 5,278 26.7% 68 46 1.02 0.87 -17.2%352 - Other Primary Steel Ind. 21,345 20,456 4.3% 162 175 0.76 0.86 11.6%TOTAL 41,034 38,053 7.8% 322 316 0.78 0.83 6.0%
Source: WSIB, EIW, Firm Experience Schema, as of March 31, 2011.
*as of March 31, 2010.
** includes allowed inactive rate group lost-time injuries.

Ontario Industrial Sectors
Education
Municipal
Health Care
Construction
Electrical
Transportation
Farm Safety
Industrial
Services
Mining
Forestry
Pulp & Paper
0.0 2.0 4.0 6.0 8.0 10.0 12.0 14.0 16.0
0.44
9.22
0.41
7.91
4.81
8.39
8.80
0.85
0.50
10.58
14.54
0.93
Traumatic Fatal Injury Rate - Average last five years*
Rate per 100,000 FTE workers
Sect
or
Schedule 1- 1.79
Source: WSIB, Firm Experience data cube, as of March 28, 2011. *2006-2010

Ontario Industrial Sectors
Education
Municipal
Health Care
Construction
Electrical
Transportation
Farm Safety
Industrial
Services
Mines & Primary Steel
Forestry
Pulp & Paper
0.0 0.5 1.0 1.5 2.0 2.5
0.4
1.9
1.8
1.6
0.7
2.1
2.3
1.0
0.9
0.8
2.1
0.7
Lost-time Injury Rate 2010
Rate per 100 FTE workers
Sect
or
Schedule 1- 1.2
Source: WSIB, Firm Experience data cube, as of March 31, 2011.

Ontario Mining Industry
Unconsciousness Slips/ Falls of Person
Power Haulage/ Falls of Ground Falling, Rolling or Sliding Rock or Material of Any
Kind
Machinery Handling Material Manually
0
5
10
15
20
25
30
35
29
26
1817
13
8
4
02
4
1 1 10
Fatal and Critical Injuries 2006 - 2010
Critical injuriesFatal injuries
Num
ber o
f Rep
orte
d In
jurie
s
Transportation off-site
Sources: Ontario Ministry of Labour, MIS, 2006-2010 WSN, Mining Group Fatality Database, 2010.
Top 7 incident categories

Ontario Mining Industry
2006 2007 2008 2009 2010 20110
5
10
15
20
25
34
21
0
3
17
21
10
15
10
1
Fatal Traumatic Injuries and Diseases 2006 - 2011
Traumatic FatalsFatal Disease
Year of Death
Num
ber
of W
SIB
allo
wed
fata
ls
Source: WSIB, Fatality Analysis by SWA data cube, as of March 31, 2011.
5

Allowed Non-fatal Occupational Disease ClaimsRegistered between 2006 - 2010
Source: WSIB, Claim Cost Analysis Schema, as of March 31, 2011.
International Classification of Disease (ICD 9) # %
Neoplasm (Cancer) 10 1Nervous System & Sense Organ Disease* 698 78Respiratory System Disease 42 5Skin & Subcutaneous Tissue Disease 20 2Symptoms, signs, & ill-defined conditions 73 8Injury and Poisoning 23 3Exposure/Surveillance 28 3Other 5 1TOTAL 899 100
* Includes Noise Induced Hearing Loss – 534 claims, hand-arm vibration syndrome-163
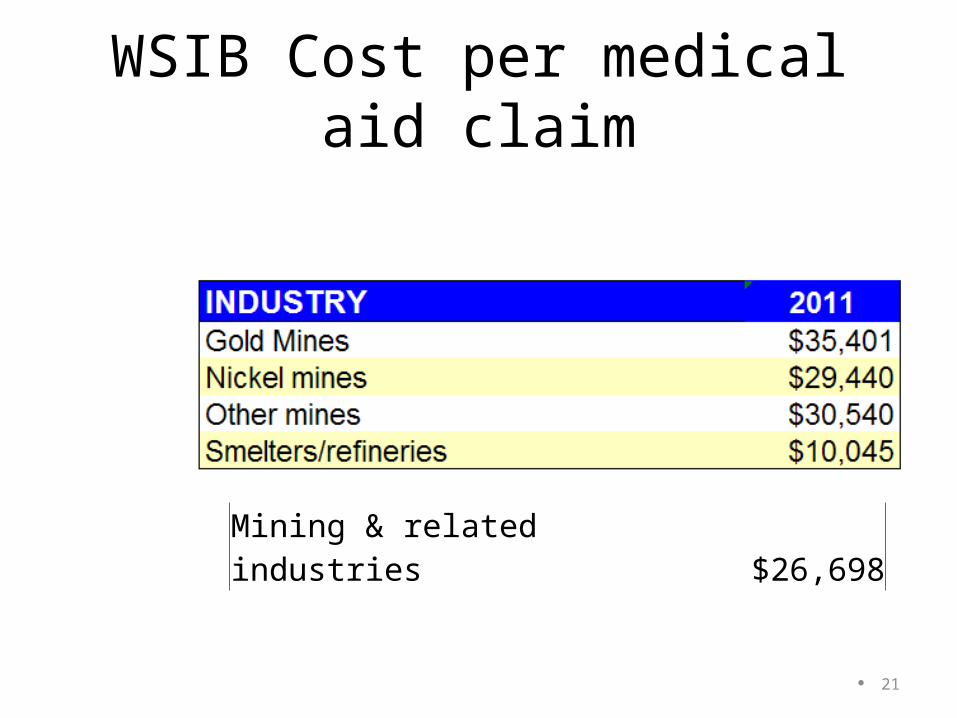
WSIB Cost per medical aid claim
21
Mining & related industries $26,698


