Initiating Coverage December 8, 2017 Narayana...
25
December 8, 2017 Initiating Coverage ICICI Securities Ltd | Retail Equity Research Asset right + affordable + flexible Incorporated by renowned cardiac surgeon Dr Devi Prasad Shetty in 2000, Narayana Hrudayalaya (NH) operates as a chain of multispecialty hospitals. Started predominantly in Karnataka and Eastern India, the company is growing its footsteps in western and northern India as well. We initiate coverage on the company as we believe NH is well poised to thrive in the domestic healthcare delivery (hospitals) space on the back of its asset right business model with focus on quality and affordability. Investment rationale Blended model of affordable + high-quality services NH has a legacy model based on affordability over the years. Due to strict control over costs and capital, the company has been making reasonable profit. However, as it is looking to scale up in other regions, where the consideration for quality has more weight than affordability, the model is likely to be modified from ‘affordable’ to a mix of ‘affordable + quality’ at a premium. Cases in point are the recent acquisition of Gurugram hospital and buying out of the partner in the Cayman Islands hospital internationally where acquisition costs were optically higher. ‘’Asset right model’’, likely ARPOB improvement to improve return ratios Under this model, the company engages with partners who invest in land and building while it takes care of medical equipment and hospital management on a revenue share basis. This is why NH’s balance sheet is one of the lightest among peers. However, the management has maintained a flexible approach in this regard. Thus, it also owns some hospitals where the opportunity is right. Due to this focus on balance sheet and likely improvement in average realisation per operating bed (ARPOB) by optimising case mix, we expect an improvement in RoCE from 12.5% to 19% during FY17-20E. After effective cost, capital management focus shifts to improving ARPOB In a conducive but challenging space of Indian healthcare delivery, plagued by longer gestation periods, low operating margin, leveraged balance sheets and low return ratios, we believe NH is best placed among peers to sail through. Its legacy model is based on affordability. Hence, conscious efforts towards cost & capital control are embedded in the management’s long term strategy. This becomes even more pertinent in the backdrop of incremental government intervention via schemes and control over procedures & products. On the other hand, it is also determined to improve ARPOB by improving case mix, occupancies, thus fine-tuning affordability with profitability. We arrive at an SOTP target price of | 340 by valuing the matured hospitals and Cayman Islands hospital at 12x FY20E EV/EBITDA, other hospitals at 1.5x FY20E EV/sales and other businesses at 1.0x FY20E EV/sales. Key Financials (Year End March) FY16 FY17 FY18E FY19E FY20E Revenues (| crore) 1613.9 1878.2 2269.7 2665.0 3021.5 EBITDA (| crore) 174.6 228.9 254.3 311.4 409.7 Net Profit (| crore) 32.2 84.4 89.0 136.2 203.4 EPS (|) 1.6 4.1 4.4 6.7 10.0 P/E (x) 273.4 69.8 66.1 42.6 28.5 EV/EBITDA (x) 34.5 26.0 23.9 19.2 14.2 RoCE (%) 8.8 12.5 11.9 14.4 18.7 RoE (x) 3.7 8.8 8.5 11.5 14.6 Source: Company, ICICIdirect.com Research Narayana Hrudayalaya (NARHRU) | 284 Rating Matrix Rating : Buy Target : | 340 Target Period : 12-15 months Potential Upside : 20% Financial Parameters (| crore) (| Crore) FY17 FY18E FY19E FY20E Revenues 1878.2 2269.7 2665.0 3021.5 EBITDA 228.9 254.3 311.4 409.7 Adjusted PAT 84.4 89.0 136.2 203.4 EPS (|) 4.1 4.4 6.7 10.0 Current & Target Multiples FY17 FY18E FY19E FY20E PE (x) 68.7 65.2 42.6 28.5 Target PE (x) 82.3 78.1 51.0 34.2 EV to EBITDA (x) 26.0 23.9 19.2 14.2 Price to book (x) 6.0 5.5 4.9 4.2 RoE (%) 8.8 8.5 11.5 14.6 RoCE (%) 12.5 11.9 14.4 18.7 Stock Data Particular Bloomberg Code Average Volumes (6 months) Market Capitalisation Debt (FY17) Cash (FY17) EV 52 week H/L (|) 350/282 Equity capital Face value | 10 Amount | 5801 crore | 217 crore | 116 crore | 5901 crore | 204.4 crore NARH IN 164523 Comparative return matrix (%) 1M 3M 6M 1Y Narayana Hrudayalaya -3.6 -2.5 -9.7 -12.6 Apollo Hospitals 14.1 5.8 -11.1 -4.6 Fortis Healthcare 2.3 -3.7 -23.3 -13.2 Price movement 7,000 8,000 9,000 10,000 11,000 0 100 200 300 400 Dec-17 Jun-17 Dec-16 Jun-16 | Price (R.H.S) Nifty (L.H.S) Research Analyst Siddhant Khandekar [email protected] Mitesh Shah [email protected] Harshal Mehta [email protected]
Transcript of Initiating Coverage December 8, 2017 Narayana...

December 8, 2017 Initiating Coverage
ICICI Securities Ltd | Retail Equity Research
Asset right + affordable + flexible
Incorporated by renowned cardiac surgeon Dr Devi Prasad Shetty in 2000,
Narayana Hrudayalaya (NH) operates as a chain of multispecialty hospitals.
Started predominantly in Karnataka and Eastern India, the company is
growing its footsteps in western and northern India as well. We initiate
coverage on the company as we believe NH is well poised to thrive in the
domestic healthcare delivery (hospitals) space on the back of its asset right
business model with focus on quality and affordability.
Investment rationale
Blended model of affordable + high-quality services
NH has a legacy model based on affordability over the years. Due to strict
control over costs and capital, the company has been making reasonable
profit. However, as it is looking to scale up in other regions, where the
consideration for quality has more weight than affordability, the model is
likely to be modified from ‘affordable’ to a mix of ‘affordable + quality’ at a
premium. Cases in point are the recent acquisition of Gurugram hospital
and buying out of the partner in the Cayman Islands hospital
internationally where acquisition costs were optically higher.
‘’Asset right model’’, likely ARPOB improvement to improve return ratios
Under this model, the company engages with partners who invest in land
and building while it takes care of medical equipment and hospital
management on a revenue share basis. This is why NH’s balance sheet is
one of the lightest among peers. However, the management has
maintained a flexible approach in this regard. Thus, it also owns some
hospitals where the opportunity is right. Due to this focus on balance sheet
and likely improvement in average realisation per operating bed (ARPOB)
by optimising case mix, we expect an improvement in RoCE from 12.5%
to 19% during FY17-20E.
After effective cost, capital management focus shifts to improving ARPOB
In a conducive but challenging space of Indian healthcare delivery,
plagued by longer gestation periods, low operating margin, leveraged
balance sheets and low return ratios, we believe NH is best placed among
peers to sail through. Its legacy model is based on affordability. Hence,
conscious efforts towards cost & capital control are embedded in the
management’s long term strategy. This becomes even more pertinent in
the backdrop of incremental government intervention via schemes and
control over procedures & products. On the other hand, it is also
determined to improve ARPOB by improving case mix, occupancies, thus
fine-tuning affordability with profitability. We arrive at an SOTP target price
of | 340 by valuing the matured hospitals and Cayman Islands hospital at
12x FY20E EV/EBITDA, other hospitals at 1.5x FY20E EV/sales and other
businesses at 1.0x FY20E EV/sales.
Key Financials
(Year End March) FY16 FY17 FY18E FY19E FY20E
Revenues (| crore) 1613.9 1878.2 2269.7 2665.0 3021.5
EBITDA (| crore) 174.6 228.9 254.3 311.4 409.7
Net Profit (| crore) 32.2 84.4 89.0 136.2 203.4
EPS (|) 1.6 4.1 4.4 6.7 10.0
P/E (x) 273.4 69.8 66.1 42.6 28.5
EV/EBITDA (x) 34.5 26.0 23.9 19.2 14.2
RoCE (%) 8.8 12.5 11.9 14.4 18.7
RoE (x) 3.7 8.8 8.5 11.5 14.6
Source: Company, ICICIdirect.com Research
Narayana Hrudayalaya (NARHRU)
| 284
Rating Matrix
Rating : Buy
Target : | 340
Target Period : 12-15 months
Potential Upside : 20%
Financial Parameters (| crore)
(| Crore) FY17 FY18E FY19E FY20E
Revenues 1878.2 2269.7 2665.0 3021.5
EBITDA 228.9 254.3 311.4 409.7
Adjusted PAT 84.4 89.0 136.2 203.4
EPS (|) 4.1 4.4 6.7 10.0
Current & Target Multiples
FY17 FY18E FY19E FY20E
PE (x) 68.7 65.2 42.6 28.5
Target PE (x) 82.3 78.1 51.0 34.2
EV to EBITDA (x) 26.0 23.9 19.2 14.2
Price to book (x) 6.0 5.5 4.9 4.2
RoE (%) 8.8 8.5 11.5 14.6
RoCE (%) 12.5 11.9 14.4 18.7
Stock Data
Particular
Bloomberg Code
Average Volumes (6 months)
Market Capitalisation
Debt (FY17)
Cash (FY17)
EV
52 week H/L (|) 350/282
Equity capital
Face value | 10
Amount
| 5801 crore
| 217 crore
| 116 crore
| 5901 crore
| 204.4 crore
NARH IN
164523
Comparative return matrix (%)
1M 3M 6M 1Y
Narayana Hrudayalaya -3.6 -2.5 -9.7 -12.6
Apollo Hospitals 14.1 5.8 -11.1 -4.6
Fortis Healthcare 2.3 -3.7 -23.3 -13.2
Price movement
7,000
8,000
9,000
10,000
11,000
0
100
200
300
400
Dec-17
Jun-17
Dec-16
Jun-16
|
Price (R.H.S) Nifty (L.H.S)
Research Analyst
Siddhant Khandekar
Mitesh Shah
Harshal Mehta
Page 2 ICICI Securities Ltd | Retail Equity Research
Company background
Narayana Hrudayalaya (NH) was incorporated by renowned cardiac
surgeon Dr Devi Prasad Shetty in 2000. The company was started as a
predominant cardiac care hospitals group initially. Gradually, it also
diversified into other specialties although cardiac still remains the
mainstream specialty followed by renal (kidney care). NH’s network
comprises 23 hospitals (including three managed hospitals), seven heart
centres and 19 primary care facilities (including clinics and information
centres) with 5889 operational beds and the potential to reach a capacity
of up to 6888 beds. Apart from this, NH had set up a multi-speciality
hospital in Cayman Islands by entering into an agreement with the
Government of Cayman Islands. Region wise, southern (mainly Karnataka)
and eastern (mainly Kolkata) regions together account for 84% of
operating revenues (FY17).
Cluster wise bifurcation
Karnataka cluster – Comprises seven hospitals including four in Bengaluru
and a hospital each in Mysore, Bellary and Shimoga totalling 2211
operational beds. The company also manages six heart centres totalling
302 operating beds.
Eastern cluster - Comprises nine hospitals including hospitals in the
greater Kolkata area encompassing Howrah, Barasat and the Eastern
Metropolitan Bypass, a multispecialty hospital in Jamshedpur, Jharkhand,
a super specialty hospital in Guwahati, Assam and a hospital in Durgapur,
West Bengal totalling 1934 operational beds. The company also manages a
heart centre in Durgapur, West Bengal, totalling 59 operational beds.
Western and Northern Clusters - Comprises seven hospitals - Jaipur
(Rajasthan), Palanpur (Gujarat), Ahmedabad (Gujarat), paediatric hospital in
Mumbai (Maharashtra), Raipur (Chhattisgarh), Jammu and Delhi totalling
1246 current operational beds. The company recently acquired a
multispecialty hospital in Q4FY18 in Gurugram (NCR), which is expected to
be commissioned in Q4FY18.
Health City Cayman Islands (HCCI) - NH had set up a multi-speciality
hospital in Cayman Islands by entering into an agreement with the
Government of Cayman Islands on April 7, 2010. Health City Cayman
Islands (HCCI) is a joint venture between NH and Ascension Health
Ventures LLC, a US based trust. This 105 bedded hospital was
commissioned in April 2014 and earned JCI, US accreditation in May, 2015
(JCI is the international arm of The Joint Commission, the leading health
care accreditor in the US). NH had initially entered into a JV with a 28.6%
stake in the hospital. Later, it bought back the rest of the 71.4% stake from
Ascension Health for a cash consideration of US$32 million (~| 208 crore)
in 2017 (implied EV of US$70 million for 105 beds), making it the step
down subsidiary of Narayana Health, post completion of acquisition. HCCI
primarily targets North American patients (Cayman Islands lies ~450 miles
south of Miami, near Caribbean islands) and provides high-quality,
affordable health care. For H1FY18, HCCI’s revenues were at US$21.3
million (~| 137 crore) with EBITDA at US$2.6 million (~| 16.8 crore;
EBITDA margin of 12.2%). For Q2FY18, the hospital was running at 28%
occupancy rate.
Shareholding pattern (FY17)
Shareholders
Promotor 63.9%
FII 7.7%
DII 6.7%
Others 21.7%
Holding (%)
Source: Company, ICICIdirect.com; Research
Number of operating Beds
3815
4678
5434 5347
5932 5799 5889
0
1000
2000
3000
4000
5000
6000
7000
FY13 FY14 FY15 FY16 FY17 Q1FY18 Q2FY18
Source: Company, ICICIdirect.com; Research
Geography Wise Revenue Break-Up (FY17)
Karnataka
48%
East
36%
Others
16%
Source: Company, ICICIdirect.com; Research
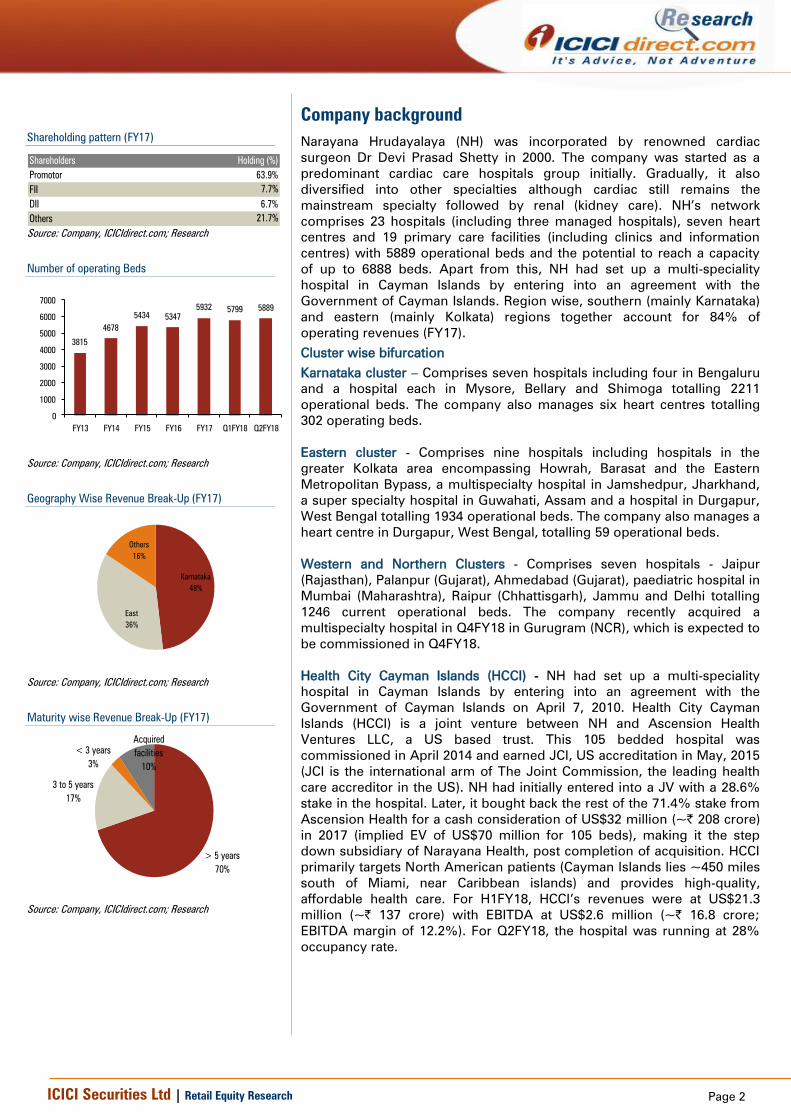
Maturity wise Revenue Break-Up (FY17)
> 5 years
70%
3 to 5 years
17%
< 3 years
3%
Acquired
facilities
10%
Source: Company, ICICIdirect.com; Research

Page 3 ICICI Securities Ltd | Retail Equity Research
Exhibit 1: NH’s footprint in India
Source: Company, ICICIdirect.com; Research
NH operates through a combination of following models:
1) Owned or long term/perpetual lease – It owns and operates on a
freehold basis or land taken on long term/perpetual lease. NH
operates eight hospitals of 2607 operating beds in FY17
2) Revenue share/rentals – NH operates and pays a revenue
share/rent to owner of the hospital premises. It operates 10
hospitals of 1817 operating beds in FY17
3) Management contract – NH provides healthcare services to third
parties for a management fee. It managed four hospitals of 720
operating beds in FY17
4) PPP – NH operates with nominal investment in partnership with
public entities. It operates two hospitals of 297 operating beds
5) Apart from this, the company has seven heart centres and 19
standalone clinics, primary care facilities and information centres
that it operates on a lease or license basis
Its centres provide advanced levels of care in over 30 specialties, including
cardiology and cardiac surgery, cancer care, neurology and neurosurgery,
orthopaedics, nephrology and urology and gastroenterology. In FY17, it
generated 90.7% of total revenues from 20 hospitals offering
multispecialty and super specialty services, 7.3% from heart centres while
the remaining was from the management fee received from four managed
hospitals, ancillary businesses and other standalone clinics & primary care
facilities.
As of FY17, it has 14330 employees, including 356 doctors, 11316 nurses,
paramedical staff and administrative personnel. Additionally, it has 469
student doctors, paramedics and administrative trainees. Further, it has
1,016 doctors on a consultancy basis (including visiting consultants).
Therapy wise revenue break-up (Q2FY18)
Cardiac
41%
Gastro
17%
Neuro
8%
Others
11%
Orthopaedics
4%
Oncology
10%
Renal
9%
Source: Company, ICICIdirect.com; Research
Payee-Profile (Q2FY18)
International
patients
9%
Insured
Patients
19%
Schemes
17%
Walk-in
patients
55%
Source: Company, ICICIdirect.com; Research

Page 4 ICICI Securities Ltd | Retail Equity Research
Exhibit 2: Narayana Hrudayalaya hospital network (ex-managed and heart centres)
Sr no Hospital Land
1 NICS, Bengaluru Owned
2 MSMC, Bengaluru Owned
3 RTIICS, Kolkata Leased
4 Brahmananda Narayana Multispeciality Hospital, Jamshedpur Leased
5 Narayana Multispeciality Hospital, Jaipur Leased
6 Narayana Multispeciality Hospital, Ahmedabad Leased
7 MMI Narayana Multispeciality Hospital, Raipur Revenue-share
8 Narayana Multispeciality Hospital, Mysore Leased
9 Sahyadri Narayana Multispeciality Hospital, Shimoga Revenue-share
10 Narayana Multispeciality Hospital, Whitefield, Bengaluru Revenue-share
11 Narayana Multispeciality Hospital, HSR Layout, Bengaluru Revenue-share
12 Narayana Superspeciality Hospital, Guwahati PPP
13 Rabindranath Tagore Surgical Centre, Kolkata, West Bengal Leased
Acquired Hospitals
14 Narayana Multispeciality Hospital, Barasat, WB Owned
15 Narayana Multispeciality Hospital, Howrah Owned
16 Narayana Superspeciality Hospital, Howrah Leased
New facilities 2016 onwards
17 Kakriyal, Jammu PPP
18 Dharamshila Narayana Hospital Revenue-share
19 Hospital in Gurugram (Acquired) Owned
20 SRCC Children Hospital, Mumbai Revenue-share
Source: Company, ICICIdirect.com; Research, NICS=Narayana Institute of Cardiac Sciences, MSCM=Mazumdar
Shaw Medical Centre, RTIICS=Rabindranath Tagore International Institute of Cardiac Sciences

Page 5 ICICI Securities Ltd | Retail Equity Research
Exhibit 3: Key events s
2000 Narayana Health City, Bengaluru, founded by Dr Devi Prasad Shetty
2008 Joins hands with Asia Heart Foundation to run the RTIICS hospital in Kolkata and NSC
2009 Sets up cardiac and cardiology centre at the SDM College of Medical Science & Hospital in Dharwad, Karnataka
2009 Institutes ‘Heart Centre’ at MS Ramaiah Medical College Hospital in Bengaluru
2009 Establishes a multispecialty hospital in Jamshedpur
2009 Starts multispecialty Mazumdar Shaw Cancer Centre in Bengaluru
2009 Sets up ‘Heart Centre’ at Chinmaya Mission Hospital in Bengaluru
2010 Starts multispecialty hospital in Hyderabad
2010 Sets up multispecialty hospital in Jaipur
2010 Sets up Rotary Narayana, a super-speciality cardiac care unit in Kolkata
2010 Sets up ‘Heart Centre’ in Kolar, Karnataka
2011 NICS receives accreditation from JCI
2011 Inaugurates a multispecialty hospital in Raipur
2012 Sets up multispecialty hospital in Ahmedabad
2012 Establishes heart centres at Davangere
2012 Narayana Multispecialty Hospital in Jaipur receives accreditation from JCI
2013 Sets up multispecialty hospitals at Shimoga, Mysore, Durgapur and HSR, Bengaluru
2013 Establishes super specialty hospital at Whitefield, Bengaluru and Guwahati
2013 Starts ‘Heart Centres’ at St Martha’s, West Bank, Suguna and Kuppam
2014 Inclusion of Barasat and Berhampore hospitals in NH Group
2014 Starts operations at Health City, Cayman Islands Phase 1 with 101 operational beds
2015 Acquires two Westbank Hospitals in Howrah
2015 Multispecialty hospitals set up at Palanpur, Mahua and Bellary
2015 Establishes a full-fledged cancer centre at Mysore to provide high-quality cancer treatment at an affordable cost
2015 Forms an association with Shri Mata Vaishno Devi Shrine Board, through PPP, to build a 230 capacity bed hospital in Kakriyal, Jammu
2016 Company lists its shares on Bombay Stock Exchange and National Stock Exchange India
2017 Forays into Northern India with commissioning of super-speciality hospital in Kakriyal, Jammu
2017 Enters into agreement for healthcare services with around 300 capacity bedded Dharamshila Hospital & Research Centre
2017 Acquires near completed ~230 bedded hospital in Gurugram (NewRise Healthcare) from Panacea Biotec
2017 Forays into Mumbai to with superspeciality Children’s Hospital - first of its kind in NH network
Nov-17 Proposes to buy back 71.4% outstanding shares in Health City Cayman Islands held by Ascension Health Ventures LLC, US for US$ 32.26 million to increase
Narayana Hrudalaya's effective stake to 100% in Health City Cayman Islands
Source: Company, ICICIdirect.com; Research
Exhibit 4: Key players in Indian hospital industry (FY17) s
Company No of Beds* Presence
Apollo Hospitals 6,997
Chennai, Madurai, Hyderabad, Karur, Karim Nagar, Mysore, Visakhapatnam, Bilaspur, Aragonda, Kakinada, Bengaluru, Delhi, Noida,
Kolkata, Ahmedabad, Mauritius, Pune, Raichur, Ranipet, Ranchi, Ludhiana, Indore, Bhubaneswar, Dhaka, Bacheli, Bellary, Goa,
Lavasa, Nashik, Nellore, Trivuannamalai, Trichi
Aravind Eye Hospitals 3,649 Theni, Tirunelveli, Coimbatore, Puducherry, Madurai, Amethi, Kolkata, Dindigul, Tirupur, Salem, Tuticorin, Udumalpet
CARE Hospitals 2,100 Hyderabad, Vijayawada, Nagpur, Raipur, Bhubaneswar, Surat, Pune, Visakhapatnam, Jabalpur, Raigarh
Fortis Healthcare 4,700
Mumbai, Bengaluru, Kolkata, Mohali, Noida, Delhi, Amritsar, Raipur, Jaipur, Chennai, Kota, Faridabad, also the company present in
Singapore, Dubai, Mauritius and Sri Lanka
Max Hospitals 2,016 Delhi, NCR, Punjab, Uttarakhand
Manipal Group of Hospitals 4,900 Udupi, Bengaluru, Manipal, Attavar, Mangalore, Goa, Tumkur, Vijaywada, Kasaragod, Visakhapatnam
Narayana Health 5,799
Ahmedabad, Bengaluru, Berhampore, Davangere, Dharwad,Durgapur, Guwahati, Hyderabad, Jaipur, Jamshedpur, Kolar, Kolkata,
Kuppam, Mahuva, Mysore, Raipur, Shimoga, Bellary, Palanpur, Mumbai
Source: IBEF.org, ICICIdirect.com; Research, * Operational Beds
Page 6 ICICI Securities Ltd | Retail Equity Research
Investment Rationale
Blended model of affordable + high-quality services
NH has had a legacy model based on affordability over the years. Due to
strict control over costs and capital, the company was making reasonable
profit. Total 60-70% beds of NH are in general wards, which is one of the
highest compared to other private hospitals. Also, charges of general
wards are 10-15% lower than other private hospitals, mainly due to the
benefit of efficient procurements, which the company passes on to
patients. However, as it looks to scale up in other regions, where the
consideration for quality has more weight than affordability, the model is
likely to be modified from ‘’affordable’’ to a mix of affordable + quality at
premium. Cases in point are the recent acquisition of Gurugram hospital
and buying out of its partner in the Cayman Islands hospital internationally
where the acquisition costs were optically higher.
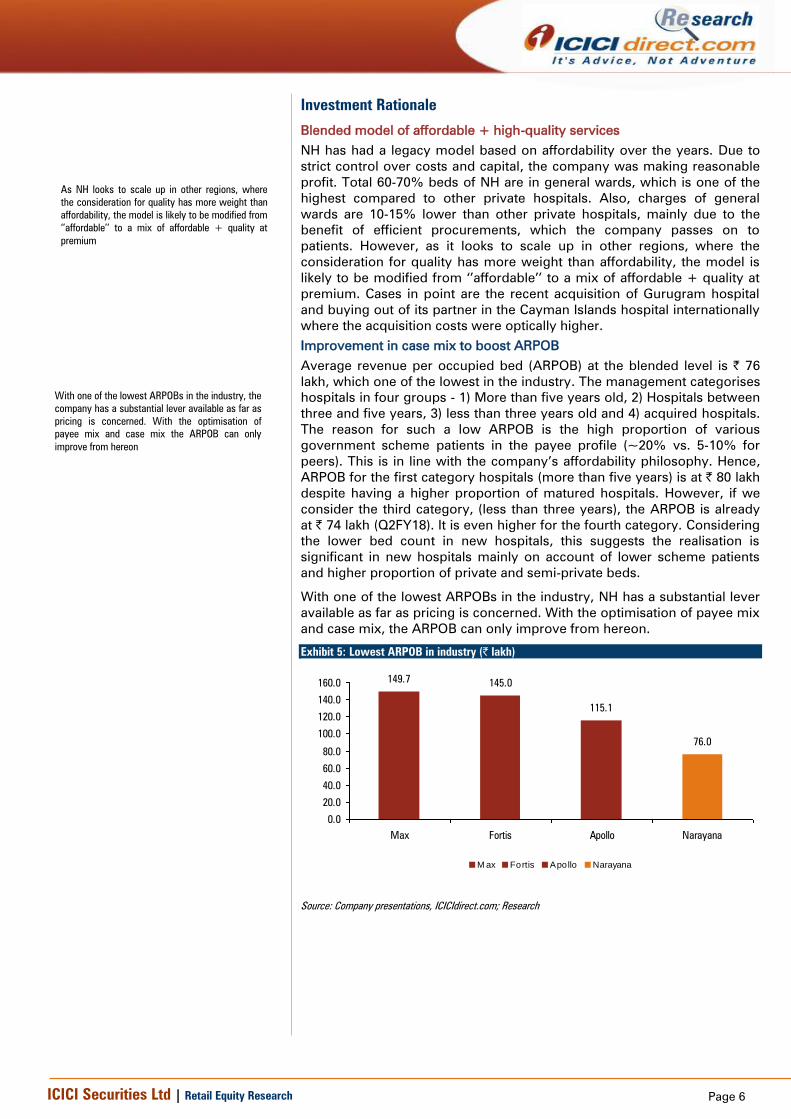
Improvement in case mix to boost ARPOB
Average revenue per occupied bed (ARPOB) at the blended level is | 76
lakh, which one of the lowest in the industry. The management categorises
hospitals in four groups - 1) More than five years old, 2) Hospitals between
three and five years, 3) less than three years old and 4) acquired hospitals.
The reason for such a low ARPOB is the high proportion of various
government scheme patients in the payee profile (~20% vs. 5-10% for
peers). This is in line with the company’s affordability philosophy. Hence,
ARPOB for the first category hospitals (more than five years) is at | 80 lakh
despite having a higher proportion of matured hospitals. However, if we
consider the third category, (less than three years), the ARPOB is already
at | 74 lakh (Q2FY18). It is even higher for the fourth category. Considering
the lower bed count in new hospitals, this suggests the realisation is
significant in new hospitals mainly on account of lower scheme patients
and higher proportion of private and semi-private beds.
With one of the lowest ARPOBs in the industry, NH has a substantial lever
available as far as pricing is concerned. With the optimisation of payee mix
and case mix, the ARPOB can only improve from hereon.
Exhibit 5: Lowest ARPOB in industry (| lakh)
149.7145.0
115.1
76.0
0.0
20.0
40.0
60.0
80.0
100.0
120.0
140.0
160.0
Max Fortis Apollo Narayana
M ax Fortis Apollo Narayana
Source: Company presentations, ICICIdirect.com; Research
As NH looks to scale up in other regions, where
the consideration for quality has more weight than
affordability, the model is likely to be modified from
‘’affordable’’ to a mix of affordable + quality at
premium
With one of the lowest ARPOBs in the industry, the
company has a substantial lever available as far as
pricing is concerned. With the optimisation of
payee mix and case mix the ARPOB can only
improve from hereon

Page 7 ICICI Securities Ltd | Retail Equity Research
More focus on fast growing international patients
Over the years, India has grown to become a top notch destination for
international patients as it scores high over a range of factors that
determine the overall quality of care. From quality of therapy, range of
procedural and treatment options, infrastructure and availability of skilled
manpower to performing any medical procedure with zero waiting time
and lastly availability of generic drugs, the list of benefits in travelling for
medical treatment in India goes on. This is especially for costly and
delicate surgeries like coronary bypass, kidney and liver transplant, hip
replacement, dental services, cosmetic surgery and bariatric surgery.
Indian hospitals are offering standard services at comparatively low costs.
Statistics reveal that treatment of major surgeries in India cost ~20% of
those in developed countries.
Exhibit 6: Competitive surgery rates
Treatment (US$) US UK Thailand Singapore India
Heart Surgery 100,000 40,000 14,000 15,000 5,000
Bone marrow transplant 250,000 290,000 62,000 150,000 30,000
Liver transplant 300,000 200,000 75,000 140,000 45,000
Knee replacement 48,000 50,000 8,000 25,000 6,000
Source: CRISIL Report, ICICIdirect.com; Research
NH’s network has eight hospitals with domestic accreditation from NABH
while three hospitals have international accreditation from Joint
Commission International (JCI). These accreditations are an important
consideration for international patients. These patients are covered under
insurance while payments are guaranteed by foreign governments. Hence,
this is one of the most lucrative payee categories. The company has
official tie-ups with several major international medical insurance
companies to facilitate international patients.
‘International patients’ as a payee category are the highest in terms of
realisation and are growing at a faster rate vis-à-vis other categories. This
will further improve the blended ARPOBs as the product mix improves.
Similarly, with higher incremental proportion of international patients and
those covered under private insurance and corporate schemes, the pie of
government schemes is steadily coming down. In turn, this will improve
the ARPOBs.
NH has witnessed strong growth in the contribution of international
patients to total revenues, which has grown from 4.8% in FY16 to 9% in
Q2FY18.
Exhibit 7: Percentage of international patients
5%
8%
10%
9%
0%
2%
4%
6%
8%
10%
12%
FY16 FY17 Q1FY18 Q2FY18
Source: Company, ICICIdirect.com; Research
Exhibit 8: Lower schemes patients’ contribution
23%25%
21%
18% 18%
0%
5%
10%
15%
20%
25%
30%
FY13 FY14 FY15 FY16 FY17
Source: Company, ICICIdirect.com; Research
The NH network has eight hospitals with domestic
accreditation from NABH while three hospitals
have international accreditation from JCI. It has
witnessed strong growth in the contribution of
international patients to total revenues, which has
grown from 4.8% in FY16 to 9% in Q2FY18

Page 8 ICICI Securities Ltd | Retail Equity Research
‘’Asset right model’’ to improve return ratios
Over the years, the company has endeavoured to focus on opportunities
where it need not have to own out and out assets. The brick-and-mortar in
most cases is owned by like-minded partners. Under this model, the
company engages with partners who invest in land and building while it
takes care of medical equipment and the hospital management on a
revenue share basis. This is why NH’s balance sheet is one of the lightest
among peers.
Exhibit 9: Asset right model explained s
Engagement Framework Comments Number of Units
Number of
Operational
Beds
Gross Block +
CWIP (| cr)
Capital Cost per
Bed (| cr)
Owned Or Long-Term /Perpetual Lease
Owns and operates on freehold basis or land
taken on long-term / perpetual lease 8 Hospitals 2607 961.5 0.37
Revenue Share / Rentals
Operates and pays a revenue share / rent to
owner of the hospital premises 10 Hospitals 1817 318.0 0.18
Public-Private Partnership
Operates with nominal investment in partnership
with public entities 2 Hospitals 297 16.8 0.06
Managed Hospitals
Provides healthcare services to third parties for
a management fee 4 Hospitals 720 - -
Heart Centres
Runs cardiac sciences’ department out of 3rd
party hospitals and pays revenue share
7 Heart Centres
and 1 Clinic 386 51.1 0.13
Source: Company Annual Report, ICICIdirect.com; Research,
In the past 10 years, NH has added 22 hospitals, which comprises 5226
operating beds majority were under assets right model. As a result of this
strategy, NH’s average effective capital cost per operational bed in FY17
was just | 27 lakh against peer’s average of ~| 90 lakh. This has primarily
led to one of the lowest leverages on the balance sheet (net D/E of 0.2x) in
the private hospitals space.
Exhibit 10: Lowest average effective cost per bed (| lakh)
55
27
87
52
0
10
20
30
40
50
60
70
80
90
100
Apollo Hospitals Narayana Max India Healthcare Global
Apollo Hospitals Narayana Max India Healthcare Global
Source: Company presentations, ICICIdirect.com; Research, *Calculated on operational beds
The company engages with partners who invest in
land and building while it takes care of medical
equipment and hospital management on a revenue
share basis. This is why NH’s balance sheet is one
of the lightest among peers
Owning an asset right model, NHL’s average
effective capital cost per operational bed in FY17
was just | 27 lakh against peer’s average of ~|
90 lakh. This has primarily led to one of the lowest
leverage on the balance sheet (net D/E of 0.2x) in
the private hospitals space

Page 9 ICICI Securities Ltd | Retail Equity Research
Exhibit 11: Lowest D/E ratio (x)
0.5
0.3
0.8
0.2
0.0
0.1
0.2
0.3
0.4
0.5
0.6
0.7
0.8
0.9
Max Fortis Apollo Narayana
Max Fortis Apollo Narayana
Source: Company presentations, ICICIdirect.com; Research
However, the management has maintained a flexible approach in this
regard. Thus, it also owns some hospitals with out and out ownership
where the opportunity is right. A case in point in this regard is the latest
acquisition of Gurugram based multi-speciality hospital NewRise
Healthcare from Panacea Biotech for | 180 crore. In this case, the cost of
acquisition per bed is almost 2.9x the blended cost of all beds for the
company. This acquisition is part of the long term strategy of penetrating
the northern market, especially the area in and around the NCR, which is
dominated by high-end players. Here, the strategy is to improve the
blended ARPOB by keeping procedure rates at a higher level vis-à-vis the
company rates but below levels charged by existing big players.
Similarly, the recent buy-out of Cayman Island based Health City hospital is
another example of higher per bed valuation where the cost per bed works
out to as high as | 5.2 crore per operating bed. Overall outgo in this deal
was ~| 208 crore. However, being an international asset, the revenue
earning capability of this hospital is also superior - ARPOB of ~| 12 crore.
However, as per the management’s own assertion, this strategy is more
opportunistic than a trend. Barring a few such instances, the focus will be
to maintain the asset right model.
Due to this focus on the balance sheet and likely improvement in average
realisation per operating bed (ARPOB) by optimising the case mix, we
expect an improvement in RoCE from 12.5% to ~19% in FY17-20E.
Exhibit 12: Improvement in ARPOB
4852
5864
76
88.6
95.5
103.1
0
10
20
30
40
50
60
70
80
90
100
110
120
FY13 FY14 FY15 FY16 FY17 FY18E FY19E FY20E
(|
crore)
ARPOB (| Lakh)
Source: Company, ICICIdirect.com; Research
Exhibit 13: Improvement in RoCE
8.27.5
10.7
5.9
8.8
12.511.9
14.4
18.7
0
5
10
15
20
FY12 FY13 FY14 FY15 FY16 FY17 FY18E FY19E FY20E
(%
)
RoCE (%)
Source: Company, ICICIdirect.com; Research

Page 10 ICICI Securities Ltd | Retail Equity Research
Cost control, extensive use technology; instances of efficient cost
management
In the backdrop of lower ARPOBs, the company has over the years
implemented and followed some unique cost control measures right from
construction of hospital buildings to sourcing equipment and
consumables. Extensive use of technology for cost reduction is another
differentiator for the company.
In most of its hospitals, it enters into an agreement with the vendors of the
diagnostic machines for blood tests whereby it pays for reagents rather
than buying a machine outright. Given the sheer volume in the system, the
vendor still makes a profit just by selling reagents while the hospital saves
on the cost of the machine.
NH is one of the first few hospitals to switch to digital X-rays to save the
cost of film. It uses disposable gowns, drapes and sutures at almost half
price by sourcing the same locally.
Even the design of most of the owned hospitals has been meticulously
planned to optimise space utilisation, which brings down the cost per bed.
As mentioned earlier, ~70% of beds are general wards that allow fitting in
more beds thus bringing the cost per bed down.
In most NH hospitals, the junior doctors, nurses and technicians handle the
routine of preparing the patient for surgery and closing up after the
surgery is complete. Senior cardiac surgeons enter the theatre to perform
complex procedures only after the chest has been opened and the heart is
ready to be operated on. This way the hospital ensures its cardiac
surgeons are able to perform two to three procedures a day compared to
the average of one a day at other hospitals. The hospital in Bengaluru, for
instance, does up to 32-35 surgeries a day and has the infrastructure to
support almost 60 operations a day.
Electricity costs are controlled by installing ACs only in operational
theatres. All other rooms are naturally ventilated. A case in point is a 300-
bed hospital in Mysuru, which was built in 2012 in association with L&T.
Built in eight months on a | 40 crore budget, it is one of the cheapest super
specialty hospital ever built in India, with the cost-per-bed coming to about
| 13-14 lakh. Made of pre-fabricated materials, the building is on a single
level, thus doing away with the need for lifts. There is also no air-
conditioning, except in operation theatres.
To reduce the cost related to intensive care units (ICU), the company has
deployed software called I-care from Cognizant Technologies to help
streamline post-operation cardiac ICU care. Using the software, medical
staff will be able to monitor ICU patients from remote locations.
NH has partnered Cisco to offer affordable remote diagnostic capabilities.
This digital telemedicine solution would deliver advanced specialised
healthcare services remotely in various parts of the country. In the
process, this would bring the company goodwill and reputation.
NH has also adapted to the latest trends in surgeries such as laparoscopy,
robotic surgery, etc. These procedures generate higher realisation and
minimal patient stay due to minimum invasive procedures and lower risks
of hospital related infections. Similarly, it can be performed from remote
locations and with a leaner medical team. The company has performed
more than 150 robotic surgeries within just 10 months since the
introduction in FY17.
The company has, over the years, implemented
and followed some unique cost control measures
right from construction of hospital buildings to
sourcing equipment and consumables. Extensive
use of technology for cost reduction is another
differentiator for the company
The company has performed more than 150 robotic
surgeries within just 10 months since introduction
in FY17

Page 11 ICICI Securities Ltd | Retail Equity Research
Exhibit 14: Common size statement- consistency in cost management
Income Statement Variables FY15 FY16 FY17 FY18E FY19E FY20E
Net Sales 100% 100% 100% 100% 100% 100%
RM 25% 24% 23% 21% 21% 21%
Gross Profit 75% 76% 77% 79% 79% 79%
Employee exp 20% 21% 20% 18% 18% 18%
Professional Fees to Doctors 19% 20% 21% 21% 21% 21%
Others Expenditure 26% 25% 24% 30% 29% 27%
Operating Profit (EBITDA) 9% 11% 12% 11% 12% 13%
Adjusted PAT 0% 2% 4% 4% 5% 7%
Source: Company Annual Reports, ICICIdirect.com; Research
Government drive on affordability favours NH’s cost efficient, affordable
model
Growing government intervention with regard to pricing of products and
procedures (recent drive against stent and implant pricing) has emerged as
a major overhang for the sustainability of many private specialty and super
specialty hospital chains. In such a tough scenario, we believe NH, with its
cost efficient and predominantly affordable model is well placed to bring
value to the table. As discussed earlier, both the ARPOB and cost per bed
parameters are lowest in the company’s case. Its flexible model allows it to
modify its payee profile as per the requirement. NH’s track record of
providing standard quality, affordable healthcare services to the broader
population has positioned the company as a partner-of-choice for a
number of state governments that are seeking to improve and expand
their local healthcare infrastructure and accessibility to healthcare services.
Some of the related examples include super specialty hospital in
Guwahati, which was commissioned in December 2013, in partnership
with the Government of Assam and the multispecialty hospital in Vaishno
Devi in partnership with the Vaishno Devi Board.
Exhibit 15: Treatment wise comparison s
Therapy Therapy ALOS NABH Non-NABH India Fortis Apollo NH
Angiography daycare 11.5 13.2 12.0-14.0 35-40 15-35 7.5-15
Angioplasty (without implant) 2 days 80 92 65-75 125-200 90-180 55-80
Coronary bypass 7-8 days 127 146 300-400 350-500 280-360 100-250
Total Hip replacement 3-4 days 79 91 150-200
Total Knee replacement (without implant) 110 127 100-150 200-250 150-220 50-100
Intensity Modulated radiotherapy (IMRT) daycare 101 116 125-150
IGRT (Image guided radiotherapy) 147 169 175-200
Craniotomy and evacuation of Hematoma 8-10 days 50 58 85-110
Excision of Brain tumours 45 51 185-210
Cataract Extraction 1 day 13.5 15.5 13-15 30-40 45-50
Glaucoma surgery 6.9 7.9 16-18
Normal delivery 3 days 8 9.2 20-35 80-130 45-110 20-50
Caesarian section 4 days 14 16 40-60 90-130 70-120 35-65
Cholecystectomy Open 6 days 10 12 30-60 50-110 65-115 50-65
Cholecystectomy Laparoscopic 5 days 40-65 90-200 70-130 50-75
Appendectomy Open 5 days 8 9 30-50 50-140 70-100 55-75
Appendectomy Laparoscopic 4 days 40-80 60-140 80-115 50-85
Kidney (without implant) 10 days 200 230 480-550 480 800
Liver (without implant) 20 days 2250 2700
Costs (| '000)
Transplant
Neurosurgery
Opthalmology
Gynaecology
General Surgery
CGHS (Delhi/NCR)
Oncology
Cardiac
Orthopedics
Source: ICICI Lombard, CRISIL, Industry reports, ICICIdirect.com; Research, NABH- National Accreditation Board for Hospitals & Healthcare, CGHS-Central Government Health Scheme
Both the ARPOB and cost per bed parameters are
lowest in NH’s case. Its flexible model allows it to
modify payee profile as per the requirement. NH’s
track record of providing standard quality,
affordable healthcare services to the broader
population has positioned the company as a
partner-of-choice for a number of state
governments that are seeking to improve and
expand their local healthcare infrastructure and
accessibility to healthcare services

Page 12 ICICI Securities Ltd | Retail Equity Research
NHP 2017 - Government recognition for private sector capability
National Health Policy (NHP) 2017 has effectively charted out three clear
objectives - progressively achieve universal health coverage, reinforce
trust in public health care system and complement the growth of the
private healthcare sector with public health goal. The roadmap to involve
the hitherto untapped private sector to address the shortcomings of
government driven health deliveries is by far the most important outcome
of the new policy. It does acknowledge the extremely poor spending by
the state and inability to cover the entire spectrum of healthcare needs
through increased public investment, which has led to a rise in the out-of-
pocket expenditure and consequent impoverishment. It advocates a shift
from a primary focus on garnering additional financial resources from the
private sector or subsidising it, to an approach in which there is a well-
defined service delivery partnership between the government, as a
purchaser, and the private sector, as a provider.
The policy explains the need for coordination with private sector
enterprises by giving statistical instances. The private sector accounts for
90% of all hospitals (up from 8% in 1947), 60% of all beds, and 80-85% of
all doctors. Over 70% of an ailing population in rural areas and almost 80%
in urban areas utilise private facilities. As much as 75% of outpatient (OPD)
care is exclusively private while more than 55% of inpatient (IPD) care is
sought from private hospitals in India.
We believe, among all private players, NH is probably best suited to utilise
this opportunity as the company is already managing two hospitals under
the PPP model besides dealing with various government scheme patients.
Although quantification of this opportunity will be difficult at this stage, the
head start itself can count on huge volume.
Favourable macroeconomic factors
Significant infrastructural gaps persist in the Indian hospital industry. The
bed availability in India was at seven per 10,000 in 2012, significantly lower
than the WHO guideline of 30 beds per population of 10,000. Out of pocket
expenditure on healthcare in India is ~60%, one of the highest in the
world. On the other hand, India has among the lowest health insurance
penetration among developing countries with just 20% penetration.
Demand-supply mismatch with a combination of macroeconomic factors,
including changing demographics, increasing affluence of the Indian
population, greater health awareness, rising incomes, changes in the
disease profile (towards lifestyle-related ailments) and rising penetration of
health insurance are likely to lead to an increase in demand for quality
healthcare services.
We believe, among all private players, NH is
perhaps the best suited candidate to utilise this
opportunity as the company is already managing
two hospitals under PPP model besides dealing
with various government scheme patients
Significant infrastructural gaps persist
1) lower bed availability (seven per 10000)
2) 60% out of pocket expenditure, highest in
world
3) Lowest health insurance penetration (20%)

Page 13 ICICI Securities Ltd | Retail Equity Research
Exhibit 16: Inadequate bed infrastructure in India
63
3634
26 25
7
0
10
20
30
40
50
60
70
Europe Brazil US World
Average
China India
Source: IBEF.Org, ICICIdirect.com; Research
Exhibit 17: Highest out-of-pocket spend on healthcare (%)
67.9
14.811.0
52.6
33.7
59.062.4
11.0 9.7
54.8
35.332.0
0
10
20
30
40
50
60
70
80
India US Uk Singapore Malaysia China
2014 2010
Source: Shalby RHP, World Bank 2015, ICICIdirect.com; Research
Exhibit 18: Health Insurance premium per capita (US$; 2016)
3.6
57.9 44
110.9
567
0
100
200
300
400
500
600
India Singapore China UK US
India Singapore China UK US
Source: ICICI Lombard RHP; CRISIL 2016, ICICIdirect.com; Research
Exhibit 19: Break-up of health insurance in India
Government
Scheme, 28.7 crore,
80%
Private insurance,
7.2 crore, 20%
Source: ICICI Lombard RHP; CRISIL 2016, ICICIdirect.com; Research

Page 14 ICICI Securities Ltd | Retail Equity Research
Financials
Revenues expected to grow at CAGR of 17% in FY17-20E
Gross revenues grew at a CAGR of 22.3% over FY13-17 to | 1878 crore on
account of: 1) 1620 bps increase in occupancy rate to 61.0% followed by
2) 12.2% increase in ARPOB to | 76 lakh per share and 3) 12% increase in
operational beds to 5932. However, commercialising new hospitals
(Mumbai, Jammu and Delhi) as well as government regulations will impact
the near term ARPOB and occupancy rate. Over FY17-20E, we expect NH’s
revenues to grow 17.3% YoY to | 3032 crore mainly due to an
improvement in occupancy rate and ARPOB in less than five years
hospitals and Cayman.
Exhibit 20: Revenue (gross) growth drivers
1363.9
3021.5
224.7 84.2 94.3 0.0
165.2 71.9
235.9 33.2
13.1
218
16.9
-120.7218.7
1878.2
402.8
0.0
500.0
1000.0
1500.0
2000.0
2500.0
3000.0
3500.0
FY15 (
Revenue)
Hospit
al (>
5 y
rs)
Hospit
al (3-5 y
ears)
Hospit
als
(<
3 y
ears)
Acquir
ed H
ospit
als
Heart C
entres
HC
CI (C
aym
an)
Others
FY17
Hospit
al (>
5 y
rs)
Hospit
al (3-5 y
ears)
Hospit
als
(<
3 y
ears)
Acquir
ed H
ospit
als
Heart C
entres
HC
CI (C
aym
an)
Others
FY20
Source: Company, ICICIdirect.com; Research
Exhibit 21: ARPOB
4852
5864
76
88.6
95.5
103.1
0
10
20
30
40
50
60
70
80
90
100
110
120
FY13 FY14 FY15 FY16 FY17 FY18E FY19E FY20E
(|
crore)
ARPOB (| Lakh)
Source: Company, ICICIdirect.com; Research
Exhibit 22: Revenue break-up
3815
46784239 4144
4721 48005090 5210
45%48%
53% 54%
61.0%64%
67%68%
0
1000
2000
3000
4000
5000
6000
FY13 FY14 FY15 FY16 FY17 FY18E FY19E FY20E
(|
crore)
0%
10%
20%
30%
40%
50%
60%
70%
80%
Operating Beds Occupancy Rate (%)
Source: Company, ICICIdirect.com; Research
EBITDA margins expected to expand 137 bps over FY17-20E
EBITDA margins contracted 51 bps to 12.2% over FY13-17 mainly due to
addition of new hospitals. The company has added ~18 hospitals over
FY11-17. We believe FY18 EBITDA margins will remain under pressure
mainly due to the impact of government regulation on cardiac stents &
implants and loss at newly commissioned hospitals. However, a gradual
improvement in new hospital margins and occupancy rate is likely to
improve EBITDA margins by 137 bps in FY17-20E. We expect EBITDA in
value terms to grow 21% to | 410 crore in FY17-20E.
Over FY17-20E, we expect NH’s revenues to grow
17.3% YoY to | 3032 crore mainly due to an
improvement in occupancy rate and ARPOB in less
than five years hospitals and Cayman
EBITDA margin expected to expand ~137 bps in
FY17-20E mainly due to improvement in new
hospitals margins and occupancy rate

Page 15 ICICI Securities Ltd | Retail Equity Research
Exhibit 23: EBITDA & EBITDA margins
83.3
122.7 123.7
174.6
228.9
254.3
311.4
409.7
9.9
11.2
9.1
10.8
12.2
11.211.7
13.6
0
50
100
150
200
250
300
350
400
450
FY13 FY14 FY15 FY16 FY17 FY18E FY19E FY20E
(|
crore)
0
2
4
6
8
10
12
14
16
(%
)
EBITDA EBITDA Margins (%)
Source: Company, ICICIdirect.com; Research
Net profit expected to increase 34% CAGR in FY17-20E
Net profit grew at 26% CAGR over FY13-17 to | 84 crore mainly due to a
robust operational performance. We expect net profit to increase at 34%
CAGR in FY17-20E mainly on the back of robust operational performance
and lower interest cost.
Exhibit 24: Net profit trend
30.8 33.8 37.332.2
84.489.0
136.2
203.4
-5.8
-50
0
50
100
150
200
250
FY12 FY13 FY14 FY15 FY16 FY17 FY18E FY19E FY20E
(|
crore)
Net Profit
Source: Company, ICICIdirect.com; Research
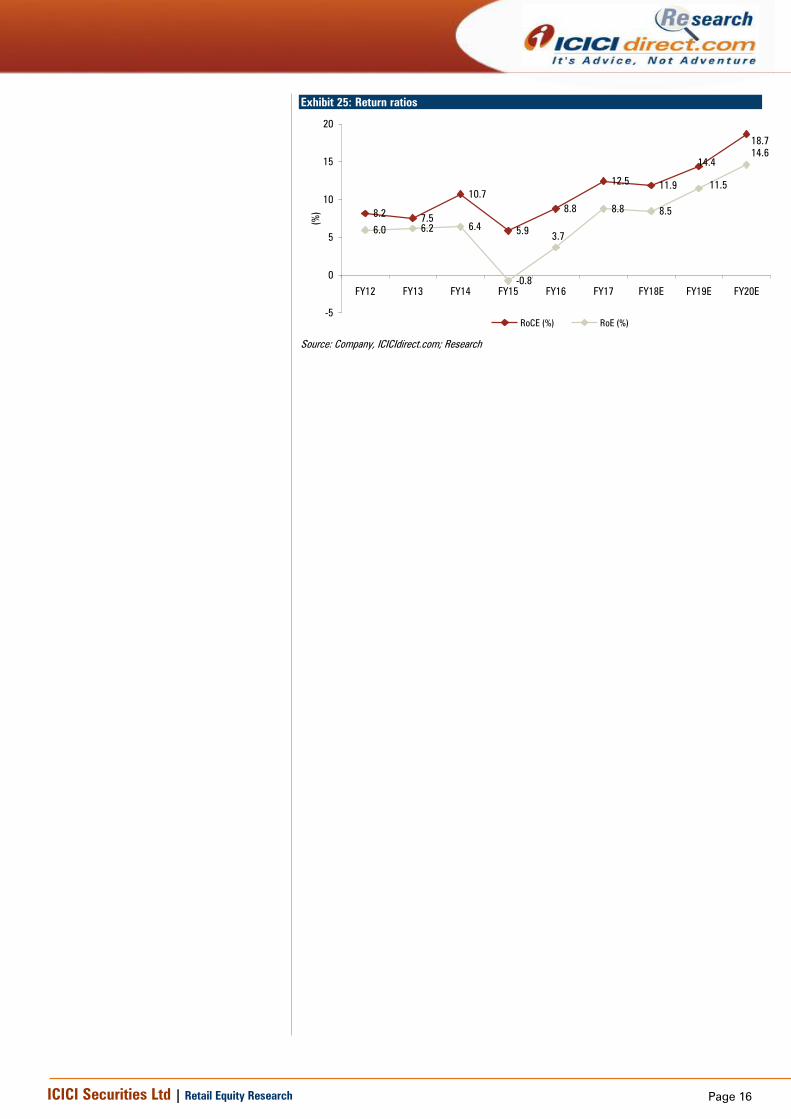
Improvement in return ratios
We expect RoCE to improve 620 bps to 18.7% in FY17-20 due to lower
base improvement in ARPOB and lower pace of gross block addition. Our
back of the envelope calculation shows that incremental capital employed
of ~| 432 crore can generate 38% ROCE during FY17-20E. (Assuming no
further gross block addition over and above the estimates.)
25.7% CAGR
34.1% CAGR
Net profit is expected to increase at 34% CAGR in
FY17-20E mainly on the back of a robust
operational performance
Page 16 ICICI Securities Ltd | Retail Equity Research
Exhibit 25: Return ratios
8.27.5
10.7
5.9
8.8
12.511.9
6.0 6.2 6.4
-0.8
8.8 8.5
14.4
18.7
3.7
11.5
14.6
-5
0
5
10
15
20
FY12 FY13 FY14 FY15 FY16 FY17 FY18E FY19E FY20E
(%
)
RoCE (%) RoE (%)
Source: Company, ICICIdirect.com; Research

Page 17 ICICI Securities Ltd | Retail Equity Research
Risk & concerns
Government regulations
In the past six months, the government has voluntarily shifted cardiac
stents and knee implants to the national list of essential medicines (NLEM)
to cap the prices of both devices. The government has also put a
restriction of six months on hospitals for changing procedural prices. NH
derived 48% of FY17 revenues from cardiac treatment. Although NH’s
model is low cost, the disturbance in supplies on account of shortage and
uncertainty of stent availability has a direct impact on procedural revenues.
The management expects | 40-45 crore of loss in FY18 due to cardiac
stent price regulation. Of late, the government has also brought knee
implants under the NLEM ambit. These kinds of interventions are
detrimental to revenues if the government also starts regulating
procedures. Recently, two state governments, West Bengal and Karnataka
passed laws capping the prices of select private healthcare services.
PPP model in healthcare may be unviable with CGHS rates
NHP 2017 advocates active participation of private healthcare providers
with the government acting as service purchaser. The Niti Aayog’s report
on PPP gives details about the rates that can be charged to patients who
are not covered by National Health Protection Schemes (NHPS), Rashtriya
Swasthya Bima Yojana (RSBY), Central Government Health Scheme
(CGHS) or state insurance schemes. It proposes that where NHPS, RSBY
and state insurance schemes are not applicable, patients cannot be
charged over CGHS rates. Note that CGHS rates are substantially lower
than even the average rates of different procedures. Hence, any player
entering into these kind arrangements will face a substantially longer
payback achievement.
Delay in ramp-up of new facilities
Recently, the company started hospitals in Jammu, Mumbai and
Dharamshila in the NCR region. The company is also planning to
commission its newly acquired facility at Gurugram in Q4FY18. It has
reported a contraction in margins in FY17 and Q1FY18 mainly due to a loss
in new hospitals. We have already factored in the initial loss due to
commissioning of new hospitals. However, any further delay beyond our
expectation will further impact overall financials.
Concentrated in few hospitals and treatments
The company’s three key facilities, Narayana Institute of Cardiac Sciences
(NICS), Mazumdar Shaw Medical Centre (MSMC) and Rabindranath Tagore
International Institute of Cardiac Sciences (RTIICS) together contribute
more than half of the company’s overall revenues. Any material impact on
any of these facilities due to a reduction in patient footfall, reputational
harm, liabilities on account of medical negligence and loss due to natural
calamities and increased competition could significantly impact overall
revenues and profitability.

Page 18 ICICI Securities Ltd | Retail Equity Research
Valuation
We expect revenues, EBITDA and PAT to grow at a CAGR of 17%, 21%
and 34% in FY17-20E, respectively. This is expected to be driven by an
increase in occupancy ratio, mainly of less than five year’s hospitals and an
improvement in the case mix. On the EBITDA margin front, we expect near
term margins to remain under pressure mainly due to government
regulations and loss from new hospitals.
In a conducive but challenging space of Indian healthcare delivery,
plagued by longer gestation periods, low operating margin, leveraged
balance sheets and low return ratios, we believe NH is best placed among
peers to sail through. Its legacy model is based on affordability. Hence,
conscious efforts towards cost & capital control are embedded in the
management’s long term strategy. This becomes even more pertinent in
the backdrop of incremental government intervention via schemes and
control over procedures & products. On the other hand, it is also
determined to improve ARPOB by improving case mix, occupancies, thus
fine-tuning affordability with profitability. We arrive at an SOTP target price
of | 340 by valuing the matured hospitals and Cayman Islands hospital at
12x FY20E EV/EBITDA, other hospitals at 1.5x FY20E EV/Sales and other
businesses at 1.0x FY20E EV/sales.
Exhibit 26: Valuation
Particulers Valuation Matrix Multiple (x) Enterprise value (| cr)
Hospital (Matured) EV/EBITDA 12.0 4514.8
Cayman EV/EBITDA 12.0 923.5
Hospital (Others) EV/Sales 1.5 1385.2
Other Business EV/Sales 1.0 186.0
Net Debt FY20E (| cr) 29.9
EV (| cr) 6979.6
No of shares (cr) 20.4
Per Share Value (|) 340.0
Source: ICICIdirect.com; Research
Exhibit 27: Domestic peers comparison (FY17)
FY17 (| crore) Market Cap
No. of
operating
beds Revenue
EBITDA
margin EBITDA
Asset
Turnover EV/Sales EV/ EBITDA
Sales/Bed (|
lakhs)
EV/Bed (|
lakhs)
ARPOB (|
Lakh) ALOS
Apollo Hospitals (Hospital segment)* 11397.6 6997 4163.3 17.1 712.2 1.0 3.3 19.5 59.5 198.9 115.1 4.0
Narayana Hrudayaalaya 5995.0 5932 1895.6 13.0 246.3 1.6 3.2 24.9 32.0 103.5 76.0 4.0
Fortis (Hospital segment)* 4654.3 4700 3712.0 14.7 545.0 NA 1.8 11.9 79.0 138.5 145.0 3.6
Max India (Hospital segment)* 2654.0 2330 2567.0 10.9 281.0 1.1 1.5 13.4 110.2 161.2 149.7 3.2
HCG 2515.0 1364 700.1 15.0 105.0 0.9 3.9 26.3 51.3 202.5 106.3 2.9
* Market caps are implied by separating other businesses Source: Bloomberg, ICICIdirect.com; Research
Exhibit 28: Global peers comparison
Company Name Country Market Cap EV Revenues EBITDA EBITDA Margin PAT FCF D/E ROCE EV/EBITDA PE
Ramsay Health Care Ltd Australia 10705.9 13861.9 6326.8 884.8 14.0% 328.1 416.2 194.5 18.2 13.8 30.2
IHH Healthcare Bhd Malaysia 11404.7 12531.5 2420.7 525.2 21.7% 148.0 383.9 34.1 5.1 21.2 49.0
HCA Healthcare Inc United States 29464.2 62361.0 41490.0 8152.0 19.6% 2890.0 1883.5 NA 24.3 7.7 12.4
DaVita Inc United States 11168.5 20565.0 14745.1 2614.8 17.7% 879.9 118.4 196.0 28.2 8.2 16.2
Universal Health Services Inc United States 10027.1 14576.3 9766.2 1698.0 17.4% 702.4 631.9 91.8 18.1 8.3 14.5
US$ million US$ million
Source: Bloomberg, ICICIdirect.com; Research
Page 19 ICICI Securities Ltd | Retail Equity Research
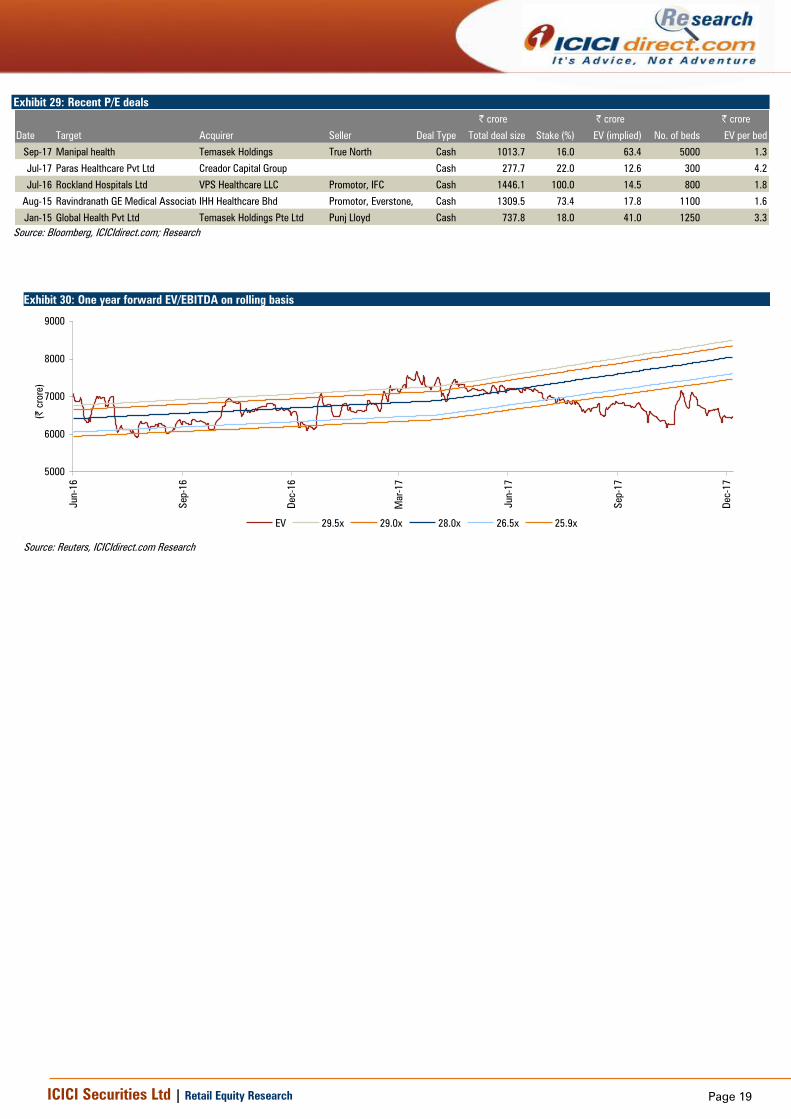
Exhibit 29: Recent P/E deals
| crore | crore | crore
Date Target Acquirer Seller Deal Type Total deal size Stake (%) EV (implied) No. of beds EV per bed
Sep-17 Manipal health Temasek Holdings True North Cash 1013.7 16.0 63.4 5000 1.3
Jul-17 Paras Healthcare Pvt Ltd Creador Capital Group Cash 277.7 22.0 12.6 300 4.2
Jul-16 Rockland Hospitals Ltd VPS Healthcare LLC Promotor, IFC Cash 1446.1 100.0 14.5 800 1.8
Aug-15 Ravindranath GE Medical Associates Pvt LtdIHH Healthcare Bhd Promotor, Everstone, IFC Cash 1309.5 73.4 17.8 1100 1.6
Jan-15 Global Health Pvt Ltd Temasek Holdings Pte Ltd Punj Lloyd Cash 737.8 18.0 41.0 1250 3.3
Source: Bloomberg, ICICIdirect.com; Research
Exhibit 30: One year forward EV/EBITDA on rolling basis
s
5000
6000
7000
8000
9000
Jun-16
Sep-16
Dec-16
Mar-17
Jun-17
Sep-17
Dec-17
(|
crore)
EV 29.5x 29.0x 28.0x 26.5x 25.9x
Source: Reuters, ICICIdirect.com Research
Page 20 ICICI Securities Ltd | Retail Equity Research
Financials
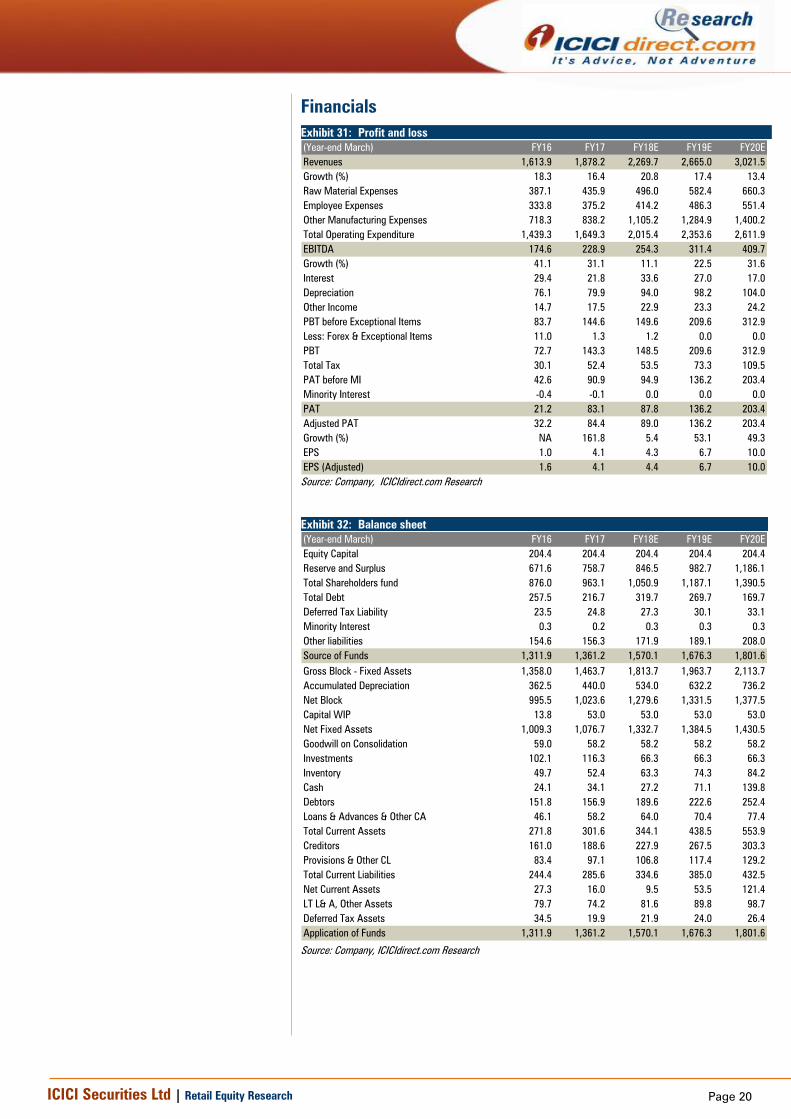
Exhibit 31: Profit and loss
(Year-end March) FY16 FY17 FY18E FY19E FY20E
Revenues 1,613.9 1,878.2 2,269.7 2,665.0 3,021.5
Growth (%) 18.3 16.4 20.8 17.4 13.4
Raw Material Expenses 387.1 435.9 496.0 582.4 660.3
Employee Expenses 333.8 375.2 414.2 486.3 551.4
Other Manufacturing Expenses 718.3 838.2 1,105.2 1,284.9 1,400.2
Total Operating Expenditure 1,439.3 1,649.3 2,015.4 2,353.6 2,611.9
EBITDA 174.6 228.9 254.3 311.4 409.7
Growth (%) 41.1 31.1 11.1 22.5 31.6
Interest 29.4 21.8 33.6 27.0 17.0
Depreciation 76.1 79.9 94.0 98.2 104.0
Other Income 14.7 17.5 22.9 23.3 24.2
PBT before Exceptional Items 83.7 144.6 149.6 209.6 312.9
Less: Forex & Exceptional Items 11.0 1.3 1.2 0.0 0.0
PBT 72.7 143.3 148.5 209.6 312.9
Total Tax 30.1 52.4 53.5 73.3 109.5
PAT before MI 42.6 90.9 94.9 136.2 203.4
Minority Interest -0.4 -0.1 0.0 0.0 0.0
PAT 21.2 83.1 87.8 136.2 203.4
Adjusted PAT 32.2 84.4 89.0 136.2 203.4
Growth (%) NA 161.8 5.4 53.1 49.3
EPS 1.0 4.1 4.3 6.7 10.0
EPS (Adjusted) 1.6 4.1 4.4 6.7 10.0
Source: Company, ICICIdirect.com Research
Exhibit 32: Balance sheet
(Year-end March) FY16 FY17 FY18E FY19E FY20E
Equity Capital 204.4 204.4 204.4 204.4 204.4
Reserve and Surplus 671.6 758.7 846.5 982.7 1,186.1
Total Shareholders fund 876.0 963.1 1,050.9 1,187.1 1,390.5
Total Debt 257.5 216.7 319.7 269.7 169.7
Deferred Tax Liability 23.5 24.8 27.3 30.1 33.1
Minority Interest 0.3 0.2 0.3 0.3 0.3
Other liabilities 154.6 156.3 171.9 189.1 208.0
Source of Funds 1,311.9 1,361.2 1,570.1 1,676.3 1,801.6
Gross Block - Fixed Assets 1,358.0 1,463.7 1,813.7 1,963.7 2,113.7
Accumulated Depreciation 362.5 440.0 534.0 632.2 736.2
Net Block 995.5 1,023.6 1,279.6 1,331.5 1,377.5
Capital WIP 13.8 53.0 53.0 53.0 53.0
Net Fixed Assets 1,009.3 1,076.7 1,332.7 1,384.5 1,430.5
Goodwill on Consolidation 59.0 58.2 58.2 58.2 58.2
Investments 102.1 116.3 66.3 66.3 66.3
Inventory 49.7 52.4 63.3 74.3 84.2
Cash 24.1 34.1 27.2 71.1 139.8
Debtors 151.8 156.9 189.6 222.6 252.4
Loans & Advances & Other CA 46.1 58.2 64.0 70.4 77.4
Total Current Assets 271.8 301.6 344.1 438.5 553.9
Creditors 161.0 188.6 227.9 267.5 303.3
Provisions & Other CL 83.4 97.1 106.8 117.4 129.2
Total Current Liabilities 244.4 285.6 334.6 385.0 432.5
Net Current Assets 27.3 16.0 9.5 53.5 121.4
LT L& A, Other Assets 79.7 74.2 81.6 89.8 98.7
Deferred Tax Assets 34.5 19.9 21.9 24.0 26.4
Application of Funds 1,311.9 1,361.2 1,570.1 1,676.3 1,801.6
Source: Company, ICICIdirect.com Research

Page 21 ICICI Securities Ltd | Retail Equity Research
Exhibit 33: Cash Flow
(Year-end March) FY16 FY17 FY18E FY19E FY20E
Profit/(Loss) after taxation 16.0 98.8 87.8 136.2 203.4
Add: Depreciation & Amortization 76.1 79.9 94.0 98.2 104.0
Net Increase in Current Assets -20.8 -20.4 -49.4 -50.4 -46.8
Net Increase in Current Liabilities 42.6 28.8 49.0 50.4 47.5
Others 60.3 32.3 33.6 27.0 17.0
CF from operating activities 174.1 219.4 214.9 261.3 325.1
(Inc)/dec in Fixed Assets -87.8 -118.4 -350.0 -150.0 -150.0
(Inc)/dec in Investments -30.2 -23.9 50.0 0.0 0.0
Others -79.6 -21.9 8.7 9.6 10.6
CF from investing activities -197.6 -164.2 -291.3 -140.4 -139.4
Inc / (Dec) in Equity Capital -1.1 0.0 0.0 0.0 0.0
Inc / (Dec) in Debt 44.5 -24.6 103.0 -50.0 -100.0
Dividend & Dividend Tax 0.0 0.0 0.0 0.0 0.0
Others -25.3 -20.6 -33.6 -27.0 -17.0
CF from financing activities 18.0 -45.1 69.4 -77.0 -117.0
Net Cash flow -5.5 10.1 -6.9 43.9 68.7
Opening Cash 29.5 24.1 34.1 27.2 71.1
Closing Cash 24.1 34.1 27.2 71.1 139.8
Free Cash Flow 86.3 101.0 -135.1 111.3 175.1
Source: Company, ICICIdirect.com Research
Source: Company, ICICIdirect.com Research
Exhibit 34: Ratio Analysis
(Year-end March) FY16 FY17 FY18E FY19E FY20E
Per share data (|)
EPS 1.6 4.1 4.4 6.7 10.0
Cash EPS 1.6 4.1 4.4 6.7 10.0
BV 42.9 47.1 51.4 58.1 68.0
DPS 0.0 0.0 0.0 0.0 0.0
Cash Per Share 17.7 21.5 26.1 30.9 36.0
Operating Ratios (%)
EBITDA margins 10.8 12.2 11.2 11.7 13.6
Net Profit margins 2.0 4.5 3.9 5.1 6.7
Cash Conversion cycle 9.2 4.0 4.0 4.0 4.0
Gross Assets Turnover 1.2 1.3 1.3 1.4 1.5
Return Ratios (%)
RoE 3.7 8.8 8.5 11.5 14.6
RoCE 8.8 12.5 11.9 14.4 18.7
RoIC 9.1 13.1 12.0 15.3 21.2
Valuation Ratios (x)
P/E 180.0 68.7 65.2 42.6 28.5
EV / EBITDA 34.5 26.0 23.9 19.2 14.2
EV / Revenues 3.7 3.2 2.7 2.2 1.9
Market Cap / Revenues 3.6 3.1 2.6 2.2 1.9
Price to Book Value 6.6 6.0 5.5 4.9 4.2
Solvency Ratios
Net Debt / Equity 0.3 0.2 0.3 0.2 0.1
Net Debt / EBITDA 1.3 0.7 1.1 0.6 0.0
Current Ratio 1.0 0.9 0.9 1.0 1.0

Page 22 ICICI Securities Ltd | Retail Equity Research
Appendix:
In-patient revenue
In patient revenue is defined as revenue generated from a patient who
lives in a hospital while under treatment.
Out-patient revenue
Outpatient revenue is defined as revenue generated from a patient who
does not stay in the hospital while under treatment.
Operational beds
Operational beds are defined as the beds, which have been commissioned
for service of the total capacity of beds
Occupied beds
Occupied beds are defined as the beds if a patient is physically in the bed
or the bed is being retained for a patient. Thus, a bed maybe operational
but not occupied.
ARPOB
ARPOB stands for Average Revenue Per Occupied Bed. To calculate the
average, divide the total revenue for each bed with the number of days the
bed has been occupied
Average effective capital cost per operational bed
The metric is calculated by dividing the gross block +CWIP by the number
of operational beds
ALOS
ALOS stands for average length of stay. To calculate ALOS, divide the sum
of inpatient days for a particular diagnosis with the number of patient
admitted for the diagnosis. In simpler terms, it refers to the number of
days a person stays in a hospital for a particular illness or disease.
Census beds (Revenue earning beds)
An official count, in the hospital setting. The total number of patients
admitted to the facility by midnight, or sometimes at another time of the
day or evening.
Organ Transplant
It is an operation in which an organ is transplanted
JCI accreditation
Joint Commission International (JCI) works to improve patient safety and
quality of health care in the international community by offering education,
publications, advisory services, and international accreditation and
certification
NABH accreditation
National Accreditation Board for Hospitals & Healthcare (NABH) is a
constituent board of Quality Council of India Certification, set up to
establish and operate accreditation programme for healthcare
organisations
Page 23 ICICI Securities Ltd | Retail Equity Research
Hospital payee profile:
1) Scheme patients
Patients who fall under various government related schemes (GIPSA,
CGHS etc.)
2) Insured patients
Patients who fall under various private insurance schemes
3) International patients
Patients who are from abroad
4) Walk-in patients
Patients who do not fall in above 3 categories of patients
Consultant fee model
1) Full time consultant
Paid combination of fixed and variable pay and are considered full time
employees
2) Retainer Shift
Paid only the fixed component. They work on a contractual basis
3) Fee for service
Visiting consultants that are paid based on service provided
Hospital Engagement framework:
1) Owned or Long-term/perpetual lease
Owns or operates on a freehold basis or land taken on a long-term /
perpetual lease
2) Revenue per share/rental
Operates and pays a revenue share/rent to owner of the hospital premises
3) Public-private partnership
Operates with nominal investment in partnership with public entities
4) Managed hospitals
Provides healthcare services to third parties for a management fee

Page 24 ICICI Securities Ltd | Retail Equity Research
RATING RATIONALE
ICICIdirect.com endeavours to provide objective opinions and recommendations. ICICIdirect.com assigns
ratings to its stocks according to their notional target price vs. current market price and then categorises them
as Strong Buy, Buy, Hold and Sell. The performance horizon is two years unless specified and the notional
target price is defined as the analysts' valuation for a stock.
Strong Buy: >15%/20% for large caps/midcaps, respectively, with high conviction;
Buy: >10%/15% for large caps/midcaps, respectively;
Hold: Up to +/-10%;
Sell: -10% or more;
Pankaj Pandey Head – Research [email protected]
ICICIdirect.com Research Desk,
ICICI Securities Limited,
1st Floor, Akruti Trade Centre,
Road No 7, MIDC,
Andheri (East)
Mumbai – 400 093

Page 25 ICICI Securities Ltd | Retail Equity Research
ANALYST CERTIFICATION
We /I, Siddhant Khandekar CA-INTER, Mitesh Shah MS (Finance) Harshal Mehta M. Tech (Biotechnology) Research Analysts, authors and the names subscribed to this report, hereby certify that all of
the views expressed in this research report accurately reflect our views about the subject issuer(s) or securities. We also certify that no part of our compensation was, is, or will be directly or
indirectly related to the specific recommendation(s) or view(s) in this report.
Terms & conditions and other disclosures:
ICICI Securities Limited (ICICI Securities) is a full-service, integrated investment banking and is, inter alia, engaged in the business of stock brokering and distribution of financial products. ICICI
Securities Limited is a Sebi registered Research Analyst with Sebi Registration Number – INH000000990. ICICI Securities is a wholly-owned subsidiary of ICICI Bank which is India’s largest private
sector bank and has its various subsidiaries engaged in businesses of housing finance, asset management, life insurance, general insurance, venture capital fund management, etc. (“associates”), the
details in respect of which are available on www.icicibank.com.
ICICI Securities is one of the leading merchant bankers/ underwriters of securities and participate in virtually all securities trading markets in India. We and our associates might have investment
banking and other business relationship with a significant percentage of companies covered by our Investment Research Department. ICICI Securities generally prohibits its analysts, persons
reporting to analysts and their relatives from maintaining a financial interest in the securities or derivatives of any companies that the analysts cover.
The information and opinions in this report have been prepared by ICICI Securities and are subject to change without any notice. The report and information contained herein is strictly confidential
and meant solely for the selected recipient and may not be altered in any way, transmitted to, copied or distributed, in part or in whole, to any other person or to the media or reproduced in any
form, without prior written consent of ICICI Securities. While we would endeavour to update the information herein on a reasonable basis, ICICI Securities is under no obligation to update or keep the
information current. Also, there may be regulatory, compliance or other reasons that may prevent ICICI Securities from doing so. Non-rated securities indicate that rating on a particular security has
been suspended temporarily and such suspension is in compliance with applicable regulations and/or ICICI Securities policies, in circumstances where ICICI Securities might be acting in an advisory
capacity to this company, or in certain other circumstances.
This report is based on information obtained from public sources and sources believed to be reliable, but no independent verification has been made nor is its accuracy or completeness guaranteed.
This report and information herein is solely for informational purpose and shall not be used or considered as an offer document or solicitation of offer to buy or sell or subscribe for securities or
other financial
instruments. Though disseminated to all the customers simultaneously, not all customers may receive this report at the same time. ICICI Securities will not treat recipients as customers by virtue of
their receiving this report. Nothing in this report constitutes investment, legal, accounting and tax advice or a representation that any investment or strategy is suitable or appropriate to your specific
circumstances. The securities discussed and opinions expressed in this report may not be suitable for all investors, who must make their own investment decisions, based on their own investment
objectives, financial positions and needs of specific recipient. This may not be taken in substitution for the exercise of independent judgment by any recipient. The recipient should independently
evaluate the investment risks. The value and return on investment may vary because of changes in interest rates, foreign exchange rates or any other reason. ICICI Securities accepts no liabilities
whatsoever for any loss or damage of any kind arising out of the use of this report. Past performance is not necessarily a guide to future performance. Investors are advised to see Risk Disclosure
Document to understand the risks associated before investing in the securities markets. Actual results may differ materially from those set forth in projections. Forward-looking statements are not
predictions and may be subject to change without notice.
ICICI Securities or its associates might have managed or co-managed public offering of securities for the subject company or might have been mandated by the subject company for any other
assignment in the past twelve months.
ICICI Securities or its associates might have received any compensation from the companies mentioned in the report during the period preceding twelve months from the date of this report for
services in respect of managing or co-managing public offerings, corporate finance, investment banking or merchant banking, brokerage services or other advisory service in a merger or specific
transaction.
ICICI Securities or its associates might have received any compensation for products or services other than investment banking or merchant banking or brokerage services from the companies
mentioned in the report in the past twelve months.
ICICI Securities encourages independence in research report preparation and strives to minimize conflict in preparation of research report. ICICI Securities or its associates or its analysts did not
receive any compensation or other benefits from the companies mentioned in the report or third party in connection with preparation of the research report. Accordingly, neither ICICI Securities nor
Research Analysts and their relatives have any material conflict of interest at the time of publication of this report.
It is confirmed that Siddhant Khandekar CA-INTER, Mitesh Shah MS (Finance) Harshal Mehta MTech (Biotechnology) Research Analysts of this report have not received any compensation from the
companies mentioned in the report in the preceding twelve months.
Compensation of our Research Analysts is not based on any specific merchant banking, investment banking or brokerage service transactions.
ICICI Securities or its subsidiaries collectively or Research Analysts or their relatives do not own 1% or more of the equity securities of the Company mentioned in the report as of the last day of the
month preceding the publication of the research report.
Since associates of ICICI Securities are engaged in various financial service businesses, they might have financial interests or beneficial ownership in various companies including the subject
company/companies mentioned in this report.
It is confirmed that Siddhant Khandekar CA-INTER, Mitesh Shah MS (Finance) Harshal Mehta MTech (Biotechnology) Research Analysts do not serve as an officer, director or employee of the
companies mentioned in the report.
ICICI Securities may have issued other reports that are inconsistent with and reach different conclusion from the information presented in this report.
Neither the Research Analysts nor ICICI Securities have been engaged in market making activity for the companies mentioned in the report.
We submit that no material disciplinary action has been taken on ICICI Securities by any Regulatory Authority impacting Equity Research Analysis activities.
This report is not directed or intended for distribution to, or use by, any person or entity who is a citizen or resident of or located in any locality, state, country or other jurisdiction, where such
distribution, publication, availability or use would be contrary to law, regulation or which would subject ICICI Securities and affiliates to any registration or licensing requirement within such
jurisdiction. The securities
described herein may or may not be eligible for sale in all jurisdictions or to certain category of investors. Persons in whose possession this document may come are required to inform themselves
of and to observe such restriction.
report and information herein is solely for informational purpose and shall not be used or considered as an offer document or solicitation of offer to buy or sell or subscribe for securities or other
financial
instruments. Though disseminated to all the customers simultaneously, not all customers may receive this report at the same time. ICICI Securities will not treat recipients as customers by virtue of
their receiving this report. Nothing in this report constitutes investment, legal, accounting and tax advice or a representation that any investment or strategy is suitable or appropriate to your specific
circumstances. The securities discussed and opinions expressed in this report may not be suitable for all investors, who must make their own investment decisions, based on their own investment
objectives, financial positions and needs of specific recipient. This may not be taken in substitution for the exercise of independent judgment by any recipient. The recipient should independently
evaluate the investment risks. The value and return on investment may vary because of changes in interest rates, foreign exchange rates or any other reason. ICICI Securities accepts no liabilities
whatsoever for any loss or damage of any kind arising out of the use of this report. Past performance is not necessarily a guide to future performance. Investors are advised to see Risk Disclosure
Document to understand the risks associated before investing in the securities markets. Actual results may differ materially from those set forth in projections. Forward-looking statements are not
predictions and may be subject to
change without notice.
ICICI Securities or its associates might have managed or co-managed public offering of securities for the subject company or might have been mandated by the subject company for any other
assignment in the past twelve months.
ICICI Securities or its associates might have received any compensation from the companies mentioned in the report during the period preceding twelve months from the date of this report for
services in respect of managing or co-managing public offerings, corporate finance, investment banking or merchant banking, brokerage services or other advisory service in a merger or specific
transaction.
ICICI Securities or its associates might have received any compensation for products or services other than investment banking or merchant banking or brokerage services from the companies
mentioned in the report in the past twelve months.
ICICI Securities encourages independence in research report preparation and strives to minimize conflict in preparation of research report. ICICI Securities or its analysts did not receive any
compensation or other benefits from the companies mentioned in the report or third party in connection with preparation of the research report. Accordingly, neither ICICI Securities nor Research
Analysts have any material conflict of interest at the time of publication of this report.
It is confirmed that Siddhant Khandekar CA-INTER Mitesh Shah MS (Finance), Harshal Mehta MTech (Biotechnology) Research Analysts of this report have not received any compensation from the
companies mentioned in the report in the preceding twelve months.
Compensation of our Research Analysts is not based on any specific merchant banking, investment banking or brokerage service transactions.