
Initial A. with OPs of B. - Abdul Latif Jameel Poverty Action Lab
20
American Economic Review 2012, 102(7): 3574–3593 http://dx.doi.org/10.1257/aer.102.7.3574 3574 Who Gets the Job Referral? Evidence from a Social Networks Experiment † By Lori Beaman and Jeremy Magruder* Social networks influence labor markets worldwide. By now, an extensive empiri- cal literature has utilized natural experiments and other credible identification tech- niques to persuade us that networks affect labor market outcomes. 1 We also know that a large fraction of jobs are found through networks in many contexts, including 30–60 percent of US jobs (Bewley 1999; Ioannides and Loury 2004). In our sample in Kolkata, India, 45 percent of employees have helped a friend or relative find a job with their current employer. While these analyses have convinced us of the importance of job networks, the empirical literature has had far less to say about why job networks are so commonplace. In contrast, theory has suggested several pathways by which firms and job searchers can find social networks beneficial. For example, job seekers can use social network contacts to minimize search costs (Calvo-Armengol 2004; Mortensen and Vishwanath 1994; Galeotti and Merlino 2009), firms can exploit peer monitoring among socially connected employees to address moral hazard (Kugler 2003), and firms can use referrals as a screen- ing mechanism to reduce asymmetric information inherent in the hiring process (Montgomery 1991; Munshi 2003). 2 Theory has also suggested a potential cost to relying on social networks to address these labor market imperfections: the use of networks in job search can perpetuate inequalities across groups in the long run (Calvo-Armengol and Jackson 2004). This paper provides experimental evidence on one of the mechanisms by which networks may generate surplus to counterbal- ance this cost, by examining whether social networks can and will provide improved screening for firms. 3 We create short-term jobs in a laboratory in the field in urban India and observe how the actual referral process responds to random variation in the incentives to refer a highly skilled employee. This allows us to determine whether participants have useful information about fellow network members. 1 See, for example, Bayer, Ross, and Topa (2008); Beaman (2012); Kramarz and Skans (2007); Granovetter (1973); Laschever (2009); Magruder (2010); Munshi (2003); Munshi and Rosenzweig (2006); and Topa (2001). 2 Moral hazard is highlighted as a reason for the use of referrals in Bangladeshi garment factories in Heath (2011) and Castilla (2005) highlights that on-the-job social connections provide support to new recruits using data from a call center in the United States. 3 We do not rule out reduced search costs and peer monitoring as additional reasons networks influence labor markets. * Beaman: Department of Economics, Northwestern University, 2001 Sheridan Rd, Evanston, IL 60208 (e-mail: [email protected]); Magruder: Department of Agricultural and Resource Economics, UC Berkeley, 207 Giannini Hall, Berkeley, CA 94720 (e-mail: [email protected]). We thank the Russell Sage Foundation for funding part of the study, Prasid Chakraborty and the SRG team for outstanding fieldwork, and Katie Wilson and Ayako Matsuda for excellent research assistance. We also thank David Figlio, Alain de Janvry, Ethan Ligon, Ted Miguel, Rohini Pande, Betty Sadoulet, Laura Schechter, and numerous seminar participants for comments. All errors are our own. † To view additional materials, visit the article page at http://dx.doi.org/10.1257/aer.102.7.3574.
Transcript of Initial A. with OPs of B. - Abdul Latif Jameel Poverty Action Lab

American Economic Review 2012, 102(7): 3574–3593 http://dx.doi.org/10.1257/aer.102.7.3574
3574
Who Gets the Job Referral? Evidence from a Social Networks Experiment†
By Lori Beaman and Jeremy Magruder*
Social networks influence labor markets worldwide. By now, an extensive empiri-cal literature has utilized natural experiments and other credible identification tech-niques to persuade us that networks affect labor market outcomes.1 We also know that a large fraction of jobs are found through networks in many contexts, including 30–60 percent of US jobs (Bewley 1999; Ioannides and Loury 2004). In our sample in Kolkata, India, 45 percent of employees have helped a friend or relative find a job with their current employer. While these analyses have convinced us of the importance of job networks, the empirical literature has had far less to say about why job networks are so commonplace. In contrast, theory has suggested several pathways by which firms and job searchers can find social networks beneficial. For example, job seekers can use social network contacts to minimize search costs (Calvo-Armengol 2004; Mortensen and Vishwanath 1994; Galeotti and Merlino 2009), firms can exploit peer monitoring among socially connected employees to address moral hazard (Kugler 2003), and firms can use referrals as a screen-ing mechanism to reduce asymmetric information inherent in the hiring process (Montgomery 1991; Munshi 2003).2 Theory has also suggested a potential cost to relying on social networks to address these labor market imperfections: the use of networks in job search can perpetuate inequalities across groups in the long run (Calvo-Armengol and Jackson 2004). This paper provides experimental evidence on one of the mechanisms by which networks may generate surplus to counterbal-ance this cost, by examining whether social networks can and will provide improved screening for firms.3 We create short-term jobs in a laboratory in the field in urban India and observe how the actual referral process responds to random variation in the incentives to refer a highly skilled employee. This allows us to determine whether participants have useful information about fellow network members.
1 See, for example, Bayer, Ross, and Topa (2008); Beaman (2012); Kramarz and Skans (2007); Granovetter (1973); Laschever (2009); Magruder (2010); Munshi (2003); Munshi and Rosenzweig (2006); and Topa (2001).
2 Moral hazard is highlighted as a reason for the use of referrals in Bangladeshi garment factories in Heath (2011) and Castilla (2005) highlights that on-the-job social connections provide support to new recruits using data from a call center in the United States.
3 We do not rule out reduced search costs and peer monitoring as additional reasons networks influence labor markets.
* Beaman: Department of Economics, Northwestern University, 2001 Sheridan Rd, Evanston, IL 60208 (e-mail: [email protected]); Magruder: Department of Agricultural and Resource Economics, UC Berkeley, 207 Giannini Hall, Berkeley, CA 94720 (e-mail: [email protected]). We thank the Russell Sage Foundation for funding part of the study, Prasid Chakraborty and the SRG team for outstanding fieldwork, and Katie Wilson and Ayako Matsuda for excellent research assistance. We also thank David Figlio, Alain de Janvry, Ethan Ligon, Ted Miguel, Rohini Pande, Betty Sadoulet, Laura Schechter, and numerous seminar participants for comments. All errors are our own.
† To view additional materials, visit the article page at http://dx.doi.org/10.1257/aer.102.7.3574.
ContentsWho Gets the Job Referral? Evidence from a Social Networks Experiment† 3574
I. Context and Experimental Design 3576A. Initial Recruitment 3578B. Return of OPs with Referrals 3580II. Theoretical Framework 3581III. Can Network Members Screen? 3582A. Returning with a Referral 3584B. Responsiveness to Fixed Fees 3586C. Relationship between Referrals and OPs 3587D. Referral Performance and Response to Incentives 3589E. Why Are High-Ability OPs Different from Low-Ability OPs? 3590IV. Identifying Good Referrals 3591V. Conclusion 3592References 3592
3575BEAmAn AnD mAgRuDER: WHO gEts tHE jOB REfERRAL?VOL. 102 nO. 7
We argue that disseminating job information is often not the primary reason that social relationships are formed and maintained. In a developing country setting like the one in this paper, the majority of the literature on networks emphasizes how individu-als use network links to improve risk sharing and insure against idiosyncratic shocks (Udry 1994, Townsend 1994, Ligon and Schechter 2010). Therefore, any empirical investigation of how social networks can influence labor markets must grapple with the fact that an individual may rely on his or her network in a variety of contexts, and there are likely spillovers from one context to another (Conley and Udry 1994). These spillovers may cause networks to smooth search frictions using network links that do not represent particularly strong job matches. For example, individuals in networks that formed to share risk may not have the right information to identify good job-specific matches, or they may not be inclined to use that information (if they have it) in a way that benefits employers. There may be contingent contracts or simple altruistic relationships that encourage an employee to refer a poorly qualified friend over the person they believe to be most qualified for the job. Several studies have suggested that particular family relationships may be quite important in job network contexts (Loury 2006, Magruder 2010, Wang 2011), and Fafchamps and Moradi (2009) argue that referrals in the colonial British army in Ghana lowered the quality of recruits due to referee opportunism. In a related context, Bandiera, Barankay, and Rasul (2007) show that without incentives, social connections decreased productivity due to on-the-job favoritism in a UK fruit farm. We must therefore consider carefully the decision problem faced by an employee who is embedded in a social network, as the network may create incentives counter to the firm’s objectives.
This study examines the job referral process in Kolkata, India, using a laboratory experiment that exploits out-of-laboratory behavior. We set up a temporary labora-tory in an urban area, and create jobs in an experimental setting by paying individu-als to take a survey and complete a cognitively intensive task. Our employees are drawn from a pool of active labor market participants and are offered a financial incentive to refer a friend or relative to the job. While everyone is asked to refer a friend who will be highly skilled at the job, the type of referral contract and amount offered is randomized: some are proposed a fixed payment while others are offered a guaranteed sum plus a contingent bonus based on the referrals’ performance (per-formance pay). The referrals are not themselves given any direct financial incentive to perform well. The incentives serve as a tool to reveal information held by par-ticipants and provide insights into competing incentives outside of the workplace. In order to isolate the effect of the performance pay contract on the selection of referrals, all individuals in performance pay treatments are informed that they will receive the full performance bonus before their referrals complete the task.
The controlled setting we create allows us to examine the complete set of on-the-job incentives faced by each of our employees, which would be difficult in a nonexperimental setting. We show that there is a tension between the incentives offered by the employer and the social incentives within a network. When individu-als in our study receive performance pay, so that their finder’s fee depends on their referral’s performance, they become 7 percentage points less likely to refer relatives, who are more integrated into our respondents’ risk-sharing networks according to the survey data. This is a large change since less than 15 percent of individuals refer relatives. They are also 8 percentage points more likely to refer coworkers.

3576 tHE AmERICAn ECOnOmIC REVIEW DECEmBER 2012
Analysis of referrals’ actual performance in the cognitive task treatments shows that high-performing original participants (OPs) are capable of selecting individu-als who are themselves highly skilled, but that these individuals only select highly skilled network members when given a contract in which their own pay is indexed to the referral’s performance. Low-ability OPs, however, show little capacity to recruit high-performing referrals. This result is consistent with the idea that only individu-als who perform well on the test can effectively screen network members, and we provide evidence that low-ability participants cannot predict the performance of their referrals.4 We also document that some of our study participants are aware of these informational advantages: high-ability participants are more likely to make a referral if they receive performance pay than low-ability participants, suggesting that the expected return to performance pay is larger for high-ability participants. Finally, while young, well-educated, and high–cognitive ability referrals perform best at the task, these observable characteristics cannot explain this productivity premium. This suggests that the information being harnessed by these high-ability types is difficult for the econometrician to observe, and may be difficult for prospec-tive employers as well.
The paper is organized as follows. The next section describes the context and experimental design, and Section II provides a theoretical framework to interpret the impact of the exogenous change in the referral bonus scheme. Section III presents the results: OPs’ decision to make a referral; the relationship between the OP and the referral; referral performance on the cognitive task; and how OPs anticipated their referrals to perform. Whether observable characteristics can explain perfor-mance is analyzed in Section IV, and Section V concludes.
I. Context and Experimental Design
The setup of the experiment is that an initial pool of subjects is asked to refer members of their social networks to participate in the experiment in subsequent rounds. The idea is that paid laboratory participants are fundamentally day labor. If we draw from a random sample of laborers, and allow these laborers to refer others into the study, we can learn about how networks identify individuals for casual labor jobs by monitoring the characteristics of the referrals, the relationships between the original participants and their referrals, and the performance of the referrals at the “job.” By varying the types of financial incentives provided to our short-term employees, we observe aspects of the decision making that occur within networks, and the trade-offs network members face when making referrals. The recruitment process into the laboratory therefore allows us to observe behavior that occurs out-side of the laboratory.
Our study takes place in urban Kolkata, India. Many of our subjects work in infor-mal and casual labor markets, where employment is often temporary and uncertain; these conditions are closely approximated by the day-labor nature of the task in our laboratory. Several characteristics of our experiment contribute to the exter-nal validity of results. First, our applicant pool are labor force participants from
4 Low-ability participants may also have a lower network quality, an alternative hypothesis we cannot rule out, as we discuss in Section II.

3577BEAmAn AnD mAgRuDER: WHO gEts tHE jOB REfERRAL?VOL. 102 nO. 7
several neighborhoods in Kolkata. Ninety-one percent of our sample are currently employed, 45 percent of whom have successfully made referrals at their current job. Our sample therefore constitutes individuals who are actively involved in network hires and reflects a diverse pool of workers, with heterogenous educational levels, ages, and labor market experiences including occupation. This kind of heterogeneity would not have been possible if we worked with one firm.
Second, participants receive Rs 135 ($3.00) payment in the first round of the study, which is higher than the median daily income for the population in this study (Rs 110). Our jobs therefore feature real-world stakes, which provide strong incen-tives for participants to take the task seriously. The task itself is an assessment of cognitive ability and described in more detail below. The laboratory reproduced key features of a real-world workplace: subjects were asked to complete the task and were closely supervised by a research assistant who provided instructions, allowed time for independent work, and evaluated performance in real time. Thus, while the experiment cannot mimic employee referrals for permanent, salaried positions, it does generate real-world stakes among workers in an employment environment, and offers what could be viewed as one additional temporary employment opportunity among many in a fluid labor market. Moreover, and important for our interpreta-tions, we have full control over the various static and dynamic incentives provided by the employer.
Finally, providing cash bonuses to existing employees for referrals is an estab-lished practice in many firms, including some firms that index these bonuses to referral performance (Lublin 2010, Castilla 2005). In many employment settings, however, there are nonmonetary incentives to induce good referrals: either positive (the ability to make additional referrals) or negative (the employee’s reputation is tarnished if he makes a bad referral). Our experiment with a one-time job opportu-nity does not replicate this feature of the labor market. The advantage of the experi-mental design is that we can disentangle employees’ ability to identify inherently good workers from other on-the-job dynamics, such as monitoring or competition, and we can think of the financial incentives as serving as a proxy for the incentives generated by the long-term relationship between the firm and the employee. We note that while other employers’ nonmonetary incentives are likely larger than the finan-cial incentives we provide, so are the social incentives to procure a long-term job for a friend. Thus, in a relative sense, we expect our incentive treatments to generate comparable trade-offs to those employees in many other contexts face. Given the strong evidence from the employer learning literature and elsewhere5 that the full package of referral incentives that employers provide are insufficient to solve the problem of asymmetric information (Altonji and Pierret 2001; Simon and Warner 1992), we expect that the trade-offs we measure are characteristic of an important problem in many labor markets.
The following describes the two main parts to the experiment: the initial recruit-ment and the return of the original participants with the referrals.
5 For example, Bandiera, Barankay, and Rasul (2009) show that a similar incentive problem existed in a UK fruit farm until the researchers proposed a financial incentive scheme for managers.

3578 tHE AmERICAn ECOnOmIC REVIEW DECEmBER 2012
A. Initial Recruitment
We draw a random sample of households through door-to-door solicitation in a peri-urban residential area of Kolkata, India. Sampled households are offered a fixed wage if they send an adult male household member to the study site, which is located nearby. Sampling and initial invitations were extended continuously from February through June 2009, during which time we successfully enrolled 561 OPs in the cognitive treatment. Of those visited during door-to-door recruitment, 37 percent of households sent an eligible man to the laboratory.6 Participants are assigned an appointment time, requested to be available for two hours of work, and are provided with a single coupon to ensure that only one male per household attends. Upon arrival at the study site, individuals complete a survey that includes questions on demographics, labor force participation, social networks, and two mea-sures of cognitive ability: the digit span test and raven’s matrices. This initial group (original participants or OPs) faces an experimental treatment randomized along several dimensions. OPs are asked to complete one (randomly chosen) task: one task emphasizes cognitive ability while a second task emphasizes pure effort. The majority of our sample (including all high-stakes treatment groups) was assigned to the cognitive task, which we focus on in this paper.7
In the cognitive task, participants are asked to design a set of four different “quilts” by arranging a group of colored swatches according to a set of logical rules.8 The puzzles were designed to be progressively more challenging. A super-visor explains the rules to each participant, who is given a maximum time limit to complete each puzzle. When the participant believes he has solved a puzzle, he signals the supervisor, who either lets the participant continue to the next puzzle if the solution is correct, or points out the error and tells the participant to try again, allowing up to three incorrect attempts per puzzle. More detail on the task is given in the online Appendix.
The measure of performance we use takes into account three aspects of perfor-mance: the time spent on each puzzle, whether the participant ultimately solved the puzzle, and the number of incorrect attempts. Incorrect attempts are important as proxies for how much supervisory time an employee requires in order to suc-cessfully complete a task. To utilize variation from all three components of perfor-mance, we use the following metric: A perfect score for a given puzzle is assigned for solving the puzzle in under one minute with no incorrect attempts. Incorrect attempts and more time spent lower the score, and a participant receives a zero if
6 This participation rate compares well to other comparable studies, such as Karlan and Zinman (2009), who had 8.7 percent of individuals solicited participate in their experiment, and Ashraf (2009), who had a 57 percent take-up rate into a laboratory experiment among a sample of previous participants from a field experiment targeted to microfinance clients.
7 In the effort task, participants are asked to create small bags of peanuts for 30 minutes. Due to limited resources, one-third of our sample was assigned to the effort treatment, and they received either the low-stakes performance pay or low-stakes fixed fee treatments described below. We did not find mean differences in performance for the referrals of OPs who completed the effort task. This may, however, be because the sample is much smaller and does not include the high-stakes treatments for OPs.
8 In one puzzle, for example, the participant must fill in a 4-by-4 pattern with 16 different color swatches—4 swatches of 4 colors—and ensure that each row and column has only one of each color. These puzzles are presented in greater detail in the online Appendix. The left side represents unmovable squares in each puzzle and the right panel shows one possible solution.

3579BEAmAn AnD mAgRuDER: WHO gEts tHE jOB REfERRAL?VOL. 102 nO. 7
the puzzle is not completed within the allotted time. The score of the four puzzles is then averaged and standardized using the mean and standard deviation of the entire OP sample. We note that the main results are robust to sensible alternate measures of performance (for example, the number of puzzles solved correctly).
At the end of the experiment, individuals are paid Rs 135 for their participa-tion. They are also offered payment to return with a male friend or family member (a referral) between the ages of 18 and 60. All OPs are specifically asked to return with a referral “who would be good at the task you just completed.” A second ran-domization occurs to determine the amount of payment the OP will receive when he returns with a referral. Payment varies along two dimensions: the amount of pay and whether pay may depend on the referral’s performance. Participants are ensured that their payment will be at least a minimal threshold and given the specific terms of the payment arrangement. OPs are informed of the offer payment immediately prior to their exit from the laboratory.
Among the OPs randomized into the cognitive task, there are five treatment groups:
Contract Fixed component Performance component n of OPs
Low-stakes performance pay 60 0–20 116High-stakes performance pay 60 0–50 136Very low fixed pay 60 0 71Low fixed pay 80 0 117High fixed pay 110 0 122
There are two performance pay levels: the high-stakes treatment varies between Rs 60 and 110 total pay while the low-performance pay is Rs 60–80. As fixed find-er’s fees, OPs are randomly offered either Rs 60, 80, or 110. In all cases, the exact contract, including the requisite number of correct puzzles needed for a given pay grade, is detailed in the offer. All participants are asked to make an appointment to return with a referral in a designated three-day window. In what follows, we denote the initial participation (where we recruit OPs into the laboratory) as round one, and the return of the OPs with referrals as round two.
Table 1 shows that the randomization created balance on observed characteris-tics of OPs from the baseline survey and round one performance. One exception is that OPs in the high-powered incentives treatment group performed worse on the cognitive task compared to OPs in other treatments.9 The average OP in the sample is approximately 30 years old, and 34 percent of the initial subjects are between 18 and 25. Seventy-eight percent of OPs are the primary income earner in their household, while 32 percent are household heads. Almost all of the participants in the study are literate.
9 As randomization was done on a rolling basis, it was not possible to use stratification. Note, however, that the correlation between OP performance and referral performance is only 0.15. Therefore, even a relatively large imbal-ance, such as 0.18 of a standard deviation, is unlikely to significantly alter the results.

3580 tHE AmERICAn ECOnOmIC REVIEW DECEmBER 2012
B. Return of OPs with Referrals
When the original participants return with their referrals, the referrals fill out the survey and perform both the effort and the cognitive ability tasks.10 A key feature of this study is that both OPs and referrals have no private incentive to perform well on either task. There may, however, be unobserved side payments indexed to referral performance (and creating a private incentive for referrals). The OP, for example, may give part of his finder’s fee to the referral to entice a highly
10 In order to minimize the potential for OPs to cheat by telling their referrals the solutions to the puzzles, we developed two sets of puzzles that are very similar, and we randomized which set was used in each laboratory ses-sion. The type of puzzle the OP was given is included as a control in all specifications.
Table 1—Randomization Check: Original Participant Characteristics
Highfixed
Low fixed
Highperf.
Lowperf. Constant n
p-value of joint test
(1) (2) (3) (4) (5) (6) (7)
Age of OP −1.508 −1.684 −1.110 −0.400 31.000 561 0.70(1.416) (1.427) (1.389) (1.431) (1.125)
OP is literate 0.031 0.044 0.032 0.034 0.887 561 0.88(0.041) (0.041) (0.040) (0.042) (0.033)
OP had 5 or fewer years of schooling 0.034 0.016 0.029 0.036 0.155 561 0.97(0.058) (0.058) (0.056) (0.058) (0.046)
OP had 5–10 years schooling 0.001 0.031 −0.051 −0.064 0.507 561 0.57(0.075) (0.075) (0.073) (0.076) (0.059)
OP was married −0.076 −0.082 −0.006 −0.083 0.535 561 0.55(0.075) (0.075) (0.073) (0.076) (0.059)
OP was employed −0.073 −0.052 −0.068 −0.071 0.958 561 0.50(0.045) (0.045) (0.044) (0.045) (0.036)
Ln of income earned by OP −0.644 −0.507 −0.388 −0.499 7.365 561 0.52(0.372) (0.375) (0.365) (0.377) (0.296)
OP is HH head −0.043 −0.022 −0.059 −0.068 0.338 561 0.85(0.068) (0.069) (0.067) (0.069) (0.054)
OP is primary income earner in HH −0.084 −0.062 −0.046 −0.084 0.789 561 0.71(0.067) (0.067) (0.065) (0.067) (0.053)
OP is 17–25 years old 0.066 −0.019 −0.014 0.030 0.352 561 0.63(0.072) (0.073) (0.071) (0.073) (0.057)
Number of Ravens correct −0.045 −0.165 −0.153 −0.228 2.028 561 0.44(0.143) (0.144) (0.140) (0.144) (0.113)
Number of Digits correct 0.751 0.237 −0.096 0.169 11.831 561 0.37(0.519) (0.523) (0.509) (0.524) (0.412)
Puzzle type −0.022 −0.037 0.012 −0.024 0.268 561 0.91(0.065) (0.066) (0.064) (0.066) (0.052)
Normalized test score on all puzzles 0.141 0.119 −0.180 0.008 −0.009 561 0.08(0.148) (0.149) (0.145) (0.150) (0.118)
Puzzle test scores of nonattriting OPs 0.168 0.163 0.021 0.024 −0.039 406 0.68(0.169) (0.172) (0.167) (0.173) (0.134)
notes: OPs are the respondents who were recruited door-to-door. This table presents mean characteristics for OPs only and excludes (endogenously selected) referrals. Each row is the regression results of the characteristics in the title column on the treatments. The regressions include the cognitive treatment sample and the omitted group is the very low fixed treatment in all rows. Column 7 shows the p-value for the joint test of significance of all the treat-ment dummies. Standard errors are in parentheses.

3581BEAmAn AnD mAgRuDER: WHO gEts tHE jOB REfERRAL?VOL. 102 nO. 7
qualified network member to participate. To eliminate the incentive for such a side payment, both the OP and referral are informed that the OP will be paid the maximum performance bonus regardless of the referral’s performance before the referral performs either task.11 While referrals perform the tasks and complete the survey, OPs fill out a short interim survey about the process they went through in recruiting referrals.
II. Theoretical Framework
We present a stylized model, similar in spirit to Bandiera, Barankay, and Rasul (2009), to illustrate the potential trade-offs an individual faces when asked to make a referral by his employer. By incorporating financial incentives provided by the firm and heterogeneity in imperfect information on the part of the network member, it also highlights how incentives can affect the choice of the referral and what we can identify in the experiment.
Employee i has the opportunity to make a job referral. In making a referral, i would choose from an ambient network of friends, each of whom has an inherent ability at the job, θ j ∈ { θ H , θ L }. In return for making a referral, his employer offers him a contract consisting of a fixed fee ( f i ) and a performance incentive ( P i ), where he will receive P i if he correctly selects a high-ability friend. He observes a sig-nal of each friend’s ability, θ j ∈ { θ H , θ L }. For simplicity, that signal is accurate with probability β i , that is, P(θ = θ H | θ = θ H , i) = P(θ = θ L | θ = θ L , i) = β i . Naturally, β i ∈ [0.5, 1], and it may be heterogeneous among employees.
Employee i ’s expected monetary payoffs from referring a particular friend are a function of his contract type ( f i , P i ), his signal of the selected friend’s ability ( θ j ), and the accuracy of that signal. Following Bandiera, Barankay, and Rasul (2009) and Prendergast and Topel (1996), i also receives a payment σ ij from referring friend j. This payment can be interpreted as an actual cash transfer or as a weighted inclu-sion of j ’s income in i ’s utility.12 Since there are two ability “types” of friends, it is without loss of generality to focus on the decision between friend 1, for whom σ i1 ∈ arg max ( σ ij | θ j = θ H ) and friend 2, for whom σ i2 ∈ arg max ( σ ij | θ j = θ j L ). Finally, i also has the option of declining to make a referral. Suppose the effort of making a referral will cost him c i . 13
If i selects friend 1, then he will receive in expectation f i + β i P i + σ i1 − c i . While if i selects friend 2, he will receive in expectation f i + (1 − β i ) P i + σ i2 − c i .
Comparing these two expressions, i will select friend 1 if
(1) P i > σ i 2 − σ i1 _ 2 β i − 1
.
11 This experimental design is similar in spirit to Karlan and Zinman (2009) and Cohen and Dupas (2010).12 Symmetrically, we could think of this as a reduction in future transfers i would otherwise have to make to this
friend due to other risk-sharing or network-based agreements.13 It is possible that different referrals require different exertions of effort; for example, it may require more effort
to recruit a high-ability referral who has better alternate options. Such additional effort is included in the payment term σ ij .
3582 tHE AmERICAn ECOnOmIC REVIEW DECEmBER 2012
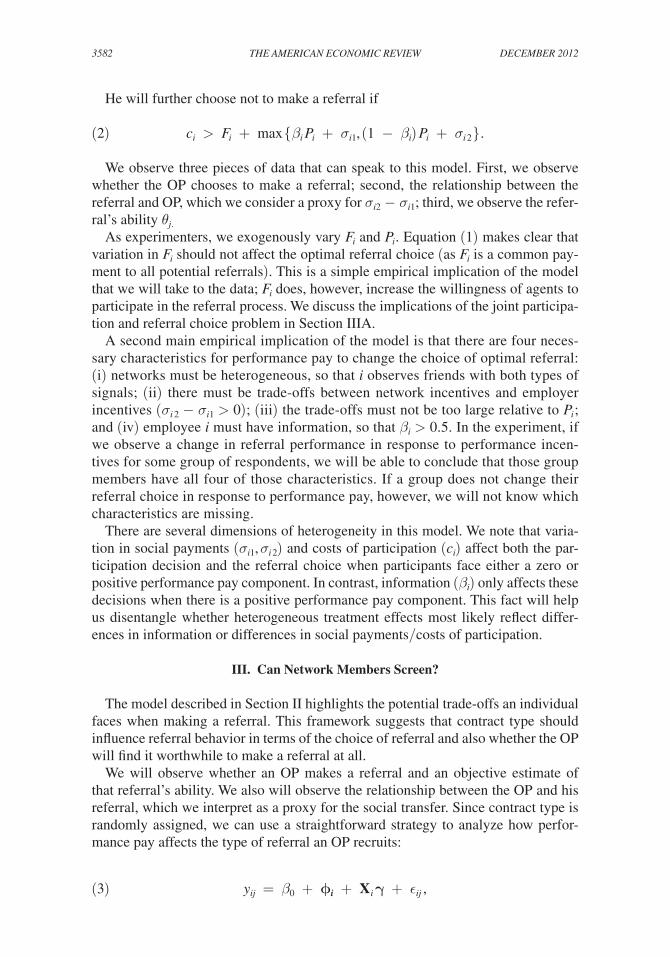
He will further choose not to make a referral if
(2) c i > f i + max { β i P i + σ i1 , (1 − β i ) P i + σ i 2 } .
We observe three pieces of data that can speak to this model. First, we observe whether the OP chooses to make a referral; second, the relationship between the referral and OP, which we consider a proxy for σ i2 − σ i1 ; third, we observe the refer-ral’s ability θ j.
As experimenters, we exogenously vary f i and P i . Equation (1) makes clear that variation in f i should not affect the optimal referral choice (as f i is a common pay-ment to all potential referrals). This is a simple empirical implication of the model that we will take to the data; f i does, however, increase the willingness of agents to participate in the referral process. We discuss the implications of the joint participa-tion and referral choice problem in Section IIIA.
A second main empirical implication of the model is that there are four neces-sary characteristics for performance pay to change the choice of optimal referral: (i) networks must be heterogeneous, so that i observes friends with both types of signals; (ii) there must be trade-offs between network incentives and employer incentives ( σ i 2 − σ i1 > 0); (iii) the trade-offs must not be too large relative to P i ; and (iv) employee i must have information, so that β i > 0.5. In the experiment, if we observe a change in referral performance in response to performance incen-tives for some group of respondents, we will be able to conclude that those group members have all four of those characteristics. If a group does not change their referral choice in response to performance pay, however, we will not know which characteristics are missing.
There are several dimensions of heterogeneity in this model. We note that varia-tion in social payments ( σ i1 , σ i 2 ) and costs of participation ( c i ) affect both the par-ticipation decision and the referral choice when participants face either a zero or positive performance pay component. In contrast, information ( β i ) only affects these decisions when there is a positive performance pay component. This fact will help us disentangle whether heterogeneous treatment effects most likely reflect differ-ences in information or differences in social payments/costs of participation.
III. Can Network Members Screen?
The model described in Section II highlights the potential trade-offs an individual faces when making a referral. This framework suggests that contract type should influence referral behavior in terms of the choice of referral and also whether the OP will find it worthwhile to make a referral at all.
We will observe whether an OP makes a referral and an objective estimate of that referral’s ability. We also will observe the relationship between the OP and his referral, which we interpret as a proxy for the social transfer. Since contract type is randomly assigned, we can use a straightforward strategy to analyze how perfor-mance pay affects the type of referral an OP recruits:
(3) y ij = β 0 + ϕ i + X i γ + ϵ ij ,
3583BEAmAn AnD mAgRuDER: WHO gEts tHE jOB REfERRAL?VOL. 102 nO. 7
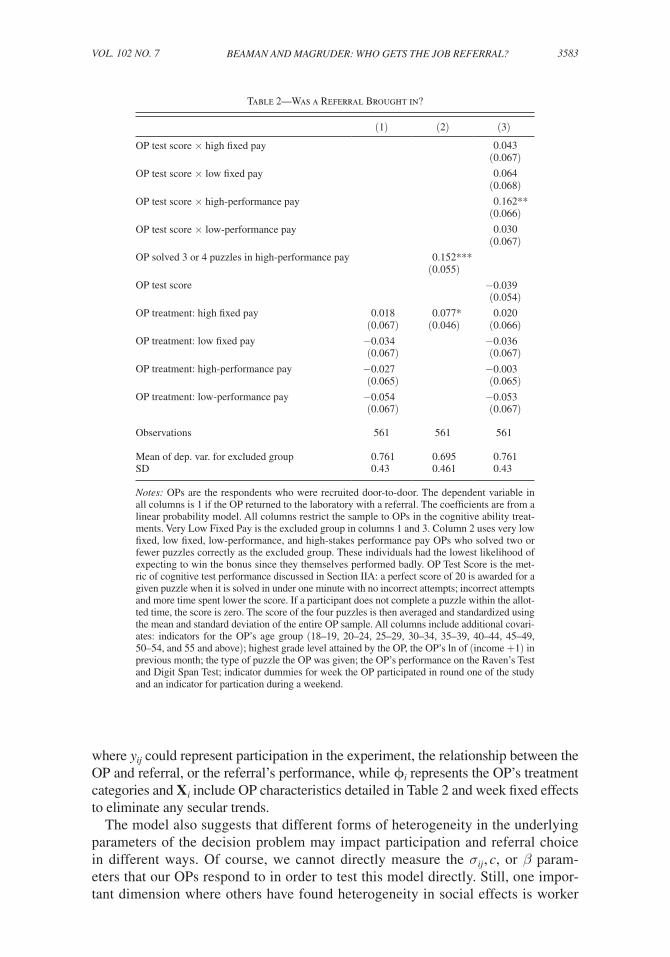
where y ij could represent participation in the experiment, the relationship between the OP and referral, or the referral’s performance, while ϕ i represents the OP’s treatment categories and X i include OP characteristics detailed in Table 2 and week fixed effects to eliminate any secular trends.
The model also suggests that different forms of heterogeneity in the underlying parameters of the decision problem may impact participation and referral choice in different ways. Of course, we cannot directly measure the σ ij , c, or β param-eters that our OPs respond to in order to test this model directly. Still, one impor-tant dimension where others have found heterogeneity in social effects is worker
Table 2—Was a Referral Brought in?
(1) (2) (3)
OP test score × high fixed pay 0.043 (0.067)OP test score × low fixed pay 0.064 (0.068)OP test score × high-performance pay 0.162**
(0.066)OP test score × low-performance pay 0.030
(0.067)OP solved 3 or 4 puzzles in high-performance pay 0.152***
(0.055)
OP test score −0.039 (0.054)OP treatment: high fixed pay 0.018 0.077* 0.020 (0.067) (0.046) (0.066)OP treatment: low fixed pay −0.034 −0.036
(0.067) (0.067)OP treatment: high-performance pay −0.027 −0.003 (0.065) (0.065)OP treatment: low-performance pay −0.054 −0.053 (0.067) (0.067)
Observations 561 561 561
Mean of dep. var. for excluded group 0.761 0.695 0.761SD 0.43 0.461 0.43
notes: OPs are the respondents who were recruited door-to-door. The dependent variable in all columns is 1 if the OP returned to the laboratory with a referral. The coefficients are from a linear probability model. All columns restrict the sample to OPs in the cognitive ability treat-ments. Very Low Fixed Pay is the excluded group in columns 1 and 3. Column 2 uses very low fixed, low fixed, low-performance, and high-stakes performance pay OPs who solved two or fewer puzzles correctly as the excluded group. These individuals had the lowest likelihood of expecting to win the bonus since they themselves performed badly. OP Test Score is the met-ric of cognitive test performance discussed in Section IIA: a perfect score of 20 is awarded for a given puzzle when it is solved in under one minute with no incorrect attempts; incorrect attempts and more time spent lower the score. If a participant does not complete a puzzle within the allot-ted time, the score is zero. The score of the four puzzles is then averaged and standardized using the mean and standard deviation of the entire OP sample. All columns include additional covari-ates: indicators for the OP’s age group (18–19, 20–24, 25–29, 30–34, 35–39, 40–44, 45–49, 50–54, and 55 and above); highest grade level attained by the OP, the OP’s ln of (income +1) in previous month; the type of puzzle the OP was given; the OP’s performance on the Raven’s Test and Digit Span Test; indicator dummies for week the OP participated in round one of the study and an indicator for partication during a weekend.

3584 tHE AmERICAn ECOnOmIC REVIEW DECEmBER 2012
ability,14 which accords with theoretical assumptions in Montgomery (1991). If high-ability workers receive a more accurate signal of their network members’ ability, i.e., β is larger, then they will recruit higher ability referrals when given a performance pay incentive and also be more likely to participate when offered performance pay. Therefore, we also investigate whether OP ability is an important dimension of heterogeneity.
In this spirit, and derived from the theory above, we also estimate
(4) y ij = δ 0 + δ 1 θ i + ∑ k∈low, high
δ 2k per f ik × θ i + ϕ i + X i γ + ϵ ij ,
where θ i is OP i ’s ability, as captured by the OP’s normalized test score (described in Section IA) on the cognitive task; per f ik × θ i is the interaction of an indicator for whether the OP was in a performance pay treatment with stakes k and the OP’s test score; ϕ i and X i are defined as before. Since ability may be related to any of the underlying parameters, we rely on supplemental data and theoretical restrictions across the referral choice and participation equations to indicate which dimensions of underlying OP heterogeneity create the referral patterns that we observe.
A. Returning with a Referral
As was made explicit in the theoretical framework, OPs face extensive and inten-sive margin choices. On the extensive margin, they choose whether or not to return with a referral. Seventy-two percent of our OPs returned with a referral, so that 407 referrals participated in round 2. We believe that this high participation rate reflects the value of the jobs we provided.
The model shows that an increase in the fixed component of the finder’s fee should induce more OPs to return with a referral. Increases in the performance pay compo-nent will affect the participation decision depending on the information signal the OP has about their potential referrals. In Table 2 we look at the impact of the fixed component using two different strategies. Column 1 shows the simplest specifica-tion, equation (3). We do not observe any differences in the high fixed or low fixed treatment categories compared to the excluded group, the very low fixed treatment. As shown in Section IA, however, there are very few observations in the very low fixed pay group.15 In order to increase power to test for whether OPs who expected to receive Rs 110 returned to the laboratory more frequently than OPs that expected to receive only Rs 60–80, column 2 expands the control group and presents an alter-native specification that looks at differential behavior only among individuals who seem likely to have expected Rs 110: those in the high fixed wage treatment, and those in the high-performance pay treatment who did well on the task themselves. The performance pay offer detailed that only the OPs who returned with a referral who got 3 or more puzzles correct would be guaranteed at least Rs 100, so that if OPs measured expectations by their own performance, those who solved two or
14 See, for example, Bandiera, Barankay, and Rasul (2010); Fafchamps and Moradi (2009); Yakubovich and Lup (2006); and Mas and Moretti (2009).
15 The very low fixed group was by design smaller than the other groups due to budget constraints.

3585BEAmAn AnD mAgRuDER: WHO gEts tHE jOB REfERRAL?VOL. 102 nO. 7
fewer puzzles correctly may have anticipated a low return.16 Column 2 shows that in this specification, the high fixed treatment group is about 8 percentage points more likely to participate in round two, and this effect is statistically indistinguishable from the return rate among the high-performing high-stakes group, who may have had similar expectations.
In the model, heterogeneity in information levels, β i , only affects participation through changing the expected return to performance pay. Thus, if OP ability is a proxy for information, we should see more able OPs participate at different rates in response to changes in performance incentives, but not to changes in fixed pay-ments. Column 2 showed that high-ability OPs in the high-stakes performance pay treatment had a higher participation rate in round two. OP ability may be correlated with other underlying modeling parameters as well, however, such as the incentives provided by the network. If OP ability were correlated with heterogeneity in c i (the costs of making a referral) or in σ i1 and σ i 2 (the incentives provided by the network), it would be associated with differential participation in response to both the perfor-mance payment level and the level of the fixed payments. We therefore estimate equation (4) to test whether the heterogenous response by ability also occurs in the fixed treatments.
Column 3 shows that the high-stakes performance pay sharply increases the par-ticipation rate among high-ability OPs, but there is no heterogeneous effect among the other treatment groups. The result in column 3 is consistent with high-ability OPs differing from low-ability OPs in their level of information but not in their costs of participation or the network incentives. In a more general model with multiple ability types, however, OP ability may also be correlated with network quality: that is, the probability of having a high-ability individual in his network. This would also generate a higher expected return to performance pay and be consistent with the result in column 3.17 We will provide more direct evidence on the role of informa-tion in Section IIIE.
While the participation decision yielded our first test for the presence of network information, differential participation rates between rounds one and two in the study could also bias the estimation of the referral choice equation. In fact, both theory and our empirical work suggested that participation in round two is related to key parameters of interest and treatment type. Simulations of the model (not presented here) suggest that even in the simplest case, where social incentives, information, and participation costs are all independently distributed, the direction of the bias in estimating the interaction of β with performance pay on the subsample of round two participants cannot be signed.
Therefore, we use two main strategies to estimate the impact of contract change on referral choice. In our preferred specification, we employ a Heckman two-step selec-tion model with a first-stage probit and second-stage estimation including the inverse
16 The offer stated 4 puzzles would earn the OP Rs 110, 3 puzzles Rs 100, 2 puzzles Rs 85, and 2 or fewer puzzles would generate Rs 60. Therefore, we are assuming that the OP’s own performance is correlated with the signal they receive about their network members or the quality of their network.
17 The data is suggestive, however, that many low-ability individuals are likely to know high-ability workers. In the fixed treatments, in which there is the least incentive to recruit high-ability workers, we see that OPs in the bottom quartile of the performance distribution are as likely to bring in a referral who performs in the top quartile as the second quartile. While imperfect, this is suggestive that network quality alone may not be the binding constraint for low-ability OPs.

3586 tHE AmERICAn ECOnOmIC REVIEW DECEmBER 2012
mills ratio from the first stage (Heckman 1976). Rainfall makes a natural exclusion restriction, as it is random and affects the desirability of traveling to our laboratory,18 while not being correlated with performance in our (indoor) laboratory.19 The weather data we have available includes an indicator for whether there was nonzero rainfall on each day of the study as well as the mean and maximum temperature on each day. As the exact day that an OP and his referral would have participated is unknown among the attrited population, we use the number of days that it rained in each OP’s allotted three-day window to return with a referral. Section IIIC discusses the strength of the relationship between rainfall and participation.
A second approach is to combine the participation and referral choice decisions into one outcome of interest. For example, the task was to solve puzzles correctly, and OPs who did not return with referrals successfully solved zero puzzles in the second round. We therefore include zeros for their performance (and then normalize accordingly) and analyze performance using ordinary least squares (OLS) on the full sample. The advantage of this strategy is that we can fully utilize the exogenous, random variation.
B. Responsiveness to fixed fees
The model predicted that variation in the level of fixed fees should not affect the choice of referral, at least once differential participation rates are properly accounted for. We have several characteristics that could be used to estimate the choice of refer-ral, and those can be broadly categorized as characteristics based on relationships (a proxy for σ ij ), or characteristics related to productivity (a proxy for θ j ). Table 3 asks whether any of these characteristics are related to the level of payment among the fixed fee subsample.
In Table 3, the dependent variable is indicated in the column heading. All esti-mates are consistent with the theoretical prediction. First, columns 1 and 2 show that rainfall during the OP’s window for recruitment significantly lowers the probability that the OP completes the study, and the joint test of both rainfall variables is above eight. The main results are in columns 3 through 7. Odd columns show estimates of the level effects of the different fixed fee payments, while even columns also include the interaction terms with OP performance. Across all specifications, the joint p-values of the overall effects of fixed fee and interaction terms are never close to significant. While not shown for brevity, all results are similar using OLS with the full sample. Since the data are consistent with the theoretical prediction that varia-tion in fixed fees does not alter the referral choice problem, we combine all fixed fee treatments into a single control group in subsequent specifications and test the performance pay treatments against the fixed fee treatments jointly.
18 As there may be selectivity into the first round of the study, we also include an indicator for whether there was rainfall on the day the OP participates in round one. We find that OPs who join the study on rainy days are less likely to attrit in the subsequent round, consistent with the hypothesis that OPs who attend despite the presence of rain are more committed to returning with a referral.
19 Estimates are robust to allowing temperature, which is correlated with rainfall, to have a direct effect on performance, as shown in online Appendix Table 2. The daily rainfall and temperature data were downloaded from Weather Underground (http://www.wunderground.com).

3587BEAmAn AnD mAgRuDER: WHO gEts tHE jOB REfERRAL?VOL. 102 nO. 7
C. Relationship between Referrals and OPs
The referral choice, equation (1), suggested that one important dimension that should change with performance pay is the selection of referrals in terms of the net-work payoff σ ij . In particular, if OPs respond to performance pay by changing their choice of referral, they should be shifting away from referrals who grant them larger social transfers in favor of those who generate a smaller transfer. Of course, we can-not directly estimate σ ij ; here, we focus on two salient relationships: coworkers and relatives. We anticipate that for both insurance and altruistic reasons, relatives are likely to donate larger social transfers than coworkers. The idea that relatives engage in more altruistic or risk-sharing arrangements than coworkers is supported by our survey data: over 35 percent of reported gifts occurred between relatives, while only 2 percent were between coworkers. High-value (at least Rs 500) gifts and loans demonstrate a similar pattern.
Table 3—Fixed Fee Treatments: Referral Choice
Relationship to OP Referral test score First stage Coworker Relative
(1) (2) (3) (4) (5) (6) (7)
Number of days with rainfall −0.166** −0.170** during OP’s referral cycle (0.085) (0.086)
Rainfall on OP arrival day 0.200*** 0.202*** (0.064) (0.063)OP test score × high fixed 0.068 −0.049 −0.021 −0.304 pay (0.081) (0.064) (0.064) (0.200)OP test score × low fixed 0.070 −0.079 −0.085 −0.139 pay (0.076) (0.066) (0.065) (0.202)OP test score −0.048 0.022 0.039 0.196 (0.064) (0.055) (0.054) (0.168)OP treatment: high fixed pay −0.003 −0.008 0.010 0.013 −0.024 −0.031 0.072 (0.080) (0.081) (0.057) (0.057) (0.056) (0.056) (0.179)OP treatment: low fixed pay −0.046 −0.049 0.055 0.061 0.009 0.013 0.192
(0.079) (0.079) (0.059) (0.059) (0.058) (0.057) (0.183)
Observations 310 310 310 310 310 310 310p-value from joint test of 0.801 0.880 0.912 0.932 0.865 treatment and treatment interactionsMean of dep. var. for excluded group
0.761 0.130 0.148 −0.068
SD 0.430 0.339 0.359 1.166Chi2 statistic: joint test of rainfall variables
8.118 8.289 8.118 8.289 8.118 8.289 8.289
Mills: coefficient −0.199 −0.189 0.115 0.098 0.864Mills: SE 0.166 0.165 0.164 0.164 0.507n censored observations 81 81 81 81 81
notes: OPs are the respondents who were recruited door-to-door. The excluded treatment category is the very low fixed treatment. All columns include additional covariates as described in Table 2, and OP Test Score is as defined in Table 2. An OP’s “Referral Cycle” is the three days the OP had to choose from to bring in his referral. The exclusion restriction uses the number of days, from 0 to 3, where there was nonzero rainfall among the potential referral days for each OP. Columns 1 and 2 show probit marginal effects. Relative and coworker are dummy variables indicating the relationship between the OP and the referral. Columns 3–7 are Heckman two-step estimates with the rainfall vari-ables from columns 1 and 2 used as exclusion restrictions. The first stage is shown in columns 1 and 2 with the f-test of joint significance of the two rainfall variables.

3588 tHE AmERICAn ECOnOmIC REVIEW DECEmBER 2012
Table 4 shows the relationship between OPs and their referrals as a function of treatment type. Columns 1 and 2 demonstrate that rainfall during the OP’s window for recruitment significantly affects the participation rate within the full cognitive sample. One extra day of rainfall within the three-day referral cycle makes an OP 21 percentage points less likely to return with a referral to the laboratory. Moreover, the instruments jointly have power: the chi squared statistic is over 12 in both speci-fications. In subsequent tables, only the chi squared statistic from the joint test of significance of the two rainfall variables is shown.
Columns 3 through 6 examine coworkers and relatives, and report estimates from the Heckman specification. Individuals assigned to the cognitive high-stakes per-formance pay treatment were almost 8 percentage points more likely to refer a coworker. This is a large effect since only 12 percent of OPs in the control group returned with a coworker as their referral. There is limited evidence again of het-erogeneity: column 4 shows little evidence of heterogeneity in the response to per-formance pay.
Columns 5 and 6 show that the high-stakes group was also less likely to refer a relative than the fixed fee groups. The result represents an economically significant
Table 4—Relationship between OP and Referral
First stage Coworker Relative
(1) (2) (3) (4) (5) (6)
Number of days with rainfall during −0.207*** −0.207*** OP’s referral cycle (0.065) (0.066)
Rainfall on OP arrival day 0.129** 0.135** (0.059) (0.058)
OP test score × high-performance pay 0.146*** 0.007 0.023 (0.053) (0.049) (0.049)
OP test score × low-performance pay −0.015 0.055 −0.007 (0.052) (0.042) (0.042)
OP test score 0.009 −0.021 −0.002 (0.029) (0.024) (0.024)
OP treatment: high-performance pay −0.022 0.027 0.079** 0.076* −0.069* −0.072*(0.050) (0.051) (0.039) (0.039) (0.040) (0.040)
OP treatment: low-performance pay −0.048 −0.048 0.010 0.013 0.072 0.069(0.055) (0.054) (0.043) (0.044) (0.045) (0.044)
Observations 561 561 561 561 561 561Mean of dep. var. for excluded group 0.761 0.130 0.148SD 0.430 0.339 0.359Chi2 statistic: joint test of rainfall variables
12.684 13.012 12.684 13.012 12.684 13.012
Mills: coefficient −0.089 −0.159 −0.073 −0.008Mills: SE 0.145 0.134 0.150 0.137n censored observations 155 155 155 155
notes: OPs are the respondents who were recruited door-to-door. The excluded category is the fixed fee treatments. An OP’s “Referral Cycle” is the three days the OP had to choose from to bring in his referral. The exclusion restric-tion uses the number of days, from 0 to 3, where there was nonzero rainfall among the potential referral days for each OP. Columns 1 and 2 show probit marginal effects. Coworker (columns 3–4) and Relative (columns 5–6) are dummy variables indicating the relationship between the OP and the referral. These columns show Heckman two-step estimates with the rainfall variables from columns 1 and 2 used as exclusion restrictions. The first stage is shown in columns 1 and 2 with the f-test of joint significance of the two rainfall variables. All columns include additional covariates as described in Table 2, and OP test score is as defined in Table 2.
3589BEAmAn AnD mAgRuDER: WHO gEts tHE jOB REfERRAL?VOL. 102 nO. 7
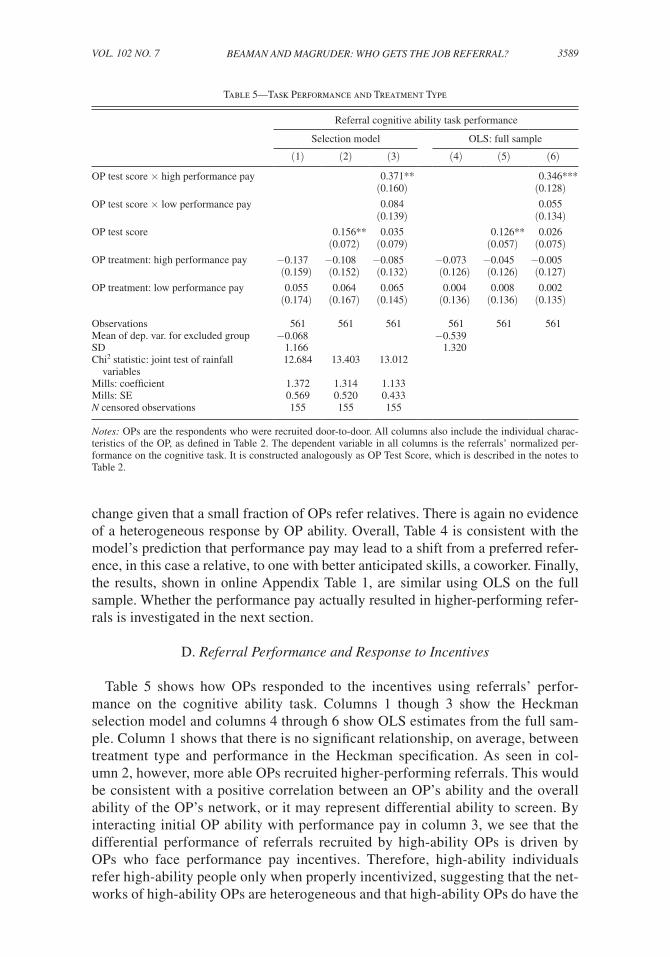
change given that a small fraction of OPs refer relatives. There is again no evidence of a heterogeneous response by OP ability. Overall, Table 4 is consistent with the model’s prediction that performance pay may lead to a shift from a preferred refer-ence, in this case a relative, to one with better anticipated skills, a coworker. Finally, the results, shown in online Appendix Table 1, are similar using OLS on the full sample. Whether the performance pay actually resulted in higher-performing refer-rals is investigated in the next section.
D. Referral Performance and Response to Incentives
Table 5 shows how OPs responded to the incentives using referrals’ perfor-mance on the cognitive ability task. Columns 1 though 3 show the Heckman selection model and columns 4 through 6 show OLS estimates from the full sam-ple. Column 1 shows that there is no significant relationship, on average, between treatment type and performance in the Heckman specification. As seen in col-umn 2, however, more able OPs recruited higher-performing referrals. This would be consistent with a positive correlation between an OP’s ability and the overall ability of the OP’s network, or it may represent differential ability to screen. By interacting initial OP ability with performance pay in column 3, we see that the differential performance of referrals recruited by high-ability OPs is driven by OPs who face performance pay incentives. Therefore, high-ability individuals refer high-ability people only when properly incentivized, suggesting that the net-works of high-ability OPs are heterogeneous and that high-ability OPs do have the
Table 5—Task Performance and Treatment Type
Referral cognitive ability task performance
Selection model OLS: full sample
(1) (2) (3) (4) (5) (6)
OP test score × high performance pay 0.371** 0.346*** (0.160) (0.128)
OP test score × low performance pay 0.084 0.055 (0.139) (0.134)OP test score 0.156** 0.035 0.126** 0.026 (0.072) (0.079) (0.057) (0.075)OP treatment: high performance pay −0.137 −0.108 −0.085 −0.073 −0.045 −0.005 (0.159) (0.152) (0.132) (0.126) (0.126) (0.127)OP treatment: low performance pay 0.055 0.064 0.065 0.004 0.008 0.002 (0.174) (0.167) (0.145) (0.136) (0.136) (0.135)
Observations 561 561 561 561 561 561Mean of dep. var. for excluded group −0.068 −0.539SD 1.166 1.320Ch i 2 statistic: joint test of rainfall variables
12.684 13.403 13.012
Mills: coefficient 1.372 1.314 1.133Mills: SE 0.569 0.520 0.433n censored observations 155 155 155
notes: OPs are the respondents who were recruited door-to-door. All columns also include the individual charac-teristics of the OP, as defined in Table 2. The dependent variable in all columns is the referrals’ normalized per-formance on the cognitive task. It is constructed analogously as OP Test Score, which is described in the notes to Table 2.

3590 tHE AmERICAn ECOnOmIC REVIEW DECEmBER 2012
capacity to screen.20 Columns 4 through 6 show that these results are similar when using OLS on the full sample: performance pay offers result in high-ability OPs generating more round two puzzles solved. More detail on the relationship between OP and referral test scores is presented in the online Appendix, which presents test score densities by treatment and also demonstrates the relationship between OP and referral test scores by OP-referral relationship and by treatment type.
E. Why Are High-Ability OPs Different from Low-Ability OPs?
We observed in Table 4 that all OPs in the high-stakes performance pay treatments respond to incentives by recruiting coworkers more often and recruiting relatives less often. Only high-ability OPs, however, recruited referrals who actually per-formed better on the cognitive task. Thus, while all OPs change their referral choices in response to changing contractual conditions, only high-ability OPs do so in a way which results in higher-ability referrals. As the model emphasized, a variety of possible differences between high- and low-ability OPs could explain why perfor-mance incentives did not induce low-ability OPs to recruit higher-ability referrals: they may not know high-ability referrals; they may lack information on the ability of their network members; or the trade-off between their network incentives and the performance incentives may be too large.21
We provide two pieces of evidence that differential information is at least one reason high-ability OPs are successful in recruiting high-quality referrals while low-ability OPs are not. First, Table 2 showed that high-ability OPs were more likely to make a referral when they were given performance pay but not when the level of the fixed component varied, which the theoretical model suggested would be due to additional information. Variation in network quality, however—which is outside our model—is also consistent with that result. In this section, we supplement this argu-ment with a direct investigation of OP knowledge. During the interim survey, OPs were asked how they expected their referrals to perform. The question was simply “How many puzzles do you think [your referral] will solve correctly without mak-ing any mistakes?” The answer is between zero and four puzzles. On average, OPs thought their referrals would answer 3.5 puzzles correctly.
Table 6 shows the results of estimating a Heckman selection model of referrals’ test score performance on anticipated performance. To ease exposition, OPs are divided into discrete ability groups, where high-ability OPs are those with a normal-ized test score above zero. Column 1 shows that high-ability OPs are able to predict their referrals’ ability. The coefficient on anticipated performance implies that if an OP anticipated a perfect score, the referral did on average 0.8 of a standard deviation better than if the OP expected zero correct puzzles. Low-ability OPs, on the other hand, are not systematically able to predict their referrals’ performance, as shown
20 OLS regressions using only the sample of round two participants show no significant relationship between treatment type nor heterogeneous effects by OP ability.
21 Another possibility is that low-ability OPs sought out a referral similar to themselves, mistakenly thinking they had performed well themselves. Given that OPs received real-time feedback on their performance, as described in Section IA, and were told the exact number of puzzles their referral needed to get correct in order to earn the bonus, we think this is an unlikely explanation.

3591BEAmAn AnD mAgRuDER: WHO gEts tHE jOB REfERRAL?VOL. 102 nO. 7
in column 2.22 Thus, while it may also be the case that low-ability OPs have access to fewer high-ability potential referrals or that network-based transfers are larger for these participants, Table 6 suggests that a lack of information on referrals’ capabili-ties is at least part of the reason low-ability OPs do not respond to performance pay. This is consistent with the fact that all participating OPs adjust their behavior on the margin of relationships between the OP and the referral: low-ability OPs are trying to bring in higher-ability referrals, but simply do not have a good understanding of which network members will perform better.
IV. Identifying Good Referrals
High-performing referrals tend to be young and low-income, yet well-educated and high-scoring on the ravens and digit span tests, as shown in online Appendix Table 3.23 OPs therefore had to find referrals who would do well on the task spe-cifically, not just the most successful individual in the network, for which income would proxy.
Can an employer use these observable characteristics to screen recruits without the use of the network, or are social networks identifying productive, but hard-to-identify, employees? While we cannot mimic the full range of information that any prospective employer could observe through resumes, interviews, and other recruitment methods, we can at least discuss whether the productive characteristics that our high-ability OPs are identifying can be explained by the other characteristics in our data. To test this, we add a variety of other characteristics to the main specification from Table 5, and present those results in online Appendix Table 4. When we add in controls that should
22 A caveat applies, however, since the rainfall instruments are not powerful in the Heckman selection model in the low-ability OP sample.
23 Given that the raven and digit span tests have been used extensively in the psychology literature on measur-ing cognitive ability (Snow, Kyllonen, and Marshalek 1984), this correlation provides reassuring evidence on the validity of our cognitive task.
Table 6—OP Ability to Predict Performance
High-ability OPs Low-ability OPs
(1) (2)
OP’s anticipated performance: puzzle 0.190** 0.025(0.090) (0.082)
Observations 280 225Chi2 statistic: joint test of rainfall variables 13.908 4.124n censored observations 78 77
notes: OPs are the respondents who were recruited door-to-door. The independent variable is the number of puzzles, from 0 to 4, that the OP expects the referral to solve correctly in the allotted time. The dependent variable is the measure of actual referral performance used in Table 5. All estimates are from a Heckman two-step selection model. Column 1 restricts the sample to high-ability OPs: those with a normalized test score greater than 0 while column 2 uses the sample of OPs with a normalized test score less than 0. All columns also include additional covariates of the OP as described in Table 2. There are fewer observations than in Table 5 since there were 56 OPs who responded with “I don’t know” as the response to the question on antic-ipated performance and were dropped from the sample.

3592 tHE AmERICAn ECOnOmIC REVIEW DECEmBER 2012
be easily observable in a resume (indicators for the referral’s five-year age group, each education level, and occupational category) and others that could be easily gauged (ravens and digit span tests, income levels), β 2 remains statistically significant, and the point estimate is not substantially affected (changing from 0.370 in the main specifica-tion to 0.383 with the full vector of controls). That is, highly skilled, incentivized OPs are bringing in referrals who are highly skilled in ways that are hard to predict by the covariates in our data, even though some of those covariates are highly correlated with puzzle task performance.24
V. Conclusion
This paper uses a hybrid laboratory-field experiment to observe the spread of tem-porary jobs through job networks under a variety of incentive schemes. Our experi-ment indicates that at least some individuals have the ability to screen others in their networks to enhance firm productivity, and will do so if properly incentivized. This result validates the plausibility of the assumption that employees can help screen for their employer, at least in some contexts. We also find evidence, however, that sug-gests that some workers could not screen effectively. Moreover, the workers who could screen were only willing to do so when they were directly incentivized, as they faced competing incentives generated by the network itself.
REFERENCES
Altonji, Joseph G., and Charles R. Pierret. 2001. “Employer Learning and Statistical Discrimination.” Quarterly journal of Economics 116 (1): 313–50.
Ashraf, Nava. 2009. “Spousal Control and Intra-household Decision Making: An Experimental Study in the Philippines.” American Economic Review 99 (4): 1245–77.
Bandiera, Oriana, Iwan Barankay, and Imran Rasul. 2007. “Incentives for Managers and Inequality among Workers: Evidence from a Firm-Level Experiment.” Quarterly journal of Economics 122 (2): 729–73.
Bandiera, Oriana, Iwan Barankay, and Imran Rasul. 2009. “Social Connections and Incentives in the Workplace: Evidence from Personnel Data.” Econometrica 77 (4): 1047–94.
Bandiera, Oriana, Iwan Barankay, and Imran Rasul. 2010. “Social Incentives in the Workplace.” Review of Economic studies 77 (2): 417–58.
Bayer, Patrick, Stephen L. Ross, and Giorgio Topa. 2008. “Place of Work and Place of Residence: Informal Hiring Networks and Labor Market Outcomes.” journal of Political Economy 116 (6): 1150–96.
Beaman, Lori A. 2012. “Social Networks and the Dynamics of Labor Market Outcomes: Evidence from Refugees Resettled in the U.S.” Review of Economic studies 79 (1): 128–61.
Beaman, Lori, and Jeremy Magruder. 2012. “Who Gets the Job Referral? Evidence from a Social Net-works Experiment: Dataset.” American Economic Review. http://dx.doi.org/10.1257/aer.102.7.3574.
Bewley, Truman F. 1999. Why Wages Don’t fall during a Recession. Cambridge, MA: Harvard Uni-versity Press.
Calvo-Armengol, Antoni. 2004. “Job Contact Networks.” journal of Economic theory 115 (1): 191–206.
Calvo-Armengol, Antoni, and Matthew O. Jackson. 2004. “The Effects of Social Networks on Employ-ment and Inequality.” American Economic Review 94 (3): 426–54.
Castilla, E. 2005. “Social Networks and Employee Performance in a Call Center.” American journal of sociology 110 (5): 1243–83.
24 Additionally, the full vector of controls renders the interaction of low-stakes performance pay with OP ability marginally significant, suggesting that high-ability OPs in low-stakes performance pay groups may also be identify-ing referrals who are unobservably productive.

3593BEAmAn AnD mAgRuDER: WHO gEts tHE jOB REfERRAL?VOL. 102 nO. 7
Cohen, Jessica, and Pascaline Dupas. 2010. “Free Distribution or Cost-Sharing? Evidence from a Ran-domized Malaria Prevention Experiment.” Quarterly journal of Economics 125 (1): 1–45.
Conley, T., and C. Udry. 1994. “Social Networks in Ghana.” Unpublished.Fafchamps, Marcel, and Alexander Moradi. 2009. “Referral and Job Performance: Evidence from the
Ghana Colonial Army.” Bureau for Research and Economic Analysis of Development (BREAD) Working Paper 238.
Galeotti, A., and L.P. Merlino. 2009. “Endogenous Job Contact Networks.” UnpublishedGranovetter, M. 1973. “The Strength of Weak Ties.” American journal of sociology 78 (6): 1360–80.Heath, R. 2011. “Why Do Firms Hire Using Referrals? Evidence from Bangladeshi Garment Facto-
ries.” Unpublished.Heckman, James J. 1976. “The Common Structure of Statistical Models of Truncation, Sample Selec-
tion and Limited Dependent Variables and a Simple Estimator for Such Models.” Annals of Eco-nomic and social measurement 5 (4): 475–92.
Ioannides, Yannis M., and Linda Datcher Loury. 2004. “Job Information Networks, Neighborhood Effects, and Inequality.” journal of Economic Literature 42 (4): 1056–93.
Karlan, Dean, and Jonathan Zinman. 2009. “Observing Unobservables: Identifying Information Asymmetries with a Consumer Credit Field Experiment.” Econometrica 77 (6): 1993–2008.
Kramarz, F., and O. N. Skans. 2007. “With a Little Help from My… Parents? Family Networks and Youth Labor Market Entry.” Unpublished.
Kugler, Adriana D. 2003. “Employee Referrals and Efficiency Wages.” Labour Economics 10 (5): 531–56.
Laschever, R. 2009. “The Doughboys Network: Social Interactions and Labor Market Outcomes of World War I Veterans.” Unpublished.
Ligon, E., and L. Schechter. 2010. “Structural Experimentation to Distinguish between Models of Risk Sharing with Frictions.” Unpublished.
Loury, Linda Datcher. 2006. “Some Contacts Are More Equal than Others: Informal Networks, Job Tenure, and Wages.” journal of Labor Economics 24 (2): 299–318.
Lublin, J. 2010. “Greasing the Inside Track to a Job.” Wall street journal, May 31.Magruder, Jeremy R. 2010. “Intergenerational Networks, Unemployment, and Persistent Inequality in
South Africa.” American Economic journal: Applied Economics 2 (1): 62–85.Mas, Alexandre, and Enrico Moretti. 2009. “Peers at Work.” American Economic Review 99 (1): 112–45.Montgomery, James D. 1991. “Social Networks and Labor-Market Outcomes: Toward an Economic
Analysis.” American Economic Review 81 (5): 1407–18.Mortensen, Dale T., and Tara Vishwanath. 1994. “Personal Contacts and Earnings: It Is Who You
Know!” Labour Economics 1 (2): 187–201.Munshi, Kaivan. 2003. “Networks in the Modern Economy: Mexican Migrants in the U.S. Labor Mar-
ket.” Quarterly journal of Economics 118 (2): 549–99.Munshi, Kaivan, and Mark Rosenzweig. 2006. “Traditional Institutions Meet the Modern World:
Caste, Gender, and Schooling Choice in a Globalizing Economy.” American Economic Review 96 (4): 1225–52.
Prendergast, Canice, and Robert H. Topel. 1996. “Favoritism in Organizations.” journal of Political Economy 104 (5): 958–78.
Simon, Curtis J., and John T. Warner. 1992. “Matchmaker, Matchmaker: The Effect of Old Boy Net-works on Job Match Quality, Earnings, and Tenure.” journal of Labor Economics 10 (3): 306–30.
Snow, R., P. Kyllonen, and B. Marshalek. 1984. “The Topography of Ability and Learning Correla-tions.” In Advances in the Psychology of Human Intelligence, Volume 2, edited by R. Sternberg, 47–103. Hillsdale, NJ: Erlbaum.
Topa, Giorgio. 2001. “Social Interactions, Local Spillovers and Unemployment.” Review of Economic studies 68 (2): 261–95.
Townsend, Robert M. 1994. “Risk and Insurance in Village India.” Econometrica 62 (3): 539–91.Udry, Christopher. 1994. “Risk and Insurance in a Rural Credit Market: An Empirical Investigation in
Northern Nigeria.” Review of Economic studies 61 (3): 495–526.Wang, S. 2011. “Marriage Networks, Nepotism and Labor Market Outcomes in China.” Unpublished.Yakubovich, V., and D. Lup. 2006. “Stages of the Recruitment Process and the Referrer’s Performance
Effect.” Organization science 17 (6): 710–23.

![bulletin - Innovations for Poverty Action · 2015-09-08 · abdul latif jameel poverty action lab • innovations for poverty action policy bulletin [ september 2015 ] building stable](https://static.fdocuments.in/doc/165x107/5cc6ffe188c99307608dbe0f/bulletin-innovations-for-poverty-action-2015-09-08-abdul-latif-jameel.jpg)