Inflation of the Aira Caldera (Japan) detected over Kokubu ... · 17/02/2007 · the Aira...
9
eEarth, 2, 17–25, 2007 www.electronic-earth.net/2/17/2007/ © Author(s) 2007. This work is licensed under a Creative Commons License. eEarth Inflation of the Aira Caldera (Japan) detected over Kokubu urban area using SAR interferometry ERS data D. Remy 1,2,* , S. Bonvalot 1,2 , M. Murakami 3 , P. Briole 2 , and S. Okuyama 4 1 Institut de Recherche pour le D´ eveloppement (IRD), UR154, France 2 Institut de Physique du Globe de Paris, 4 Place Jussieu, 75005 Paris, France 3 Geographical Survey Institute, Mizusawa Geodetic Observatory, Japan 4 Kyoto University, Dept. of Geophysics, Kyoto, 606-8502, Japan * presently at: Dept. of Geophysics, University of Chile, Santiago, Chile Received: 20 July 2006 – Published in eEarth Discuss.: 8 August 2006 Revised: 26 October 2006 – Accepted: 30 January 2007 – Published: 2 February 2007 Abstract. Nine ERS-1 and ERS-2 descending orbit data ac- quired over Aira Caldera between June 1995 and November 1998 were used to create 36 differential interferograms. Al- though the interferograms exhibit a relatively low level of coherence, even for couples sampling short time intervals (6 months), Synthetique Aperture Radar (SAR) observations re- veal a distinct range change pattern over Kokubu urban area whose amplitude increases with the time separation between SAR images. The analysis of the ground deformation time series relative to the earliest ERS images showed a maxi- mum uplift of about 20 mm between the north and the south of the urban area during the period covered by our satellite observations. Taking the reduced surface of the coherent area into account, we performed a simple modeling of the defor- mation field assuming an inflating spherical source within an elastic half-space medium located beneath the centre of the Aira Caldera. This simple model predicts a maximum volume increase of 20–30×10 6 m 3 between 1995 and 1998, which would produce an inflation of about 70 mm at the cen- tre of the Aira Caldera and 40 mm in the Kokubu south urban area. These results are in good agreement with other geo- physical observations carried out on the Aira caldera during this period. Despite the limited spatial extent of the coherent areas around the Aira Caldera, this study shows that Din- SAR method using data collected in C band can be success- fully used to detect subtle ground displacement changes of the volcanic complex and thus provides complementary in- formation to ground-based geodetic monitoring of dynamic processes of the Aira Caldera and Sakurajima volcano. Correspondence to: D. Remy ([email protected]) 1 Introduction Numerous papers have shown the potential of SAR (Syn- thetic Aperture Radar) interferometry data for ground defor- mation studies on volcanoes (Massonnet and Sigmundsson, 2000; Zebker et al., 2000; Pritchard and Simons, 2002). Un- der optimal conditions a differential interferogram derived from two SAR images may monitor topographic changes in- duced by internal volcanic processes with an accuracy of a few cm over periods of time up to several months or years. Furthermore, as satellite systems repeat their orbit on the order of weeks, it is now possible to generate deformation time series which help to better resolve time dependant de- formation (Schmidt and Burgmann, 2003). In this paper we use the DinSAR method to examine ground deformation oc- curring on the volcanic complex of the Aira Caldera (Japan) within the 1995–1998 period (Fig. 1). This Caldera and its post-caldera volcano, Sakurajima, are among the most ac- tive volcanic centers in Japan where significant ground de- formations have been observed from ground monitoring net- works over several decades (Omori, 1916; Yokoyama, 1971; Aramaki, 1984). The latest precise leveling survey con- ducted along a coast road at Sakurijima clearly shows that the deflation of the ground around the Aira Caldera start- ing in 1974 turned into inflation in 1994 (Ishihara, 1999). Using JERS (L band, λ=23.53 cm) data acquired between 1993 and 1998, (Okuyama et al., 2001) detected two dis- tinct deformation patterns. Figure 2 shows three examples of JERS interferograms used in their study for various time pe- riods during 1993–1998. The first deformation pattern is lo- cated at the north flank of Sakurajima and it was interpreted by the authors as related to a volume change of a shallow Published by Copernicus GmbH on behalf of the European Geosciences Union.
Transcript of Inflation of the Aira Caldera (Japan) detected over Kokubu ... · 17/02/2007 · the Aira...
eEarth, 2, 17–25, 2007www.electronic-earth.net/2/17/2007/© Author(s) 2007. This work is licensedunder a Creative Commons License.
eEarth
Inflation of the Aira Caldera (Japan) detected over Kokubu urbanarea using SAR interferometry ERS data
D. Remy1,2,*, S. Bonvalot1,2, M. Murakami 3, P. Briole2, and S. Okuyama4
1Institut de Recherche pour le Developpement (IRD), UR154, France2Institut de Physique du Globe de Paris, 4 Place Jussieu, 75005 Paris, France3Geographical Survey Institute, Mizusawa Geodetic Observatory, Japan4Kyoto University, Dept. of Geophysics, Kyoto, 606-8502, Japan* presently at: Dept. of Geophysics, University of Chile, Santiago, Chile
Received: 20 July 2006 – Published in eEarth Discuss.: 8 August 2006Revised: 26 October 2006 – Accepted: 30 January 2007 – Published: 2 February 2007
Abstract. Nine ERS-1 and ERS-2 descending orbit data ac-quired over Aira Caldera between June 1995 and November1998 were used to create 36 differential interferograms. Al-though the interferograms exhibit a relatively low level ofcoherence, even for couples sampling short time intervals (6months), Synthetique Aperture Radar (SAR) observations re-veal a distinct range change pattern over Kokubu urban areawhose amplitude increases with the time separation betweenSAR images. The analysis of the ground deformation timeseries relative to the earliest ERS images showed a maxi-mum uplift of about 20 mm between the north and the southof the urban area during the period covered by our satelliteobservations. Taking the reduced surface of the coherent areainto account, we performed a simple modeling of the defor-mation field assuming an inflating spherical source withinan elastic half-space medium located beneath the centre ofthe Aira Caldera. This simple model predicts a maximumvolume increase of 20–30×106 m3 between 1995 and 1998,which would produce an inflation of about 70 mm at the cen-tre of the Aira Caldera and 40 mm in the Kokubu south urbanarea. These results are in good agreement with other geo-physical observations carried out on the Aira caldera duringthis period. Despite the limited spatial extent of the coherentareas around the Aira Caldera, this study shows that Din-SAR method using data collected in C band can be success-fully used to detect subtle ground displacement changes ofthe volcanic complex and thus provides complementary in-formation to ground-based geodetic monitoring of dynamicprocesses of the Aira Caldera and Sakurajima volcano.
Correspondence to:D. Remy([email protected])
1 Introduction
Numerous papers have shown the potential of SAR (Syn-thetic Aperture Radar) interferometry data for ground defor-mation studies on volcanoes (Massonnet and Sigmundsson,2000; Zebker et al., 2000; Pritchard and Simons, 2002). Un-der optimal conditions a differential interferogram derivedfrom two SAR images may monitor topographic changes in-duced by internal volcanic processes with an accuracy of afew cm over periods of time up to several months or years.Furthermore, as satellite systems repeat their orbit on theorder of weeks, it is now possible to generate deformationtime series which help to better resolve time dependant de-formation (Schmidt and Burgmann, 2003). In this paper weuse the DinSAR method to examine ground deformation oc-curring on the volcanic complex of the Aira Caldera (Japan)within the 1995–1998 period (Fig. 1). This Caldera and itspost-caldera volcano, Sakurajima, are among the most ac-tive volcanic centers in Japan where significant ground de-formations have been observed from ground monitoring net-works over several decades (Omori, 1916; Yokoyama, 1971;Aramaki, 1984). The latest precise leveling survey con-ducted along a coast road at Sakurijima clearly shows thatthe deflation of the ground around the Aira Caldera start-ing in 1974 turned into inflation in 1994 (Ishihara, 1999).Using JERS (L band,λ=23.53 cm) data acquired between1993 and 1998, (Okuyama et al., 2001) detected two dis-tinct deformation patterns. Figure 2 shows three examples ofJERS interferograms used in their study for various time pe-riods during 1993–1998. The first deformation pattern is lo-cated at the north flank of Sakurajima and it was interpretedby the authors as related to a volume change of a shallow
Published by Copernicus GmbH on behalf of the European Geosciences Union.

18 D. Remy et al.: Inflation of Aira Caldera (Japan) detected using DinSAR
130° 30'
130° 30'
130° 36'
130° 36'
130° 42'
130° 42'
130° 48'
130° 48'
31° 30' 31° 30'
31° 36' 31° 36'
31° 42' 31° 42'
KAGOSHIMA BAY
KAJIKI
KAGOSHIMA
KOKUBU
0 5 10
km
Fig. 1. Geographical setting of Kagoshima bay. The white dottedline is the rim of the Aira Caldera proposed by Matumoto (1943).The white box located in the northeast (Kokubu urban area) of thecaldera shows the area used in this study for SAR data analysis andmodeling. The black box located in the southwest of the calderashows the area used to perform the analysis of the spatial structureof interferogram noise.
pressure source located beneath the volcano at 4 km depth.The second one corresponds to an uplift of Kokubu urbanarea, which was interpreted by the authors as related to avolume change caused by magmatic injection of a deep pres-sure source roughly located at the center of the Aira Calderaat 10 km depth. Assuming a point center of dilatation (Mogi,1958), these authors estimated a roughly constant inflationrate of about 8–16×106 m3/year between 1992–1998. InOctober 98 began an increase in seismic activity until July1999 which has been interpreted as a migration of the magmastored in the magma reservoir beneath the caldera to the sum-mit of Sakurajima volcano, accumulating stress in the rocksaround the magma reservoir. This increase in seismic ac-tivity was followed by the eruptive activity which reachedits peak between August 1999 and February 2000 (Smithso-nian Institution, 1999a, b, 2000; Kriswati and Iguchi, 2003).
Kriswati and Iguchi (2003) analyzed GPS data acquiredfrom the Sakurajima Volcano Research Center network (12permanent stations) and from 7 campaigns of Kyoto Univer-sity in South Kyushu during 1996–2002 period in order toinvestigate characteristics of ground deformation caused byvolcanic activity of Sakurajima. This study revealed an out-ward radial pattern of horizontal displacement from the cen-ter of the Aira Caldera. Assuming a simple point source ofpressure in an elastic half space, the location of the sourcewas estimated to be 8–9 km beneath the Aira Caldera. Be-tween 1995 and 2000 the total volume change of the sourcewas estimated to about 20×106 m3. During the same pe-
riod total weight of volcanic ash ejected from the summitcrater was estimated by the Sakurajima Volcano ResearchCenter to about 8.75×10⁹ kg which leads to an estimation ofmagma in volume to 3.5×10⁶ m3 (assuming a magma den-sity of 2500 kg/m3). Presumably, this preeruption uplift wascaused by accumulation of magma within a reservoir beneaththe Aira caldera prior to the 1999 eruption.
In this paper, we show a clear evidence of ground deforma-tion of the northern rim of the Aira Caldera using ERS SARinterferometry, which is in good agreement with the previ-ous independent studies. The analysis and interpretation ofthe interferogram time series are also presented
2 DinSAR data acquisition and processing
We analyzed a series of 36 interferograms produced from9 ERS-1 and ERS-2 scenes acquired in descending orbitsover the Aira Caldera volcanic complex between June 1995and November 1998 (see Fig. 3). The differential interfero-grams were produced by the two pass method with DIAPA-SON software (CNES, 1996) using precise ERS orbit dataproduced by the Delft Institute for Earth-Oriented Space Re-search (DEOS)(Sharroo et al., 1998). The topographic con-tribution was removed by subtracting the fringe pattern com-puted from a Digital Elevation Model (DEM) with 45 m pixelspacing and with a height uncertainty of 5–10 m provided bythe Geographical Survey Institute (Japan). The resulting in-terferograms span between 1 and 1261 days, with perpendic-ular baselines ranging from 2 m to 730 m (see Fig. 3).
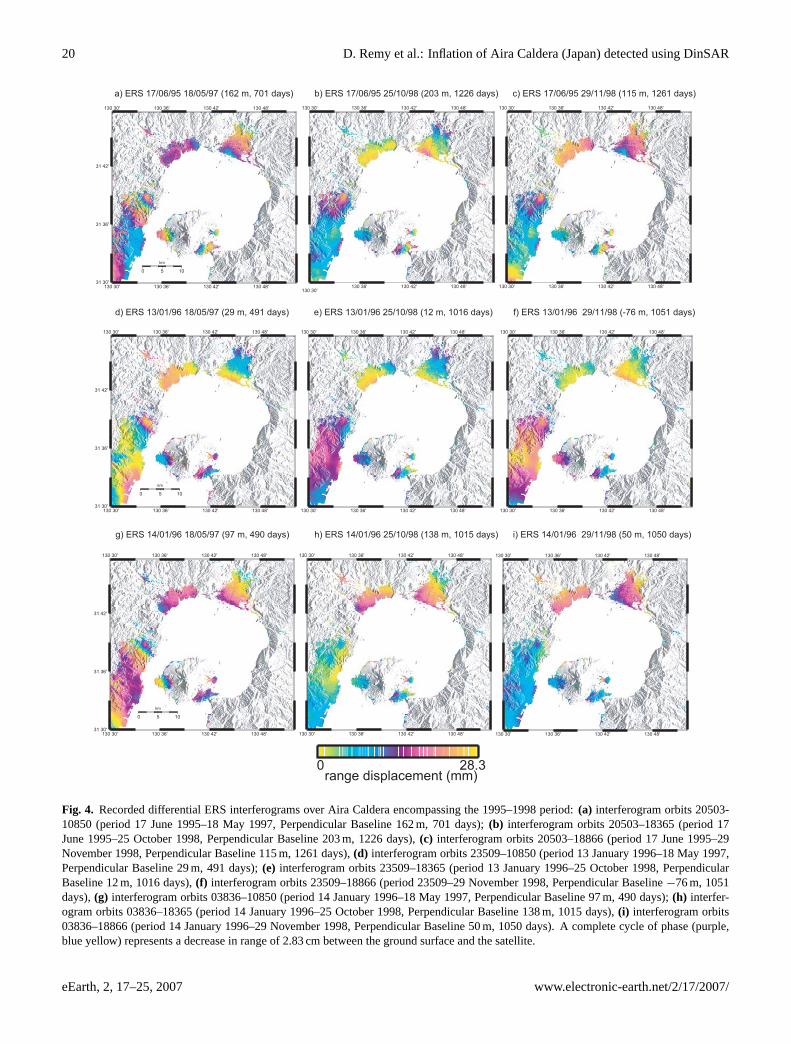
Figure 4 shows typical examples of wrapped interfero-grams constructed using three different master images (orbits20503, 23509 and 0386). It can be noted that the interfero-grams exhibit a relatively low level of coherence over thewhole area due to densely vegetated areas and water surfacewhich disconnects the Sakurajima volcano from the coast.The comparison between Fig. 2 and 4 clearly shows that theinterferometric coherence is better and persists longer in Lband than in the C band, confirming conclusions from In-SAR investigations at others places (e.g., Murakami et al,1996; Lu et al., 2005). Consequently using C band, suc-cessful measurements of the phase are only possible in threeisolated areas located in the northeast (Kokubu urban area)in the northwest (Kajiki urban area) and in the southwest ofthe caldera (Kagoshima urban area). The two isolated ar-eas corresponding to Kajiki urban area and Kagoshima urbanarea exhibit signals which are not observed in independentinterferograms (i.e. generated from images pairs acquiredfrom different satellite tracks). We conclude that these sig-nals are mainly produced by atmospheric turbulence. Onthe contrary, examination of the differential SAR interfer-ograms computed over time separations from one to threeyears reveals that Kokubu urban area exhibits a time de-pendant but perpendicular baseline independent phase pat-tern. This phase pattern (up to almost one fringe) cannot
eEarth, 2, 17–25, 2007 www.electronic-earth.net/2/17/2007/

D. Remy et al.: Inflation of Aira Caldera (Japan) detected using DinSAR 19
a) JERS 06/93 03/97
130 30'
130 30'
130 36'
130 36'
130 42'
130 42'
130 48'
130 48'
31 30'
31 36'
31 42'
0 5 10
km
b) JERS 10/93 08/98
130 30'
130 30'
130 36'
130 36'
130 42'
130 42'
130 48'
130 48'
0 117.2
c) JERS 10/93 09/98
130 30'
130 30'
130 36'
130 36'
130 42'
130 42'
130 48'
130 48'
range displacement (mm)
Fig. 2. Recorded differential JERS interferograms over the Aira Caldera encompassing the 1993–1998 period.(a) Interferogram spanningfour years from June 1993 to March 1997.(b) Interferogram spanning five years from October 1993 to August 1998.(c) Interferogramspanning five years from October 1993 to September 1998. A complete cycle of phase (purple, blue yellow) represents a decrease in rangeof 11.73 cm between the ground surface and the satellite.
be attributed to topographic residuals resulting from DEMinaccuracies used in the data reduction as it does not ap-pear in various interferograms obtained from images span-ning over less than one month with orbit perpendicular base-lines greater than 350 m. Effects of excess path delays pro-duced by temporal changes of tropospheric water vapor con-tent might also explain the interferometric signals on the AiraCaldera as they have been already observed on the study area(Remy et al., 2003). The signal seen here on Kokubu urbanarea is unlikely to be produced by topography related tropo-spheric effects as height variation along this coherent area isvery weak (less than 200 m) and does not reveal any corre-lation with the observed phase signal. Obviously, we can-not rule out a possible contribution of residual transient tro-pospheric effects. According to the unpredictable characterof atmospheric phase delay and without external data on theatmospheric water vapor content (such as direct or indirectmeasurements provided by radio-soundings, permanent GPSarrays, or MODIS/MERIS water vapor data, for instance), itis difficult to separate this phase delay from a signal of de-formation. We discuss later (section analysis of the DinSARtime series) the influence of atmospheric effects on the inter-pretation of the observed signal in terms of displacement.
3 Analysis of the DinSAR time series
It is noteworthy that all the independent interferograms hav-ing significant signals over Kokubu urban area exhibit aphase variation with coherent patterns in both space and time(signal with relatively constant shape and with an amplitudethat increases with the time separation between SAR im-ages). In order to better understand and quantify the time de-
01/01/95 01/01/96 01/01/97 01/01/98 01/01/99
-400
-300
-200
-100
0
100
200
300
40021004 (35 days)
23509 (210 days)
03836 (211 days)
10850 (701 days) 18365 (1226 days)
25513
18866 (1261 days)
25513(350 days)
20503 (reference)
21505 (72 days)
Perp
en
dic
ula
r b
aselin
e(m
)
Time
Fig. 3. Dataset of ERS images acquired on the Aira Caldera used inthis study (acquisition data versus perpendicular baseline in meters).Solid lines indicate the 31 interferograms used for the time seriesgeneration. Time spans in days of each ERS image relative to thereference image orbit 20503 is also reported.
pendency of this interferometry phase signal, we generateda time series relative to the earliest SAR image of our dataset (June 1995) using the technique proposed by Lundgren etUsai (2001). First, we selected the most coherent interfero-grams of our dataset (31 interferograms with perpendicularbaseline lower than 400 m, see Fig. 2). The differential in-terferograms were filtered using a weighted power spectraldensity filter (Goldstein et al., 1988), and then unwrappedusing an implementation of the Network-flow Algorithm forPhase Unwrapping developed by Chen and Zebker (2002).We selected the whole Kokubu urban area where the phasesignal is clearly defined. Next, we generated a time seriesof interferograms relative to the earliest SAR image of ourdata set (orbit 20503 acquired the 17 June 1995). Due to the
www.electronic-earth.net/2/17/2007/ eEarth, 2, 17–25, 2007
20 D. Remy et al.: Inflation of Aira Caldera (Japan) detected using DinSAR
c) ERS 17/06/95 29/11/98 (115 m, 1261 days)
130 30'
130 30'
130 36'
130 36'
130 42'
130 42'
130 48'
130 48'
130 30'
130 30'
130 36'
130 36'
130 42'
130 42'
130 48'
130 48'
130 30'
130 30'
130 36'
130 36'
130 42'
130 42'
130 48'
130 48'
130 30'
130 30'
130 36'
130 36'
130 42'
130 42'
130 48'
130 48'
130 30'
130 30'
130 36'
130 36'
130 42'
130 42'
130 48'
130 48'
b) ERS 17/06/95 25/10/98 (203 m, 1226 days)
130 30'
130 30'
130 36'
130 36'
130 42'
130 42'
130 48'
130 48'
a) ERS 17/06/95 18/05/97 (162 m, 701 days)
130 30'
130 30'
130 36'
130 36'
130 42'
130 42'
130 48'
130 48'
31 30'
31 36'
31 42'
0 5 10
km
130 30'
130 30'
130 36'
130 36'
130 42'
130 42'
130 48'
130 48'
31 30'
31 36'
31 42'
0 5 10
km
130 30'
130 30'
130 36'
130 36'
130 42'
130 42'
130 48'
130 48'
31 30'
31 36'
31 42'
0 5 10
km
d) ERS 13/01/96 18/05/97 (29 m, 491 days) e) ERS 13/01/96 25/10/98 (12 m, 1016 days) f) ERS 13/01/96 29/11/98 (-76 m, 1051 days)
g) ERS 14/01/96 18/05/97 (97 m, 490 days) h) ERS 14/01/96 25/10/98 (138 m, 1015 days) i) ERS 14/01/96 29/11/98 (50 m, 1050 days)
0 28.3range displacement (mm)
Fig. 4. Recorded differential ERS interferograms over Aira Caldera encompassing the 1995–1998 period:(a) interferogram orbits 20503-10850 (period 17 June 1995–18 May 1997, Perpendicular Baseline 162 m, 701 days);(b) interferogram orbits 20503–18365 (period 17June 1995–25 October 1998, Perpendicular Baseline 203 m, 1226 days),(c) interferogram orbits 20503–18866 (period 17 June 1995–29November 1998, Perpendicular Baseline 115 m, 1261 days),(d) interferogram orbits 23509–10850 (period 13 January 1996–18 May 1997,Perpendicular Baseline 29 m, 491 days);(e) interferogram orbits 23509–18365 (period 13 January 1996–25 October 1998, PerpendicularBaseline 12 m, 1016 days),(f) interferogram orbits 23509–18866 (period 23509–29 November 1998, Perpendicular Baseline−76 m, 1051days),(g) interferogram orbits 03836–10850 (period 14 January 1996–18 May 1997, Perpendicular Baseline 97 m, 490 days);(h) interfer-ogram orbits 03836–18365 (period 14 January 1996–25 October 1998, Perpendicular Baseline 138 m, 1015 days),(i) interferogram orbits03836–18866 (period 14 January 1996–29 November 1998, Perpendicular Baseline 50 m, 1050 days). A complete cycle of phase (purple,blue yellow) represents a decrease in range of 2.83 cm between the ground surface and the satellite.
eEarth, 2, 17–25, 2007 www.electronic-earth.net/2/17/2007/

D. Remy et al.: Inflation of Aira Caldera (Japan) detected using DinSAR 21
03836 : 211 days
18866 :1261 days
23509 : 210 days21505 : 70 days
25513 : 350 days
P
P'
10850 : 701 days 18365 :1226 days
21004 : 35 days
0
10
20
(mm)
Fig. 5. Inverted displacement field (mm) for each of the 8 ERS im-ages relative to the earliest image (June 1995). Displacements to-ward the satellite are positive. P and P′ denote the reference profileused in the data analysis.
limited spatial extent of the selected coherent patch it wasnot possible to define a reference point far away from thearea of inflation which could be considered as a zero phasevalue for the phase unwrapping process. Consequently, inorder to make comparable the phase variations both in spaceand time within the study area and considering the decreasingpattern of the signal towards the north, we defined arbitrar-ily a reference site on north Kokubu (noted P in Fig. 5) forwhich the observed deformation is assumed to be minimalover the studied period. The reference phase value for thissite has been calculated by averaging the unwrapped phasevalues for the surrounding pixels within a 200 m squared box.This value has thus been used as a common reference forthe whole time series of unwrapped interferograms. By thisprocess, the resulting field displacement maps give a rela-tive measure of the ground displacement with respect to thisfixed reference point. In the first stage, in order to detectthe presence of noise or unwrapped phase errors that couldlead to severe misinterpretations, we estimated the phase un-wrapping biases by comparing each subset of three inter-ferograms composed of a linear combination of three SARimages (Lundgren and Usai, 2001). If we have three im-ages (A, B, C) forming interferograms AB, AC, and BC, theabsolute deformation at a given pixel for all three interfer-ograms should sum to zero. Since the presence of noisewill, in general, result in a non-zero sum, a histogram ofthe phase sum should show a maximum at the correct phaseshift. This analysis enhances the consistency of our datasetof unwrapped interferograms for which a 90% of the pixelshave closure discrepancies lower than 4 mm. Next we in-verted an InSAR data network, formed by a subset of 31 in-terferograms. In this way, for a given pixel, the observed dis-placement is adjusted using a least square inversion to mini-mize the closure discrepancies within the network. Figure 5shows the resulting temporal evolution of the displacementfield where each image corresponds to the adjusted displace-ment field relative to the earliest one. The resulting displace-ment field series clearly reveals a pattern of uplift betweenJune 1995 to November 1999 with as much as 23 mm of dif-
01/01/95 01/01/96 01/01/97 01/01/98 01/01/995
0
5
10
15
20
Time
Dis
pla
ce
me
nt
(mm
)
Fig. 6. Maximum relative ground deformation signal determinedfrom ERS data between north and south Kokubu (PP′ profile) forvarious acquisition dates. The amplitudes and the standard devi-ation (vertical error bars) of the maximum uplift values are takenfrom a 10×50 pixel E-W cross section centered on the area of themaximum uplift around P′. The maximum amplitude of the upliftreaches 23 mm between June 1995 and May 1997.
ferential uplift between the south and the north of Kokubuurban area. The Fig. 6 plots the maximum relative grounddisplacement observed along the P-P′ profile at the respec-tive SAR image acquisition dates. The amplitude and thestandard deviation of the differential uplift are taken from a10×50 pixel cross section centered on the area of the max-imum uplift around P′ observed in each adjusted displace-ment field. The good agreement of measured uplifts obtainedfor image orbits 23509 and 03836 (8 mm, 6 mm) and imagesorbits 20503 and 21004 (0 mm,−1 mm) spanning one and35 days, respectively demonstrates the robustness of the ap-proach. These time series show a differential uplift of upto 23 mm between June 1995 and May 1997 followed by astop in the uplift observed between May 1997 and October1998 and finally by a period of an apparent rapid subsidenceof few mm amplitude between October and November 1998.Obviously, these estimates must be used with some cautiongiven the uncertainties due to phase delays induced by tro-pospheric effects. In order to better understand the characterof the InSAR data noise in our observations, we examinedthe spatial structure of interferogram noise in various inter-ferogram which spanned more than one year. We selectedsub-images from the southern part of Kagoshima urban area(see Fig. 1). This area was chosen because visual inspectionof our series and the results of the previously mentioned stud-ies (Okuyama et al., 2001; Kriswati and Iguchi, 2003) indi-cate that this area is little affected by deformation. The sub-images have size of 150×150 pixels, or about 7 km×7 km.Next, we calculated the autocorrelation function of INSARnoise by assuming randomness, following the procedure de-scribed in Jonsson (2002). The resulting covariance functionestimations show noise variances ranging from 5 to 15 mm2
and a correlation length scale which varies from 1200 to1600 m. These results illustrate the variability of the noisestructure from one interferogram to another on the study area.Nevertheless, from the result of this analysis, we can esti-mate the amplitude of the bias induced by noise effects in our
www.electronic-earth.net/2/17/2007/ eEarth, 2, 17–25, 2007

22 D. Remy et al.: Inflation of Aira Caldera (Japan) detected using DinSAR
130 30'
130 30'
130 36'
130 36'
130 42'
130 42'
130 48'
130 48'
31 30'
31 36'
31 42'
0 5 10
km
130 30'
130 30'
130 36' 130 42' 130 48'
130 36' 130 42' 130 48'
0 28.3range displacement (mm)
A B
Fig. 7. (a)Simulated interferogram of a Mogi source at 10 km depth with volume change of 25×106 m3. Black star indicates the localisationof the deformation source.(b) A noisy interferogram obtained from addition of (a) and a simulated noise using interferogram noise structuresimilar to those observed in the study area (variance of 15 mm2 and correlation length scale of 1600 m). Note that only Kokubu urban areaexhibits a phase pattern induced by the volume change within the source. In other areas, the surface deformation signal power is below thedetection threshold estimated roughly two or three times the noise variance (30–45 mm2).
0 range displacement (
130 30'
130 30'
130 36'
130 36'
130 42'
130 42'
130 48'
130 48'
31 30'
31 36'
31 42'
0 5 10
km
130 30' 130 36' 130 42' 130 48'
130 30' 130 36' 130 42' 130 48'
0 28.3range displacement (mm)
A B
Fig. 8. (a)interferogram orbits 20503–10850.(b) Residual between the best-fit model (volume change of 25×106 m3) and the interferogram.The model explains about 68% of the variance in the data. The variance of the residual is about 14 mm2 consistent with the variance of theinterferogram noise derived from our noise analysis. Residual are rewrapped.
estimations of relative displacements between the north andthe south of Kokubu to be about 8 mm. This bias and the lim-ited amount of interferograms make the interpretation of thesmall fluctuation (such as those observed between May 1997
and October 1998 or between October and November 1998)speculative. Nevertheless, considering the magnitude of thedecrease in range observed (up to 20 mm) over Kokubu ur-ban area, we interpret the series of temporal signals as mainly
eEarth, 2, 17–25, 2007 www.electronic-earth.net/2/17/2007/

D. Remy et al.: Inflation of Aira Caldera (Japan) detected using DinSAR 23
produced by a ground displacement towards the sensor lineof sight associated with land uplift. Considering the previousresults of other ground deformations studies carried out fromJERS and GPS data on this volcanic complex for the simi-lar time period (Okuyama et al., 2001; Kriswati and Iguchi,2003), we consider that this signal might be consider as apart of a larger ground deformation signal resulting from in-flation processes within the main magma chamber below theAira caldera.
4 Source of crustal deformation
We used a simple approach in order to investigate this hy-pothesis and to quantify the source for crustal deformationslocated at the center of the Aira caldera which may producethe observed signal at Kokubu urban area. Such an approachis facilitated by the low topography in the study area thatmakes possible to use the elastic half space assumption. Thelimited spatial extent of the coherent area, which will onlyrepresent a small segment of the deformation field, makesit impossible to estimate simultaneously the location of thesource and its associated variation. We therefore assume thenthe geometry proposed by Okuyama et al. (2001). Becauseour observations of the deformation field are discontinuous,it is not obvious how to relate the phase of isolated patches.In order to evaluate the ability of the proposed model and ourinversion technique to find a physically acceptable solution,we carried out a synthetic case study. We simulated an in-terferogram of a Mogi source at 10 km depth for a volumechange of 25×106 m3. We added spatially correlated noisewith interferogram noise structure similar to those observedpreviously. Figure 7 shows the small portion of the defor-mation field measured in the three disconnected patches. Vi-sual inspection reveals that no measurements are availablein the two disconnected patches corresponding to Kajiki andKagoshima urban areas. Clearly the corresponding surfacedeformation signal power is below the detection threshold,which can be estimated to be roughly two or three times thelocal noise variance (30–45 mm2). This explains why the ob-servation of the interferogram series does not reveal a cleardeformation pattern over these two disconnected areas. Tomodel the observed deformation, we thus use InSAR phasemeasurements located in the 10×10 km area used previously,where the signal energy clearly exceeds the noise energy.In the inversion, we use all the interferograms which spanmore than one year. We solve for the volume change abso-lute offset of the phase relative to zero deformation. Figure 8shows the best fit model and the residual for the interfero-gram formed by images orbits 20503–10850 spanning twoyears. This model explains 68% of the variance in the data.The variance calculated from the residual (observed – bestmodeled) data is around 15 mm2, which is consistent withthe variance of the interferogram noise (5 to 15 mm2) de-rived from our noise analysis. These values are similar for
Table 1. Inversion solutions for point source models for the subsetof the 15 coherent interferograms which span more than one year.Column 2 gives the time spanned by the interferogram in days. Col-umn 3 gives the inferred volume change obtained for each interfer-ogram. Column 4 and 5 give the variance explained by the modeland the variance calculated from the residual, respectively. Column6 gives the inferred rate of volume change.
Master Slave days V Var.exp Var.res Rate(×106 m3) % mm2
×106 m3 year−1
20503 10850 701 25 68 14 1320503 18365 1226 21 60 14 620503 18866 1261 19 52 16 5.521004 10850 666 30 65 19 1621004 18365 1191 25 55 19 7.521004 18866 1226 18 51 18 5.521505 10850 631 27 57 19 15.521505 18365 1156 25 63 18 821505 18866 1191 19 54 17 623509 10850 491 20 84 3 1523509 18365 1016 18 73 6 6.523509 18866 1051 13 64 5 4.503836 10850 490 21 79 6 15.503836 18365 1015 20 62 12 703836 18866 1050 14 48 10 5
most interferograms (see Table 1). We infer the rate of vol-ume change as function of time assuming a constant sourcedepth, a spherical source in half space and a constant rate ofdeformation during the time period covered in the interfero-gram. Between 1995 and 1998, there was a roughly constantrate of inflation of about 7–13×106 m3/year. This estimationis in good agreement with those obtained by other studiesbased on the analysis of JERS or GPS data spanning similartimes:
i) 12×106 m3/year during December 1991–October 1997(Eto et al., 1998)
ii) 7–16×106 m3/year between 1992–1998 (Okuyama etal., 2001)
iii) 10×106 m3/year in the January 1998–December 1999period (Kriswati and Iguchi, 2003)
Figure 9 shows the cumulative volume change of the defor-mation source during the 1995–2000 period as deduced bythe analysis of continuous GPS stations from the permanentSakurajima monitoring network (Kriswati and Iguchi, 2003).As these series began roughly at the same date than our ERSSAR time series, the results are directly comparable. Our es-timations are generally in agreement with those deduced bythe analysis of GPS data. For instance, the cumulative vol-ume change of the deformation source during the 1995–1999period deduced by both analysis is very similar (20×106 m3).Nevertheless, a significant discrepancy is observed in 1997between both estimations. The value inferred by interferom-etry is higher than the one inferred by GPS data: 25×106 m3
www.electronic-earth.net/2/17/2007/ eEarth, 2, 17–25, 2007

24 D. Remy et al.: Inflation of Aira Caldera (Japan) detected using DinSAR
1995 1996 1997 1998 1999 2000
0
10
20
30
40
Cu
mu
lati
ve v
olu
me (x
106
m3
)
-5
time
Fig. 9. Thick line shows volume inferred from the analysis of thepermanent GPS network (Kriswati and Iguchi, 2003) assuming zerovolume at the beginning of the survey (May 1995). Black circlesshow volume inferred from ERS satellite radar interferometry as-suming zero volume at the time of the first SAR images (June 1995).Using the overlapping interferograms, we estimate the rate of defor-mation between each pair of SAR images with a linear least squareinversion. We plot the result as the cumulative volume within thesource at the time of each SAR image. We assume a constant er-ror for each measurement of 5×10⁶ m3. As both times series be-gan nearly at the same date, they are directly comparable. Notethe agreement between volume inferred from GPS data and thoseinferred from ERS satellite radar interferometry.
and 11×106 m3; respectively. Due to the limited amount ofinterferograms in 1997, we can not discard the possibilitythat an atmospheric signal may be responsible for some ofthe apparent deformation signal observed over Kokubu ur-ban area in SAR image (orbit 10850) acquired on 18 May1995.
5 Conclusion
Despite the limited spatial extent of the coherent areasaround the Aira Caldera, ERS data has been successfullyused in this study for measuring a ground displacement oc-curring on this volcanic complex during a three year period.The interferogram time series analysis performed on the SARcoherent area of Kokubu city indicates that the south of thiscity was uplifted by about 20 mm with respect to the northernpart. Assuming a spherical model located beneath the centerof the Aira Caldera at 10 km depth, we estimate a roughlyconstant annual rate of inflation of about 5–15×106 m3/yearbetween 1995 and 1998. This estimation is in agreement withthose obtained by other studies based on the analysis of JERSor GPS data spanning a similar time period. It is interestingto note that the deformation was observed at least 4 yearsbefore the start of the eruption occurred in 1999.
Ground inflation has been commonly observed before theonset of eruption (Lanary et al., 1998; Mann et al., 2002).Nevertheless, further complication the situation numerousstudies have shown that some substantial ground deformationcan occur due to magma intrusion without eruption (Dvorakand Dzurisin, 1997; Pritchard and Simons, 2002; Langbein,
2003) and others erupt without any deformation being de-tectable (Pritchard and Simons, 2002). For the Sakurajimavolcano, the pattern and rate of surface displacement, whichreveal the depth and the rate of pressure increase within themagma reservoir beneath Aira Caldera seems to be a reliableprecursor of eruption. In this context, future observations atthe Aira Caldera will enable us to learn more details abouta typical deformation characteristic of preeruptive inflationand correlation to actual eruptions.
This study clearly shows that data collected in C band byERS or ENVISAT can give useful constraints on Sakurajimavolcano activity and may provide useful additional informa-tion to other geodetic measurements to better understand thedynamical processes below the Aira caldera. Although theERS interferograms exhibit a lower level of coherence thanJERS interferograms, the accuracy of the orbital state vectorsprovided by Delft Institute and the highest sensibility of theC-band to ground deformation enables the detection of subtlecrustal deformation signals, such as the one evidenced here
Finally, this study shows that urban areas located aroundthe Sakurjaima volcano may be considered as excellent sitesto apply methods more sophisticated than the one used inthis study such as those based on InSAR persistent scatter-ers (Ferretti et al., 2001; Hooper et al., 2004) for analyzingcrustal deformation related to Sakurajima volcano activity.
Acknowledgements.We thank N. Pourthie and H. Vadon for tech-nical help in the SAR data processing with DIAPASON software.We are grateful to the two anonymous reviewers whose commentshelped us to improve significantly our manuscript. Discussionsand corrections of the English by M. Falvey and J. Nordhoff weremuch appreciated. The ERS images processed in this study wereobtained through ESA research project. This study was supportedby IRD (Dept. DME).
Edited by: T. Van Dam
References
Aramaki, S.: Formation of the Aira Caldera, Southern Kyushu,22,000 Years ago, J. Geophys. Res., 89(B10), 8485–8501, 1984.
Chen, C. W. and Zebker, H. A.: Phase unwrapping for large SAR in-terferograms: Statistical segmentation and generalized networkmodels, IEEE Transactions on Geoscience and Remote Sensing,40, 1709–1719, 2002.
CNES: Philosophie et mode d’emploi de la chaıne logicielleinterferometrique DIAPASON (Version 1), Toulouse, France,1996.
Dvorak, J. J. and Dzurisin, D.: Volcano geodesy: the search formagma reservoirs and the formation of eruptive vents, Rev. Geo-phys., 35, 343–384, 1997.
Eto, T., Takayama, T., Yamamoto, K., Hendrasto, M., Miki, D.,Sonoda, T., Kimata, F., Miyajima, R., Matsushima, T., Uchida,K., Yakiwara, H., and Kokabayasi, K.: On the result of level-ing surveys around Sakurajima volcano during December to Oc-tober 1996, Report of the 9 th joint Observation of SakurajimaVolcano, 1998.
eEarth, 2, 17–25, 2007 www.electronic-earth.net/2/17/2007/

D. Remy et al.: Inflation of Aira Caldera (Japan) detected using DinSAR 25
Ferretti, A., Prati, C., and Rocca, F.: Permanent Scattered in SARinterferometry, IEEE Trans. Geosci. Remote Sens, 39(1), 8–20,2001.
Goldstein, R. M., Zebker, H. A., and Werner, C. L.: Sattelite radarinterferometry : two dimensional phase unwrapping, Radio Sci.,23, 713–720, 1988.
Hooper, A., Zebker, H. A., Segall, P., and Kampes, B.: A newmethod for measuring deformation on volcanoes and other nat-ural terrains using INSAR persitent scatterers, Geophys. Res.Lett., 31(L23611), doi:10.1029/2004GL021737, 2004.
Ishihara, K.: Sakurajima activity for the period from 1995 to 1998,IUGG 22nd General Assembly, Birmingham, UK, 1999.
Jonsson, S.: Modeling volcano and earthquake deformation fromsatellite radar interferometric observations, PhD thesis, Stand-ford, 174 pp, 2002.
Kriswati, E. and Iguchi, M.: Inflation of the Aira Caldera prior tothe 1999 Eruptive Activity at Sakurajima Volcano detected byGPS network in South Kyushu, Disaster Prevention Research In-stitute Report, 46, 817–825, 2003.
Lanary, R., Lundgren, P., and Sansosti, E.: Dynamic deformationof Etna volcano observed by satellite radar interferometry, Geo-phys. Res. Lett., 25, 1541–1544, 1998.
Langbein, J. O.: Deformation of the Long Valley Caldera, Califor-nia: inferences from measurements from 1988 to 2001, Journalof Volcanology and Geothermal Research, 127(3-4), 247–267,2003.
Lundgren, P. and Usai, S.: Modeling surface deformation observedwith synthetic aperture radar interferometry at Campi Flegreicaldera, J. Geophys. Res., 106, 19 355–19 366, 2001.
Mann, C. D., Freymueller, J., and Lu, Z.: Deformation associatedwith the 1997 eruptio of Okmok volcano, Alaska, J. Geophys.Res., 107(B4), doi:10.1029/2001JB000163, 2002.
Massonnet, D. and Sigmundsson, F.: Remote sensing of volcano de-formation by radar interferometry from various satellites, in: Re-mote Sensing of Active Volcanoes, edited by: Mouginis-Mark,P., Crisp, J. A., and Fink, J. H., Geophys. Monogr., pp. 207–221,2000.
Matumuto, T.: The four gigantic caldera volcanoes of Kyusyu,Japanese Journal of Geology and Geography, 19, 1–57, 1943.
Mogi, K.: Relations between the eruptions of various volcanoesand the deformation of the ground surface around them, BulletinEarthquake Research Institute of Tokyo, 36, 99–134, 1958.
Okuyama, S., Takemoto, S., Murakami, M., Tobita, M., Fijuwara,S., Nakagawa, H., and Yarai, H.: Detection of Crustal Defor-mation in Sakurajima by means of L-band SAR Interferome-try based on JERS-1 SAR Images During 1992–1998, INSARWorkshop, Tokyo, Japan, 2001.
Omori, F.: The Sakurajima eruptions and earthquakes, Bull. Vol-canol. Soc. Jpn, 8, 1–525, 1916.
Pritchard, M. E. and Simons, M.: A satellite geodetic survey oflarge scale deformation of volcanic centres in the central Andes,Nature, 418, 167–170, 2002.
Remy, D., Bonvalot, S., Briole, P., and Murakami, M.: Accuratemeasurement of tropospheric effects in volcanic area from SARinterferometry data: Application to Sakurajima volcano (Japan),Earth Planet. Sci. Lett., 213(3-4), 299–310, 2003.
Schmidt, D. A. and Burgmann, R.: Time-dependant land uplift andsubsidence in the Santa Clara valley, California, from a large in-terferometric synthetic aperture radar data set, J. Geophys. Res.,108, 2416, doi:10.1029/2202JB002267, 2003.
Sharroo, R., Visser, P. N. A. M., and Met, G. J.: Precise orbits de-termination and gravity field improvement for the ERS satellites,J. Geophys. Res., 103(C), 8113–8127, 1998.
SmithsonianInstitution: Bull. Global Volcanism Network, 24(5),1999a.
SmithsonianInstitution: Bull. Global Volcanism Network, 24(8),1999b.
SmithsonianInstitution: Bull. Global Volcanism Network, 25(2),2000.
Yokoyama, I.: A model for the crustal deformation around volca-noes, J. Phys. Earth, 19, 199–207, 1971.
Zebker, H., Amelung, F., and Jonnson, S.: Remote Sensing of Vol-cano Surface and Internal Processes Using Radar Interferometry,in: Remote Sensing of Active Volcanoes, edited by: Mouginis-Mark, P., Crisp, J. A., and Fink, J. H., Geophys. Monogr, pp.179–205, 2000.
www.electronic-earth.net/2/17/2007/ eEarth, 2, 17–25, 2007