Inhibition of a ribosome-inactivating ribonuclease: the crystal structure of the cytotoxic domain of...
12
Inhibition of a ribosome-inactivating ribonuclease: the crystal structure of the cytotoxic domain of colicin E3 in complex with its immunity protein Stephen Carr 1 , Daniel Walker 2 , Richard James 2 , Colin Kleanthous 2 and Andrew M Hemmings 1,2 * Background: The cytotoxicity of most ribonuclease E colicins towards Escherichia coli arises from their ability to specifically cleave between bases 1493 and 1494 of 16S ribosomal RNA. This activity is carried by the C-terminal domain of the colicin, an activity which if left unneutralised would lead to destruction of the producing cell. To combat this the host E. coli cell produces an inhibitor protein, the immunity protein, which forms a complex with the ribonuclease domain effectively suppressing its activity. Results: We have solved the crystal structure of the cytotoxic domain of the ribonuclease colicin E3 in complex with its immunity protein, Im3. The structure of the ribonuclease domain, the first of its class, reveals a highly twisted central β-sheet elaborated with a short N-terminal helix, the residues of which form a well-packed interface with the immunity protein. Conclusions: The structure of the ribonuclease domain of colicin E3 is novel and forms an interface with its inhibitor which is significantly different in character to that reported for the DNase colicin complexes with their immunity proteins. The structure also gives insight into the mode of action of this class of enzymatic colicins by allowing the identification of potentially catalytic residues. This in turn reveals that the inhibitor does not bind at the active site but rather at an adjacent site, leaving the catalytic centre exposed in a fashion similar to that observed for the DNase colicins. Thus, E. coli appears to have evolved similar methods for ensuring efficient inhibition of the potentially destructive effects of the two classes of enzymatic colicins. Introduction Colicins are plasmid-encoded protein antibiotics pro- duced by strains of Escherichia coli and closely related bac- teria. They are classified into groups corresponding to the cell-surface receptor to which they bind; for example, the E colicins bind to the product of the chromosomal btuB gene, a receptor involved in the high-affinity transport of vitamin B 12 [1]. Killing of E. coli cells by E colicins occurs in three stages: receptor binding, translocation and cyto- toxicity. E colicin proteins consist of three domains, each of which has been implicated in one of these stages. The central (R) domain is responsible for the binding of the colicin to the btuB receptor, whereas the subsequent translocation across the cytoplasmic membrane involves the N-terminal (T) domain of the toxin interacting with various components of the E. coli Tol translocation system. The mechanism of cytotoxicity of E colicins results from either cytoplasmic membrane depolarisation (colicin E1) [2], a non-specific endonuclease activity that degrades DNA (colicins E2, E7, E8 and E9) [3–5] or a ribonuclease activity that cleaves specific transfer RNAs (colicin E5) [6] or16S ribosomal RNA (colicins E3, E4 and E6) [7,8]. Colicin E3 is a 58 kDa RNase colicin which kills sensitive cells by a process of ribosome inactivation. The cytotoxic activity is associated with the 11 kDa C-terminal domain of the colicin (96 amino acids) which can be isolated as a folded, active protein fragment [9]. The mode of action in vivo involves a nucleolytic break of E. coli 16S ribosomal RNA. The same cleavage has been observed in vitro by incubation of colicin E3 with isolated ribosomes [10]. The cleavage is specific and occurs between bases 1493 and 1494, 48 nucleotides from the 3′-end of the 16S RNA [11] and results in total inactivation of peptide synthesis. Adenine 1493 is located within the ribosomal A-site and is protected from dimethyl sulphate modification by mRNA- dependent tRNA binding. This suggests that this residue is in the immediate vicinity of the codon–anticodon complex formed during peptide synthesis [12]. Addresses: Colicin Research Group, 1 School of Chemical Sciences, University of East Anglia, Norwich NR4 7TJ, UK and 2 School of Biological Sciences, University of East Anglia, Norwich NR4 7TJ, UK. *Corresponding author. E-mail: [email protected] Key words: crystal structure, immunity protein, ribonuclease colicin, ribosome inactivation Received: 18 April 2000 Revisions requested: 21 June 2000 Revisions received: 11 July 2000 Accepted: 12 July 2000 Published: 15 August 2000 Structure 2000, 8:949–960 0969-2126/00/$ – see front matter © 2000 Elsevier Science Ltd. All rights reserved. Research Article 949
-
Upload
stephen-carr -
Category
Documents
-
view
212 -
download
0
Transcript of Inhibition of a ribosome-inactivating ribonuclease: the crystal structure of the cytotoxic domain of...

Inhibition of a ribosome-inactivating ribonuclease: the crystalstructure of the cytotoxic domain of colicin E3 in complex withits immunity proteinStephen Carr1, Daniel Walker2, Richard James2, Colin Kleanthous2
and Andrew M Hemmings1,2*
Background: The cytotoxicity of most ribonuclease E colicins towardsEscherichia coli arises from their ability to specifically cleave between bases1493 and 1494 of 16S ribosomal RNA. This activity is carried bythe C-terminal domain of the colicin, an activity which if left unneutralisedwould lead to destruction of the producing cell. To combat this the hostE. coli cell produces an inhibitor protein, the immunity protein, which formsa complex with the ribonuclease domain effectively suppressing its activity.
Results: We have solved the crystal structure of the cytotoxic domain of theribonuclease colicin E3 in complex with its immunity protein, Im3. The structureof the ribonuclease domain, the first of its class, reveals a highly twisted centralβ-sheet elaborated with a short N-terminal helix, the residues of which form awell-packed interface with the immunity protein.
Conclusions: The structure of the ribonuclease domain of colicin E3 isnovel and forms an interface with its inhibitor which is significantly differentin character to that reported for the DNase colicin complexes with theirimmunity proteins. The structure also gives insight into the mode of actionof this class of enzymatic colicins by allowing the identification ofpotentially catalytic residues. This in turn reveals that the inhibitor does notbind at the active site but rather at an adjacent site, leaving the catalyticcentre exposed in a fashion similar to that observed for the DNase colicins.Thus, E. coli appears to have evolved similar methods for ensuring efficientinhibition of the potentially destructive effects of the two classes ofenzymatic colicins.
IntroductionColicins are plasmid-encoded protein antibiotics pro-duced by strains of Escherichia coli and closely related bac-teria. They are classified into groups corresponding to thecell-surface receptor to which they bind; for example, theE colicins bind to the product of the chromosomal btuBgene, a receptor involved in the high-affinity transport ofvitamin B12 [1]. Killing of E. coli cells by E colicins occursin three stages: receptor binding, translocation and cyto-toxicity. E colicin proteins consist of three domains, eachof which has been implicated in one of these stages. Thecentral (R) domain is responsible for the binding of thecolicin to the btuB receptor, whereas the subsequenttranslocation across the cytoplasmic membrane involvesthe N-terminal (T) domain of the toxin interacting withvarious components of the E. coli Tol translocationsystem. The mechanism of cytotoxicity of E colicinsresults from either cytoplasmic membrane depolarisation(colicin E1) [2], a non-specific endonuclease activity thatdegrades DNA (colicins E2, E7, E8 and E9) [3–5] or a
ribonuclease activity that cleaves specific transfer RNAs(colicin E5) [6] or16S ribosomal RNA (colicins E3, E4and E6) [7,8].
Colicin E3 is a 58 kDa RNase colicin which kills sensitivecells by a process of ribosome inactivation. The cytotoxicactivity is associated with the 11 kDa C-terminal domainof the colicin (96 amino acids) which can be isolated as afolded, active protein fragment [9]. The mode of actionin vivo involves a nucleolytic break of E. coli 16S ribosomalRNA. The same cleavage has been observed in vitro byincubation of colicin E3 with isolated ribosomes [10]. Thecleavage is specific and occurs between bases 1493 and1494, 48 nucleotides from the 3′-end of the 16S RNA [11]and results in total inactivation of peptide synthesis.Adenine 1493 is located within the ribosomal A-site and isprotected from dimethyl sulphate modification by mRNA-dependent tRNA binding. This suggests that this residueis in the immediate vicinity of the codon–anticodoncomplex formed during peptide synthesis [12].
Addresses: Colicin Research Group, 1School ofChemical Sciences, University of East Anglia,Norwich NR4 7TJ, UK and 2School of BiologicalSciences, University of East Anglia, NorwichNR4 7TJ, UK.
*Corresponding author. E-mail: [email protected]
Key words: crystal structure, immunity protein,ribonuclease colicin, ribosome inactivation
Received: 18 April 2000Revisions requested: 21 June 2000Revisions received: 11 July 2000Accepted: 12 July 2000
Published: 15 August 2000
Structure 2000, 8:949–960
0969-2126/00/$ – see front matter © 2000 Elsevier Science Ltd. All rights reserved.
Research Article 949

The resistance of the producing bacteria to the toxiceffects of colicin E3 is afforded by the presence of the9.8 kDa immunity protein (Im3). This binds to the C-ter-minal domain of colicin E3 in a 1:1 stoichiometry whichrenders the toxin completely inactive [9]. Mutagenesis ofIm3 reveals that Cys47 is the most important specificitydetermining residue in the colicin E3–Im3 interaction[13]. Asp15 and Glu19 were also implicated in colicinspecificity but mutation of these has much less effect oncolicin binding. Although no structure for an RNasecolicin exists, the structure of Im3 has been reportedrecently [14,15]. This revealed a crystallographic dimerwith the monomer consisting of a four-stranded antiparal-lel β sheet with two short helices packing against one face.Residues Cys47, Asp15 and Glu19 all fall on the sameinner face of the β sheet in the immunity protein dimerand so it was proposed that this is the site of interactionwith the toxin.
In contrast to the RNase colicins, the interaction of DNasecolicins with their immunity proteins has been well-studied[16]. The association between the colicin E9 DNasedomain and Im9 has been extensively characterised anddisplays one of the tightest protein–protein interactions yetreported (Kd = 10–16 M) [17]. To date, no binding affinitystudies have been performed for the RNase colicinsalthough a dissociation constant of a similar magnitude isexpected as the E3–Im3 complex can only be dissociatedunder strongly denaturing conditions [18]. The amino acidsequence at the interface between colicin E9 and Im9 hasbeen shown to contain two distinct regions: the first is con-served and constitutes a binding energy hot-spot whereasthe second is variable and determines specificity [19,20].The cytotoxic domain of the RNase colicins displays amuch greater sequence conservation (80%–90% as shownin Figure 1) than that observed for the DNase colicinsendonuclease domain (70%–80%). This implies that immu-nity binding specificity is governed by fewer residues thanfor DNase colicin–immunity protein complexes.
The cytotoxic domains of the DNase colicins E7 and E9in complex with their respective cognate immunity pro-teins have been structurally characterised [21,22]. However,no structural data is available for the enzymatic RNase col-icins, although the crystallisation of colicin E3 in complexwith its immunity protein has been reported [23]. Here wereport the crystallographic structure determination ofcolicin E3 RNase domain bound to Im3 with a view tounderstanding its ribosome-inactivating properties and itsinhibition by immunity protein binding.
Results and discussionCrystal structure of the colicin E3 RNase–Im3 complexCrystals of the E3–Im3 complex were prepared which dif-fracted to 2.4 Å resolution [24]. A selenomethionine deriva-tive was prepared and the structure was solved by seleniummultiwavelength anomalous diffraction (Se-MAD) (Tables 1and 2). The refined structure contains residues 1–96 of theRNase domain (corresponding to residues 455–551 ofcolicin E3), residues 1′ to 84′ of the immunity protein and177 water molecules (Figure 2a). Eight residues (aminoacids 447–454 of colicin E3) present in the gene constructare disordered and not visible in the electron-density maps.The model of the E3–Im3 complex displayed in Figure 2reveals that both proteins contain predominantly β structurewith only a limited occurrence of α helices. The molecularinterface between E3 and Im3 is formed between strands 1and 2 of the ribonuclease packing across the exposed face ofthe β sheet in Im3, with the N-terminal helix of the ribo-nuclease domain wrapping across the top of the immunityprotein. This leads to an arrangement within the complexwhere the β sheet in E3 lies perpendicular to that in Im3.This type of packing is markedly different to that observedin other protein–protein complexes involving β sheetswhere complexation occurs by the sheets packing edge toedge as found, for example, in the immunoglobulin–proteinG complex (Protein Data Bank [PDB] accession code 1igc[25]) or the TolA N-terminal domain–g3p protein complex(accession code 1tol [26]).
950 Structure 2000, Vol 8 No 9
Figure 1
Sequence alignment of (a) the RNaseE colicin cytotoxic domains and (b) immunityproteins. The boxed residues represent theregions of each protein involved in binding.Non-conserved residues are shown in redand potential catalytic residues aredisplayed in green.
Im4ImDF13Im6Im3
G L K L N L T W F D K K T E D F K G E E Y S K D F G D D G S V I E S L G M P L K D N I N N G G F D V K K SG L K L H I H W F D K K T E E F K G G E Y S K D F G D D G S V I E S L G M P L K D N I N N G W F D V E K PG L K L H I N W F D K R T E E F K G G E Y S K D F G D D G S V I E R L G M P F K D N I N N G W F D V I A EG L K L D L T W F D K S T E D F K G E E Y S K D F G D D G S V M E S L G V P F K D N V N N G C F D V I A E1 10 20 30 40 50
Im4ImDF13Im6Im3
W V P L L Q P Y F K N K I E V D K Y W Y Q I S F D Y R D G N WW V S I L Q P H F K N V I D I S K F D Y F V S F V Y R D G N WW V P L L Q P Y F N H Q I D I S D N E Y F V S F D Y R D G D WW V P L L Q P Y F N H Q I D I S D N E Y F V S F D Y R D G D W
60 70 80
Colicin E4Cloacin DF13Colicin E6Colicin E3
G V K D Y G H D Y H P A P K T E E I K G L G E L K K A P K K T P K Q G G G G R R D R W I G D K G R K I Y EG T K D Y G H D Y F P D P K T E D I K G L G E L K E G K P K T P K Q G G G G K R A R W Y G D K K R K I Y EG V K D Y G H D Y H P D P K T E D I K G L G E L K E G K P K T P K Q G G G G K R A R W Y G D K G R K I Y EG F K D Y G H D Y H P A P K T E N I K G L G D L K P G I P K T P K Q N G G G K R K R W T G D K G R K I Y E1 10 20 30 40 50
Colicin E4Cloacin DF13Colicin E6Colicin E3
W D S Q H G E L E G Y R A S D G E H I G A F D P K T G K Q I K G P D P K G R N I K K Y LW D S Q H G E L E G Y R A S D G E H L G A F D P K T G K Q V K G P D P K - R N I K K Y LW D S Q H G E L E G Y R A S D G Q H L G S F E P K T G N Q L K G P D P K - R N I K K Y LW D S Q H G E L E G Y R A S D G Q H L G S F D P K T G N Q L K G P D P K - R N I K K Y L
60 70 80 90
(a)
(b)
Structure
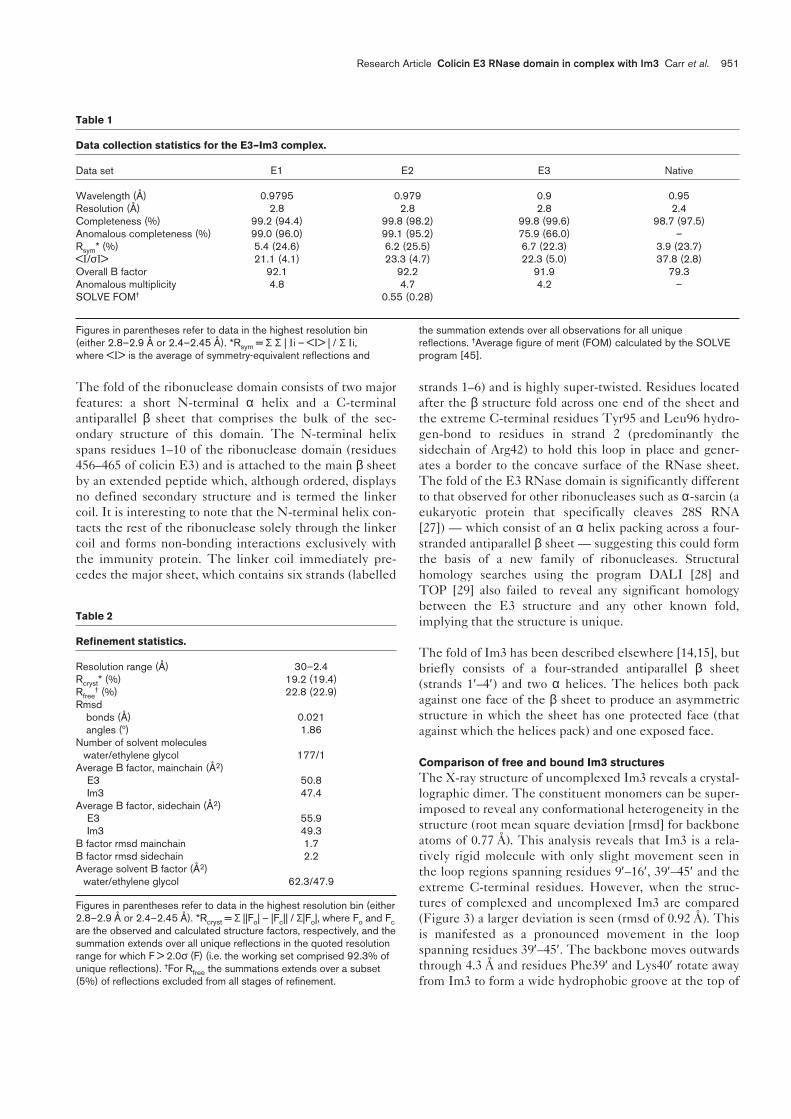
The fold of the ribonuclease domain consists of two majorfeatures: a short N-terminal α helix and a C-terminalantiparallel β sheet that comprises the bulk of the sec-ondary structure of this domain. The N-terminal helixspans residues 1–10 of the ribonuclease domain (residues456–465 of colicin E3) and is attached to the main β sheetby an extended peptide which, although ordered, displaysno defined secondary structure and is termed the linkercoil. It is interesting to note that the N-terminal helix con-tacts the rest of the ribonuclease solely through the linkercoil and forms non-bonding interactions exclusively withthe immunity protein. The linker coil immediately pre-cedes the major sheet, which contains six strands (labelled
strands 1–6) and is highly super-twisted. Residues locatedafter the β structure fold across one end of the sheet andthe extreme C-terminal residues Tyr95 and Leu96 hydro-gen-bond to residues in strand 2 (predominantly thesidechain of Arg42) to hold this loop in place and gener-ates a border to the concave surface of the RNase sheet.The fold of the E3 RNase domain is significantly differentto that observed for other ribonucleases such as α-sarcin (aeukaryotic protein that specifically cleaves 28S RNA[27]) — which consist of an α helix packing across a four-stranded antiparallel β sheet — suggesting this could formthe basis of a new family of ribonucleases. Structuralhomology searches using the program DALI [28] andTOP [29] also failed to reveal any significant homologybetween the E3 structure and any other known fold,implying that the structure is unique.
The fold of Im3 has been described elsewhere [14,15], butbriefly consists of a four-stranded antiparallel β sheet(strands 1′–4′) and two α helices. The helices both packagainst one face of the β sheet to produce an asymmetricstructure in which the sheet has one protected face (thatagainst which the helices pack) and one exposed face.
Comparison of free and bound Im3 structuresThe X-ray structure of uncomplexed Im3 reveals a crystal-lographic dimer. The constituent monomers can be super-imposed to reveal any conformational heterogeneity in thestructure (root mean square deviation [rmsd] for backboneatoms of 0.77 Å). This analysis reveals that Im3 is a rela-tively rigid molecule with only slight movement seen inthe loop regions spanning residues 9′–16′, 39′–45′ and theextreme C-terminal residues. However, when the struc-tures of complexed and uncomplexed Im3 are compared(Figure 3) a larger deviation is seen (rmsd of 0.92 Å). Thisis manifested as a pronounced movement in the loopspanning residues 39′–45′. The backbone moves outwardsthrough 4.3 Å and residues Phe39′ and Lys40′ rotate awayfrom Im3 to form a wide hydrophobic groove at the top of
Research Article Colicin E3 RNase domain in complex with Im3 Carr et al. 951
Table 1
Data collection statistics for the E3–Im3 complex.
Data set E1 E2 E3 Native
Wavelength (Å) 0.9795 0.979 0.9 0.95Resolution (Å) 2.8 2.8 2.8 2.4Completeness (%) 99.2 (94.4) 99.8 (98.2) 99.8 (99.6) 98.7 (97.5)Anomalous completeness (%) 99.0 (96.0) 99.1 (95.2) 75.9 (66.0) –Rsym* (%) 5.4 (24.6) 6.2 (25.5) 6.7 (22.3) 3.9 (23.7)<I/σI> 21.1 (4.1) 23.3 (4.7) 22.3 (5.0) 37.8 (2.8)Overall B factor 92.1 92.2 91.9 79.3Anomalous multiplicity 4.8 4.7 4.2 –SOLVE FOM† 0.55 (0.28)
Figures in parentheses refer to data in the highest resolution bin(either 2.8–2.9 Å or 2.4–2.45 Å). *Rsym = Σ Σ | Ii – <I> | / Σ Ii,where <I> is the average of symmetry-equivalent reflections and
the summation extends over all observations for all uniquereflections. †Average figure of merit (FOM) calculated by the SOLVEprogram [45].
Table 2
Refinement statistics.
Resolution range (Å) 30–2.4Rcryst* (%) 19.2 (19.4)Rfree
† (%) 22.8 (22.9)Rmsd
bonds (Å) 0.021angles (º) 1.86
Number of solvent moleculeswater/ethylene glycol 177/1
Average B factor, mainchain (Å2)E3 50.8Im3 47.4
Average B factor, sidechain (Å2)E3 55.9Im3 49.3
B factor rmsd mainchain 1.7B factor rmsd sidechain 2.2Average solvent B factor (Å2)
water/ethylene glycol 62.3/47.9
Figures in parentheses refer to data in the highest resolution bin (either2.8–2.9 Å or 2.4–2.45 Å). *Rcryst = Σ ||Fo| – |Fc|| / Σ|Fo|, where Fo and Fcare the observed and calculated structure factors, respectively, and thesummation extends over all unique reflections in the quoted resolutionrange for which F > 2.0σ (F) (i.e. the working set comprised 92.3% ofunique reflections). †For Rfree the summations extends over a subset(5%) of reflections excluded from all stages of refinement.
the immunity protein which interacts extensively with theN-terminal helix of the RNase domain. The rest of thebackbone is essentially unperturbed on complexation butsidechains Phe9′, Phe16′ and Phe74′ all rotate significantlyowing to their specific interaction with residues in E3.
The protein–protein interface The exposed face of the four-stranded β sheet in Im3 isthe major site of interaction with the E3 RNase domain.Residues in the groove formed by the movement of loop
residues 39′–45′ also make a number of contacts with theRNase. When mapped onto the primary sequence theseresidues form four discrete regions located throughout theentire length of the protein. In contrast to this the residuesinvolved in binding in the RNase domain all fall withinthe N-terminal half of the protein (the last residueinvolved in binding is Lys41) and consist of just two elon-gated binding regions (Figure 1). Structurally, the residuesin the RNase domain involved in binding fall on the lowerface of the short N-terminal helix, the linker coil and the
952 Structure 2000, Vol 8 No 9
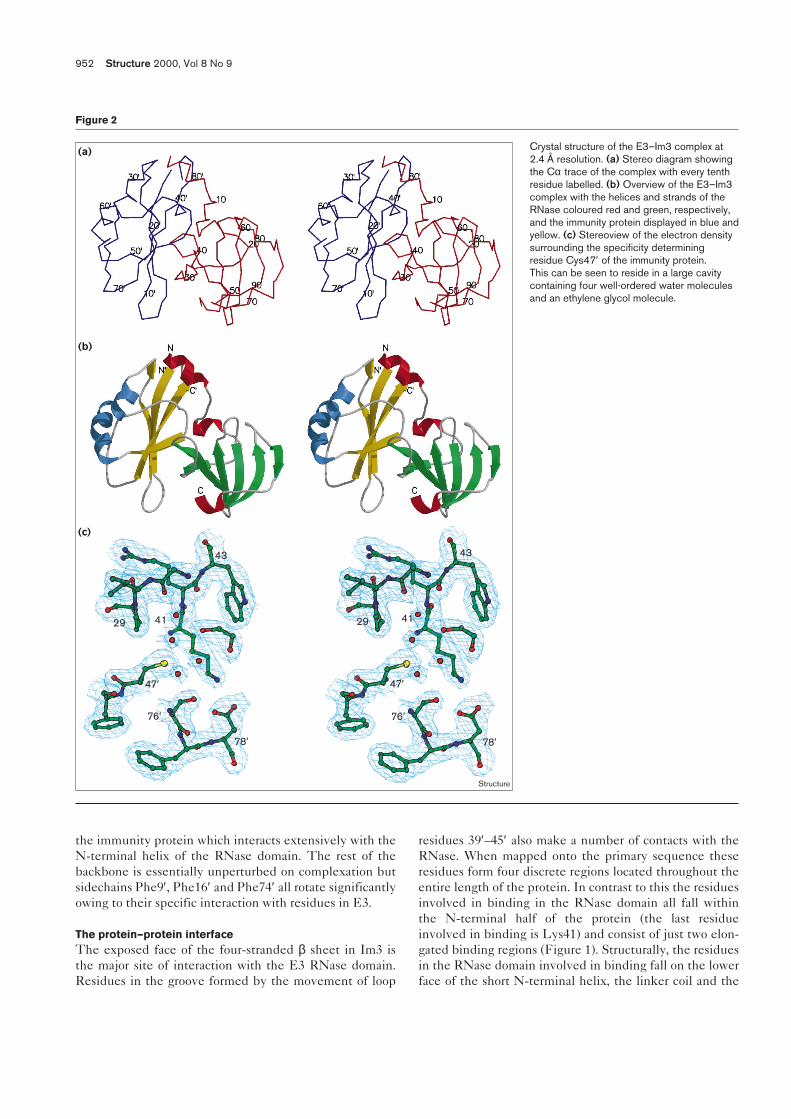
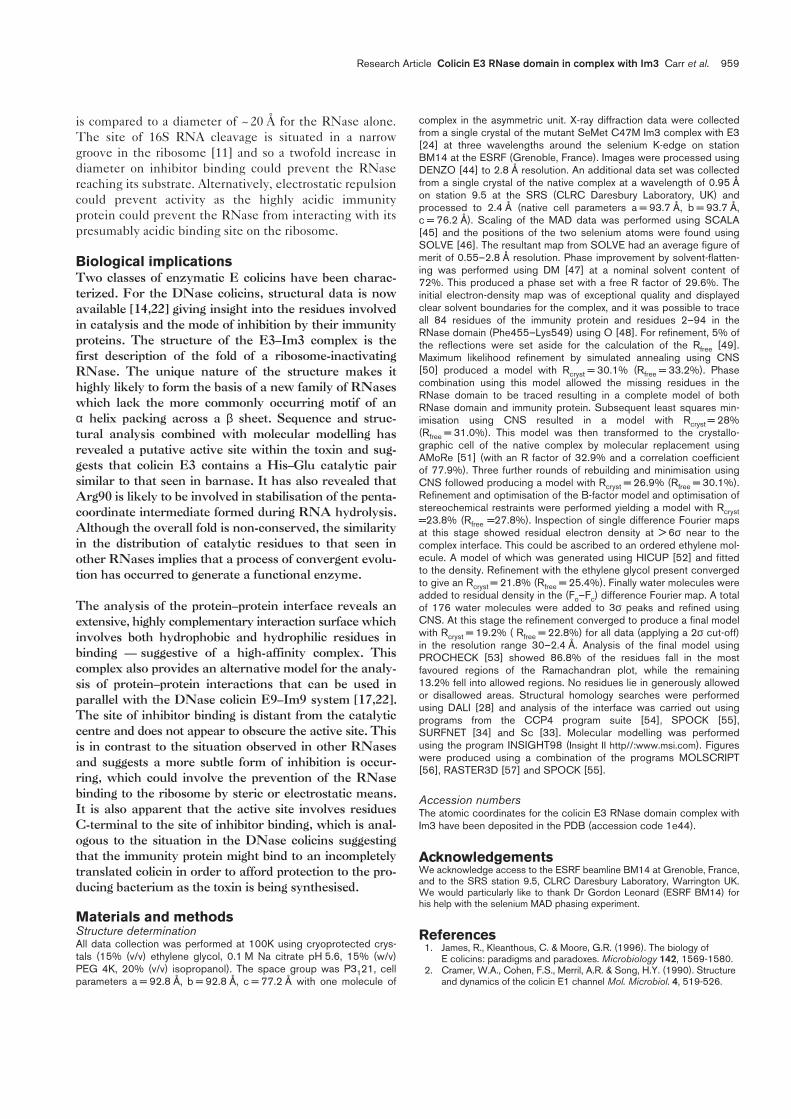
Figure 2
Crystal structure of the E3–Im3 complex at2.4 Å resolution. (a) Stereo diagram showingthe Cα trace of the complex with every tenthresidue labelled. (b) Overview of the E3–Im3complex with the helices and strands of theRNase coloured red and green, respectively,and the immunity protein displayed in blue andyellow. (c) Stereoview of the electron densitysurrounding the specificity determiningresidue Cys47′ of the immunity protein.This can be seen to reside in a large cavitycontaining four well-ordered water moleculesand an ethylene glycol molecule.
41
78′
47′
43
29
76′
41
78′
47′
29
43
76′
Structure
(c)
(b)
(a)

first two strands of the β sheet. The solvent-accessibleareas calculated for each of the proteins when separatedare 6631 Å2 and 5172 Å2 for E3 and Im3, respectively. Oncomplexation the total accessible surface area buried is2554 Å2 corresponding to the loss of 1374 Å2 for E3 and1180 Å2 for Im3 (Figure 4a). This is a much greater loss ofsurface area compared to that occurring on complexationof barnase and barstar (1590 Å2) [30] or either of theDNase colicin immunity complexes analysed to date(1575 Å2 for colicin E9–Im9 and 1473 Å2 for colicinE7–Im7) [21,31].
The molecular surfaces at the interface colour-coded byelectrostatic potential are shown in Figure 4b. The inter-face is highly charged and also displays charge comple-mentarity with the basic RNase domain and an acidicimmunity protein. The most acidic surface areas in Im3,located in the immediate vicinity of Asp5′ and Asp78′,interact with the most prominent basic area of E3, centredaround Lys41. These electrostatic interactions — due totheir long range nature — could be involved in the elec-trostatic steering and pre-orientation of each moleculebefore binding, as well as contributing significantly to theinteraction energy on complexation. Figure 4c shows thehydrophobic residues present at the interface. Thisclearly indicates the presence of a hydrophobic patchdirectly beneath the most acidic and basic regions of E3and Im3, respectively. In addition, a significant hydropho-bic pocket is seen in the open groove at the top of Im3,this complements the hydrophobic residues present in theN-terminal helix of E3. The organisation of hydrophobicand hydrophilic interactions across the open groove istypical in that the hydrophobic pocket is surrounded bypolar residues [32]. However, in the main body of theinterface this distribution is much less apparent as thehydrophobic patch is at the base of the interface andflanked by a single polar interaction (Im3 Glu14′–E3Lys30) on one side and an extensive hydrophilic patchon the other.
The surface complementarity index was calculated usingthe program Sc [33] and a value of 0.7 was obtained. Thisdegree of complementarity is at the upper end of a scalebetween 0 (no complementarity) and 1 (perfect comple-mentarity) and is remarkable considering the area buriedas other proteins with similar values generally have smallerinterfaces. The complementarity index has the same valueas that obtained for the barnase–barstar complex and beinghigh suggests highly complementary surfaces — implyingthe presence of few gaps at the interface. This was con-firmed by calculation of the interfacial gap volume(SURFNET [34]) revealing a total gap volume of 3398 Å3
which, when normalised to give the gap volume index,produces a value of 1.34 Å. This is significantly lower thanthe average calculated for ten test enzyme–inhibitor com-plexes, which gave a value of 2.2 Å [35].
Analysis of the surface area buried on complexation at theamino acid level identifies the residues participating inbinding. In Im3, residues Glu14′ (51 Å2), Phe16′ (64 Å2),Phe39′ (38 Å2), Asp41′ (78 Å2), Asn44′ (85 Å2), Asn45′(84 Å2), Cys47′ (74 Å2), Tyr79′ (67 Å2), Arg80′ (66 Å2) andAsp81′ (50 Å2) are most deeply buried (loss of > 50 Å2) atthe interface reiterating the presence of both hydrophobicand hydrophilic interaction at the interface. In E3 themost deeply buried residues at the interface are: Phe2(168 Å2), Lys3 (64 Å2), Tyr5 (74 Å2), Tyr9 (82 Å2), Pro11(75 Å2), Lys14 (80 Å2), Pro26 (79 Å2), Ile28 (115 Å2), Pro29(51 Å2), Lys39 (72 Å2) and Lys41 (93 Å2). The hydropho-bic residues Phe2 and Ile28 can be seen to contributeextensively to the overall buried surface area.
There are a total of 15 direct hydrogen bonds with distancesless than 3.2 Å at the E3–Im3 interface, a comparablenumber to that seen in the DNase colicin complexesE7–Im7 and E9–Im9, both of which contain 12 hydrogenbonds. Considering the size of the interfaces, however, thedensity of hydrogen bonds is significantly lower in E3–Im3than observed elsewhere. On average, 1.37 hydrogen bondsare formed per 100 Å2 of interface in ten enzyme–inhibitorcomplexes [35]. However, in the E3–Im3 complex only1.17 hydrogen bonds are identified per 100 Å2 of interfacialarea. The sparse nature of hydrogen bonding arisesbecause, although a large surface area is buried, the
Research Article Colicin E3 RNase domain in complex with Im3 Carr et al. 953
Figure 3
Schematic representation of the superposition of the fold of Im3 fromthe Em3–Im3 complex with that of free Im3. The uncomplexed proteinis shown in green and the complexed protein in red.

954 Structure 2000, Vol 8 No 9
Figure 4
Surface representations of each componentof the E3–Im3 complex oriented to display theinteracting surfaces. In each case E3 isshown on the left and Im3 on the right.(a) The buried residues are colouredaccording to the amount of accessible arealost on complexation, with yellowcorresponding to the least (0–29 Å2),followed by blue (30–60 Å2) and red(> 60 Å2). The highlighted residues are thosewhich undergo the greatest loss of surfacearea on complexation. (b) The interfacecoloured by electrostatic potential; red areascorrespond to acidic residues and blueregions to basic residues. (c) The hydrophobicresidues buried on complexation arehighlighted in green. (d) The conservation ofresidues at the interface colour-coded on thebasis of the sequence alignment in Figure 1.The residues coloured yellow are totallyconserved, whereas blue residues displaysome mutational variability, and red regionscorrespond to non-conserved residues. Thelabelled residues correspond to those thoughtto be involved in specificity.

hydrophilic interactions are localised to the upper regionof the interface while the rest of the buried surface dis-plays entirely hydrophobic characteristics (Figure 4c). Ofthe 15 hydrogen bonds, five involve both charged donorand acceptor groups and four others involve one chargedgroup, which should make significant contributions to thefree energy change of dissociation [36]. Thereforealthough the E3–Im3 complex contains a similar numberof hydrogen bonds to the DNase colicin complexes and thebarnase–barstar complex (containing 14 direct hydrogenbonds) [30] their density at the interface is lower, thusimplying hydrophobic burial may be more intimately linkedwith the dissociation energy than in other nuclease–inhibitorcomplexes. Within the hydrophobic areas the majority ofthe interactions are observed to be either the stacking ofaromatic rings or the interaction of aromatic rings withlarge aliphatic residues such as isoleucine. Studies ofprotein–inhibitor complexes have revealed that the largestvalues of buried accessible surface area are associated with asignificant conformational change in one of the two proteinson complexation. As shown above, the structure of Im3 isnot significantly altered on complexation and until thestructure of the free RNase is determined we should not neglect the possibility that significant changes in the
structure of the RNase domain may be contributing to thelarge buried surface area of the interface.
The direct interactions at the molecular interface can beseparated into two regions based on the structure of E3.The first corresponds to the N-terminal helix and its imme-diate vicinity (E3 residues 1–12, Figure 5a), while thesecond corresponds to the interacting residues in the β sheetof E3 (residues 26–41, Figure 5b). The α helix in E3 dis-plays extensive interactions with residues forming the opengroove in Im3. E3 residue Phe2 is in van der Waals contactwith several residues in Im3 including Leu2′, Phe39′ andTyr79′ — residues which form the hydrophobic pocket seenin Figure 4c. Tyr5 from E3 also packs against Phe39′. Aswell as participating in hydrophobic interactions the back-bone oxygen of Tyr5 forms two water-mediated hydrogenbonds to the mainchain oxygen atoms of both Phe39′ andVal43′. The positive charge of Lys3 is compensated by theacidic group Asp81′, while the lower region of the sidechainpacks against the aromatic ring of Tyr79′. The sidechain ofHis7 forms a bifurcated hydrogen bond to the charged headgroup of Asp81′ forming one of the major interactions in thisregion. The hydroxyl group of Tyr9 also forms a hydrogenbond to a charged acceptor (Asp41′). Immediately adjacent
Research Article Colicin E3 RNase domain in complex with Im3 Carr et al. 955
Figure 5
Stereoview representations of some of thespecific interactions occurring on E3–Im3complex formation. Residues from theimmunity protein are coloured light grey whileresidues from the RNase are black andlabelled in bold type. (a) Interactions at theN-terminal helix involving the insertion of thePhe2 sidechain into a hydrophobic pocketand the formation of several salt bridges andhydrogen bonds. (b) Interactions involving theβ-sheet region of E3 displaying several saltbridges and hydrophobic contacts.

to the N-terminal helix, Ala12 forms direct and water-medi-ated hydrogen bonds to the sidechains of Arg80′ and Asn44′,respectively. The residues within the β sheet on E3 at theinterface (26–41) interact with residues across the face of theβ sheet of Im3. The hydrophobic residues involved inimmunity binding in this region are Pro26, Ile28 and Pro29.Pro26 packs against both Phe9′ and Phe16′, while Ile28interacts with Phe9′ and Phe74′. Pro29 is in van der Waalscontact with the aromatic ring of Phe74′ alone. Lysineresidues 39 and 41 are extremely important in terms of Im3binding as both are deeply buried on complexation and alsoform multiple contacts with residues in Im3. Lys39 formstwo mainchain hydrogen bonds to the backbone carbonyland amide groups of Cys47′, a residue implicated in immu-nity specificity between the RNase colicins E3 and E6 [14].The sidechain of Lys39 forms a salt bridge with the car-boxylic acid group of Asp49′. Lys41 forms two salt bridgeswith residues Asp5′ and Asp78′ and the highly buriednature of Lys41 on complexation is likely to greatlyincrease the strength of these interactions. Surface burialanalysis does not implicate Ser56 as an interfacial residue,however, its sidechain is oriented such that it forms twodirect hydrogen bonds to residues Asn44′ and Asn45′.Asp15′ and Glu19′ have been implicated in Im3 bindingdue to the lack of conservation displayed at these positions[8,14]; however, the structure reveals that these residuesare not involved in binding at all.
The role of water at the molecular interfaceSurface area analysis of the ordered water moleculesrevealed the presence of 23 water molecules in the vicin-ity of the molecular interface (Figure 6). Of these 12 arecompletely buried, whereas the remainder have an acces-sible area of < 5 Å2. The average temperature factor ofthese water molecules is 53.4 Å2, a value comparable to
that for the residues in both protein chains (E3, 53.3 Å2;Im3, 48.3 Å2) indicating that they are well ordered. Six ofthe water molecules are involved in water-bridged hydro-gen bonds and a further three participate in double-water-bridged hydrogen bonds (of the type E3–water–water–Im3).The remaining 14 water molecules lie much closer toeither E3 or Im3 and could represent some of the hydra-tion shell of each protein before complexation. One line ofevidence to support this assertion comes from the super-position of Im3 from the complex onto the free immunityprotein [14,15]. This reveals that seven of the water mol-ecules at the complex interface occupy very similar posi-tions to water molecules observed in the free Im3structure. When included in the gap volume calculation,the gap volume index was reduced to 1.12. This indicatesthat water has a dual role at protein interfaces formingadditional interactions between the proteins and filling ingaps between macromolecular surfaces. The latter func-tion should lead to an increase in complementarity at theinterface and when the Sc coefficient was recalculatedincluding the buried water molecules a value of 0.71 wasfound indicating a slight increase in complementarily.This very slight increase in complementarity has beenobserved for several other protein complexes [34]. It islikely that water molecules bind at areas of particularlypoor complementarity and so only cause a local improve-ment. As the Sc coefficient is the median of the comple-mentarity calculated for small subsections of the interface,an improvement in the areas of very poor fit has littleeffect on the overall Sc value.
Sequence conservation and specificity of immunity proteinbindingThe RNase E colicins display a very high degree ofsequence identity and as such the specificity of each colicin
956 Structure 2000, Vol 8 No 9
Figure 6
Surface representation of the interactingsurfaces of colicin E3 and Im3 showing watermolecules that display less than 5 Åaccessible surface area on complex formation.Many of the waters are positioned to fill cleftson the interacting surfaces of each protein(water molecules involved in hydrogen-bonding interactions to both proteins areshown in dark blue). Water moleculesconserved in position between this structureand that of the free immunity protein [14]are coloured magenta.

to its cognate inhibitor protein will be dictated by a fewresidues. Sequence alignment of the RNase colicins andcloacin DF13 reveals the presence of seven non-con-served residues which are involved in interactionsbetween the proteins (Figures 1 and 4d). To ascertainwhether these residues may be involved in immunityspecificity the variability of the amino acids in Im3 withwhich they interact was analysed. It is seen that Ala12 andPro26 both interact with totally conserved residues in Im3and that the sidechain of Lys39 retains its positive natureamong the RNases and forms a salt bridge with the com-pletely conserved Asp49′ suggesting none of these residueshave a role in specificity. Ile28 is also unlikely to have arole in specificity based on this analysis. Residue 41(lysine in E3) is extremely variable and is the only basicresidue in this position in the homologous proteins. It istherefore a good candidate to be involved in specificbinding of Im3 to E3. One of the partner residues ofLys41 (Asp78′) is totally invariant and so the highly acidicpatch seen in Figure 4a retains some of its charged charac-ter in the other RNase colicins. However, residue 5′ (aspar-tic acid in Im3), which also contributes to the interfacialacidic patch on Im3, displays the same degree of variabil-ity as Lys41 yet complementarity can be seen betweenthe mutations at both these positions, confirming thespecificity-defining nature of these residues. Phe2 appearsto be involved in specificity in a more indirect manner. Inthe homologous sequences smaller amino acids occupythis position (valine and threonine), but the residuesforming the hydrophobic pocket with which it interactsare invariant or mutated in a conserved manner. Thisimplies the burial of hydrophobic surface is much greaterfor E3 than any other protein, increasing the strength ofinteraction at this site and thus aiding in specific bindingof Im3. Pro29 is conserved between E3 and E6 but ismutated to lysine in E4. In Im4 a compensatory F74′Qmutation occurs and so this is likely to facilitate specificitybetween E4 and Im4. Asp5′ and Cys47′ are the sole vari-able residues in Im3. The former is involved in interac-tions with Lys41, whereas the latter interacts with thebackbone of Lys39. Cys47′ has been implicated in specificbinding to E3 by experiments using chimeric Im3/Im6proteins [14]. As backbone atoms are involved in thehydrogen bonds formed between Lys39 and Cys47′ it islikely that specificity resides in the sidechain of Cys47′.However, the structure reveals the cysteine residue to belocated in a large open pocket flanked by E3 residuesPro29 and Lys41 and does not form any direct contactswith any residue (Figure 1). Therefore the role of Cys47′in specificity determination is not obvious. The immunityprotein also displays a significant lack of sequence conser-vation on the protected face of the β sheet and the αhelices. This is in marked contrast to the DNase colicinswhich display their most significant sequence heterogene-ity at the site of DNase binding. As the second site ofsequence variation is located in a discrete region of the
immunity protein it could represent a second site of spe-cific interaction between the colicin and immunity protein.This would lead to a tighter toxin–immunity protein inter-action and hence afford even greater host protection.
The active site and inhibition of RNase activityAs the fold of the E3 domain appears to be unique no cat-alytic residues could be identified by simple comparisonto other RNases. However, a number of residues havebeen implicated in the activity of this toxin by a variety ofmethods. The activity of colicin E3 is sensitive to modifi-cation with diethyl pyrocarbonate (DW and CK, unpub-lished results) and this, when combined with theobservation that histidines are invariably located at theactive site of RNases, indicates that at least one histidineis involved in catalysis. Of the four histidines found in E3(at positions 7, 10, 58 and 71), two (residues 7 and 58) aremore likely to be involved in RNA hydrolysis, as His10 isnon-conserved between the homologous proteins E3, E4,E6 and cloacin DF13, while His71 is entirely buried in theE3 monomer structure. Sequence alignment techniqueshave also been used to suggest a potential catalytic role forone or both of these histidines (7 or 58) as well as reveal-ing a conserved arginine residue at position 42 [37]. Thisarginine has been postulated to have a role in RNAsensing [38], although this may not be the case in E3 asthis residue hydrogen bonds to the C-terminal residues ofthe enzyme and might be necessary to maintain theRNase structure. Two mutations which abolish activityhave also been identified within this domain (G59D andS74L) [39]. From analysis of the structure it appears thatboth of these are likely to have lost activity by an alter-ation of the conformation of the protein rather than beingdirectly involved in catalysis.
As mutational analysis to locate the catalytic residues isyet to be performed, the active-site residues of two previ-ously well-characterised RNases (RNase A, PDB code1afk [40] His–His catalytic pair and barnase, PDB code1a2p [41] His–Glu catalytic pair) were used to generatefingerprints of the relative positions of catalytic residues.These fingerprints were then used to probe the surface ofthe E3 RNase in order to locate potential active siteresidues. The potential catalytic residue His7 is located atthe surface of the RNase and is in direct contact with Im3.This could indicate a role in catalysis as it interacts withIm3 in a manner which could lead to inactivation of thetoxin, as the hydrogen bonds formed between His7 andAsp81′ could orientate the imidazole sidechain group insuch a way as to prevent nucleolytic activity. It is possibleto superimpose His7 and His10 onto the catalytic histi-dine pair of RNase A with an rmsd of 1.7 Å (calculatedusing all sidechain atoms in the residues mentionedabove), however, it is unlikely that this represents theactual catalytic pair as His10 is a non-conserved residueand there are no basic residues in the vicinity to stabilise
Research Article Colicin E3 RNase domain in complex with Im3 Carr et al. 957
the transition state of the nucleolytic reaction. Of thenumerous alternative pairs also tested the His10–His58pair are near a basic residue (Lys33) producing a potentialactive site (rmsd to RNase A active site 1.4 Å). However,this putative active site contains the non-conserved His10and both the mainchain and sidechain of Gln57 are orien-tated such that they protrude into the region betweenthese residues, suggesting that these are not involved inactivity. Alternatively, His58, located some distance fromIm3 is found adjacent to a basic residue (Arg90) and toGlu62. Least squares superposition of all commonsidechain atoms in these residues was performed againstthe barnase catalytic residues (His102, Glu73 and Lys27)and revealed an rmsd of 1.3 Å. This alignment also placesthe basic head group of Lys84 from E3 in the same posi-tion as that of the barnase active-site residue Arg87, sug-gesting they perform similar roles during the reactioncycle. However, the barnase active-site residue Arg83appears to have no structural homologue in colicin E3based on this analysis. His58, Glu62, Lys84 and Arg90 aretotally conserved throughout the ribonuclease colicinsand the tetrad is not sterically blocked by surroundingresidues, suggesting that His58 and Glu62 could form thecatalytic pair while Lys84 and Arg90 stabilise the transi-tion state of the nucleolytic reaction.
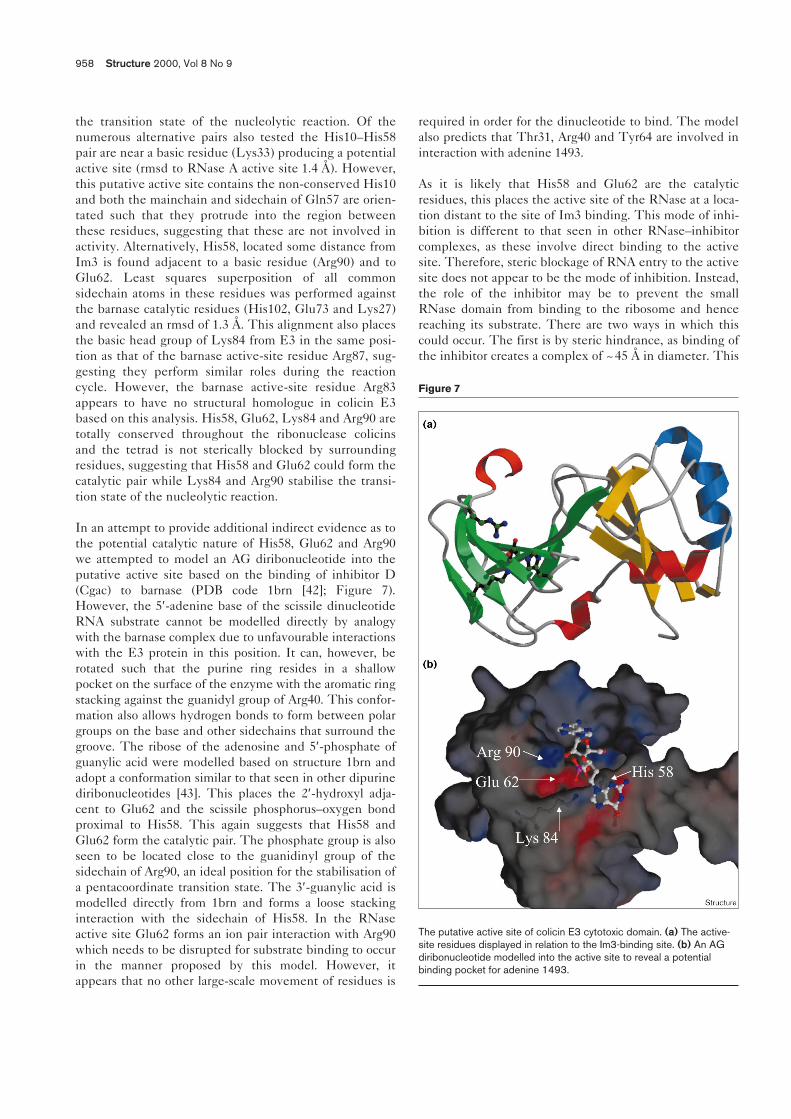
In an attempt to provide additional indirect evidence as tothe potential catalytic nature of His58, Glu62 and Arg90we attempted to model an AG diribonucleotide into theputative active site based on the binding of inhibitor D(Cgac) to barnase (PDB code 1brn [42]; Figure 7).However, the 5′-adenine base of the scissile dinucleotideRNA substrate cannot be modelled directly by analogywith the barnase complex due to unfavourable interactionswith the E3 protein in this position. It can, however, berotated such that the purine ring resides in a shallowpocket on the surface of the enzyme with the aromatic ringstacking against the guanidyl group of Arg40. This confor-mation also allows hydrogen bonds to form between polargroups on the base and other sidechains that surround thegroove. The ribose of the adenosine and 5′-phosphate ofguanylic acid were modelled based on structure 1brn andadopt a conformation similar to that seen in other dipurinediribonucleotides [43]. This places the 2′-hydroxyl adja-cent to Glu62 and the scissile phosphorus–oxygen bondproximal to His58. This again suggests that His58 andGlu62 form the catalytic pair. The phosphate group is alsoseen to be located close to the guanidinyl group of thesidechain of Arg90, an ideal position for the stabilisation ofa pentacoordinate transition state. The 3′-guanylic acid ismodelled directly from 1brn and forms a loose stackinginteraction with the sidechain of His58. In the RNaseactive site Glu62 forms an ion pair interaction with Arg90which needs to be disrupted for substrate binding to occurin the manner proposed by this model. However, itappears that no other large-scale movement of residues is
required in order for the dinucleotide to bind. The modelalso predicts that Thr31, Arg40 and Tyr64 are involved ininteraction with adenine 1493.
As it is likely that His58 and Glu62 are the catalyticresidues, this places the active site of the RNase at a loca-tion distant to the site of Im3 binding. This mode of inhi-bition is different to that seen in other RNase–inhibitorcomplexes, as these involve direct binding to the activesite. Therefore, steric blockage of RNA entry to the activesite does not appear to be the mode of inhibition. Instead,the role of the inhibitor may be to prevent the smallRNase domain from binding to the ribosome and hencereaching its substrate. There are two ways in which thiscould occur. The first is by steric hindrance, as binding ofthe inhibitor creates a complex of ~45 Å in diameter. This
958 Structure 2000, Vol 8 No 9
Figure 7
The putative active site of colicin E3 cytotoxic domain. (a) The active-site residues displayed in relation to the Im3-binding site. (b) An AGdiribonucleotide modelled into the active site to reveal a potentialbinding pocket for adenine 1493.
is compared to a diameter of ~20 Å for the RNase alone.The site of 16S RNA cleavage is situated in a narrowgroove in the ribosome [11] and so a twofold increase indiameter on inhibitor binding could prevent the RNasereaching its substrate. Alternatively, electrostatic repulsioncould prevent activity as the highly acidic immunityprotein could prevent the RNase from interacting with itspresumably acidic binding site on the ribosome.
Biological implicationsTwo classes of enzymatic E colicins have been charac-terized. For the DNase colicins, structural data is nowavailable [14,22] giving insight into the residues involvedin catalysis and the mode of inhibition by their immunityproteins. The structure of the E3–Im3 complex is thefirst description of the fold of a ribosome-inactivatingRNase. The unique nature of the structure makes ithighly likely to form the basis of a new family of RNaseswhich lack the more commonly occurring motif of anα helix packing across a β sheet. Sequence and struc-tural analysis combined with molecular modelling hasrevealed a putative active site within the toxin and sug-gests that colicin E3 contains a His–Glu catalytic pairsimilar to that seen in barnase. It has also revealed thatArg90 is likely to be involved in stabilisation of the penta-coordinate intermediate formed during RNA hydrolysis.Although the overall fold is non-conserved, the similarityin the distribution of catalytic residues to that seen inother RNases implies that a process of convergent evolu-tion has occurred to generate a functional enzyme.
The analysis of the protein–protein interface reveals anextensive, highly complementary interaction surface whichinvolves both hydrophobic and hydrophilic residues inbinding — suggestive of a high-affinity complex. Thiscomplex also provides an alternative model for the analy-sis of protein–protein interactions that can be used inparallel with the DNase colicin E9–Im9 system [17,22].The site of inhibitor binding is distant from the catalyticcentre and does not appear to obscure the active site. Thisis in contrast to the situation observed in other RNasesand suggests a more subtle form of inhibition is occur-ring, which could involve the prevention of the RNasebinding to the ribosome by steric or electrostatic means.It is also apparent that the active site involves residuesC-terminal to the site of inhibitor binding, which is anal-ogous to the situation in the DNase colicins suggestingthat the immunity protein might bind to an incompletelytranslated colicin in order to afford protection to the pro-ducing bacterium as the toxin is being synthesised.
Materials and methodsStructure determinationAll data collection was performed at 100K using cryoprotected crys-tals (15% (v/v) ethylene glycol, 0.1 M Na citrate pH 5.6, 15% (w/v)PEG 4K, 20% (v/v) isopropanol). The space group was P3121, cellparameters a = 92.8 Å, b = 92.8 Å, c = 77.2 Å with one molecule of
complex in the asymmetric unit. X-ray diffraction data were collectedfrom a single crystal of the mutant SeMet C47M Im3 complex with E3[24] at three wavelengths around the selenium K-edge on stationBM14 at the ESRF (Grenoble, France). Images were processed usingDENZO [44] to 2.8 Å resolution. An additional data set was collectedfrom a single crystal of the native complex at a wavelength of 0.95 Åon station 9.5 at the SRS (CLRC Daresbury Laboratory, UK) andprocessed to 2.4 Å (native cell parameters a = 93.7 Å, b = 93.7 Å,c = 76.2 Å). Scaling of the MAD data was performed using SCALA[45] and the positions of the two selenium atoms were found usingSOLVE [46]. The resultant map from SOLVE had an average figure ofmerit of 0.55–2.8 Å resolution. Phase improvement by solvent-flatten-ing was performed using DM [47] at a nominal solvent content of72%. This produced a phase set with a free R factor of 29.6%. Theinitial electron-density map was of exceptional quality and displayedclear solvent boundaries for the complex, and it was possible to traceall 84 residues of the immunity protein and residues 2–94 in theRNase domain (Phe455–Lys549) using O [48]. For refinement, 5% ofthe reflections were set aside for the calculation of the Rfree [49].Maximum likelihood refinement by simulated annealing using CNS[50] produced a model with Rcryst = 30.1% (Rfree = 33.2%). Phasecombination using this model allowed the missing residues in theRNase domain to be traced resulting in a complete model of bothRNase domain and immunity protein. Subsequent least squares min-imisation using CNS resulted in a model with Rcryst = 28%(Rfree = 31.0%). This model was then transformed to the crystallo-graphic cell of the native complex by molecular replacement usingAMoRe [51] (with an R factor of 32.9% and a correlation coefficientof 77.9%). Three further rounds of rebuilding and minimisation usingCNS followed producing a model with Rcryst = 26.9% (Rfree = 30.1%).Refinement and optimisation of the B-factor model and optimisation ofstereochemical restraints were performed yielding a model with Rcryst=23.8% (Rfree =27.8%). Inspection of single difference Fourier mapsat this stage showed residual electron density at > 6σ near to thecomplex interface. This could be ascribed to an ordered ethylene mol-ecule. A model of which was generated using HICUP [52] and fittedto the density. Refinement with the ethylene glycol present convergedto give an Rcryst = 21.8% (Rfree = 25.4%). Finally water molecules wereadded to residual density in the (Fo–Fc) difference Fourier map. A totalof 176 water molecules were added to 3σ peaks and refined usingCNS. At this stage the refinement converged to produce a final modelwith Rcryst = 19.2% ( Rfree = 22.8%) for all data (applying a 2σ cut-off)in the resolution range 30–2.4 Å. Analysis of the final model usingPROCHECK [53] showed 86.8% of the residues fall in the mostfavoured regions of the Ramachandran plot, while the remaining13.2% fell into allowed regions. No residues lie in generously allowedor disallowed areas. Structural homology searches were performedusing DALI [28] and analysis of the interface was carried out usingprograms from the CCP4 program suite [54], SPOCK [55],SURFNET [34] and Sc [33]. Molecular modelling was performedusing the program INSIGHT98 (Insight II http//:www.msi.com). Figureswere produced using a combination of the programs MOLSCRIPT[56], RASTER3D [57] and SPOCK [55].
Accession numbersThe atomic coordinates for the colicin E3 RNase domain complex withIm3 have been deposited in the PDB (accession code 1e44).
AcknowledgementsWe acknowledge access to the ESRF beamline BM14 at Grenoble, France,and to the SRS station 9.5, CLRC Daresbury Laboratory, Warrington UK.We would particularly like to thank Dr Gordon Leonard (ESRF BM14) forhis help with the selenium MAD phasing experiment.
References1. James, R., Kleanthous, C. & Moore, G.R. (1996). The biology of
E colicins: paradigms and paradoxes. Microbiology 142, 1569-1580.2. Cramer, W.A., Cohen, F.S., Merril, A.R. & Song, H.Y. (1990). Structure
and dynamics of the colicin E1 channel Mol. Microbiol. 4, 519-526.
Research Article Colicin E3 RNase domain in complex with Im3 Carr et al. 959

3. Toba, M., Masaki, H. & Ohta, T. (1988). Colicin E8, a DNase whichindicates an evolutionary relationship between colicin E2 and colicinE3. J. Bacteriol. 170, 3237-3242.
4. Eaton, T. & James, R. (1989). Complete nucleotide sequence of thecolicin E9 (cei) gene. Nucl. Acids Res. 17, 1761-1761.
5. Chak, K.-F., Kuo,W.-S., Lu, F.-M. & James, R. (1991). Cloning andcharacterisation of the cole7 plasmid. J. Gen. Microbiol. 137, 91-100.
6. Ogawa, T., Tomita, K., Ueda, T., Watanabe, K., Uozumi, T. & Masaki,H. (1999). A cytotoxic ribonuclease targeting specific transfer RNAanticodons. Science 283, 2097-100.
7. Senior, B. W. & Holland, I.B. (1971). Effect of colicin E3 upon the30S ribosomal subunit of Escherichia coli. Proc. Natl Acad. Sci. USA68, 959-963.
8. Bowman, C.M., Dahlaberg, J.E., Ikemura,T., Konisky, J. & Nomura, M.(1971). Specific inactivation of 16S ribosomal RNA induced by colicinE3 in vivo. Proc. Natl Acad. Sci. USA 68, 964-968.
9. Ohno, S., Ohno-iwashita, Y., Suzuki, K. & Imahori, K. (1977).Purification and Characterisation of active component and activefragment of Colicin E3. Biochem J. 82, 1045-1053.
10. Boon, T. (1971). Inactivation of ribosomes in vitro by Colicin E3.Proc Natl Acad. Sci. USA 68, 2421-2425.
11. Cate, J.H., Yusupov, M.M., Yusopova, G.Z., Earnest, T.N. & Noller H.F.(1999). X-ray structure of 70S ribosome functional complexes.Science 285, 2095-2104.
12. Yoshizawa, S., Fourmy, D. & Puglisi, J.D. (1999). Recognition of thecodon-anticodon helix by ribosomal RNA. Science 285, 1722-1725.
13. Masaki, H., Akutsu, A., Uozumi, T. & Ohta, T. (1991). Identification of aunique specificity determinant of the colicin E3 immunity protein.Gene 107, 133-138.
14. Li, C., Zhao, D., Djebli, A. & Shoham, M. (1999). Crystal structure ofcolicin E3 immunity protein: an inhibitor of a ribosome inactivatingRNase. Structure 7, 1365-1378.
15. Yajima, S., et al., & Uozumi, T. (1993). The three dimensional structureof the colicin-E3 immunity protein by distance geometry calculationFEBS Lett. 333, 257-260.
16. Kleanthous, C, Hemmings, A.M., Moore, G.R. & James, R. (1998).Immunity proteins and their specificity for endonuclease colicins: rightfrom wrong in protein–protein recognition. Mol. Microbiol, 28, 227-233.
17. Wallis, R., Moore, G.R., James, R. & Kleanthous, C. (1995).Protein–protein interactions in colicin E9 DNase — immunity proteincomplexes. 1. Diffusion controlled association and femtomolar bindingfor the cognate complex. Biochemistry 34, 13743-13750.
18. Jakes, K., Zinder, N.N. & Boon, T. (1974). Purification and propertiesof colicin E3 immunity protein. J. Biol. Chem. 249, 438-444.
19. Wallis, R., Leung, K.Y., Osborne, M.J., James, R., Moore, G.R. &Kleanthous, C. (1998). Specificity in protein–protein recognition:Conserved Im9 residues are the major determinants of stability in thecolicin E9 DNase–Im9 complex. Biochemistry 37, 476-485.
20. Li, W., Hamill, S.J., Hemmings, A.M., Moore, G.R. & James, R.,Kleanthous, C. (1998). Dual recognition and the role of specificity-determining residues in colicin E9 DNase-immunity proteininteractions. Biochemistry 37, 11771-11779.
21. Ko, T.P., Liao, C.C., Ku, W.Y., Chak, K.F. & Yuan, H.S. (1999). Thecrystal structure of the DNase domain of colicin E7 in complex with itsinhibitor Im7 protein. Structure 7, 91-102.
22. Kleanthous, C., et al., & Hemmings, A. M. (1999). Structural andmechanistic basis of immunity towards endonuclease colicins.Nat. Struct. Biol. 6, 243-252.
23. Shoham, M. & Djebli, A. (1992). Structural studies on Colicin E3 andits immunity protein. In Bacteriocins, Microcins and Lantibiotics.NATO ASI Series, Vol H65, (James, R., Lazdunski, C. & Pattus, F.,eds), pp. 203-214, Springer Verlag, Berlin.
24. Carr, S., Walker, D., James, R., Kleanthous, C. & Hemmings, A.M.(1999). Crystallisation and preliminary crystallographic analysis ofcolicin E3 RNase domain in complex with its cognate immunityprotein. Acta Crystallogr. D in press.
25. Derrick, J.P. & Wigley, D.B. (1994). The third IgG-binding domain fromstreptococcal protein G. An analysis by X-ray crystallography of thestructure alone and in a complex with Fab. J. Mol. Biol. 243, 906.
26. Lubkowski, J., Hennecke, F., Plückthorn, A. & Wlodawer A. (1999).Filamentous phage infection: crystal structure of g3p in complexwith its coreceptor, the C-terminal domain of TolA. Structure7, 711-722.
27. Endo, Y., Huber, P.W. & Wool, I.G. (1983). The ribonuclease activityof the cytotoxin α-sarcin. The characteristics of the enzymatic activityof α-sarcin with ribosomes and ribonucleic acids as substrates.J. Biol. Chem. 258, 2662-2667.
28. Holm, L. & Sander, C. (1993). Protein structure comparison byalignment of distance matrices. J. Mol. Biol. 233, 123-38.
29. Lu, G. (1996). A WWW service system for automatic comparison ofprotein structures. Prot. Databank Quart. Newsletter 78, 10-11.
30. Buckle, A.M., Schreiber, G. & Fersht, A.R. (1994). Protein–proteinrecognition: crystal structural analysis of a Barnase–Barstar complexat 2.0 Å resolution. Biochem. 33, 8878-8889.
31. Kühlmann, U.C. (1998). The Crystal Structure of the Complex of theEscherichia coli Colicin E9 DNase Domain with its Cognate ImmunityProtein, Im9. PhD thesis, University of East Anglia, Norwich, UK.
32. Conte, L.L., Chothia, C. & Janin J. (1999). The atomic structure ofprotein-protein recognition sites. J. Mol. Biol. 285, 2177-2198.
33. Lawrence, M.C. & Colman, P.M. (1993). Shape complimentarity atprotein–protein interfaces. J. Mol. Biol. 234, 946-950.
34. Laskowski, R.A. (1995). SURFNET – a program for visualising molecular-surfaces, cavities and intermolecular interactions. J. Mol. Graph. 13, 323.
35. Jones, S. & Thornton, J.M. (1996). Principles of protein–proteininteraction Proc. Natl Acad. Sci. USA 93, 13-20.
36. Janin, J., Miller, S. & Chothia, C. (1988). Surface, subunit interfacesand interior of oligomeric proteins. J. Mol. Biol. 204, 155-164.
37. Lau, P.C.K., Parsons, M. & Uchimura, T. (1991). Molecular evolution ofE colicin plasmids with emphasis on the endonuclease colicins. InBacteriocins, Microcins and Lantibiotics. ASI Series, Vol H65, (James,R., Lazdunski, C. & Pattus, F.,eds), pp. 203-214, Springer Verlag, Berlin.
38. Calnan, B.J., Tidor, B., Biancalana, S., Hudson, D. & Frankel, A.D. (1991).Arginine-mediated recognition: arginine fork. Science 252, 1167-1171.
39. Escuyer, V. & Mock, M. (1987). DNA sequence analysis of threemissense mutations affecting colicin E3 bactericidal activity.Mol. Microbiol. 1, 82-85.
40. Leonidas, D.D., Shapiro, R., Irons, L.I., Russo, N. & Acharya, K.R.(1997). Crystal structures of ribonuclease A complexes with5′ diphosphoadenosine 3′-phosphate and 5′-diphosphoadenosine2′-phosphate at 1.7 Å resolution. Biochemistry 36, 5578-5588.
41. Mauguen, Y., et al., & Jack, A. (1982). Molecular structure of a newfamily of ribonucleases. Nature 297, 162-164.
42. Buckle, A.M. & Fersht, A.R. (1994). Subsite binding in an RNase:structure of a Barnase–tetranucleotide complex at 1.76 Å resolution.Biochemistry 33, 1644-1653.
43. Einspahr, H., Cook, W.J. & Bugg, C.E. (1981). Conformational flexibility insingle-stranded oligonucleotides: crystal structure of a hydrated calciumsalt of adenylyl-(3′–5′)-adenosine. Biochemistry 20, 5788-5794.
44. Otwinowski, Z. & Minor, W. (1997). Processing of X-ray diffractiondata collected in oscillation mode. Methods Enzymol. 276, 307-326.
45. Evans, P.R. (1993). Data reduction. In Proceedings of CCP4 StudyWeekend, on Data Collection & Processing, 114-122.
46. Terwilliger, T. & Berendzen, J. (1999). Automated structure solution forMIR and MAD Acta Crystallogr. D 55, 849-861.
47. Cowtan, K. (1994). Joint CCP4 and ESF-EACBM newsletter onprotein crystallography, 31, 34-38.
48. Jones, T.A., Zou, J.Y., Cowan, S.W. & Kjeldgaard, M. (1991). Improvedmethods for building protein models in electron-density maps and thelocation of errors in these models. Acta Crystallogr. A 47, 110-119.
49. Brünger, A.T. (1992). Free R value – a novel statistical quantity forassessing the accuracy of crystal structures. Nature 355, 472-475.
50. Brünger, A.T., et al., & Warren, G.L. (1998). Crystallography & NMRsystem: a new software suite for macromolecular structuredetermination. Acta Crystallogr. D 54, 905-921.
51. Navaza, J. & Saludjian, P. (1997). AMoRe: An automated molecularreplacement program package Methods Enzymol. 276, 581-594.
52. Kleywegt, G.J. & Jones, T.A. (1998). Databases in proteincrystallography. Acta Crystallogr. D 54, 1119-1131.
53. Laskowski, R.A., MacArthur, M.W., Moss, D.S. & Thornton, J.M.(1993). PROCHECK – a program to check the stereochemical qualityof protein structures. J. Appl. Crystallogr. 26, 283-291.
54. Bailey, S. (1994). The CCP4 suite – programs for proteincrystallography Acta Crystallogr. D 50, 760-763.
55. Christopher, J.A. (1997). SPOCK: The structure properties andobservation toolkit. Center for Macromolecular Design, Texas A&MUniversity, College Station Tx 77843-2128.
56. Kraulis, P.J. (1991). MOLSCRIPT — a program to produce detailed andschematic plots of protein structures. J. Appl. Crystallogr. 24, 946-950.
57. Merritt, E.A. & Bacon, D.J. (1997). Raster3D: photorealistic moleculargraphics. Methods Enzymol. 277, 505-524.
960 Structure 2000, Vol 8 No 9