Ingalls USD #477 Ingalls, KS 67835ksde.org/Portals/0/School...
25
Ingalls USD #477 Ingalls, KS 67835
-
Upload
nguyentruc -
Category
Documents
-
view
215 -
download
0
Transcript of Ingalls USD #477 Ingalls, KS 67835ksde.org/Portals/0/School...

Ingalls USD #477 Ingalls, KS 67835

i
• Budget General Information (characteristics of district)
• Supplemental Information for Tables in Summary of Expenditures
• KSDE Website Information Available
• Summary of Expenditures (Sumexpen.xls)

1
2008-2009 Budget General Information USD #: _477_
Introduction We feel we are able to provide a quality education to our students; however, each year we find it difficult to make ends meet financially. It is difficult to compete with salaries of many other Kansas school districts.
Board Members Michael Schmidt, President 5403 0 Road, Ingalls, KS 67853 620-335-5757 Tom Beavers, Vice-President 01506 US Hwy 50, Pierceville, KS 67868 620-335-5760 Robert Benton PO Box 83, Ingalls, KS 67853 620-335-5490 Joe Jury 17504 7 Road, Ingalls, KS 67853 620-335-5472 Kyle Litton 12805 L Road, Ingalls, KS 67853 620-335-5626 Aaron Maxwell PO Box 54, Ingalls, KS 67835 620-335-5847 Alice Thomas PO Box 203, Ingalls, KS 67853 620-335-5282
Key Staff Superintendent: Dave Novack Associate or Assistant Superintendents: Steve Johnson and Joseph Meador Business Office Staff: Debbie Benton Curriculum & Instruction Staff: Amy Benton 4 Year Olds Kim Schmdit Kindergarten Theresa Irsik 1st Grade Jennifer Beach 2nd Grade Terri Vanderree 3rd Grade Tiffany Wilkison 3rd Grade Nancy Jones 4th Grade Pam Millershaski 5th Grade Kim Batman Jr. High Steve Thompson Jr. High Tammy Meador Music Joseph Meador Music Mitch Harris PE Lori Furgason Library Dan Beery Science Terri Nicholson Science Judy Harris HS English Gayla Rodenbur Counselor Susan Bailey Math Leonard Rodenbur Social Studies Roger Thurlow Social Studies Tracy Bleumer Business Mark Fisher Technology

2
Other Key Contacts: Carla Bowman and Cindy Kirmer
The District’s Accomplishments and Challenges Accomplishments: Our district has steadily improved with state assessment scores. We have made standard of excellence in numerous areas. Our graduation rate is over 90%. We maintain a safe and orderly climate for our students and staff. Challenges: Even though our current enrollment is holding steady, there are concerns of long term decreases. Because of budget restraints, we do not provide a quality health insurance benefit. Teacher recruitment is a huge concern due to our size school, location and salaries.

3
Supplemental Information for the Following Tables 1. Summary of Total Expenditures by Function (All Funds) 2. Summary of General Fund Expenditures by Function 3. Summary of Supplemental General Fund Expenditures by Function 4. Summary of General and Supplemental General Fund Expenditures by Function 5. Summary of Special Education Fund by Function 6. Instruction Expenditures (1000) 7. Student and Instructional Support Expenditures (2100 & 2200) 8. General Administration Expenditures (2300) 9. School Administration Expenditures (2400) 10. Operations and Maintenance Expenditures (2600) 11. Other Costs (2500 & 2900: Other Supplemental Services) (3000: Non-Instruction Services) 12. Capital Improvements (4000) 13. Debt Services (5000) 14. Miscellaneous Information Unencumbered Cash Balance by Fund 15. Reserve Funds Unencumbered Cash Balance 16. Other Information - FTE 17. Miscellaneous Information Mill Rates by Fund 18. Other Information – Assessed Valuation and Bonded Indebtedness Note: The FTE (full time equivalency) used in this report to calculate the “Amount Per Pupil” is defined as following: Enrollment (FTE) includes the enrollment of the district used for state aid and budget authority, and all other preschool enrollment and kindergarten students attending full time.

4
KSDE Website Information Available K-12 Statistics (Building, District or State Totals) http://www.ksde.org/Default.aspx?tabid=223
• Attendance / Enrollment Reports • Staff Reports • Graduates / Dropouts Reports • Crime / Violence Reports
School Finance Reports and Publications http://www.ksde.org/Default.aspx?tabid=1870
• Certified Personnel • Enrollment • Dropouts • Graduates • Salary Reports
Kansas Building Report Card (listed on the right under Data Portal sections) http://www.ksde.org/Default.aspx?tabid=229
• Attendance Rate • Graduation Rate • Dropout Rate • School Violence • Assessments
o Reading o Mathematics o Writing
• Graduates Passing Adv. Science Courses • Graduates Passing Adv. Math Courses

USD# 477
Summary of Total Expenditures By Function(All Funds)
% % % % %2006-2007 of 2007-2008 of inc/ 2008-2009 of inc/
Actual Tot Actual Tot dec Budget Tot dec
Instruction 1,754,281 60% 1,911,544 56% 9% 2,026,190 60% 6%
Student & Instructional Support 119,312 4% 137,325 4% 15% 143,552 4% 5%
General Administration 110,339 4% 116,302 3% 5% 118,025 3% 1%
School Administration (Building) 186,920 6% 172,653 5% -8% 157,831 5% -9%
Operations & Maintenance 303,493 10% 443,895 13% 46% 378,914 11% -15%
Capital Improvements 85,780 3% 95,093 3% 11% 40,249 1% -58%
Debt Services 0 0% 0 0% 0% 0 0% 0%
Other Costs 340,391 12% 507,730 15% 49% 512,973 15% 1%
Total Expenditures 2,900,516 100% 3,384,542 100% 17% 3,377,734 100% 0%
Amount per Pupil $12,085 $14,620 21% $13,457 -8%
Note: Percentages on charts are within +-1% due to rounding used. Pie graph percentages may differ from charts for this reason also.
Further definition of what goes into each category:Instruction - 1000 Operations & Maintenance - 2600Student & Instructional Support - 2100 & 2200 Other Costs - 2500, 2900 and 3000 and all others not included elsewhereGeneral Administration - 2300 Capital Improvements - 4000School Administration (Building) - 2400 Debt Services - 5100 Transfers - 5200
The funds that are included in the categories above are: General, Supplemental General, Bilingual Education, At Risk(4yr Old), At Risk(K-12), Virtual Education, Capital Outlay, Driver Education, Extraordinary School Program, Summer School, Special Education, Vocational Education, Professional Development, Bond & Interest #1, Bond & Interest #2, No-Fund Warrant, Special Assessment, Parent Education, School Retirement, Student Materials Revolving & Textbook Rental, Tuition Reimbursement, Gifts/Grants, KPERS Special Retirement Contribution, Contingency, Special Liability Expense, Federal Funds, Adult Education, Adult Supplemental Education, Area Vocational Education, and Special Education Coop.
Summary of Total Expenditures By Function (All Funds)
0
500,000
1,000,000
1,500,000
2,000,000
2,500,000
Instruction Student &Instructional
Support
GeneralAdministration
SchoolAdministration
(Building)
Operations &Maintenance
CapitalImprovements
Debt Services Other Costs
2006-2007
2007-2008
2008-2009
2008-2009 Summary of Total Expenditures By Function (All Funds)
Instruction61%
General Administration3%
School Administration (Building)5%
Operations & Maintenance11%
Capital Improvements1%
Other Costs15%
Student & Instructional Support4%
Instruction
Student & Instructional Support
General Administration
School Administration (Building)
Operations & Maintenance
Capital Improvements
Debt Services
Other Costs
9/12/2008 1:47 PM Sumexpen.xls Page 1 of 19

USD# 477
Summary of General Expendituresby Function
% % % % %2006-2007 of 2007-2008 of inc/ 2008-2009 of inc/
Actual Tot Actual Tot dec Budget Tot dec
Instruction 1,135,294 65% 1,040,349 59% -8% 1,115,575 62% 7%
Student & Instructional Support 104,649 6% 119,826 7% 15% 124,838 7% 4%
General Administration 100,810 6% 111,986 6% 11% 113,062 6% 1%
School Administration (Building) 180,621 10% 168,643 10% -7% 153,219 9% -9%
Operations & Maintenance 122,015 7% 128,238 7% 5% 129,815 7% 1%
Capital Improvements 0 0% 0 0% 0% 0 0% 0%
Other Costs 93,118 5% 181,196 10% 95% 157,043 9% -13%
Total Expenditures 1,736,507 100% 1,750,238 100% 1% 1,793,552 100% 2%
Amount per Pupil $7,235 $7,560 4% $7,146 -5%
The Summary of General Fund Expenditures chart information comes from pages 6-13 and only uses the 'General Fund' line items.
Summary of General Fund Expendituresby Function
0
200,000
400,000
600,000
800,000
1,000,000
1,200,000
Instruction Student &Instructional
Support
GeneralAdministration
SchoolAdministration
(Building)
Operations &Maintenance
CapitalImprovements
Other Costs
2006-2007
2007-2008
2008-2009
2008-2009 Summary of General Fund Expendituresby Function
Instruction62%Student & Instructional
Support7%
General Administration6%
School Administration (Building)
9%
Operations & Maintenance7%
Other Costs9%
Instruction
Student & Instructional Support
General Administration
School Administration (Building)
Operations & Maintenance
Capital Improvements
Other Costs
9/12/2008 1:47 PM Sumexpen.xls Page 2 of 19
USD# 477
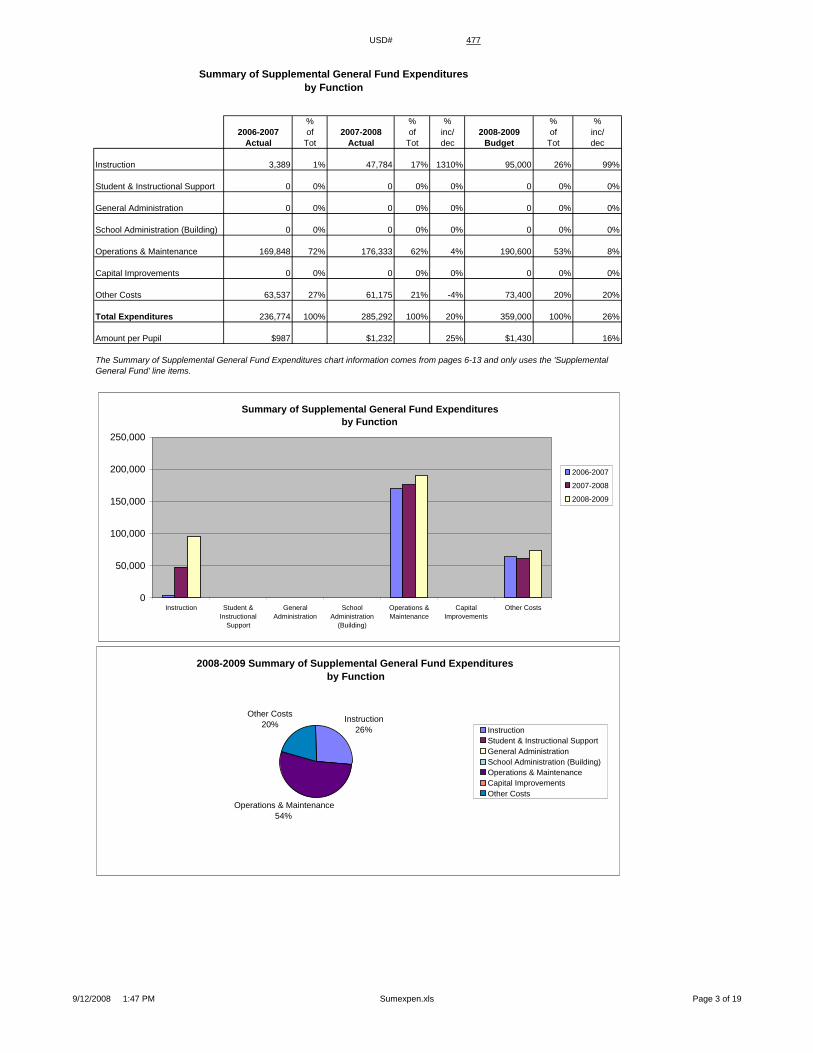
Summary of Supplemental General Fund Expendituresby Function
% % % % %2006-2007 of 2007-2008 of inc/ 2008-2009 of inc/
Actual Tot Actual Tot dec Budget Tot dec
Instruction 3,389 1% 47,784 17% 1310% 95,000 26% 99%
Student & Instructional Support 0 0% 0 0% 0% 0 0% 0%
General Administration 0 0% 0 0% 0% 0 0% 0%
School Administration (Building) 0 0% 0 0% 0% 0 0% 0%
Operations & Maintenance 169,848 72% 176,333 62% 4% 190,600 53% 8%
Capital Improvements 0 0% 0 0% 0% 0 0% 0%
Other Costs 63,537 27% 61,175 21% -4% 73,400 20% 20%
Total Expenditures 236,774 100% 285,292 100% 20% 359,000 100% 26%
Amount per Pupil $987 $1,232 25% $1,430 16%
The Summary of Supplemental General Fund Expenditures chart information comes from pages 6-13 and only uses the 'Supplemental General Fund' line items.
2008-2009 Summary of Supplemental General Fund Expendituresby Function
Instruction26%
Operations & Maintenance54%
Other Costs20%
InstructionStudent & Instructional SupportGeneral AdministrationSchool Administration (Building)Operations & MaintenanceCapital ImprovementsOther Costs
Summary of Supplemental General Fund Expendituresby Function
0
50,000
100,000
150,000
200,000
250,000
Instruction Student &Instructional
Support
GeneralAdministration
SchoolAdministration
(Building)
Operations &Maintenance
CapitalImprovements
Other Costs
2006-2007
2007-2008
2008-2009
9/12/2008 1:47 PM Sumexpen.xls Page 3 of 19

USD# 477Summary of General and Supplemental General Fund
Expenditures by Function
% % % % %2006-2007 of 2007-2008 of inc/ 2008-2009 of inc/
Actual Tot Actual Tot dec Budget Tot dec
Instruction 1,138,683 58% 1,088,133 53% -4% 1,210,575 56% 11%
Student & Instructional Support 104,649 5% 119,826 6% 15% 124,838 6% 4%
General Administration 100,810 5% 111,986 6% 11% 113,062 5% 1%
School Administration (Building) 180,621 9% 168,643 8% -7% 153,219 7% -9%
Operations & Maintenance 291,863 15% 304,571 15% 4% 320,415 15% 5%
Capital Improvements 0 0% 0 0% 0% 0 0% 0%
Other Costs 156,655 8% 242,371 12% 55% 230,443 11% -5%
Total Expenditures 1,973,281 100% 2,035,530 100% 3% 2,152,552 100% 6%
Amount per Pupil $8,222 $8,793 7% $8,576 -2%
The Summary of General and Supplemental General Fund Expenditures chart information comes from pages 6-13 and adds togetherthe 'General Fund' and 'Supplemental General Fund' line items.
Summary of General and Supplemental General Fund Expenditures by Function
0
200,000
400,000
600,000
800,000
1,000,000
1,200,000
1,400,000
Instruction Student &Instructional
Support
GeneralAdministration
SchoolAdministration
(Building)
Operations &Maintenance
CapitalImprovements
Other Costs
2006-2007
2007-2008
2008-2009
2008-2009 Summary of General and Supplemental General Fund Expenditures by Function
Instruction56%
Student & Instructional Support
6%
General Administration5%
School Administration (Building)
7%
Operations & Maintenance15%
Other Costs11%
Instruction
Student & Instructional Support
General Administration
School Administration (Building)
Operations & Maintenance
Capital Improvements
Other Costs
9/12/2008 1:47 PM Sumexpen.xls Page 4 of 19

USD# 477
Summary of Special Education Fundby Function
% % % % %2006-2007 of 2007-2008 of inc/ 2008-2009 of inc/
Actual Tot Actual Tot dec Budget Tot dec
Instruction 261,667 93% 322,555 96% 23% 303,269 95% -6%
Student & Instructional Support 0 0% 0 0% 0% 0 0% 0%
General Administration 0 0% 0 0% 0% 0 0% 0%
School Administration (Building) 0 0% 0 0% 0% 0 0% 0%
Operations & Maintenance 0 0% 0 0% 0% 0 0% 0%
Capital Improvements 0 0% 0 0% 0% 0 0% 0%
Other Costs 19,652 7% 13,777 4% -30% 14,622 5% 6%
Total Expenditures 281,319 100% 336,332 100% 20% 317,891 100% -5%
Amount per Pupil $1,172 $1,453 24% $1,266 -13%
The Summary of Special Education Fund Expenditures chart information comes from pages 6-13 and only uses the 'Special Education Fund'line items. (Total expenditures excludes Special Ed Coop Fund because it would include expenditures for all schools participating in the Coop.)
Summary of Special Education Fund Expendituresby Function
0
50,000
100,000
150,000
200,000
250,000
300,000
350,000
Instruction Student &Instructional
Support
GeneralAdministration
SchoolAdministration
(Building)
Operations &Maintenance
CapitalImprovements
Other Costs
2006-2007
2007-2008
2008-2009
2008-2009 Summary of Special Education Fundby Function
Instruction95%
Other Costs5%
Instruction
Student & Instructional Support
General Administration
School Administration (Building)
Operations & Maintenance
Capital Improvements
Other Costs
9/12/2008 1:47 PM Sumexpen.xls Page 5 of 19

USD# 477Instruction Expenditures (1000)
% %2006-2007 2007-2008 inc/ 2008-2009 inc/
Actual Actual dec Budget dec
General 1,135,294 1,040,349 -8% 1,115,575 7%Federal Funds 72,189 59,133 -18% 70,477 19%Supplemental General 3,389 47,784 1310% 95,000 99%At Risk (4yr Old) 16,401 25,075 53% 26,598 6%At Risk (K-12) 80,278 202,955 153% 213,611 5%Bilingual Education 74,235 104,538 41% 97,624 -7%Virtual Education 0Capital Outlay 21,079 14,519 -31% 20,000 38%Driver Education 5,351 5,457 2% 5,521 1%Declining Enrollment 0 0 0% 0 0%Extraordinary School Program 0 0 0% 0 0%Food Service 0 0 0% 0 0%Professional Development 0 0 0% 0 0%Parent Education Program 0 0 0% 0 0%Summer School 0 0 0% 0 0%Special Education 261,667 322,555 23% 303,269 -6%Cost of Living 0 0 0% 0 0%Vocational Education 0 875 0% 960 10%Gifts/Grants 0 0 0% 0 0%Special Liability 0 0 0% 0 0%School Retirement 0 0 0% 0 0%Extraordinary Growth Facilities 0 0 0% 0 0%Special Reserve 0 0 0%KPERS Spec. Ret. Contribution 61,911 67,439 9% 77,555 15%Contingency Reserve 0 0 0%Text Book & Student Material 22,487 20,865 -7%Bond & Interest #1 0 0 0% 0 0%Bond & Interest #2 0 0 0% 0 0%No-Fund Warrant 0 0 0% 0 0%Special Assessment 0 0 0% 0 0%Temporary Note 0 0 0% 0 0%
SUBTOTAL 1,754,281 1,911,544 9% 2,026,190 6%Enrollment (FTE)* 240.0 231.5 -4% 251.0 8%Amount per Pupil 7,310 8,257 13% 8,072 -2%
Adult Education 0 0 0% 0 0%Adult Supplemental Education 0 0 0% 0 0%Area Vocational School 0 0 0% 0 0%Tuition Reimbursement 0 0 0% 0 0%Special Education Coop 0 0 0% 0 0%TOTAL 1,754,281 1,911,544 9% 2,026,190 6%
NOTE: Gifts/Grants includes private grants and grants from nonfederal sources.
Amount per pupil excludes the following funds: Area Vocational School, Adult Education, Adult Supplemental Education,Special Education Coop and Tuition Reimbursement.
*Enrollment (FTE) includes the enrollment of the district used for state aid and budget authority, and all other preschool enrollmentand kindergarten students attending full time.
Instruction Expenditures
0
500,000
1,000,000
1,500,000
2,000,000
2,500,000
2006-2007 2007-2008 2008-2009
Instruction Expenditures
0
200,000
400,000
600,000
800,000
1,000,000
1,200,000
2006-2007 2007-2008 2008-2009
General
Supplemental General
Special Education
9/12/2008 1:47 PM Sumexpen.xls Page 6 of 19

USD# 477
Student and Instructional Support Expenditures (2100 & 2200)
% %2006-2007 2007-2008 inc/ 2008-2009 inc/
Actual Actual dec Budget dec
General 104,649 119,826 15% 124,838 4%Federal Funds 0 0 0% 0 0%Supplemental General 0 0 0% 0 0%At Risk (4yr Old) 0 0 0% 0 0%At Risk (K-12) 0 0 0% 0 0%Bilingual Education 0 0 0% 0 0%Virtual Education 0Capital Outlay 394 0 -100% 0 0%Driver Training 0 0 0% 0 0%Declining Enrollment 0 0 0% 0 0%Extraordinary School Program 0 0 0% 0 0%Food Service 0 0 0% 0 0%Professional Development 9,948 11,146 12% 11,408 2%Parent Education Program 0 0 0% 0 0%Summer School 0 0 0% 0 0%Special Education 0 0 0% 0 0%Cost of Living 0 0 0% 0 0%Vocational Education 0 0 0% 0 0%Gifts/Grants 0 0 0% 0 0%Special Liability 0 0 0% 0 0%School Retirement 0 0 0% 0 0%Extraordinary Growth Facilities 0 0 0% 0 0%Special Reserve 0 0 0%KPERS Spec. Ret. Contribution 4,294 6,353 48% 7,306 15%Contingency Reserve 0 0 0%Text Book & Student Material 27 0 -100%Bond & Interest #1 0 0 0% 0 0%Bond & Interest #2 0 0 0% 0 0%No-Fund Warrant 0 0 0% 0 0%Special Assessment 0 0 0% 0 0%Temporary Note 0 0 0% 0 0%
SUBTOTAL 119,312 137,325 15% 143,552 5%Enrollment (FTE)* 240.0 231.5 -4% 251.0 8%Amount per Pupil 497 593 19% 572 -4%
Adult Education 0 0 0% 0 0%Adult Supplemental Education 0 0 0% 0 0%Area Vocational School 0 0 0% 0 0%Tuition Reimbursement 0 0 0% 0 0%Special Education Coop 0 0 0% 0 0%TOTAL 119,312 137,325 15% 143,552 5%Amount per Pupil $507 $548 8% $586 7%
NOTE: Gifts/Grants includes private grants and grants from nonfederal sources.
Amount per pupil excludes the following funds: Area Vocational School, Adult Education, Adult Supplemental Education,Special Education Coop and Tuition Reimbursement.
*Enrollment (FTE) includes the enrollment of the district used for state aid and budget authority, and all other preschool enrollmentand kindergarten students attending full time.
Student and Instructional Support Expenditures
0
20,000
40,000
60,000
80,000
100,000
120,000
140,000
160,000
2006-2007 2007-2008 2008-2009
9/12/2008 1:47 PM Sumexpen.xls Page 7 of 19

USD# 477
General Administration Expenditures (2300)
% %2006-2007 2007-2008 inc/ 2008-2009 inc/
Actual Actual dec Budget dec
General 100,810 111,986 11% 113,062 1%Federal Funds 0 0 0% 0 0%Supplemental General 0 0 0% 0 0%At Risk (4yr Old) 0 0 0% 0 0%At Risk (K-12) 0 0 0% 0 0%Bilingual Education 0 0 0% 0 0%Virtual Education 0Capital Outlay 436 0 -100% 0 0%Driver Training 0 0 0% 0 0%Declining Enrollment 0 0 0% 0 0%Extraordinary School Program 0 0 0% 0 0%Food Service 0 0 0% 0 0%Professional Development 0 0 0% 0 0%Parent Education Program 0 0 0% 0 0%Summer School 0 0 0% 0 0%Special Education 0 0 0% 0 0%Cost of Living 0 0 0% 0 0%Vocational Education 0 0 0% 0 0%Gifts/Grants 0 0 0% 0 0%Special Liability Expense 0 0 0% 0 0%School Retirement 0 0 0% 0 0%Extraordinary Growth Facilities 0 0 0% 0 0%Special Reserve 0 0 0%KPERS Spec. Ret. Contribution 9,093 4,316 -53% 4,963 15%Contingency Reserve 0 0 0%Text Book & Student Material 0 0 0%Bond & Interest #1 0 0 0% 0 0%Bond & Interest #2 0 0 0% 0 0%No-Fund Warrant 0 0 0% 0 0%Special Assessment 0 0 0% 0 0%Temporary Note 0 0 0% 0 0%
SUBTOTAL 110,339 116,302 5% 118,025 1%Enrollment (FTE)* 240.0 231.5 -4% 251.0 8%Amount per Pupil 460 502 9% 470 -6%
Adult Education 0 0 0% 0 0%Adult Supplemental Education 0 0 0% 0 0%Area Vocational School 0 0 0% 0 0%Tuition Reimbursement 0 0 0% 0 0%Special Education Coop 0 0 0% 0 0%TOTAL 110,339 116,302 5% 118,025 1%
NOTE: Gifts/Grants includes private grants and grants from nonfederal sources.
Amount per pupil excludes the following funds: Area Vocational School, Adult Education, Adult Supplemental Education,Special Education Coop and Tuition Reimbursement.
*Enrollment (FTE) includes the enrollment of the district used for state aid and budget authority, and all other preschool enrollmentand kindergarten students attending full time.
General Administration Expenditures
0
20,000
40,000
60,000
80,000
100,000
120,000
140,000
2006-2007 2007-2008 2008-2009
9/12/2008 1:47 PM Sumexpen.xls Page 8 of 19

USD# 477
School Administration Expenditures (2400)
% %2006-2007 2007-2008 inc/ 2008-2009 inc/
Actual Actual dec Budget dec
General 180,621 168,643 -7% 153,219 -9%Federal Funds 0 0 0% 0 0%Supplemental General 0 0 0% 0 0%At Risk (4yr Old) 0 0 0% 0 0%At Risk (K-12) 0 0 0% 0 0%Bilingual Education 0 0 0% 0 0%Virtual Education 0Capital Outlay 0 0 0% 0 0%Driver Training 0 0 0% 0 0%Declining Enrollment 0 0 0% 0 0%Extraordinary School Program 0 0 0% 0 0%Food Service 0 0 0% 0 0%Professional Development 0 0 0% 0 0%Parent Education Program 0 0 0% 0 0%Summer School 0 0 0% 0 0%Special Education 0 0 0% 0 0%Cost of Living 0 0 0% 0 0%Vocational Education 0 0 0% 0 0%Gifts/Grants 0 0 0% 0 0%Special Liability Expense 0 0 0% 0 0%School Retirement 0 0 0% 0 0%Extraordinary Growth Facilities 0 0 0% 0 0%Special Reserve 0 0 0%KPERS Spec. Ret. Contribution 6,299 4,010 -36% 4,612 15%Contingency Reserve 0 0 0%Text Book & Student Material 0 0 0%Bond & Interest #1 0 0 0% 0 0%Bond & Interest #2 0 0 0% 0 0%No-Fund Warrant 0 0 0% 0 0%Special Assessment 0 0 0% 0 0%Temporary Note 0 0 0% 0 0%
SUBTOTAL 186,920 172,653 -8% 157,831 -9%Enrollment (FTE)* 240.0 231.5 -4% 251.0 8%Amount per Pupil 779 746 -4% 629 -16%
Adult Education 0 0 0% 0 0%Adult Supplemental Education 0 0 0% 0 0%Area Vocational School 0 0 0% 0 0%Tuition Reimbursement 0 0 0% 0 0%Special Education Coop 0 0 0% 0 0%TOTAL 186,920 172,653 -8% 157,831 -9%
NOTE: Gifts/Grants includes private grants and grants from nonfederal sources.
Amount per pupil excludes the following funds: Area Vocational School, Adult Education, Adult Supplemental Education,Special Education Coop and Tuition Reimbursement.
*Enrollment (FTE) includes the enrollment of the district used for state aid and budget authority, and all other preschool enrollmentand kindergarten students attending full time.
School Administration Expenditures
020,00040,00060,00080,000
100,000120,000140,000160,000180,000200,000
2006-2007 2007-2008 2008-2009
9/12/2008 1:47 PM Sumexpen.xls Page 9 of 19

USD# 477
Operations and Maintenance Expenditures (2600)
% %2006-2007 2007-2008 inc/ 2008-2009 inc/
Actual Actual dec Budget dec
General 122,015 128,238 5% 129,815 1%Federal Funds 0 0 0% 0 0%Supplemental General 169,848 176,333 4% 190,600 8%At Risk (4yr Old) 0 0 0% 0 0%At Risk (K-12) 0 0 0% 0 0%Bilingual Education 0 0 0% 0 0%Virtual Education 0Capital Outlay 0 131,934 0% 50,000 -62%Driver Training 0 0 0% 0 0%Declining Enrollment 0 0 0% 0 0%Extraordinary School Program 0 0 0% 0 0%Food Service 6,248 0 -100% 0 0%Professional Development 0 0 0% 0 0%Parent Education Program 0 0 0% 0 0%Summer School 0 0 0% 0 0%Special Education 0 0 0% 0 0%Cost of Living 0 0 0% 0 0%Vocational Education 0 0 0% 0 0%Gifts/Grants 0 0 0% 0 0%Special Liability 0 0 0% 0 0%School Retirement 0 0 0% 0 0%Extraordinary Growth Facilities 0 0 0% 0 0%Special Reserve 0 0 0%KPERS Spec. Ret. Contribution 5,382 7,390 37% 8,499 15%Contingency Reserve 0 0 0%Text Book & Student Material 0 0 0%Bond & Interest #1 0 0 0% 0 0%Bond & Interest #2 0 0 0% 0 0%No-Fund Warrant 0 0 0% 0 0%Special Assessment 0 0 0% 0 0%Temporary Note 0 0 0% 0 0%
SUBTOTAL 303,493 443,895 46% 378,914 -15%Enrollment (FTE)* 240.0 231.5 -4% 251.0 8%Amount per Pupil 1,265 1,917 52% 1,510 -21%
Adult Education 0 0 0% 0 0%Adult Supplemental Education 0 0 0% 0 0%Area Vocational School 0 0 0% 0 0%Tuition Reimbursement 0 0 0% 0 0%Special Education Coop 0 0 0% 0 0%TOTAL 303,493 443,895 46% 378,914 -15%
NOTE: Gifts/Grants includes private grants and grants from nonfederal sources.
Amount per pupil excludes the following funds: Area Vocational School, Adult Education, Adult Supplemental Education,Special Education Coop and Tuition Reimbursement.
*Enrollment (FTE) includes the enrollment of the district used for state aid and budget authority, and all other preschool enrollmentand kindergarten students attending full time.
Operations and Maintenance Expenditures
0
50,000
100,000
150,000
200,000
250,000
300,000
350,000
400,000
450,000
500,000
2006-2007 2007-2008 2008-2009
9/12/2008 1:47 PM Sumexpen.xls Page 10 of 19

USD# 477
Other Costs(2500 & 2900: Other Supplemental Services)
(2700: Transportation)(3000: Non-Instruction Services)
% %2006-2007 2007-2008 inc/ 2008-2009 inc/
Actual Actual dec Budget dec
General 93,118 181,196 95% 157,043 -13%Federal Funds 0 0 0% 0 0%Supplemental General 63,537 61,175 -4% 73,400 20%At Risk (4yr Old) 0 0 0% 0 0%At Risk (K-12) 0 0 0% 0 0%Bilingual Education 0 0 0% 0 0%Virtual Education 0Capital Outlay 8,456 77,698 819% 80,000 3%Driver Training 0 0 0% 0 0%Declining Enrollment 0 0 0% 0 0%Extraordinary School Program 0 0 0% 0 0%Food Service 150,307 161,786 8% 173,996 8%Professional Development 0 0 0% 0 0%Parent Education Program 0 0 0% 0 0%Summer School 0 0 0% 0 0%Special Education 19,652 13,777 -30% 14,622 6%Cost of Living 0 0 0% 0 0%Vocational Education 0 0 0% 0 0%Gifts/Grants 0 0 0% 0 0%Special Liability 0 0 0% 0 0%School Retirement 0 0 0% 0 0%Extraordinary Growth Facilities 0 0 0% 0 0%Special Reserve 0 0 0%KPERS Spec. Ret. Contribution 5,321 12,098 127% 13,912 15%Contingency Reserve 0 0 0%Text Book & Student Material 0 0 0%Bond & Interest #1 0 0 0% 0 0%Bond & Interest #2 0 0 0% 0 0%No-Fund Warrant 0 0 0% 0 0%Special Assessment 0 0 0% 0 0%Temporary Note 0 0 0% 0 0%
SUBTOTAL 340,391 507,730 49% 512,973 1%Enrollment (FTE)* 240.0 231.5 -4% 251.0 8%Amount per Pupil 1,418 2,193 55% 2,044 -7%
Adult Education 0 0 0% 0 0%Adult Supplemental Education 0 0 0% 0 0%Area Vocational School 0 0 0% 0 0%Tuition Reimbursement 0 0 0% 0 0%Special Education Coop 0 0 0% 0 0%TOTAL 340,391 507,730 49% 512,973 1%
NOTE: Gifts/Grants includes private grants and grants from nonfederal sources.
Amount per pupil excludes the following funds: Area Vocational School, Adult Education, Adult Supplemental Education,Special Education Coop and Tuition Reimbursement.
*Enrollment (FTE) includes the enrollment of the district used for state aid and budget authority, and all other preschool enrollmentand kindergarten students attending full time.
Other Costs
0
100,000
200,000
300,000
400,000
500,000
600,000
2006-2007 2007-2008 2008-2009
9/12/2008 1:47 PM Sumexpen.xls Page 11 of 19

USD# 477
Capital Improvements Expenditures (4000)
% %2006-2007 2007-2008 inc/ 2008-2009 inc/
Actual Actual dec Budget dec
General 0 0 0% 0 0%Federal Funds 0 0 0% 0 0%Supplemental General 0 0 0% 0 0%At Risk (4yr Old) 0 0 0% 0 0%At Risk (K-12) 0 0 0% 0 0%Bilingual Education 0 0 0% 0 0%Virtual Education 0Capital Outlay 85,780 95,093 11% 40,249 -58%Driver Training 0 0 0% 0 0%Declining Enrollment 0 0 0% 0 0%Extraordinary School Program 0 0 0% 0 0%Food Service 0 0 0% 0 0%Professional Development 0 0 0% 0 0%Parent Education Program 0 0 0% 0 0%Summer School 0 0 0% 0 0%Special Education 0 0 0% 0 0%Cost of Living 0 0 0% 0 0%Vocational Education 0 0 0% 0 0%Gifts/Grants 0 0 0% 0 0%Special Liability 0 0 0% 0 0%School Retirement 0 0 0% 0 0%Extraordinary Growth Facilities 0 0 0% 0 0%Special Reserve 0 0 0%KPERS Spec. Ret. Contribution 0 0 0% 0 0%Contingency Reserve 0 0 0%Text Book & Student Material 0 0 0%Bond & Interest #1 0 0 0% 0 0%Bond & Interest #2 0 0 0% 0 0%No-Fund Warrant 0 0 0% 0 0%Special Assessment 0 0 0% 0 0%Temporary Note 0 0 0% 0 0%
SUBTOTAL 85,780 95,093 11% 40,249 -58%Enrollment (FTE)* 240.0 231.5 -4% 251.0 8%Amount per Pupil 357 411 15% 160 -61%
Adult Education 0 0 0% 0 0%Adult Supplemental Education 0 0 0% 0 0%Area Vocational School 0 0 0% 0 0%Tuition Reimbursement 0 0 0% 0 0%Special Education Coop 0 0 0% 0 0%TOTAL 85,780 95,093 11% 40,249 -58%
NOTE: Gifts/Grants includes private grants and grants from nonfederal sources.
Amount per pupil excludes the following funds: Area Vocational School, Adult Education, Adult Supplemental Education,Special Education Coop and Tuition Reimbursement.
*Enrollment (FTE) includes the enrollment of the district used for state aid and budget authority, and all other preschool enrollmentand kindergarten students attending full time.
Capital Improvements (4000)
0
10,000
20,000
30,000
40,000
50,000
60,000
70,000
80,000
90,000
100,000
2006-2007 2007-2008 2008-2009
9/12/2008 1:47 PM Sumexpen.xls Page 12 of 19

USD# 477
Debt Services Expenditures (5100)
% %2006-2007 2007-2008 inc/ 2008-2009 inc/
Actual Actual dec Budget dec
General 0 0 0% 0 0%Federal Funds 0 0 0% 0 0%Supplemental General 0 0 0% 0 0%At Risk (4yr Old) 0 0 0% 0 0%At Risk (K-12) 0 0 0% 0 0%Bilingual Education 0 0 0% 0 0%Virtual Education 0Capital Outlay 0 0 0% 0 0%Driver Training 0 0 0% 0 0%Declining Enrollment 0 0 0% 0 0%Extraordinary School Program 0 0 0% 0 0%Food Service 0 0 0% 0 0%Professional Development 0 0 0% 0 0%Parent Education Program 0 0 0% 0 0%Summer School 0 0 0% 0 0%Special Education 0 0 0% 0 0%Cost of Living 0 0 0% 0 0%Vocational Education 0 0 0% 0 0%Gifts/Grants 0 0 0% 0 0%Special Liability 0 0 0% 0 0%School Retirement 0 0 0% 0 0%Extraordinary Growth Facilities 0 0 0% 0 0%Special Reserve 0 0 0%KPERS Spec. Ret. Contribution 0 0 0% 0 0%Contingency Reserve 0 0 0%Text Book & Student Material 0 0 0%Bond & Interest #1 0 0 0% 0 0%Bond & Interest #2 0 0 0% 0 0%No-Fund Warrant 0 0 0% 0 0%Special Assessment 0 0 0% 0 0%Temporary Note 0 0 0% 0 0%
SUBTOTAL 0 0 0% 0 0%Enrollment (FTE)* 240.0 231.5 -4% 251.0 8%Amount per Pupil 0 0 0% 0 0%
Adult Education 0 0 0% 0 0%Adult Supplemental Education 0 0 0% 0 0%Area Vocational School 0 0 0% 0 0%Tuition Reimbursement 0 0 0% 0 0%Special Education Coop 0 0 0% 0 0%TOTAL 0 0 0% 0 0%
NOTE: Gifts/Grants includes private grants and grants from nonfederal sources.
Amount per pupil excludes the following funds: Area Vocational School, Adult Education, Adult Supplemental Education,Special Education Coop and Tuition Reimbursement.
*Enrollment (FTE) includes the enrollment of the district used for state aid and budget authority, and all other preschool enrollmentand kindergarten students attending full time.
Debt Services (5100)
00000111111
2006-2007 2007-2008 2008-2009
9/12/2008 1:47 PM Sumexpen.xls Page 13 of 19

USD# 477
Transfers (5200)
% %2006-2007 2007-2008 inc/ 2008-2009 inc/
Actual Actual dec Budget dec
General 501,640 690,891 38% 674,742 -2%Federal Funds 0 0 0% 0 0%Supplemental General 48,396 60,477 25% 31,769 -47%At Risk (4yr Old) 0 0 0% 0 0%At Risk (K-12) 0 0 0% 0 0%Bilingual Education 0 0 0% 0 0%Virtual Education 0Capital OutlayDriver Training 0 0 0% 0 0%Declining Enrollment 0 0 0% 0 0%Extraordinary School Program 0 0 0% 0 0%Food Service 0 0 0% 0 0%Professional Development 0 0 0% 0 0%Parent Education Program 0 0 0% 0 0%Summer School 0 0 0% 0 0%Special Education 0 0 0% 0 0%Cost of Living 0 0 0% 0 0%Vocational Education 0 0 0% 0 0%Gifts/Grants 0 0 0% 0 0%Special Liability 0 0 0% 0 0%School Retirement 0 0 0% 0 0%Extraordinary Growth Facilities 0 0 0% 0 0%Special Reserve 0 0 0%KPERS Spec. Ret. Contribution 0 0 0% 0 0%Contingency Reserve 0 0 0%Text Book & Student Material 0 0 0%Bond & Interest #1 0 0 0% 0 0%Bond & Interest #2 0 0 0% 0 0%No-Fund Warrant 0 0 0% 0 0%Special Assessment 0 0 0% 0 0%Temporary Note 0 0 0% 0 0%
SUBTOTAL 550,036 751,368 37% 706,511 -6%Enrollment (FTE)* 240.0 231.5 -4% 251.0 8%Amount per Pupil 2,292 3,246 42% 2,815 -13%
Adult Education 0 0 0% 0 0%Adult Supplemental Education 0 0 0% 0 0%Area Vocational School 0 0 0% 0 0%Tuition Reimbursement 0 0 0% 0 0%Special Education Coop 0 0 0% 0 0%TOTAL 550,036 751,368 37% 706,511 -6%
NOTE: Gifts/Grants includes private grants and grants from nonfederal sources.
Amount per pupil excludes the following funds: Area Vocational School, Adult Education, Adult Supplemental Education,Special Education Coop and Tuition Reimbursement.
*Enrollment (FTE) includes the enrollment of the district used for state aid and budget authority, and all other preschool enrollmentand kindergarten students attending full time.
Transfers (5200)
0
100,000
200,000
300,000
400,000
500,000
600,000
700,000
800,000
2006-2007 2007-2008 2008-2009
9/12/2008 1:47 PM Sumexpen.xls Page 14 of 19

USD# 477Miscellaneous Information
Unencumbered Cash Balance by Fund
July 1, 2006 July 1, 2007 July 1, 2008General 0 0 132Federal Funds -787 0 0Supplemental General 0 10,521 5,037At Risk (4yr Old) 3,491 42 2,080At Risk (K-12) 1,612 6,272 6,353Bilingual Education 774 774 775Virtual Education 0Capital Outlay 212,556 236,044 179,646Driver Training 1,894 111 754Declining Enrollment 0 0 0Extraordinary School Program 0 0 0Food Service 0 4,884 9,762Professional Development 0 0 741Parent Education Program 0 0 0Summer School 0 0 0Special Education 14,766 52,375 6,519Cost of Living 0 0Vocational Education 0 0 0Gifts/Grants 0 0 0Special Liability 0 0 0School Retirement 0 0 0Extraordinary Growth Facilities 0 0 0Special Reserve 0 0KPERS Spec. Ret. Contribution 0 0 0Contingency Reserve 51,340 56,340Text Book & Student Material 22,514 15,151Bond & Interest 1 0 0 0Bond & Interest 2 0 0 0No Fund Warrant 0 0 0Special Assessment 0 0 0Temporary Note 0 0 0
SUBTOTAL 308,160 382,514 211,799Enrollment (FTE)* 240.0 231.5 251.0Amount per Pupil 1,284 1,652 844
Adult Education 0 0 0Adult Supplemental Education 0 0 0Area Vocational School 0 0 0Tuition Reimbursement 0 0 0Special Education Coop 0 0 0TOTAL 308,160 382,514 211,799
NOTE: Gifts/Grants includes private grants and grants from nonfederal sources.
Amount per pupil excludes the following funds: Area Vocational School, Adult Education, Adult Supplemental Education,Special Education Coop and Tuition Reimbursement.
*Enrollment (FTE) includes the enrollment of the district used for state aid and budget authority, and all other preschool enrollmentand kindergarten students attending full time.
Unencumbered Cash Balances by Fund
0
50,000
100,000
150,000
200,000
250,000
300,000
350,000
400,000
450,000
July 1, 2006 July 1, 2007 July 1, 2008
9/12/2008 1:47 PM Sumexpen.xls Page 15 of 19

USD# 477
Reserve FundsUnencumbered Cash Balance
July 1, 2006 July 1, 2007Special Reserve 0 0TOTAL OTHER 0 0Amount per Pupil $0 $0
*School districts are authorized by law to self insure rather than purchase insurance for the following categories: Worker's Comp,Health Insurance, Life Insurance, Property and Casualty (Risk Management) and Disability Income Insurance. Monies are placedin the Self Insured Fund to pay for claims which may arise from the categories listed above.
Unencumbered Cash Balances by Fund (Reserve Funds Only)
0
0
0
0
0
1
1
1
1
1
1
July 1, 2006 July 1, 2007
9/12/2008 1:47 PM Sumexpen.xls Page 16 of 19

USD# 477Other Information
2004-2005 2005-2006 % 2006-2007 % 2007-2008 % 2008-2009 %Actual Actual inc/ Actual inc/ Actual inc/ Budget inc/
dec dec dec dec
Enrollment (FTE)* 241.0 242.4 1% 235.5 -3% 250.5 6% 245.0 -2%
Enrollment (FTE)** 262.0 274.0 5% 240.0 -12% 231.5 -4% 251.0 8%Number of Students - Free Meals 85 62 -27% 67 8% 105 57% 100 -5%Number of Students - Reduced Meals 34 41 21% 33 -20% 18 -45% 30 67%
*FTE for state aid and budget authority purposes for general fund (excludes 4 yr old at-risk).
** FTE includes 9/20 enrollment used for state aid purposes and adding the additional FTE for preschool programs, headstart, and all-daykindergarten. For example, preschool students attending half days on September 20th would be counted as .5 FTE. Kindergartenstudents attending full time every day would be counted as 1.0 FTE.
Enrollment (FTE)* for Budget Authority
0.0
50.0
100.0
150.0
200.0
250.0
300.0
2004-2005 2005-2006 2006-2007 2007-2008 2008-2009
Low Income Students
0
20
40
60
80
100
120
2004-2005 2005-2006 2006-2007 2007-2008 2008-2009
Free Meals
Reduced Meals
Enrollment (FTE)** Used for Calculating "Amount Per Pupil"
210.0
220.0
230.0
240.0
250.0
260.0
270.0
280.0
2004-2005 2005-2006 2006-2007 2007-2008 2008-2009
9/12/2008 1:47 PM Sumexpen.xls Page 17 of 19

USD# 477
Miscellaneous InformationMill Rates by Fund
2006-2007 2007-2008 2008-2009Actual Actual Budget
General 20.000 20.000 20.000Supplemental General 14.963 14.918 14.909Adult Education 0.000 0.000 0.000Capital Outlay 3.990 3.985 4.000Declining Enrollment 0.000 0.000 0.000Cost of Living 0.000 0.000 0.000Special Liability 0.000 0.000 0.000School Retirement 0.000 0.000 0.000Extraordinary Growth Facilities 0.000 0.000 0.000Bond & Interest 1 0.000 0.000 0.000Bond & Interest 2 0.000 0.000 0.000No Fund Warrant 0.000 0.000 0.000Special Assessment 0.000 0.000 0.000Temporary Note 0.000 0.000 0.000TOTAL USD 38.953 38.903 38.909Historical Museum 0.000 0.000 0.000Public Library Board 0.000 0.000 0.000Public Library Brd & Emp Benf 0.000 0.000 0.000Recreation Commission 2.493 2.490 2.500Recreation Commission Employee Benefit 0.365 0.223 0.387TOTAL OTHER 2.858 2.713 2.887
2008-2009 Miscellaneous InformationMill Rates by Fund (Total USD)
General52%Supplemental General
38%
Capital Outlay10%
General
Supplemental General
Adult Education
Capital Outlay
Special Liability
School Retirement
Declining Enrollment
Cost of Living
Bond & Interest 1
Bond & Interest 2
Extraordinary Growth Facilities
No Fund Warrant
Special Assessment
Temporary Note
Total USD Mill Rates
0.000
5.000
10.000
15.000
20.000
25.000
30.000
35.000
40.000
45.000
2006-2007 2007-2008 2008-2009
9/12/2008 1:47 PM Sumexpen.xls Page 18 of 19

USD# 477Other Information
2006-2007 2007-2008 2008-2009Actual Actual Budget
Assessed Valuation $17,093,551 $17,211,253 $17,454,963
Bonded Indebtedness $0 $0 $0
Assessed Valuation
$0$2,000,000$4,000,000$6,000,000$8,000,000
$10,000,000$12,000,000$14,000,000$16,000,000$18,000,000$20,000,000
2006-2007 2007-2008 2008-2009
Bonded Indebtedness
$0
$0
$0
$0
$0
$1
$1
$1
$1
$1
$1
2006-2007 2007-2008 2008-2009
9/12/2008 1:47 PM Sumexpen.xls Page 19 of 19