Infrastrutture Wireless Italiane...Infrastrutture Wireless Italiane A strong signal FY 2015...
23
Infrastrutture Wireless Italiane A strong signal FY 2015 preliminary financial results & 2016–18 business plan February 3, 2016 In line with the future
Transcript of Infrastrutture Wireless Italiane...Infrastrutture Wireless Italiane A strong signal FY 2015...
Infrastrutture Wireless Italiane A strong signal
FY 2015 preliminary financial results &
2016–18 business plan February 3, 2016
In line with the future
Oscar Cicchetti, Rafael Perrino 1
FY 2015 preliminary financial results & 2016–18 BP
In line with the future
Safe harbour
This presentation contains statements that constitute forward looking statements within the meaning of the Private Securities Litigation Reform Act of 1995. These statements appear in a number of places in this presentation and include statements regarding the intent, belief or current expectations
of the estimates regarding future growth of the business, market share, financial results and other aspects of the activities and situation relating to Infrastrutture Wireless Italiane S.p.A. (INWIT). Such forward looking statements are not guarantees of future performance and involve risks and uncertainties, and actual results may differ materially from those projected or implied in the forward looking statements as a result of various factors.
Consequently, INWIT makes no representation, whether expressed or implied, as to the conformity of the actual results with those projected in the forward looking statements.
Forward-looking information is based on certain key assumptions which we believe to be reasonable as of the date hereof, but forward looking information by its nature involves risks and uncertainties, which are outside our control, and could significantly affect expected results. Analysts and investors are cautioned not to place undue reliance on those forward looking statements, which speak only as of the date of this presentation. INWIT
undertakes no obligation to release publicly the results of any revisions to these forward looking statements which may be made to reflect events and circumstances after the date of this presentation, including, without limitation, changes in INWIT business or acquisition strategy or planned capital expenditures or to reflect the occurrence of unanticipated events.
The FY2015 financial information of INWIT has been prepared in accordance with the International Financial Reporting Standards issued by the International Accounting Standards Board and endorsed by the European Union (designated as “IFRS”). The related figures disclosed in this
document have to be considered as preliminary results.
INWIT was incorporated on January 14, 2015 and the Tower Business was contributed to it from the Telecom Italia Group effective as of April 1,
2015; therefore the financial information of INWIT does not include comparative information and the FY2015 economic results relate in substance to the nine-month period from April 1, 2015 to December 31, 2015.
Please note that the audit on the Financial Statements of INWIT as of December 31, 2015 has not yet been completed.
The 9-months 2014 pro forma financial information (9M PF 2014) included in this presentation for comparative purposes was calculated as 75% of the
pro forma financial information of INWIT for the year ended December 31, 2014 as presented in the IPO prospectus and is unaudited.
The 9-months 2014 (9M 2014) financial information included in this presentation for comparative purposes was calculated as 75% of the annual 2014
financial information of the Tower Business prior to the Transfer to INWIT as presented in the IPO prospectus and is unaudited. The financial information of the Tower Business prior to the Transfer has been calculated on the basis of the Telecom Italia Group accounting records and management accounts used to prepare the Telecom Italia Group consolidated financial statements for the corresponding period and is unaudited.
Oscar Cicchetti, Rafael Perrino 2
FY 2015 preliminary financial results & 2016–18 BP
In line with the future
In line with the future
1
2
3
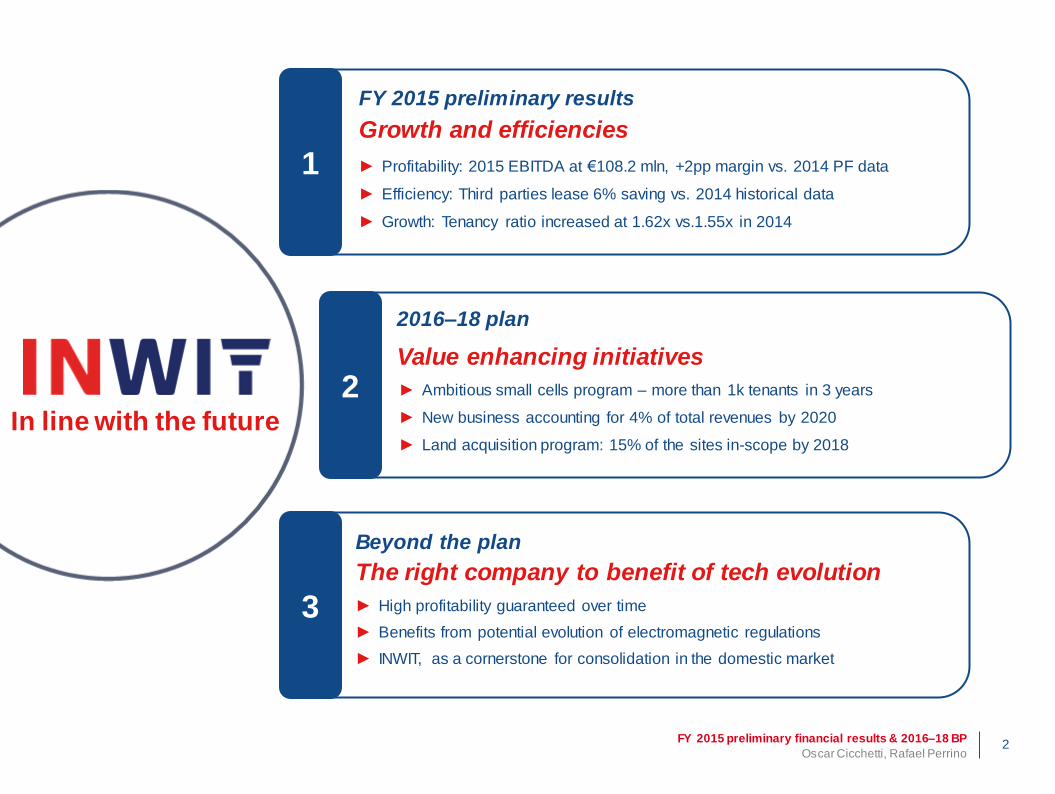
FY 2015 preliminary results
Growth and efficiencies
2016–18 plan
Value enhancing initiatives
Beyond the plan
The right company to benefit of tech evolution
► Growth: Tenancy ratio increased at 1.62x vs.1.55x in 2014
► Profitability: 2015 EBITDA at €108.2 mln, +2pp margin vs. 2014 PF data
► Ambitious small cells program – more than 1k tenants in 3 years
► Land acquisition program: 15% of the sites in-scope by 2018
► Efficiency: Third parties lease 6% saving vs. 2014 historical data
► High profitability guaranteed over time
► Benefits from potential evolution of electromagnetic regulations
► New business accounting for 4% of total revenues by 2020
► INWIT, as a cornerstone for consolidation in the domestic market
2015 preliminary results
Growth and efficiencies
Oscar Cicchetti – CEO
Rafael Perrino – CFO
Oscar Cicchetti, Rafael Perrino 4
FY 2015 preliminary financial results & 2016–18 BP
In line with the future
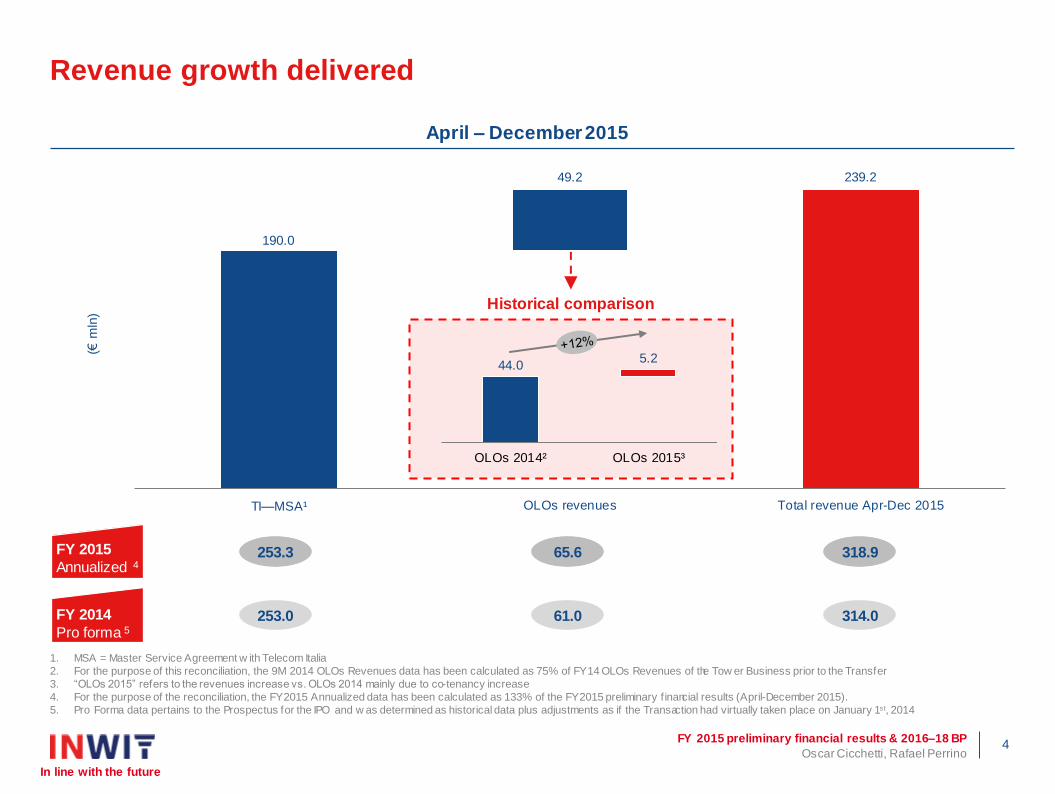
190.0
49.2 239.2
TI—MSA¹ OLOs revenues Total revenue Apr-Dec 2015
(€ m
ln)
Revenue growth delivered
1. MSA = Master Service Agreement w ith Telecom Italia
2. For the purpose of this reconciliation, the 9M 2014 OLOs Revenues data has been calculated as 75% of FY14 OLOs Revenues of the Tow er Business prior to the Transfer
3. “OLOs 2015” refers to the revenues increase vs. OLOs 2014 mainly due to co-tenancy increase
4. For the purpose of the reconciliation, the FY2015 Annualized data has been calculated as 133% of the FY2015 preliminary f inancial results (April-December 2015).
5. Pro Forma data pertains to the Prospectus for the IPO and w as determined as historical data plus adjustments as if the Transaction had virtually taken place on January 1st, 2014
FY 2015
Annualized 4
44.0 5.2
OLOs 2014² OLOs 2015³
FY 2014
Pro forma 5 61.0 314.0 253.0
65.6 253.3 318.9
Historical comparison
April – December 2015
Oscar Cicchetti, Rafael Perrino 5
FY 2015 preliminary financial results & 2016–18 BP
In line with the future
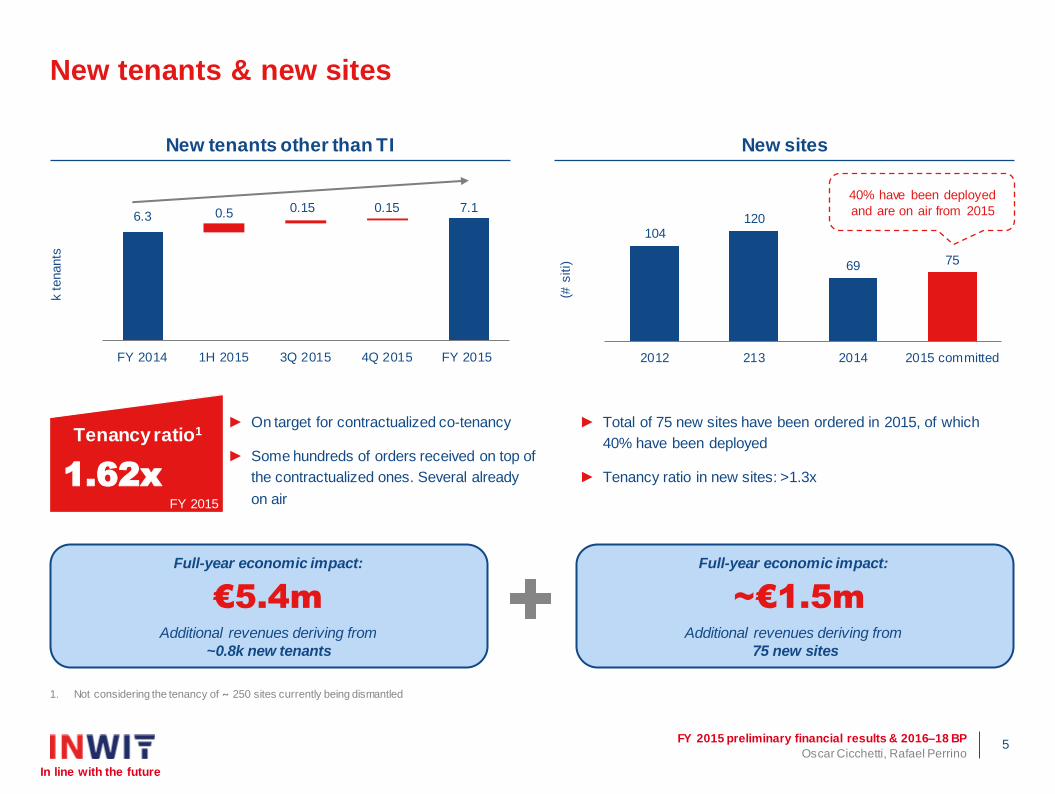
Additional revenues deriving from
~0.8k new tenants
€5.4m
Full-year economic impact:
~€1.5m
Additional revenues deriving from
75 new sites
Full-year economic impact:
► Total of 75 new sites have been ordered in 2015, of which
40% have been deployed
► Tenancy ratio in new sites: >1.3x
► On target for contractualized co-tenancy
► Some hundreds of orders received on top of
the contractualized ones. Several already
on air
Tenancy ratio1
1.62x
FY 2015
New tenants & new sites
6.3 0.5 0.15 0.15 7.1
FY 2014 1H 2015 3Q 2015 4Q 2015 FY 2015
k tenants
104 120
69 75
2012 213 2014 2015 committed
(# s
iti)
1. Not considering the tenancy of ~ 250 sites currently being dismantled
40% have been deployed
and are on air from 2015
New tenants other than TI New sites
Oscar Cicchetti, Rafael Perrino 6
FY 2015 preliminary financial results & 2016–18 BP
In line with the future
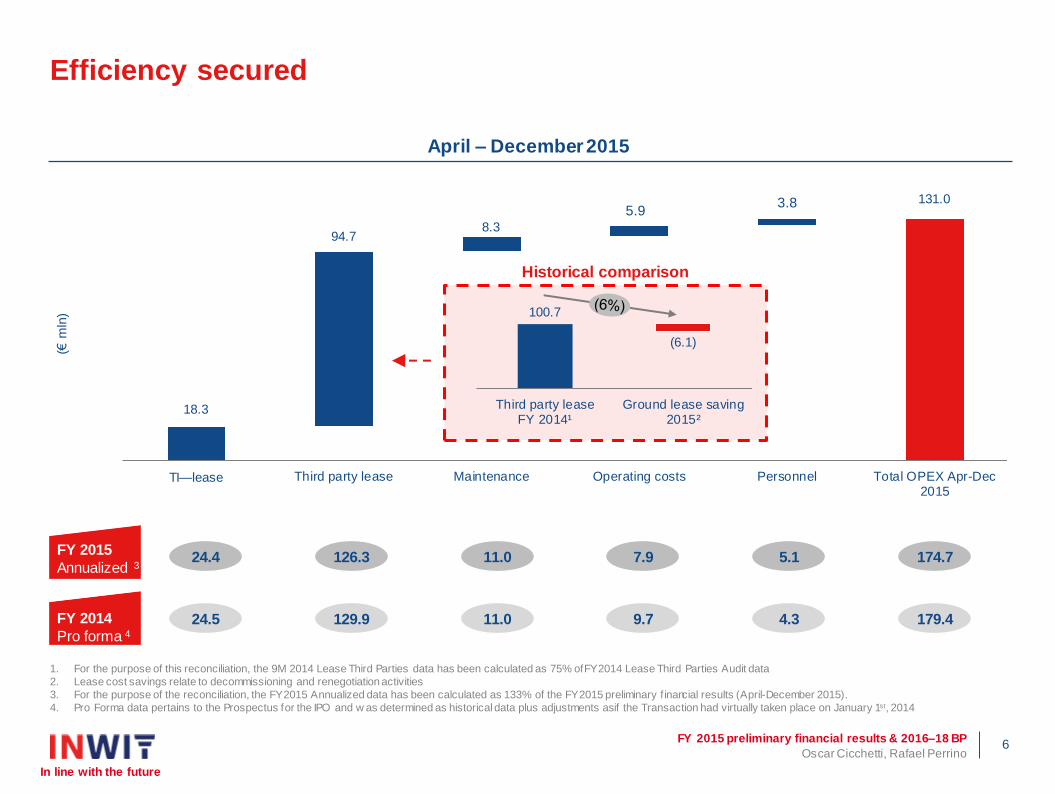
18.3
94.7 8.3
6.3 3.4 131.0
TI—lease Third party lease Maintenance Operating costs Personnel Total OPEX Apr-Dec2015
(€ m
ln)
Efficiency secured
FY 2015
Annualized 3
FY 2014
Pro forma 4
24.4 174.7 126.3 11.0 7.9 5.1
24.5 179.4 129.9 11.0 9.7 4.3
100.7
(6.1)
Third party leaseFY 2014¹
Ground lease saving2015²
Historical comparison
1. For the purpose of this reconciliation, the 9M 2014 Lease Third Parties data has been calculated as 75% of FY2014 Lease Third Parties Audit data
2. Lease cost savings relate to decommissioning and renegotiation activities
3. For the purpose of the reconciliation, the FY2015 Annualized data has been calculated as 133% of the FY2015 preliminary f inancial results (April-December 2015).
4. Pro Forma data pertains to the Prospectus for the IPO and w as determined as historical data plus adjustments as if the Transaction had virtually taken place on January 1st, 2014
April – December 2015
3.8 5.9
Oscar Cicchetti, Rafael Perrino 7
FY 2015 preliminary financial results & 2016–18 BP
In line with the future
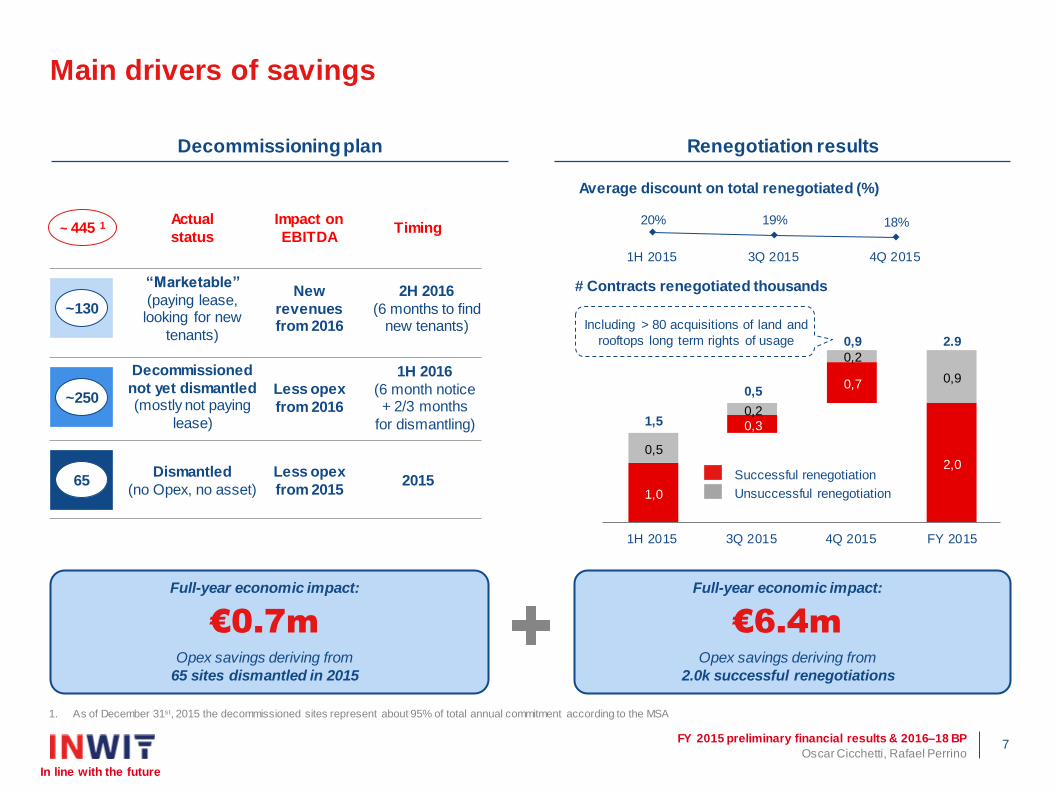
2,0
1,0
0,3
0,7 0,9
0,5
0,2
0,2
1,5
0,5
0,9 2.9
1H 2015 3Q 2015 4Q 2015 FY 2015
Average discount on total renegotiated (%)
# Contracts renegotiated thousands
Successful renegotiation
Unsuccessful renegotiation
~ 445 1 Timing Actual
status
Impact on
EBITDA
~250
1H 2016
(6 month notice + 2/3 months
for dismantling)
Decommissioned
not yet dismantled (mostly not paying
lease)
Less opex
from 2016
Less opex
from 2015
~130
2H 2016
(6 months to find new tenants)
“Marketable”
(paying lease, looking for new
tenants)
New
revenues from 2016
65 2015 Dismantled
(no Opex, no asset)
Main drivers of savings
Opex savings deriving from
65 sites dismantled in 2015
€0.7m
Full-year economic impact:
€6.4m
Opex savings deriving from
2.0k successful renegotiations
Full-year economic impact:
Including > 80 acquisitions of land and
rooftops long term rights of usage
20% 19% 18%
1H 2015 3Q 2015 4Q 2015
1. As of December 31st, 2015 the decommissioned sites represent about 95% of total annual commitment according to the MSA
Decommissioning plan Renegotiation results
Oscar Cicchetti, Rafael Perrino 8
FY 2015 preliminary financial results & 2016–18 BP
In line with the future
Stadiums
& arenas
Government
buildings
Hospitals
Hotels
Factories
Offices
Campuses
Airports,
subways
Shopping
malls
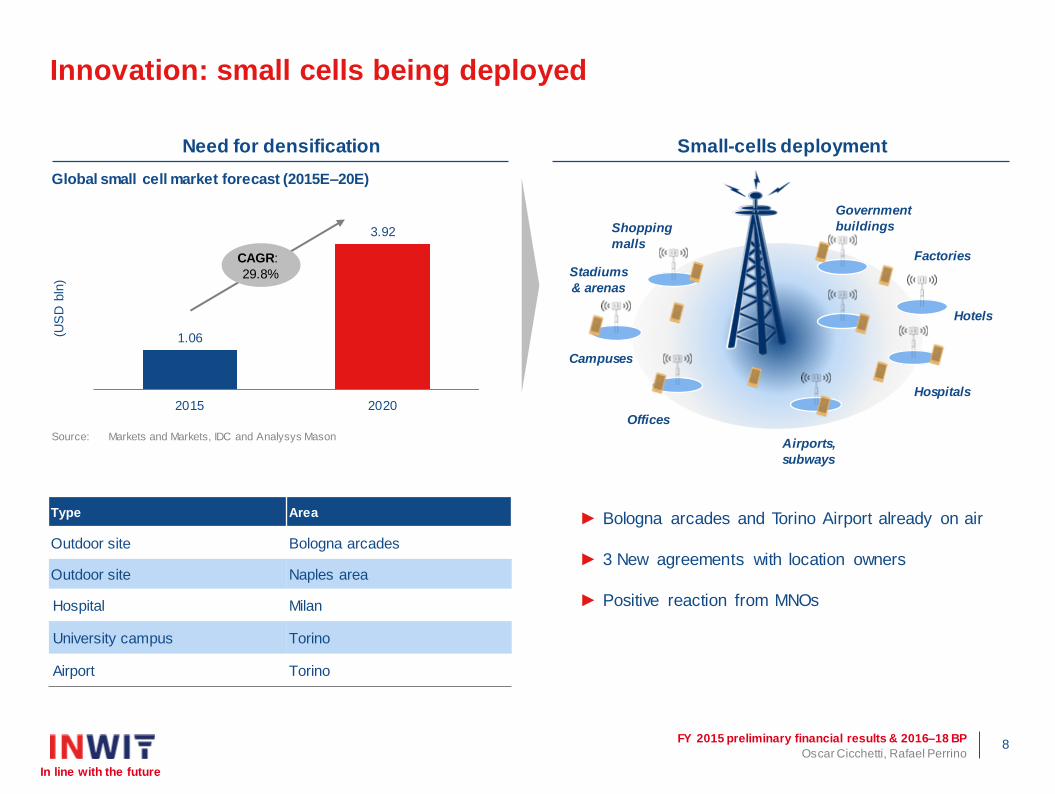
Source: Markets and Markets, IDC and Analysys Mason
Global small cell market forecast (2015E–20E)
► Bologna arcades and Torino Airport already on air
► 3 New agreements with location owners
► Positive reaction from MNOs
Type Area
Outdoor site Bologna arcades
Outdoor site Naples area
Hospital Milan
University campus Torino
Airport Torino
Innovation: small cells being deployed
1.06
3.92
2015 2020
(US
D b
ln)
CAGR:
29.8%
Need for densification Small-cells deployment

2015 preliminary results
financial results presentation
Oscar Cicchetti – CEO
Rafael Perrino – CFO
Oscar Cicchetti, Rafael Perrino 10
FY 2015 preliminary financial results & 2016–18 BP
In line with the future
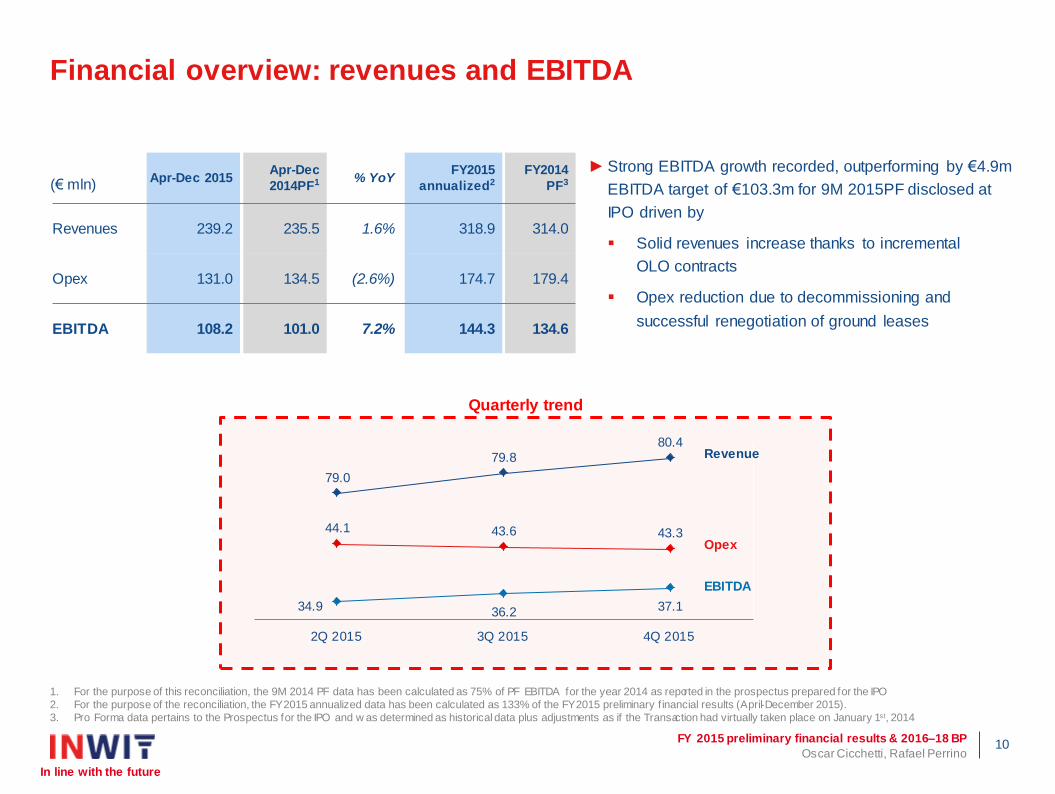
► Strong EBITDA growth recorded, outperforming by €4.9m
EBITDA target of €103.3m for 9M 2015PF disclosed at
IPO driven by
Solid revenues increase thanks to incremental
OLO contracts
Opex reduction due to decommissioning and
successful renegotiation of ground leases
Quarterly trend
44.1 43.6 43.3
34.9 36.2 37.1
79.0
79.8 80.4
2Q 2015 3Q 2015 4Q 2015
Apr-Dec 2015 Apr-Dec
2014PF1 % YoY FY2015
annualized2
FY2014
PF3
Revenues 239.2 235.5 1.6% 318.9 314.0
Opex 131.0 134.5 (2.6%) 174.7 179.4
EBITDA 108.2 101.0 7.2% 144.3 134.6
Revenue
Opex
EBITDA
Financial overview: revenues and EBITDA
1. For the purpose of this reconciliation, the 9M 2014 PF data has been calculated as 75% of PF EBITDA for the year 2014 as reported in the prospectus prepared for the IPO
2. For the purpose of the reconciliation, the FY2015 annualized data has been calculated as 133% of the FY2015 preliminary f inancial results (April-December 2015).
3. Pro Forma data pertains to the Prospectus for the IPO and w as determined as historical data plus adjustments as if the Transaction had virtually taken place on January 1st, 2014
(€ mln)
Oscar Cicchetti, Rafael Perrino 11
FY 2015 preliminary financial results & 2016–18 BP
In line with the future
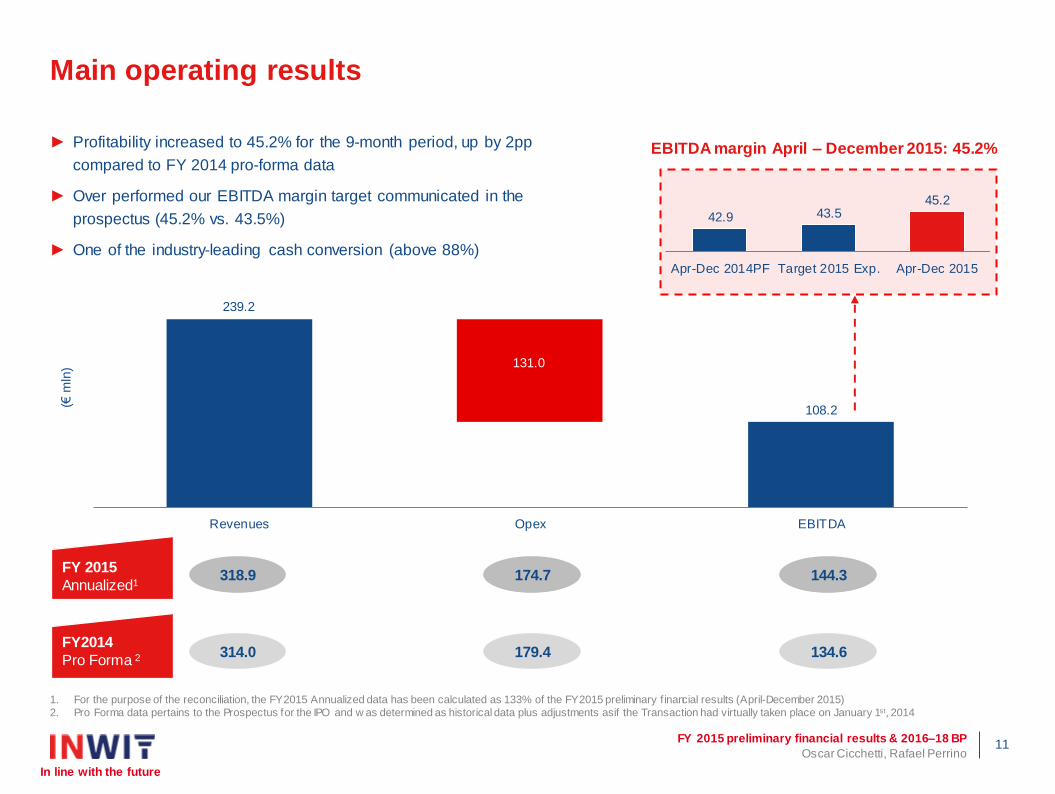
42.9 43.5 45.2
Apr-Dec 2014PF Target 2015 Exp. Apr-Dec 2015
Main operating results
EBITDA margin April – December 2015: 45.2%
FY 2015
Annualized1
FY2014
Pro Forma 2
318.9 174.7 144.3
134.6 314.0 179.4
131.0
239.2
108.2
Revenues Opex EBITDA
(€ m
ln)
1. For the purpose of the reconciliation, the FY2015 Annualized data has been calculated as 133% of the FY2015 preliminary f inancial results (April-December 2015)
2. Pro Forma data pertains to the Prospectus for the IPO and w as determined as historical data plus adjustments as if the Transaction had virtually taken place on January 1st, 2014
► Profitability increased to 45.2% for the 9-month period, up by 2pp
compared to FY 2014 pro-forma data
► Over performed our EBITDA margin target communicated in the
prospectus (45.2% vs. 43.5%)
► One of the industry-leading cash conversion (above 88%)
Oscar Cicchetti, Rafael Perrino 12
FY 2015 preliminary financial results & 2016–18 BP
In line with the future
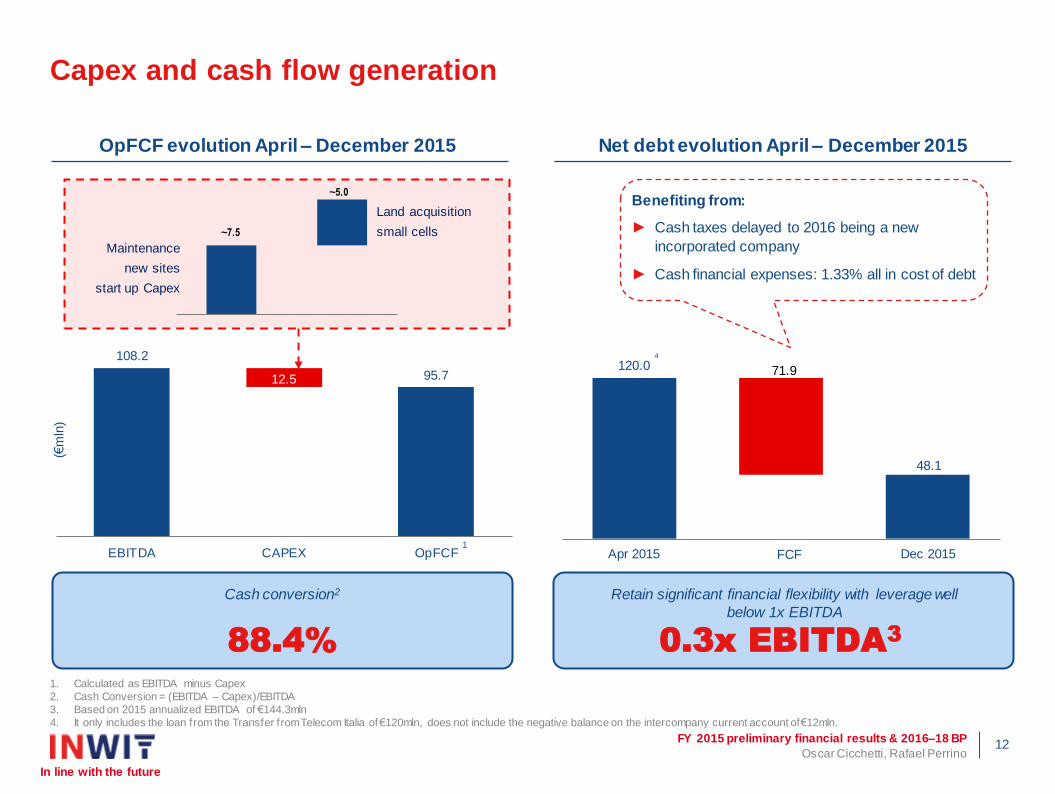
12.5
108.2
95.7
EBITDA CAPEX OpFCF
Capex and cash flow generation
1. Calculated as EBITDA minus Capex
2. Cash Conversion = (EBITDA – Capex)/EBITDA
3. Based on 2015 annualized EBITDA of €144.3mln
4. It only includes the loan from the Transfer from Telecom Italia of €120mln, does not include the negative balance on the intercompany current account of €12mln.
(€m
ln)
Retain significant financial flexibility with leverage well
below 1x EBITDA
Cash conversion2
0.3x EBITDA3
Benefiting from:
► Cash taxes delayed to 2016 being a new
incorporated company
► Cash financial expenses: 1.33% all in cost of debt
Maintenance
new sites
start up Capex
Land acquisition
small cells
Apr 2015 Dec 2015 FCF 1
88.4%
OpFCF evolution April – December 2015 Net debt evolution April – December 2015
~7.5
~5.0
120.0
48.1
71.9
4

Overview of the 2016-18 plan
13
Oscar Cicchetti, Rafael Perrino 14
FY 2015 preliminary financial results & 2016–18 BP
In line with the future
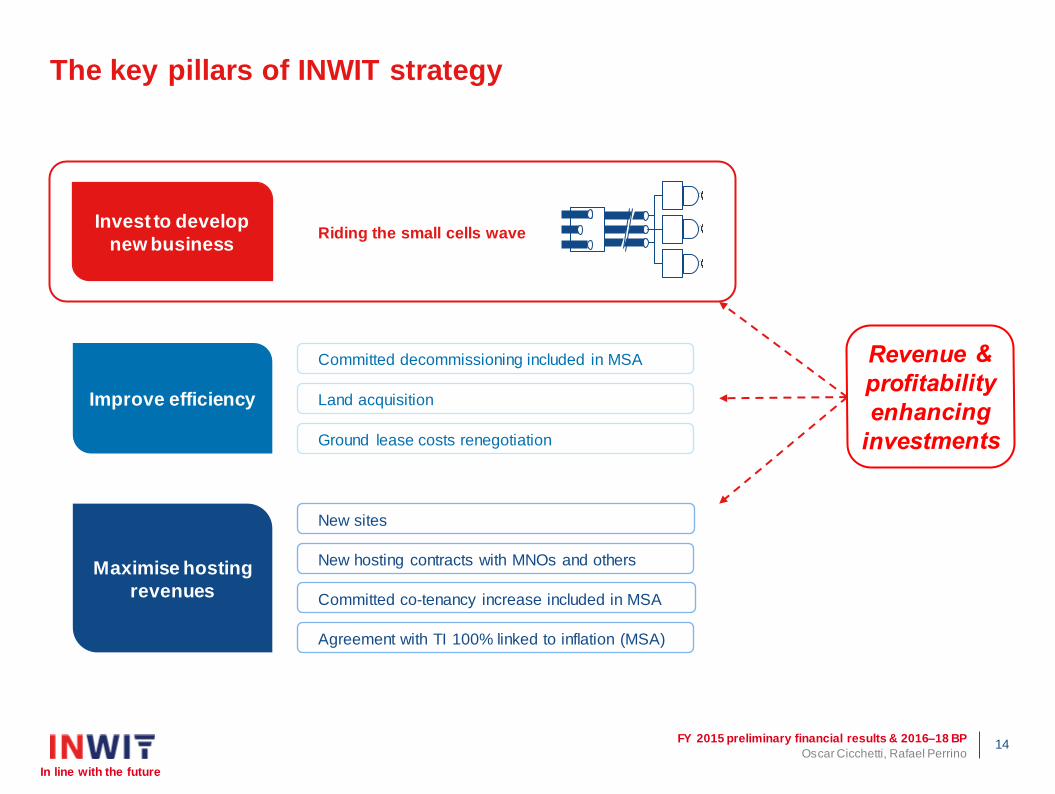
The key pillars of INWIT strategy
Committed co-tenancy increase included in MSA
Invest to develop
new business
New hosting contracts with MNOs and others
Riding the small cells wave
Agreement with TI 100% linked to inflation (MSA)
Improve efficiency
Maximise hosting
revenues
Ground lease costs renegotiation
Land acquisition
Committed decommissioning included in MSA
New sites
Oscar Cicchetti, Rafael Perrino 15
FY 2015 preliminary financial results & 2016–18 BP
In line with the future
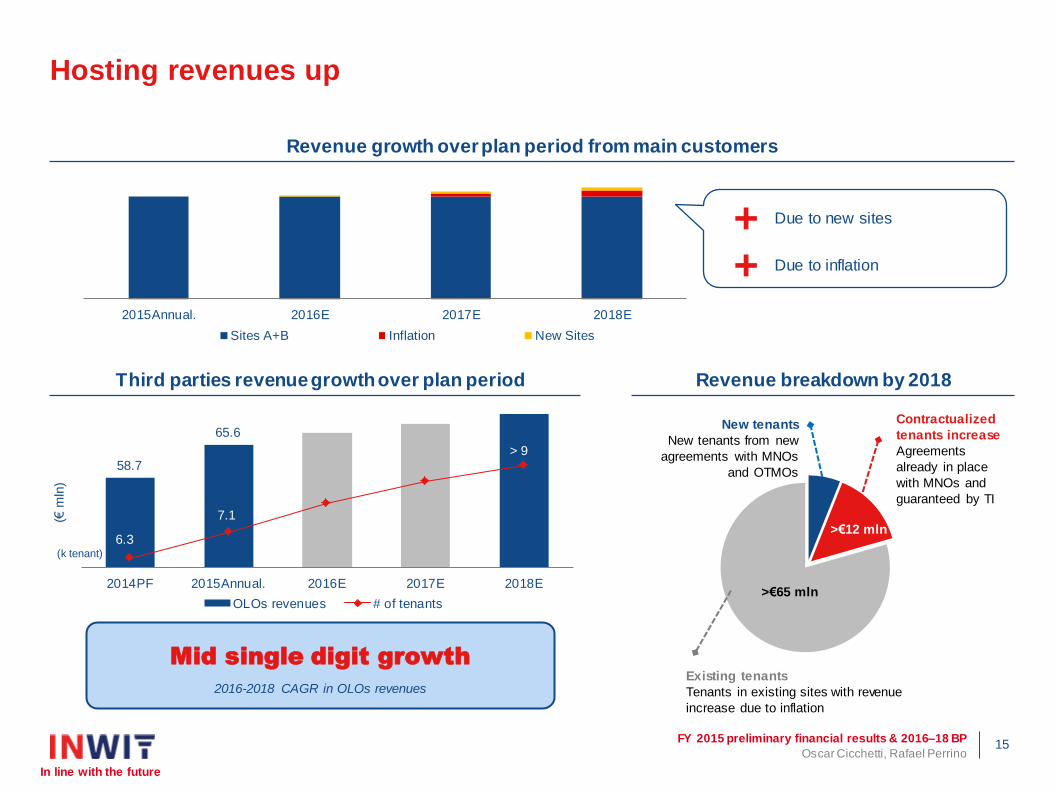
58.7
65.6
6.3
7.1
> 9
2014PF 2015Annual. 2016E 2017E 2018E
OLOs revenues # of tenants
Hosting revenues up
New tenants
New tenants from new
agreements with MNOs
and OTMOs
>€65 mln
>€12 mln
Contractualized
tenants increase
Agreements
already in place
with MNOs and
guaranteed by TI
Existing tenants
Tenants in existing sites with revenue
increase due to inflation
(€ m
ln)
+ Due to inflation
+ Due to new sites
(k tenant)
Mid single digit growth
2015Annual. 2016E 2017E 2018E
Sites A+B Inflation New Sites
2016-2018 CAGR in OLOs revenues
Revenue growth over plan period from main customers
Third parties revenue growth over plan period Revenue breakdown by 2018
Oscar Cicchetti, Rafael Perrino 16
FY 2015 preliminary financial results & 2016–18 BP
In line with the future
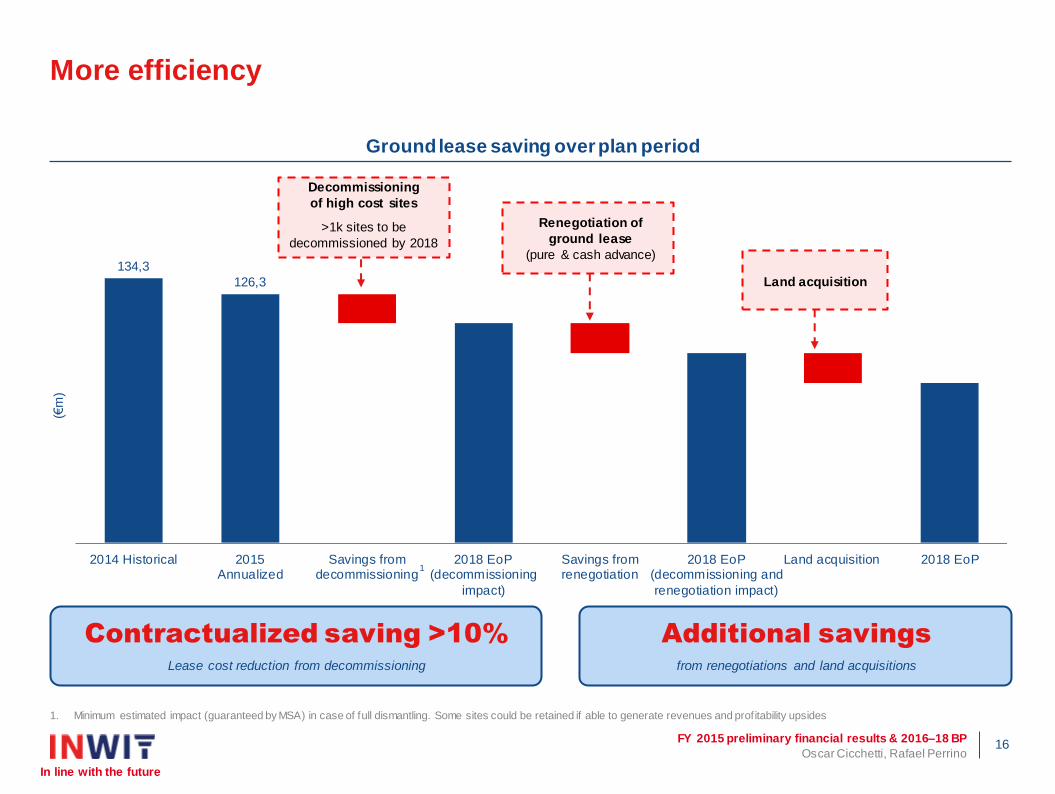
134,3
126,3
2014 Historical 2015Annualized
Savings fromdecommissioning
2018 EoP(decommissioning
impact)
Savings fromrenegotiation
2018 EoP(decommissioning and
renegotiation impact)
Land acquisition 2018 EoP
More efficiency
Renegotiation of
ground lease
(pure & cash advance)
Decommissioning
of high cost sites
Land acquisition
>1k sites to be
decommissioned by 2018
(€m
)
1. Minimum estimated impact (guaranteed by MSA) in case of full dismantling. Some sites could be retained if able to generate revenues and profitability upsides
Contractualized saving >10%
Lease cost reduction from decommissioning
Additional savings
from renegotiations and land acquisitions
1
Ground lease saving over plan period
Oscar Cicchetti, Rafael Perrino 17
FY 2015 preliminary financial results & 2016–18 BP
In line with the future
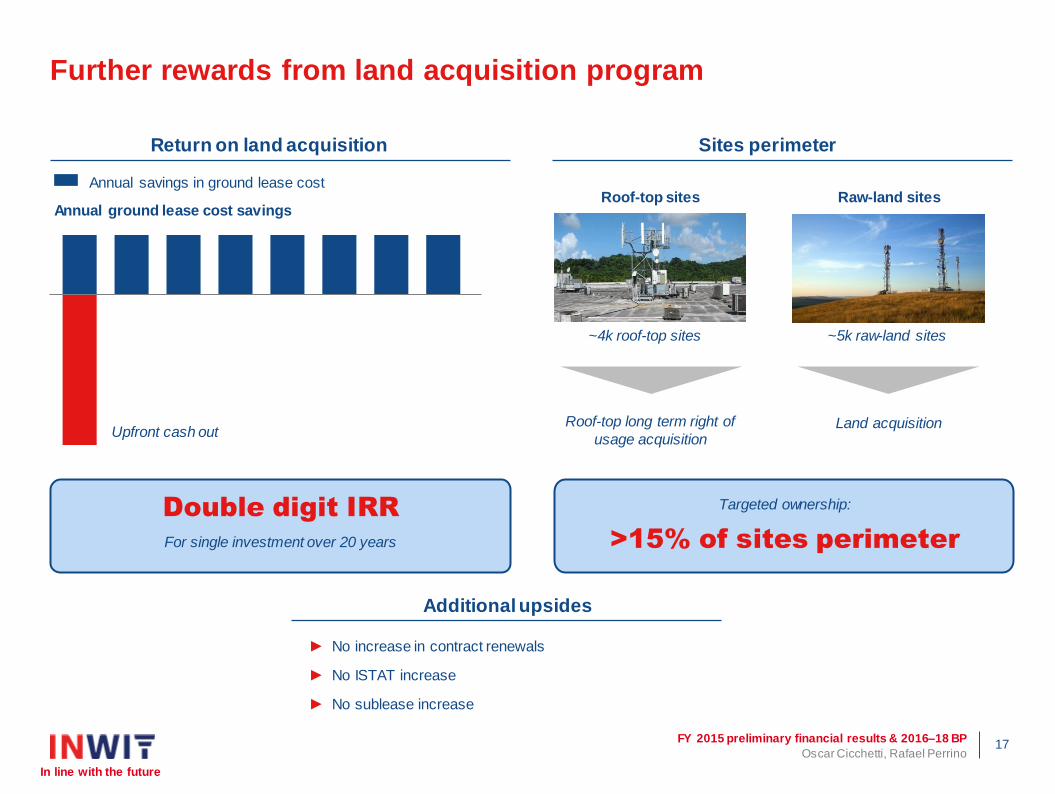
Further rewards from land acquisition program
Upfront cash out
Annual ground lease cost savings
~4k roof-top sites
Raw-land sites Roof-top sites
► No increase in contract renewals
► No ISTAT increase
► No sublease increase
Double digit IRR
For single investment over 20 years
Targeted ownership:
Annual savings in ground lease cost
Roof-top long term right of
usage acquisition Land acquisition
~5k raw-land sites
>15% of sites perimeter
Return on land acquisition Sites perimeter
Additional upsides
Oscar Cicchetti, Rafael Perrino 18
FY 2015 preliminary financial results & 2016–18 BP
In line with the future
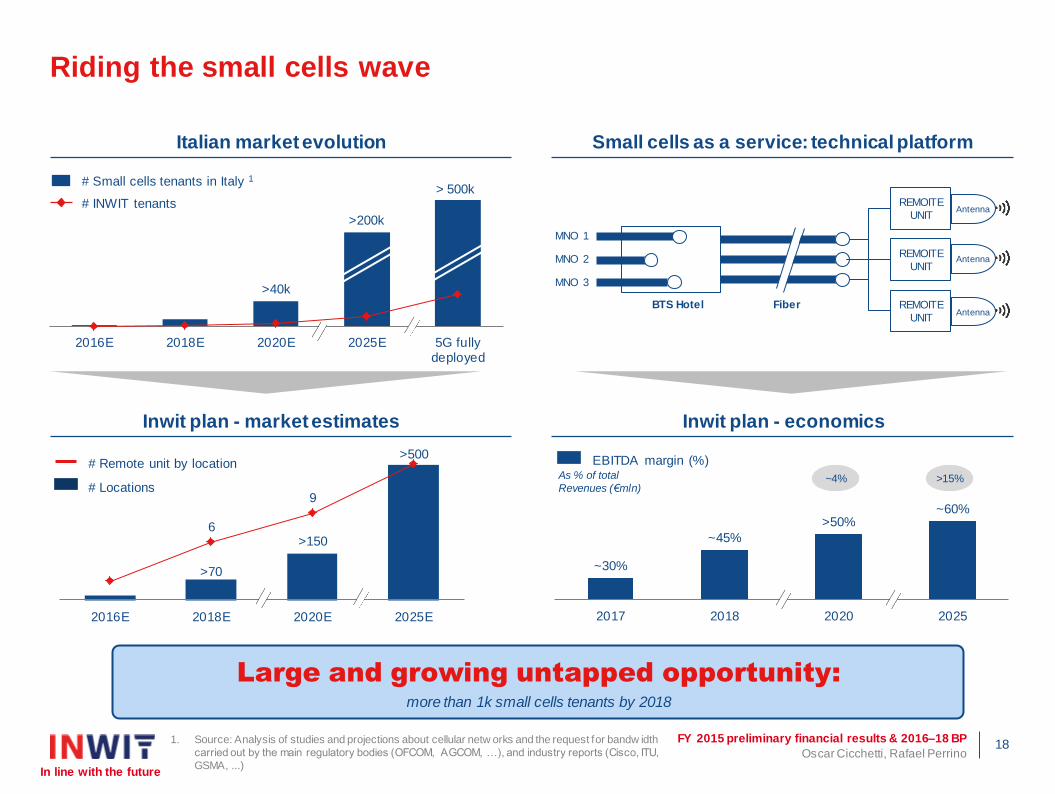
>70
>150
>500
6
9
2016E 2018E 2020E 2025E
~30%
~45%
>50% ~60%
2017 2018 2020 2025
>40k
>200k
2016E 2018E 2020E 2025E 5G fullydeployed
> 500k
Riding the small cells wave
# Remote unit by location
# Locations As % of total
Revenues (€mln)
# Small cells tenants in Italy 1
# INWIT tenants
~4% >15%
EBITDA margin (%)
Large and growing untapped opportunity:
more than 1k small cells tenants by 2018
1. Source: Analysis of studies and projections about cellular netw orks and the request for bandw idth
carried out by the main regulatory bodies (OFCOM, AGCOM, …), and industry reports (Cisco, ITU,
GSMA, ...)
Italian market evolution Small cells as a service: technical platform
Inwit plan - market estimates Inwit plan - economics
REMOITE
UNIT
REMOITE
UNIT
REMOITE
UNIT
MNO 1
MNO 3
MNO 2
BTS Hotel Fiber
Antenna
Antenna
Antenna
Oscar Cicchetti, Rafael Perrino 19
FY 2015 preliminary financial results & 2016–18 BP
In line with the future
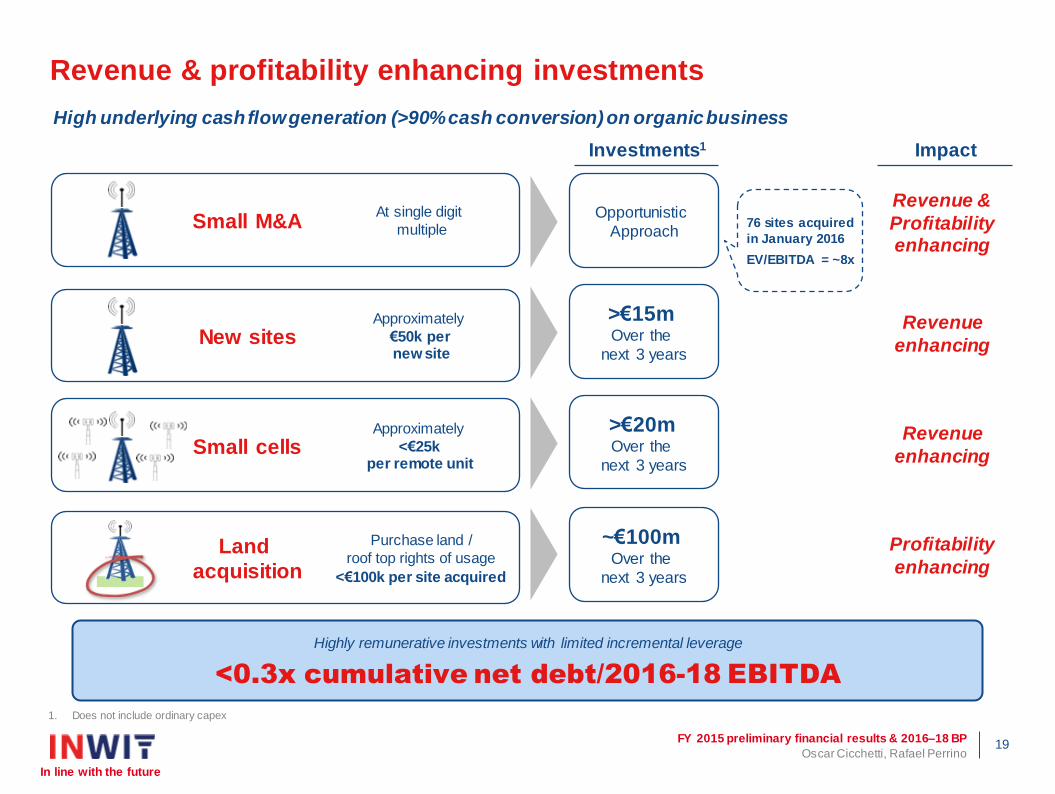
Revenue & profitability enhancing investments
High underlying cash flow generation (>90% cash conversion) on organic business
1. Does not include ordinary capex
At single digit
multiple
Approximately
€50k per new site
Approximately
<€25k per remote unit
Purchase land /
roof top rights of usage
<€100k per site acquired
Opportunistic
Approach
>€15m Over the
next 3 years
>€20m
Over the
next 3 years
~€100m Over the
next 3 years
Revenue &
Profitability enhancing
Revenue
enhancing
Revenue
enhancing
Profitability
enhancing
Highly remunerative investments with limited incremental leverage
<0.3x cumulative net debt/2016-18 EBITDA
Small M&A
New sites
Small cells
Land
acquisition
76 sites acquired
in January 2016
EV/EBITDA = ~8x
Investments1 Impact
Oscar Cicchetti, Rafael Perrino 20
FY 2015 preliminary financial results & 2016–18 BP
In line with the future
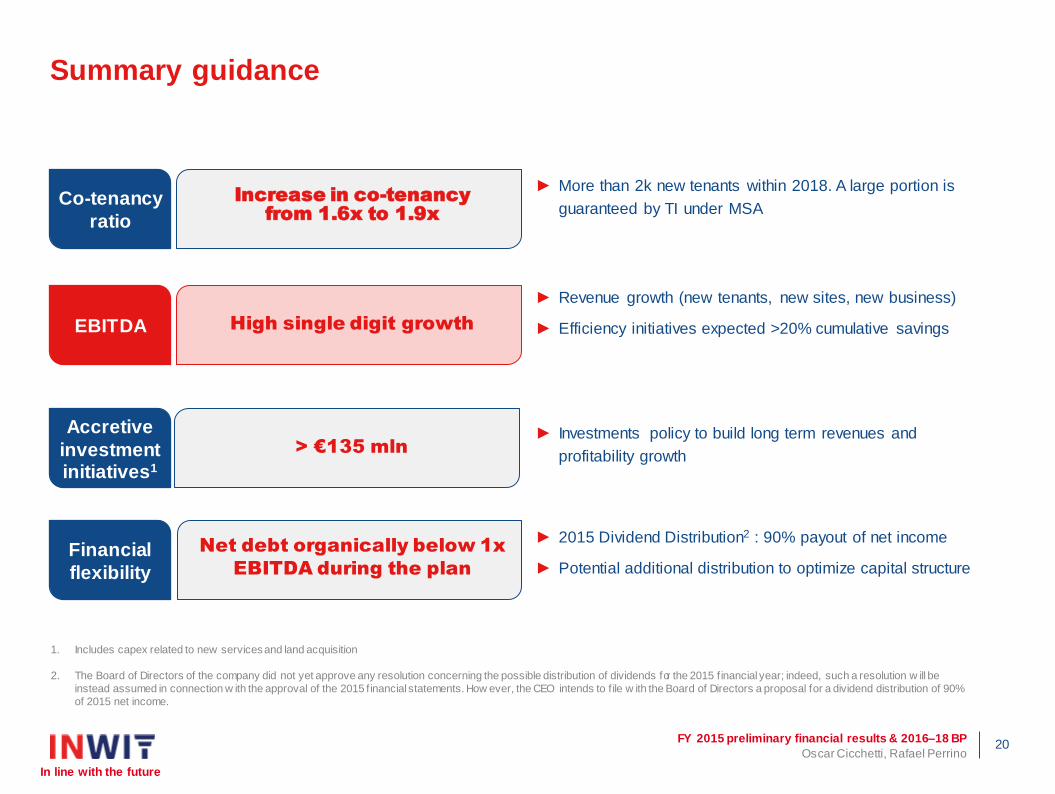
High single digit growth
> €135 mln
1. Includes capex related to new services and land acquisition
2. The Board of Directors of the company did not yet approve any resolution concerning the possible distribution of dividends for the 2015 f inancial year; indeed, such a resolution w ill be
instead assumed in connection w ith the approval of the 2015 f inancial statements. How ever, the CEO intends to f ile w ith the Board of Directors a proposal for a dividend distribution of 90%
of 2015 net income.
► 2015 Dividend Distribution2 : 90% payout of net income
► Potential additional distribution to optimize capital structure
Summary guidance
Increase in co-tenancy
from 1.6x to 1.9x
Net debt organically below 1x
EBITDA during the plan
► More than 2k new tenants within 2018. A large portion is
guaranteed by TI under MSA
► Revenue growth (new tenants, new sites, new business)
► Efficiency initiatives expected >20% cumulative savings
► Investments policy to build long term revenues and
profitability growth
Co-tenancy
ratio
EBITDA
Accretive
investment initiatives1
Financial
flexibility
Oscar Cicchetti, Rafael Perrino 21
FY 2015 preliminary financial results & 2016–18 BP
In line with the future
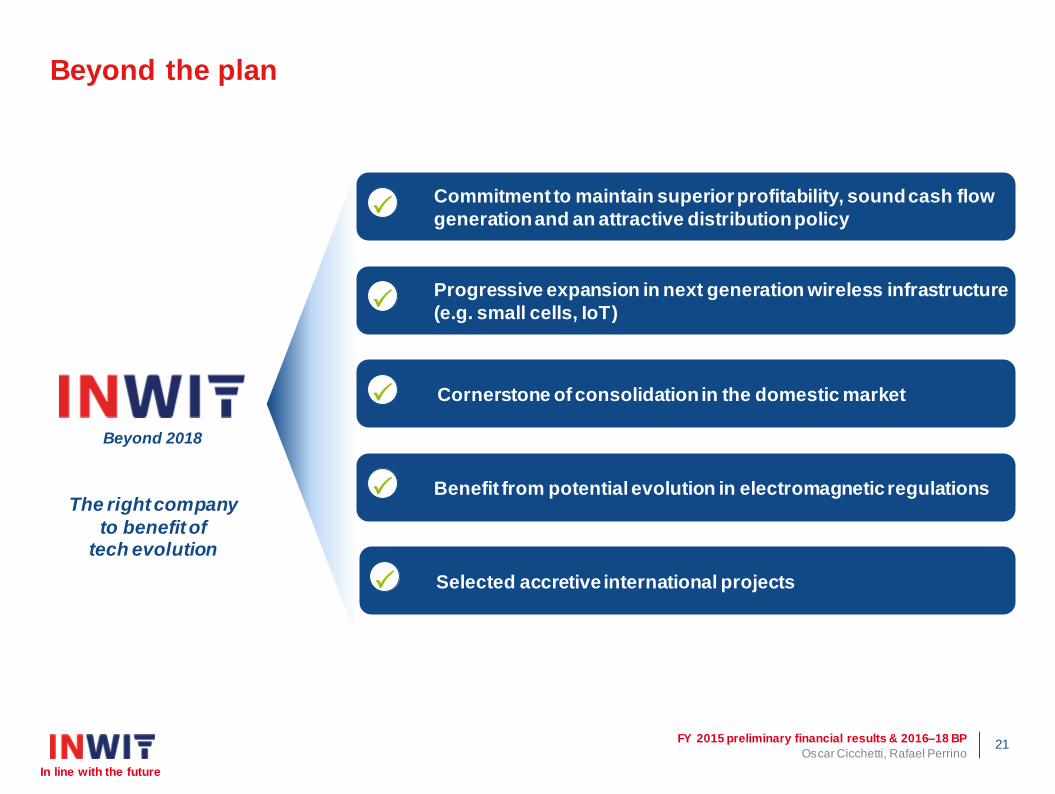
Beyond the plan
Beyond 2018
Cornerstone of consolidation in the domestic market P
Benefit from potential evolution in electromagnetic regulations P
Progressive expansion in next generation wireless infrastructure
(e.g. small cells, IoT) P
Commitment to maintain superior profitability, sound cash flow
generation and an attractive distribution policy P
Selected accretive international projects P
The right company
to benefit of tech evolution

Thank you
Q&A session