Drinking Water Infrastructure Needs Survey and Assessment: Fifth ...
Upload
truongmienCategory
view
216download
1
INFRASTRUCTURE SURVEY 2011
PAGE 2 GROUP OF EIGHT INFRASTRUCTURE SURVEY 2011
Contents
Background and Context 3
Summary of Survey Results 4
1. Buildings and Space 4
1.1 Types of Space 5
1.2 Teaching and Learning Space 5
1.3 Space Utilisation 5
1.4 Functionality of Building Stock 5
1.5 Building Condition 7
2. Backlog Maintenance 8
3. Parking and Modes of Transport 8
4. Student Accommodation 8
5. Planned Infrastructure and Building Works 2011 9
6. TEFMA Space Management 10
7. Timetabling Management 10
8. Conclusion 10
Appendices
Appendix 1. Glossary of Terminology and Definitions 11
Appendix 2. Survey Definitions 12
Appendix 3. Go8 Survey Form 2011 15
September 2012
The Group of Eight
Group of Eight House Level 2, 101 Northbourne Avenue Turner ACT 2612
PO Box 6229 O’Connor ACT 2602
Tel: (02) 6239 5488
www.go8.edu.au
PAGE 3GROUP OF EIGHT INFRASTRUCTURE SURVEY 2011
BACKGROUND AND CONTEXT
In 2011, the Group of Eight (Go8) conducted a survey on the state of its buildings and infrastructure. The survey is the third Go8 Infrastructure survey, with previous surveys being conducted in 2007 and 2009. The reports of those surveys are available on the Go8 website (www.go8.edu.au/government-a-business/go8-policy-a-analysis/2008/181-group-of-eight-infrastructure-condition-survey-2007 and www.go8.edu.au/government-_and_-business/go8-policy-_and_-analysis/2010/go8-infrastructure-survey-report-2009, respectively).
The current survey updated some of the information collected in the previous surveys. It also collated data related to aspects of the estate not previously explored, including leasing arrangements, space utilisation, parking and transportation modes.
In addition to using Tertiary Education Facilities Management Association (TEFMA) definitions and methodology where appropriate, the survey has used Go8-specific definitions that were developed after the previous survey, to enhance the TEFMA definitions to classify space types and enable relevant benchmarking.
There is a Glossary of Terminology and Definitions (Appendix 1). The survey form is Appendix 3 of this Report.
As for the previous surveys, two reports from the survey data have been prepared. This summary presents aggregates across the Go8. The second report contains data about each member university. It is confidential, and has limited availability.
The Go8 records its appreciation for the assistance of Directors of Facilities Management and their staff of member universities.
PAGE 4 GROUP OF EIGHT INFRASTRUCTURE SURVEY 2011
SUMMARY OF SURVEY RESULTS
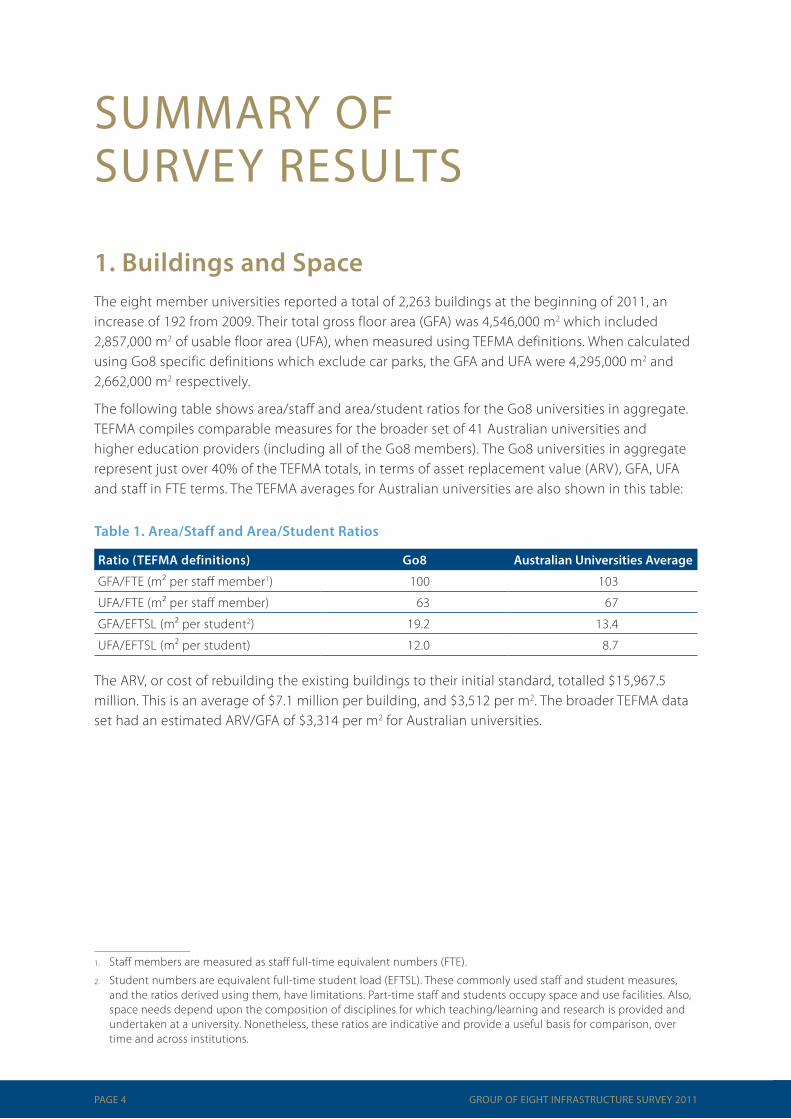
1.BuildingsandSpaceThe eight member universities reported a total of 2,263 buildings at the beginning of 2011, an increase of 192 from 2009. Their total gross floor area (GFA) was 4,546,000 m2 which included 2,857,000 m2 of usable floor area (UFA), when measured using TEFMA definitions. When calculated using Go8 specific definitions which exclude car parks, the GFA and UFA were 4,295,000 m2 and 2,662,000 m2 respectively.
The following table shows area/staff and area/student ratios for the Go8 universities in aggregate. TEFMA compiles comparable measures for the broader set of 41 Australian universities and higher education providers (including all of the Go8 members). The Go8 universities in aggregate represent just over 40% of the TEFMA totals, in terms of asset replacement value (ARV), GFA, UFA and staff in FTE terms. The TEFMA averages for Australian universities are also shown in this table:
Table1.Area/StaffandArea/StudentRatios12
Ratio(TEFMAdefinitions) Go8 AustralianUniversitiesAverage
GFA/FTE (m² per staff member1) 100 103
UFA/FTE (m² per staff member) 63 67
GFA/EFTSL (m² per student2) 19.2 13.4
UFA/EFTSL (m² per student) 12.0 8.7
The ARV, or cost of rebuilding the existing buildings to their initial standard, totalled $15,967.5 million. This is an average of $7.1 million per building, and $3,512 per m2. The broader TEFMA data set had an estimated ARV/GFA of $3,314 per m2 for Australian universities.
1. Staff members are measured as staff full-time equivalent numbers (FTE).
2. Student numbers are equivalent full-time student load (EFTSL). These commonly used staff and student measures, and the ratios derived using them, have limitations. Part-time staff and students occupy space and use facilities. Also, space needs depend upon the composition of disciplines for which teaching/learning and research is provided and undertaken at a university. Nonetheless, these ratios are indicative and provide a useful basis for comparison, over time and across institutions.

PAGE 5GROUP OF EIGHT INFRASTRUCTURE SURVEY 2011
1.1TypesofSpaceSpace used by the eight universities (both owned and leased) is distributed across the following space types.
Table2.UniversityUsedSpace(OwnedandLeased)bySpaceType
Typeofspace %
Teaching & Learning 7.2%
Specialist Teaching or Research 13.9%
Office 18.1%
Library IT & Learning Use 5.2%
Ancillary 10.0%
General Facility 8.7%
Residential accommodation 5.6%
Other (includes non useable floor area) 31.3%
1.2TeachingandLearningSpaceThe eight member universities had a total of 74,300 lecture theatre seats, with a UFA of 95,500 m2. Seminar/tutorial rooms contained a further 44,000 seats (101,000 m2 UFA) and computer labs 10,400 seats (57,000 m2 UFA).
1.3SpaceUtilisationThe 2011 DEEWR Capital Asset Management Survey (CAMS) definitions (see Table A2.2 for details) allowed for the set of rooms under consideration to be between 10% and 100% of centrally controlled, or centrally controlled and school controlled, teaching space. They also allowed for the data to be based on actual audits or on booking data. This has led to a wide variety of responses in the current survey and the Go8 Directors of Facilities are working on a more precise definition for future data collections.
The reported daytime utilisation of lecture theatres ranged from 19% to 52%, with an average of 40%, in the seven universities that reported it. Seminar/tutorial rooms had slightly lower daytime utilisation, with a range of 20% to 47%, and 37% on average. As expected, evening utilisation was somewhat lower, with an average of 26% for both lecture theatres and seminar/tutorial rooms.
1.4FunctionalityofBuildingStockThe TEFMA Facilities Functionality Index provides an objective methodology for qualitative ratings of the building stock. The index takes account of the requirements to bring a facility up to user requirements, statutory compliance and fitness for purpose. See Appendix 2 for definitions of the categories, and details of the TEFMA Index. In interpreting these data, some caution is required, given the degree of subjectivity in the ratings. However, they provide a good indication of the extent to which there are various spaces requiring attention and expenditure to bring them up to appropriate standard.

PAGE 6 GROUP OF EIGHT INFRASTRUCTURE SURVEY 2011
Figure1.FunctionalityofBuildingStock
0% 20% 40% 60% 80% 100%
Teaching & Learning
Specialist Teaching & Learning
Office
Library & Learning
Ancillary
General Facility
Excellent/Good Adequate Barely Adequate/Poor
Teaching and Learning
Overall, 21.3% of Teaching and Learning areas were rated Excellent, with a further 32.5% rated Good. There was 9.6% of Teaching and Learning space rated Poor or Barely Adequate. The remaining 36.6% was described as Adequate.
Specialist Teaching and Research
Of Specialist Teaching and Research space, 27.7% was rated Excellent and 24.0% Good. Some 32.7% was Adequate, while 15.5% was described as Poor or Barely Adequate
Offices
Across Go8 universities, 21.2% of office space was rated Excellent, and 31.3% Good. Some 13.0% was rated Poor or Barely Adequate; the remaining 34.5% was Adequate.
Library and Learning
In the Library and Learning areas, 20.1% was rated Excellent, 39.8% Good, 32.7% Adequate, and 7.4% Barely Adequate or Poor. Library and Learning areas include libraries, computer rooms and audio visual facilities.
Ancillary
For the Ancillary areas, 12.4% were rated Excellent, and 36.7% rated Good. There was 16.1% of Ancillary space rated Poor or Barely Adequate. The remaining 34.8% was Adequate. Ancillary space includes laboratory preparation rooms, store rooms, workshops and locker rooms.

PAGE 7GROUP OF EIGHT INFRASTRUCTURE SURVEY 2011
General Facility
For General Facility areas of the building stock, which include meeting rooms, lounges, medical centres, exhibition space, recreation rooms and child care facilities, 16.0% were rated Excellent, 39.7% Good, 32.2% Adequate and 12.2% Barely Adequate or Poor.
1.5BuildingConditionThe condition of the university buildings was rated, using the TEFMA Facilities Condition Index. (Details of this Index are in Appendix 2.)
Of the 2,107 buildings assessed in the Go8 universities, 1,000 (47.5%) were rated as in Excellent or Good condition, while 818 (38.8%) were Adequate. The remaining 289 buildings (13.7%) were rated as Barely Adequate or Poor.
In terms of total Gross Floor Area, 60.3% was rated Excellent/Good; 28.5% was Adequate; while 11.2% of GFA was rated Barely Adequate or Poor.
Buildings in Excellent/Good condition were almost two thirds (64.2%) of the total Asset Replacement Value. A further 24.4% of the ARV was considered Adequate. Buildings rated in Barely Adequate or Poor condition represent 11.4% of the total Building ARV.
Figure2.BuildingConditionLevel
Buildings GFA ARV
100%
80%
60%
40%
20%
0%
Excellent/Good Adequate Barely Adequate/Poor
PAGE 8 GROUP OF EIGHT INFRASTRUCTURE SURVEY 2011
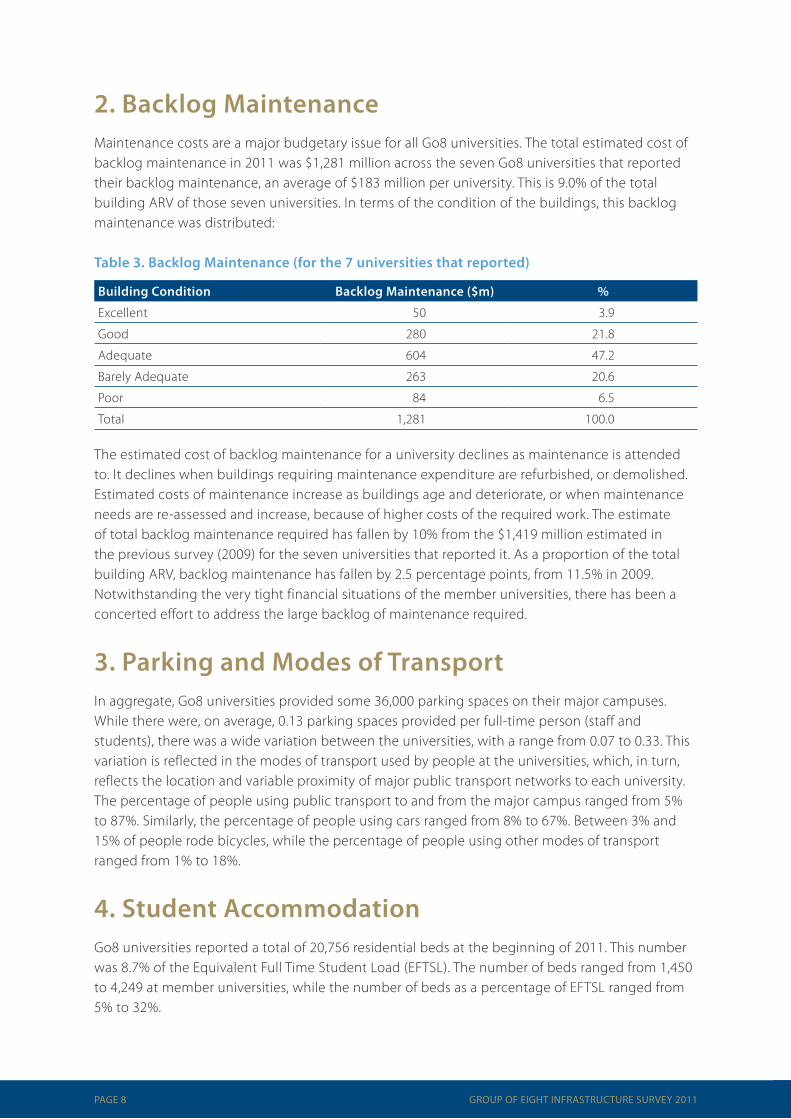
2.BacklogMaintenanceMaintenance costs are a major budgetary issue for all Go8 universities. The total estimated cost of backlog maintenance in 2011 was $1,281 million across the seven Go8 universities that reported their backlog maintenance, an average of $183 million per university. This is 9.0% of the total building ARV of those seven universities. In terms of the condition of the buildings, this backlog maintenance was distributed:
Table3.BacklogMaintenance(forthe7universitiesthatreported)
BuildingCondition BacklogMaintenance($m) %
Excellent 50 3.9
Good 280 21.8
Adequate 604 47.2
Barely Adequate 263 20.6
Poor 84 6.5
Total 1,281 100.0
The estimated cost of backlog maintenance for a university declines as maintenance is attended to. It declines when buildings requiring maintenance expenditure are refurbished, or demolished. Estimated costs of maintenance increase as buildings age and deteriorate, or when maintenance needs are re-assessed and increase, because of higher costs of the required work. The estimate of total backlog maintenance required has fallen by 10% from the $1,419 million estimated in the previous survey (2009) for the seven universities that reported it. As a proportion of the total building ARV, backlog maintenance has fallen by 2.5 percentage points, from 11.5% in 2009. Notwithstanding the very tight financial situations of the member universities, there has been a concerted effort to address the large backlog of maintenance required.
3.ParkingandModesofTransportIn aggregate, Go8 universities provided some 36,000 parking spaces on their major campuses. While there were, on average, 0.13 parking spaces provided per full-time person (staff and students), there was a wide variation between the universities, with a range from 0.07 to 0.33. This variation is reflected in the modes of transport used by people at the universities, which, in turn, reflects the location and variable proximity of major public transport networks to each university. The percentage of people using public transport to and from the major campus ranged from 5% to 87%. Similarly, the percentage of people using cars ranged from 8% to 67%. Between 3% and 15% of people rode bicycles, while the percentage of people using other modes of transport ranged from 1% to 18%.
4.StudentAccommodationGo8 universities reported a total of 20,756 residential beds at the beginning of 2011. This number was 8.7% of the Equivalent Full Time Student Load (EFTSL). The number of beds ranged from 1,450 to 4,249 at member universities, while the number of beds as a percentage of EFTSL ranged from 5% to 32%.
PAGE 9GROUP OF EIGHT INFRASTRUCTURE SURVEY 2011
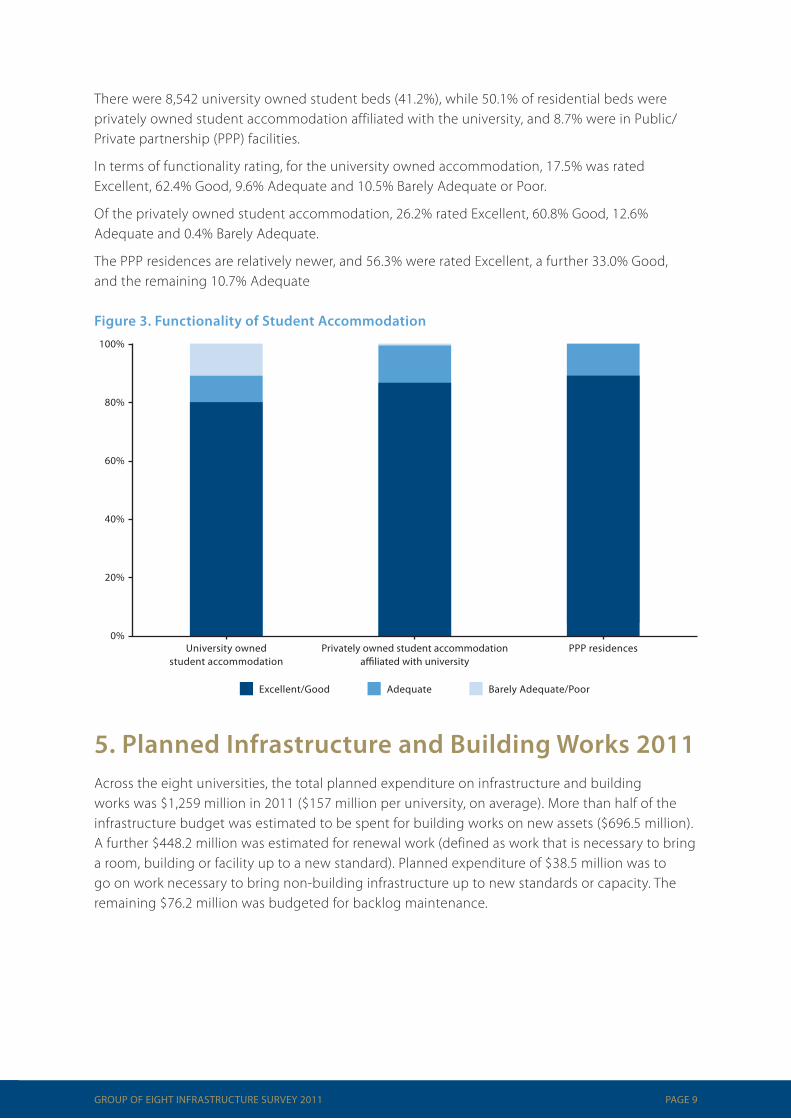
There were 8,542 university owned student beds (41.2%), while 50.1% of residential beds were privately owned student accommodation affiliated with the university, and 8.7% were in Public/Private partnership (PPP) facilities.
In terms of functionality rating, for the university owned accommodation, 17.5% was rated Excellent, 62.4% Good, 9.6% Adequate and 10.5% Barely Adequate or Poor.
Of the privately owned student accommodation, 26.2% rated Excellent, 60.8% Good, 12.6% Adequate and 0.4% Barely Adequate.
The PPP residences are relatively newer, and 56.3% were rated Excellent, a further 33.0% Good, and the remaining 10.7% Adequate
Figure3.FunctionalityofStudentAccommodation
5.PlannedInfrastructureandBuildingWorks2011Across the eight universities, the total planned expenditure on infrastructure and building works was $1,259 million in 2011 ($157 million per university, on average). More than half of the infrastructure budget was estimated to be spent for building works on new assets ($696.5 million). A further $448.2 million was estimated for renewal work (defined as work that is necessary to bring a room, building or facility up to a new standard). Planned expenditure of $38.5 million was to go on work necessary to bring non-building infrastructure up to new standards or capacity. The remaining $76.2 million was budgeted for backlog maintenance.
University owned student accommodation
Privately owned student accommodation affiliated with university
PPP residences
100%
80%
60%
40%
20%
0%
Excellent/Good Adequate Barely Adequate/Poor

PAGE 10 GROUP OF EIGHT INFRASTRUCTURE SURVEY 2011
6.TEFMASpaceManagementThe space management self-assessment tool was developed by TEFMA to measure the extent to which an institution has embraced space management principles using a range of compliance statements. Best practice for space management encompasses an accurate and well-managed space data-base with management systems in place, and space norms used, for allocating space and measuring space utilisation rates. Space is mapped electronically and linked to the facilities management operational data-base. Most of the Go8 universities (7 out of 8) assessed their space management as being at least an average practice level, with one reported that it is achieving best practice and another good practice.
7.TimetablingManagementThe timetabling management self-assessment tool measures the extent to which an institution has embraced timetabling management principles, in a similar way to the space management tool. Although the member universities were at different stages in the development and implementation of a best practice timetabling management system, the majority (6 out of 8) assessed their timetabling management as being at least average, with one reported that it is achieving best practice and another good practice.
8.ConclusionThe report and survey data show aspects of Go8 university facilities which need improvement. Much of the infrastructure is in excellent or good condition, but a proportion is rated as barely adequate or poor. With a continuing high proportion of the infrastructure and building works budget being allocated to new work, the commitment for renewal work on both building and non-building infrastructure is important. The estimated backlog maintenance has been reduced since the earlier surveys, but remains substantial, in a very tight financial environment for Go8 universities.

PAGE 11GROUP OF EIGHT INFRASTRUCTURE SURVEY 2011
Appendix1GlossaryofTerminologyandDefinitions
ARV Asset Replacement Value (The cost of rebuilding an existing capital asset to its initial standard)
Backlog maintenance Maintenance that is necessary to prevent the deterioration of an asset or its function but which has not been carried out
CAMS Capital Asset Management Survey
EFTSL Equivalent Full-time Student Load
FTE Full-time Equivalent Staff
GFA Gross Floor Area (The sum of the ‘Fully enclosed covered area’ and ‘Unenclosed covered area’)
TEFMA Tertiary Education Facilities Management Association
UFA Usable Floor Area (The sum of the floor areas measured at floor level from the general inside face of walls of all interior spaces related to the primary function of the building)

PAGE 12 GROUP OF EIGHT INFRASTRUCTURE SURVEY 2011
Appendix2SurveyDefinitions
TableA2.1Go8definitions
Campus/buildings List main campuses which may be made up of or include other sites. If there are sites that are owned and used by the university that do not fit into a ‘main campus’ then create a campus called ‘other’ to include them.
A Include all buildings owned or leased for University purposes. Provide the count of all building structures that have an ARV, you may exclude minor small structures such as substations.
B Total area of each campus in hectares. Field stations and remote properties should be included as a total under campus ‘Other’ or ‘Rural’.
C Gross building area – includes all external walls and projections (TEFMA Strategic Asset Management Guideline; exclude Residential as per TEFMA GFA definitions).
D GFA (Go8 def ) – All Room categories excluding 7 & 9. E UFA (Go8 Def ) – All Room categories excluding 7, 8 & 9. Note; All car parks are treated
as Non-Usable.F Not used.G EFTSC UG (Internal & External on shore)
Exclude off shore students. External on shore EFTSL are typically distance education students who are not normally expected to be on campus but may spend a few weeks on campus per year.
H Post graduate students doing course work degrees.I Post graduate students not doing course work degrees.J Students not doing a degree program and not off shoreK & L Not used.M As per Go8 Room Type Codes in Data Dictionary (see Table A2.5).N, O & P Not used.Q As per the DEEWR CAMS 2011 survey definitions (see Table A2.2).R Teaching and learning space type Room type codes
Lecture Theatres 201, 202, 203, 210, 211, 212Seminar/tutorial rooms 204, 205, 206,213, 214
Collaborative learning
May be included in the above room codes or 517 or have a new code such as 225 or 230
Computer labs 308, 309, 310
Specialist teachingAll 300 to 399 codes excluding computer rooms (308, 309, 310)
Other612, 613 if used for teaching and any other spaces used for teaching
Learning space 207, 216, 517S This may be based on a survey of staff and students or by doing an audit at campus
entrances. Motorbikes come under other.T & U TEFMA Facilities Audit Guideline 2010 (see Tables A2.3 and A2.4).V & W Does not include private accommodation available near campus.X Not used.Y Total cost of construction, includes the costs of construction, fees, loose furniture
and equipment.
PAGE 13GROUP OF EIGHT INFRASTRUCTURE SURVEY 2011
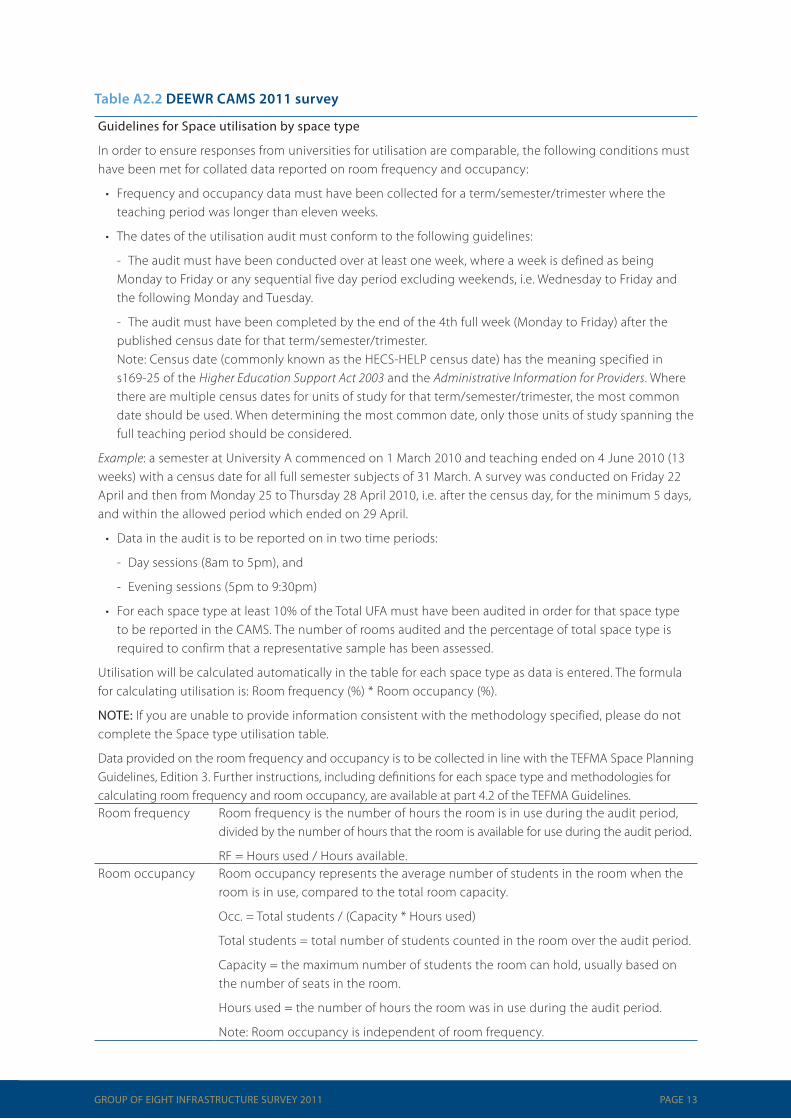
TableA2.2DEEWRCAMS2011survey
Guidelines for Space utilisation by space type
In order to ensure responses from universities for utilisation are comparable, the following conditions must have been met for collated data reported on room frequency and occupancy:
• Frequency and occupancy data must have been collected for a term/semester/trimester where the teaching period was longer than eleven weeks.
• The dates of the utilisation audit must conform to the following guidelines:
- The audit must have been conducted over at least one week, where a week is defined as being Monday to Friday or any sequential five day period excluding weekends, i.e. Wednesday to Friday and the following Monday and Tuesday.
- The audit must have been completed by the end of the 4th full week (Monday to Friday) after the published census date for that term/semester/trimester. Note: Census date (commonly known as the HECS-HELP census date) has the meaning specified in s169-25 of the Higher Education Support Act 2003 and the Administrative Information for Providers. Where there are multiple census dates for units of study for that term/semester/trimester, the most common date should be used. When determining the most common date, only those units of study spanning the full teaching period should be considered.
Example: a semester at University A commenced on 1 March 2010 and teaching ended on 4 June 2010 (13 weeks) with a census date for all full semester subjects of 31 March. A survey was conducted on Friday 22 April and then from Monday 25 to Thursday 28 April 2010, i.e. after the census day, for the minimum 5 days, and within the allowed period which ended on 29 April.
• Data in the audit is to be reported on in two time periods:
- Day sessions (8am to 5pm), and
- Evening sessions (5pm to 9:30pm)
• For each space type at least 10% of the Total UFA must have been audited in order for that space type to be reported in the CAMS. The number of rooms audited and the percentage of total space type is required to confirm that a representative sample has been assessed.
Utilisation will be calculated automatically in the table for each space type as data is entered. The formula for calculating utilisation is: Room frequency (%) * Room occupancy (%).
NOTE: If you are unable to provide information consistent with the methodology specified, please do not complete the Space type utilisation table.
Data provided on the room frequency and occupancy is to be collected in line with the TEFMA Space Planning Guidelines, Edition 3. Further instructions, including definitions for each space type and methodologies for calculating room frequency and room occupancy, are available at part 4.2 of the TEFMA Guidelines.Room frequency Room frequency is the number of hours the room is in use during the audit period,
divided by the number of hours that the room is available for use during the audit period.
RF = Hours used / Hours available.Room occupancy Room occupancy represents the average number of students in the room when the
room is in use, compared to the total room capacity.
Occ. = Total students / (Capacity * Hours used)
Total students = total number of students counted in the room over the audit period.
Capacity = the maximum number of students the room can hold, usually based on the number of seats in the room.
Hours used = the number of hours the room was in use during the audit period.
Note: Room occupancy is independent of room frequency.

PAGE 14 GROUP OF EIGHT INFRASTRUCTURE SURVEY 2011
TableA2.3TEFMAdefinitionforFacilityFunctionalityIndex(FFI)
Functionality code TEFMA FFI code Description
Excellent Very functionalBuilding efficiency is over 75%, building layout is very flexible and can be adapted with minimal effort, less than 5% ARV
Good FunctionalBuilding efficiency is between 65% and 75%, services are reasonably up to date and has spare capacity, requires less than 25% of ARV to refurbish
Adequate Fair functionalityFacility has area efficiency between 50% and 65%, has accessible service paths although services are out of date, and requires between 25% and 50% of ARV to refurbish
Barely Adequate Low functionalityFacility has area efficiency between 40% and 50% and requires between 50% and 80% of ARV to refurbish
Poor Not functionalFacility is very inefficient in the use of utilities, has an area efficiency of less than 40%, or requires more than 80% of ARV to refurbish
TableA2.4TEFMAdefinitionforFacilityConditionIndex(FCI)
Building Condition Level code TEFMA FCI code Description
Excellent Very Good Asset has no defect; appearance is as new
Good GoodAsset exhibits superficial wear and tear, minor defects, minor signs of deterioration to surface finishes; but does not require major maintenance; no major defects exist
Adequate FairAsset is in average condition; deteriorated surfaces require attention; services are functional, but require attention; backlog maintenance work exists
Barely Adequate PoorAsset is in poor condition; deteriorated surfaces require significant attention; services are functional but failing often; significant backlog maintenance work exists
Poor Demolish
Asset has deteriorated badly; serious structural problems; general appearance is poor with eroded protective coatings; elements are broken, services are not performing; significant number of major defects exist
TableA2.5Go8RoomCategories
Room Category Space Type1 Office Space2 Teaching & Learning Space3 Specialist Teaching or Research Space4 Ancillary Space5 Library IT and Learning Use Space6 General Facility Space7 Residential Accommodation Space8 Non Useable Floor Area Space
9Non Reportable Area Space (including investment properties and space not classified elsewhere)
PAGE 15GROUP OF EIGHT INFRASTRUCTURE SURVEY 2011
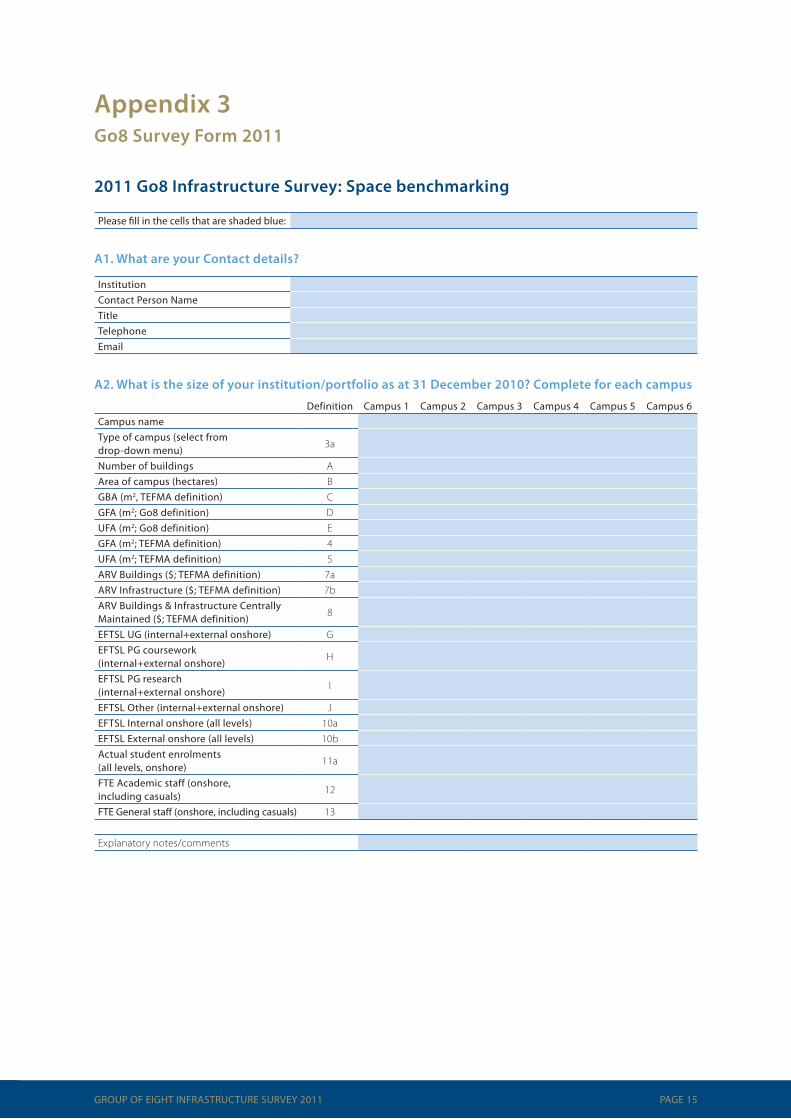
Appendix3Go8SurveyForm2011
2011Go8InfrastructureSurvey:Spacebenchmarking
Please fill in the cells that are shaded blue:
A1.WhatareyourContactdetails?
Institution Contact Person Name Title Telephone Email
A2.Whatisthesizeofyourinstitution/portfolioasat31December2010?Completeforeachcampus
Definition Campus 1 Campus 2 Campus 3 Campus 4 Campus 5 Campus 6Campus name Type of campus (select from drop-down menu)
3a
Number of buildings A Area of campus (hectares) B GBA (m2, TEFMA definition) C GFA (m2; Go8 definition) D UFA (m2; Go8 definition) E GFA (m2; TEFMA definition) 4 UFA (m2; TEFMA definition) 5 ARV Buildings ($; TEFMA definition) 7a ARV Infrastructure ($; TEFMA definition) 7b ARV Buildings & Infrastructure Centrally Maintained ($; TEFMA definition)
8
EFTSL UG (internal+external onshore) G EFTSL PG coursework (internal+external onshore)
H
EFTSL PG research (internal+external onshore)
I
EFTSL Other (internal+external onshore) J EFTSL Internal onshore (all levels) 10a EFTSL External onshore (all levels) 10b Actual student enrolments (all levels, onshore)
11a
FTE Academic staff (onshore, including casuals)
12
FTE General staff (onshore, including casuals) 13
Explanatory notes/comments
PAGE 16 GROUP OF EIGHT INFRASTRUCTURE SURVEY 2011
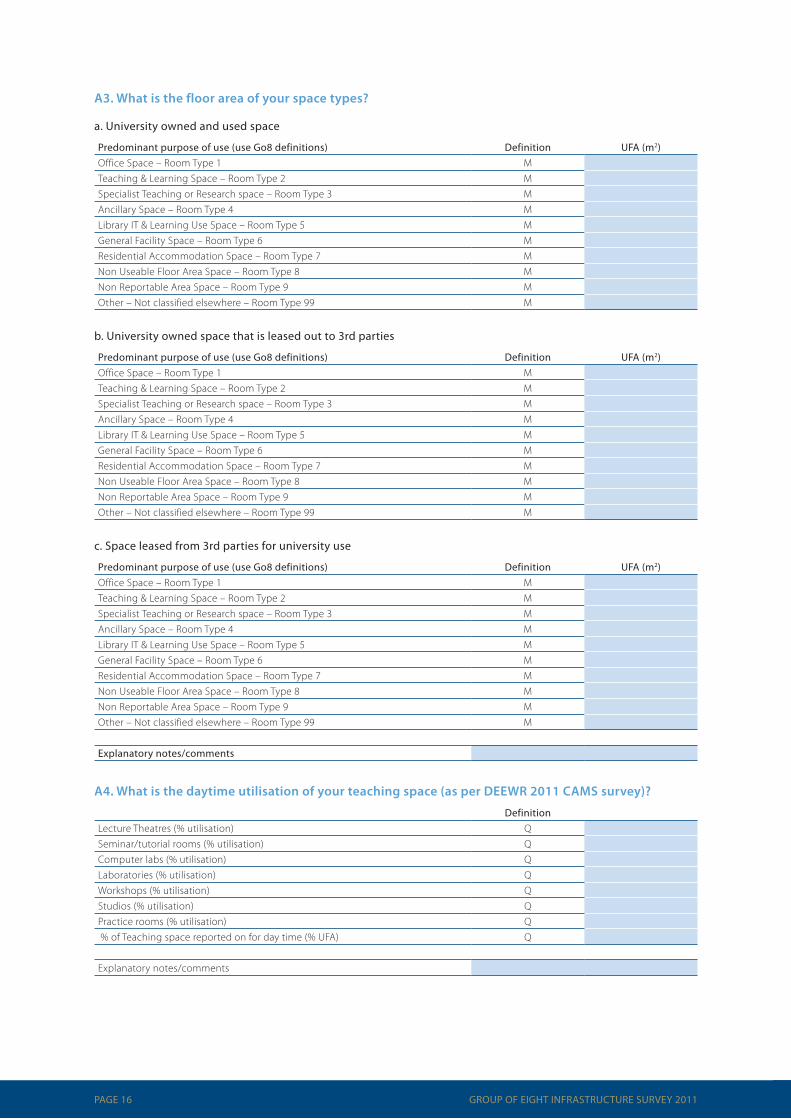
A3.Whatisthefloorareaofyourspacetypes?
a. University owned and used space
Predominant purpose of use (use Go8 definitions) Definition UFA (m2)Office Space – Room Type 1 M Teaching & Learning Space – Room Type 2 M Specialist Teaching or Research space – Room Type 3 M Ancillary Space – Room Type 4 M Library IT & Learning Use Space – Room Type 5 M General Facility Space – Room Type 6 M Residential Accommodation Space – Room Type 7 M Non Useable Floor Area Space – Room Type 8 M Non Reportable Area Space – Room Type 9 M Other – Not classified elsewhere – Room Type 99 M
b. University owned space that is leased out to 3rd parties
Predominant purpose of use (use Go8 definitions) Definition UFA (m2)Office Space – Room Type 1 M Teaching & Learning Space – Room Type 2 M Specialist Teaching or Research space – Room Type 3 M Ancillary Space – Room Type 4 M Library IT & Learning Use Space – Room Type 5 M General Facility Space – Room Type 6 M Residential Accommodation Space – Room Type 7 M Non Useable Floor Area Space – Room Type 8 M Non Reportable Area Space – Room Type 9 M Other – Not classified elsewhere – Room Type 99 M
c. Space leased from 3rd parties for university use
Predominant purpose of use (use Go8 definitions) Definition UFA (m2)Office Space – Room Type 1 M Teaching & Learning Space – Room Type 2 M Specialist Teaching or Research space – Room Type 3 M Ancillary Space – Room Type 4 M Library IT & Learning Use Space – Room Type 5 M General Facility Space – Room Type 6 M Residential Accommodation Space – Room Type 7 M Non Useable Floor Area Space – Room Type 8 M Non Reportable Area Space – Room Type 9 M Other – Not classified elsewhere – Room Type 99 M
Explanatory notes/comments
A4.Whatisthedaytimeutilisationofyourteachingspace(asperDEEWR2011CAMSsurvey)?
Definition Lecture Theatres (% utilisation) Q Seminar/tutorial rooms (% utilisation) Q Computer labs (% utilisation) Q Laboratories (% utilisation) Q Workshops (% utilisation) Q Studios (% utilisation) Q Practice rooms (% utilisation) Q % of Teaching space reported on for day time (% UFA) Q
Explanatory notes/comments

PAGE 17GROUP OF EIGHT INFRASTRUCTURE SURVEY 2011
A5.Whatistheeveningutilisationofyourteachingspace(asperDEEWR2011CAMSsurvey)?
DefinitionLecture Theatres (% utilisation) QSeminar/tutorial rooms (% utilisation) QComputer labs (% utilisation) QLaboratories (% utilisation) QWorkshops (% utilisation) QStudios (% utilisation) QPractice rooms (% utilisation) Q % of Teaching space reported on for evening (% UFA) Q
Explanatory notes/comments
A6.Detailsofyourteachingandlearningspaceandseats.
Definition UFA (m2) # of seatsLecture Theatres R Seminar/tutorial rooms R Collaborative learning R Computer labs R Specialist teaching R Other R Learning space R
Explanatory notes/comments
A7.Detailsofyourparkingandmodesoftransport
Definition Number of parking spaces on major campus S % of people using public transport to/from major campus S % of people using cars to/from major campus S % of people using bicycles to/from major campus S % of people using other transport to/from major campus S
Explanatory notes/comments
A8.Whatisthefunctionalityofyourbuildingstock?FunctionalityistobedefinedinaccordancewiththeTEFMAFacilitiesAuditGuideline2010,step3.2availablefromhttp://www.tefma.com/member-portal/tefma-resources/tefma-publications
% of building stock within predominant use category
Predominant purpose of use Definition Excellent Good AdequateBarely
AdequatePoor
Office T Teaching & Learning T Specialist Teaching & Research T Ancillary T Library & Learning T General Facility T
Explanatory notes/comments
PAGE 18 GROUP OF EIGHT INFRASTRUCTURE SURVEY 2011
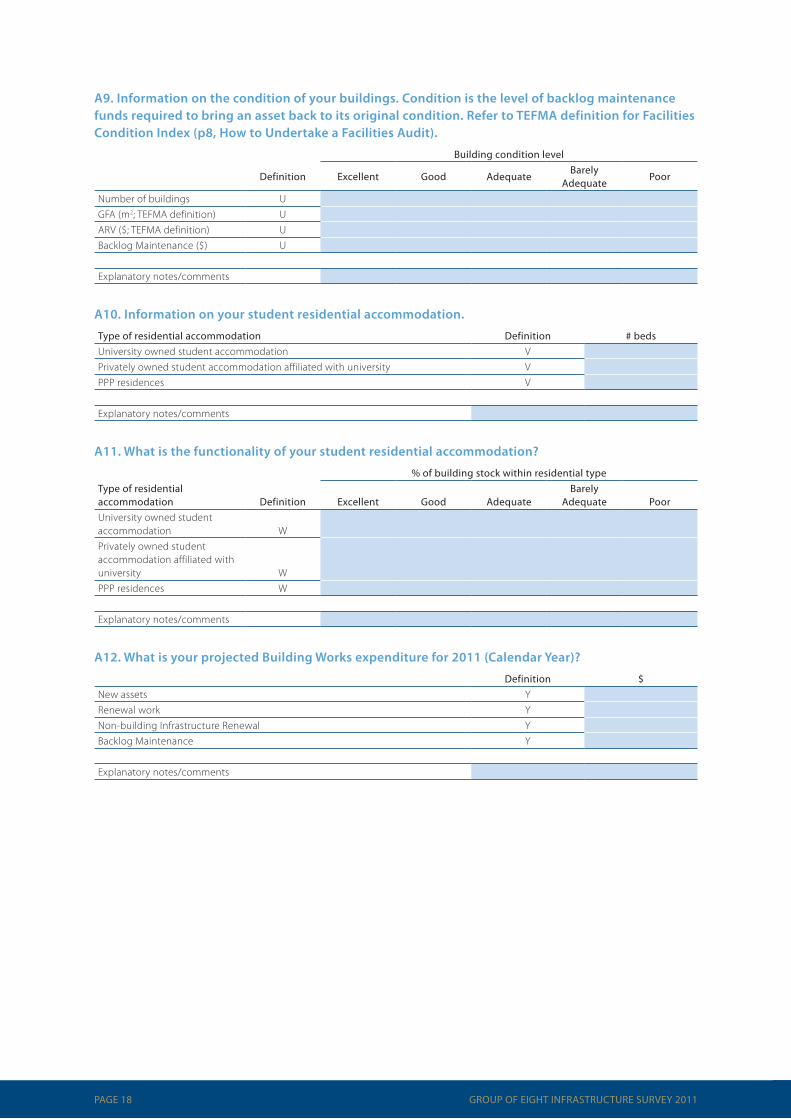
A9.Informationontheconditionofyourbuildings.Conditionisthelevelofbacklogmaintenancefundsrequiredtobringanassetbacktoitsoriginalcondition.RefertoTEFMAdefinitionforFacilitiesConditionIndex(p8,HowtoUndertakeaFacilitiesAudit).
Building condition level
Definition Excellent Good AdequateBarely
AdequatePoor
Number of buildings U GFA (m2; TEFMA definition) U ARV ($; TEFMA definition) U Backlog Maintenance ($) U
Explanatory notes/comments
A10.Informationonyourstudentresidentialaccommodation.
Type of residential accommodation Definition # bedsUniversity owned student accommodation V Privately owned student accommodation affiliated with university V PPP residences V
Explanatory notes/comments
A11.Whatisthefunctionalityofyourstudentresidentialaccommodation?
% of building stock within residential typeType of residential accommodation Definition Excellent Good Adequate
Barely Adequate Poor
University owned student accommodation W Privately owned student accommodation affiliated with university W PPP residences W
Explanatory notes/comments
A12.WhatisyourprojectedBuildingWorksexpenditurefor2011(CalendarYear)?
Definition $New assets Y Renewal work Y Non-building Infrastructure Renewal Y Backlog Maintenance Y
Explanatory notes/comments
PAGE 19GROUP OF EIGHT INFRASTRUCTURE SURVEY 2011
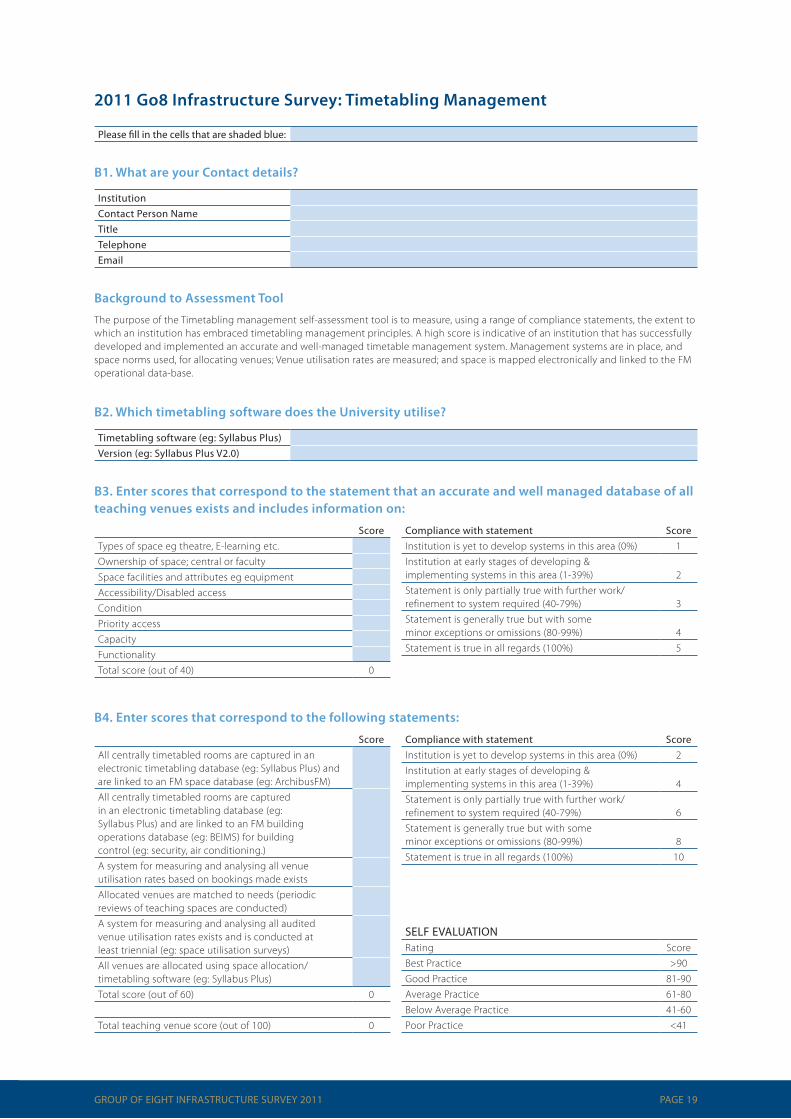
2011Go8InfrastructureSurvey:TimetablingManagement
Please fill in the cells that are shaded blue:
B1.WhatareyourContactdetails?
Institution Contact Person Name Title Telephone Email
BackgroundtoAssessmentTool
The purpose of the Timetabling management self-assessment tool is to measure, using a range of compliance statements, the extent to which an institution has embraced timetabling management principles. A high score is indicative of an institution that has successfully developed and implemented an accurate and well-managed timetable management system. Management systems are in place, and space norms used, for allocating venues; Venue utilisation rates are measured; and space is mapped electronically and linked to the FM operational data-base.
B2.WhichtimetablingsoftwaredoestheUniversityutilise?
Timetabling software (eg: Syllabus Plus) Version (eg: Syllabus Plus V2.0)
B3.Enterscoresthatcorrespondtothestatementthatanaccurateandwellmanageddatabaseofallteachingvenuesexistsandincludesinformationon:
Compliance with statement ScoreInstitution is yet to develop systems in this area (0%) 1Institution at early stages of developing & implementing systems in this area (1-39%) 2Statement is only partially true with further work/refinement to system required (40-79%) 3Statement is generally true but with some minor exceptions or omissions (80-99%) 4Statement is true in all regards (100%) 5
ScoreTypes of space eg theatre, E-learning etc. Ownership of space; central or faculty Space facilities and attributes eg equipment Accessibility/Disabled access Condition Priority access Capacity Functionality Total score (out of 40) 0
B4.Enterscoresthatcorrespondtothefollowingstatements:
Compliance with statement ScoreInstitution is yet to develop systems in this area (0%) 2Institution at early stages of developing & implementing systems in this area (1-39%) 4Statement is only partially true with further work/refinement to system required (40-79%) 6Statement is generally true but with some minor exceptions or omissions (80-99%) 8Statement is true in all regards (100%) 10
ScoreAll centrally timetabled rooms are captured in an electronic timetabling database (eg: Syllabus Plus) and are linked to an FM space database (eg: ArchibusFM) All centrally timetabled rooms are captured in an electronic timetabling database (eg: Syllabus Plus) and are linked to an FM building operations database (eg: BEIMS) for building control (eg: security, air conditioning.) A system for measuring and analysing all venue utilisation rates based on bookings made exists Allocated venues are matched to needs (periodic reviews of teaching spaces are conducted) A system for measuring and analysing all audited venue utilisation rates exists and is conducted at least triennial (eg: space utilisation surveys) All venues are allocated using space allocation/timetabling software (eg: Syllabus Plus) Total score (out of 60) 0
Total teaching venue score (out of 100) 0
SELF EVALUATIONRating ScoreBest Practice >90Good Practice 81-90Average Practice 61-80Below Average Practice 41-60Poor Practice <41
PAGE 20 GROUP OF EIGHT INFRASTRUCTURE SURVEY 2011
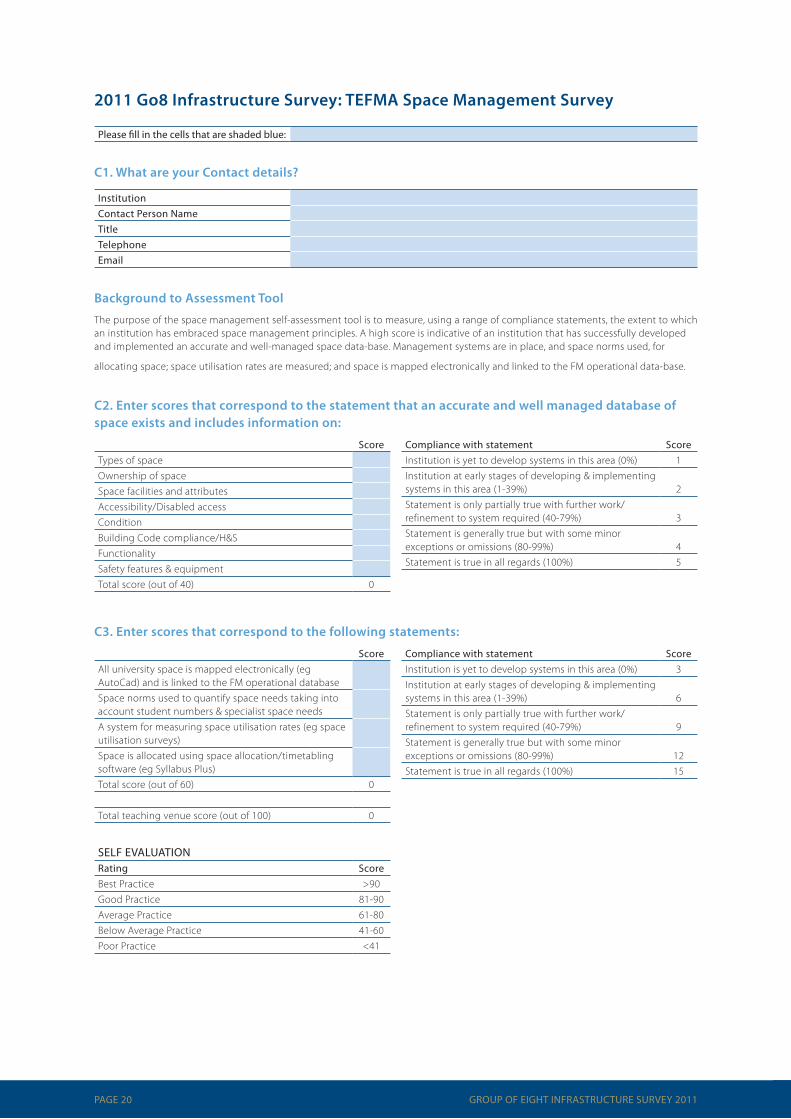
2011Go8InfrastructureSurvey:TEFMASpaceManagementSurvey
Please fill in the cells that are shaded blue:
C1.WhatareyourContactdetails?
Institution Contact Person Name Title Telephone Email
BackgroundtoAssessmentTool
The purpose of the space management self-assessment tool is to measure, using a range of compliance statements, the extent to which an institution has embraced space management principles. A high score is indicative of an institution that has successfully developed and implemented an accurate and well-managed space data-base. Management systems are in place, and space norms used, for
allocating space; space utilisation rates are measured; and space is mapped electronically and linked to the FM operational data-base.
C2.Enterscoresthatcorrespondtothestatementthatanaccurateandwellmanageddatabaseofspaceexistsandincludesinformationon:
Compliance with statement ScoreInstitution is yet to develop systems in this area (0%) 1Institution at early stages of developing & implementing systems in this area (1-39%) 2Statement is only partially true with further work/refinement to system required (40-79%) 3Statement is generally true but with some minor exceptions or omissions (80-99%) 4Statement is true in all regards (100%) 5
ScoreTypes of space Ownership of space Space facilities and attributes Accessibility/Disabled access Condition Building Code compliance/H&S Functionality Safety features & equipment Total score (out of 40) 0
C3.Enterscoresthatcorrespondtothefollowingstatements:
Compliance with statement ScoreInstitution is yet to develop systems in this area (0%) 3Institution at early stages of developing & implementing systems in this area (1-39%) 6Statement is only partially true with further work/refinement to system required (40-79%) 9Statement is generally true but with some minor exceptions or omissions (80-99%) 12Statement is true in all regards (100%) 15
ScoreAll university space is mapped electronically (eg AutoCad) and is linked to the FM operational database Space norms used to quantify space needs taking into account student numbers & specialist space needs A system for measuring space utilisation rates (eg space utilisation surveys) Space is allocated using space allocation/timetabling software (eg Syllabus Plus) Total score (out of 60) 0
Total teaching venue score (out of 100) 0
SELF EVALUATIONRating ScoreBest Practice >90Good Practice 81-90Average Practice 61-80Below Average Practice 41-60Poor Practice <41

PAGE 21GROUP OF EIGHT INFRASTRUCTURE SURVEY 2011

The Group of Eight
Group of Eight House Level 2, 101 Northbourne Avenue Turner ACT 2612
PO Box 6229 O’Connor ACT 2602
Tel: (02) 6239 5488
www.go8.edu.au