Infrastructure Asset Management - Angelfire · Infrastructure Asset Management ... • Condition...
37
Infrastructure Asset Management Southwest Chula Vista Civic Association April 26, 2007
Transcript of Infrastructure Asset Management - Angelfire · Infrastructure Asset Management ... • Condition...
Infrastructure Asset Management
Southwest Chula Vista Civic AssociationApril 26, 2007
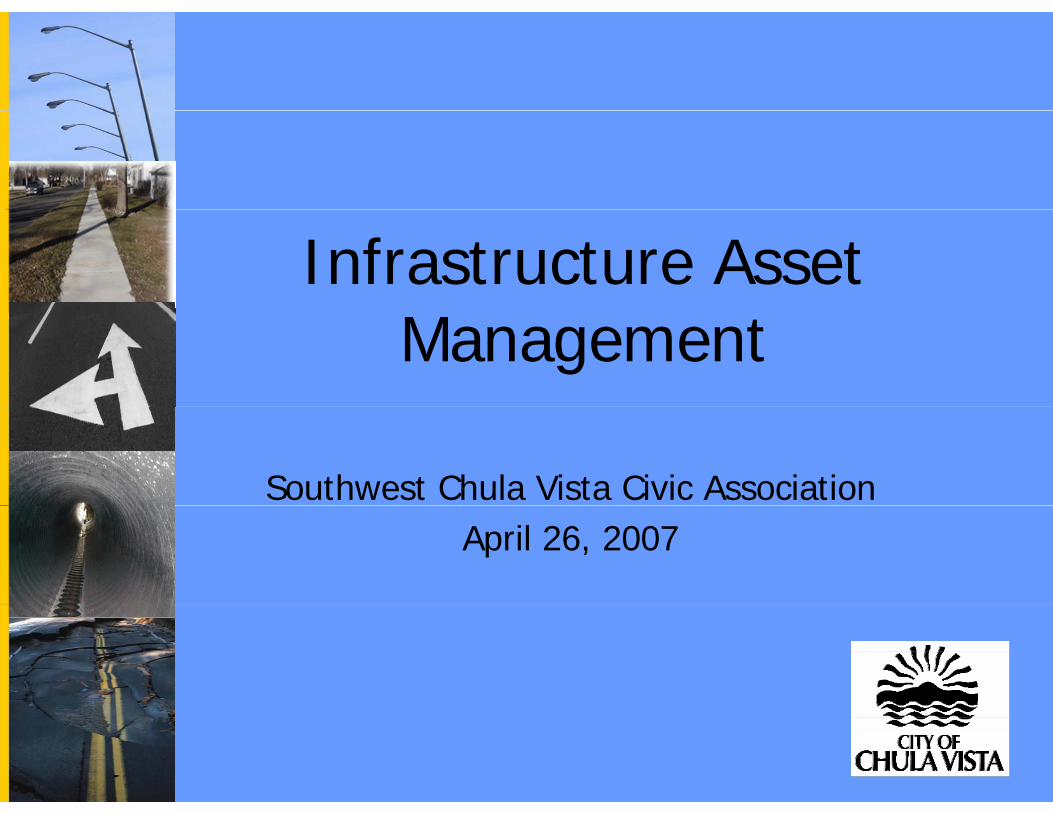
Chula Vista’s Municipal Infrastructure
– Pavement*– Alleys
– Traffic Signals– Streetlights
– Parking Lots– Sidewalks*– Curbs*
– Street Signs– Pavement Markings
P ki M tCurbs– Gutters*– Corners*
(i l di d )
– Parking Meters– Wastewater Collection System
(pipelines and pump stations)(including ped ramps)– Bridges– Retaining Walls
(pipelines and pump stations)– Storm Water Conveyance
System*g– Stairways– Guardrails
Trees
– Public Buildings(including parking structures)
– Parks
2
– Trees – Parks– Open Space
* First phase focus areas
Underlying BeliefsUnderlying BeliefsInfrastructure Asset Management
• Ongoing preventative maintenance to preserve infrastructure and avoidpreserve infrastructure and avoid catastrophic failure
• Proactive infrastructure management is• Proactive infrastructure management is necessary to manage risk and liability
• Catastrophic failure means higher• Catastrophic failure means higher expense repairs, more impact to the publicpublic
• Pay now or pay more later
3
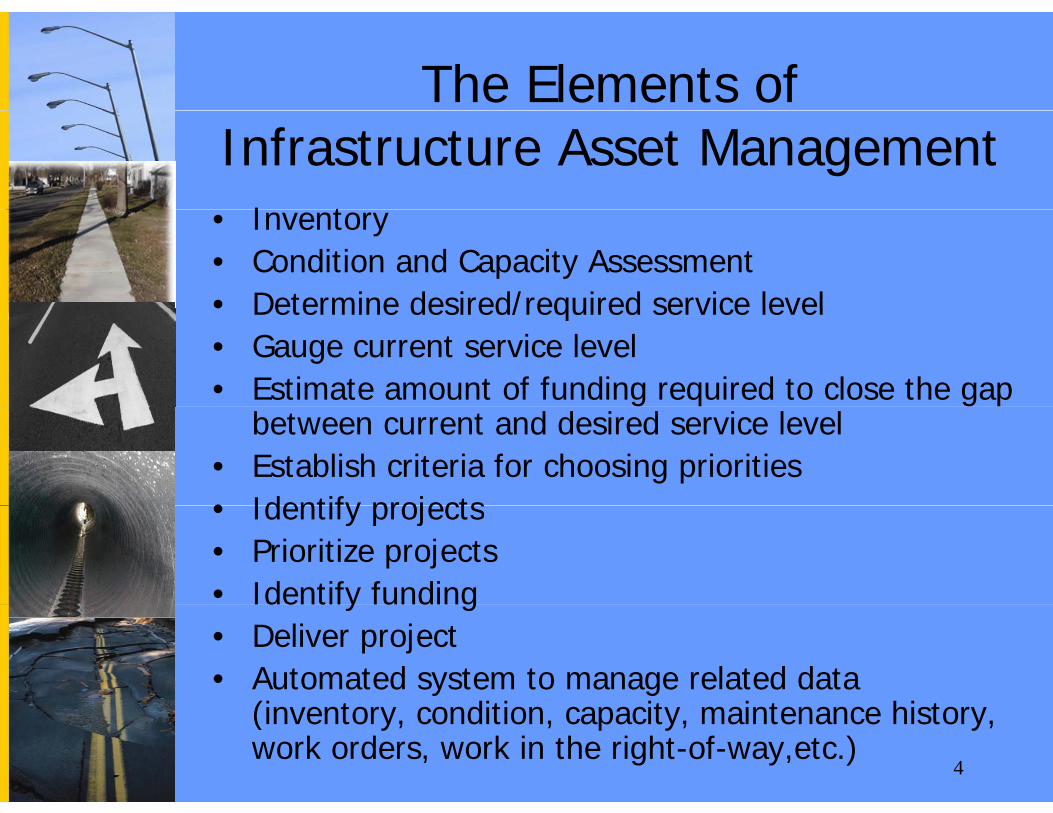
The Elements of Infrastructure Asset Management
I t• Inventory• Condition and Capacity Assessment• Determine desired/required service level• Determine desired/required service level• Gauge current service level• Estimate amount of funding required to close the gap
between current and desired service level• Establish criteria for choosing priorities• Identify projects• Identify projects• Prioritize projects• Identify fundingIdentify funding• Deliver project• Automated system to manage related data
(i t diti it i t hi t
4
(inventory, condition, capacity, maintenance history, work orders, work in the right-of-way,etc.)
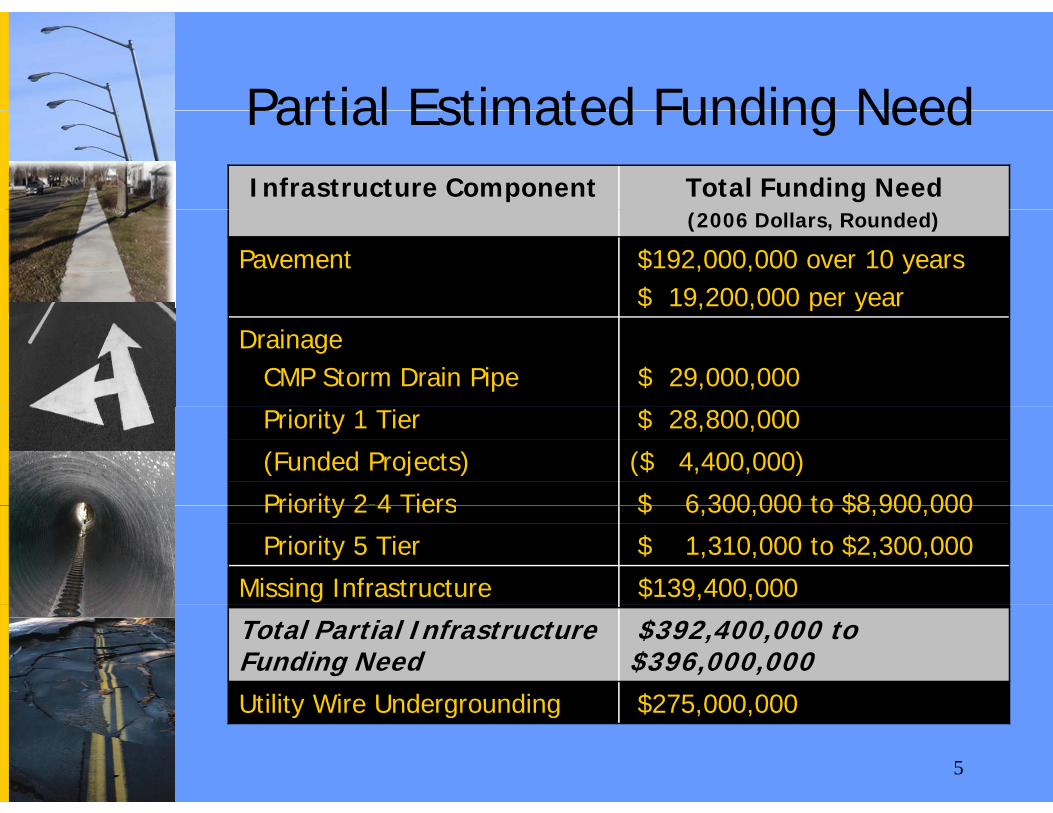
Partial Estimated Funding NeedPartial Estimated Funding NeedInfrastructure Component Total Funding Need
(2006 Dollars, Rounded)
Pavement $192,000,000 over 10 years$ 19,200,000 per year$ , , p y
DrainageCMP Storm Drain Pipe $ 29,000,000
Priority 1 Tier $ 28,800,000
(Funded Projects) ($ 4,400,000)
Priority 2-4 Tiers $ 6 300 000 to $8 900 000Priority 2 4 Tiers $ 6,300,000 to $8,900,000
Priority 5 Tier $ 1,310,000 to $2,300,000
Missing Infrastructure $139,400,000
Total Partial Infrastructure Funding Need
$392,400,000 to $396,000,000
Utility Wire Undergrounding $275 000 000
5
Utility Wire Undergrounding $275,000,000
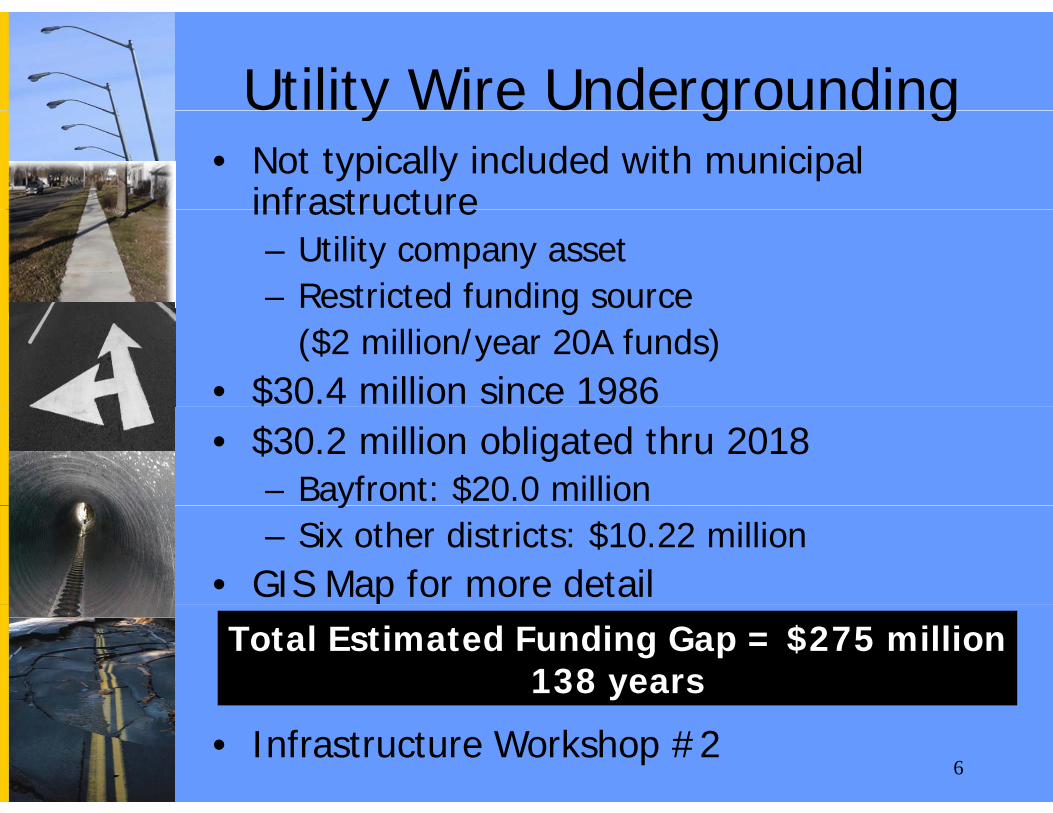
Utility Wire Undergroundingy g g• Not typically included with municipal
infrastructureinfrastructure– Utility company asset– Restricted funding source est cted u d g sou ce
($2 million/year 20A funds)• $30.4 million since 1986$• $30.2 million obligated thru 2018
– Bayfront: $20.0 milliony $– Six other districts: $10.22 million
• GIS Map for more detailpTotal Estimated Funding Gap = $275 million
138 years
6• Infrastructure Workshop #2
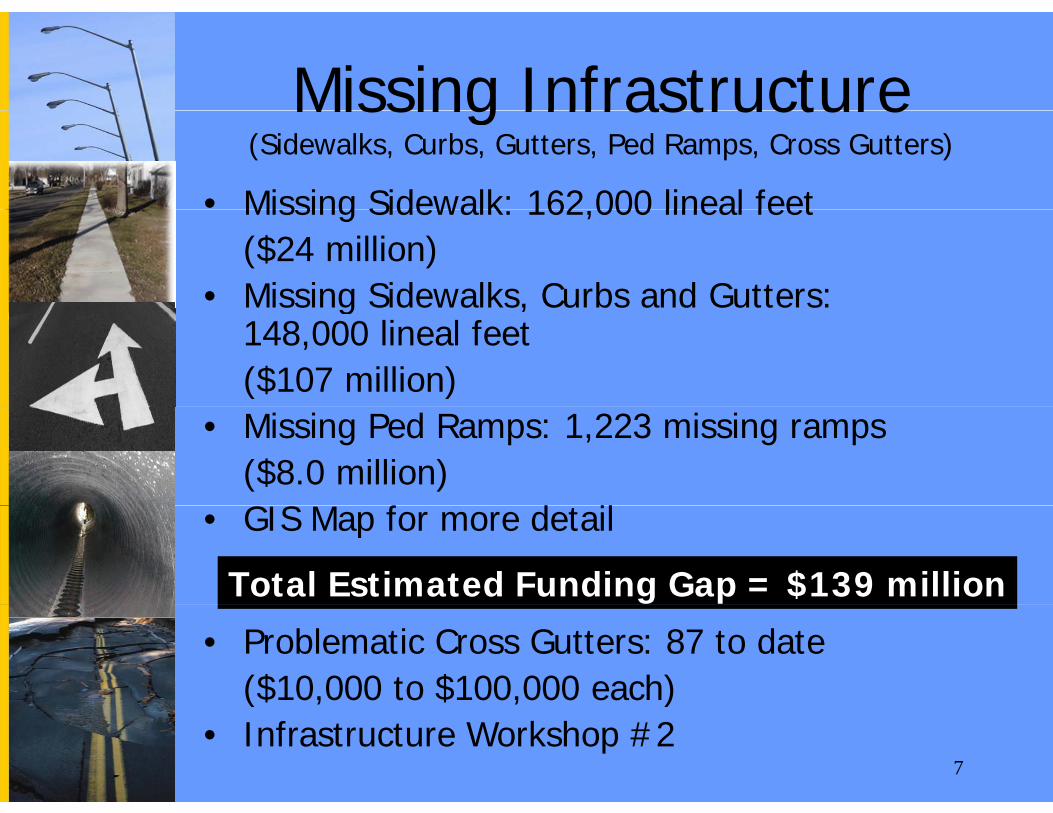
Missing InfrastructureMissing Infrastructure(Sidewalks, Curbs, Gutters, Ped Ramps, Cross Gutters)
• Missing Sidewalk: 162 000 lineal feet• Missing Sidewalk: 162,000 lineal feet ($24 million)
• Missing Sidewalks, Curbs and Gutters: g ,148,000 lineal feet ($107 million)
• Missing Ped Ramps: 1,223 missing ramps($8.0 million) GIS M f d il• GIS Map for more detail
Total Estimated Funding Gap = $139 million
• Problematic Cross Gutters: 87 to date ($10,000 to $100,000 each)
7
($ , $ , )• Infrastructure Workshop #2
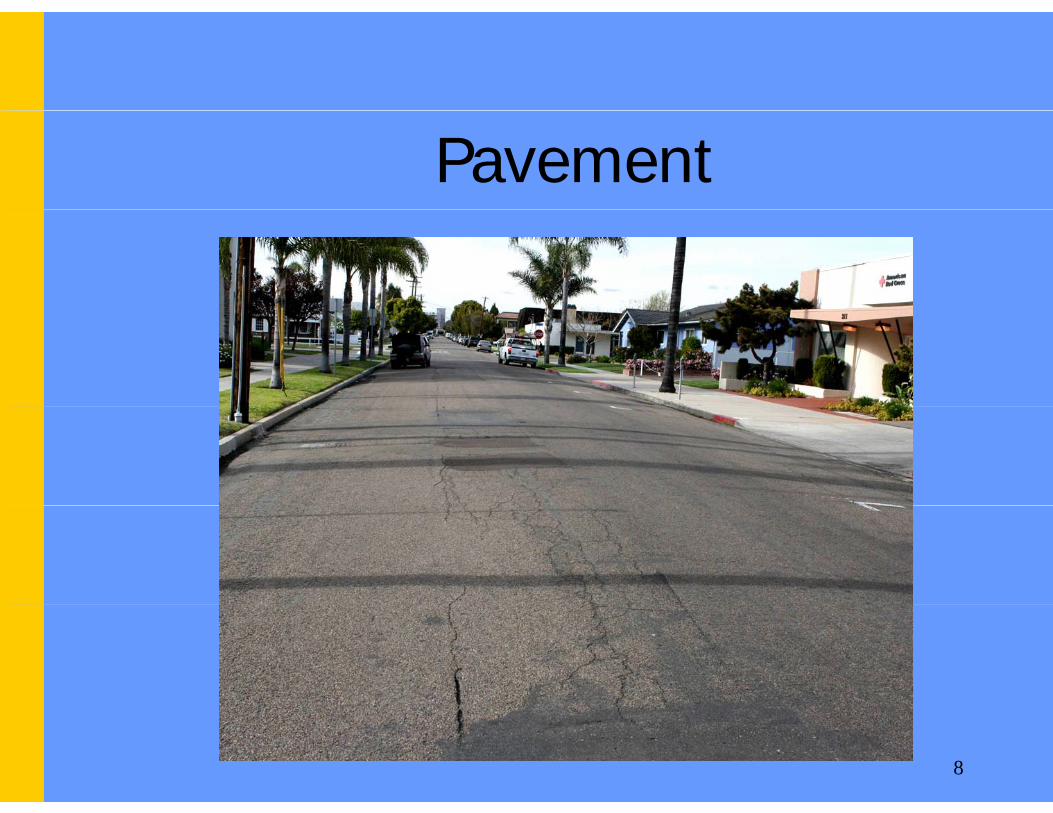
Pavement
8
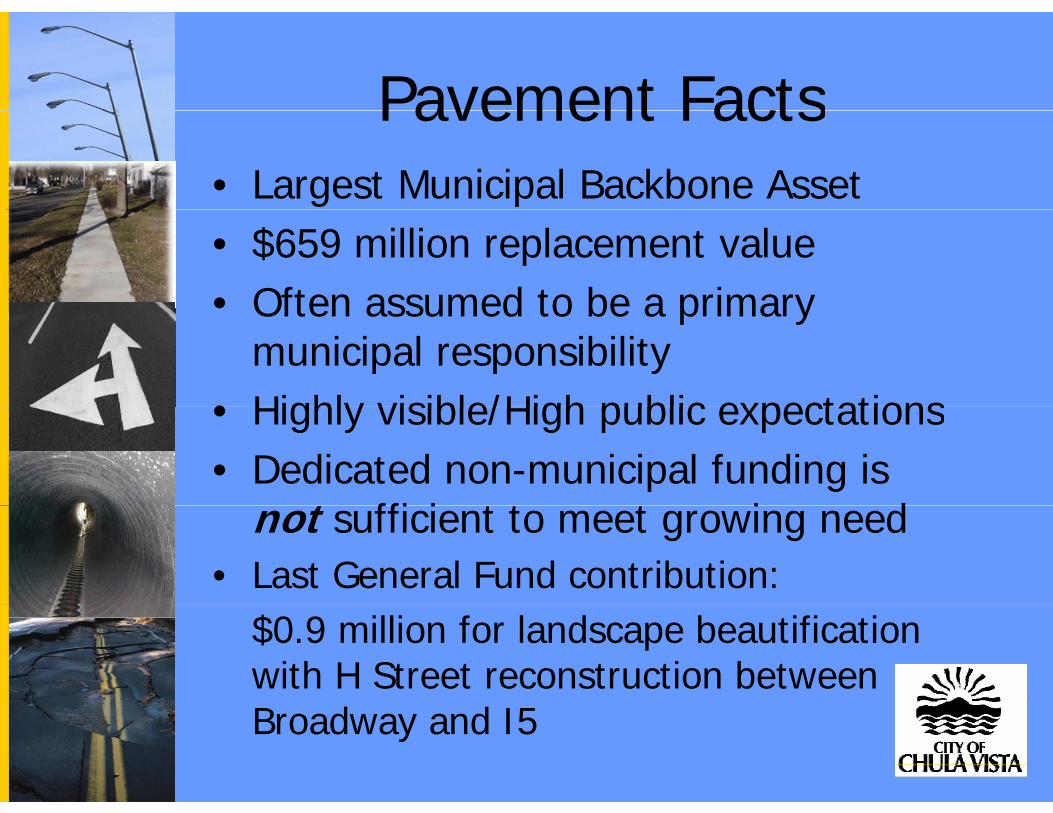
Pavement FactsPavement Facts• Largest Municipal Backbone Asset• $659 million replacement value• Often assumed to be a primary• Often assumed to be a primary
municipal responsibility• Highly visible/High public expectations• Highly visible/High public expectations• Dedicated non-municipal funding is
t ffi i t t t i dnot sufficient to meet growing need• Last General Fund contribution:
$0.9 million for landscape beautification with H Street reconstruction between
9
Broadway and I5
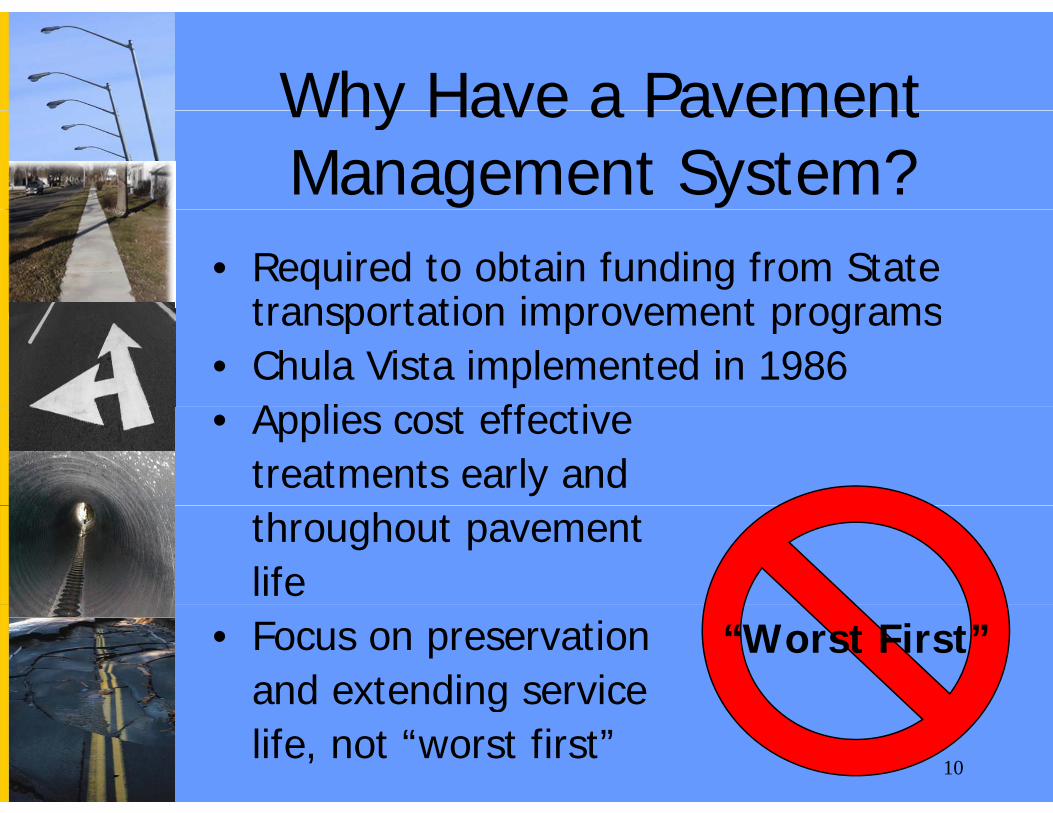
Why Have a PavementWhy Have a Pavement Management System?
• Required to obtain funding from State transportation improvement programstransportation improvement programs
• Chula Vista implemented in 1986A li t ff ti• Applies cost effective treatments early andthroughout pavementlife
• Focus on preservationand extending service
“Worst First”
10
and extending servicelife, not “worst first”
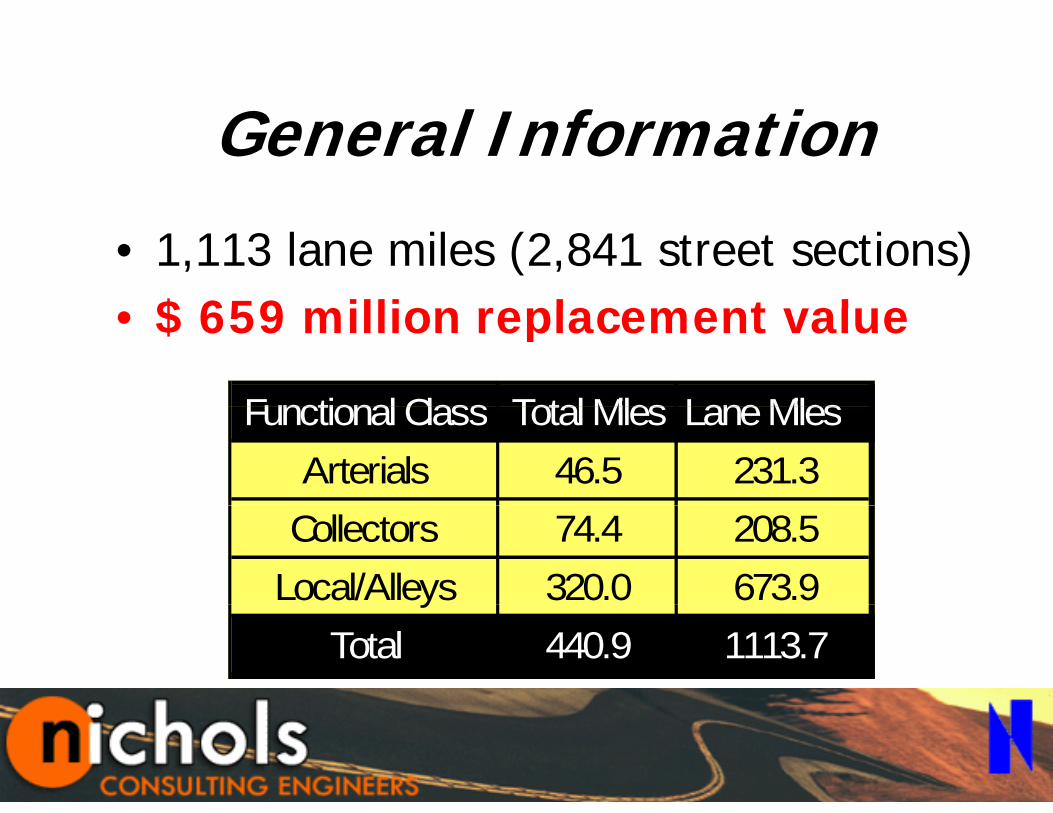
G l I f tiGeneral Information
• 1,113 lane miles (2,841 street sections)$ 659 million replacement value• $ 659 million replacement value
Functional Class Total Miles LaneMilesFunctional Class Total Miles Lane MilesArterials 46.5 231.3
Collectors 74.4 208.5Local/Alleys 320.0 673.9y
Total 440.9 1113.7
11
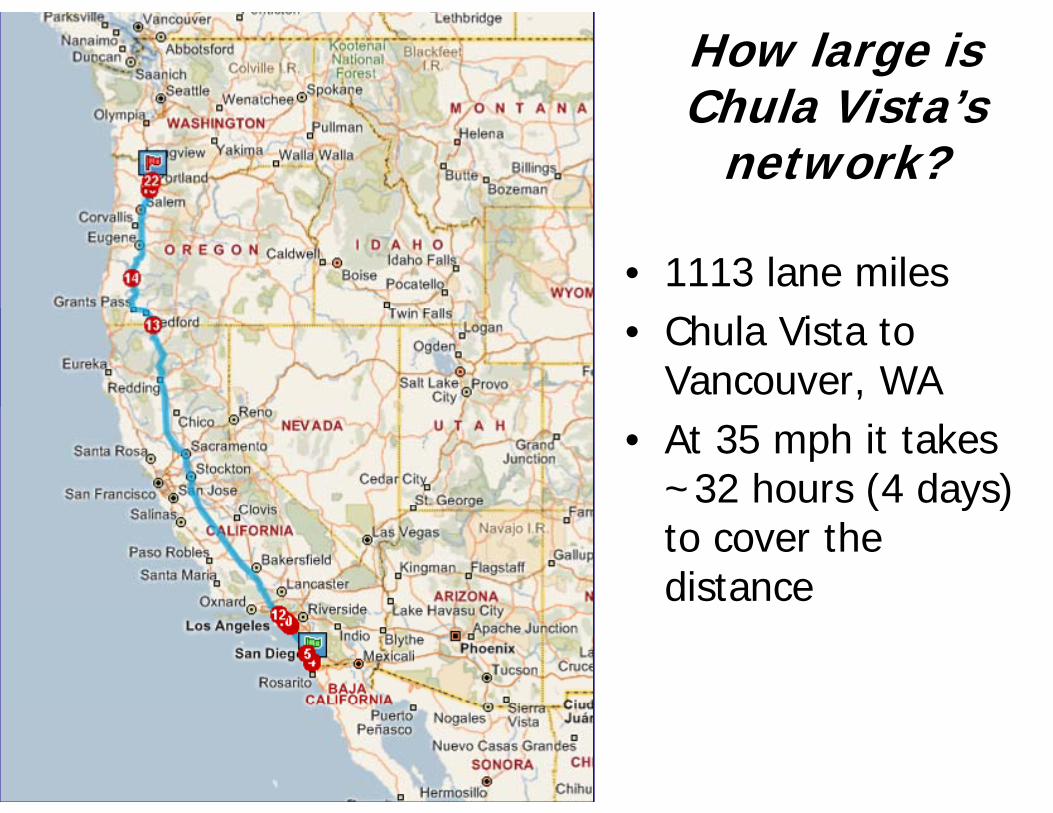
How large is Chula Vista’sChula Vista s
network?
• 1113 lane miles• Chula Vista to
Vancouver, WA• At 35 mph it takes
~32 hours (4 days) ( y )to cover the distance
12
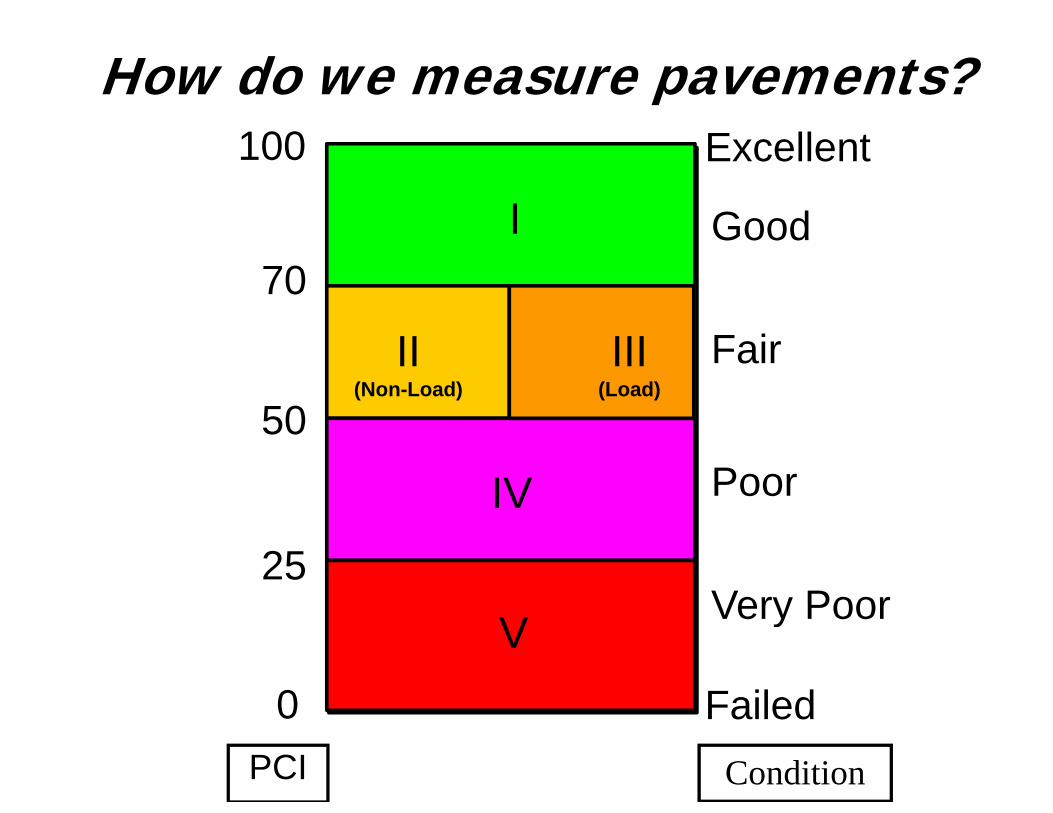
How do we measure pavements?100 Excellent
I70
GoodI
50
FairII(Non-Load)
III(Load)
50PoorIV
25Very Poor
IV
0 Failed
Very PoorV
13
0 FailedPCI Condition
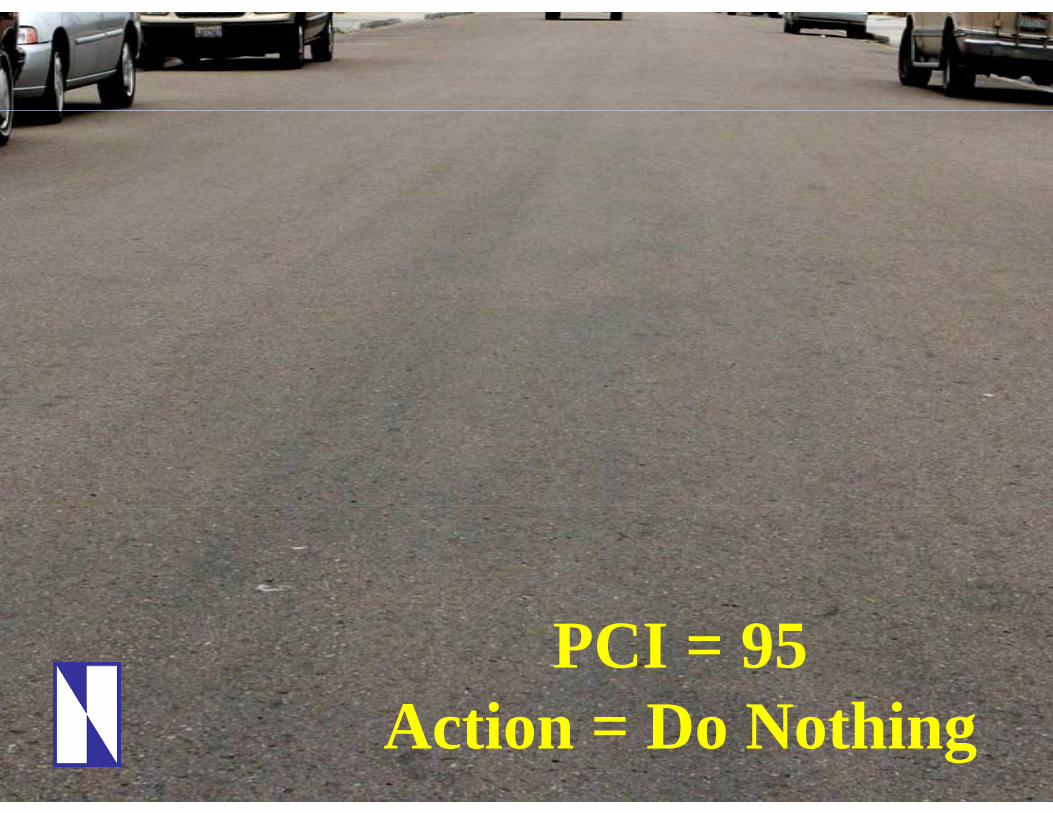
PCI = 95i i
14Action = Do Nothing
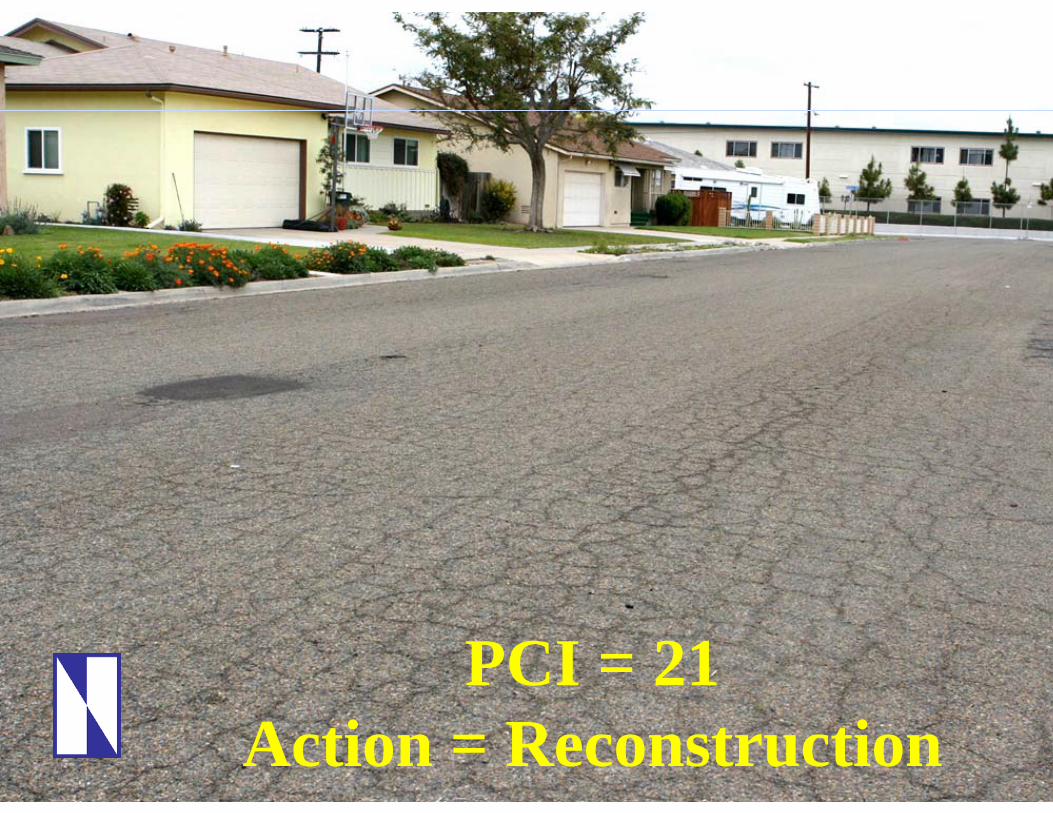
PCI = 2115Action = Reconstruction
2006 Average PCI
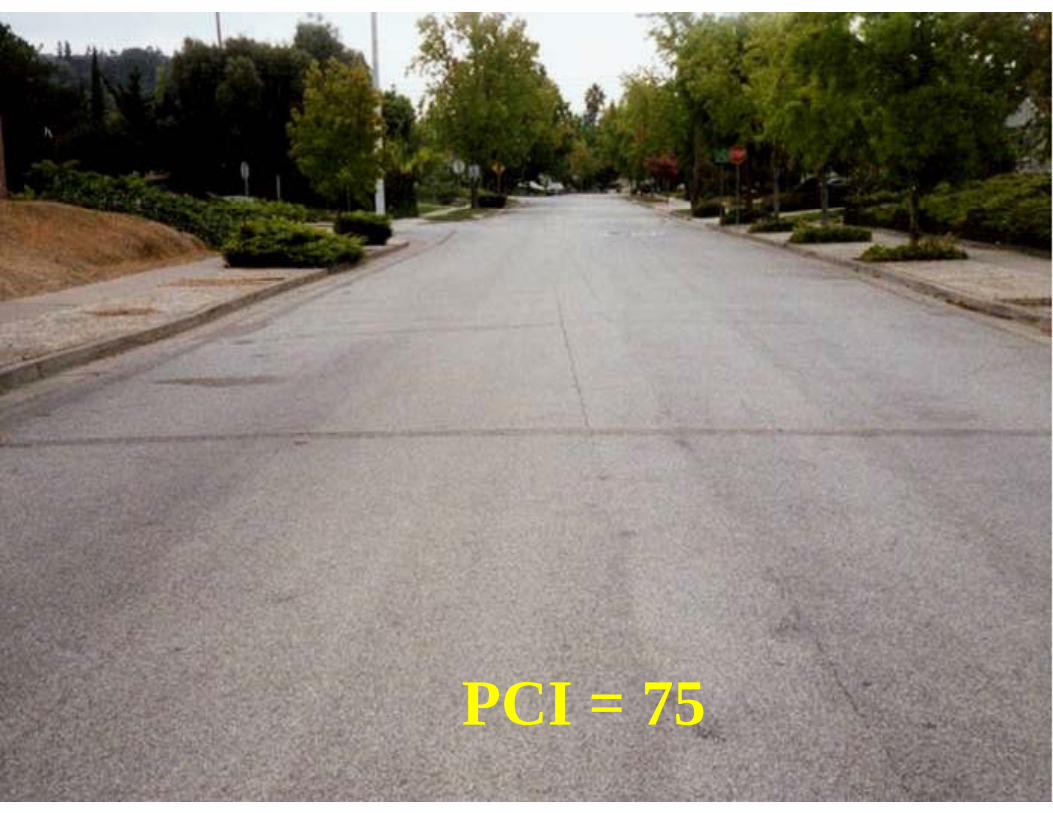
A PCIAverage PCI: 79 (“Good”) ( )PCI Range: 13 10013-100
PCI = 7516
PCI = 75
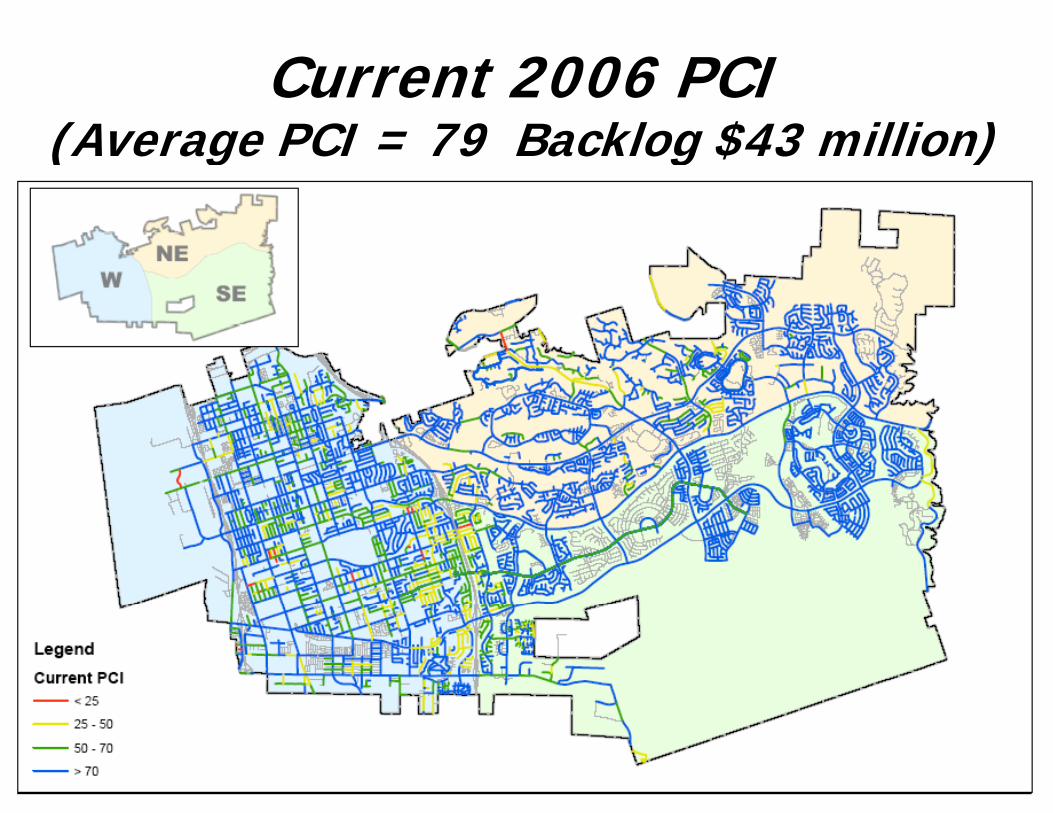
Current 2006 PCI(Average PCI = 79 Backlog $43 million)
17
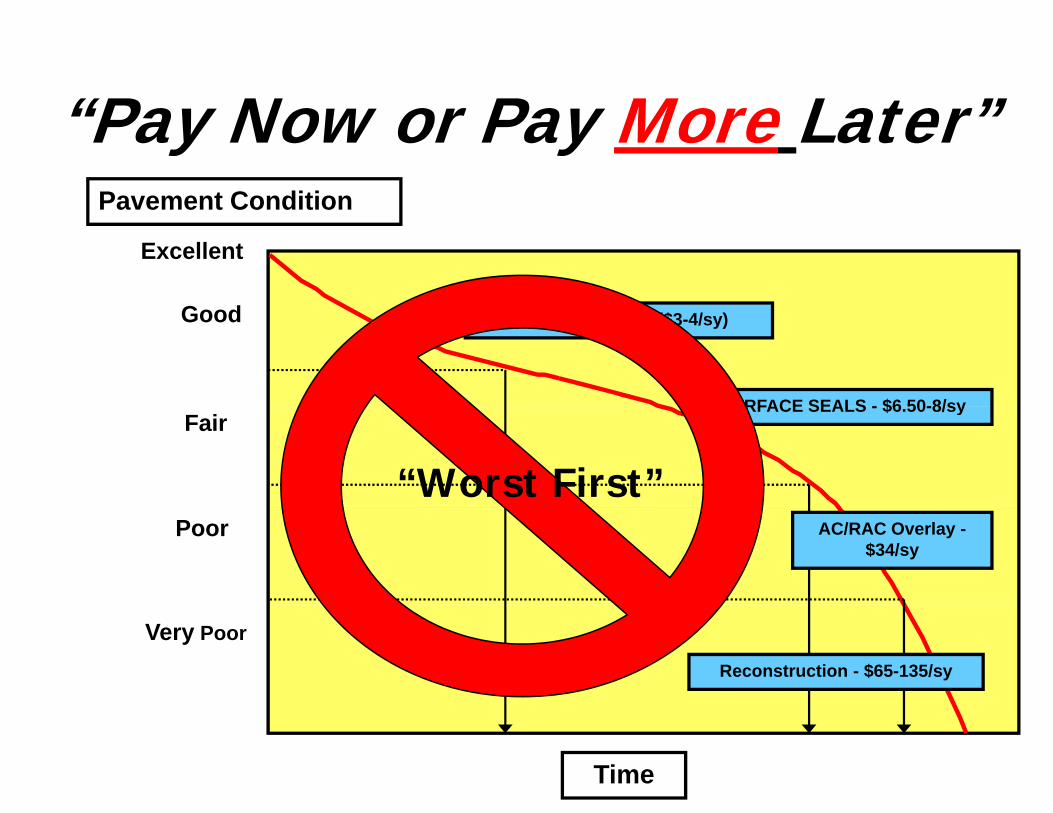
“Pay Now or Pay More Later”Pavement Condition
“Pay Now or Pay More Later”Pavement Condition
G d
Excellent
Good Crack Seal/REAS ($3-4/sy)
SURFACE SEALS - $6 50-8/syFair
SURFACE SEALS - $6.50-8/sy
“Worst First”Poor AC/RAC Overlay -
$34/sy
Very Poor
Reconstruction - $65-135/sy
18Time
Failed
40% 75% 90%
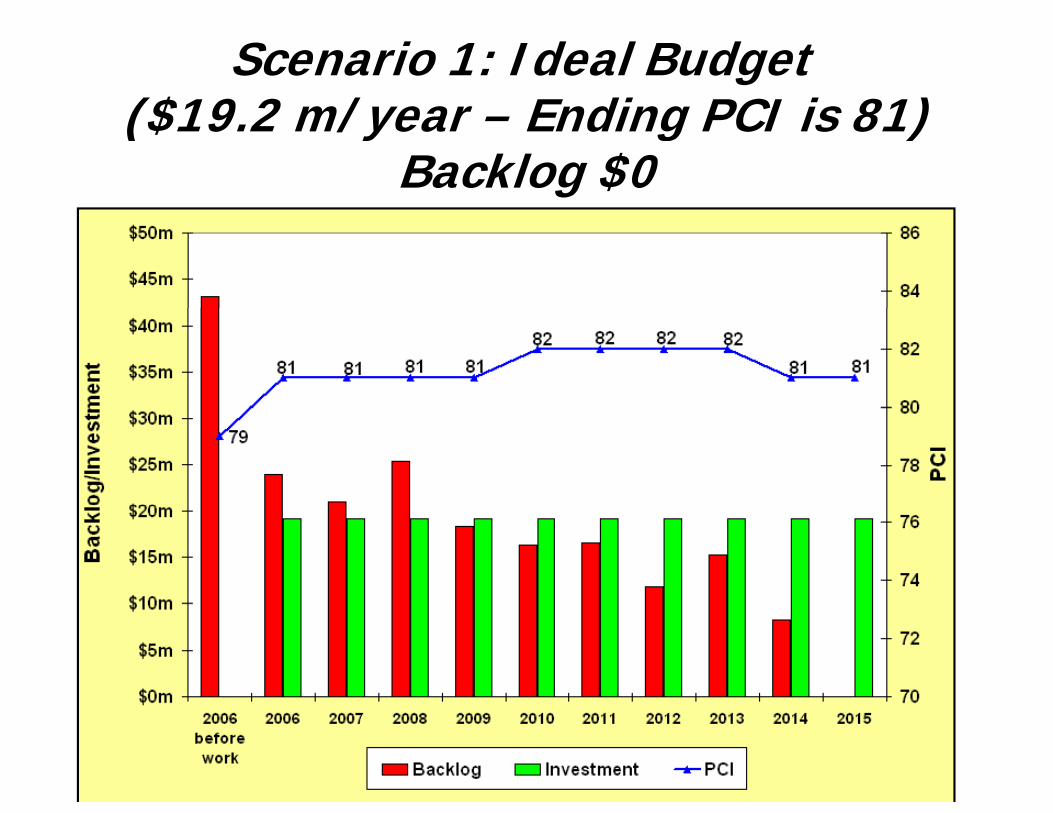
Scenario 1: Ideal Budget ($19 2 m/year Ending PCI is 81)($19.2 m/year – Ending PCI is 81)
Backlog $0
19
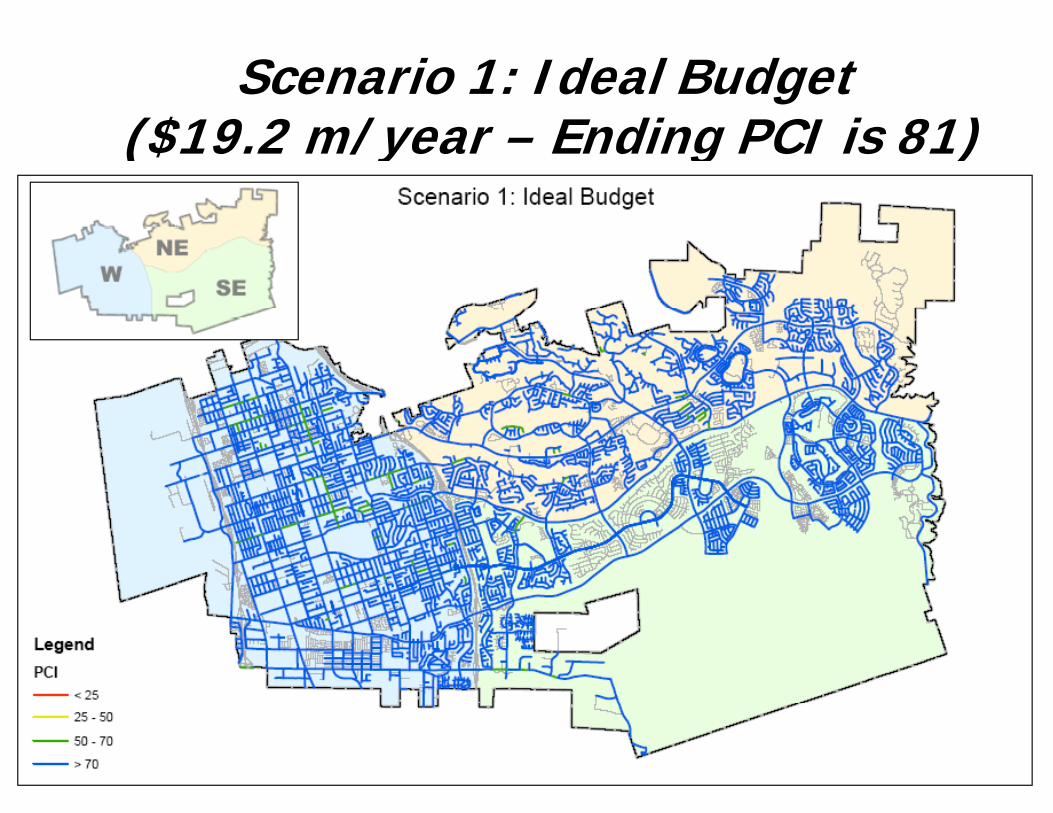
Scenario 1: Ideal Budget($19.2 m/year – Ending PCI is 81)
20
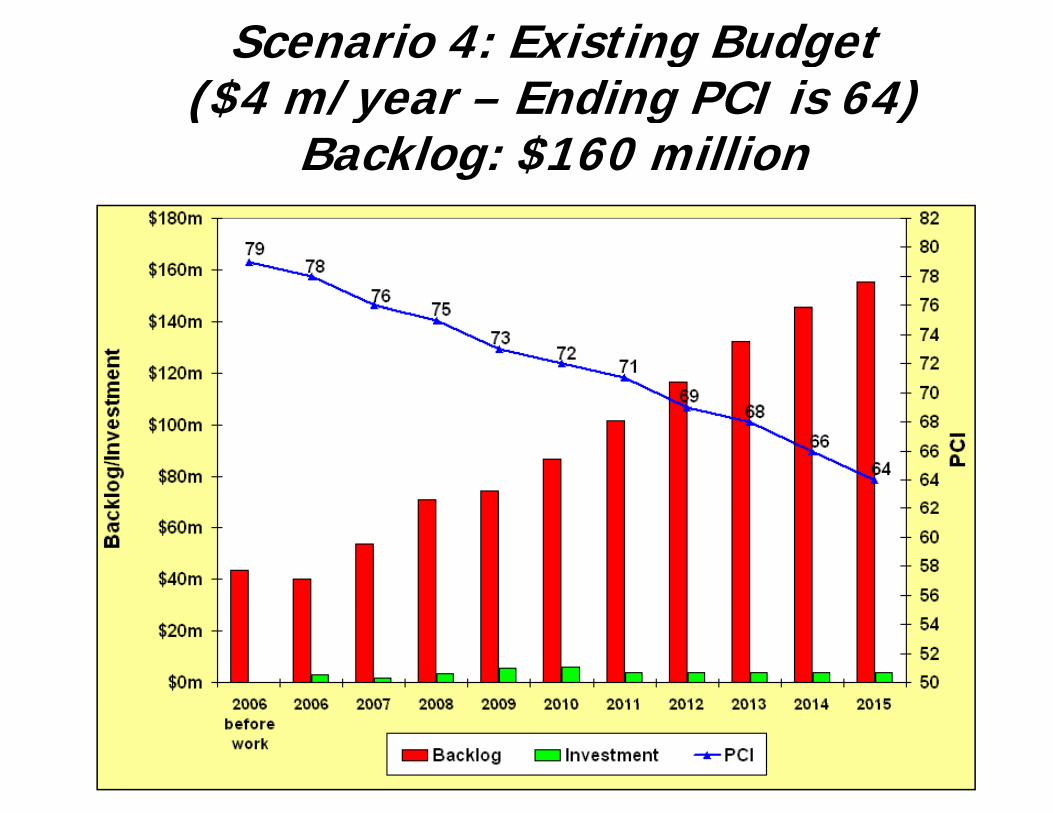
Scenario 4: Existing Budget($4 m/year – Ending PCI is 64)($4 m/year Ending PCI is 64)
Backlog: $160 million
21
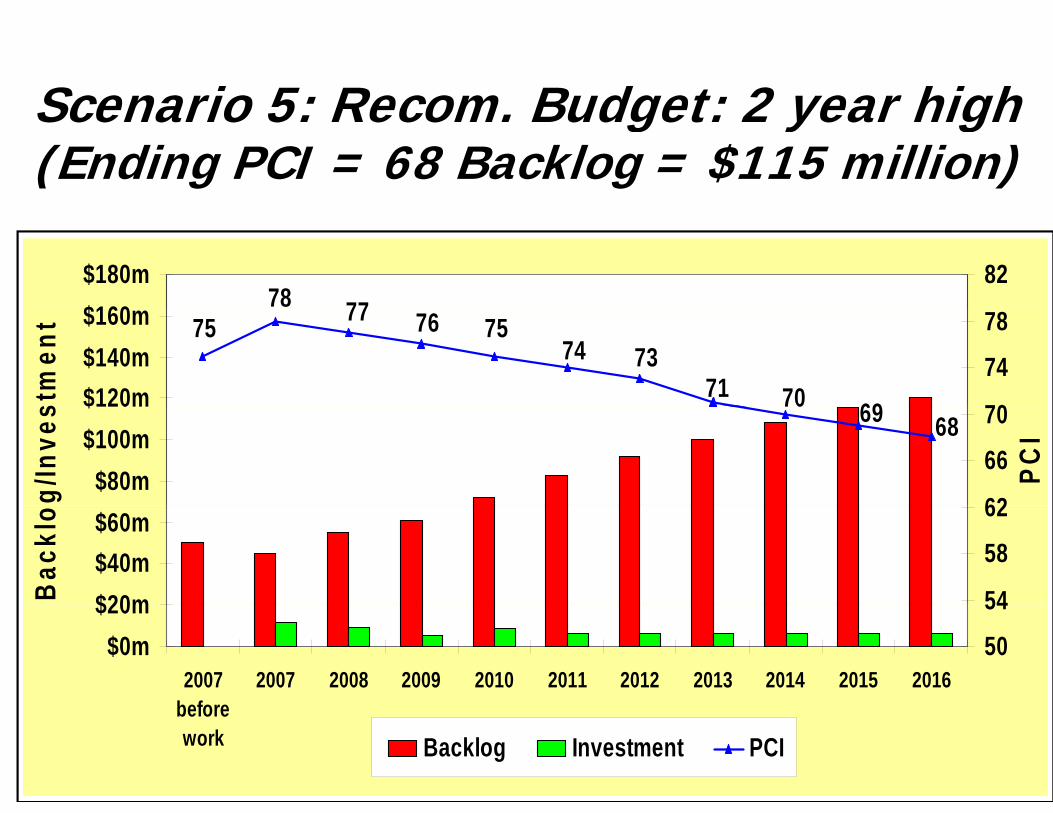
Scenario 5: Recom Budget: 2 year highScenario 5: Recom. Budget: 2 year high(Ending PCI = 68 Backlog = $115 million)
7778$160$180m 82
75
6970717374
7577 76
$120m$140m$160m
stm
ent
70
74
78
68690
$80m$100m$ 0
g/In
ves
62
66
70
PCI
$20m$40m$60m
Bac
klo
54
58
62
$0m$20m
2007b f
2007 2008 2009 2010 2011 2012 2013 2014 2015 201650
54
22
beforework Backlog Investment PCI
ConclusionsConclusions
• City has pavement network in “good” condition - will deteriorate to “fair” under current budget
• With no change in funding, deferred maintenance will grow from $43m to $160m in g $ $10 years
• Allocate sufficient funds to reduce deteriorationAllocate sufficient funds to reduce deterioration• Preserve good roads first!
23
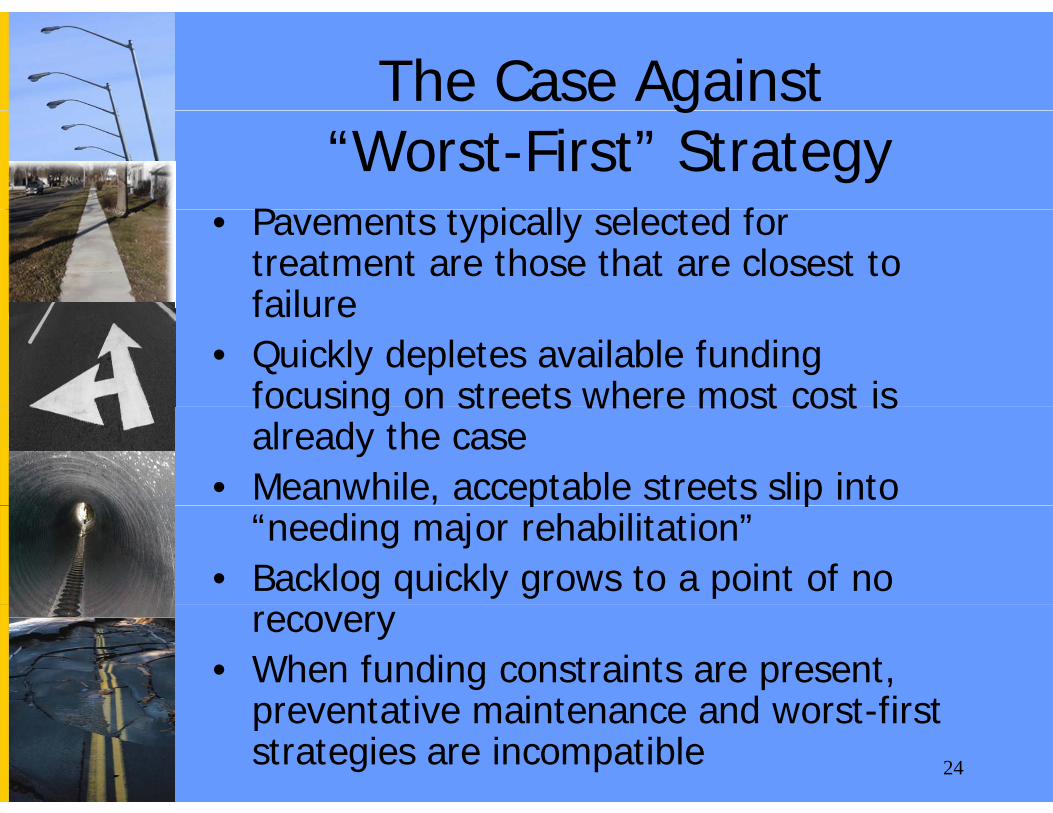
The Case Againstg“Worst-First” Strategy
P t t i ll l t d f• Pavements typically selected for treatment are those that are closest to failurefailure
• Quickly depletes available funding focusing on streets where most cost isfocusing on streets where most cost is already the case
• Meanwhile, acceptable streets slip into , p p“needing major rehabilitation”
• Backlog quickly grows to a point of no recovery
• When funding constraints are present, preventative maintenance and worst first
24
preventative maintenance and worst-first strategies are incompatible
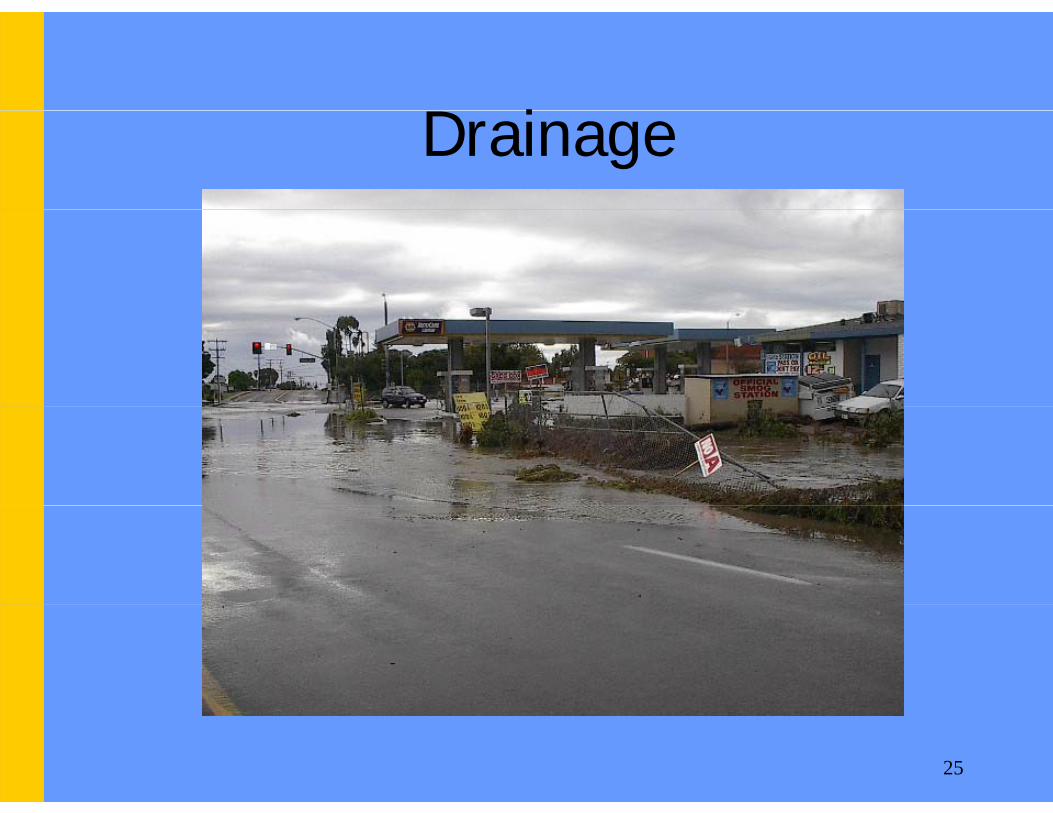
D iDrainage
25
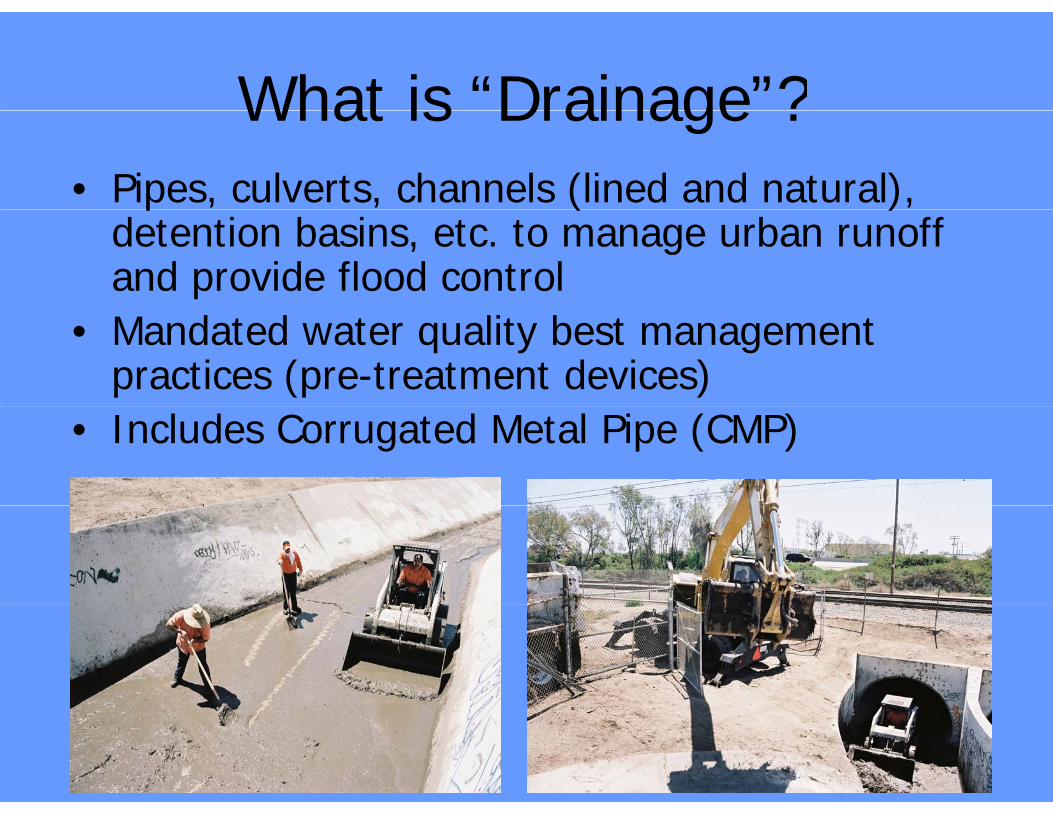
What is “Drainage”?What is Drainage ?• Pipes, culverts, channels (lined and natural), p , , ( ),
detention basins, etc. to manage urban runoff and provide flood control
• Mandated water quality best management practices (pre-treatment devices)
• Includes Corrugated Metal Pipe (CMP)
26
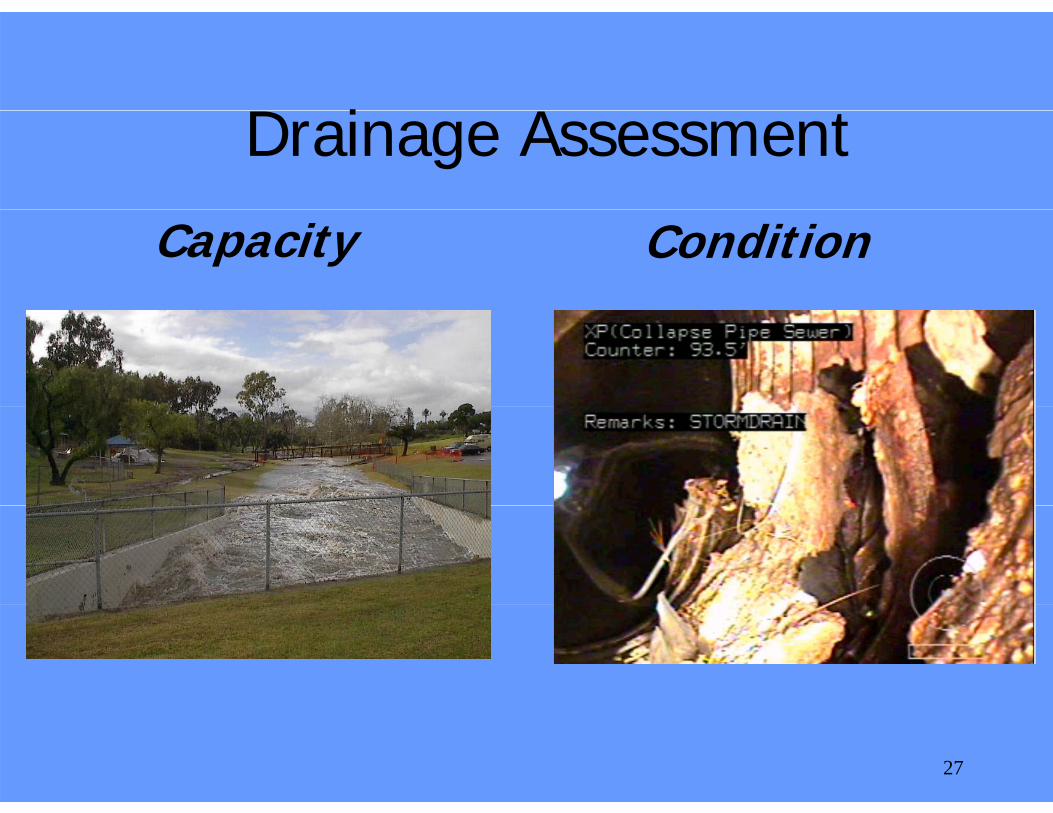
D i A tDrainage Assessment
ConditionCapacity
27
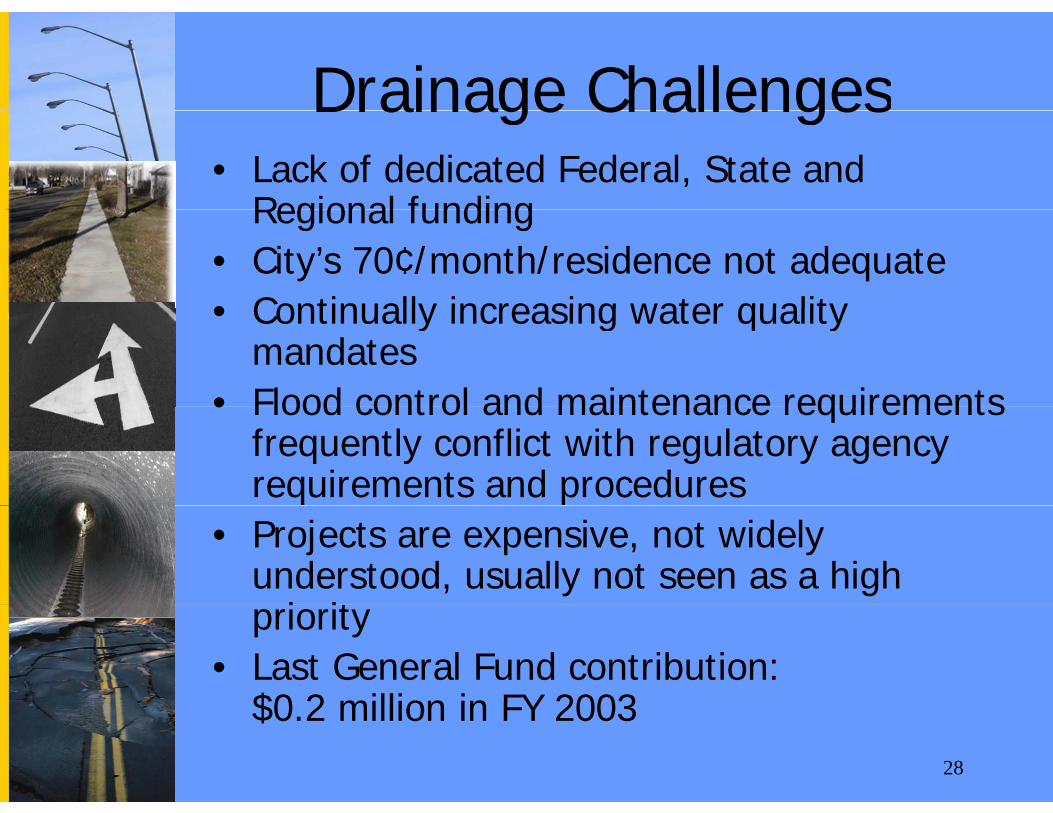
Drainage ChallengesDrainage Challenges• Lack of dedicated Federal, State and
Regional fundingRegional funding• City’s 70¢/month/residence not adequate• Continually increasing water quality• Continually increasing water quality
mandates• Flood control and maintenance requirements• Flood control and maintenance requirements
frequently conflict with regulatory agency requirements and procedures
• Projects are expensive, not widely understood, usually not seen as a high
i itpriority• Last General Fund contribution:
$0 2 million in FY 200328
$0.2 million in FY 2003
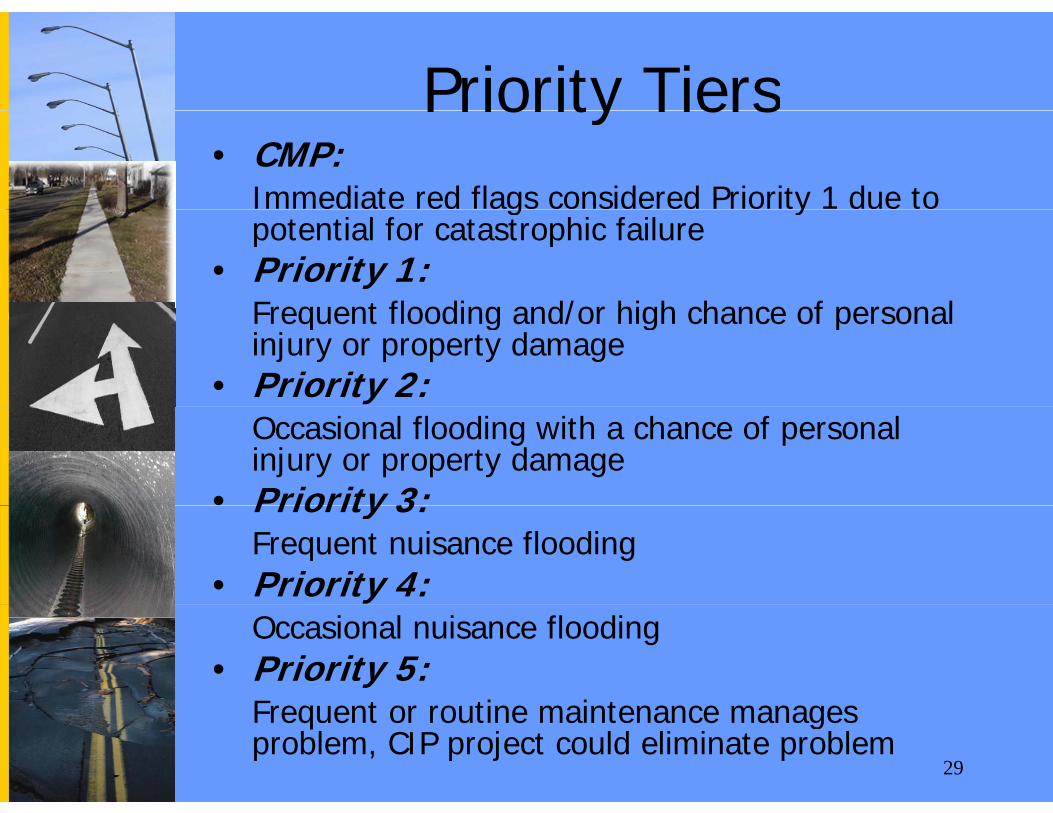
Priority TiersPriority Tiers• CMP:
Immediate red flags considered Priority 1 due to g ypotential for catastrophic failure
• Priority 1:Frequent flooding and/or high chance of personalFrequent flooding and/or high chance of personal injury or property damage
• Priority 2:Occasional flooding with a chance of personal injury or property damage
• Priority 3:• Priority 3:Frequent nuisance flooding
• Priority 4:Occasional nuisance flooding
• Priority 5:F t ti i t
29
Frequent or routine maintenance manages problem, CIP project could eliminate problem
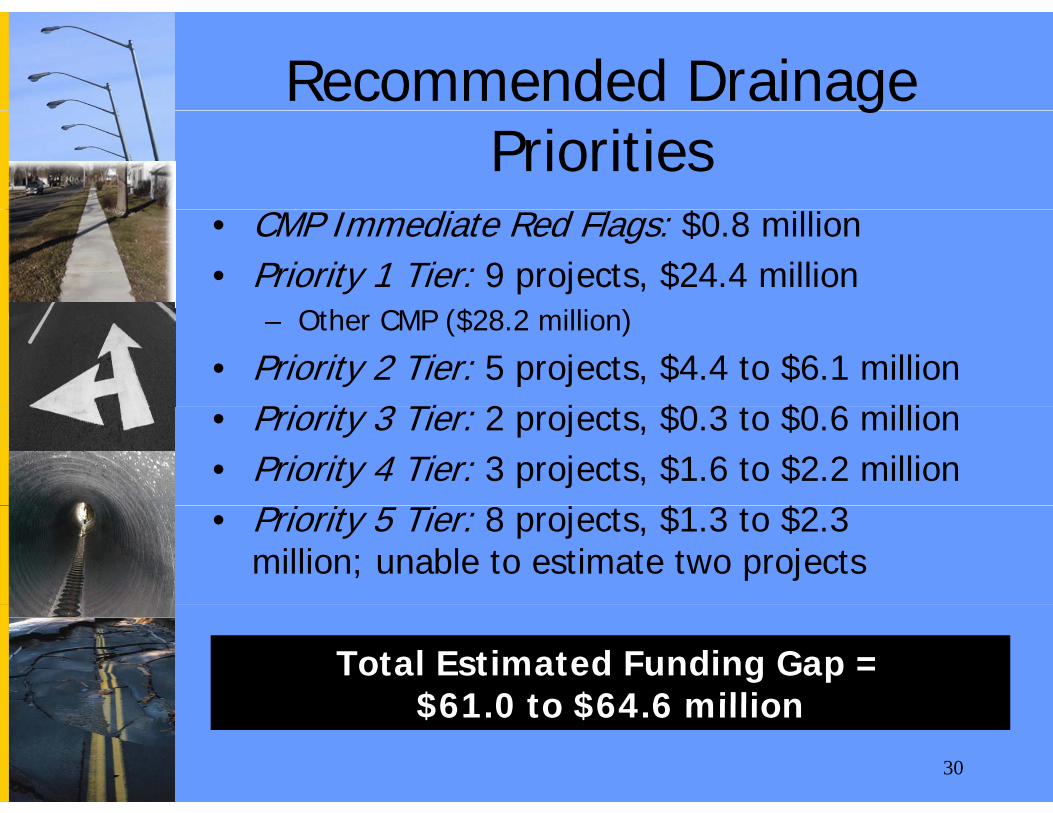
Recommended Drainage gPriorities
• CMP Immediate Red Flags: $0.8 million• Priority 1 Tier: 9 projects, $24.4 million
$– Other CMP ($28.2 million)
• Priority 2 Tier: 5 projects, $4.4 to $6.1 millionP i it 3 Ti 2 j t $0 3 t $0 6 illi• Priority 3 Tier: 2 projects, $0.3 to $0.6 million
• Priority 4 Tier: 3 projects, $1.6 to $2.2 million8 $ 3 $2 3• Priority 5 Tier: 8 projects, $1.3 to $2.3
million; unable to estimate two projects
Total Estimated Funding Gap = $61 0 to $64 6 million
30
$61.0 to $64.6 million
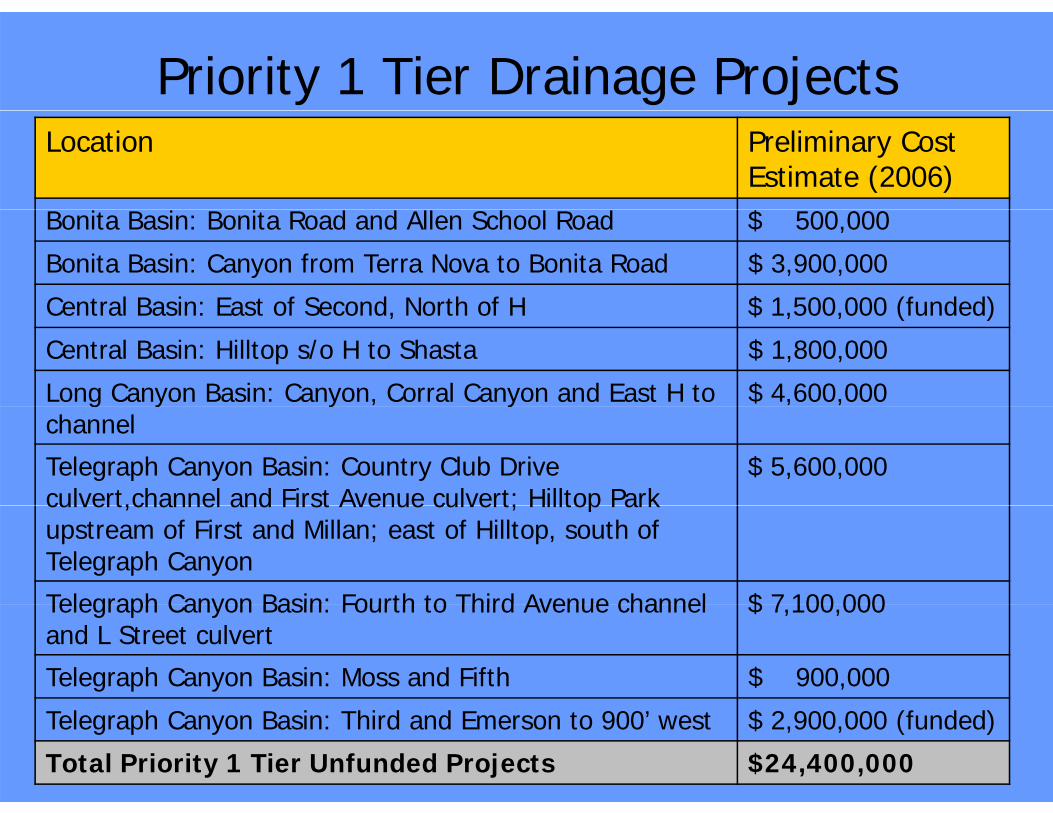
Priority 1 Tier Drainage ProjectsLocation Preliminary Cost
Estimate (2006)$Bonita Basin: Bonita Road and Allen School Road $ 500,000
Bonita Basin: Canyon from Terra Nova to Bonita Road $ 3,900,000
Central Basin: East of Second North of H $ 1 500 000 (funded)Central Basin: East of Second, North of H $ 1,500,000 (funded)
Central Basin: Hilltop s/o H to Shasta $ 1,800,000
Long Canyon Basin: Canyon, Corral Canyon and East H to $ 4,600,000g y y ychannel
Telegraph Canyon Basin: Country Club Drive culvert,channel and First Avenue culvert; Hilltop Park
$ 5,600,000culvert,channel and First Avenue culvert; Hilltop Park upstream of First and Millan; east of Hilltop, south of Telegraph Canyon
Telegraph Canyon Basin: Fourth to Third Avenue channel $ 7 100 000Telegraph Canyon Basin: Fourth to Third Avenue channel and L Street culvert
$ 7,100,000
Telegraph Canyon Basin: Moss and Fifth $ 900,000
31
Telegraph Canyon Basin: Third and Emerson to 900’ west $ 2,900,000 (funded)
Total Priority 1 Tier Unfunded Projects $24,400,000
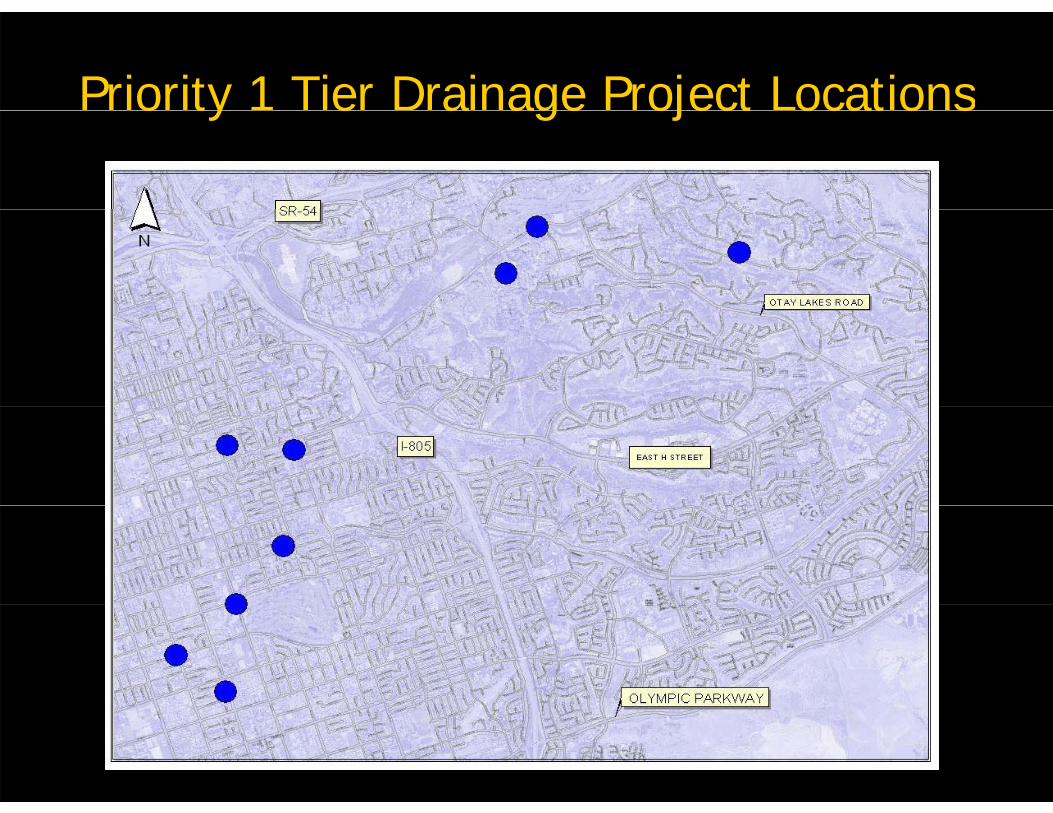
Priority 1 Tier Drainage Project Locationso ty e a age oject ocat o s
32
Funding Chula Vista’s I f t t N dInfrastructure Needs
33
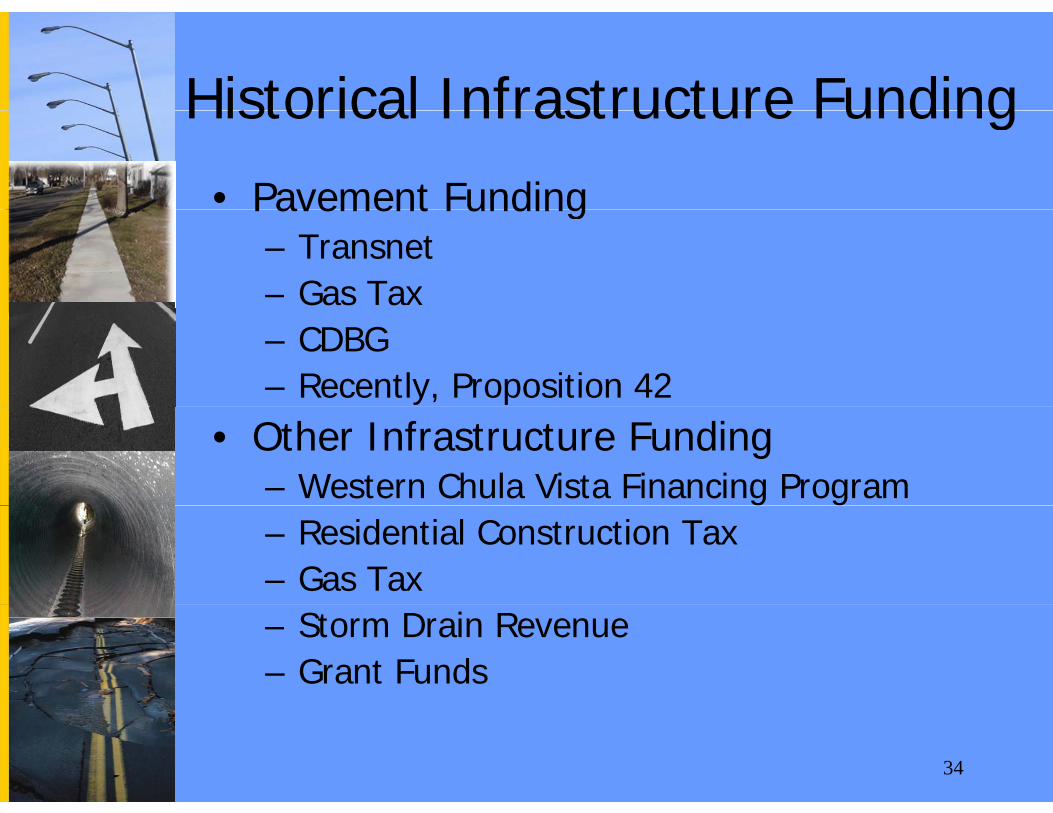
Historical Infrastructure FundingHistorical Infrastructure Funding
• Pavement FundingPavement Funding– Transnet– Gas Tax– CDBG– Recently, Proposition 42
• Other Infrastructure Funding– Western Chula Vista Financing Program– Residential Construction Tax– Gas Tax– Storm Drain Revenue– Grant Funds
34
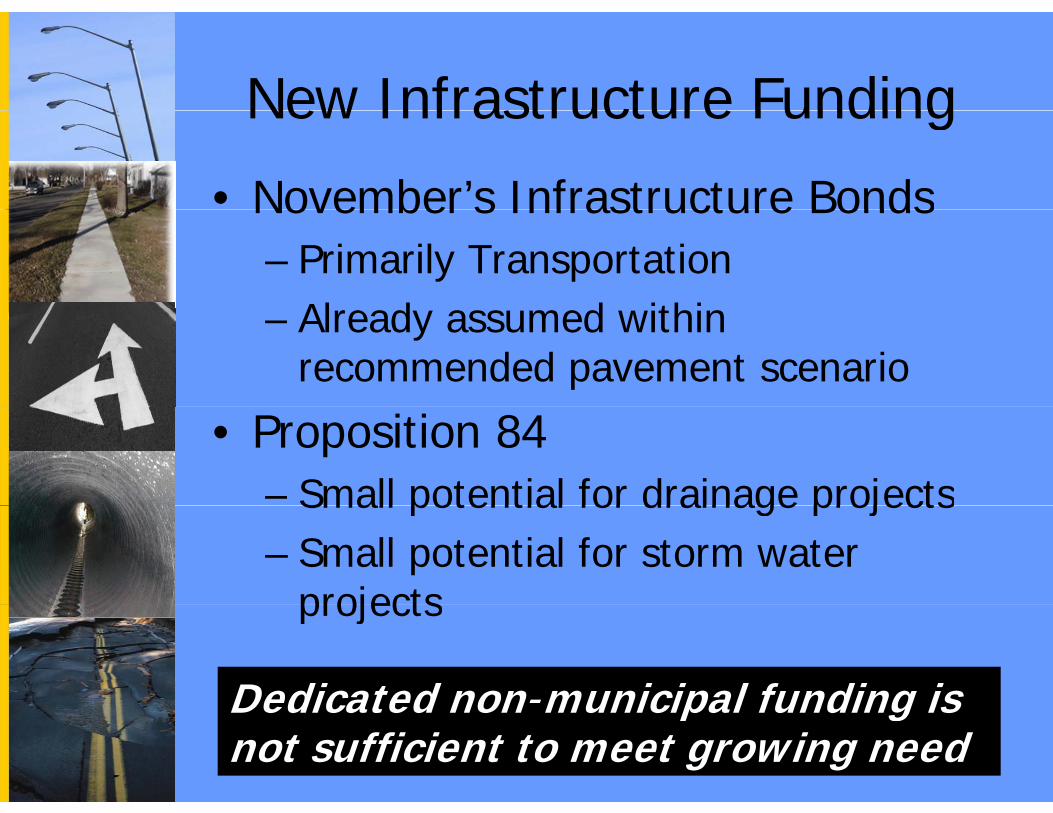
New Infrastructure FundingNew Infrastructure Funding
• November’s Infrastructure BondsNovember s Infrastructure Bonds– Primarily Transportation
Al d d ithi– Already assumed within recommended pavement scenario
• Proposition 84– Small potential for drainage projectsSmall potential for drainage projects– Small potential for storm water
projectsprojects
Dedicated non-municipal funding is35
Dedicated non municipal funding is not sufficient to meet growing need
Potential New FundingPotential New FundingV hi l R i t ti F (St t• Vehicle Registration Fees (State legislation)
• Grants• Federal Earmarks• Local Bond Measure• Local Sales Tax Increase (sunset clause)• Local Sales Tax Increase (sunset clause)• Tax Increment• Citywide Assessment Districts
36
37