INFOSYS LIMITED · INFOSYS LIMITED Condensed Statement of Cash Flows (In ` crore) Particulars 2018...
41
Index Balance Sheet Statement of Profit and Loss Statement of Changes in Equity Statement of Cash Flows 1. Overview 1.1 Company overview 1.2 Basis of preparation of financial statements 1.3 Use of estimates and judgments 1.4 Critical accounting estimates 1.5 Recent accounting pronouncements 2. Notes to financial statements 2.1 Property, Plant And Equipment 2.2 Investments 2.3 Loans 2.4 Other Financial Assets 2.5 Trade Receivables 2.6 Cash And Cash Equivalents 2.7 Other Assets 2.8 Financial Instruments 2.9 Equity 2.10 Other Financial Liabilities 2.11 Trade Payables 2.12 Other Liabilities 2.13 Provisions 2.14 Income Taxes 2.15 Revenue From Operations 2.16 Other Income, Net 2.17 Expenses 2.18 Reconciliation Of Basic And Diluted Shares Used In Computing Earning Per Share 2.19 Contingent Liabilities And Commitments 2.20 Related Party Transactions 2.21 Segment Reporting 2.22 Assets Held For Sale 2.23 Function-Wise Classification Of Statement Of Profit And Loss INFOSYS LIMITED Standalone Financial Statements under Indian Accounting Standards (Ind AS) for the three months and year ended March 31, 2018
Transcript of INFOSYS LIMITED · INFOSYS LIMITED Condensed Statement of Cash Flows (In ` crore) Particulars 2018...

Index
Balance Sheet
Statement of Profit and Loss
Statement of Changes in Equity
Statement of Cash Flows
1. Overview
1.1 Company overview
1.2 Basis of preparation of financial statements
1.3 Use of estimates and judgments
1.4 Critical accounting estimates
1.5 Recent accounting pronouncements
2. Notes to financial statements
2.1 Property, Plant And Equipment
2.2 Investments
2.3 Loans
2.4 Other Financial Assets
2.5 Trade Receivables
2.6 Cash And Cash Equivalents
2.7 Other Assets
2.8 Financial Instruments
2.9 Equity
2.10 Other Financial Liabilities
2.11 Trade Payables
2.12 Other Liabilities
2.13 Provisions
2.14 Income Taxes
2.15 Revenue From Operations
2.16 Other Income, Net
2.17 Expenses
2.18 Reconciliation Of Basic And Diluted Shares Used In Computing Earning Per Share
2.19 Contingent Liabilities And Commitments
2.20 Related Party Transactions
2.21 Segment Reporting
2.22 Assets Held For Sale
2.23 Function-Wise Classification Of Statement Of Profit And Loss
INFOSYS LIMITEDStandalone Financial Statements
under Indian Accounting Standards (Ind AS)
for the three months and year ended March 31, 2018
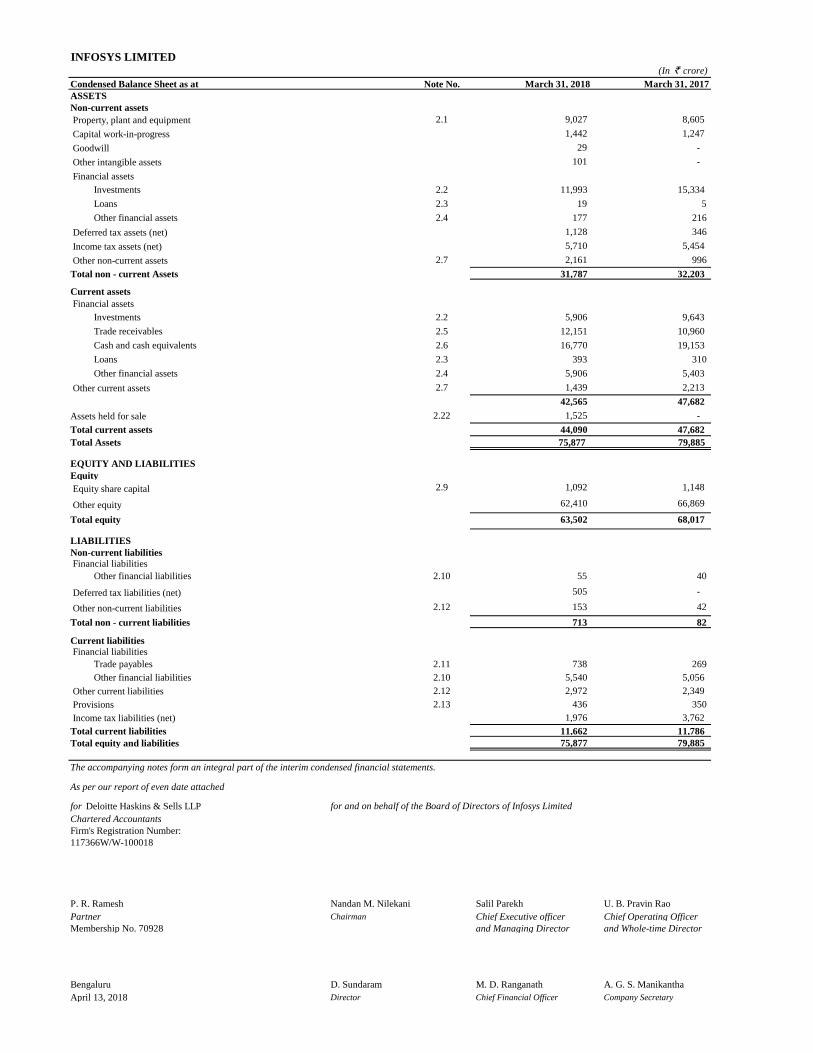
INFOSYS LIMITED(In ` crore)
Note No. March 31, 2018 March 31, 2017
Property, plant and equipment 2.1 9,027 8,605
Capital work-in-progress 1,442 1,247
Goodwill 29 -
Other intangible assets 101 -
Financial assets
Investments 2.2 11,993 15,334
Loans 2.3 19 5
Other financial assets 2.4 177 216
Deferred tax assets (net) 1,128 346
Income tax assets (net) 5,710 5,454
Other non-current assets 2.7 2,161 996
31,787 32,203
Current assets
Financial assets
Investments 2.2 5,906 9,643
Trade receivables 2.5 12,151 10,960
Cash and cash equivalents 2.6 16,770 19,153
Loans 2.3 393 310
Other financial assets 2.4 5,906 5,403
Other current assets 2.7 1,439 2,213
42,565 47,682
Assets held for sale 2.22 1,525 -
44,090 47,682
75,877 79,885
Equity
Equity share capital 2.9 1,092 1,148
Other equity 62,410 66,869
Total equity 63,502 68,017
LIABILITIES
Non-current liabilities
Financial liabilities
Other financial liabilities 2.10 55 40
Deferred tax liabilities (net) 505 -
Other non-current liabilities 2.12 153 42
713 82
Current liabilities
Financial liabilities
Trade payables 2.11 738 269
Other financial liabilities 2.10 5,540 5,056
Other current liabilities 2.12 2,972 2,349
Provisions 2.13 436 350
Income tax liabilities (net) 1,976 3,762
11,662 11,786
Total equity and liabilities 75,877 79,885
The accompanying notes form an integral part of the interim condensed financial statements.
As per our report of even date attached
for Deloitte Haskins & Sells LLP for and on behalf of the Board of Directors of Infosys Limited
Chartered Accountants
Firm's Registration Number:
117366W/W-100018
P. R. Ramesh Nandan M. Nilekani Salil Parekh U. B. Pravin Rao
Partner Chairman Chief Executive officer Chief Operating Officer
Membership No. 70928 and Managing Director and Whole-time Director
Bengaluru D. Sundaram M. D. Ranganath A. G. S. Manikantha
April 13, 2018 Director Chief Financial Officer Company Secretary
Non-current assets
Condensed Balance Sheet as at
ASSETS
Total Assets
Total current liabilities
EQUITY AND LIABILITIES
Total non - current Assets
Total current assets
Total non - current liabilities

INFOSYS LIMITED
(In ` crore, except equity share and per equity share data)
Condensed Statement of Profit and Loss for the
2018 2017 2018 2017
Revenue from operations 2.15 15,984 14,920 61,941 59,289
Other income, net 2.16 636 733 4,019 3,062
Total income 16,620 15,653 65,960 62,351
Expenses
Employee benefit expenses 2.17 8,418 7,667 32,472 30,944
Cost of technical sub-contractors 1,434 1,263 5,494 4,809
Travel expenses 369 342 1,479 1,638
Cost of software packages and others 2.17 320 341 1,270 1,235
Communication expenses 75 104 330 372
Consultancy and professional charges 233 176 826 538
Depreciation and amortization expense 363 336 1,408 1,331
Other expenses 2.17 429 641 2,184 2,546
Impairment loss on assets held for sale 2.22 589 - 589 -
Total expenses 12,230 10,870 46,052 43,413
Profit before tax 4,390 4,783 19,908 18,938
Tax expense:
Current tax 2.14 1,397 1,141 4,003 5,068
Deferred tax 2.14 (164) 80 (250) 52
Profit for the period 3,157 3,562 16,155 13,818
Other comprehensive income
Items that will not be reclassified subsequently to profit or loss
Remeasurement of the net defined benefit liability/asset, net 31 16 52 (42)
Equity instruments through other comprehensive income, net 7 (5) 7 (5)
Items that will be reclassified subsequently to profit or loss
2 11 (39) 39
Fair value changes on investments, net 2.2 (12) (10) 1 (10)
Total other comprehensive income/ (loss), net of tax 28 12 21 (18)
Total comprehensive income for the period 3,185 3,574 16,176 13,800
Earnings per equity share
Equity shares of par value `5/- each
Basic (`) 14.45 15.51 71.28 60.16
Diluted (`) 14.45 15.51 71.25 60.15
Basic 2.18 2,18,40,80,668 2,29,69,44,664 2,26,63,43,802 2,29,69,44,664
Diluted 2.18 2,18,46,42,294 2,29,72,89,436 2,26,73,92,621 2,29,71,59,670
The accompanying notes form an integral part of the interim condensed financial statements.
As per our report of even date attached
for Deloitte Haskins & Sells LLP for and on behalf of the Board of Directors of Infosys Limited
Chartered Accountants
Firm's Registration Number:
117366W/W-100018
P. R. Ramesh Nandan M. Nilekani Salil Parekh U. B. Pravin Rao
Partner Chairman Chief Executive officer Chief Operating Officer
Membership No. 70928 and Managing Director and Whole-time Director
Bengaluru D. Sundaram M. D. Ranganath A. G. S. Manikantha
April 13, 2018 Director Chief Financial Officer Company Secretary
Year ended March 31,
Note No.
Fair value changes on derivatives designated as cash flow hedge,
net
Weighted average equity shares used in computing earnings per
equity share
Three months ended March 31,
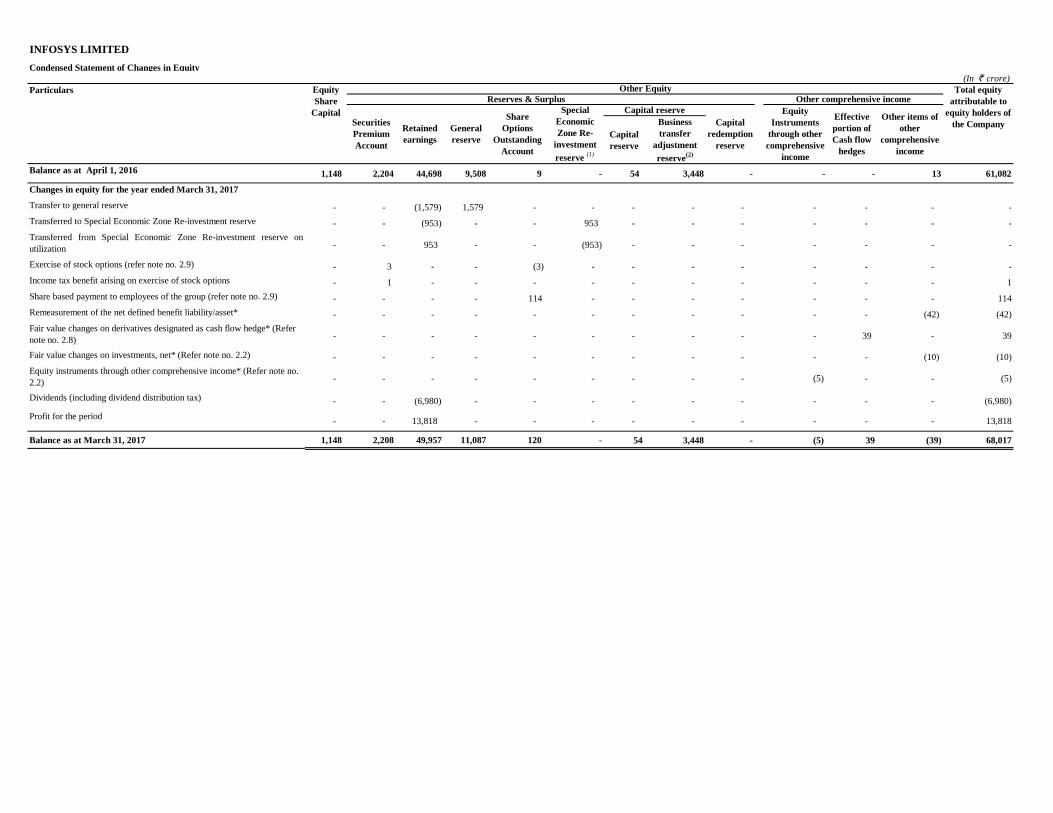
INFOSYS LIMITED
Condensed Statement of Changes in Equity
(In ` crore)
Capital
reserve
Business
transfer
adjustment
reserve(2)
Balance as at April 1, 2016 1,148 2,204 44,698 9,508 9 - 54 3,448 - - - 13 61,082
Changes in equity for the year ended March 31, 2017
Transfer to general reserve - - (1,579) 1,579 - - - - - - - - -
Transferred to Special Economic Zone Re-investment reserve - - (953) - - 953 - - - - - - -
Transferred from Special Economic Zone Re-investment reserve on
utilization - - 953 - - (953) - - - - - - -
Exercise of stock options (refer note no. 2.9) - 3 - - (3) - - - - - - - -
Income tax benefit arising on exercise of stock options - 1 - - - - - - - - - - 1
Share based payment to employees of the group (refer note no. 2.9) - - - - 114 - - - - - - - 114
Remeasurement of the net defined benefit liability/asset* - - - - - - - - - - - (42) (42)
Fair value changes on derivatives designated as cash flow hedge* (Refer
note no. 2.8) - - - - - - - - - - 39 - 39
Fair value changes on investments, net* (Refer note no. 2.2) - - - - - - - - - - - (10) (10)
Equity instruments through other comprehensive income* (Refer note no.
2.2) - - - - - - - - - (5) - - (5)
Dividends (including dividend distribution tax) - - (6,980) - - - - - - - - - (6,980)
Profit for the period - - 13,818 - - - - - - - - - 13,818
Balance as at March 31, 2017 1,148 2,208 49,957 11,087 120 - 54 3,448 - (5) 39 (39) 68,017
Reserves & Surplus
Other Equity
Other comprehensive income
Securities
Premium
Account
Retained
earnings
General
reserve
Special
Economic
Zone Re-
investment
reserve (1)
Capital reserve Equity
Instruments
through other
comprehensive
income
Effective
portion of
Cash flow
hedges
Particulars
Capital
redemption
reserve
Other items of
other
comprehensive
income
Total equity
attributable to
equity holders of
the Company
Equity
Share
Capital Share
Options
Outstanding
Account
INFOSYS LIMITED
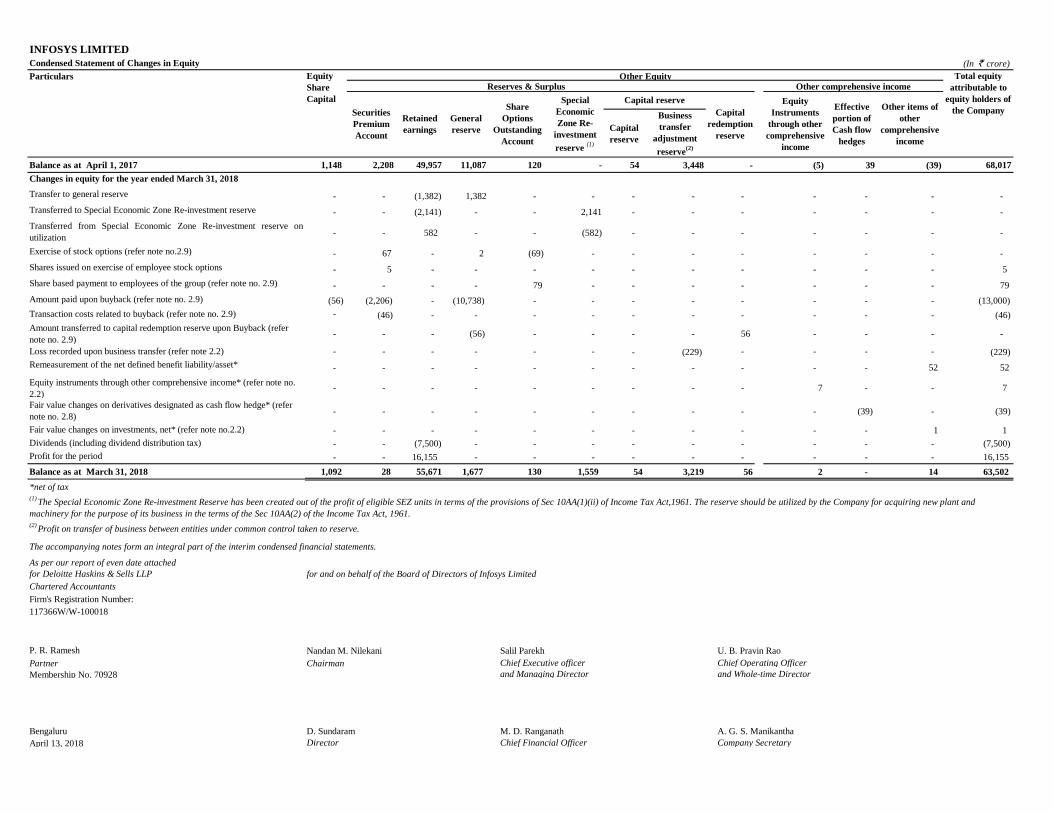
Condensed Statement of Changes in Equity (In ` crore)
Capital
reserve
Business
transfer
adjustment
reserve(2)
Balance as at April 1, 2017 1,148 2,208 49,957 11,087 120 - 54 3,448 - (5) 39 (39) 68,017
Changes in equity for the year ended March 31, 2018
Transfer to general reserve - - (1,382) 1,382 - - - - - - - - -
Transferred to Special Economic Zone Re-investment reserve - - (2,141) - - 2,141 - - - - - - -
Transferred from Special Economic Zone Re-investment reserve on
utilization - - 582 - - (582) - - - - - - -
Exercise of stock options (refer note no.2.9) - 67 - 2 (69) - - - - - - - -
Shares issued on exercise of employee stock options - 5 - - - - - - - - - - 5
Share based payment to employees of the group (refer note no. 2.9) - - - - 79 - - - - - - - 79
Amount paid upon buyback (refer note no. 2.9) (56) (2,206) - (10,738) - - - - - - - - (13,000)
Transaction costs related to buyback (refer note no. 2.9) - (46) - - - - - - - - - - (46)
Amount transferred to capital redemption reserve upon Buyback (refer
note no. 2.9) - - - (56) - - - - 56 - - - -
Loss recorded upon business transfer (refer note 2.2) - - - - - - - (229) - - - - (229)
Remeasurement of the net defined benefit liability/asset* - - - - - - - - - - - 52 52
Equity instruments through other comprehensive income* (refer note no.
2.2) - - - - - - - - - 7 - - 7
Fair value changes on derivatives designated as cash flow hedge* (refer
note no. 2.8) - - - - - - - - - - (39) - (39)
Fair value changes on investments, net* (refer note no.2.2) - - - - - - - - - - - 1 1
Dividends (including dividend distribution tax) - - (7,500) - - - - - - - - - (7,500)
Profit for the period - - 16,155 - - - - - - - - - 16,155
Balance as at March 31, 2018 1,092 28 55,671 1,677 130 1,559 54 3,219 56 2 - 14 63,502
*net of tax
The accompanying notes form an integral part of the interim condensed financial statements.
As per our report of even date attached
for Deloitte Haskins & Sells LLP for and on behalf of the Board of Directors of Infosys Limited
Chartered Accountants
Firm's Registration Number:
117366W/W-100018
P. R. Ramesh Nandan M. Nilekani Salil Parekh U. B. Pravin Rao
Partner Chairman Chief Executive officer Chief Operating Officer
Membership No. 70928 and Managing Director and Whole-time Director
Bengaluru D. Sundaram M. D. Ranganath A. G. S. Manikantha
April 13, 2018 Director Chief Financial Officer Company Secretary
(2)Profit on transfer of business between entities under common control taken to reserve.
Other EquityReserves & Surplus Other comprehensive income
Capital reserve
(1)The Special Economic Zone Re-investment Reserve has been created out of the profit of eligible SEZ units in terms of the provisions of Sec 10AA(1)(ii) of Income Tax Act,1961. The reserve should be utilized by the Company for acquiring new plant and
machinery for the purpose of its business in the terms of the Sec 10AA(2) of the Income Tax Act, 1961.
Particulars Equity
Share
Capital
Securities
Premium
Account
Retained
earnings
Capital
redemption
reserve
General
reserve
Share
Options
Outstanding
Account
Special
Economic
Zone Re-
investment
reserve (1)
Equity
Instruments
through other
comprehensive
income
Effective
portion of
Cash flow
hedges
Other items of
other
comprehensive
income
Total equity
attributable to
equity holders of
the Company

INFOSYS LIMITED
Condensed Statement of Cash Flows
(In ` crore)
Particulars
2018 2017
Profit for the period 16,155 13,818
Depreciation and amortization 1,408 1,331
Income tax expense 3,753 5,120
Allowance for credit losses on financial assets 18 135
(3,169) (2,553)
Other adjustments 40 48
Impairment loss on assets held for sale 589 -
3 39
Trade receivables and unbilled revenue (1,579) (1,825)
Loans and other financial assets and other assets (207) (427)
Trade payables 466 (354)
Other financial liabilities, other liabilities and provisions 1,052 179
18,529 15,511
Income taxes paid (6,054) (5,033)
Net cash generated by operating activities 12,475 10,478
(1,842) (2,292)
Deposits placed with corporations (106) (155)
Loans to employees 19 23
Loan given to subsidiaries (106) -
Repayment of debentures 349 420
Investment in subsidiaries (212) (369)
Proceeds on liquidation of Noah (Refer note 2.2) 316 -
Payment towards acquisition of business (Refer note 2.2) (295) -
Payment towards contingent consideration pertaining to acquisition (33) (36)
Payments to acquire financial assets
Preference and equity securities (13) (43)
Liquid mutual fund units and fixed maturity plan securities (57,250) (49,648)
Tax free bonds (1) (312)
Non-convertible debentures - (3,664)
Certificates of deposit (6,290) (7,555)
Commercial papers (291) -
Proceeds on sale of financial assets
Preference and equity securities 10 -
Liquid mutual fund units and fixed maturity plan securities 59,364 47,495
Tax free bonds - 2
Non-convertible debentures 100 -
Certificates of deposit 9,411 -
Dividend received from subsidiaries 846 -
Interest and dividend received 1,708 2,640
Net cash used in investing activities 5,684 (13,494)
Shares issued on exercise of employee stock options 5 -
Buyback including transaction cost (13,046) -
Payment of dividends (including dividend distribution tax) (7,495) (6,968)
(20,536) (6,968)
(6) (39)
Net decrease in cash and cash equivalents (2,377) (9,984)
Cash and cash equivalents at the beginning of the period 19,153 29,176
Cash and cash equivalents at the end of the period 16,770 19,153
Supplementary information:
Restricted cash balance 375 411
The accompanying notes form an integral part of the interim condensed financial statements.
As per our report of even date attached
for Deloitte Haskins & Sells LLP for and on behalf of the Board of Directors of Infosys Limited
Chartered Accountants
Firm's Registration Number:
117366W/W-100018
P. R. Ramesh Nandan M. Nilekani Salil Parekh U. B. Pravin Rao
Partner Chairman Chief Executive officer Chief Operating Officer
Membership No. 70928 and Managing Director and Whole-time Director
Bengaluru D. Sundaram M. D. Ranganath A. G. S. Manikantha
April 13, 2018 Director Chief Financial Officer Company Secretary
Year ended March 31,
Adjustments to reconcile net profit to net cash provided by operating activities:
Changes in assets and liabilities
Cash generated from operations
Exchange differences on translation of assets and liabilities
Cash flow from operating activities:
Interest and dividend income
Cash flow from investing activities:
Cash flow from financing activities:
Expenditure on property, plant and equipment net of sale proceeds
Net cash used in financing activities
Effect of exchange differences on translation of foreign currency cash and cash equivalents
Accounting Policy
Amendment to Ind AS 7
Cash flows are reported using the indirect method, whereby profit for the period is adjusted for the effects of transactions of a non-cash nature, any deferrals or accruals of past or
future operating cash receipts or payments and item of income or expenses associated with investing or financing cash flows. The cash flows from operating, investing and financing
activities of the Company are segregated. The company considers all highly liquid investments that are readily convertible to known amounts of cash to be cash equivalents.
Effective April 1, 2017, the Company adopted the amendment to Ind AS 7, which require the entities to provide disclosures that enable users of financial statements to evaluate
changes in liabilities arising from financing activities, including both changes arising from cash flows and non-cash changes, suggesting inclusion of a reconciliation between the
opening and closing balances in the Balance Sheet for liabilities arising from financing activities, to meet the disclosure requirement. The adoption of amendment did not have any
material impact on the financial statements.
d. Non-current assets held for sale
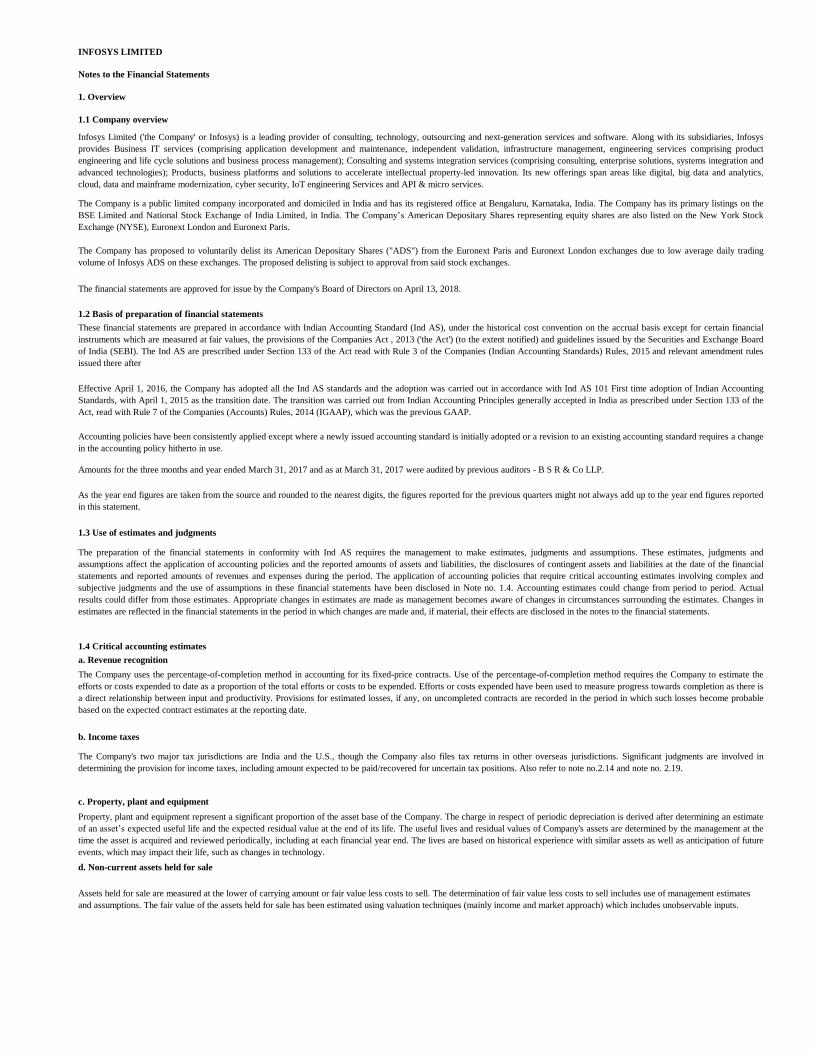
These financial statements are prepared in accordance with Indian Accounting Standard (Ind AS), under the historical cost convention on the accrual basis except for certain financial
instruments which are measured at fair values, the provisions of the Companies Act , 2013 ('the Act') (to the extent notified) and guidelines issued by the Securities and Exchange Board
of India (SEBI). The Ind AS are prescribed under Section 133 of the Act read with Rule 3 of the Companies (Indian Accounting Standards) Rules, 2015 and relevant amendment rules
issued there after
INFOSYS LIMITED
Notes to the Financial Statements
1. Overview
1.1 Company overview
Infosys Limited ('the Company' or Infosys) is a leading provider of consulting, technology, outsourcing and next-generation services and software. Along with its subsidiaries, Infosys
provides Business IT services (comprising application development and maintenance, independent validation, infrastructure management, engineering services comprising product
engineering and life cycle solutions and business process management); Consulting and systems integration services (comprising consulting, enterprise solutions, systems integration and
advanced technologies); Products, business platforms and solutions to accelerate intellectual property-led innovation. Its new offerings span areas like digital, big data and analytics,
cloud, data and mainframe modernization, cyber security, IoT engineering Services and API & micro services.
The Company is a public limited company incorporated and domiciled in India and has its registered office at Bengaluru, Karnataka, India. The Company has its primary listings on the
BSE Limited and National Stock Exchange of India Limited, in India. The Company’s American Depositary Shares representing equity shares are also listed on the New York Stock
Exchange (NYSE), Euronext London and Euronext Paris.
The Company has proposed to voluntarily delist its American Depositary Shares ("ADS") from the Euronext Paris and Euronext London exchanges due to low average daily trading
volume of Infosys ADS on these exchanges. The proposed delisting is subject to approval from said stock exchanges.
The financial statements are approved for issue by the Company's Board of Directors on April 13, 2018.
1.2 Basis of preparation of financial statements
Effective April 1, 2016, the Company has adopted all the Ind AS standards and the adoption was carried out in accordance with Ind AS 101 First time adoption of Indian Accounting
Standards, with April 1, 2015 as the transition date. The transition was carried out from Indian Accounting Principles generally accepted in India as prescribed under Section 133 of the
Act, read with Rule 7 of the Companies (Accounts) Rules, 2014 (IGAAP), which was the previous GAAP.
Amounts for the three months and year ended March 31, 2017 and as at March 31, 2017 were audited by previous auditors - B S R & Co LLP.
Accounting policies have been consistently applied except where a newly issued accounting standard is initially adopted or a revision to an existing accounting standard requires a change
in the accounting policy hitherto in use.
As the year end figures are taken from the source and rounded to the nearest digits, the figures reported for the previous quarters might not always add up to the year end figures reported
in this statement.
1.3 Use of estimates and judgments
The preparation of the financial statements in conformity with Ind AS requires the management to make estimates, judgments and assumptions. These estimates, judgments and
assumptions affect the application of accounting policies and the reported amounts of assets and liabilities, the disclosures of contingent assets and liabilities at the date of the financial
statements and reported amounts of revenues and expenses during the period. The application of accounting policies that require critical accounting estimates involving complex and
subjective judgments and the use of assumptions in these financial statements have been disclosed in Note no. 1.4. Accounting estimates could change from period to period. Actual
results could differ from those estimates. Appropriate changes in estimates are made as management becomes aware of changes in circumstances surrounding the estimates. Changes in
estimates are reflected in the financial statements in the period in which changes are made and, if material, their effects are disclosed in the notes to the financial statements.
1.4 Critical accounting estimates
a. Revenue recognition
The Company uses the percentage-of-completion method in accounting for its fixed-price contracts. Use of the percentage-of-completion method requires the Company to estimate the
efforts or costs expended to date as a proportion of the total efforts or costs to be expended. Efforts or costs expended have been used to measure progress towards completion as there is
a direct relationship between input and productivity. Provisions for estimated losses, if any, on uncompleted contracts are recorded in the period in which such losses become probable
based on the expected contract estimates at the reporting date.
b. Income taxes
The Company's two major tax jurisdictions are India and the U.S., though the Company also files tax returns in other overseas jurisdictions. Significant judgments are involved in
determining the provision for income taxes, including amount expected to be paid/recovered for uncertain tax positions. Also refer to note no.2.14 and note no. 2.19.
c. Property, plant and equipment
Property, plant and equipment represent a significant proportion of the asset base of the Company. The charge in respect of periodic depreciation is derived after determining an estimate
of an asset’s expected useful life and the expected residual value at the end of its life. The useful lives and residual values of Company's assets are determined by the management at the
time the asset is acquired and reviewed periodically, including at each financial year end. The lives are based on historical experience with similar assets as well as anticipation of future
events, which may impact their life, such as changes in technology.
Assets held for sale are measured at the lower of carrying amount or fair value less costs to sell. The determination of fair value less costs to sell includes use of management estimates
and assumptions. The fair value of the assets held for sale has been estimated using valuation techniques (mainly income and market approach) which includes unobservable inputs.
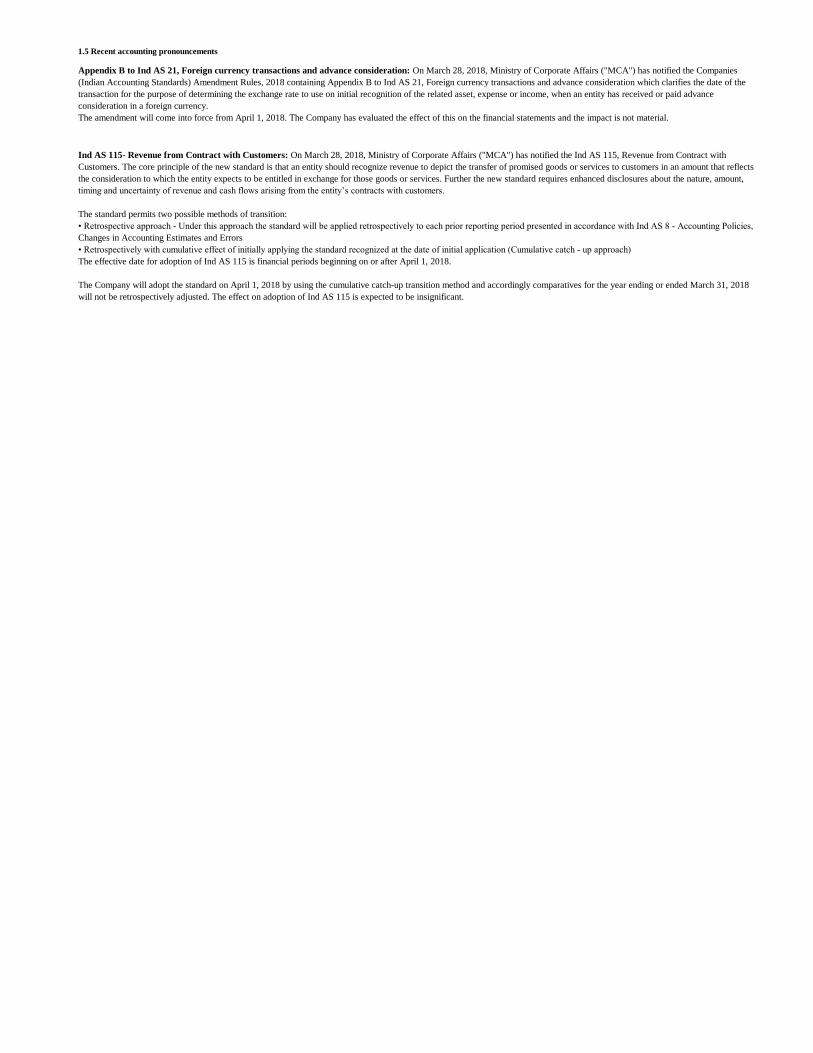
1.5 Recent accounting pronouncements
Appendix B to Ind AS 21, Foreign currency transactions and advance consideration: On March 28, 2018, Ministry of Corporate Affairs ("MCA") has notified the Companies
(Indian Accounting Standards) Amendment Rules, 2018 containing Appendix B to Ind AS 21, Foreign currency transactions and advance consideration which clarifies the date of the
transaction for the purpose of determining the exchange rate to use on initial recognition of the related asset, expense or income, when an entity has received or paid advance
consideration in a foreign currency.
The amendment will come into force from April 1, 2018. The Company has evaluated the effect of this on the financial statements and the impact is not material.
Ind AS 115- Revenue from Contract with Customers: On March 28, 2018, Ministry of Corporate Affairs ("MCA") has notified the Ind AS 115, Revenue from Contract with
Customers. The core principle of the new standard is that an entity should recognize revenue to depict the transfer of promised goods or services to customers in an amount that reflects
the consideration to which the entity expects to be entitled in exchange for those goods or services. Further the new standard requires enhanced disclosures about the nature, amount,
timing and uncertainty of revenue and cash flows arising from the entity’s contracts with customers.
The standard permits two possible methods of transition:
• Retrospective approach - Under this approach the standard will be applied retrospectively to each prior reporting period presented in accordance with Ind AS 8 - Accounting Policies,
Changes in Accounting Estimates and Errors
• Retrospectively with cumulative effect of initially applying the standard recognized at the date of initial application (Cumulative catch - up approach)
The effective date for adoption of Ind AS 115 is financial periods beginning on or after April 1, 2018.
The Company will adopt the standard on April 1, 2018 by using the cumulative catch-up transition method and accordingly comparatives for the year ending or ended March 31, 2018
will not be retrospectively adjusted. The effect on adoption of Ind AS 115 is expected to be insignificant.

2.1 PROPERTY, PLANT AND EQUIPMENT
Building(1) 22-25 years
Plant and machinery(1) 5 years
Office equipment 5 years
Computer equipment(1) 3-5 years
Furniture and fixtures(1) 5 years
Vehicles(1) 5 years
Leasehold improvements Over lease term
Following are the changes in the carrying value of property, plant and equipment for the three months ended March 31, 2018: (In ` crore)
ParticularsLand-
Freehold
Land-
LeaseholdBuildings(1)(2)
Plant and
machinery(2)
Office
Equipment(2)
Computer
equipment(2)
Furniture
and
fixtures(2)
Leasehold
ImprovementsVehicles Total
Gross carrying value as at January 1, 2018 1,135 659 6,856 2,116 818 4,133 1,208 215 27 17,167
Additions 92 2 416 95 24 108 40 20 2 799
Deletions - - (1) (2) (1) (12) (1) - - (17)
Gross carrying value as at March 31, 2018 1,227 661 7,271 2,209 841 4,229 1,247 235 29 17,949
Accumulated depreciation as at January 1, 2018 - (29) (2,558) (1,460) (555) (3,005) (860) (97) (17) (8,581)
Depreciation - (1) (63) (67) (28) (150) (37) (10) - (356)
Accumulated depreciation on deletions - - - 1 1 12 1 - - 15
Accumulated depreciation as at March 31, 2018 - (30) (2,621) (1,526) (582) (3,143) (896) (107) (17) (8,922)
Carrying value as at March 31, 2018 1,227 631 4,650 683 259 1,086 351 128 12 9,027
Carrying value as at January 1, 2018 1,135 630 4,298 656 263 1,128 348 118 10 8,586
The changes in the carrying value of property, plant and equipment for the three months ended March 31, 2017 are as follows: (In ` crore)
ParticularsLand-
Freehold
Land-
LeaseholdBuildings(1)(2)
Plant and
machinery(2)
Office
Equipment(2)
Computer
equipment(2)
Furniture
and
fixtures(2)
Leasehold
ImprovementsVehicles Total
Gross carrying value as at January 1, 2017 1,011 659 6,335 1,902 750 3,788 1,105 166 23 15,739
Additions 82 - 148 67 20 117 29 34 1 498
Deletions - - - (3) (1) (19) (2) (2) - (27)
Gross carrying value as at March 31, 2017 1,093 659 6,483 1,966 769 3,886 1,132 198 24 16,210
Accumulated depreciation as at January 1, 2017 - (25) (2,321) (1,213) (445) (2,483) (722) (75) (12) (7,296)
Depreciation - (1) (56) (64) (28) (139) (37) (9) (2) (336)
Accumulated depreciation on deletions - - - 3 1 19 2 2 - 27
Accumulated depreciation as at March 31, 2017 - (26) (2,377) (1,274) (472) (2,603) (757) (82) (14) (7,605)
Carrying value as at March 31, 2017 1,093 633 4,106 692 297 1,283 375 116 10 8,605
Carrying value as at January 1, 2017 1,011 634 4,014 689 305 1,305 383 91 11 8,443
Accounting Policy
Impairment
Property, plant and equipment are evaluated for recoverability whenever events or changes in circumstances indicate that their carrying amounts may not be recoverable. For the purpose of
impairment testing, the recoverable amount (i.e. the higher of the fair value less cost to sell and the value-in-use) is determined on an individual asset basis unless the asset does not generate
cash flows that are largely independent of those from other assets. In such cases, the recoverable amount is determined for the CGU (Cash Generating Unit) to which the asset belongs.
If such assets are considered to be impaired, the impairment to be recognized in the Statement of Profit and Loss is measured by the amount by which the carrying value of the assets
exceeds the estimated recoverable amount of the asset. An impairment loss is reversed in the statement of profit and loss if there has been a change in the estimates used to determine the
recoverable amount. The carrying amount of the asset is increased to its revised recoverable amount, provided that this amount does not exceed the carrying amount that would have been
determined (net of any accumulated depreciation) had no impairment loss been recognized for the asset in prior years.
Property, plant and equipment are stated at cost, less accumulated depreciation and impairment, if any. Costs directly attributable to acquisition are capitalized until the property, plant and
equipment are ready for use, as intended by the management. The Company depreciates property, plant and equipment over their estimated useful lives using the straight-line method. The
estimated useful lives of assets are as follows:
(1)Based on technical evaluation, the management believes that the useful lives as given above best represent the period over which management expects to use these assets. Hence, the
useful lives for these assets is different from the useful lives as prescribed under Part C of Schedule II of the Companies Act 2013.
Depreciation methods, useful lives and residual values are reviewed periodically, including at each financial year end.
Advances paid towards the acquisition of property, plant and equipment outstanding at each Balance Sheet date is classified as capital advances under other non-current assets and the cost
of assets not ready to use before such date are disclosed under ‘Capital work-in-progress’. Subsequent expenditures relating to property, plant and equipment is capitalized only when it is
probable that future economic benefits associated with these will flow to the Company and the cost of the item can be measured reliably. Repairs and maintenance costs are recognized in
the Statement of Profit and Loss when incurred. The cost and related accumulated depreciation are eliminated from the financial statements upon sale or retirement of the asset and the
resultant gains or losses are recognized in the Statement of Profit and Loss.
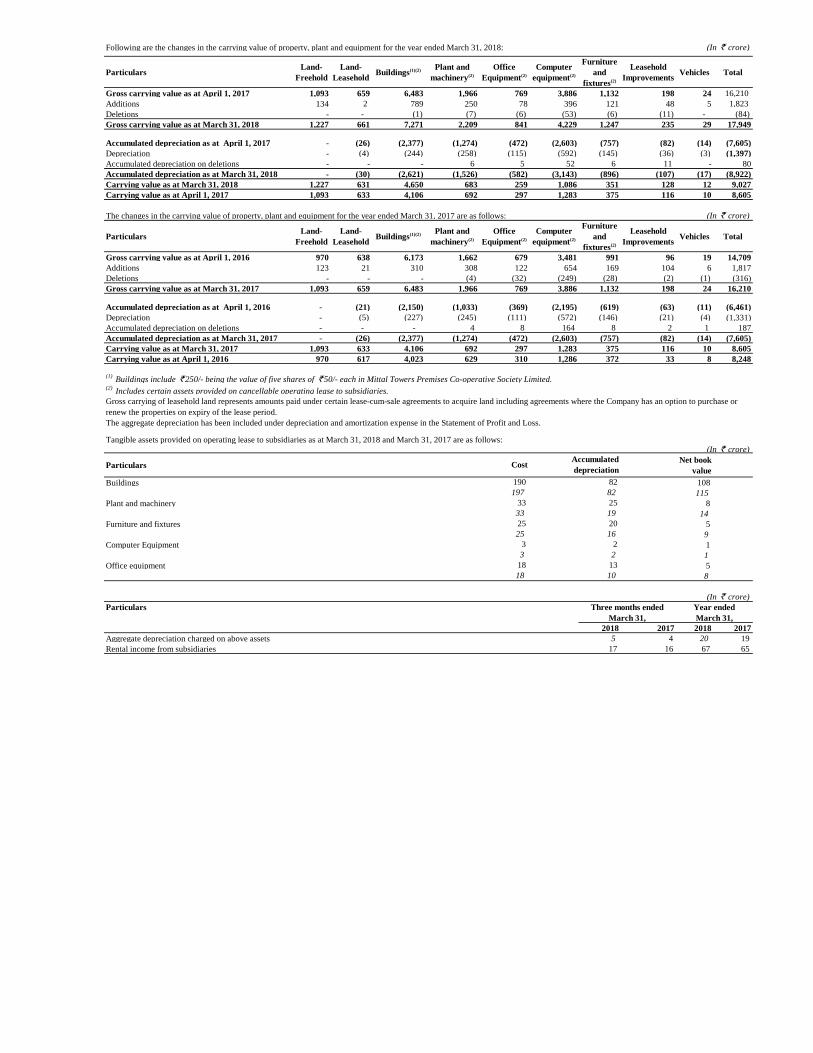
Following are the changes in the carrying value of property, plant and equipment for the year ended March 31, 2018: (In ` crore)
ParticularsLand-
Freehold
Land-
LeaseholdBuildings(1)(2)
Plant and
machinery(2)
Office
Equipment(2)
Computer
equipment(2)
Furniture
and
fixtures(2)
Leasehold
ImprovementsVehicles Total
Gross carrying value as at April 1, 2017 1,093 659 6,483 1,966 769 3,886 1,132 198 24 16,210
Additions 134 2 789 250 78 396 121 48 5 1,823
Deletions - - (1) (7) (6) (53) (6) (11) - (84)
Gross carrying value as at March 31, 2018 1,227 661 7,271 2,209 841 4,229 1,247 235 29 17,949
Accumulated depreciation as at April 1, 2017 - (26) (2,377) (1,274) (472) (2,603) (757) (82) (14) (7,605)
Depreciation - (4) (244) (258) (115) (592) (145) (36) (3) (1,397)
Accumulated depreciation on deletions - - - 6 5 52 6 11 - 80
Accumulated depreciation as at March 31, 2018 - (30) (2,621) (1,526) (582) (3,143) (896) (107) (17) (8,922)
Carrying value as at March 31, 2018 1,227 631 4,650 683 259 1,086 351 128 12 9,027
Carrying value as at April 1, 2017 1,093 633 4,106 692 297 1,283 375 116 10 8,605
The changes in the carrying value of property, plant and equipment for the year ended March 31, 2017 are as follows: (In ` crore)
ParticularsLand-
Freehold
Land-
LeaseholdBuildings(1)(2)
Plant and
machinery(2)
Office
Equipment(2)
Computer
equipment(2)
Furniture
and
fixtures(2)
Leasehold
ImprovementsVehicles Total
Gross carrying value as at April 1, 2016 970 638 6,173 1,662 679 3,481 991 96 19 14,709
Additions 123 21 310 308 122 654 169 104 6 1,817
Deletions - - - (4) (32) (249) (28) (2) (1) (316)
Gross carrying value as at March 31, 2017 1,093 659 6,483 1,966 769 3,886 1,132 198 24 16,210
Accumulated depreciation as at April 1, 2016 - (21) (2,150) (1,033) (369) (2,195) (619) (63) (11) (6,461)
Depreciation - (5) (227) (245) (111) (572) (146) (21) (4) (1,331)
Accumulated depreciation on deletions - - - 4 8 164 8 2 1 187
Accumulated depreciation as at March 31, 2017 - (26) (2,377) (1,274) (472) (2,603) (757) (82) (14) (7,605)
Carrying value as at March 31, 2017 1,093 633 4,106 692 297 1,283 375 116 10 8,605
Carrying value as at April 1, 2016 970 617 4,023 629 310 1,286 372 33 8 8,248
(1) Buildings include ` 250/- being the value of five shares of ` 50/- each in Mittal Towers Premises Co-operative Society Limited.
(2) Includes certain assets provided on cancellable operating lease to subsidiaries.
(In ` crore)
ParticularsNet book
value
Buildings 108
115
Plant and machinery 8
14
Furniture and fixtures 5
9
Computer Equipment 1
1
Office equipment 5
8
(In ` crore)
Particulars
2018 2017 2018 2017
Aggregate depreciation charged on above assets 5 4 20 19
Rental income from subsidiaries 17 16 67 65
The aggregate depreciation has been included under depreciation and amortization expense in the Statement of Profit and Loss.
Gross carrying of leasehold land represents amounts paid under certain lease-cum-sale agreements to acquire land including agreements where the Company has an option to purchase or
renew the properties on expiry of the lease period.
Tangible assets provided on operating lease to subsidiaries as at March 31, 2018 and March 31, 2017 are as follows:
Accumulated
depreciationCost
82
82
25
19
20
16
2
Year ended
March 31,
Three months ended
March 31,
2
13
10
190
197
33
33
25
25
3
3
18
18

2.2 INVESTMENTS
(In ` crore)
Particulars
March 31, 2018 March 31, 2017
Non-current investments
Equity instruments of subsidiaries 5,013 7,305
Debentures of subsidiary 1,780 2,129
Preference securities and equity instruments 117 132
Others 7 3
Tax free bonds 1,831 1,833
Fixed maturity plans securities 376 357
Non-convertible debentures 2,869 3,575
11,993 15,334
Current investments
Liquid mutual fund units - 1,755
Fixed maturity plans securities - 151
Certificates of deposit 4,901 7,635
Government bonds 1 -
Non-convertible debentures 711 102
Commercial Paper 293 -
5,906 9,643
Total carrying value 17,899 24,977
(In ` crore, except as otherwise stated)
Particulars
March 31, 2018 March 31, 2017
Non-current investments
Unquoted
Investment carried at cost
Investments in equity instruments of subsidiaries
Infosys BPM Limited (formerly Infosys BPO Limited) 659 659
3,38,22,319 (3,38,22,319) equity shares of `10/- each, fully paid
Infosys Technologies (China) Co. Limited 333 236
Infosys Technologies (Australia) Pty Limited (1) 38 66
1,01,08,869 (1,01,08,869) equity shares of AUD 0.11 par value, fully paid
Infosys Technologies, S. de R.L. de C.V., Mexico 65 65
17,49,99,990 (17,49,99,990) equity shares of MXN 1 par value, fully paid up
Infosys Technologies (Sweden) AB 76 76
1,000 (1,000) equity shares of SEK 100 par value, fully paid
Infosys Technologia do Brazil Ltda 149 149
5,91,24,348 (5,91,24,348) shares of BRL 1.00 par value, fully paid
Infosys Technologies (Shanghai) Company Limited 900 826
Infosys Public Services, Inc. 99 99
3,50,00,000 (3,50,00,000) shares of USD 0.50 par value, fully paid
Infosys Consulting Holding AG (formerly Lodestone Holding AG) 1,323 1,323
23,350 (23,350) - Class A shares of CHF 1,000 each and 29,400
(29,400) - Class B Shares of CHF 100 each, fully paid up
Infosys Americas Inc. 1 1
10,000 (10,000) shares of USD 10 per share, fully paid up
EdgeVerve Systems Limited 1,312 1,312
1,31,18,40,000 (1,31,18,40,000) equity shares of `10/- each, fully paid
Infosys Nova Holdings LLC * (1) - 94
Noah Consulting LLC (refer note 2.2.1) - 313
Infosys Consulting Pte Ltd (formerly Lodestone Management Consultants 10 10
Pte Ltd) 1,09,90,000 (1,09,90,000) shares of SGD 1.00 par value, fully paid
Brilliant Basics Holding Limited (refer note 2.2.2) 46 -
1,170 (Nil) shares of GBP 0.005 each, fully paid up
Infosys Arabia Limited 2
70 (Nil) shares
Kallidus Inc. (refer note no. 2.22) - 619
(10,21,35,416) shares
Skava Systems Private Limited (refer note no. 2.22) - 59
(25,000) shares of `10/- per share, fully paid up
Panaya Inc. ( refer note no. 2.22)** - 1,398
(2) shares of USD 0.01 per share, fully paid up
5,013 7,305
Investment carried at amortized cost
Investment in debentures of subsidiary
EdgeVerve Systems Limited
1,780 2,129
1,780 2,129
Investments carried at fair value through profit or loss
Others 7 3
7 3
Investment carried at fair value through other comprehensive income (FVOCI)
Preference securities 116 131
Equity instruments 1 1
117 132
As at
As at
17,80,00,000 (21,29,00,000) Unsecured redeemable, non-convertible debentures of ` 100/- each fully paid up

(In ` crore, except as otherwise stated)
Particulars
March 31, 2018 March 31, 2017
Quoted
Investments carried at amortized cost
Tax free bonds 1,831 1,833
1,831 1,833
Investments carried at fair value through profit or loss
Fixed maturity plans securities 376 357
376 357
Investments carried at fair value through other comprehensive income
Non-convertible debentures 2,869 3,575
2,869 3,575
Total non-current investments 11,993 15,334
Current investments
Unquoted
Investments carried at fair value through profit or loss
Liquid mutual fund units - 1,755
- 1,755
Investments carried at fair value through other comprehensive income
Commercial Papers 293 -
Certificates of Deposit 4,901 7,635
5,194 7,635
Quoted
Investments carried at amortized cost
Government bonds 1 -
1 -
Investments carried at fair value through profit or loss
Fixed maturity plans securities - 151
- 151
Investments carried at fair value through other comprehensive income
Non-convertible debentures 711 102
711 102
Total current investments 5,906 9,643
Total investments 17,899 24,977
5,788 6,018
6,045 6,327
Aggregate amount of unquoted investments 12,111 18,959 (1)
Aggregate amount of impairment in value of investments 122 -
Aggregate amount of impairment in value of investments held for sale (refer note no 2.22) 589 -
Investments carried at cost 5,013 7,305
Investments carried at amortized cost 3,612 3,962
Investments carried at fair value through other comprehensive income 8,891 11,444
Investments carried at fair value through profit or loss 383 2,266
** During the year ended March 31, 2018, there was an additional capital infusion of ` 38 crore in Panaya Inc.
Refer to note 2.9 for accounting policies on financial instruments.
Aggregate amount of quoted investments
* During the three months ended June 30, 2017, Infosys Nova Holding LLC has written down the entire carrying value of its investment in its associate DWA Nova LLC.
Consequently, the Company has written down the entire carrying value of the investment in its subsidiary Infosys Nova Holdings LLC, amounting to ` 94 crore.
As at
Market value of quoted investments (including interest accrued)

Details of amounts recorded in Other comprehensive income:
Gross Tax Net Gross Tax Net
Net Gain/(loss) on
Non-convertible debentures (22) 3 (19) (7) - (7)
Certificate of deposits 11 (4) 7 (5) 2 (3)
Unquoted equity and preference securities 4 3 7 (2) (3) (5)
Gross Tax Net Gross Tax Net
Net Gain/(loss) on
Non-convertible debentures (11) 2 (9) (7) - (7)
Certificate of deposits 15 (5) 10 (5) 2 (3)
Unquoted equity and preference securities 4 3 7 (2) (3) (5)
Method of fair valuation:
Class of investment Method
2018 2017
Mutual funds - 1,755
Fixed Maturity plan securities 376 508
Tax free bonds and government bonds 2,079 2,142
Non-convertible debentures 3,580 3,677
Certificate of deposits 4,901 7,635
Commercial papers Market observable inputs 293 -
Unquoted equity and preference securities 117 132
Others 7 3
Certain quoted investments are classified as Level 2 in the absence of active market for such investments.
Particulars (In ` crore)
Goodwill 29
Trade name 16
Customer contracts 80
Other intangibles 16
Deferred tax assets 13
Net assets / (liabilities), others (117)
Total 37
Less: Consideration paid 266
Business transfer reserve (229)
Proposed investment
On April 13, 2018, the Company entered into a definitive agreement to acquire WongDoody Holding Company Inc, a US-based creative and consumer insights agency for a
total consideration of up to US $75 million (approximately `489 crore) including contingent consideration and retention payouts, subject to regulatory approvals and fulfillment
of closing conditions.
On July 14, 2017, the Board of Directors of Infosys authorized the Company to execute a Business Transfer Agreement and related documents with Noah Consulting LLC, a
wholly owned subsidiary, to transfer the business of Noah Consulting LLC to Infosys Limited, subject to securing the requisite regulatory approvals for a consideration based on
an independent valuation. Subsequently on October 17, 2017 , the company entered into a business transfer agreement to transfer the business for a consideration of $41 million
(`266 crore) and the transfer was with effect from October 25, 2017.
The transaction was between a holding company and a wholly owned subsidiary, the resultant impact on account of business transfer was recorded in 'Business Transfer
Adjustment Reserve' during the year ended March 31, 2018. The table below details out the assets and liabilities taken over upon business transfer:
Year ended
March 31, 2018 March 31, 2017
Fair value as at March 31,
Three months ended
March 31, 2018 March 31, 2017
2.2.2 Brilliant Basics Holdings Limited.
On September 8, 2017, Infosys acquired 100% of the voting interests in Brilliant Basics Holdings Limited., UK, (Brilliant Basics) a product design and customer experience
innovator with experience in executing global programs. The business acquisition was conducted by entering into a share purchase agreement for cash consideration of `29
crore, contingent consideration of up to `20 crore and an additional consideration of upto `13 crore, referred to as retention bonus, payable to the employees of Brilliant Basics
at each anniversary year over the next two years, subject to their continuous employment with the group at each anniversary. The fair value of contingent consideration on the
date of acquisition is `17 crore.
2.2.1 Business transfer- Noah
Subsequently, in November 2017, Noah Consulting LLC has been liquidated and the Company received `316 crore as proceeds on liquidation.
Discounted cash flows method, Market
multiples method, Option pricing model, etc.
Discounted cash flows method, Market
multiples method, Option pricing model, etc.
Quoted price
Market observable inputs
Quoted price and market observable inputs
Quoted price and market observable inputs
Market observable inputs
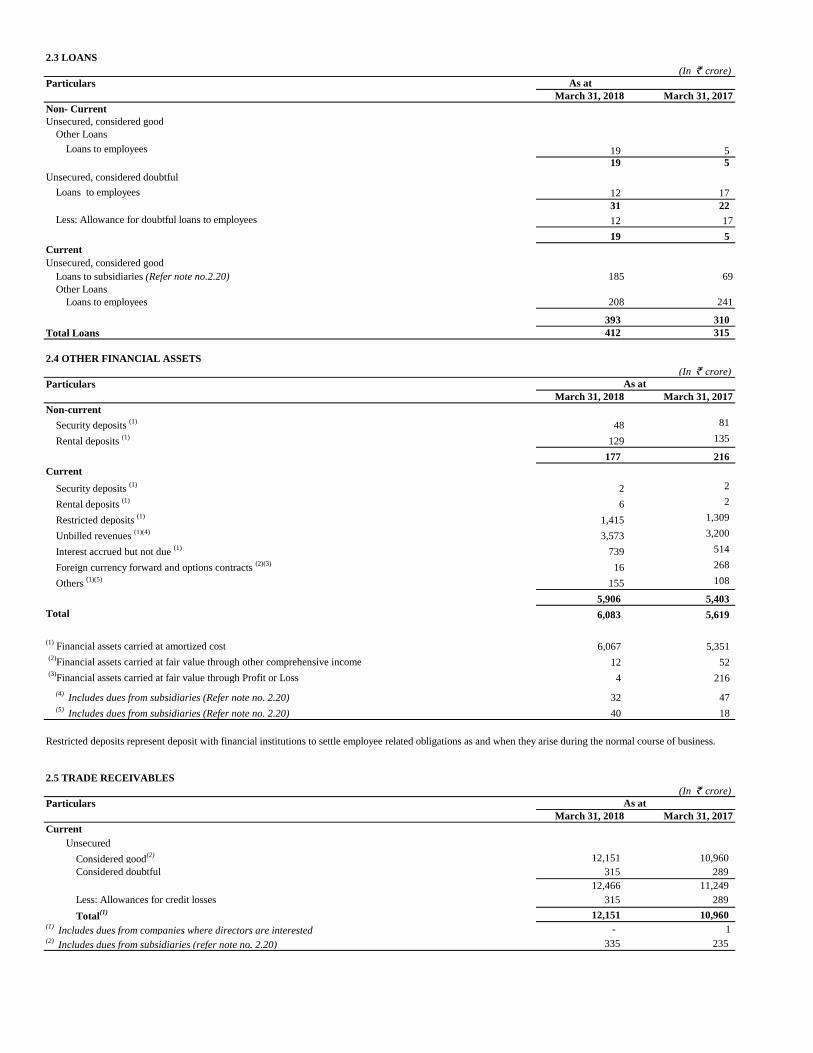
2.3 LOANS
(In ` crore)
Particulars As at
March 31, 2018 March 31, 2017
Non- Current
Unsecured, considered good
Other Loans
Loans to employees 19 5
19 5
Unsecured, considered doubtful
Loans to employees 12 17
31 22
Less: Allowance for doubtful loans to employees 12 17
19 5
Current
Unsecured, considered good
Loans to subsidiaries (Refer note no.2.20) 185 69
Other Loans
Loans to employees 208 241
393 310
Total Loans 412 315
2.4 OTHER FINANCIAL ASSETS
(In ` crore)
Particulars
March 31, 2018 March 31, 2017
Non-current
Security deposits (1)
48 81
Rental deposits (1)
129 135
177 216
Current
Security deposits (1)
2 2
Rental deposits (1)
6 2
Restricted deposits (1)
1,415 1,309
Unbilled revenues (1)(4)
3,573 3,200
Interest accrued but not due (1)
739 514
Foreign currency forward and options contracts (2)(3)
16 268
Others (1)(5)
155 108
5,906 5,403
Total 6,083 5,619
(1) Financial assets carried at amortized cost 6,067 5,351
(2)
Financial assets carried at fair value through other comprehensive income 12 52
(3)
Financial assets carried at fair value through Profit or Loss 4 216
(4) Includes dues from subsidiaries (Refer note no. 2.20) 32 47
(5) Includes dues from subsidiaries (Refer note no. 2.20) 40 18
2.5 TRADE RECEIVABLES
(In ` crore)
Particulars
March 31, 2018 March 31, 2017
Current
Unsecured
Considered good(2) 12,151 10,960
Considered doubtful 315 289
12,466 11,249
Less: Allowances for credit losses 315 289
Total(1) 12,151 10,960
(1) Includes dues from companies where directors are interested - 1
(2) Includes dues from subsidiaries (refer note no. 2.20) 335 235
As at
As at
Restricted deposits represent deposit with financial institutions to settle employee related obligations as and when they arise during the normal course of business.

2.6 CASH AND CASH EQUIVALENTS
(In ` crore)
Particulars
March 31, 2018 March 31, 2017
Balances with banks
In current and deposit accounts 10,789 12,222
Cash on hand - -
Others
Deposits with financial institution 5,981 6,931
16,770 19,153
Balances with banks in unpaid dividend accounts 22 17
Deposit with more than 12 months maturity 6,187 6,765
Balances with banks held as margin money deposits against guarantees 353 394
(In ` crore)
Particulars
March 31, 2018 March 31, 2017
In current accounts
ANZ Bank, Taiwan 9 3
Bank of America, USA 814 769
Bank of Baroda, Mauritius 1 -
BNP Paribas Bank, Norway 88 7
Citibank N.A., Australia 184 8
Citibank N.A., Dubai 5 1
Citibank N.A., EEFC (U.S. Dollar account) 4 1
Citibank N.A., Hungary 6 3
Citibank N.A., India 3 2
Citibank N.A., Japan 18 12
Citibank N.A., New Zealand 8 6
Citibank N.A., South Africa 33 9
Citibank N.A., South Korea 2 1
Deutsche Bank, Belgium 27 10
Deutsche Bank, EEFC (Australian Dollar account) 2 38
Deutsche Bank, EEFC (Euro account) 14 11
Deutsche Bank, EEFC (Swiss Franc account) 2 2
Deutsche Bank, EEFC (U.S. Dollar account) 27 73
Deutsche Bank, EEFC (United Kingdom Pound Sterling account) 8 8
Deutsche Bank, France 19 8
Deutsche Bank, Germany 70 48
Deutsche Bank, India 40 9
Deutsche Bank, Malaysia 5 7
Deutsche Bank, Netherlands 8 2
Deutsche Bank, Philippines 14 4
Deutsche Bank, Russia 3 3
Deutsche Bank, Russia (U.S. Dollar account) 5 1
Deutsche Bank, Singapore 17 6
Deutsche Bank, Spain 1 -
Deutsche Bank, Switzerland 18 5
Deutsche Bank, Switzerland (U.S. Dollar Account) - 1
Deutsche Bank, United Kingdom 74 25
HSBC Bank, Hong Kong 2 1
ICICI Bank, EEFC (U.S. Dollar account) 5 3
ICICI Bank, India 33 40
Nordbanken, Sweden 26 22
Punjab National Bank, India 12 6
Royal Bank of Canada, Canada 9 5
Splitska Banka D.D., Société Générale Group, Croatia 8 -
State Bank of India - 6
1,624 1,166
As at
Cash and cash equivalents as at March 31, 2018 and March 31, 2017 include restricted cash and bank balances of `375 crore and `411 crore, respectively. The
restrictions are primarily on account of bank balances held as margin money deposits against guarantees and balances held in unpaid dividend bank accounts.
The deposits maintained by the Company with banks and financial institution comprise of time deposits, which can be withdrawn by the Company at any point
without prior notice or penalty on the principal.
As at
The details of balances as on balance sheet dates with banks are as follows:
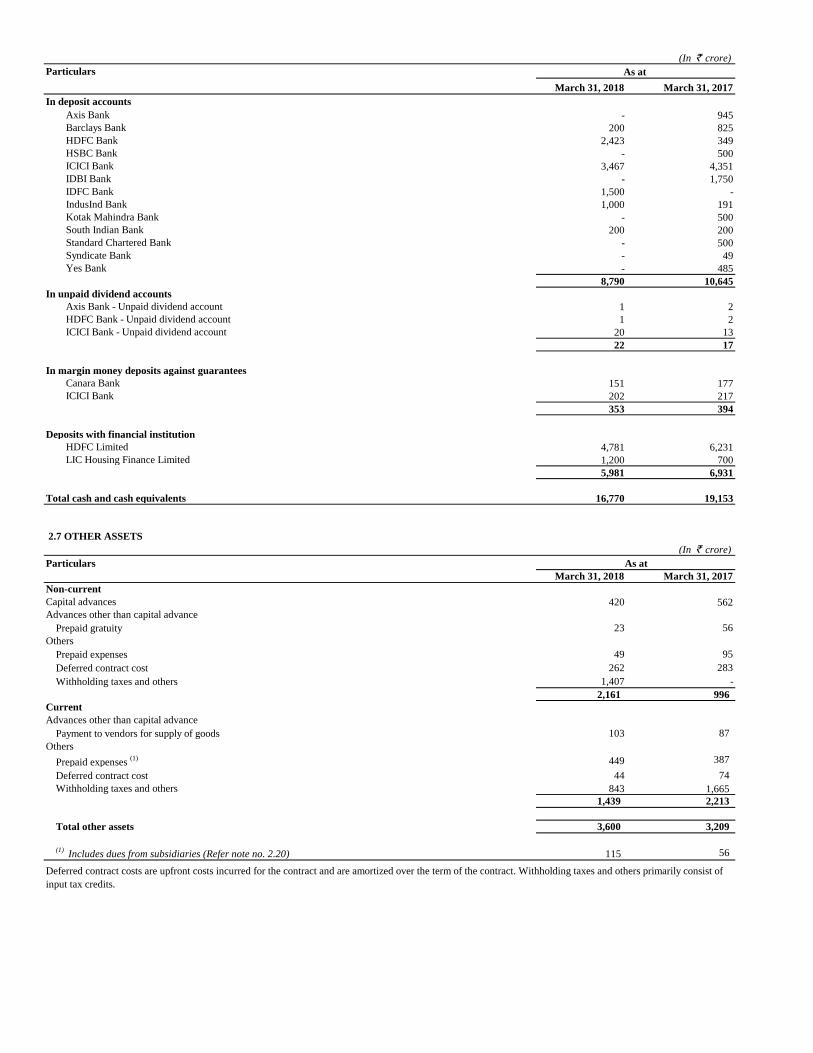
(In ` crore)
Particulars
March 31, 2018 March 31, 2017
In deposit accounts
Axis Bank - 945
Barclays Bank 200 825
HDFC Bank 2,423 349
HSBC Bank - 500
ICICI Bank 3,467 4,351
IDBI Bank - 1,750
IDFC Bank 1,500 -
IndusInd Bank 1,000 191
Kotak Mahindra Bank - 500
South Indian Bank 200 200
Standard Chartered Bank - 500
Syndicate Bank - 49
Yes Bank - 485
8,790 10,645
In unpaid dividend accounts
Axis Bank - Unpaid dividend account 1 2
HDFC Bank - Unpaid dividend account 1 2
ICICI Bank - Unpaid dividend account 20 13
22 17
In margin money deposits against guarantees
Canara Bank 151 177
ICICI Bank 202 217
353 394
Deposits with financial institution
HDFC Limited 4,781 6,231
LIC Housing Finance Limited 1,200 700
5,981 6,931
Total cash and cash equivalents 16,770 19,153
2.7 OTHER ASSETS
(In ` crore)
Particulars
March 31, 2018 March 31, 2017
Non-current
Capital advances 420 562
Advances other than capital advance
Prepaid gratuity 23 56
Others
Prepaid expenses 49 95
Deferred contract cost 262 283
Withholding taxes and others 1,407 -
2,161 996
Current
Advances other than capital advance
Payment to vendors for supply of goods 103 87
Others
Prepaid expenses (1) 449 387
Deferred contract cost 44 74
Withholding taxes and others 843 1,665
1,439 2,213
Total other assets 3,600 3,209
(1) Includes dues from subsidiaries (Refer note no. 2.20) 115 56
As at
Deferred contract costs are upfront costs incurred for the contract and are amortized over the term of the contract. Withholding taxes and others primarily consist of
input tax credits.
As at
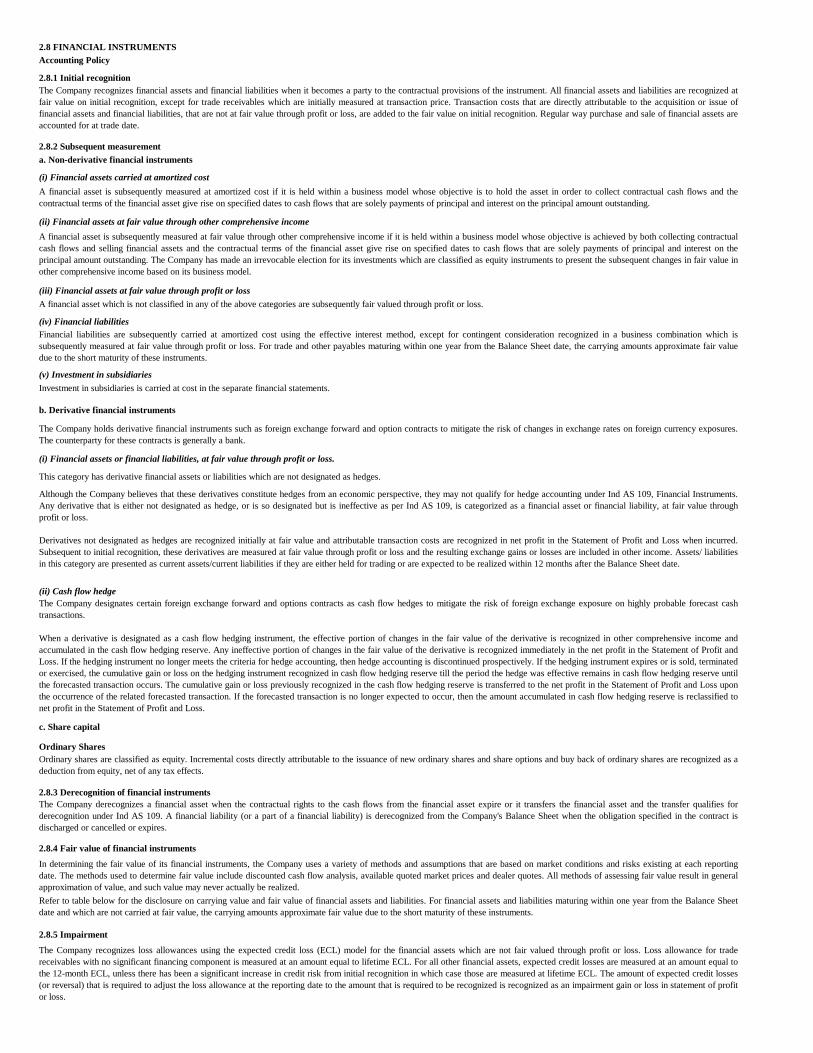
2.8 FINANCIAL INSTRUMENTS
Accounting Policy
2.8.1 Initial recognition
(iv) Financial liabilities
(ii) Financial assets at fair value through other comprehensive income
(iii) Financial assets at fair value through profit or loss
2.8.2 Subsequent measurement
a. Non-derivative financial instruments
(i) Financial assets carried at amortized cost
c. Share capital
Ordinary Shares
Ordinary shares are classified as equity. Incremental costs directly attributable to the issuance of new ordinary shares and share options and buy back of ordinary shares are recognized as a
deduction from equity, net of any tax effects.
The Company recognizes financial assets and financial liabilities when it becomes a party to the contractual provisions of the instrument. All financial assets and liabilities are recognized at
fair value on initial recognition, except for trade receivables which are initially measured at transaction price. Transaction costs that are directly attributable to the acquisition or issue of
financial assets and financial liabilities, that are not at fair value through profit or loss, are added to the fair value on initial recognition. Regular way purchase and sale of financial assets are
accounted for at trade date.
A financial asset is subsequently measured at amortized cost if it is held within a business model whose objective is to hold the asset in order to collect contractual cash flows and the
contractual terms of the financial asset give rise on specified dates to cash flows that are solely payments of principal and interest on the principal amount outstanding.
A financial asset is subsequently measured at fair value through other comprehensive income if it is held within a business model whose objective is achieved by both collecting contractual
cash flows and selling financial assets and the contractual terms of the financial asset give rise on specified dates to cash flows that are solely payments of principal and interest on the
principal amount outstanding. The Company has made an irrevocable election for its investments which are classified as equity instruments to present the subsequent changes in fair value in
other comprehensive income based on its business model.
A financial asset which is not classified in any of the above categories are subsequently fair valued through profit or loss.
Financial liabilities are subsequently carried at amortized cost using the effective interest method, except for contingent consideration recognized in a business combination which is
subsequently measured at fair value through profit or loss. For trade and other payables maturing within one year from the Balance Sheet date, the carrying amounts approximate fair value
due to the short maturity of these instruments.
Investment in subsidiaries is carried at cost in the separate financial statements.
The Company holds derivative financial instruments such as foreign exchange forward and option contracts to mitigate the risk of changes in exchange rates on foreign currency exposures.
The counterparty for these contracts is generally a bank.
This category has derivative financial assets or liabilities which are not designated as hedges.
Although the Company believes that these derivatives constitute hedges from an economic perspective, they may not qualify for hedge accounting under Ind AS 109, Financial Instruments.
Any derivative that is either not designated as hedge, or is so designated but is ineffective as per Ind AS 109, is categorized as a financial asset or financial liability, at fair value through
profit or loss.
Derivatives not designated as hedges are recognized initially at fair value and attributable transaction costs are recognized in net profit in the Statement of Profit and Loss when incurred.
Subsequent to initial recognition, these derivatives are measured at fair value through profit or loss and the resulting exchange gains or losses are included in other income. Assets/ liabilities
in this category are presented as current assets/current liabilities if they are either held for trading or are expected to be realized within 12 months after the Balance Sheet date.
The Company designates certain foreign exchange forward and options contracts as cash flow hedges to mitigate the risk of foreign exchange exposure on highly probable forecast cash
transactions.
When a derivative is designated as a cash flow hedging instrument, the effective portion of changes in the fair value of the derivative is recognized in other comprehensive income and
accumulated in the cash flow hedging reserve. Any ineffective portion of changes in the fair value of the derivative is recognized immediately in the net profit in the Statement of Profit and
Loss. If the hedging instrument no longer meets the criteria for hedge accounting, then hedge accounting is discontinued prospectively. If the hedging instrument expires or is sold, terminated
or exercised, the cumulative gain or loss on the hedging instrument recognized in cash flow hedging reserve till the period the hedge was effective remains in cash flow hedging reserve until
the forecasted transaction occurs. The cumulative gain or loss previously recognized in the cash flow hedging reserve is transferred to the net profit in the Statement of Profit and Loss upon
the occurrence of the related forecasted transaction. If the forecasted transaction is no longer expected to occur, then the amount accumulated in cash flow hedging reserve is reclassified to
net profit in the Statement of Profit and Loss.
(ii) Cash flow hedge
(i) Financial assets or financial liabilities, at fair value through profit or loss.
(v) Investment in subsidiaries
b. Derivative financial instruments
In determining the fair value of its financial instruments, the Company uses a variety of methods and assumptions that are based on market conditions and risks existing at each reporting
date. The methods used to determine fair value include discounted cash flow analysis, available quoted market prices and dealer quotes. All methods of assessing fair value result in general
approximation of value, and such value may never actually be realized.
Refer to table below for the disclosure on carrying value and fair value of financial assets and liabilities. For financial assets and liabilities maturing within one year from the Balance Sheet
date and which are not carried at fair value, the carrying amounts approximate fair value due to the short maturity of these instruments.
The Company recognizes loss allowances using the expected credit loss (ECL) model for the financial assets which are not fair valued through profit or loss. Loss allowance for trade
receivables with no significant financing component is measured at an amount equal to lifetime ECL. For all other financial assets, expected credit losses are measured at an amount equal to
the 12-month ECL, unless there has been a significant increase in credit risk from initial recognition in which case those are measured at lifetime ECL. The amount of expected credit losses
(or reversal) that is required to adjust the loss allowance at the reporting date to the amount that is required to be recognized is recognized as an impairment gain or loss in statement of profit
or loss.
2.8.5 Impairment
2.8.3 Derecognition of financial instruments
2.8.4 Fair value of financial instruments
The Company derecognizes a financial asset when the contractual rights to the cash flows from the financial asset expire or it transfers the financial asset and the transfer qualifies for
derecognition under Ind AS 109. A financial liability (or a part of a financial liability) is derecognized from the Company's Balance Sheet when the obligation specified in the contract is
discharged or cancelled or expires.

Financial instruments by category
The carrying value and fair value of financial instruments by categories as at March 31, 2018 are as follows:
(In ` crore)Particulars
Designated upon
initial
recognition
Mandatory Equity
instruments
designated upon
initial
recognition
Mandatory
Assets: Cash and cash equivalents (Refer Note no. 2.6) 16,770 - - - - 16,770 16,770
Investments (Refer note no.2.2)
Equity and preference securities and others - - 7 117 - 124 124
Tax free bonds and government bonds 1,832 - - - - 1,832 2,079 *
Liquid mutual fund units - - - - - - -
Redeemable, non-convertible debentures (1) 1,780 - - - - 1,780 1,780
Fixed maturity plans securities - - 376 - - 376 376
Certificates of deposit - - - - 4,901 4,901 4,901
Non convertible debentures - - - - 3,580 3,580 3,580
Commercial papers - - - - 293 293 293
Trade receivables (Refer Note no. 2.5) 12,151 - - - - 12,151 12,151
Loans (Refer note no. 2.3) 412 - - - - 412 412
Other financial assets (Refer Note no. 2.4) 6,067 - 4 - 12 6,083 6,001 **
Total 39,012 - 387 117 8,786 48,302 48,467
Liabilities:
Trade payables (Refer Note no. 2.11) 738 - - - - 738 738
Other financial liabilities (Refer Note no. 2.10) 4,241 - 91 - 3 4,335 4,335
Total 4,979 - 91 - 3 5,073 5,073
(1)
The carrying value of debentures approximates fair value as the instruments are at prevailing market rates
* On account of fair value changes including interest accrued
** Excludes interest accrued on tax free bonds
The carrying value and fair value of financial instruments by categories as at March 31, 2017 were as follows:
(In ` crore)
Particulars
Designated upon
initial
recognition
Mandatory Equity
instruments
designated upon
initial
recognition
Mandatory
Assets:
Cash and cash equivalents (Refer Note no. 2.6) 19,153 - - - - 19,153 19,153
Investments (Refer Note no. 2.2)
Equity and preference securities and others - - 3 132 - 135 135
Tax free bonds and government bonds 1,833 - - - - 1,833 2,142 *
Liquid mutual fund units - - 1,755 - - 1,755 1,755
Redeemable, non-convertible debentures (1) 2,129 - - - - 2,129 2,129
Fixed maturity plans - - 508 - - 508 508
Certificates of deposit - - - - 7,635 7,635 7,635
Non convertible debentures - - - - 3,677 3,677 3,677
Trade receivables (Refer Note no. 2.5) 10,960 - - - - 10,960 10,960
Loans (Refer note no. 2.3) 315 - - - - 315 315
Other financial assets (Refer Note no. 2.4) 5,351 - 216 - 52 5,619 5,537 **
Total 39,741 - 2,482 132 11,364 53,719 53,946
Liabilities:
Trade payables (Refer note no. 2.11) 269 - - - - 269 269
Other financial liabilities (Refer Note no. 2.10) 3,867 - 87 - - 3,954 3,954
Total 4,136 - 87 - - 4,223 4,223
(1)
The carrying value of debentures approximates fair value as the instruments are at prevailing market rates
* On account of fair value changes including interest accrued
** Excludes interest accrued on tax free bonds
Total fair valueFinancial assets/ liabilities at fair
value through profit or loss
Financial assets/liabilities at fair
value through OCI
Amortized
cost
Total carrying
value
Financial assets/ liabilities at fair
value through profit or loss
Financial assets/liabilities at fair
value through OCI
Total fair valueTotal carrying
value
Amortized
cost

Fair value hierarchy
Level 1 - Quoted prices (unadjusted) in active markets for identical assets or liabilities.
Level 3 - Inputs for the assets or liabilities that are not based on observable market data (unobservable inputs).
(In ` crore)
Particulars
Level 1 Level 2 Level 3
Assets
2,078 1,806 272 -
1 1 - -
1 - - 1
116 - - 116
376 - 376 -
4,901 - 4,901 -
Investments in non convertible debentures (Refer note no. 2.2) 3,580 2,493 1,087 -
Investments in commercial paper (Refer note no. 2.2) 293 - 293 -
Other investments (Refer note no. 2.2) 7 - - 7
16 - 16 -
Liabilities
40 - 40 -
Liability towards contingent consideration (Refer note no. 2.10)(1)(2) 54 - - 54
(1)Pertains to contingent consideration payable to selling shareholders of Kallidus and Brilliant Basics Holding Limited as per the share purchase agreement.
(2)Discounted ` 21 crore at 10%, pertaining to Brilliant Basics
(In ` crore)
Particulars
Level 1 Level 2 Level 3
Assets
1,755 1,755 - -
2,142 206 1,936 -
1 - - 1
131 - - 131
508 - 508 -
7,635 - 7,635 -
3,677 3,160 517 -
3 - - 3
268 - 268 -
Liabilities
2 - 2 -
Liability towards contingent consideration (Refer note no. 2.10)(1)(2) 85 - - 85
(1)Pertains to contingent consideration payable to selling shareholders of Kallidus as per the share purchase agreement.
(2)Discounted ` 91 crore at 14.2%
The movement in level 3 investments from March 31, 2017 to March 31, 2018 is on account of purchase of additional investments, disposals during the year and change in fair value.
A one percentage point change in the unobservable inputs used in fair valuation of Level 3 assets and liabilities does not have a significant impact in its value.
Fair value measurement at end of the
reporting period/year using
As at March 31,
2017
Investments in tax free bonds (Refer note no. 2.2)
During the year ended March 31, 2018, quoted debt securities of `1,797 crore were transferred from Level 2 to Level 1 of fair value hierarchy, since these were valued based on Quoted
price, and `743 crore were transferred from Level 1 to Level 2 of fair value hierarchy, since these were valued based on market observable inputs.
Investments in government bonds (Refer note no. 2.2)
Derivative financial instruments - gain on outstanding foreign currency forward and option contracts
(Refer note no. 2.4)
Investments in equity instruments (Refer note no. 2.2)
Investments in preference securities (Refer note no. 2.2)
Derivative financial instruments - loss on outstanding foreign currency forward and option contracts
(Refer Note no. 2.10)
The following table presents fair value hierarchy of assets and liabilities as at March 31, 2018:
As at March 31,
2018
Fair value measurement at end of the reporting
period/year using
Level 2 – Inputs other than quoted prices included within Level 1 that are observable for the asset or liability, either directly (i.e. as prices) or indirectly (i.e. derived from prices).
Derivative financial instruments - loss on outstanding foreign currency forward and
option contracts (Refer note 2.10)
Investments in fixed maturity plan securities (Refer Note no. 2.2)
Investments in certificates of deposit (Refer Note no. 2.2)
Investments in non convertible debentures (Refer Note no. 2.2)
Other investments (Refer Note no. 2.2)
Derivative financial instruments - gain on outstanding foreign currency forward and
option contracts (Refer Note no. 2.4)
Investments in fixed maturity plan securities (Refer note no. 2.2)
Investments in certificates of deposit (Refer note no. 2.2)
Investments in equity instruments (Refer Note no. 2.2)
Investments in preference securities (Refer Note no. 2.2)
Investments in liquid mutual fund units (Refer Note no. 2.2)
The following table presents fair value hierarchy of assets and liabilities as at March 31, 2017:
Investments in tax free bonds (Refer Note no. 2.2)
The movement in contingent consideration as at March 31, 2018 from March 31, 2017 is mainly on account of settlement of `45 crore pertaining to Kallidus acquisiton and addition of
`17 crore in relation to acquisition of Brilliant Basics Holdings Limited. (Refer note no. 2.2)
During the year ended March 31, 2017, tax-free bonds of `115 crore were transferred from Level 1 to Level 2 of fair value hierarchy, since these were valued based on market
observable inputs.

Financial risk management
Financial risk factors
Market risk
The following table analysis foreign currency risk from financial instruments as at March 31, 2018:
(In ` crore)
Particulars U.S. dollars Euro United
Kingdom Pound
Sterling
Australian dollars Other
currencies
Total
Cash and cash equivalents 858 139 82 186 271 1,536
Trade receivables 7,776 1,522 871 743 550 11,462
Other financials assets ( including loans) 2,196 597 335 159 305 3,592
Trade payables (312) (60) (168) (36) (22) (598)
Other financial liabilities (1,962) (252) (148) (220) (162) (2,744)
Net assets / (liabilities) 8,556 1,946 972 832 942 13,248
The following table analyzes foreign currency risk from financial instruments as at March 31, 2017:
(In ` crore)
Particulars U.S. dollars Euro United
Kingdom Pound
Sterling
Australian dollars Other
currencies
Total
Cash and cash equivalents 849 79 33 45 97 1,103
Trade Receivables 7,611 1,005 793 533 361 10,303
Other financials assets ( including loans) 2,686 436 365 148 136 3,771
Trade payables (145) (5) (11) (12) (22) (195)
Other financial liabilities (1,847) (227) (169) (186) (137) (2,566)
Net assets / (liabilities) 9,154 1,288 1,011 528 435 12,416
Particulars
2018 2017 2018 2017
Impact on the Company's incremental Operating Margins 0.52% 0.52% 0.52% 0.52%
Derivative financial instruments
The Company operates internationally and a major portion of the business is transacted in several currencies and consequently the Company is exposed to foreign exchange risk through
its sales and services in the United States and elsewhere, and purchases from overseas suppliers in various foreign currencies. The Company holds derivative financial instruments such
as foreign exchange forward and option contracts to mitigate the risk of changes in exchange rates on foreign currency exposures. The exchange rate between the Indian rupee and
foreign currencies has changed substantially in recent years and may fluctuate substantially in the future. Consequently, the results of the Company’s operations are adversely affected as
the rupee appreciates/ depreciates against these currencies.
Year ended March 31,Three months ended March 31,
Sensitivity analysis between Indian Rupee and USD
The Company holds derivative financial instruments such as foreign currency forward and option contracts to mitigate the risk of changes in exchange rates on foreign currency
exposures. The counterparty for these contracts is generally a bank. These derivative financial instruments are valued based on quoted prices for similar assets and liabilities in active
markets or inputs that are directly or indirectly observable in the marketplace.
The Company's activities expose it to a variety of financial risks: market risk, credit risk and liquidity risk. The Company's primary focus is to foresee the unpredictability of financial
markets and seek to minimize potential adverse effects on its financial performance. The primary market risk to the Company is foreign exchange risk. The Company uses derivative
financial instruments to mitigate foreign exchange related risk exposures. The Company's exposure to credit risk is influenced mainly by the individual characteristic of each customer
and the concentration of risk from the top few customers.
Sensitivity analysis is computed based on the changes in the income and expenses in foreign currency upon conversion into functional currency, due to exchange rate fluctuations
between the previous reporting period and the current reporting period.

The following table gives details in respect of outstanding foreign currency forward and option contracts:
Particulars
In million In ` crore In million In ` crore
Derivatives designated as cash flow hedges
Forward contracts
In Australian dollars - - 130 644
In Euro - - 95 658
In United Kingdom Pound Sterling - - 40 324
Option Contracts
In Australian dollars 60 300 - -
In Euro 100 808 40 277
In United Kingdom Pound Sterling 20 184 - -
Other derivatives
Forward contracts
In Australian dollars - - 30 149
In Canadian dollars 20 99 - -
In Euro 86 695 106 735
In Japanese Yen 550 34 - -
In New Zealand dollars 16 76 - -
In Norwegian Krone 40 34 - -
In South African Rand 25 14 - -
In Singapore dollars 5 25 5 23
In Swedish Krona 50 40 50 36
In Swiss Franc 21 146 10 65
In U.S. dollars 556 3,624 480 3,113
In United Kingdom Pound Sterling 45 415 70 566
Option Contracts
In Australian dollars 20 100 - -
In Canadian dollars - - 13 65
In Euro 45 363 25 173
In Swiss Franc 5 33 - -
In U.S. dollars 320 2,086 195 1,265
In United Kingdom Pound Sterling 25 231 30 243
Total forwards and options 9,307 8,336
(In ` crore)
Particulars
Not later than one month
Later than one month and not later than three months
Later than three months and not later than one year
The following table provides the reconciliation of effective portion of cash flow hedges for the three months and year ended March 31, 2018 and March 31, 2017:
(In ` crore)
Particulars
2018 2017 2018 2017
Balance at the beginning of the period/ year (2) 28 39 -
Gain / (Loss) recognized in other comprehensive income during the period/ year (9) 73 (93) 121
Amount reclassified to profit and loss during the period/year 11 (59) 41 (69)
Tax impact on above - (3) 13 (13)
Balance at the end of the period/ year - 39 - 39
(In ` crore)
Particulars
Derivative
financial asset
Derivative
financial liability
Derivative
financial
asset
Derivative
financial liability
Gross amount of recognized financial asset/liability 20 (44) 269 (3)
Amount set off (4) 4 (1) 1
Net amount presented in balance sheet 16 (40) 268 (2)
March 31, 2017March 31, 2018
As at
Three months ended March 31, Year ended March 31,
As atAs at
8,336
2,693
4,274
2,340
9,307
March 31, 2017March 31, 2018
2,215
4,103
2,018
As at
The Company offsets a financial asset and a financial liability when it currently has a legally enforceable right to set off the recognized amounts and the Company intends either to settle
on a net basis, or to realize the asset and settle the liability simultaneously.
The following table provides quantitative information about offsetting of derivative financial assets and derivative financial liabilities:
During the year ended March 31, 2018, the Company has designated certain foreign exchange forward and option contracts as cash flow hedges to mitigate the risk of foreign exchange
exposure on highly probable forecast cash transactions. The related hedge transactions for balance in cash flow hedging reserve are expected to occur and reclassified to statement of
profit or loss within 3 months.
If the hedge ratio for risk management purposes is no longer optimal but the risk management objective remains unchanged and the hedge continues to qualify for hedge accounting, the
hedge relationship will be rebalanced by adjusting either the volume of the hedging instrument or the volume of the hedged item so that the hedge ratio aligns with the ratio used for risk
management purposes. Any hedge ineffectiveness is calculated and accounted for in the Statement of Profit or Loss at the time of the hedge relationship rebalancing.
Hedge effectiveness is determined at the inception of the hedge relationship, and through periodic prospective effectiveness assessments to ensure that an economic relationship exists
between the hedged item and hedging instrument, including whether the hedging instrument is expected to offset changes in cash flows of hedged items.
March 31, 2018 March 31, 2017
As at As at
The foreign exchange forward and option contracts mature within twelve months. The table below analyzes the derivative financial instruments into relevant maturity groupings based on
the remaining period as at the balance sheet date:
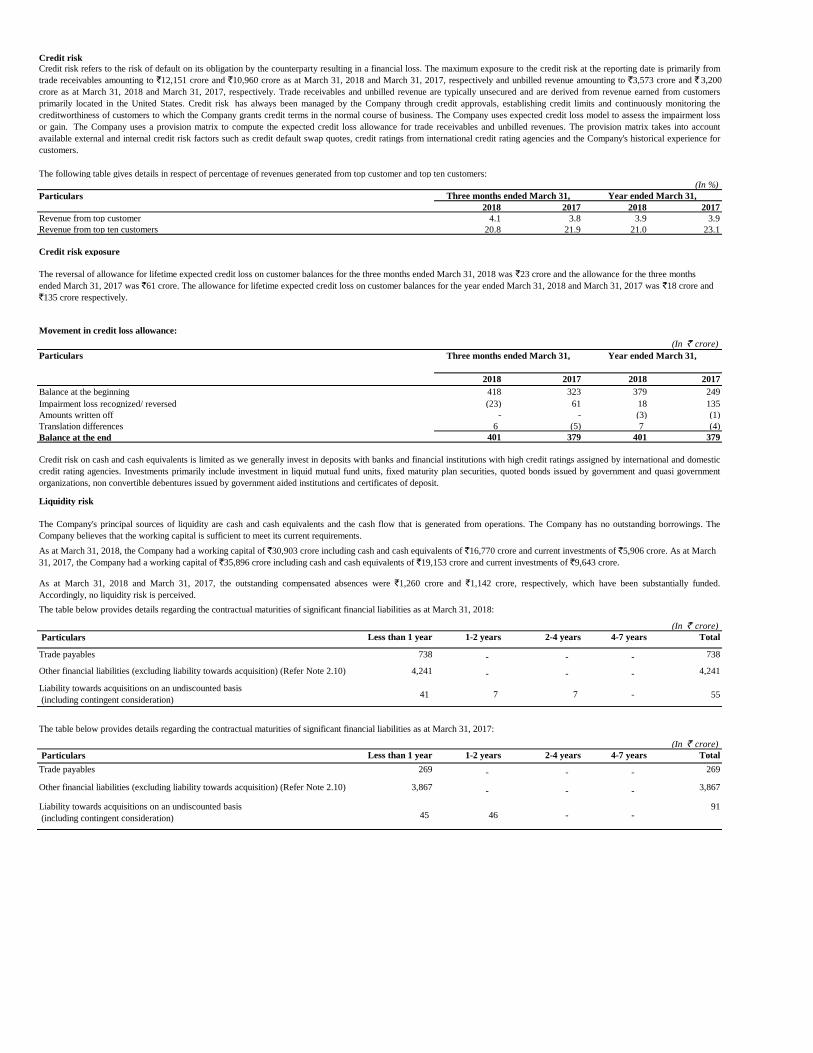
Credit risk
The following table gives details in respect of percentage of revenues generated from top customer and top ten customers:
(In %)
Particulars
2018 2017 2018 2017
Revenue from top customer 4.1 3.8 3.9 3.9
Revenue from top ten customers 20.8 21.9 21.0 23.1
(In ` crore)
Particulars
2018 2017 2018 2017
Balance at the beginning 418 323 379 249
Impairment loss recognized/ reversed (23) 61 18 135
Amounts written off - - (3) (1)
Translation differences 6 (5) 7 (4)
Balance at the end 401 379 401 379
Liquidity risk
The table below provides details regarding the contractual maturities of significant financial liabilities as at March 31, 2018:
(In ` crore)
Particulars Less than 1 year 1-2 years 2-4 years 4-7 years Total
738 - - - 738
4,241 - - - 4,241
41 7 7 - 55
The table below provides details regarding the contractual maturities of significant financial liabilities as at March 31, 2017:
(In ` crore)
Particulars Less than 1 year 1-2 years 2-4 years 4-7 years Total
269 - - - 269
3,867 - - - 3,867
45 46 - - 91
As at March 31, 2018 and March 31, 2017, the outstanding compensated absences were `1,260 crore and `1,142 crore, respectively, which have been substantially funded.
Accordingly, no liquidity risk is perceived.
The Company's principal sources of liquidity are cash and cash equivalents and the cash flow that is generated from operations. The Company has no outstanding borrowings. The
Company believes that the working capital is sufficient to meet its current requirements.
Credit risk on cash and cash equivalents is limited as we generally invest in deposits with banks and financial institutions with high credit ratings assigned by international and domestic
credit rating agencies. Investments primarily include investment in liquid mutual fund units, fixed maturity plan securities, quoted bonds issued by government and quasi government
organizations, non convertible debentures issued by government aided institutions and certificates of deposit.
Year ended March 31,
Credit risk exposure
As at March 31, 2018, the Company had a working capital of `30,903 crore including cash and cash equivalents of `16,770 crore and current investments of `5,906 crore. As at March
31, 2017, the Company had a working capital of `35,896 crore including cash and cash equivalents of `19,153 crore and current investments of `9,643 crore.
The reversal of allowance for lifetime expected credit loss on customer balances for the three months ended March 31, 2018 was `23 crore and the allowance for the three months
ended March 31, 2017 was `61 crore. The allowance for lifetime expected credit loss on customer balances for the year ended March 31, 2018 and March 31, 2017 was `18 crore and
`135 crore respectively.
Year ended March 31,
Credit risk refers to the risk of default on its obligation by the counterparty resulting in a financial loss. The maximum exposure to the credit risk at the reporting date is primarily from
trade receivables amounting to `12,151 crore and `10,960 crore as at March 31, 2018 and March 31, 2017, respectively and unbilled revenue amounting to `3,573 crore and ` 3,200
crore as at March 31, 2018 and March 31, 2017, respectively. Trade receivables and unbilled revenue are typically unsecured and are derived from revenue earned from customers
primarily located in the United States. Credit risk has always been managed by the Company through credit approvals, establishing credit limits and continuously monitoring the
creditworthiness of customers to which the Company grants credit terms in the normal course of business. The Company uses expected credit loss model to assess the impairment loss
or gain. The Company uses a provision matrix to compute the expected credit loss allowance for trade receivables and unbilled revenues. The provision matrix takes into account
available external and internal credit risk factors such as credit default swap quotes, credit ratings from international credit rating agencies and the Company's historical experience for
customers.
Three months ended March 31,
Three months ended March 31,
Liability towards acquisitions on an undiscounted basis
(including contingent consideration)
Liability towards acquisitions on an undiscounted basis
(including contingent consideration)
Other financial liabilities (excluding liability towards acquisition) (Refer Note 2.10)
Trade payables
Trade payables
Other financial liabilities (excluding liability towards acquisition) (Refer Note 2.10)
Movement in credit loss allowance:

2.9 EQUITY
EQUITY SHARE CAPITAL
(In ` crore, except as otherwise stated)
Particulars
March 31, 2018 March 31, 2017
Authorized
Equity shares, `5/- par value
2,40,00,00,000 (2,40,00,00,000) equity shares 1,200 1,200
Issued, Subscribed and Paid-Up
Equity shares, `5/- par value (1) 1,092 1,148
2,18,41,14,257 (2,29,69,44,664) equity shares fully paid-up
1,092 1,148
Forfeited shares amounted to `1,500/- (`1,500/-)
Dividends
Amount of per share dividend recognized as distribution to equity shareholders: (in ` )
2018 2017
Final Dividend for fiscal 2016 - 14.25
Interim Dividend for fiscal 2017 - 11.00
Final Dividend for fiscal 2017 14.75 -
Interim Dividend for fiscal 2018 13.00 -
As at
(1) Refer note no. 2.18 for details of basic and diluted shares
The Company declares and pays dividends in Indian rupees. The remittance of dividends outside India is governed by Indian law on foreign exchange and is subject to
applicable distribution taxes. Dividend distribution tax paid by subsidiaries may be reduced / available as a credit against dividend distribution tax payable by Infosys
Limited.
The Board of Directors, in their meeting on October 24, 2017, declared an interim dividend of `13/- per equity share, which resulted in a cash outflow of
`3,422 crore, inclusive of dividend distribution tax.
During the year ended March 31, 2018, the Company received `846 crore as dividend from Infosys BPM its majority owned subsidiary. Dividend distribution tax paid by
the subsidiary on such dividend has been reduced as credit against dividend distribution tax payable by Infosys.
The Company has only one class of shares referred to as equity shares having a par value of `5/-. Each holder of equity shares is entitled to one vote per share. The equity
shares represented by American Depository Shares (ADS) carry similar rights to voting and dividends as the other equity shares. Each ADS represents one underlying
equity share
Final dividends on shares are recorded as a liability on the date of approval by the shareholders and interim dividends are recorded as a liability on the date of declaration
by the Company's Board of Directors.
Particulars Year ended March 31,
The Board of Directors recommended a final dividend of `20.5/- per equity share for the financial year ended March 31, 2018 and a special dividend of `10/- per equity
share. The payment is subject to the approval of the shareholders in the ensuing Annual General Meeting of the Company, to be held on June 23, 2018 and if approved
would result in a cash outflow of approximately `7,982 crore, including dividend distribution tax.
Effective from Financial Year 2018, the Company's policy is to payout up to 70% of the free cash flow of the corresponding Financial Year in such manner (including by
way of dividend and / or share buyback) as may be decided by the Board from time to time, subject to applicable laws and requisite approvals, if any. Free cash flow is
defined as net cash provided by operating activities less capital expenditure as per the consolidated statement of cash flows prepared under IFRS. Dividend payout
includes dividend distribution tax.
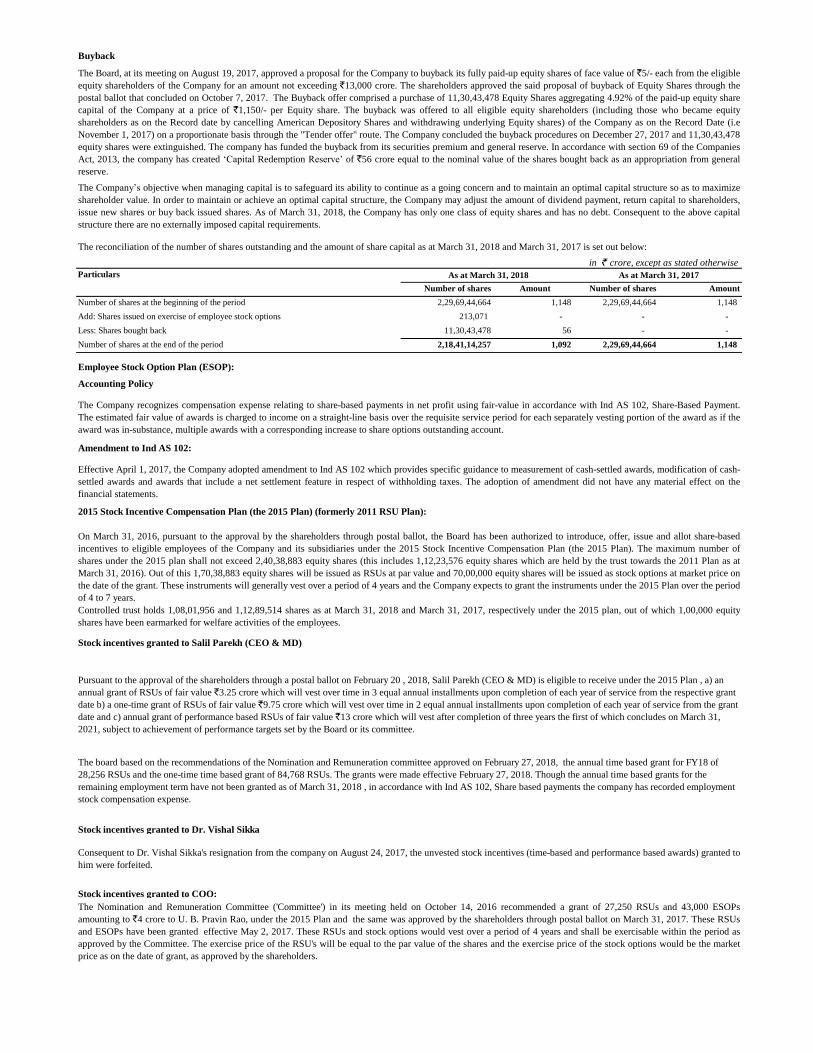
in ` crore, except as stated otherwise
Particulars
Number of shares Amount Number of shares Amount
Number of shares at the beginning of the period 2,29,69,44,664 1,148 2,29,69,44,664 1,148
213,071 - - -
Less: Shares bought back 11,30,43,478 56 - -
Number of shares at the end of the period 2,18,41,14,257 1,092 2,29,69,44,664 1,148
Stock incentives granted to Salil Parekh (CEO & MD)
Stock incentives granted to Dr. Vishal Sikka
Stock incentives granted to COO:
Employee Stock Option Plan (ESOP):
The Board, at its meeting on August 19, 2017, approved a proposal for the Company to buyback its fully paid-up equity shares of face value of `5/- each from the eligible
equity shareholders of the Company for an amount not exceeding `13,000 crore. The shareholders approved the said proposal of buyback of Equity Shares through the
postal ballot that concluded on October 7, 2017. The Buyback offer comprised a purchase of 11,30,43,478 Equity Shares aggregating 4.92% of the paid-up equity share
capital of the Company at a price of `1,150/- per Equity share. The buyback was offered to all eligible equity shareholders (including those who became equity
shareholders as on the Record date by cancelling American Depository Shares and withdrawing underlying Equity shares) of the Company as on the Record Date (i.e
November 1, 2017) on a proportionate basis through the "Tender offer" route. The Company concluded the buyback procedures on December 27, 2017 and 11,30,43,478
equity shares were extinguished. The company has funded the buyback from its securities premium and general reserve. In accordance with section 69 of the Companies
Act, 2013, the company has created ‘Capital Redemption Reserve’ of `56 crore equal to the nominal value of the shares bought back as an appropriation from general
reserve.
Buyback
The reconciliation of the number of shares outstanding and the amount of share capital as at March 31, 2018 and March 31, 2017 is set out below:
As at March 31, 2018 As at March 31, 2017
Add: Shares issued on exercise of employee stock options
The Company’s objective when managing capital is to safeguard its ability to continue as a going concern and to maintain an optimal capital structure so as to maximize
shareholder value. In order to maintain or achieve an optimal capital structure, the Company may adjust the amount of dividend payment, return capital to shareholders,
issue new shares or buy back issued shares. As of March 31, 2018, the Company has only one class of equity shares and has no debt. Consequent to the above capital
structure there are no externally imposed capital requirements.
The Company recognizes compensation expense relating to share-based payments in net profit using fair-value in accordance with Ind AS 102, Share-Based Payment.
The estimated fair value of awards is charged to income on a straight-line basis over the requisite service period for each separately vesting portion of the award as if the
award was in-substance, multiple awards with a corresponding increase to share options outstanding account.
Accounting Policy
Amendment to Ind AS 102:
Controlled trust holds 1,08,01,956 and 1,12,89,514 shares as at March 31, 2018 and March 31, 2017, respectively under the 2015 plan, out of which 1,00,000 equity
shares have been earmarked for welfare activities of the employees.
Consequent to Dr. Vishal Sikka's resignation from the company on August 24, 2017, the unvested stock incentives (time-based and performance based awards) granted to
him were forfeited.
2015 Stock Incentive Compensation Plan (the 2015 Plan) (formerly 2011 RSU Plan):
On March 31, 2016, pursuant to the approval by the shareholders through postal ballot, the Board has been authorized to introduce, offer, issue and allot share-based
incentives to eligible employees of the Company and its subsidiaries under the 2015 Stock Incentive Compensation Plan (the 2015 Plan). The maximum number of
shares under the 2015 plan shall not exceed 2,40,38,883 equity shares (this includes 1,12,23,576 equity shares which are held by the trust towards the 2011 Plan as at
March 31, 2016). Out of this 1,70,38,883 equity shares will be issued as RSUs at par value and 70,00,000 equity shares will be issued as stock options at market price on
the date of the grant. These instruments will generally vest over a period of 4 years and the Company expects to grant the instruments under the 2015 Plan over the period
of 4 to 7 years.
The Nomination and Remuneration Committee ('Committee') in its meeting held on October 14, 2016 recommended a grant of 27,250 RSUs and 43,000 ESOPs
amounting to `4 crore to U. B. Pravin Rao, under the 2015 Plan and the same was approved by the shareholders through postal ballot on March 31, 2017. These RSUs
and ESOPs have been granted effective May 2, 2017. These RSUs and stock options would vest over a period of 4 years and shall be exercisable within the period as
approved by the Committee. The exercise price of the RSU's will be equal to the par value of the shares and the exercise price of the stock options would be the market
price as on the date of grant, as approved by the shareholders.
Pursuant to the approval of the shareholders through a postal ballot on February 20 , 2018, Salil Parekh (CEO & MD) is eligible to receive under the 2015 Plan , a) an
annual grant of RSUs of fair value `3.25 crore which will vest over time in 3 equal annual installments upon completion of each year of service from the respective grant
date b) a one-time grant of RSUs of fair value `9.75 crore which will vest over time in 2 equal annual installments upon completion of each year of service from the grant
date and c) annual grant of performance based RSUs of fair value `13 crore which will vest after completion of three years the first of which concludes on March 31,
2021, subject to achievement of performance targets set by the Board or its committee.
The board based on the recommendations of the Nomination and Remuneration committee approved on February 27, 2018, the annual time based grant for FY18 of
28,256 RSUs and the one-time time based grant of 84,768 RSUs. The grants were made effective February 27, 2018. Though the annual time based grants for the
remaining employment term have not been granted as of March 31, 2018 , in accordance with Ind AS 102, Share based payments the company has recorded employment
stock compensation expense.
Effective April 1, 2017, the Company adopted amendment to Ind AS 102 which provides specific guidance to measurement of cash-settled awards, modification of cash-
settled awards and awards that include a net settlement feature in respect of withholding taxes. The adoption of amendment did not have any material effect on the
financial statements.

Stock incentives granted to KMPs (other than Dr. Vishal Sikka and COO)
Stock incentive granted to employees other than KMP:
Break-up of employee stock compensation expenses ( ` in crore)
Particulars
2018 2017 2018 2017
Granted to:
KMP (2) 1 12 (13) 36
Employees other than KMP 22 28 85 71
Total (1) 23 40 72 107
- - 1 1 (2)
Includes a reversal of stock compensation cost of ` 35 crore towards forfeiture of stock incentives granted to Dr. Vishal Sikka upon his resignation
Particulars
Shares arising out of
options
Weighted average
exercise price (`)
Shares arising out
of options
Weighted average
exercise price (`)
2015 Plan: RSU
Outstanding at the beginning 2,084,284 5 2,961,373 5
Granted 1,887,894 5 2,280,608 5
Exercised 115,996 5 648,217 5
Forfeited and expired 105,773 5 843,355 5
Outstanding at the end 3,750,409 5 3,750,409 5
Exercisable at the end 24,205 5 24,205 5
2015 Plan: Employee Stock Options (ESOPs)
Outstanding at the beginning 1,158,400 992 1,197,650 992
Granted - - 491,575 943
Exercised 52,412 983 52,412 983
Forfeited and expired 139,075 963 669,900 961
Outstanding at the end 966,913 986 966,913 986
Exercisable at the end 196,912 992 196,912 992
As at March 31, 2018 and March 31, 2017, 1,11,757 and 1,06,845 incentive units were outstanding (net of forfeitures).
The activity in the 2015 Plan (formerly 2011 RSU Plan) for equity-settled share based payment transactions during the three months and year ended March 31, 2018 is
set out below:
Three months ended
March 31, 2018
Year ended
March 31, 2018
Three months ended March 31, Year ended March 31,
The carrying value of liability towards cash settled share based payments was `6 crore and `3 crore as at March 31, 2018 and March 31, 2017, respectively.
During fiscal 2017, the company granted 25,06,740 RSUs and 7,03,300 ESOPs and 1,12,210 incentive units (cash settled) to certain eligible employees at mid and senior
levels under the 2015 plan. Further, on May 2, 2017, the company granted 37,090 RSUs (includes equity shares and equity shares represented by ADS) at par value,
73,600 employee stock options (ESOPs) (including equity shares and equity shares represented by ADS) to be exercised at market price at the time of grant, to certain
employees at the senior management level. On August 1, 2017, 7,450 incentive units (cash settled) were granted to employees at the senior management level. These
instruments will vest over a period of 4 years and are subject to continued service. On February 27, 2018 15,59,920 RSUs and 42,590 incentive units (cash settled) were
granted to eligible employees. These instruments will vest over a period of 4 years and are subject to continued service.
On November 1, 2016, 2,47,250 RSUs and 5,02,550 stock options were granted under the 2015 plan, to key management personnel, excluding Vishal Sikka and COO,
based on fiscal 2016 performance. On August 1, 2017 58,150 RSUs and 44,450 ESOPs were granted to the General Counsel. These RSUs and stock options will vest
within a period of 4 years and shall be exercisable within the period as approved by the Committee. The exercise price of the RSUs will be equal to the par value of the
shares and the exercise price of the stock options would be the market price as on the date of grant. On February 27, 2018, based on the recommendation and approval of
the Nomination and Remuneration Committee the company granted 214,950 RSUs to the KMP other than CEO and COO. These instruments will vest over a period of 4
years and are subject to continued service.
During the year ended March 31, 2018, three of the KMPs have resigned (Refer to note no. 2.20 Related party transactions for further details) and hence the RSUs and
stock options granted to them were forfeited.
(1) Cash settled stock compensation expense included in the above
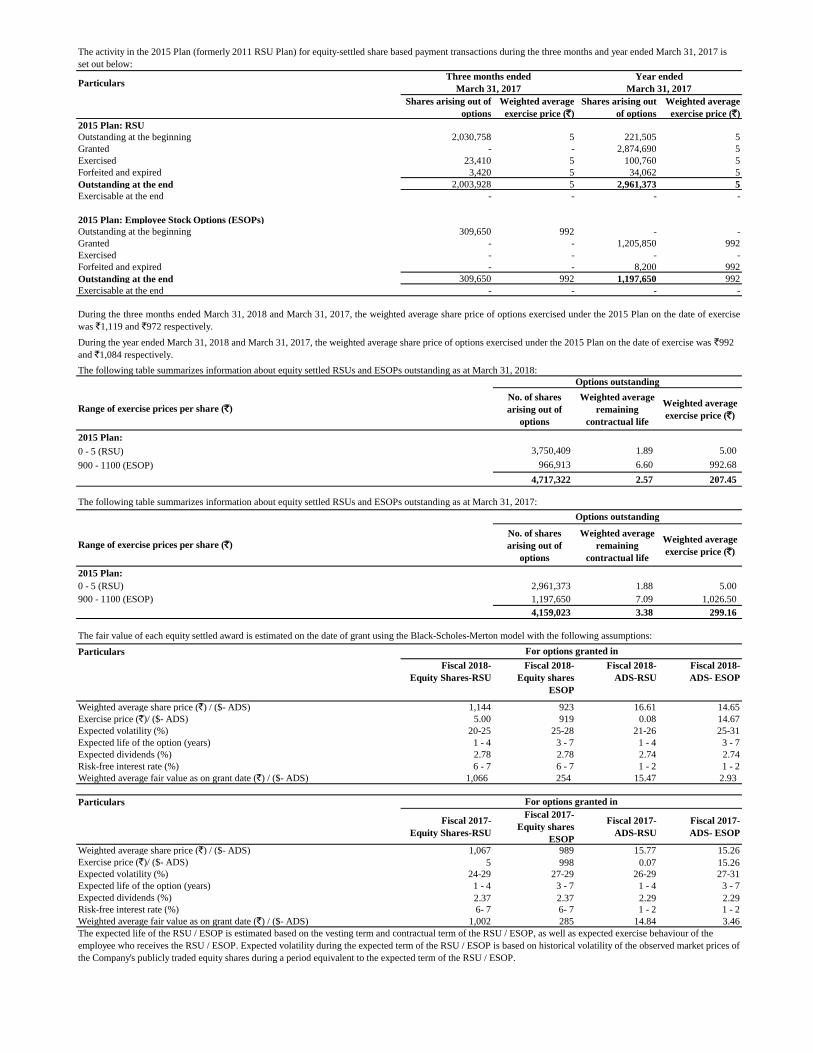
Particulars
Shares arising out of
options
Weighted average
exercise price (`)
Shares arising out
of options
Weighted average
exercise price (`)
2015 Plan: RSU
Outstanding at the beginning 2,030,758 5 221,505 5
Granted - - 2,874,690 5
Exercised 23,410 5 100,760 5
Forfeited and expired 3,420 5 34,062 5
Outstanding at the end 2,003,928 5 2,961,373 5
Exercisable at the end - - - -
2015 Plan: Employee Stock Options (ESOPs)
Outstanding at the beginning 309,650 992 - -
Granted - - 1,205,850 992
Exercised - - - -
Forfeited and expired - - 8,200 992
Outstanding at the end 309,650 992 1,197,650 992
Exercisable at the end - - - -
The following table summarizes information about equity settled RSUs and ESOPs outstanding as at March 31, 2018:
No. of shares
arising out of
options
Weighted average
remaining
contractual life
Weighted average
exercise price (`)
2015 Plan:
0 - 5 (RSU) 3,750,409 1.89 5.00
900 - 1100 (ESOP) 966,913 6.60 992.68
4,717,322 2.57 207.45
The following table summarizes information about equity settled RSUs and ESOPs outstanding as at March 31, 2017:
No. of shares
arising out of
options
Weighted average
remaining
contractual life
Weighted average
exercise price (`)
2015 Plan:
0 - 5 (RSU) 2,961,373 1.88 5.00
900 - 1100 (ESOP) 1,197,650 7.09 1,026.50
4,159,023 3.38 299.16
The fair value of each equity settled award is estimated on the date of grant using the Black-Scholes-Merton model with the following assumptions:
Particulars
Fiscal 2018-
Equity Shares-RSU
Fiscal 2018-
Equity shares
ESOP
Fiscal 2018-
ADS-RSU
Fiscal 2018-
ADS- ESOP
Weighted average share price (`) / ($- ADS) 1,144 923 16.61 14.65
Exercise price (`)/ ($- ADS) 5.00 919 0.08 14.67
Expected volatility (%) 20-25 25-28 21-26 25-31
Expected life of the option (years) 1 - 4 3 - 7 1 - 4 3 - 7
Expected dividends (%) 2.78 2.78 2.74 2.74
Risk-free interest rate (%) 6 - 7 6 - 7 1 - 2 1 - 2
Weighted average fair value as on grant date (`) / ($- ADS) 1,066 254 15.47 2.93
Particulars
Fiscal 2017-
Equity Shares-RSU
Fiscal 2017-
Equity shares
ESOP
Fiscal 2017-
ADS-RSU
Fiscal 2017-
ADS- ESOP
Weighted average share price (`) / ($- ADS) 1,067 989 15.77 15.26
Exercise price (`)/ ($- ADS) 5 998 0.07 15.26
Expected volatility (%) 24-29 27-29 26-29 27-31
Expected life of the option (years) 1 - 4 3 - 7 1 - 4 3 - 7
Expected dividends (%) 2.37 2.37 2.29 2.29
Risk-free interest rate (%) 6- 7 6- 7 1 - 2 1 - 2
Weighted average fair value as on grant date (`) / ($- ADS) 1,002 285 14.84 3.46
The expected life of the RSU / ESOP is estimated based on the vesting term and contractual term of the RSU / ESOP, as well as expected exercise behaviour of the
employee who receives the RSU / ESOP. Expected volatility during the expected term of the RSU / ESOP is based on historical volatility of the observed market prices of
the Company's publicly traded equity shares during a period equivalent to the expected term of the RSU / ESOP.
Options outstanding
Range of exercise prices per share (`)
During the year ended March 31, 2018 and March 31, 2017, the weighted average share price of options exercised under the 2015 Plan on the date of exercise was `992
and `1,084 respectively.
Options outstanding
Range of exercise prices per share (`)
For options granted in
For options granted in
During the three months ended March 31, 2018 and March 31, 2017, the weighted average share price of options exercised under the 2015 Plan on the date of exercise
was `1,119 and `972 respectively.
The activity in the 2015 Plan (formerly 2011 RSU Plan) for equity-settled share based payment transactions during the three months and year ended March 31, 2017 is
set out below:
Three months ended
March 31, 2017
Year ended
March 31, 2017

2.10 OTHER FINANCIAL LIABILITIES
(In ` crore)
Particulars
March 31, 2018 March 31, 2017
Non-current
Compensated absences 42 -
Payable for acquisition of business- Contingent consideration 13 40
55 40
Current
Unpaid dividends 22 17
Others
Accrued compensation to employees 2,048 1,404
Accrued expenses (1) 1,776 2,013
Retention monies 63 153
Payable for acquisition of business - Contingent consideration 41 45
Capital creditors 148 36
Compensated absences 1,218 1,142
Other payables (2) 184 244
Foreign currency forward and options contracts 40 2
5,540 5,056
Total financial liabilities 5,595 5,096
Financial liability carried at amortized cost 4,241 3,867
Financial liability carried at fair value through profit or loss 91 87
Financial liability carried at fair value through other comprehensive income 3 -
Liability towards acquisition of business on undiscounted basis 55 91 (1)
Includes dues to subsidiaries (Refer note no. 2.20) 9 3
(2) Includes dues to subsidiaries (Refer note no. 2.20) 19 14
2.11 TRADE PAYABLES
(In ` crore)
Particulars
March 31, 2018 March 31, 2017
Trade payables(1) 738 269
738 269 (1)
Includes dues to subsidiaries (refer note no. 2.20) 178 135
2.12 OTHER LIABILITIES
(In ` crore)
Particulars
March 31, 2018 March 31, 2017
Non current
Deferred income 36 42
Deferred rent 117 -
153 42
Current
Unearned revenue 1,887 1,320
Client deposits 32 -
Others
Withholding taxes and others 1,029 1,027
Deferred Rent 24 2
2,972 2,349
3,125 2,391
2.13 PROVISIONS
Provisions for onerous contracts are recognized when the expected benefits to be derived by the Company from a contract are lower than the unavoidable costs of meeting the
future obligations under the contract. The provision is measured at the present value of the lower of the expected cost of terminating the contract and the expected net cost of
continuing with the contract. Before a provision is established, the Company recognizes any impairment loss on the assets associated with that contract.
As at
As at
As at
Accounting Policy
a. Post sales client support
b. Onerous contracts
A provision is recognized if, as a result of a past event, the Company has a present legal or constructive obligation that is reasonably estimable, and it is probable that an outflow of
economic benefits will be required to settle the obligation. Provisions are determined by discounting the expected future cash flows at a pre-tax rate that reflects current market
assessments of the time value of money and the risks specific to the liability.
The Company provides its clients with a fixed-period post sales support for corrections of errors and support on all its fixed-price, fixed-timeframe contracts. Costs associated with
such support services are accrued at the time related revenues are recorded in the Statement of Profit and Loss. The Company estimates such costs based on historical experience
and estimates are reviewed on a periodic basis for any material changes in assumptions and likelihood of occurrence.

(In ` crore)
Particulars
March 31, 2018 March 31, 2017
Current
Others
Post-sales client support 436 350
436 350
Provision for post-sales client support
The movement in the provision for post-sales client support is as follows : (In ` crore)
ParticularsThree months ended
March 31, 2018
Year ended March
31, 2018
Balance at the beginning 399 350
Provision recognized/(reversed) 43 130
Provision utilized (15) (46)
Exchange difference 9 2
Balance at the end 436 436
Provision for post-sales client support are expected to be utilized over a period of 6 months to 1 year.
As at

2.14 INCOME TAXES
Income tax expense in the statement of profit and loss comprises: (In ` crore)
Particulars
2018 2017 2018 2017
Current taxes 1,397 1,141 4,003 5,068
Deferred taxes (164) 80 (250) 52
Income tax expense 1,233 1,221 3,753 5,120
Entire deferred income tax, except for a credit of `155 crore (on account of US Tax Reforms explained above), for the year ended March 31, 2018, relates to origination and
reversal of temperary differences.
The foreign tax expense is due to income taxes payable overseas, principally in the United States. In India, the Company has benefited from certain income tax incentives that the
Government of India had provided for export of software from the units registered under the Special Economic Zones Act (SEZs), 2005. SEZ units which began the provision of
services on or after April 1, 2005 are eligible for a deduction of 100% of profits or gains derived from the export of services for the first five years from the financial year in
which the unit commenced the provision of services and 50% of such profits or gains for further five years. Up to 50% of such profits or gains is also available for a further five
years subject to creation of a Special Economic Zone re-investment Reserve out of the profit for the eligible SEZ units and utilization of such reserve by the Company for
acquiring new plant and machinery for the purpose of its business as per the provisions of the Income Tax Act, 1961.
Other income for the three months and year ended March 31, 2018 includes interest on income tax refund of Nil crore and `257 crore, respectively.
During the three months ended December 31, 2017, the Company had concluded an Advance Pricing Agreement (“APA”) with the US Internal Revenue Service ("IRS") for the
US branch covering the years ending March 2011 to March 2021. Under the APA, the Company and the IRS have agreed on the methodology to allocate revenues and compute
the taxable income of the Company’s US Branch operations
During the three months ended December 31, 2017, in accordance with the APA, the company has reversed income tax expense provision of `1,432 crore which pertains to
previous periods. This comprises of current tax expense of `1,610 crore, reversal of `132 crore on account of deferred tax assets pertaining to the temporary differences which are
no longer required and a deferred tax liability of `46 crore pertaining to Branch profit tax for the three months ended December 31, 2017 on account of conclusion of APA. In
line with the APA, the Company has to pay an amount of approximately `1,488 crore due to the difference between the taxes payable for prior periods as per the APA and the
actual taxes paid for such periods. The company has paid `479 crore during the three months ended March 31, 2018 and the balance amount is expected to be paid over the next
few quarters.
Infosys is subject to a 15% Branch Profit Tax (BPT) in the U.S. to the extent its U.S. branch's net profit during the year is greater than the increase in the net assets of the U.S.
branch during the year, computed in accordance with the Internal Revenue Code. As at March 31, 2018, Infosys' U.S. branch net assets amounted to approximately `5,030 crore.
During the year ended March 31, 2018, an additional deferred tax liability has been created for branch profit tax amounting to `46 crore on account of conclusion of APA
explained above. Further, on account of US tax Reforms, the company has a credit of `155 crore pertaining to Branch Profit Tax for the year ended March 31, 2018. The
company has also reversed `55 crore of Branch Profit tax during the year ended March 31, 2018 towards current taxes. As at March 31, 2018, the Company has a deferred tax
liability for branch profit tax of `164 crore (net of credits), as the Company estimates that these branch profits are expected to be distributed in the foreseeable future.
Additionally, income tax expense for the three months ended March 31, 2018 and March 31, 2017 includes reversal (net of provisions) of `82 crore and `95 crore, respectively,
pertaining to prior periods on account of adjudication of certain disputed matters in favor of the company across various jurisdictions.
The “Tax Cuts and Jobs Act (H.R. 1)” was signed into law on December 22, 2017 (“US Tax Reforms”). The US tax reforms has reduced federal tax rates from 35% to 21%
effective January 1, 2018 amongst other measures. During the year ended March 31, 2018 , the US tax reforms has resulted in a positive impact of `155 crore on account of
credits pertaining to deferred tax liabilities on branch profit. The impact of US tax reforms is expected to be not significant for future periods.
Income tax expense for the year ended March 31, 2018 and March 31, 2017 includes reversal (net of provisions) of `240 crore and `218 crore, respectively, pertaining to prior
periods on account of adjudication of certain disputed matters in favor of the company across various jurisdictions.
Advance Pricing Agreement (“APA”)
Accounting Policy
Income tax expense comprises current and deferred income tax. Income tax expense is recognized in net profit in the Statement of Profit and Loss except to the extent that it
relates to items recognized directly in equity, in which case it is recognized in other comprehensive income. Current income tax for current and prior periods is recognized at the
amount expected to be paid to or recovered from the tax authorities, using the tax rates and tax laws that have been enacted or substantively enacted by the Balance Sheet date.
Deferred income tax assets and liabilities are recognized for all temporary differences arising between the tax bases of assets and liabilities and their carrying amounts in the
financial statements. Deferred tax assets are reviewed at each reporting date and are reduced to the extent that it is no longer probable that the related tax benefit will be realized.
Deferred income tax assets and liabilities are measured using tax rates and tax laws that have been enacted or substantively enacted by the Balance Sheet date and are expected to
apply to taxable income in the years in which those temporary differences are expected to be recovered or settled. The effect of changes in tax rates on deferred income tax assets
and liabilities is recognized as income or expense in the period that includes the enactment or the substantive enactment date. A deferred income tax asset is recognized to the
extent that it is probable that future taxable profit will be available against which the deductible temporary differences and tax losses can be utilized. Deferred income taxes are
not provided on the undistributed earnings of subsidiaries and branches where it is expected that the earnings of the subsidiary or branch will not be distributed in the foreseeable
future. The Company offsets current tax assets and current tax liabilities, where it has a legally enforceable right to set off the recognized amounts and where it intends either to
settle on a net basis, or to realize the asset and settle the liability simultaneously. Tax benefits of deductions earned on exercise of employee share options in excess of
compensation charged to income are credited to share premium.
Three months ended March 31, Year ended March 31,

2.15 REVENUE FROM OPERATIONS
Revenue from operations for the year ended March 31, 2018 and March 31, 2017 is as follows: (In ` crore)
Particulars
2018 2017 2018 2017
Revenue from software services 15,971 14,910 61,910 59,257
Revenue from software products 13 10 31 32
15,984 14,920 61,941 59,289
2.16 OTHER INCOME, NET
2.16.1 Other income - Accounting Policy
Year ended March 31,Three months ended March 31,
Accounting Policy
The Company derives revenues primarily from software development and related services and from the licensing of software products. Arrangements with customers
for software related services are mainly either on a fixed-price, fixed-timeframe or on a time-and-material basis.
The Company presents revenues net of indirect taxes in its Statement of Profit and Loss.
Revenue on time-and-material contracts are recognized as the related services are performed and revenue from the end of the last billing to the Balance Sheet date is
recognized as unbilled revenues. Revenue from fixed-price, fixed-timeframe contracts, where there is no uncertainty as to measurement or collectability of
consideration, is recognized as per the percentage-of-completion method. When there is uncertainty as to measurement or ultimate collectability, revenue recognition
is postponed until such uncertainty is resolved. Efforts or costs expended have been used to measure progress towards completion as there is a direct relationship
between input and productivity. Provisions for estimated losses, if any, on uncompleted contracts are recorded in the period in which such losses become probable
based on the current contract estimates. Costs and earnings in excess of billings are classified as unbilled revenue while billings in excess of costs and earnings are
classified as unearned revenue. Deferred contract costs are amortized over the term of the contract. Maintenance revenue is recognized rateably over the term of the
underlying maintenance arrangement.
In arrangements for software development and related services and maintenance services, the Company has applied the guidance in Ind AS 18, Revenue, by applying
the revenue recognition criteria for each separately identifiable component of a single transaction. The arrangements generally meet the criteria for considering
software development and related services as separately identifiable components. For allocating the consideration, the Company has measured the revenue in respect
of each separable component of a transaction at its fair value, in accordance with principles given in Ind AS 18. The price that is regularly charged for an item when
sold separately is the best evidence of its fair value. In cases where the Company is unable to establish objective and reliable evidence of fair value for the software
development and related services, the Company has used a residual method to allocate the arrangement consideration. In these cases, the balance of the consideration,
after allocating the fair values of undelivered components of a transaction, has been allocated to the delivered components for which specific fair values do not exist.
License fee revenues are recognized when the general revenue recognition criteria given in Ind AS 18 are met. Arrangements to deliver software products generally
have three elements: license, implementation and Annual Technical Services (ATS). The Company has applied the principles given in Ind AS 18 to account for
revenues from these multiple element arrangements. Objective and reliable evidence of fair value has been established for ATS. Objective and reliable evidence of
fair value is the price charged when the element is sold separately. When other services are provided in conjunction with the licensing arrangement and objective and
reliable evidence of their fair values have been established, the revenue from such contracts are allocated to each component of the contract in a manner, whereby
revenue is deferred for the undelivered services and the residual amounts are recognized as revenue for delivered elements. In the absence of objective and reliable
evidence of fair value for implementation, the entire arrangement fee for license and implementation is recognized using the percentage-of-completion method as the
implementation is performed. Revenue from client training, support and other services arising due to the sale of software products is recognized as the services are
performed. ATS revenue is recognized rateably over the period in which the services are rendered.
Advances received for services and products are reported as client deposits until all conditions for revenue recognition are met.
The Company accounts for volume discounts and pricing incentives to customers as a reduction of revenue based on the ratable allocation of the discounts/ incentives
amount to each of the underlying revenue transaction that results in progress by the customer towards earning the discount/ incentive. Also, when the level of discount
varies with increases in levels of revenue transactions, the Company recognizes the liability based on its estimate of the customer's future purchases. If it is probable
that the criteria for the discount will not be met, or if the amount thereof cannot be estimated reliably, then discount is not recognized until the payment is probable
and the amount can be estimated reliably. The Company recognizes changes in the estimated amount of obligations for discounts in the period in which the change
occurs. The discounts are passed on to the customer either as direct payments or as a reduction of payments due from the customer.
Other income is comprised primarily of interest income, dividend income, gain / loss on investments and exchange gain/loss on forward and options contracts and on
translation of other assets and liabilities. Interest income is recognized using the effective interest method. Dividend income is recognized when the right to receive
payment is established.
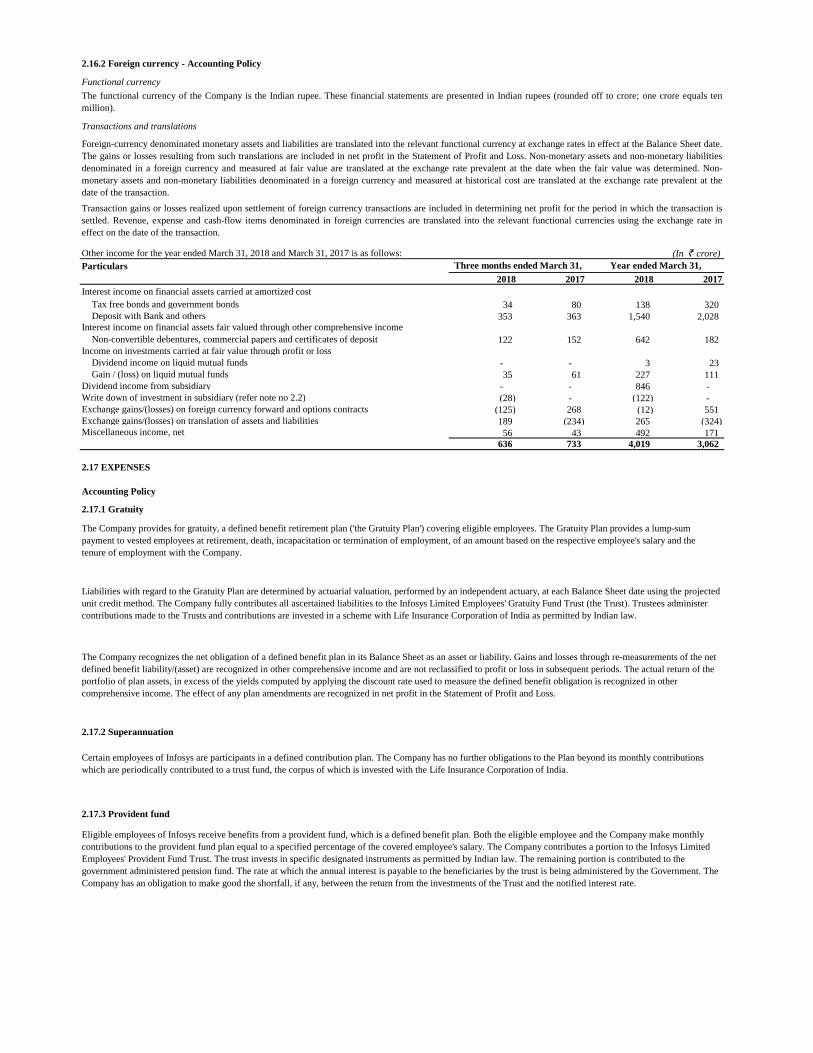
Other income for the year ended March 31, 2018 and March 31, 2017 is as follows: (In ` crore)
Particulars
2018 2017 2018 2017
Interest income on financial assets carried at amortized cost
Tax free bonds and government bonds 34 80 138 320
Deposit with Bank and others 353 363 1,540 2,028
Non-convertible debentures, commercial papers and certificates of deposit 122 152 642 182
Income on investments carried at fair value through profit or loss
Dividend income on liquid mutual funds - - 3 23
Gain / (loss) on liquid mutual funds 35 61 227 111
Dividend income from subsidiary - - 846 -
Write down of investment in subsidiary (refer note no 2.2) (28) - (122) -
Exchange gains/(losses) on foreign currency forward and options contracts (125) 268 (12) 551
Exchange gains/(losses) on translation of assets and liabilities 189 (234) 265 (324)
56 43 492 171
636 733 4,019 3,062
2.17 EXPENSES
Accounting Policy
Miscellaneous income, net
Year ended March 31,
Interest income on financial assets fair valued through other comprehensive income
Three months ended March 31,
2.17.1 Gratuity
The Company provides for gratuity, a defined benefit retirement plan ('the Gratuity Plan') covering eligible employees. The Gratuity Plan provides a lump-sum
payment to vested employees at retirement, death, incapacitation or termination of employment, of an amount based on the respective employee's salary and the
tenure of employment with the Company.
2.16.2 Foreign currency - Accounting Policy
Functional currency
Foreign-currency denominated monetary assets and liabilities are translated into the relevant functional currency at exchange rates in effect at the Balance Sheet date.
The gains or losses resulting from such translations are included in net profit in the Statement of Profit and Loss. Non-monetary assets and non-monetary liabilities
denominated in a foreign currency and measured at fair value are translated at the exchange rate prevalent at the date when the fair value was determined. Non-
monetary assets and non-monetary liabilities denominated in a foreign currency and measured at historical cost are translated at the exchange rate prevalent at the
date of the transaction.
Transactions and translations
The functional currency of the Company is the Indian rupee. These financial statements are presented in Indian rupees (rounded off to crore; one crore equals ten
million).
Transaction gains or losses realized upon settlement of foreign currency transactions are included in determining net profit for the period in which the transaction is
settled. Revenue, expense and cash-flow items denominated in foreign currencies are translated into the relevant functional currencies using the exchange rate in
effect on the date of the transaction.
2.17.2 Superannuation
Liabilities with regard to the Gratuity Plan are determined by actuarial valuation, performed by an independent actuary, at each Balance Sheet date using the projected
unit credit method. The Company fully contributes all ascertained liabilities to the Infosys Limited Employees' Gratuity Fund Trust (the Trust). Trustees administer
contributions made to the Trusts and contributions are invested in a scheme with Life Insurance Corporation of India as permitted by Indian law.
The Company recognizes the net obligation of a defined benefit plan in its Balance Sheet as an asset or liability. Gains and losses through re-measurements of the net
defined benefit liability/(asset) are recognized in other comprehensive income and are not reclassified to profit or loss in subsequent periods. The actual return of the
portfolio of plan assets, in excess of the yields computed by applying the discount rate used to measure the defined benefit obligation is recognized in other
comprehensive income. The effect of any plan amendments are recognized in net profit in the Statement of Profit and Loss.
Certain employees of Infosys are participants in a defined contribution plan. The Company has no further obligations to the Plan beyond its monthly contributions
which are periodically contributed to a trust fund, the corpus of which is invested with the Life Insurance Corporation of India.
Eligible employees of Infosys receive benefits from a provident fund, which is a defined benefit plan. Both the eligible employee and the Company make monthly
contributions to the provident fund plan equal to a specified percentage of the covered employee's salary. The Company contributes a portion to the Infosys Limited
Employees' Provident Fund Trust. The trust invests in specific designated instruments as permitted by Indian law. The remaining portion is contributed to the
government administered pension fund. The rate at which the annual interest is payable to the beneficiaries by the trust is being administered by the Government. The
Company has an obligation to make good the shortfall, if any, between the return from the investments of the Trust and the notified interest rate.
2.17.3 Provident fund

(In ` crore)
Particulars
2018 2017 2018 2017
Employee benefit expenses
Salaries including bonus 8,185 7,441 31,618 30,111
Contribution to provident and other funds 179 160 695 640
Share based payments to employees (Refer note no. 2.9) 23 40 72 107
Staff welfare 31 26 87 86
8,418 7,667 32,472 30,944
Cost of software packages and others
For own use 195 199 774 729
Third party items bought for service delivery to clients 125 142 496 506
320 341 1,270 1,235
Other expenses
Power and fuel 39 35 162 180
Brand and Marketing 58 63 247 276
Operating lease payments 77 87 328 284
Rates and taxes (12) 24 116 118
Repairs and Maintenance 227 291 902 1,073
Consumables 6 7 22 31
Insurance 13 14 47 45
Provision for post-sales client support 48 15 127 84
Commission to non-whole time directors 2 2 9 9
Impairment loss recognized / (reversed) on financial assets (21) 62 24 140
Auditor's remuneration
Statutory audit fees - 1 3 2
Tax matters 1 - 1 -
Reimbursement of expenses - - - -
Contributions towards Corporate Social Responsibility 17 38 142 215
(26) 2 54 89
429 641 2,184 2,546
Three months ended March 31, Year ended March 31,
The Company has a policy on compensated absences which are both accumulating and non-accumulating in nature. The expected cost of accumulating compensated
absences is determined by actuarial valuation performed by an independent actuary at each Balance Sheet date using projected unit credit method on the additional
amount expected to be paid/availed as a result of the unused entitlement that has accumulated at the Balance Sheet date. Expense on non-accumulating compensated
absences is recognized in the period in which the absences occur.
2.17.4 Compensated absences
Others

2.18 RECONCILIATION OF BASIC AND DILUTED SHARES USED IN COMPUTING EARNING PER SHARE
Particulars
2018 2017 2018 2017
2,18,40,80,668 2,29,69,44,664 2,26,63,43,802 2,29,69,44,664
Effect of dilutive common equivalent shares - share options outstanding 5,61,626 3,44,772 10,48,819 2,15,006
2,18,46,42,294 2,29,72,89,436 2,26,73,92,621 2,29,71,59,670
2.19 CONTINGENT LIABILITIES AND COMMITMENTS
(In ` crore)
Particulars
March 31, 2018 March 31, 2017
Contingent liabilities :
Claims against the Company, not acknowledged as debts(1) 4,627 6,596
Commitments :
Estimated amount of contracts remaining to be executed on capital contracts and not provided for 1,405 1,094
(net of advances and deposits)
Other Commitments* 36 37
*Uncalled capital pertaining to investments
Accounting Policy
Basic earnings per equity share is computed by dividing the net profit attributable to the equity holders of the Company by the weighted average number of equity shares
outstanding during the period. Diluted earnings per equity share is computed by dividing the net profit attributable to the equity holders of the Company by the weighted
average number of equity shares considered for deriving basic earnings per equity share and also the weighted average number of equity shares that could have been issued
upon conversion of all dilutive potential equity shares. The dilutive potential equity shares are adjusted for the proceeds receivable had the equity shares been actually issued at
fair value (i.e. the average market value of the outstanding equity shares). Dilutive potential equity shares are deemed converted as at the beginning of the period, unless issued
at a later date. Dilutive potential equity shares are determined independently for each period presented.
The number of equity shares and potentially dilutive equity shares are adjusted retrospectively for all periods presented for any share splits and bonus shares issues including
for changes effected prior to the approval of the financial statements by the Board of Directors.
The following is a reconciliation of the equity shares used in the computation of basic and diluted earnings per equity share:
Year ended March 31,
Basic earnings per equity share - weighted average number of equity shares
outstanding
Diluted earnings per equity share - weighted average number of equity shares
and common equivalent shares outstanding
The Company is subject to legal proceedings and claims, which have arisen in the ordinary course of business. The Company’s management does not reasonably expect that
these legal actions, when ultimately concluded and determined, will have a material and adverse effect on the Company’s results of operations or financial condition.
For the three months and year ended March 31, 2018 number of options to purchase equity shares that had an anti-dilutive effect are 574 and 27,876 respectively. For the three
months and year ended March 31, 2017 1,79,926 and 77,942 number of options to purchase equity shares had an anti-dilutive effect.
Three months ended March 31,
[Amount paid to statutory authorities `6,486 crore (` 4,694 crore )]
(1)As at March 31, 2018, claims against the company not acknowledged as debts in respect of income tax matters amounted to `4,461crore. These matters are pending before
various Appellate Authorities and the management including its tax advisors expect that its position will likely be upheld on ultimate resolution and will not have a material
adverse effect on the Company's financial position and results of operations.
Income tax claims amounting to `4,670 crore has not been considered as claims not acknowledged as debt because the Company has received favourable decisions on similar
claims and therefore based on its assessment , is of the view that any liability resulting from these claims is remote and will not sustain on ultimate resolution.
Amount paid to statutory authorities against the above tax claims amounted to `6,475 crore.
As at
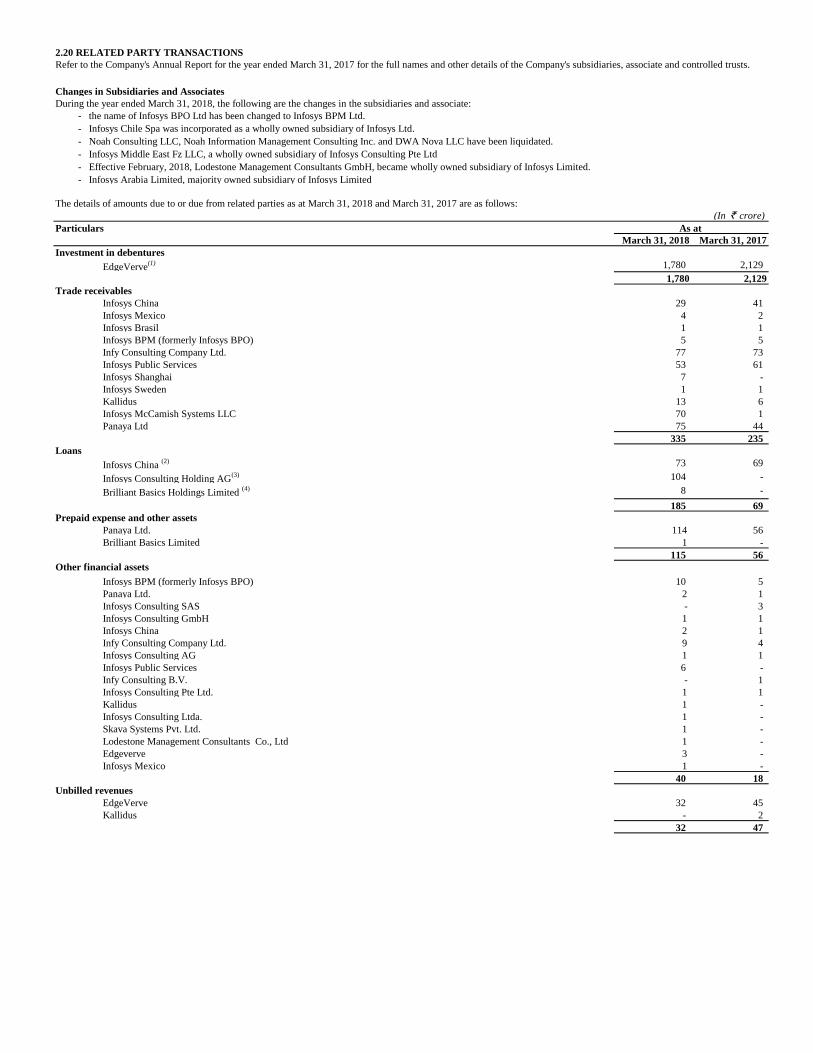
2.20 RELATED PARTY TRANSACTIONS
Changes in Subsidiaries and Associates
During the year ended March 31, 2018, the following are the changes in the subsidiaries and associate:
(In ` crore)
Particulars
March 31, 2018 March 31, 2017
EdgeVerve(1) 1,780 2,129
1,780 2,129
Infosys China 29 41
Infosys Mexico 4 2
Infosys Brasil 1 1
Infosys BPM (formerly Infosys BPO) 5 5
Infy Consulting Company Ltd. 77 73
Infosys Public Services 53 61
Infosys Shanghai 7 -
Infosys Sweden 1 1
Kallidus 13 6
Infosys McCamish Systems LLC 70 1
Panaya Ltd 75 44
335 235
Infosys China (2) 73 69
Infosys Consulting Holding AG(3) 104 -
Brilliant Basics Holdings Limited (4) 8 -
185 69
Panaya Ltd. 114 56
Brilliant Basics Limited 1 -
115 56
Infosys BPM (formerly Infosys BPO) 10 5
Panaya Ltd. 2 1
Infosys Consulting SAS - 3
Infosys Consulting GmbH 1 1
Infosys China 2 1
Infy Consulting Company Ltd. 9 4
Infosys Consulting AG 1 1
Infosys Public Services 6 -
Infy Consulting B.V. - 1
Infosys Consulting Pte Ltd. 1 1
Kallidus 1 -
Infosys Consulting Ltda. 1 -
Skava Systems Pvt. Ltd. 1 -
Lodestone Management Consultants Co., Ltd 1 -
Edgeverve 3 -
Infosys Mexico 1 -
40 18
EdgeVerve 32 45
Kallidus - 2
32 47
Investment in debentures
Trade receivables
Loans
Other financial assets
Unbilled revenues
As at
The details of amounts due to or due from related parties as at March 31, 2018 and March 31, 2017 are as follows:
- the name of Infosys BPO Ltd has been changed to Infosys BPM Ltd.
- Infosys Chile Spa was incorporated as a wholly owned subsidiary of Infosys Ltd.
- Noah Consulting LLC, Noah Information Management Consulting Inc. and DWA Nova LLC have been liquidated.
- Infosys Middle East Fz LLC, a wholly owned subsidiary of Infosys Consulting Pte Ltd
- Effective February, 2018, Lodestone Management Consultants GmbH, became wholly owned subsidiary of Infosys Limited.
- Infosys Arabia Limited, majority owned subsidiary of Infosys Limited
Prepaid expense and other assets
Refer to the Company's Annual Report for the year ended March 31, 2017 for the full names and other details of the Company's subsidiaries, associate and controlled trusts.
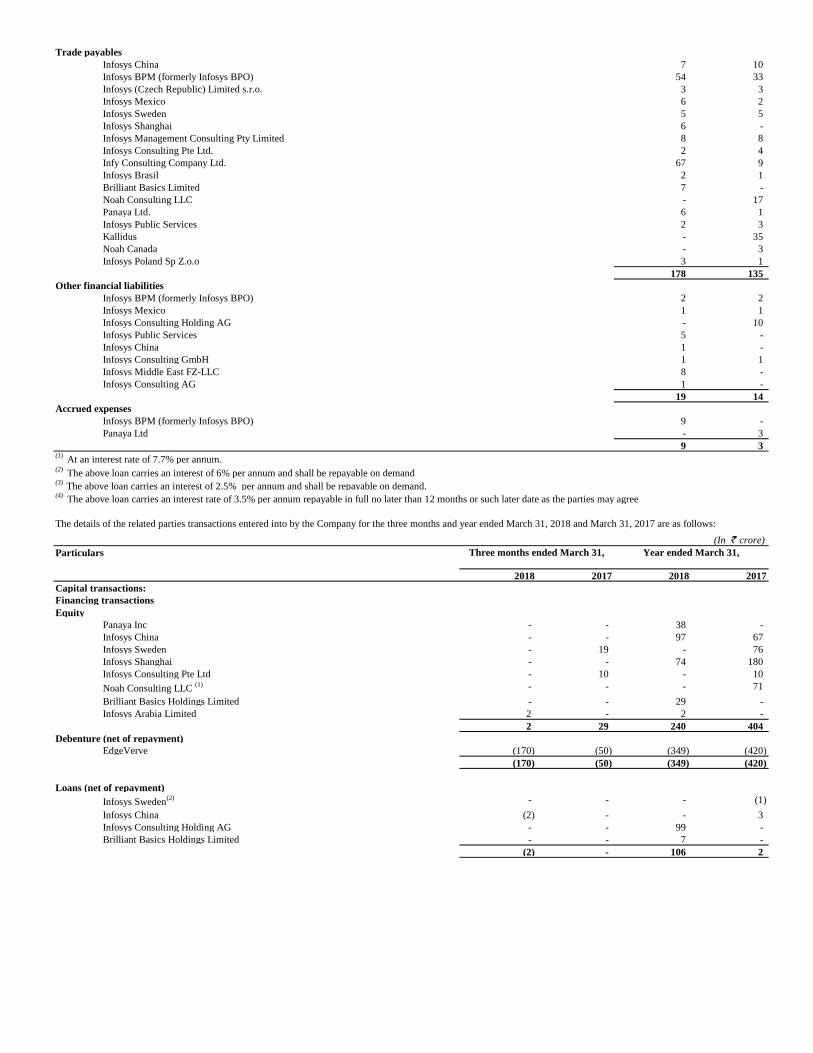
Infosys China 7 10
Infosys BPM (formerly Infosys BPO) 54 33
Infosys (Czech Republic) Limited s.r.o. 3 3
Infosys Mexico 6 2
Infosys Sweden 5 5
Infosys Shanghai 6 -
8 8
Infosys Consulting Pte Ltd. 2 4
Infy Consulting Company Ltd. 67 9
Infosys Brasil 2 1
Brilliant Basics Limited 7 -
Noah Consulting LLC - 17
Panaya Ltd. 6 1
Infosys Public Services 2 3
Kallidus - 35
Noah Canada - 3
Infosys Poland Sp Z.o.o 3 1
178 135
Infosys BPM (formerly Infosys BPO) 2 2
Infosys Mexico 1 1
Infosys Consulting Holding AG - 10
Infosys Public Services 5 -
Infosys China 1 -
Infosys Consulting GmbH 1 1
Infosys Middle East FZ-LLC 8 -
Infosys Consulting AG 1 -
19 14
Infosys BPM (formerly Infosys BPO) 9 -
Panaya Ltd - 3
9 3 (1)
At an interest rate of 7.7% per annum.(2)
The above loan carries an interest of 6% per annum and shall be repayable on demand(3)
The above loan carries an interest of 2.5% per annum and shall be repayable on demand.(4)
The above loan carries an interest rate of 3.5% per annum repayable in full no later than 12 months or such later date as the parties may agree
(In ` crore)
Particulars
2018 2017 2018 2017
Capital transactions:
Equity
Panaya Inc - - 38 -
Infosys China - - 97 67
Infosys Sweden - 19 - 76
Infosys Shanghai - - 74 180
Infosys Consulting Pte Ltd - 10 - 10
Noah Consulting LLC (1) - - - 71
Brilliant Basics Holdings Limited - - 29 -
Infosys Arabia Limited 2 - 2 -
2 29 240 404
Debenture (net of repayment)
EdgeVerve (170) (50) (349) (420)
(170) (50) (349) (420)
Loans (net of repayment)
Infosys Sweden(2) - - - (1)
Infosys China (2) - - 3
Infosys Consulting Holding AG - - 99 -
Brilliant Basics Holdings Limited - - 7 -
(2) - 106 2
Other financial liabilities
Financing transactions
Year ended March 31,Three months ended March 31,
Trade payables
The details of the related parties transactions entered into by the Company for the three months and year ended March 31, 2018 and March 31, 2017 are as follows:
Infosys Management Consulting Pty Limited
Accrued expenses

Revenue transactions:
Purchase of services
Infosys China 20 30 88 120
Infosys Management Consulting Pty Limited 22 30 99 125
Infy Consulting Company Limited 189 153 729 697
Infosys Consulting Pte Ltd. 7 13 41 36
Portland Group Pty Ltd - 1 9 3
Infosys (Czech Republic) Limited s.r.o. 11 8 40 31
Infosys BPM (formerly Infosys BPO) 137 104 502 391
Infosys Sweden 14 16 56 72
Infosys Shanghai 20 - 65 -
Infosys Mexico 9 5 27 22
Infosys Public Services 4 7 22 22
Panaya Ltd. 21 15 84 50
Infosys Brasil 3 3 13 8
Infosys Poland Sp Z.o.o 6 1 14 4
Kallidus (4) 43 7 75
Noah Consulting, LLC - 46 91 135
McCamish Systems LLC 1 - 3 -
Brilliant Basics Limited 18 - 24 -
Noah Canada - 1 2 4
Infosys Middle East FZ-LLC 22 - 22 -
500 476 1,938 1,795
Panaya Ltd. - - - 2
Infosys BPM (formerly Infosys BPO) 7 2 21 19
Infosys Mexico - - 2 -
Brilliant Basics Limited 1 - 1 -
Kallidus Inc 4 - 4 -
Infosys Consulting AG 1 - 1 -
13 2 29 21
Interest income
Infosys China 1 1 4 4
Infosys Consulting Holding AG 1 - 2 -
Infosys Sweden - - - 1
EdgeVerve 36 45 156 197
38 46 162 202
Dividend income
Infosys BPM (formerly Infosys BPO) - - 846 -
- - 846 -
Sale of services
Infosys China 7 4 27 15
Infosys Mexico 6 8 22 31
Infy Consulting Company Limited 10 10 40 75
Infosys Brasil 1 4 5 12
Infosys BPM (formerly Infosys BPO) 19 16 70 58
McCamish Systems LLC 37 1 113 1
Infosys Sweden 2 5 11 17
Infosys Shanghai 3 - 7 -
EdgeVerve 104 97 407 303
Kallidus Inc - 6 2 6
Infosys Public Services 153 178 628 893
342 329 1,332 1,411
Sale of shared services including facilities and personnel
EdgeVerve 10 10 40 40
Panaya Ltd. 12 10 48 32
Infy Consulting Company Limited - 2 3 3
Infy Consulting B.V - 1 1 1
Infosys BPM (formerly Infosys BPO) 19 8 67 46
Infosys Public Services - - 2 1
Infosys Consulting SAS 1 2 1 2
42 33 162 125
(2) Loan outstanding (including accrued interest) given to Infosys Sweden is converted to equity during the year ended March 31, 2017.
Purchase of shared services including facilities and personnel
(1) Refer Note 2.2

Changes in Key Management personnel
Transactions with key management personnel
The table below describes the compensation to key managerial personnel which comprise directors and executive officers:
(In ` crore)
Particulars
2018 2017 2018 2017
19 18 48 84
Commission and other benefits to non-executive/independent directors 2 3 10 10
Total 21 21 58 94
(1)On December 2, 2017, the Board appointed Salil Parekh as the Chief Executive Officer and Managing Director of the Company with effect from January 2, 2018. The
appointment is for a term of 5 years with effect from January 2, 2018 to January 1, 2023 and the remuneration is approved by shareholders through postal ballot dated
February 20, 2018.
(2)Total employee stock compensation expense for the three months and year ended March 31, 2018 includes a charge of ` 1 crore and a reversal of ` 13 crore, respectively
towards key managerial personnel. For the three months and year ended March 31, 2017, an employee stock compensation expense of ` 12 crore and ` 36 crore,
respectively, was recorded towards key managerial personnel.(Refer to note 2.9)
Salaries and other employee benefits to whole-time directors and executive officers (1)(2)(3)(4)
(4) Includes ` 6 crore payable under severance agreement to David Kennedy, General counsel and Chief compliance officer during the year ended March 31, 2017.
The following were the changes in key management personnel:-
• Salil Parekh appointed as Chief Executive Officer and Managing Director effective January 2, 2018. The appointment is for a term of 5 years with effect from January 2, 2018
to January 1, 2023 and the remuneration is approved by shareholders through postal ballot dated February 20, 2018
• U. B. Pravin Rao, Chief Operating officer appointed as Interim-Chief Executive Officer and Managing Director effective August 18, 2017. Subsequently he stepped down as
the interim CEO and Managing Director effective January 2, 2018 and will continue as Chief Operating Officer and a whole-time director of the Company.
• Nandan M. Nilekani appointed as Non-Executive, Non-Independent Chairman effective August 24, 2017
• D. Sundaram appointed as Independent director effective July 14, 2017
• R. Seshasayee, Chairman, resigned effective August 24, 2017
• Ravi Venkatesan, resigned from his position as Co-Chairman effective August 24, 2017
• Prof. Jeffrey Lehman, Independent director resigned effective August 24, 2017
• Prof. John Etchemendy, Independent director resigned effective August 24, 2017
• Dr. Vishal Sikka, resigned as Chief Executive Officer and Managing Director effective August 18, 2017 and as Executive Vice Chairman effective August 24, 2017
• Sandeep Dadlani, President, resigned effective July 14, 2017
• Inderpreet Sawhney, Group General Counsel and Chief Compliance Officer, appointed as Executive Officer effective July 14, 2017
• Rajesh K. Murthy, President, resigned effective January 31, 2018
• Gopi Krishnan Radhakrishnan, Acting General Counsel, resigned effective June 24, 2017
(3)Iincludes a reversal of stock compensation cost of ` 35 crore for the year ended March 31, 2018 towards forfeiture of stock incentives granted to Dr. Vishal Sikka upon
his resignation. (Refer to note 2.9)
Year ended March 31,Three months ended March 31,

2.21 SEGMENT REPORTING
Business segments
Three months ended March 31, 2018 and March 31, 2017
(In ` crore)
Particulars FS MFG ECS RCL HILIFE Hi-tech All other
segments
Total
Revenue from operations 4,012 1,666 4,106 2,617 2,046 1,239 298 15,984
3,924 1,566 3,630 2,503 1,860 1,157 280 14,920
Identifiable operating expenses 2,162 924 2,117 1,300 1,025 656 140 8,324
2,068 810 1,813 1,270 933 629 175 7,698
Allocated expenses 736 309 761 485 379 230 56 2,956
741 298 691 476 354 220 53 2,833
Segment operating income 1,114 433 1,228 832 642 353 102 4,704
1,115 458 1,126 757 573 308 52 4,389
Unallocable expenses 361
339
Operating profit 4,343
4,050
Impairment loss on assets held for sale (refer note no 2.22) 589
-
Other income, net 636
733
Profit before tax 4,390
4,783
Tax expense 1,233
1,221
Profit for the period 3,157
3,562
Depreciation and amortization expense 363
336
Non-cash expenses other than depreciation and amortization 615
3
Ind AS 108 establishes standards for the way that public business enterprises report information about operating segments and related
disclosures about products and services, geographic areas, and major customers. The Company's operations predominantly relate to
providing end-to-end business solutions to enable clients to enhance business performance. Based on the 'management approach' as defined
in Ind AS 108, the Chief Operating Decision Maker (CODM) evaluates the Company's performance and allocates resources based on an
analysis of various performance indicators by business segments and geographic segments. Accordingly, information has been presented
both along business segments and geographic segments. The accounting principles used in the preparation of the financial statements are
consistently applied to record revenue and expenditure in individual segments, and are as set out in the significant accounting policies.
Business segments of the Company are primarily enterprises in Financial Services (FS), enterprises in Manufacturing (MFG), enterprises in
Retail, Consumer packaged goods and Logistics (RCL), enterprises in the Energy & utilities, Communication and Services (ECS),
enterprises in Hi-tech (Hi-tech), enterprises in Life Sciences, Healthcare and Insurance (HILIFE) and all other segments. The FS reportable
segments has been aggregated to include the Financial Services operating segment and the Finacle operating segment because of the
similarity of the economic characteristics. All other segments represents the operating segments of businesses in India, Japan and China.
Geographic segmentation is based on business sourced from that geographic region and delivered from both on-site and off-shore locations.
North America comprises the United States of America, Canada and Mexico, Europe includes continental Europe (both the east and the
west), Ireland and the United Kingdom, and the Rest of the World comprising all other places except those mentioned above and India.
Revenue and identifiable operating expenses in relation to segments are categorized based on items that are individually identifiable to that
segment. Revenue for “all other segments” represents revenue generated from customers located in India, Japan and China. Allocated
expenses of segments include expenses incurred for rendering services from the Company's offshore software development centres and on-
site expenses, which are categorized in relation to the associated turnover of the segment. Certain expenses such as depreciation, which form
a significant component of total expenses, are not specifically allocable to specific segments as the underlying assets are used
interchangeably. The management believes that it is not practical to provide segment disclosures relating to those costs and expenses, and
accordingly these expenses are separately disclosed as "unallocated" and adjusted against the total income of the Company.
Assets and liabilities used in the Company's business are not identified to any of the reportable segments, as these are used interchangeably
between segments. Management believes that it is currently not practicable to provide segment disclosures relating to total assets and
liabilities since a meaningful segregation of the available data is onerous.
Geographical information on revenue and business segment revenue information is collated based on individual customers invoiced or in
relation to which the revenue is otherwise recognized.

Geographic segmentsThree months ended March 31, 2018 and March 31, 2017
(In ` crore)
Particulars North
America
Europe India Rest of the
World
Total
Revenue from operations 9,854 3,894 434 1,802 15,984
9,753 3,207 455 1,505 14,920
Identifiable operating expenses 5,221 2,088 140 875 8,324
5,158 1,663 184 693 7,698
Allocated expenses 1,825 721 80 330 2,956
1,855 610 85 283 2,833
Segment operating income 2,808 1,085 214 597 4,704
2,740 934 186 529 4,389
Unallocable expenses 361
339
Operating profit 4,343
4,050
Impairment loss on assets held for sale (refer note no 2.22) 589
-
Other income, net 636
733
Profit before tax 4,390
4,783
Tax expense 1,233
1,221
Profit for the period 3,157
3,562
Depreciation and amortization expense 363
336
Non-cash expenses other than depreciation and amortization 615
3
Business segments
Year ended March 31, 2018 and March 31, 2017
Particulars FS MFG ECS RCL HILIFE Hi-tech All other
segments
Total
Revenue from operations 15,860 6,485 15,457 10,247 7,825 4,782 1,285 61,941
15,735 6,086 13,999 10,280 7,065 4,901 1,223 59,289
Identifiable operating expenses 8,628 3,523 7,957 5,118 3,946 2,582 659 32,413
8,408 3,136 6,931 5,127 3,607 2,595 788 30,592
Allocated expenses 2,964 1,221 2,909 1,929 1,474 901 242 11,640
3,036 1,180 2,713 1,994 1,369 952 236 11,480
Segment operating income 4,268 1,741 4,591 3,200 2,405 1,299 384 17,888
4,291 1,770 4,355 3,159 2,089 1,354 199 17,217
Unallocable expenses 1,410
1,341
Operating profit 16,478
15,876
Impairment loss on assets held for sale (refer note no 2.22) 589
-
Other income, net 4,019
3,062
Profit before tax 19,908
18,938
Tax expense 3,753
5,120
Profit for the period 16,155
13,818
Depreciation and amortization expense 1,408
1,331
Non-cash expenses other than depreciation and amortization 713
10

Geographic segments
Year ended March 31, 2018 and March 31, 2017
(In ` crore)
Particulars North
America
Europe India Rest of the
World
Total
Revenue from operations 38,984 14,426 1,861 6,670 61,941
38,578 13,019 1,798 5,894 59,289
Identifiable operating expenses 20,761 7,702 649 3,301 32,413
20,337 6,664 786 2,805 30,592
Allocated expenses 7,339 2,713 348 1,240 11,640
7,479 2,523 345 1,133 11,480
Segment operating income 10,884 4,011 864 2,129 17,888
10,762 3,832 667 1,956 17,217
Unallocable expenses 1,410
1,341
Operating profit 16,478
15,876
Impairment loss on assets held for sale (refer note no 2.22) 589
-
Other income, net 4,019
3,062
Profit before tax 19,908
18,938
Tax expense 3,753
5,120
Profit for the period 16,155
13,818
Depreciation and amortization expense 1,408
1,331
Non-cash expenses other than depreciation and amortization 713
10
Significant clients
2.22 ASSETS HELD FOR SALE
Accounting policy
Non current assets and disposal groups are classified as held for sale if their carrying amount is intended to be recovered principally through
sale rather than through continuing use. The condition for classification of held for sale is met when the non current asset or the disposal
group is available for immediate sale and the same is highly probable of being completed within one year from the date of classification as
held for sale. Non current assets and disposal groups held for sale are measured at the lower of carrying amount and fair value less cost to
sell.
On conclusion of a strategic business review in the quarter ending March 31, 2018, the company evaluated its portfolio of businesses and
has planned for the sale of its investment in subsidiaries, Kallidus and Skava (together herein referred to as "Skava" ) and Panaya. The
company has initiated the sale process including identification and evaluation of potential buyers for the investment in the above
subsidiaries. The Company anticipates completion of the sale by March, 2019 and accordingly, the Company has reclassified the
investments in these subsidiaries amounting to `1,525 crore as "Assets held for sale". On such reclassification, these investments are
measured at the lower of carrying amount and fair value less cost to sell and accordingly, the Company has recognized an impairment loss of
`589 crore in respect of Panaya in the standalone books of Infosys Limited.
No client individually accounted for more than 10% of the revenues in the three months and year ended March 31, 2018 and March 31,
2017.
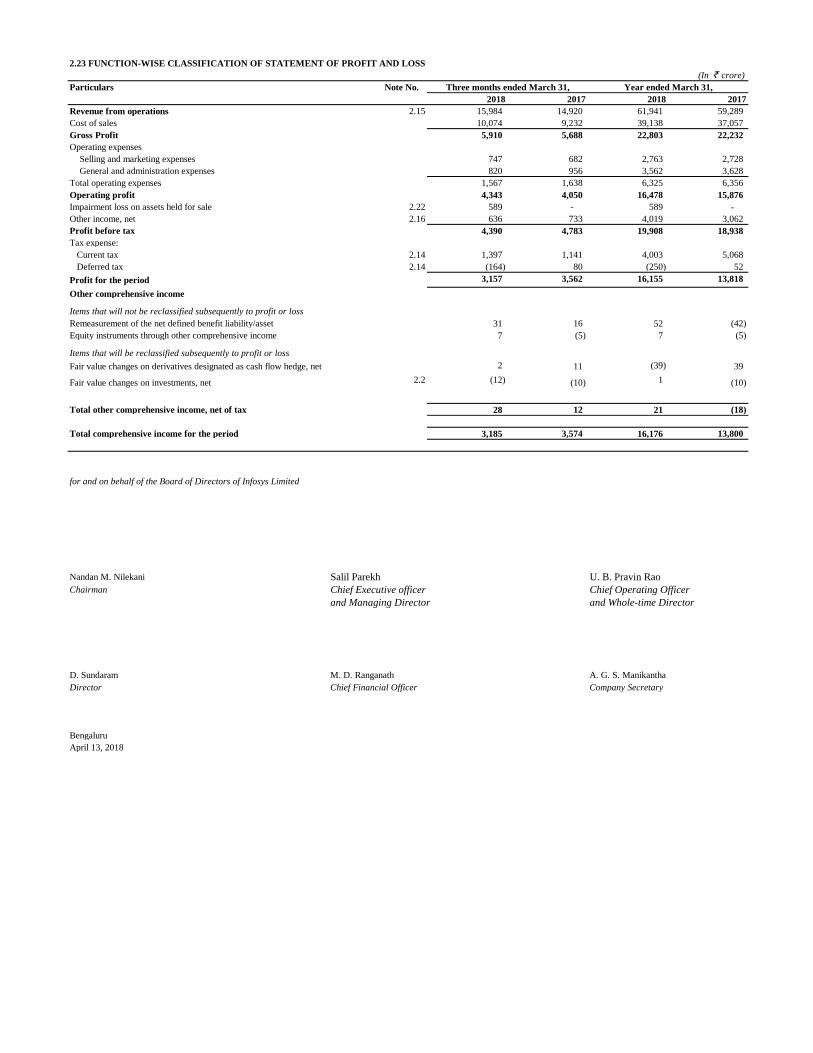
2.23 FUNCTION-WISE CLASSIFICATION OF STATEMENT OF PROFIT AND LOSS
(In ` crore)
Particulars Note No.
2018 2017 2018 2017
Revenue from operations 2.15 15,984 14,920 61,941 59,289
Cost of sales 10,074 9,232 39,138 37,057
Gross Profit 5,910 5,688 22,803 22,232
Operating expenses
Selling and marketing expenses 747 682 2,763 2,728
General and administration expenses 820 956 3,562 3,628
Total operating expenses 1,567 1,638 6,325 6,356
Operating profit 4,343 4,050 16,478 15,876
Impairment loss on assets held for sale 2.22 589 - 589 -
Other income, net 2.16 636 733 4,019 3,062
Profit before tax 4,390 4,783 19,908 18,938
Tax expense:
Current tax 2.14 1,397 1,141 4,003 5,068
Deferred tax 2.14 (164) 80 (250) 52
Profit for the period 3,157 3,562 16,155 13,818
Other comprehensive income
Items that will not be reclassified subsequently to profit or loss
Remeasurement of the net defined benefit liability/asset 31 16 52 (42)
Equity instruments through other comprehensive income 7 (5) 7 (5)
Items that will be reclassified subsequently to profit or loss
Fair value changes on derivatives designated as cash flow hedge, net 2 11 (39) 39
Fair value changes on investments, net 2.2 (12) (10) 1 (10)
Total other comprehensive income, net of tax 28 12 21 (18)
Total comprehensive income for the period 3,185 3,574 16,176 13,800
for and on behalf of the Board of Directors of Infosys Limited
Nandan M. Nilekani Salil Parekh U. B. Pravin Rao
Chairman Chief Executive officer Chief Operating Officer
and Managing Director and Whole-time Director
D. Sundaram M. D. Ranganath A. G. S. Manikantha
Director Chief Financial Officer Company Secretary
Bengaluru
April 13, 2018
Three months ended March 31, Year ended March 31,