INFORMES PORTAL MAYORES 130 - Envejecimiento...
30
INFORMES PORTAL MAYORES ISSN: 1885-6780 Econometric analysis of care homes sector in Catalonia Iñaki Villanueva MSc Dissertaon. Department of Economics, University of Essex [email protected] Abstract This paper is divided in two parts. The first part esmates the effect of a Spanish law for dependants care Ley de la dependencia (LdD) on the demand of care homes in Spain. To do so, an OLS model is applied to Google Insights data which is used as a proxy of the demand. Results show that LdD had a significant effect on the demand of care homes. The second part analyses the geographical distribuon of care homes and their beds on Catalonia municipalies. To do so, this paper uses negave-binomial and zero-inflated count models and considers socioeconomic, topographic and demographic measures as explanatory variables. Results show that populaon older than 84 years old, the proporon of men over women, metropolitan regions and altude have all a significant and posive effect on the supply of care homes and their beds. Keywords Dependants care, care homes, geographical distribuon, econometric analysis / Dependencia, centros residenciales, residencias de ancianos, distribución espacial, datos estadíscos, análisis econométrico Para citar este documento: VILLANUEVA, Iñaki (2012). “Econometric analysis of care homes sector in Catalonia”. Madrid, Informes Portal Mayores, nº 130. [Fecha de publicación: 29/02/2012]. <hp://www.imsersomayores.csic.es/documentos/documentos/villanueva-econometric-01.pdf> Febrero 2012 130 Antes de imprimir este informe, piensa bien si es necesario hacerlo. Una tonelada de papel implica la tala de 15 árboles. Ayúdanos a cuidar el medio ambiente.
Transcript of INFORMES PORTAL MAYORES 130 - Envejecimiento...
INFORMES PORTAL MAYORES
ISSN: 1885-6780
Econometric analysis of care homes sector in CataloniaIñaki VillanuevaMSc Dissertation. Department of Economics, University of Essex [email protected]
AbstractThis paper is divided in two parts. The first part estimates the effect of a Spanish law for dependants care Ley de la dependencia (LdD) on the demand of care homes in Spain. To do so, an OLS model is applied to Google Insights data which is used as a proxy of the demand. Results show that LdD had a significant effect on the demand of care homes. The second part analyses the geographical distribution of care homes and their beds on Catalonia municipalities. To do so, this paper uses negative-binomial and zero-inflated count models and considers socioeconomic, topographic and demographic measures as explanatory variables. Results show that population older than 84 years old, the proportion of men over women, metropolitan regions and altitude have all a significant and positive effect on the supply of care homes and their beds.
KeywordsDependants care, care homes, geographical distribution, econometric analysis / Dependencia, centros residenciales, residencias de ancianos, distribución espacial, datos estadísticos, análisis econométrico
Para citar este documento: VILLANUEVA, Iñaki (2012). “Econometric analysis of care homes sector in Catalonia”. Madrid, Informes Portal Mayores, nº 130. [Fecha de publicación: 29/02/2012]. <http://www.imsersomayores.csic.es/documentos/documentos/villanueva-econometric-01.pdf>
Febrero 2012130
Antes de imprimir este informe, piensa bien si es necesario hacerlo. Una tonelada de papel implica la tala de 15 árboles. Ayúdanos a cuidar el medio ambiente.

ww
w.im
sers
omay
ores
.csi
c.es
2
INFORMES PORTAL MAYORES Nº 130
Econometric analysis of care homes sector in Catalonia
Table of contents 1. Introduction.........................................................................................................................32. Time-series study of care homes demand...........................................................................3
2.1. Study justification.......................................................................................................32.2. Literature review.........................................................................................................42.3. Analysis and results.....................................................................................................6
3. Cross-section study of care homes location.........................................................................83.1. Study justification........................................................................................................83.2. Literature review..........................................................................................................93.3. Methodological framework........................................................................................103.4. Data and restrictions..................................................................................................123.5. Analysis and results....................................................................................................163.6. Two extra analysis......................................................................................................20
Conclusion ................................................................................................................................21References.................................................................................................................................23Table of variables.......................................................................................................................25Maps..........................................................................................................................................26
- List of tables and figures -Table 1. Results of OLS time-series regressions and Chow test................................................8Table 2. Explanatory variables effect on industrial location decisions......................................9Table 3. Descriptive statistics of cross-section variables.........................................................13Table 4. Cross-section regressions without robust standard errors........................................17Table 5. Cross-section regressions with robust standard errors..............................................18Table 6. Correlations of independent variables.......................................................................19Table 7. Coefficients and t-statistics of lagged disabled variable.............................................20Table 8. Coefficients and t-statistics of political party variable................................................21
Figure 1. Ratio of beds per population older than 64 in Spain and Catalonia...........................5Figure 2. Searches in Google Insights for Residencia de ancianos in Spain...............................7Figure 3. Histogram of beds per municipality (excluding zero observations)..........................15Figure 4. Histogram of care homes per municipality...............................................................15

ww
w.im
sers
omay
ores
.csi
c.es
3
INFORMES PORTAL MAYORES Nº 130
Econometric analysis of care homes sector in Catalonia
1. IntroductionInformal carers of dependants face many problems to look after them properly. Care homes for the elder people may solve those pro blem but the decision to move them to a care home is a process affected by many factors, such as friends and/or family readiness to help, economic costs, savings, level of disability, government benefits, etc. All in all, in this decision process, subjectivity and complexity are main factors. This paper tries to analyse how care homes sector has evolved recently and how it responds to geographic, socioeconomic and demographic factors in Spain and Catalonia.
The analysis of care homes in Spain and Catalonia is an interesting subject due to two main reasons. Firstly, the sector is getting more and more relevance economically because the increasing proportion of elder population and the consolidation of the region as an European retirement destination. Secondly, there is an important lack of analysis and proper study of the sector. Most of the studies available are merely descriptive without any deep analysis of how factors can affect the sector. An econometric analysis may enhance the understanding of the care homes sector.
This paper is divided in two parts. The first part shows that the Ley de la Dependencia (LdD) passed by Spanish Government at the end of 2006, a milestone in the sector, has had a statistically significant effect on the care homes sector in Spain. To do so, this first part carries out a timeseries analysis of the demand of care homes using an OLS model and getting data from Google Insights tool as a proxy of the demand. The second part of the paper shows that the geographic distribution of care homes and their number of beds in Catalonia does not depend on the geographic distribution of population older than 64, as many studies consider, but in other factors like population older than 84, ratio of men over women and geographic features of the care homes’ location like altitude and metropolitan areas. To do the analysis, crosssection regressions of the 946 municipalities of Catalonia are carried out. Given the nonnegative and discrete nature of the number of beds or care homes, negativebinomial
and zero-inflated count models are used.The paper is organized as follows: Section 2
carries out the timeseries study of the demand of care homes in Spain. Section 3 provides the crosssection study of the geographical distribution of care homes and their beds in Catalonia. Finally, Section 4 highlights the conclusions.
2. Time-series study of care homes demand
2.1.- Study justification
In December 2006 the Spanish Congress passed a law informally called Ley de la dependencia, Dependency Law in English (LdD). This law was designed to change the life of many dependants – people in need of assistance because of a physical or psychological disability – in Spain. Provision of dependants’ care was then called the fourth pillar of the welfare state (being the other three, health, education, and pensions). It was supposed to become a milestone on the sector. The Spanish Government’s budget attached to LdD was 12,600 million euros, for the period 20072015. Most of the beneficiaries of this regulation were and are aged persons, through direct subsidies or indirectly through the Government plan to increase the number of care services.
This law highlights the increasing importance of elderly in Catalonia and Spain. Spain has suffered a major demographic change in the last 30 years. In 1980 less than 10% of the population (3.7 millions) was above 65 years old (INE 2011). In 2000 Spain had 17% of its population over 64 years old (6.7 millions). At that time Spain was the fifth country in the world with higher rate of elderly. In 2010 there were already 7.4 million people of 65 years old and over, 18.5% of the total population. Still among the most aged countries in the world (U.S. Census Bureau, 2010).
Being among the most aged populations in the world is a problem, economically and socially. One indicator that can easily explain why it is worrying is the dependency ratio. Dependency ratio can be defined as population in working age, between 15 and 65 years old, divided by population of 65 and

ww
w.im
sers
omay
ores
.csi
c.es
4
INFORMES PORTAL MAYORES Nº 130
Econometric analysis of care homes sector in Catalonia
over. In this case we are excluding young people who usually are also included. Dependency ratio is a measure of how many people can pay aged pensions and necessities. Although in all developed country this ratio is decreasing, in Spain is doing it faster. In 2000 there were only 4 people in working age for each one retired, in 2010 they were 3.6. Again, Spain is the fifth country in the world with the worst ratio (U.S. Census Bureau, 2010).
Obviously, not all the aged need assistance or are dependant although is it true that the older a person becomes the more likely to be dependant. At the same time, not all dependants are aged. Unfortunately, children, teens and adults can also be dependants due to several sorts of reasons. The problem is that is easy to know how many people is older than 65 years old but it is difficult to calculate how many people is dependant. Usually, estimates are made simply by taking a proportion of old population. Other measures uses the number of request of assistance, however, not all the people uses public care systems. Moreover, dependency can not always be objectively measured (although LdD has tried to standardized measures) and even some people can pervert the system by including non dependants is if they were. If dependants can not be measured, the demand for care homes becomes harder to estimate. Even so, according to estimates, in 2008 there were two millions of dependent people in Spain (Abellán García, A., C. Esparza Catalán, and J. Pérez Díaz, 2011 ), that is around one in every four people over 65 is dependant. Not only is important to measure who is dependant but also who has the right to receive benefits and who has actually received them. On January 2011, 900,000 people in all Spain had the right to get benefits according to SAAD (Sistema para la Autonomía y Atención a la Dependencia). Half of those received services and the other half financial assistance (Imserso, 2011a).
As it can be seen in Spain and Catalonia both government and local authorities play an important role in the dependants care sector and specifically in care homes sector. Is it so, because care homes are considered a part of the provision for elderly care and welfare state. This role and regulation is justified by the aim of avoiding low quality service to already vulnerable people, both Spanish and Catalan governments set minimum
quality standards in many dimensions of the sector such as services, human resources, architectonic spaces, etc. The role of the government is necessary because it can reduce the asymmetric information otherwise present in a free market of care homes. First, public institutions can assess the dependency level of the elderly to help care homes to estimate the real costs of each dependant. Secondly, by assessing the care homes facilities they can certify minimum quality standards offered in each care home. This action may help dependants to match their own preferences and restriction to those services offered. This implies that public sector must have an important role in the sector.
These theoretical arguments, data and facts show the burden that Spain and Catalonia have, and the necessity to keep and enhance a public policy towards the elderly. That is also why LdD became such an important goal.
The care home sector is clearly one of the most important sectors of dependant care, but, how LdD affected the care home for the elderly or nursing homes in Spain? The increased public budget toward dependants should have had a direct positive effect on care homes’ accounts and should also have increased the supply of care homes. Is that true? These questions are going to be addressed in this first part of this paper.
2.2.- Literature review
In the Spanish case, the more recent study of care homes sector is a DBK report published in August 2011. Some newspapers published articles summarizing this report. According to a summary made by ElPais.com (ElPais, 2011), from 2005 until 2008 care homes’ beds grew at an average of 5% annually in Spain (no data for Catalonia was offered). However, the articles says, the 20092010 growth was just 1.6%. Plazas concer-tadas, that is, private beds paid by public sector, increased an 8.5%, whilst pure private beds decreased an 1.7% indicating, states the article, the recent crisis that the sector has being suffering.
Although a huge progress has occurred in the last 10 year, Spain and Catalonia are still lagged behind developed countries in some of the most common indicators used. For example,

ww
w.im
sers
omay
ores
.csi
c.es
5
INFORMES PORTAL MAYORES Nº 130
Econometric analysis of care homes sector in Catalonia
according to the data from “Llibre Blanc de la Dependencia” (Departament de Benestar Social, 2002), in 1999 there were 3.83 beds for every 100 people older than 64 years old in Catalonia, well below 5, the OECD average at that time. In 2001 the ratio increased to 4.1 beds and was stable at 4.1 until 2008. An estimate for 2011 for Catalonia, using data from Imserso SAAD care home database and population estimates from the statistical office of Catalonia (Idescat) showed that the ratio is nowadays around 4.3 beds per 100 people older than 64 years old.
Although, there have been many critics of the implementation and improvements of the LdD (see for example Barriga, 2010), the fact is, at least in Catalonia, that the provision of beds has significantly increased since LdD was applied in 2007. Doubts still remain though, Was this latter increase due to the LdD or another reason?
It should be clarify that international comparison using simplistic ratios are not a useful tool. Indeed, many factors affect country patterns and culture is one of the most influential. Traditionally, in many countries, overall southern Europe
Figure 1. Ratio of beds per population older than 64 in Spain and Catalonia
countries, most of the dependant burden fell on family members, so it could be expected to have lower beds per elderly in Mediterranean countries. However, throughout the world family size is decreasing, women are more involved in the workforce, divorce rates are higher and there is increased geographic mobility. Thus, even in countries with the strongest traditions of family responsibility, indicators such as beds of care
homes per older than 64 inhabitants should be increasing. On the other hand, preferences of the elderly themselves are the key aspect in many countries, and there is a strong wish of many elders to avoid institutional living (Bishop, 1999). A survey in Catalonia showed that more than 70% of the elderly prefer to stay at home (Departament de Benestar Social, 2002). New technologies and better systems of assistance can facilitate elders’
Source: Catalonia data is estimated using Imserso and Idescat data (except 1999 which comes from Dep. Benestar).
Spanish data comes from Imserso own estimations
ww
w.im
sers
omay
ores
.csi
c.es
6
INFORMES PORTAL MAYORES Nº 130
Econometric analysis of care homes sector in Catalonia
wishes and provide independence and care in the least restrictive setting. In such case it is likely to see ratio of beds per aged diminishing instead of increasing. In fact, that was the case in the United States, nursing home admissions were falling in the 1990's despite an increase of elder population ratios (Bishop, 1999).
In summary, the analysis of available number of beds is much more complex than taking a simplistic static ratio. Aged preferences may vary along time and region and other factors, like savings, can be as important as elder population in determining the number of beds available. In addition, the LdD has changed the rules of the game in Spain increasing sector’s budget (private and public) which should have had an effect on the number of beds available. However, the financial crisis in recent years may have had an opposite effect, increasing the difficulty to discern the effects. The following section is going to estimate if this LdD law has had a significant effect on the care home sector.
2.3.- Analysis and results
This section tries to answer the following question. Has the implementation of LdD significantly affected the sector?
As it was said in previous section, recent ana lysis (ElPais, 2011) showed that the supply of care homes has increased a lot in last decade, with an important exception in 20092010. However, it can not be known if that is the result of an increasing demand or not. Supply may have changed not only via quantity but also via price and quality. In that case, those latter changes would not be depicted by supply increases alone. Number of facilities is not a useful tool to estimate the demand of care homes. Nevertheless, there is still one way to estimate how the demand has evolved recently using Google Insights.A sound data source can be obtained by Google. Google offers a service called Google Insights that provides data on the number of times a word
or website has been searched for in Google. They provide this data per week and also per region. So if you want to know how many times “care homes” words have been searched in Google you can obtain that data by region and week since 2004. It is a very powerful tool. Many papers have used Google Insight to estimate different demand patterns with positive results. For example, in 2009 Torsten Schmidt and Simeon Vosen used Google Insight to estimate consumption in USA. Their results were that in almost all conducted insample and outofsample forecasting experiments, the Google indicator outperformed the surveybased indicators and therefore incorporating information from Google Insight may offer significant benefits to forecasters of private consumption (Schmidt et.al., 2009). Other recent studies that predict economic activity using Google Insight are made by Choi and Varian (Choi and Varian, 2009) and Della Penna (Della Penna, 2009) with positive results on forecasting performance.
Following those papers, this study used Goggle Insights application to estimate the market performance since 2004. Unfortunately, although this paper objective is to analyse Catalonian sector, in the case of “care homes” words, Google only offers Spain aggregated data and not disaggregated regional data. For that reason this section analysed Spain case.
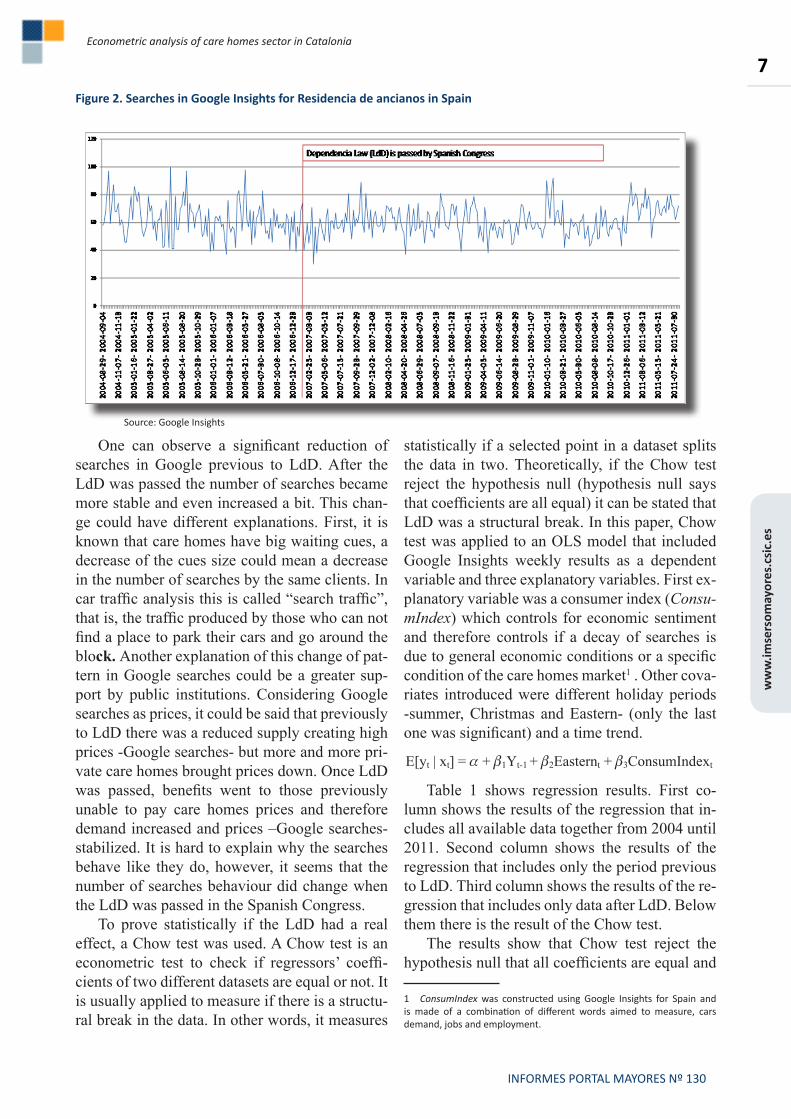
Several signifiers (e.g. words) in Spanish language are a kin to the English idea of carehomes. Main ones are: Residencia de ancianos, Residencia para tercera edad or Residencia de mayores. Fortunately, Google Insight can also compare number of searches of different words. When comparing the previous examples it is clear that Residencia de ancianos is by far the most searched combination and therefore the one that clearly gathers more information about care homes sector in Spain. Figure 2 shows how many times word Residencias de ancianos has been searched in the last seven years in Spain.
ww
w.im
sers
omay
ores
.csi
c.es
7
INFORMES PORTAL MAYORES Nº 130
Econometric analysis of care homes sector in Catalonia
One can observe a significant reduction of searches in Google previous to LdD. After the LdD was passed the number of searches became more stable and even increased a bit. This change could have different explanations. First, it is known that care homes have big waiting cues, a decrease of the cues size could mean a decrease in the number of searches by the same clients. In car traffic analysis this is called “search traffic”, that is, the traffic produced by those who can not find a place to park their cars and go around the block. Another explanation of this change of pattern in Google searches could be a greater support by public institutions. Considering Google searches as prices, it could be said that previously to LdD there was a reduced supply creating high prices Google searches but more and more private care homes brought prices down. Once LdD was passed, benefits went to those previously unable to pay care homes prices and therefore demand increased and prices –Google searches stabilized. It is hard to explain why the searches behave like they do, however, it seems that the number of searches behaviour did change when the LdD was passed in the Spanish Congress.
To prove statistically if the LdD had a real effect, a Chow test was used. A Chow test is an econometric test to check if regressors’ coefficients of two different datasets are equal or not. It is usually applied to measure if there is a structural break in the data. In other words, it measures
statistically if a selected point in a dataset splits the data in two. Theoretically, if the Chow test reject the hypothesis null (hypothesis null says that coefficients are all equal) it can be stated that LdD was a structural break. In this paper, Chow test was applied to an OLS model that included Google Insights weekly results as a dependent variable and three explanatory variables. First explanatory variable was a consumer index (Consu-mIndex) which controls for economic sentiment and therefore controls if a decay of searches is due to general economic conditions or a specific condition of the care homes market1 . Other covariates introduced were different holiday periods summer, Christmas and Eastern (only the last one was significant) and a time trend.
Table 1 shows regression results. First column shows the results of the regression that includes all available data together from 2004 until 2011. Second column shows the results of the regression that includes only the period previous to LdD. Third column shows the results of the regression that includes only data after LdD. Below them there is the result of the Chow test.
The results show that Chow test reject the hypothesis null that all coefficients are equal and
1 ConsumIndex was constructed using Google Insights for Spain and is made of a combination of different words aimed to measure, cars demand, jobs and employment.
Figure 2. Searches in Google Insights for Residencia de ancianos in Spain
Source: Google Insights
E[yt | xt] = + 1Yt1 + 2Easternt + 3ConsumIndext

ww
w.im
sers
omay
ores
.csi
c.es
8
INFORMES PORTAL MAYORES Nº 130
Econometric analysis of care homes sector in Catalonia
Table 1. Results of OLS time-series regressions and Chow test.
(1) care homes
2004-2011
(2) carehomes
2004-2006 (No LdD)
(3) carehomes
2007-2011 (LdD) Eastern -7.020 -0.354 -9.447* (-1.71) (-0.04) (-2.28) ConsumIndex 0.819*** 0.297 1.174*** (7.30) (1.22) (7.71) Trend 0.0777*** -0.0268 0.0991*** (6.62) (-0.53) (8.33) Constant 6.828 45.75* -13.68 (0.90) (2.57) (-1.53) N 364 122 242 R-sqr 0.147 0.051 0.275 t statistics in parentheses * p<0.05, ** p<0.01, *** p<0.001
Chow Test = 3.65 F(4,356) = 2.37
therefore it can be argued that Google searches before and after LdD was passed behave differently. In other words, LdD was a structural break for care homes sector.
3.- Cross-section study of care homes location
3.1.- Study justification
In order to understand how public benefits could affect the care homes sector, it is important to consider how care homes respond to markets and other factors. How they are distributed geographically? How they respond to family income, size of families or rural locations? This is what this second part analyses.
Although is it true that a panel data analysis would have been ideal for this kind of research, several restrictions prevented to carry it out. First, no recent data was available for many explanatory variables. It was essential to have 2010 or 2011 data because the effects of the LdD can be lagged on time. Secondly, some covariates were available for a single year like household size or income per household that were from
2001. Thirdly, STATA and most of the statistical software do not offer panel data analysis using Zero-inflated Poisson or Zero-inflated Negative binomial distributions (only Limdep 7.0 and above has the build in capability to deal with panel count data estimation).
Still, a crosssection analysis can be very complex and useful. The multiple potential variables affecting the number of care homes or their beds, the special distribution pattern of the data and the public interventions are complex and interesting enough features.
At this point is essential to explain why Catalonian municipalities were chosen for this crosssection study. Catalan Institute of Statistics (Idescat) provides a great number of geographic and socioeconomic variables of Catalonian municipalities that can potentially explain their number of care homes or their beds. Other Spanish regions do not provide such an important amount of data. Another possibility would have been to analyse Catalan comarques which are local regions bigger than municipalities inside Catalonia. The problem here would have been that the analysis would have had only 41 observations as Catalonia has only 41 comarques. Moreover,

ww
w.im
sers
omay
ores
.csi
c.es
9
INFORMES PORTAL MAYORES Nº 130
Econometric analysis of care homes sector in Catalonia
differences within comarques are too important to be ignored. Finally, a research at municipality level offers a new perspective; a research of care homes per municipality has never been done on Catalonia or Spain.
Municipality scale has some handicaps as well. First, municipalities are artificial divisions made by public administration and not market demand and supply. Second, in the case of Catalonia, population is extremely concentrated in Barcelona city (25% of the population lives in Barcelona). Therefore, taking Barcelona as a single observation hides a lot of information. Thirdly, some municipalities, overall in the metropolitan region, are closer between them than in rural areas and therefore interactions between metropolitan ones are more frequent than in the rural case. All in all, while the study of municipalities is probably the best option it is not exempted from problems.
As a descriptive information, Maps 1, 2 and 3 show the number of bed per municipality, the ratio of beds over population older than 64 per municipality and the number of care homes per municipality, respectively in Catalonia.
3.2.- Literature review
Business location has been one of the basic fields of studies in Economics since Alfred Marshall and Alfred Weber. Location theory can be summarized in three different approaches: neoclassical
approach, behavioural approach and institutional approach.
The neoclassical approach is focused on profit maximization and costs minimization. The behavioural approach, instead, considers imperfect information and uncertainty. Small investors and entrepreneurs willing to open a new business do not have perfect information about every single location available and therefore they take their decisions from a smaller range of locations, probably those locations closer to their living town. In such context personal factors may be more important than market factors. It is likely to be the case of small business as some empirical research shows (Lloyd and Mason, 1984). In our study it is likely to be the case of non-profit care homes which are less market oriented and more local. The institutional approach, adds that also institutional characteristics of the location should be taken into account, like administrative capitals.Today, most of the empirical works are based on a mix of the three approaches. Empirical works in location theory have been focusing overall on industrial location and Foreign Direct Investment location (Arauzo, 2005; Guimarães, 2000). A wide range of explanatory results have been found and some of the results are contradictory. Arauzo, 2005, summarizes some of the most recent findings:
Obviously, industrial location incentives are very different from services incentives, and even
Table 2. Explanatory variables effect on industrial location decisions
Arauzo (2005)Catalan
municipalities
Holl (2004) Portugal
municipalities
Guimarães(2005)Portugal
municipalitiesPopulation + Population Density Urbanization scale + + + Industrial diversity +Distance to city centre Infrastructures +, +Human Capital +

ww
w.im
sers
omay
ores
.csi
c.es
10
INFORMES PORTAL MAYORES Nº 130
Econometric analysis of care homes sector in Catalonia
more for the case of personal services. For example, population density has clearly a negative effect on industrial location but it is likely to have a positive effect on personal services like care homes. So, this table may not be what it could be expected from care homes sector. Even though it can give some clues, like which variables can be used.
In 2007, Bettencourt (Bettencourt, et.al., 2007) “[gathered] …an extensive body of data [around 300 cities], much of it never before published, across national urban systems, addressing a wide range of characteristics, including energy consumption, economic activity, demographics, infrastructure, and innovation [… and found that] cities make possible economies of scale in infrastructure and facilitate the optimized delivery of social services, such as education, and health care”. Amazingly, they found those patterns really consistent in a wide range of cities around the world. If this is applicable to care homes, we should expect to see fewer beds per capita in metropolitan areas of Catalonia.
In the case of FDI (Foreign Direct Investment), List in 1999 found that “results indicate that previous counts of foreign direct investment, market size and accessibility, and land area are positively related to Foreign Direct Investment (FDI) occurrences; while higher input costs deter new foreign firm entry” (List, 1999). This should confirm Bettencourt, et.al. arguments about economies of scale in cities. However, special characteristics must be considered and general conclusions should be avoided. Kronenberg in 2011 found that for Netherland’s municipalities business relocations and migrations depend largely on the sector. Chosen destinations for kno wledgeintensive sectors notably differ from those of less knowledge-intensive. In addition, "[firm's], “age and size keep a firm from relocating, whereas firms paying high average salaries have a higher probability to move out of their present location. Relocating firms are generally attracted by densely populated municipalities with high wage levels, and predominantly service firms are drawn to municipalities that are specialized in the firm’s own sector and appeal to individuals, while they avoid moving to municipalities in which only few sectors are present. Sector-specific
wages may either attract, or deter firms, suggesting that this variable may capture both the cost and the quality of the locally available workforce.” (Kronenberg, 2011).
Finally, StraussKahn and Vives researched location criteria followed by headquarters in the US for the period 19962001. They used 50,000 headquarters data. Their findings were that headquarters “are concentrated, increasingly so in mediumsized serviceoriented metropolitan areas, and the rate of relocation is significant (5% a year). Larger (in terms of sales) and younger headquarters tend to relocate more often”. They also found that “headquarters relocate to metropolitan areas with good airport facilities, low corporate taxes, low average wages, high level of business services and agglomeration of headquarters in the same sector of activity” (StraussKahn, V. and Vives, X, 2005).
As a result of the literature review, it can be said that there is a high heterogeneity of results, some being contradictory. The most important conclusion could be said to be that business location depends a lot on business characteristics and sector features. Therefore, it is still necessary to carry a study of care homes for the elderly in Catalonia in order to find sector and territorial particularities that may not match other papers’ conclusions.
3.3.- Methodological framework
According to Guimarães (Guimarães, 2000), two main methodologies are available depending on who is the subject of analysis: the subjects can be companies (care homes in our case) or territories (municipalities in our case). The analysis of this paper will be mainly focused on the territories’ point of view and their characteristics. This is basically because, firstly, there is more data available from municipalities than from care homes themselves. Moreover, some data from care homes, like prices, are not reliable. Secondly, econometric methodologies that use as a subject the decisionmaker (as care homes) instead of location places do need huge computer process. Indeed, from the decisionmaker point of view, it is necessary to consider all the existent municipalities in Catalonia which are 946. Therefore,

ww
w.im
sers
omay
ores
.csi
c.es
11
INFORMES PORTAL MAYORES Nº 130
Econometric analysis of care homes sector in Catalonia
every single care home has 946 options that, indeed, require a huge calculation process. There are some ways to avoid this calculation problem, for example using a conditional model the number of options can be reduced. However, good theoretical reasons should be found to argue that a company or care home would only focus on a specific region of Catalonia.
The most used econometric models for location research are called count data models like Poisson models. Poisson family models consider that a random variable follows a Poisson distribution. A broad known definition of a Poisson distribution is: a discrete probability distribution (not continuous) that expresses the probability of a given number of events occurring in a fixed interval of time and/or space if these events occur with a known average rate and independently of the time since the last event. Poisson models can be defined by the following expression:
f(k;λ) = λk e-λ/k!
If the expected number of occurrences in an interval is λ, then the probability that there are exactly k occurrences (k being a nonnegative integer, k = 0, 1, 2 ...) is equal to f(k; λ).
In the case of municipalities, a care home would choose a location instead of another if its profits are more likely to be higher. Obviously, expected profits are likely to be different from one location to another. Therefore, and following Arauzo notation (Arauzo, 2005), when a care home i chooses a municipality j its expected profit will be Π ij , which includes a deterministic term and a stochastic one:
Therefore, the care home i will choose municipality j if:
If Yi is a random variable which specifies the chosen municipality by care home i, the probability of Yi being municipality j will be:
The value yi of Yi is distributed following a Poisson with a parameter λ which is the expected number of occurrences:
At this point, the expected value of yi conditional on explanatory variables xi is the number of occurrences λ.
And,
where xi are municipality attributes that affect the care homes’ spatial profit function and β is the vector of unknown parameters.
A basic assumption of a Poisson distribution is that its variance and its mean are equal (no overdispersion), however, as it will be seen in Data section, care homes per municipality exhibit a huge number of zeros which will probably make data not fulfil that assumption. In fact, more than 70% of the municipalities have no beds or care homes at all. This would mean that the data can not be modelling using a Poisson regression because even though in overdispersion cases Poisson models are still consistent, they are not efficient any more. This problem could be solved including in the regression model a parameter that accounts for this deviance.
Mathematically, in the original Poisson regression model, the conditional expectancy E(y | x) is equal to eβ’xi, but, to account for the unobserved heterogeneity, a stochastic, independent and nonobservable explanatory variable let’s call it “v” can be introduce into the model:
Doing so, there will be two consequences, first, this model will exhibit overdispersion -larger variance than mean and, secondly, this model will exhibit a larger number of zeros than in the Poisson model.
A model that expresses such consequences has been named in several ways, including zero inflated Poisson (zip), zero altered Poisson (zap),
ij = Uij + ij
ij >ik ∀k, k ≠ j
P(Yi=j)=Prob( ij >ik) ∀k, k ≠ j
P(Yi=yi) = λk e-λ / k!
E[yi|xi]=Var[yi|xi]= λi = e ’xi
∂ E[yi|xi] / ∂xi = λi
E[y | x, v]= exv

ww
w.im
sers
omay
ores
.csi
c.es
12
INFORMES PORTAL MAYORES Nº 130
Econometric analysis of care homes sector in Catalonia
hurdle model, or simply a mixed model. In particular, if the Poisson parameter, previously called λ, is μV, where V is the stochastic, independent and non-observable explanatory variable defined above and following a Gamma distribution with expected value one and variance α, then
Mullahy (1997) proved that the probability of zero in this case of mixed Poisson distribution is greater than the probability of zero in an ordinary Poisson with the same mean.
A way to check if a mixed model is a more accurate distribution than an ordinary Poisson is then to test if α=0. Or in other words, to test for overdispersion a likelihood ratio test can be used (LR test α). If the null hypothesis (α=0) is not rejected, there is no overdispersion and the mixed model is equivalent to a Poisson.
There are other ways to deal with excess of zeros, one is called inflated models. Such models are built up by discrete distributions. Two different distributions are applied, one when values are zeros and the other one when values are positive. Usually a logit or probit is used for zeros and a Poisson for positive values.
Mathematically a zero-inflated Poisson distribution is given by,
Where ω is assumed to be 0 ≥ ω < 1 and the expected value and variance are:
Notice that it is the same formula as in the Poisson model if {ω/(1-ω)} is substituted by α. Therefore, if Zero-Inflated Negative Binomial is considered, there are three possible models to account for excess of zeros and overdispersion, the Negative Binomial, the Zero-inflated Poisson and the Zero-Inflated Negative Binomial. How to choose which to apply is difficult. There
is no single way to determine which one is the best model for a given data. PseudoR2, LR test and Vuong test are different test that may help to measure and compare the quality of the models.
Finally, it could be argued that the number of beds in a municipality may depend on others’ amount of beds or even in previous periods’ beds. In other words, explanatory variables may not be exogenous but endogenous. In such case, a GMM (Generalized method of moment) could be applied. However, that would increase model complexity. Consequently, in this paper, this scenario will be ignored.
3.4.- Data and restrictions
As it was said in the 3.1 section, this part of the paper is focused on Catalonia. The availability of socioeconomic variables disaggregated by municipalities and their geographic diversity makes this Spanish region a truly interesting region for this paper purposes. Catalonia has 946 municipalities. ImsersoSAAD (Instituto de Mayores y Servicios Sociales. Sistema para la Autonomía y Atención a la Dependencia) database provides the number of care homes and their beds per typology (public, private and not-for-profit) and municipality. Data used in this study are those obtained from this database when consulted in July 2011 (Imserso, 2011b). The number of inhabitants in total or by age, genre or nationality in each municipality of Catalonia is provided by Idescat (Catalan Statistical Office). Idescat also offers data for unemployment and average size of family in each municipality. The only drawback in this case is that last data available for average size of family is from 2001. Topographic and geographic data is provided by Municat (Municat, 2011) and finally population certified by the Government as disabled per municipality is provided by Idescat for all the years until 2009. Specifically, the variables that were considered in the study are the following:
This paragraph defines each variable and the next paragraph explains potential theoretical interpretations of each one. Totaldebs is the number of beds/places per municipality. Carehomes is the total number of care homes per municipality.
E(Y) = and var(Y) = + 2
E(Y) = (1 - ) λ = and var(Y) = + {/(1-)} 2
+ (1 + ) e-λ y = 0
Pr(Y = y) =
(1 – ) e-λ λy / y! y > 0
ww
w.im
sers
omay
ores
.csi
c.es
13
INFORMES PORTAL MAYORES Nº 130
Econometric analysis of care homes sector in Catalonia
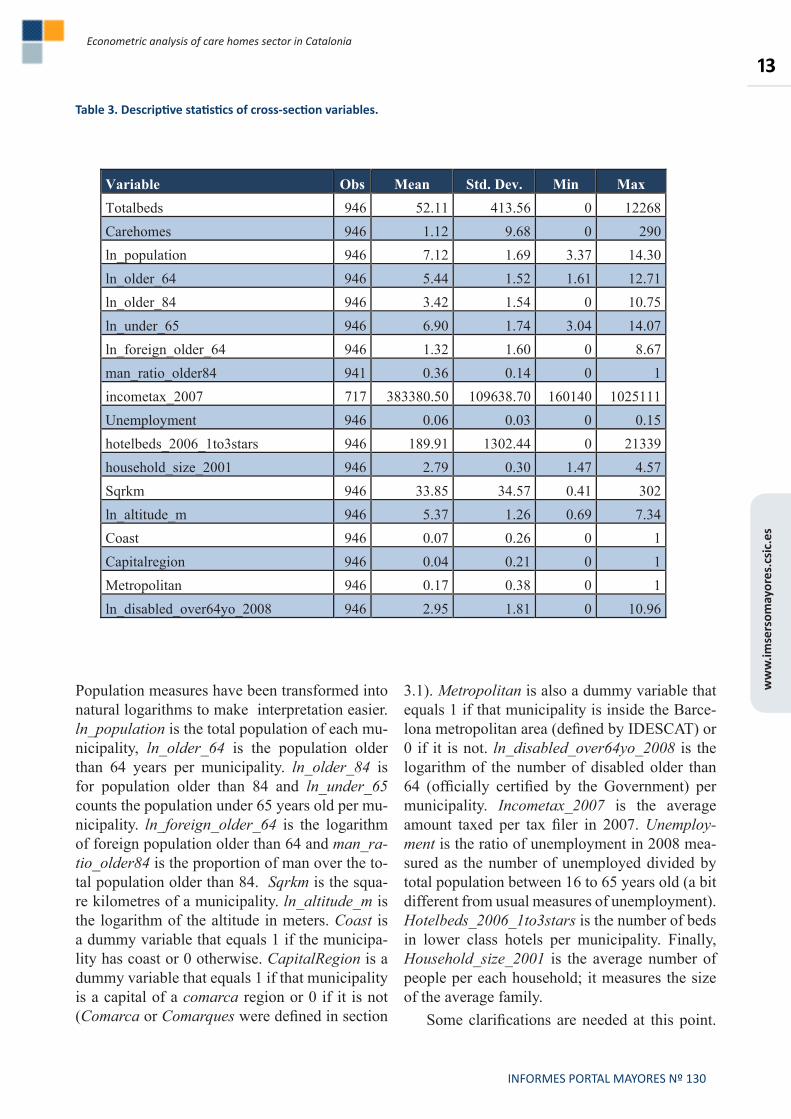
Table 3. Descriptive statistics of cross-section variables.
Variable Obs Mean Std. Dev. Min MaxTotalbeds 946 52.11 413.56 0 12268Carehomes 946 1.12 9.68 0 290ln_population 946 7.12 1.69 3.37 14.30ln_older_64 946 5.44 1.52 1.61 12.71ln_older_84 946 3.42 1.54 0 10.75ln_under_65 946 6.90 1.74 3.04 14.07ln_foreign_older_64 946 1.32 1.60 0 8.67man_ratio_older84 941 0.36 0.14 0 1incometax_2007 717 383380.50 109638.70 160140 1025111Unemployment 946 0.06 0.03 0 0.15hotelbeds_2006_1to3stars 946 189.91 1302.44 0 21339household_size_2001 946 2.79 0.30 1.47 4.57Sqrkm 946 33.85 34.57 0.41 302ln_altitude_m 946 5.37 1.26 0.69 7.34Coast 946 0.07 0.26 0 1Capitalregion 946 0.04 0.21 0 1Metropolitan 946 0.17 0.38 0 1ln_disabled_over64yo_2008 946 2.95 1.81 0 10.96
Population measures have been transformed into natural logarithms to make interpretation easier. ln_population is the total population of each municipality, ln_older_64 is the population older than 64 years per municipality. ln_older_84 is for population older than 84 and ln_under_65 counts the population under 65 years old per municipality. ln_foreign_older_64 is the logarithm of foreign population older than 64 and man_ra-tio_older84 is the proportion of man over the total population older than 84. Sqrkm is the square kilometres of a municipality. ln_altitude_m is the logarithm of the altitude in meters. Coast is a dummy variable that equals 1 if the municipality has coast or 0 otherwise. CapitalRegion is a dummy variable that equals 1 if that municipality is a capital of a comarca region or 0 if it is not (Comarca or Comarques were defined in section
3.1). Metropolitan is also a dummy variable that equals 1 if that municipality is inside the Barcelona metropolitan area (defined by IDESCAT) or 0 if it is not. ln_disabled_over64yo_2008 is the logarithm of the number of disabled older than 64 (officially certified by the Government) per municipality. Incometax_2007 is the average amount taxed per tax filer in 2007. Unemploy-ment is the ratio of unemployment in 2008 measured as the number of unemployed divided by total population between 16 to 65 years old (a bit different from usual measures of unemployment). Hotelbeds_2006_1to3stars is the number of beds in lower class hotels per municipality. Finally, Household_size_2001 is the average number of people per each household; it measures the size of the average family.
Some clarifications are needed at this point.

ww
w.im
sers
omay
ores
.csi
c.es
14
INFORMES PORTAL MAYORES Nº 130
Econometric analysis of care homes sector in Catalonia
The hotel covariate has been introduced in order to measure the attractiveness of the location. If care homes are usually located in nice landscapes, a proxy of this 'attractiveness' value might be the number of hotels available. Another covariate introduced is the size of average family which has been introduced in order to control for family's influence on decision taker. Presumably, it could be asserted that the bigger the family, the easier it becomes to share the dependant's burden among all and therefore a care home would not be needed. However, it is also possible that the larger the family, the easier it is to share care homes costs among all and as a result the demand of care homes would increase. The average household income has not been included because there is data only for 220 municipalities which would reduce the sample to a 27% of the original sample, secondly because most of the elderly are not working so they have no incomes and thirdly because most updated data was from 2001. Although Income Tax could have been used as a substitute (Incometax_2007), it also had an important setback; 250 municipalities had no data due to privacy concerns. Logically, most of the municipalities without data are small ones which if ignored would have led to biased estimations when regression were carried out. In consequence, unemployment data (available for year 2008) per municipality was the variable used to account for economic factors.
The regional administrative capital dummy has been introduced following a study where this variable was found significant in industrial facilities location in Catalonia (Arauzo, 2005). Sqrkm variable would a priori measure population dispersion. Theoretically, a more dispersed population is less likely to have a care home. Me-tropolitan variable accounts for agglomeration economies of the metropolitan area of Barcelona. Coast is a dummy that account for the attractiveness of coast regions for retired and care homes.
At last, ln_disabled_over64yo_2008 is the variable that accounts for the direct effect of government. The municipality differences in the application of the LdD are accounted by this variable. A significant effect of this variable would mean that direct benefits to dependants have a real effect on the supply of beds and/or care homes.
All these variables with a brief description and the source of the data can be found in the Table of Variables on page 25.
Finally, is essential to say that one special covariate has been ignored, that is, the number of Centre de dia places. Centre de dia is a facility provided to the elderly and where they can stay during day time but not at night. The aim is to reduce the burden over family or carer during day time. It is also cheaper than the normal care homes place and therefore affordable for some families. It is likely that the number of Centre de dia places would reduce demand of care home places because they are substitutive for some people. However, from centre de dia are problematic. According to the data from ImsersoSAAD, Centre de dia places are mostly inside care homes. Therefore, while presumably there should be a negative relation between Centre de dia and care homes because they substitutive relation, this covariate show always a positive correlation due to endogeneity.
The dependent variables of this study are the number of beds and care homes. As it was argued their distribution per municipality follow a Poisson if zeros are excluded. Next figure shows beds case.
Observations follow a Poisson distribution if zero values are excluded. When they are included the figure is much closer to what care homes histogram with zeros shows below.
This distribution is what in statistics is called zero-inflated Poisson (excess of zeros) and can

ww
w.im
sers
omay
ores
.csi
c.es
15
INFORMES PORTAL MAYORES Nº 130
Econometric analysis of care homes sector in Catalonia
Figure 3. Histogram of beds per municipality. (excluding zero observations)
30
40
50
60
70Fre
quen
cy
0
10
20
25 50 75 100
125
150
175
200
225
250
275
300
325
350
375
400
425
450
475
500
525
550
575
600
625
650
675
700
725
750
775
800
825
850
875
900
925
950
975
1000
and m
ore
Class (within 25 ranges)
Source: own elaboration
be easily modelised with zip or zinb models as in previous section was explained.
Some considerations and restrictions must be considered at this point. First, around 5% of the
Figure 4. Histogram of care homes per municipality.
700700
600600
500
400
ency
Freq
u
300
F
200200
100100
0
Values
Source: own elaboration
care homes do not provide their number of beds. This could be an important issue; however, it has been decided to take no action about this because 5% is a low number of cases and moreover no apparent pattern was found in that 5% cases. In other words, missing data was not concentrated
among low populated municipalities, poor regions, or any other important variable. Second, zero values where changed for ones to avoid taking the natural logarithm of 0. That may not have important consequences because the worst case had around 30 zeros (disabled_2008 variable)

ww
w.im
sers
omay
ores
.csi
c.es
16
INFORMES PORTAL MAYORES Nº 130
Econometric analysis of care homes sector in Catalonia
and the rest of the variables barely had 5 to 10 cases. A less clear decision was the foreigners older than 64 variable which had 289 zero cases. In this latter case the zero for one substitution was also applied because the whole variable was expected to have small significant effect on the dependent variable. Third, this paper assumes that care homes react to dependants’ preferences, in fact, decisionmaker's preferences (in some cases it could be that the person who decides is not the dependant but the carer: their family or public institutions). Dependants’ preferences may rely on a special feature about care homes that is essential to consider: care homes’ ownership. Care homes can have three different types of ownerships, that is, private, not-for-profit or public. Obviously, the first one is more likely to follow market demand and the other ones are more likely to be distributed through the territory by other reasons like political reasons in public care homes’ case or by particular and specific reasons in not-for-profit case (historical reasons, Church locations...). Assuming this, public and notforprofit cases should be considered as explanatory variables instead of part of the dependant variable. That way one could estimate what effect would have not-for-profit and public facilities had on private ones. Unfortunately, public and not-for-profit facilities do also follow market demand, which brings endogeneity problems when regression models are applied. In consequence, ownership was not considered and only aggregated data of beds or care homes by municipality was considered.
Finally, there is another constraint on the interpretation of beds available that is worth to have in mind; either facility’s price or quality has not been considered. The reason for that is again that the only data available is unreliable because is provided by care homes themselves. Excluding prices from the study is not necessarily a problem as what this study wants to measure is the supply of beds or care homes facilities and could be assumed that price only measures quality and do not affect its amount of supply (inelastic supply).
3.5.- Analysis and results
This section carries out a crosssection analysis of care homes’ sector in year 2008 and in Catalonia. Two different dependent variables were used, totalbeds and carehomes. For each dependent variable, three different models were applied, Negative-Binomial (nbreg), Zero-Inflated Poisson (zip) and Zero-Inflated Negative-Binomial (zinb). The same independent variables were applied to each model. Finally, all models were replicated with robust standard errors.
In addition, for each model Vuong test was carried out to see if zero-inflated models were more appropriate than a simple Poisson. Finally, as it can be seen, many different covariates have been considered to estimate the dependent variables. However, it is obvious that there are a huge number of likely explanatory variables that were not accounted for due to, essentially, a lack of data. Consequently, there could be an omitted variable problem. It is hard to know if there is an important bias due to omitted variable problem, however, the general basic explanatory concepts (population, geography and economic concepts) are included in the model and therefore including more similar variables could induce them all to be not statistically significant. To avoid this problem, in the results table it has been included a Wald test to check if a group of variables were jointly significant or not. Wald tests were, first, Wald Test Geographic which is a Wald test of sqrkm, ln_altitude_m, capitalregion, metropolitan and coast being equal to zero. Wald Test Socioeco-nomic is a Wald test of unemployment, house-hold_size_2001 and hotelbeds_2006_1to3stars variables to be equal to zero.
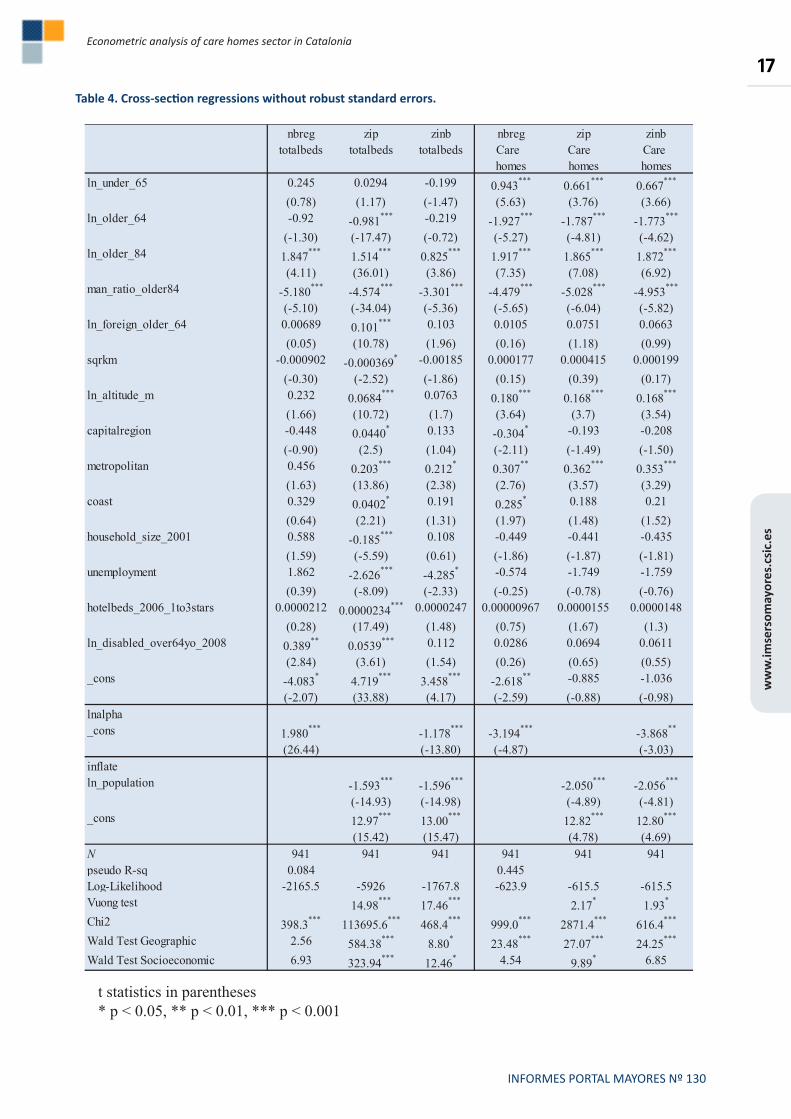
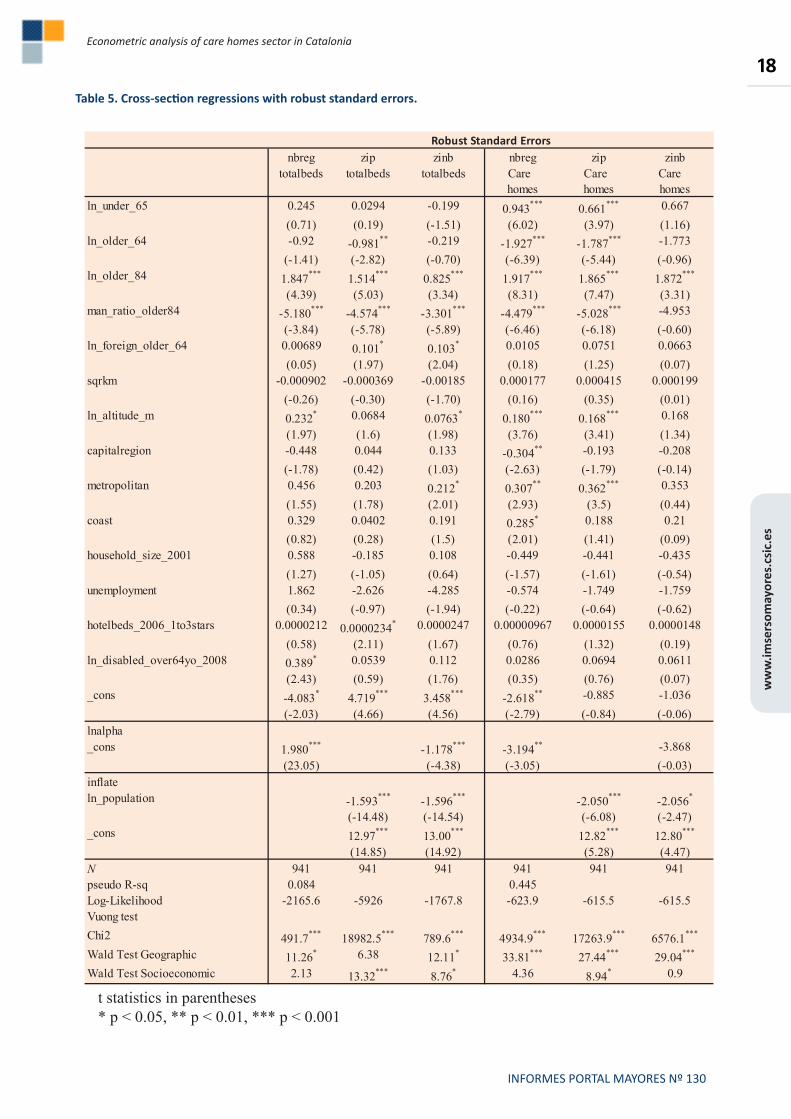
The next tables show the result of the six models applied. Table 4 shows results of nbreg, zip and zinb models without robust standard errors. Table 5 shows the results of the same models and dependent variables but using robust standard errors.
ww
w.im
sers
omay
ores
.csi
c.es
17
INFORMES PORTAL MAYORES Nº 130
Econometric analysis of care homes sector in Catalonia
Table 4. Cross-section regressions without robust standard errors.
t statistics in parentheses* p < 0.05, ** p < 0.01, *** p < 0.001
nbreg zip zinb nbreg zip zinbtotalbeds totalbeds totalbeds Care
homes Care
homes Care
homesln_under_65 0.245 0.0294 -0.199 0.943*** 0.661*** 0.667***
(0.78) (1.17) (-1.47) (5.63) (3.76) (3.66)ln_older_64 -0.92 -0.981*** -0.219 -1.927*** -1.787*** -1.773***
(-1.30) (-17.47) (-0.72) (-5.27) (-4.81) (-4.62)ln_older_84 1.847*** 1.514*** 0.825*** 1.917*** 1.865*** 1.872***
(4.11) (36.01) (3.86) (7.35) (7.08) (6.92)man_ratio_older84 -5.180*** -4.574*** -3.301*** -4.479*** -5.028*** -4.953***
(-5.10) (-34.04) (-5.36) (-5.65) (-6.04) (-5.82)ln_foreign_older_64 0.00689 0.101*** 0.103 0.0105 0.0751 0.0663
(0.05) (10.78) (1.96) (0.16) (1.18) (0.99)sqrkm -0.000902 -0.000369* -0.00185 0.000177 0.000415 0.000199
(-0.30) (-2.52) (-1.86) (0.15) (0.39) (0.17)ln_altitude_m 0.232 0.0684*** 0.0763 0.180*** 0.168*** 0.168***
(1.66) (10.72) (1.7) (3.64) (3.7) (3.54)capitalregion -0.448 0.0440* 0.133 -0.304* -0.193 -0.208
(-0.90) (2.5) (1.04) (-2.11) (-1.49) (-1.50)metropolitan 0.456 0.203*** 0.212* 0.307** 0.362*** 0.353***
(1.63) (13.86) (2.38) (2.76) (3.57) (3.29)coast 0.329 0.0402* 0.191 0.285* 0.188 0.21
(0.64) (2.21) (1.31) (1.97) (1.48) (1.52)household_size_2001 0.588 -0.185*** 0.108 -0.449 -0.441 -0.435
(1.59) (-5.59) (0.61) (-1.86) (-1.87) (-1.81)unemployment 1.862 -2.626*** -4.285* -0.574 -1.749 -1.759
(0.39) (-8.09) (-2.33) (-0.25) (-0.78) (-0.76)hotelbeds_2006_1to3stars 0.0000212 0.0000234*** 0.0000247 0.00000967 0.0000155 0.0000148
(0.28) (17.49) (1.48) (0.75) (1.67) (1.3)ln_disabled_over64yo_2008 0.389** 0.0539*** 0.112 0.0286 0.0694 0.0611
(2.84) (3.61) (1.54) (0.26) (0.65) (0.55)_cons -4.083* 4.719*** 3.458*** -2.618** -0.885 -1.036
(-2.07) (33.88) (4.17) (-2.59) (-0.88) (-0.98)lnalpha_cons 1.980*** -1.178*** -3.194*** -3.868**
(26.44) (-13.80) (-4.87) (-3.03)inflateln_population -1.593*** -1.596*** -2.050*** -2.056***
(-14.93) (-14.98) (-4.89) (-4.81)_cons 12.97*** 13.00*** 12.82*** 12.80***
(15.42) (15.47) (4.78) (4.69)N 941 941 941 941 941 941pseudo R-sq 0.084 0.445Log-Likelihood -2165.5 -5926 -1767.8 -623.9 -615.5 -615.5Vuong test 14.98*** 17.46*** 2.17* 1.93*
Chi2 398.3*** 113695.6*** 468.4*** 999.0*** 2871.4*** 616.4***
Wald Test Geographic 2.56 584.38*** 8.80* 23.48*** 27.07*** 24.25***
Wald Test Socioeconomic 6.93 323.94*** 12.46* 4.54 9.89* 6.85
ww
w.im
sers
omay
ores
.csi
c.es
18
INFORMES PORTAL MAYORES Nº 130
Econometric analysis of care homes sector in Catalonia
Table 5. Cross-section regressions with robust standard errors.
nbreg zip zinb nbreg zip zinbtotalbeds totalbeds totalbeds Care
homes Care
homes Care
homesln_under_65 0.245 0.0294 -0.199 0.943*** 0.661*** 0.667
(0.71) (0.19) (-1.51) (6.02) (3.97) (1.16)ln_older_64 -0.92 -0.981** -0.219 -1.927*** -1.787*** -1.773
(-1.41) (-2.82) (-0.70) (-6.39) (-5.44) (-0.96)ln_older_84 1.847*** 1.514*** 0.825*** 1.917*** 1.865*** 1.872***
(4.39) (5.03) (3.34) (8.31) (7.47) (3.31)man_ratio_older84 -5.180*** -4.574*** -3.301*** -4.479*** -5.028*** -4.953
(-3.84) (-5.78) (-5.89) (-6.46) (-6.18) (-0.60)ln_foreign_older_64 0.00689 0.101* 0.103* 0.0105 0.0751 0.0663
(0.05) (1.97) (2.04) (0.18) (1.25) (0.07)sqrkm -0.000902 -0.000369 -0.00185 0.000177 0.000415 0.000199
(-0.26) (-0.30) (-1.70) (0.16) (0.35) (0.01)ln_altitude_m 0.232* 0.0684 0.0763* 0.180*** 0.168*** 0.168
(1.97) (1.6) (1.98) (3.76) (3.41) (1.34)capitalregion -0.448 0.044 0.133 -0.304** -0.193 -0.208
(-1.78) (0.42) (1.03) (-2.63) (-1.79) (-0.14)metropolitan 0.456 0.203 0.212* 0.307** 0.362*** 0.353
(1.55) (1.78) (2.01) (2.93) (3.5) (0.44)coast 0.329 0.0402 0.191 0.285* 0.188 0.21
(0.82) (0.28) (1.5) (2.01) (1.41) (0.09)household_size_2001 0.588 -0.185 0.108 -0.449 -0.441 -0.435
(1.27) (-1.05) (0.64) (-1.57) (-1.61) (-0.54)unemployment 1.862 -2.626 -4.285 -0.574 -1.749 -1.759
(0.34) (-0.97) (-1.94) (-0.22) (-0.64) (-0.62)hotelbeds_2006_1to3stars 0.0000212 0.0000234* 0.0000247 0.00000967 0.0000155 0.0000148
(0.58) (2.11) (1.67) (0.76) (1.32) (0.19)ln_disabled_over64yo_2008 0.389* 0.0539 0.112 0.0286 0.0694 0.0611
(2.43) (0.59) (1.76) (0.35) (0.76) (0.07)_cons -4.083* 4.719*** 3.458*** -2.618** -0.885 -1.036
(-2.03) (4.66) (4.56) (-2.79) (-0.84) (-0.06)lnalpha_cons 1.980*** -1.178*** -3.194** -3.868
(23.05) (-4.38) (-3.05) (-0.03)inflateln_population -1.593*** -1.596*** -2.050*** -2.056*
(-14.48) (-14.54) (-6.08) (-2.47)_cons 12.97*** 13.00*** 12.82*** 12.80***
(14.85) (14.92) (5.28) (4.47)N 941 941 941 941 941 941pseudo R-sq 0.084 0.445Log-Likelihood -2165.6 -5926 -1767.8 -623.9 -615.5 -615.5Vuong testChi2 491.7*** 18982.5*** 789.6*** 4934.9*** 17263.9*** 6576.1***
Wald Test Geographic 11.26* 6.38 12.11* 33.81*** 27.44*** 29.04***
Wald Test Socioeconomic 2.13 13.32*** 8.76* 4.36 8.94* 0.9
Robust Standard Errors
t statistics in parentheses* p < 0.05, ** p < 0.01, *** p < 0.001

ww
w.im
sers
omay
ores
.csi
c.es
19
INFORMES PORTAL MAYORES Nº 130
Econometric analysis of care homes sector in Catalonia
Map 4 and 5 at the end of the paper show inverted residuals of zip robust std. errors models distributed geographically over Catalonian map. Blue municipalities are those with a positive residual. In other words, blue municipalities are those with an excess of beds or care homes according to zip robust std. errors model. Orange municipalities have a lack of beds according to
zip robust std. errors model (negative residuals).
Before analysing the results it is important to notice that as it can be seen in Table 4 and 5 most of the regressors of the zip columns are very significant, which may bring concerns of multicollinearity. The following table shows how variables are correlated.
Table 6. Correlations of independent variables
We may conclude that there is a certain significant level of multicollinearity according to Table 6, which may influence the regression results. Attention has been paid to reduce the amount of multicollinearity to an acceptable level. As it can be seen in previous table all variables related to population have high correlation. When variables like ln_under_65, ln_older_64, man_ratio_ol-der84 or ln_foreign_older_64 were excluded from the models, the rest of the variables were still significant and coefficients did not change too much.
Results of previous regression tables confirm several important ideas. First, Vuong test and LR test certify that a simple Poisson model would have been inadequate. However, to determine which model is more efficient among nbreg, zip and zinb is a more difficult task. Log-likelihood results and Chi2 results may suggest that zip model is a more appropriate model for beds estimation but the models are nonnested and therefore loglikelihood values are not directly comparable. In care home’s case it is too close to call.
The number of observations is, for all models, 941 observations, that means only five observations were lost. It is important to recall that some variables were transformed to avoid loss of data; although in the worst case only around thirty observations were transformed (ln_disabled_over64yo_2008).
Wald test were carried out to test if geographic
variables and socioeconomic variables were significant when added together. Most of the results showed that geographic variables all together are significant but only half of the models showed the same for socioeconomic variables.
Data from tstatistics showed that ln_ol-der_84 and man_ratio_older84 are the most significant variables. Models were coherent about both variables’ coefficients. Positive coefficients for ln_older_84 and negative ones for man_ra-tio_older84 resulted for all models. As expected the more elderly a municipality has the more beds or care homes it has. On the other hand it is surprising to find how important the effect of genre is. Women have a positive impact on number of beds or care homes available, already accounting for the fact that women live longer than men (and therefore there are more old women than old men). In fact, it is sensible to think so, according to INE (Spanish Statistical Office) data, for each man older than 64 years old, there are around 1.35 women older than 64, but in 2001 census (Imserso, 2004; pp.826) there were 2.63 women for each man living in care homes. When only older than 84 years old values are considered, the results are even more extreme
Less significant variables but equally consistent (same sign at all models) are ln_altitude_m and metropolitan. The first one had a positive effect, showing that the higher the municipality the more likely to have a care home, that is, again,

ww
w.im
sers
omay
ores
.csi
c.es
20
INFORMES PORTAL MAYORES Nº 130
Econometric analysis of care homes sector in Catalonia
taking into account that mountainous towns do have older populations. The second variable, me-tropolitan, had a positive coefficient showing that Barcelona city and its metropolitan area is more likely to have more beds or care homes. This effect may also be accounted by ln_under_65 variable, which showed positive coefficients in all models. In short, there is a kind of concentration of beds and care homes in high regions and urban areas. A tentative explanation may be that the first case is for quality of life reasons while the second case is for proximity reasons, infrastructures in metropolitan areas make access easier for families and those responsible of the dependant. It is also important to say that ln_older_64 variable was found to be significant in many models but unexpectedly with a negative coefficient in all them. While it is not simple to elucidate, a provisional explanation would be that people from 65 to 84 are retired but capable to care of themselves without family or care homes help. So, the bigger the covariate is the less likely care homes and their beds are.
Finally, coefficients of ln_disabled_over-64yo_2008 were in all models positive which is consistent with theory. The more disabled are granted with benefits the more funds are accessible in that municipality and therefore more facilities should be available. Although coefficients are consistent with theory, only in three of the twelve models applied they were significant. More importantly, it is essential to notice that probably there is a problem of endogeneity. Where there are more dependants more care homes are likely
and at the same time more aged would have had benefits from government. So, more care homes and more benefits are related by the real and unobservable number of dependants. This conclusion eradicates any possible inference made from regressions about the effect of benefits on care homes.
Therefore, it is not possible to discern the effect of disabled certified by government over care homes using crosssectional analysis. Neither any conclusion about Ley de la dependencia (LdD) effect should be assumed from these results. Nonetheless, the reader should remember that the time-series analysis of the first part of the paper was very different, it did not consider supply but demand and for Spain case not Catalonia. In any case the inferences made about the rest of the covariates described above are still true.
3.6.- Two extra analysis
Finally, two more short analyses were carried out to clarify some aspects. In the first one not only 2008 disabled data were taken into account, but also 2006, 2004 and 2002 data were considered as lagged regressors. Still, it was found that 2008 was the more significant (and positive, which is sensible) for them all, see table below. That is why 2008 disabled data was used in models instead of any lagged regressors.
The second short analysis was carried out to answer the following question; Do political parties had any influence on the number of facilities available in each municipality? As it was said in
Table 7. Coefficients and t statistics of lagged disabled variable
disabledyear data
Coefficients of lagged disabled variables in zip
totalbeds model
Coefficients of lagged disabled variables in zip carehomes model
2002 0.0095 0.0488 (.01457) (.1035)
2004 0.0074 0.0517 (.0151) (.1074)
2006 0.0312 0.0498 (.0174) (.1191)
2008 0.0539 *** 0.0694 (.0149) (.1074)
tstatistics in parentheses* p < 0.05, ** p < 0.01, *** p < 0.001
ww
w.im
sers
omay
ores
.csi
c.es
21
INFORMES PORTAL MAYORES Nº 130
Econometric analysis of care homes sector in Catalonia
the introduction, the care homes sector is a regularized sector where public sector has great influence. Therefore, is interesting to know if the colour of the municipal’s main political party has any effect on the public care homes available.
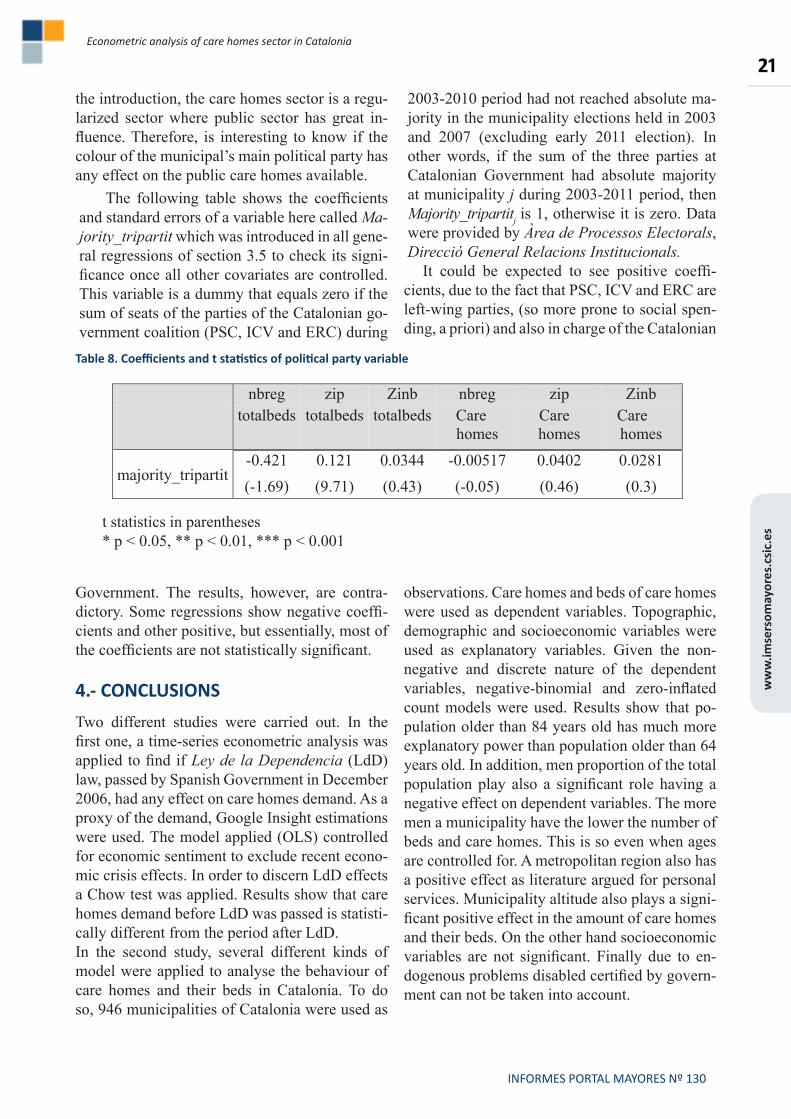
The following table shows the coefficients and standard errors of a variable here called Ma-jority_tripartit which was introduced in all general regressions of section 3.5 to check its significance once all other covariates are controlled. This variable is a dummy that equals zero if the sum of seats of the parties of the Catalonian government coalition (PSC, ICV and ERC) during
20032010 period had not reached absolute majority in the municipality elections held in 2003 and 2007 (excluding early 2011 election). In other words, if the sum of the three parties at Catalonian Government had absolute majority at municipality j during 20032011 period, then Majority_tripartitj is 1, otherwise it is zero. Data were provided by Àrea de Processos Electorals, Direcció General Relacions Institucionals.
It could be expected to see positive coefficients, due to the fact that PSC, ICV and ERC are leftwing parties, (so more prone to social spending, a priori) and also in charge of the Catalonian
Table 8. Coefficients and t statistics of political party variable
nbreg zip Zinb nbreg zip Zinb
totalbeds totalbeds totalbeds Care homes
Carehomes
Care homes
majority_tripartit -0.421 0.121 0.0344 -0.00517 0.0402 0.0281 (-1.69) (9.71) (0.43) (-0.05) (0.46) (0.3)
t statistics in parentheses* p < 0.05, ** p < 0.01, *** p < 0.001
Government. The results, however, are contradictory. Some regressions show negative coefficients and other positive, but essentially, most of the coefficients are not statistically significant.
4.- CONCLUSIONSTwo different studies were carried out. In the first one, a time-series econometric analysis was applied to find if Ley de la Dependencia (LdD) law, passed by Spanish Government in December 2006, had any effect on care homes demand. As a proxy of the demand, Google Insight estimations were used. The model applied (OLS) controlled for economic sentiment to exclude recent economic crisis effects. In order to discern LdD effects a Chow test was applied. Results show that care homes demand before LdD was passed is statistically different from the period after LdD.In the second study, several different kinds of model were applied to analyse the behaviour of care homes and their beds in Catalonia. To do so, 946 municipalities of Catalonia were used as
observations. Care homes and beds of care homes were used as dependent variables. Topographic, demographic and socioeconomic variables were used as explanatory variables. Given the nonnegative and discrete nature of the dependent variables, negative-binomial and zero-inflated count models were used. Results show that population older than 84 years old has much more explanatory power than population older than 64 years old. In addition, men proportion of the total population play also a significant role having a negative effect on dependent variables. The more men a municipality have the lower the number of beds and care homes. This is so even when ages are controlled for. A metropolitan region also has a positive effect as literature argued for personal services. Municipality altitude also plays a significant positive effect in the amount of care homes and their beds. On the other hand socioeconomic variables are not significant. Finally due to endogenous problems disabled certified by government can not be taken into account.

ww
w.im
sers
omay
ores
.csi
c.es
22
INFORMES PORTAL MAYORES Nº 130
Econometric analysis of care homes sector in Catalonia
Abellán García, A., Esparza Catalán, C., and Pérez Díaz, J. (2011), “Evolución y estructura de la población en situación de dependencia”. Cuadernos de Relaciones Laborales 29 (1): 4367.
Arauzo, J.M. (2005), “Determinants of industrial location. An application for Catalan municipalities”, Papers in Regional Science 84: 105119.
Barriga L., et.al. (2010). "Desarrollo e implantacion territorial de la Ley de promocion de la autonomia personal y atencion a las personas en situación de dependencia," V Dictamen del Observatorio
Bettencourt, L. M. A., José Lobo, Dirk Helbing, Christian Kühnert, and Geoffrey B. West (2007): “Growth, innovation, scaling, and the pace of life in cities”; PNAS vol. 104 no. 17 pp. 73017306
Bishop, C.E. (1999) “Where Are the Missing Elders? The Decline in Nursing Home Use 1985 and 1995”. Health Affairs, 18(4):14655.
Choi H. and Varian, H. (2009). “Predicting the present with Google Trends”, Google Technical report.
Della Penna, N., Huang, H. (October, 2009) “Constructing consumer Sentiment Index for U.S. Using Internet Search Patterns”; Working Paper No. 200926
Departament de Benestar Social (2002). “Llibre blanc de la gent gran amb dependencia”
ElPais.com (2011), “La creación de plazas geriátricas ha sufrido un frenazo severo”, ElPais.com, August, 2011.
Guimarães, P., Figueredo, O. and Woodward, D. (2000), “Agglomeration and the location of foreign direct investment in Portugal” Journal of Urban Economics 7: 115.
Idescat (2011), “Base de dades de municipis” http://www.idescat.cat/territ/BasicTerr?TC=9
Imserso (2011a), “Información estadística del SAAD, Situación a 1 de Enero de 2011”, Datos estadísticos del Sistema para la Autonomía y Atención a la Dependencia
Imserso (2011b), “Recursos Sociales: Residencias. Base de datos”,
http://www.imsersodependencia.csic.es/recursos/residencias/index.htm
Imserso (2009), “Guía 2009 de servicios de atención residencial para personas mayores” Colección manuales y guías. Serie servicios sociales.
Imserso (2004); “Informe 2004; Las Personas Mayores en España”; pp.826
References

ww
w.im
sers
omay
ores
.csi
c.es
23
INFORMES PORTAL MAYORES Nº 130
Econometric analysis of care homes sector in Catalonia
Jefatura del Estado (2006), “Ley 39/2006, de 14 de diciembre, de Promoción de la Autonomía Personal y Atención a las personas en situación de dependencia”, BOE n.º 299/2006.
Kronenberg, K. (2011): “Firm relocations in the Netherlands: Why do firms move, and where do they go?” Unpublished
List, J. A. (1999); “US county-level determinants of inbound FDI: evidence from a two-step modified count data model”; International Journal of Industrial Organization 19 (2001) 953–973
Lloyd, P. E. and Mason, C. M. (1984): “Spatial variation in new firm formation in the United Kingdom: comparative evidence from Merseyside, Greater Manchester and South Hampshire”, Regional Studies 18: 207220.
Municat (2011), “Consulta de dades”, http://municat.gencat.cat/index.php?page=consulta
Schmidt, T. and Vosen, S., (2009). “Forecasting Private Consumption: SurveyBased Indicators vs. Google Trends”. Ruhr Economic Papers #155
StraussKahn, V. and Vives, X. (2005). 'Why and Where do Headquarters Move?'. CEPR Discussion Paper no. 5070. London, Centre for Economic Policy
Torres, M., Nuñez J., Martínez, J., Suarez, J.L., (2007) "La atención de las necesidades residenciales para las personas mayores" IESE, Documento de Investigación 664
U.S. Census Bureau, Population Division "International Database" (as of 10 May 2010)

ww
w.im
sers
omay
ores
.csi
c.es
24
INFORMES PORTAL MAYORES Nº 130
Econometric analysis of care homes sector in Catalonia
Table of variables
Variable Description Source
Totalbeds Number of beds/places per municipality in 2011.
Imserso-SAAD
Carehomes Number of care homes per municipality in 2011.
Imserso-SAAD
ln_population Natural logarithm of the population in each municipality in 2008. Idescat
ln_older_64 Natural logarithm of the population older than 64 years per municipality in 2008. Idescat
ln_older_84 Natural logarithm of the population older than 84 years per municipality in 2008. Idescat
ln_under_65 Natural logarithm of the population under 65 years old per municipality in 2008. Idescat
ln_foreign_older_64 Natural logarithm of foreign population older than 64 in 2008. Idescat
man_ratio_older84 Proportion of man over the population older than 84 per municipality in 2008. Idescat
incometax_2007 Average amount taxed per tax filer in 2007. Idescat
Unemployment
Ratio of unemployment in 2008 measured as the number of unemployed divided by total population between 16 to 65 years old.
own elaboration using Idescat data
hotelbeds_2006_1to3stars Sum of the number of beds in hotels classified as one to three stars in 2006, per municipality.
Idescat
household_size_2001 Average number of people per each household in 2001 (Census data). Idescat
Sqrkm Square kilometres of each municipality. Municat
ln_altitude_m Natural logarithm of the altitude (in meters). Municat
Coast Dummy variable that equals 1 if the municipality has coast or 0 otherwise. Idescat
Capitalregion Dummy variable that equals 1 if that municipality is a capital of a comarcaregion or 0 if it is not.
Idescat
Metropolitan
Dummy variable that equals 1 if that municipality is inside the Barcelona metropolitan area (as defined by Idescat) or 0 if it is not.
Idescat
ln_disabled_over64yo_2008
Natural logarithm of the number of disabled older than 64 (officially certified by the Government) per municipality in 2008.
Idescat

ww
w.im
sers
omay
ores
.csi
c.es
25
INFORMES PORTAL MAYORES Nº 130
Econometric analysis of care homes sector in Catalonia
- MAPS -
Map 1. Beds of care homes per municipality
Source: Own elaboration using Imserso data

ww
w.im
sers
omay
ores
.csi
c.es
26
INFORMES PORTAL MAYORES Nº 130
Econometric analysis of care homes sector in Catalonia
Map 2. Beds of care homes / population older than 64 (x100) per
municipality
Source: Own elaboration using Imserso and Idescat data

ww
w.im
sers
omay
ores
.csi
c.es
27
INFORMES PORTAL MAYORES Nº 130
Econometric analysis of care homes sector in Catalonia
Map 3. Number of care homes per municipality
Source: Own elaboration using Imserso data

ww
w.im
sers
omay
ores
.csi
c.es
28
INFORMES PORTAL MAYORES Nº 130
Econometric analysis of care homes sector in Catalonia
Map 4. Residuals of zip model of totalbeds with Robust Standard Errors
Source: Own elaboration.

ww
w.im
sers
omay
ores
.csi
c.es
29
INFORMES PORTAL MAYORES Nº 130
Econometric analysis of care homes sector in Catalonia
Map 5. Residuals of zip model of carehomes with Robust Standard Errors
Source: Own elaboration.
Note: Blue colors denote lack of care homes according to this model; red colors an excess.

INFORMES PORTAL MAYORES Nº 130
Econometric analysis of care homes sector in Catalonia
30
- Acknowledgments -
I would like to express my gratitude to my supervisor Professor Gordon Kemp for his guidance and help. I also thank Professor Joao Santos Silva for his useful course in econometrics and his unselfish help on my dissertation. I am also gra-teful to staff of the University of Essex Economic Department and Mathematical Sciences Department. I want to thank Victor Sazatornil for helping me to design the maps. Finally, I want to dedicate this paper to Veronica and my family.
Los Informes Portal Mayores son publicados por el Laboratorio Portal Mayores del Centro de Ciencias Humanas y Sociales del CONSEJO SUPERIOR DE INVESTIGACIONES CIENTÍFICAS (CSIC), dentro del convenio de colaboración IMSERSO-CSIC.
Son documentos elaborados con un objetivo de divulgación, abordándose cuestiones estadísticas, demográficas, legales, psicológicas, sanitarias, sociales entre otras. Algunos son elaborados por el propio equipo del Portal y por profesionales especialistas de distintos campos de la Gerontología y la Geriatría.
La serie se inició en 2003 sin periodicidad fija. Son gratuitos y se presentan en formato digital.
Portal Mayores no se responsabiliza de las opiniones vertidas por los autores de estos informes. Es obligatorio citar la procedencia en cualquier reproducción total o parcial que se haga de los mismos.
Una iniciativa del Imserso y del CSIC © 2003
Informes Portal Mayores Director: Antonio Abellán García Redacción técnica y maquetación: Isabel Fernández Morales, Juan Carlos Mejía Acera, Ana Sevillano Bermejo Dirección postal: CSIC / Portal Mayores Albasanz 26, 28037 Madrid, España Teléfono: 0034 916 022 391 / 92 Fax: 0034 916 022 971 Correo electrónico: [email protected] Web: www.imsersomayores.csic.es