Shipbuilding- Shipbreaking Spain2015 CCOO de Industria. Exige Industria.
Upload
promocionmusicalesCategory
view
430download
1
12015 NIELSEN MUSIC U.S. REPORT Copyright © 2016 The Nielsen Company
2015 N I E L S E N M U S I C U.S. R E P O R T

2 2015 NIELSEN MUSIC U.S. REPORT
Welcome to Nielsen’s annual Year End Music Report, a summary of consumption trends and
consumer insights for 2015.
Going into the year, we had recently modernized the industry measuring stick - the Billboard
200 chart - to include track downloads and streamed songs in addition to traditional
album sales. The new chart reflected how fans now consume music, and in 2015 they
were consuming more than ever. Total consumption, including sales, streams and track
downloads, was up, fueled by the continued surge of streaming, which nearly doubled last
year.
And yet the biggest music consumption story of the year was not even available on streaming
services. We were awed by Adele’s record-crushing 25. We monitored daily activity across
sales, streaming, airplay and social, and were thrilled to report on every new milestone she
achieved, incredible by any measuring stick.
We also “listened” to over 500,000 music consumers in 2015. We learned about their
consumption behaviors and preferences. We learned about their social activity – how they
engage with their favorite artists, and how they use it to follow festivals and discover new
music. And importantly, we also showed brands the power and value of music fans; how to
reach them, and how to connect with them.
As advocates for the business of music, we are passionate about delivering the most
valuable, actionable, insights into music fans - and believe that smart data can inform
creativity. We hope you enjoy these 2015 highlights, and look forward to measuring your
amazing 2016 successes.
-Sincerely,
ERIN CRAWFORD
ERIN CRAWFORD SVP
ENTERTAINMENT &
GM MUSIC
WELCOME

32015 NIELSEN MUSIC U.S. REPORT Copyright © 2016 The Nielsen Company
CONTENTSHIGHLIGHTS AND ANALYSIS ............................................................. 4
YEAR IN MUSIC REVIEW ..................................................................... 6
CONSUMPTION CHARTS ................................................................... 7
BILLBOARD CHARTS ........................................................................... 11
ADELE ................................................................................................. 16
N-SCORE ............................................................................................. 18
RADIO .................................................................................................. 19
TWITTER TV RATINGS ......................................................................... 21
SOCIAL ................................................................................................ 22
FAN INSIGHTS .................................................................................. 23
MUSIC DISCOVERY.............................................................................. 24
MUSIC SPENDING............................................................................... 25
LIVE MUSIC ATTENDANCE.................................................................. 26
STREAMING SERVICES......................................................................... 27

4 2015 NIELSEN MUSIC U.S. REPORT
NIELSEN MUSIC 2015 YEAR-END HIGHLIGHTS AND ANALYSIS
• Adele’s 25 was the sales story of the year, despite only being available for the last
6 weeks of the year.
• Week ending 11/26 (release week), Adele shatters the single week Nielsen
SoundScan record for weekly album sales with over 3.377 Million units,
breaking the record previously held by NSync’s album, No Strings Attached,
which sold 2.416 Million in its first week.
• For its release week, Adele/25 set an all-time record for highest album
share of total industry albums when it accounted for over 41% of the total
industry album sales for the week.
• Adele/25 was the first title to ever scan over 1 Million units in multiple
weeks when she accomplished that feat in her second week (week-ending
12/03), with 1.112 Million album sales and then capped it off with an
unprecedented third week with 1.157 Million album sales during week-
ending 12/24.
• Adele/25 set a first week record for Digital album sales as well, when she
sold 1.644 Million digital albums.
• After only 6 weeks of sales, Adele/25 is already the 61st best-selling album
in Nielsen SoundScan history with over 7.4 Million sales.
• Adele’s catalog also showed dramatic increases in conjunction with the new
release as 21 re-entered the top 10 on the Billboard 200 chart for week-
ending 11/26 at Number 9. That was the first appearance in the top 10 for
21 since 10/21/2012, a span of over 3 years. Adele’s album 21 has also risen
to be the 10th best-selling album in SoundScan history with over 11.4 Million
sales.
• Sales of Adele/25 represented 3.1% of all album sales for the year and 16.4%
of all album sales during the six weeks since its release. Coupled with her
Catalog albums, 21 and 19 the total Adele Catalog sold 8 Million albums in
2015.
• This is Adele’s 3rd time as biggest-selling album of the year – she topped
the year-end album chart in 2011 and 2012 with her album 21 selling 5.8M
and 4.4M respectively. No other artist in SoundScan history has ever
topped the year-end album chart three times.
• Adele/25 was also 16.4% of all Digital Albums sold in the last 6 weeks of the
year and was 48% of all digital albums sold during its release week. It also
52015 NIELSEN MUSIC U.S. REPORT Copyright © 2016 The Nielsen Company
was an amazing 26% of all albums sold at Mass Merchant retailers in the
six weeks since its release.
• Streaming continues its growth with Audio on-demand streaming (+83% vs LY)
and Video on-demand streaming (+102%) both increasing dramatically.
• Catalog continues to be the biggest share of on-demand streams, with
songs over 18 months old accounting for nearly 70% of all streaming
volume.
• Streaming Equivalent Albums (where 1,500 streams is equivalent to 1
album) comprised 38.5% of the total industry volume, up from 23% in 2014.
• An all-time weekly record was set week-ending 12/24 with nearly 7.5 Billion
on-demand streams.
• Justin Bieber set an all-time record for total Audio on-demand streams in
one week for an album when songs from his album Purpose had over 100
Million on-demand audio streams in its release week (week-ending 11/19).
• Vinyl LPs continued to set new all-time highs with nearly 12 Million units sold in
2015.
• This marks the 10th straight year of growth for Vinyl LPs and surpasses last
year’s previous record volume by 2.8 Million units.
• Independent record stores continue to be the biggest driver of Vinyl LP
sales, with over 45% of Vinyl LP sales coming from the Independent stores.
• Rock is still the biggest genre for Vinyl LPs with over 68% of Vinyl LP sales
coming from Rock titles. With strong sales of Vinyl LPs by Adele/25 and
Taylor Swift/1989, pop more than doubled its share of Vinyl LP sales from
2014 (5.7% of total in 2015 vs. 2.8% of total in 2014).
• Nearly 18% of all physical album sales for Rock were Vinyl LPs in 2015, up
from 13.4% in 2014.
• Genre highlights – it was a great year for Pop albums, as well as R&B/Hip-Hop.
• Pop Albums, led by Adele/25 and Taylor Swift/1989 showed the most growth
year-over-year with a gain of 23% vs. 2014. CD sales for Pop records were up
21% vs. 2014 and Digital Album sales were up 22%. Although it was off of a
small base, Vinyl LP sales for the Pop genre were up 163% vs. last year.
• R&B/Hip-Hop also showed growth in album sales vs. last year, as titles
such as Drake/If You’re Reading This, It’s Too Late, The Weeknd/Beauty
Behind the Madness and Kendrick Lamar/To Pimp A Butterf ly all had strong
years. Album sales for R&B/Hip-Hop were up 2% overall vs. 2014 and
Digital Album sales were up 19% vs. last year.
• Rock continued to be the #1 genre for Album sales, with nearly 33% of all
album sales coming from the Rock genre. Pop continues to dominate Track
sales, with 23% of track sales coming from the Pop genre. When it comes to
On-Demand Streaming, the dominant genre is R&B/Hip-Hop with over 21%
of on-demand streams coming from the R&B/Hip-Hop genre.

6 2015 NIELSEN MUSIC U.S. REPORT
FEBRUARY 1 99% increase in Katy Perry’s
album sales the week after her Super Bowl halftime
performance.
MARCH 305.5% increase in streams of Jay Z’s “Big Pimpin” the week following Tidal’s press launch.
FEBRUARY 8Most-Tweeted minute of the GRAMMYS is at 10:42 p.m. EST, when 121,000 Tweets are sent after Kanye West approaches the stage following Beck’s win for Album of the Year.
MARCH 17 The soundtrack for Fox’s hit TV series Empire debuts at Number 1 on the Billboard 200 chart. It’s the first TV soundtrack to debut at Number 1 since 2010.
APRIL 30Billboard Latin Music Awards:
Romeo Santos wins Top Latin Album of the Year for his album, Formula,
Vol.2, which has sold 300,000 units to date.
JUNE 30Apple Music launches. It is ranked as one of Nielsen’s Top 10 Smartphone apps of 2015 with 54.5 MM unique users.
2015 YEAR IN MUSIC REVIEWMUSIC CONSUMPTION
MA
RC
HFE
BR
UA
RY
AP
RIL
JUN
EN
OV
EM
BE
RD
EC
EM
BE
R
NOVEMBER 10After Chris Stapleton’s CMA performancewith Justin Timberlake, sales of his album Traveller increase 6,000% putting it at the top of the Billboard 200 chart.
NOVEMBER 20 Adele’s album 25 sells 3.37 million in
its first week to beat NSYNC’sNo Strings Attached single-week record
for album sales set back in 2000.
DECEMBER 11 Billboard names Lady Gaga, Woman of the Year.
According to Nielsen’s Talent Analytics, Lady Gaga scores above the average in terms of “Awareness,”
“Influential,” “Social Media Savvy, “ and “Trendsetter.”
DECEMBER 21Mariah Carey’s “All I Want For Christmas Is You” is the top on-demand holiday song with 8 million streams for this week.
DECEMBER 24The Beatles start streaming and their catalog has over 14 million streams by Christmas. Radio spins increase 89% 12/24-12/28 compared to the previous week.
APRIL 18Record Store Day: the indie sector accounts for 532,000 album scans, or 21.5 % of total physical album sales, and 11.9 % of overall sales, representing the highest weekly sales percentages total for the indies since 2003.

72015 NIELSEN MUSIC U.S. REPORT Copyright © 2016 The Nielsen Company
(INCLUDES ALL ALBUMS & TRACK EQUIVALENT ALBUMS &
STREAMING EQUIVALENT ALBUMS –IN MILLIONS)
(INCLUDES CD, CASSETTE, VINYL , & DIGITAL ALBUMS – IN
MILLIONS)
NOTE: TRACK EQUIVALENT ALBUMS RATIO OF 10 TRACKS TO 1 ALBUM AND
STREAMING EQUIVALENT ALBUMS RATIO OF 1500 STREAMS TO 1 ALBUM
OVERALL ALBUM CONSUMPTION WITH TEA AND SEA
TOTAL ALBUM SALES
2015
2015
549.4
241.4
125.6
103.3
11.9
2014
2014
476.9
257.0
140.8
106.5
9.2
% CHG.
% CHG.
+15.2%
-6.1%
-10.8%
-2.9%
+29.8%
TOTAL ALBUM + TEA + SEA
TOTAL UNITS
CD
DIGITAL
LP/VINYL
Source: Nielsen Music 12/29/14 -12/31/15
8 2015 NIELSEN MUSIC U.S. REPORT
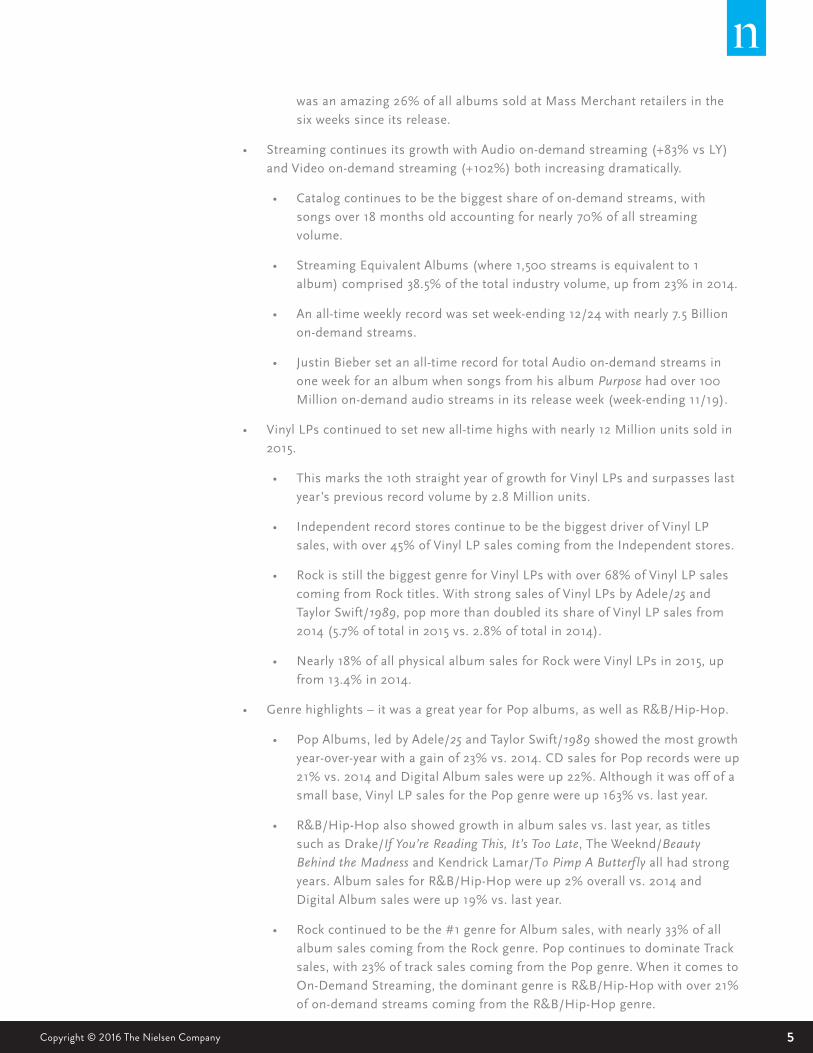
(INCLUDES CDS, CASSETTES, VINYL LPS – IN MILLIONS)
PHYSICAL ALBUM SALES BY STORE TYPE
2015
31.0
18.2
62.9
38.5
2014
28.7
17.3
51.2
40.9
% CHG.
-7.5%
-5.0%
-18.6%
+6.2%
CHAIN
INDEPENDENT
MASS MERCHANT
NON-TRADITIONAL
(NON-TRADITIONAL INCLUDES INTERNET, VENUE, DIRECT-TO-CONSUMER AND
OTHER NON-TRADITIONAL RETAIL OUTLETS)
(IN MILLIONS)
DIGITAL TRACK SALES
2015
964.8
2014
1,102.5
% CHG.
-12.5%TOTAL UNITS
2015 2014 % CHG.
(INCLUDES AUDIO + VIDEO DATA FROM AOL, BEATS, CRICKET,
GOOGLE PLAY, MEDIANET, RDIO, RHAPSODY, SLACKER, SPOTIFY,
XBOX MUSIC, YOUTUBE/VEVO - IN BILLIONS)
ON-DEMAND MUSIC STREAMS
317.2STREAMS 164.5 +92.8%
AUDIO 144.9 79.1 +83.1%
172.4VIDEO 85.4 +101.9%
92015 NIELSEN MUSIC U.S. REPORT Copyright © 2016 The Nielsen Company
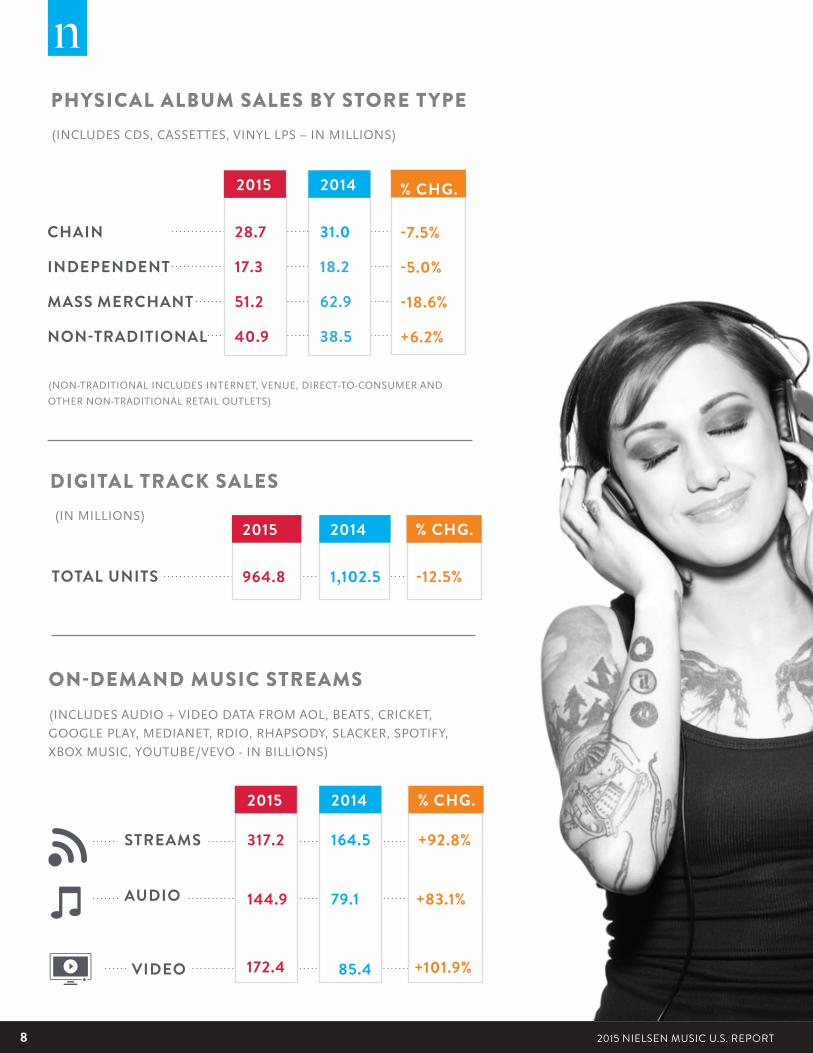
(DIGITAL ALBUMS + TRACK EQUIVALENT ALBUMS + STREAMING
EQUIVALENT ALBUMS – IN MILLIONS)
TOTAL DIGITAL MUSIC CONSUMPTION
2015
411.3
2014
326.4
% CHG.
+26.0%TOTAL UNITS
2015 2014 % CHG.
(CATALOG IS DEFINED AS OVER 18 MONTHS SINCE RELEASE
IN MILLIONS)
CURRENT AND CATALOG SALES
65.8
71.2
76.3
73.7
-13.8%
-2.7%
CURRENT
CATALOG
118.5
479.8
122.8
484.9
130.5
532.9
126.5
569.6
-9.2%
-10.0%
-2.9%
-14.9%
CURRENT
CATALOG
CURRENT
CATALOG
52.5
50.9
53.8
52.6
-2.5%
-3.4%
CURRENT
CATALOG
PHYSICAL ALBUMS
OVERALL ALBUMS
DIGITAL ALBUMS
DIGITAL TRACKS
NOTE: TRACK EQUIVALENT ALBUMS RATIO OF 10 TRACKS TO 1 ALBUM AND STREAMING
EQUIVALENT ALBUMS RATIO OF 1500 STREAMS TO 1 ALBUM

10 2015 NIELSEN MUSIC U.S. REPORT
GENRE % OF FORMAT TOTAL
% OF TOTAL
CONSUMPTIONALBUMS TRACKS STREAMS
CHILDREN 1.1% 1.8% 0.4% 0.6%
CHRISTIAN/GOSPEL 2.8% 3.4% 2.8% 2.1%
CLASSICAL 1.3% 2.1% 0.5% 0.7%
COUNTRY 8.5% 11.2% 11.5% 4.1%
DANCE/ELECTRONIC (EDM) 3.4% 1.8% 4.2% 4.7%
HOLIDAY/SEASONAL 1.7% 3.0% 0.8% 0.8%
JAZZ 1.3% 2.1% 0.6% 0.6%
LATIN 4.5% 2.1% 1.7% 8.5%
POP 15.7% 14.1% 22.6% 14.5%
R&B/HIP-HOP 18.2% 15.1% 19.7% 21.1%
ROCK 24.5% 32.6% 19.8% 17.5%
GENRE BREAKDOWN – TOTAL CONSUMPTION BY FORMAT(SELECTED TOP GENRES – ALBUMS + TRACK EQUIVALENT ALBUMS + STREAMING EQUIVALENT ALBUMS)
GENRE % OF TOTAL
PHYSICAL ALBUM DIGITAL ALBUM TEA SEA
CHILDREN 51% 21% 6% 22%
CHRISTIAN/GOSPEL 27% 26% 18% 29%
CLASSICAL 45% 27% 7% 22%
COUNTRY 37% 20% 24% 19%
DANCE/ELECTRONIC (EDM) 7% 17% 22% 54%
HOLIDAY/SEASONAL 55% 19% 8% 18%
JAZZ 46% 27% 8% 19%
LATIN 16% 4% 7% 73%
POP 23% 16% 25% 35%
R&B/HIP-HOP 18% 18% 19% 45%
ROCK 34% 24% 14% 27%
FORMAT BREAKDOWN- TOTAL CONSUMPTION BY GENRE(SELECTED TOP GENRES)
Read as: 11.2% of albums are Country titles.

112015 NIELSEN MUSIC U.S. REPORT Copyright © 2016 The Nielsen Company
RANK ARTIST TITLETOTAL
VOLUME (000s)
ALBUM
SALES (000s)
SONG
SALES (000s)
ON-DEMANDAUDIO STREAMS
(000s)
1 ADELE 25 8,008 7,441 4,770 135,400
2 TAYLOR SWIFT 1989 3,105 1,993 10,563 83,002
3 JUSTIN BIEBER PURPOSE 2,225 1,269 4,672 732,357
4 ED SHEERAN X 2,206 1,162 6,786 548,663
5 THE WEEKNDBEAUTY BEHIND THE
MADNESS 2,045 862 6,156 849,813
6 DRAKEIF YOU'RE READING THIS,
IT'S TOO LATE 1,919 1,142 2,770 749,380
7 MEGHAN TRAINOR TITLE 1,795 1,007 5,833 307,136
8 SAM SMITH IN THE LONELY HOUR 1,741 1,018 4,168 459,192
9 SAM HUNT MONTEVALLO 1,378 757 4,387 273,118
10 FETTY WAP FETTY WAP 1,295 254 6,342 609,994
RANK ARTIST TITLE SALES (000s)
1 ADELE 25 7,441
2 TAYLOR SWIFT 1989 1,993
3 JUSTIN BIEBER PURPOSE 1,269
4 ED SHEERAN X 1,162
5 DRAKE IF YOU'RE READING THIS, IT’S TOO LATE 1,142
6 SAM SMITH IN THE LONELY HOUR 1,018
7 MEGHAN TRAINOR TITLE 1,007
8 THE WEEKND BEAUTY BEHIND THE MADNESS 862
9 SOUNDTRACK FIFTY SHADES OF GREY 861
10 LUKE BRYAN KILL THE LIGHTS 851
2015 TOP ALBUMS (BASED ON U.S. SALES)
2015 OVERALL TOP 10(BASED ON U.S. ALBUM SALES; TRACK EQUIVALENT ALBUMS; STREAM EQUIVALENT ALBUMS)
BILLBOARD’S TOP CHARTS OF 2015 COMPILED BY NIELSEN MUSIC
12 2015 NIELSEN MUSIC U.S. REPORT
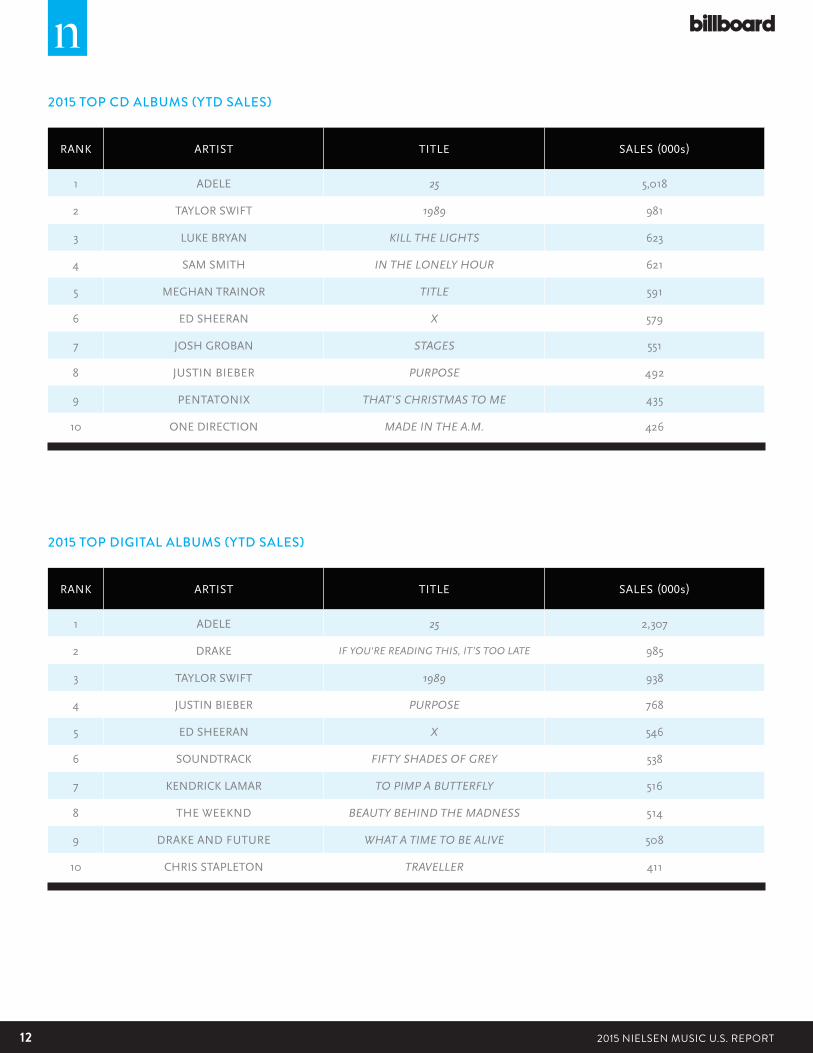
RANK ARTIST TITLE SALES (000s)
1 ADELE 25 5,018
2 TAYLOR SWIFT 1989 981
3 LUKE BRYAN KILL THE LIGHTS 623
4 SAM SMITH IN THE LONELY HOUR 621
5 MEGHAN TRAINOR TITLE 591
6 ED SHEERAN X 579
7 JOSH GROBAN STAGES 551
8 JUSTIN BIEBER PURPOSE 492
9 PENTATONIX THAT'S CHRISTMAS TO ME 435
10 ONE DIRECTION MADE IN THE A.M. 426
2015 TOP CD ALBUMS (YTD SALES)
RANK ARTIST TITLE SALES (000s)
1 ADELE 25 2,307
2 DRAKE IF YOU'RE READING THIS, IT’S TOO LATE 985
3 TAYLOR SWIFT 1989 938
4 JUSTIN BIEBER PURPOSE 768
5 ED SHEERAN X 546
6 SOUNDTRACK FIFTY SHADES OF GREY 538
7 KENDRICK LAMAR TO PIMP A BUTTERFLY 516
8 THE WEEKND BEAUTY BEHIND THE MADNESS 514
9 DRAKE AND FUTURE WHAT A TIME TO BE ALIVE 508
10 CHRIS STAPLETON TRAVELLER 411
2015 TOP DIGITAL ALBUMS (YTD SALES)

132015 NIELSEN MUSIC U.S. REPORT Copyright © 2016 The Nielsen Company
RANK ARTIST TITLE SALES (000s)
1 ADELE 25 116
2 TAYLOR SWIFT 1989 74
3 PINK FLOYD DARK SIDE OF THE MOON 50
4 BEATLES ABBEY ROAD 49,8
5 MILES DAVIS KIND OF BLUE 49
6 ARCTIC MONKEYS AM 48
7 SUFJAN STEVENS CARRIE & LOWELL 44,9
8 ALABAMA SHAKES SOUND & COLOR 44,6
9 HOZIER HOZIER 43
10 SOUNDTRACK GUARDIANS OF THE GALAXY 43
2015 TOP LP VINYL ALBUMS (YTD SALES)
RANK ARTIST SONG SALES (000s)
1 MARK RONSON FEAT. BRUNO MARS “UPTOWN FUNK!” 5,529
2 ED SHEERAN “THINKING OUT LOUD” 3,976
3 WIZ KHALIFA FEAT. CHARLIE PUTH “SEE YOU AGAIN” 3,801
4 ADELE “HELLO” 3,712
5 MAROON 5 “SUGAR” 3,343
6 WALK THE MOON “SHUT UP AND DANCE” 2,986
7 FETTY WAP ‘TRAP QUEEN’ 2,730
8 OMI “CHEERLEADER” 2,698
9 THE WEEKND “THE HILLS” 2,586
10 TAYLOR SWIFT FEAT. KENDRICK LAMAR “BAD BLOOD” 2,580
2015 TOP DIGITAL SONGS (YTD SALES)
14 2015 NIELSEN MUSIC U.S. REPORT
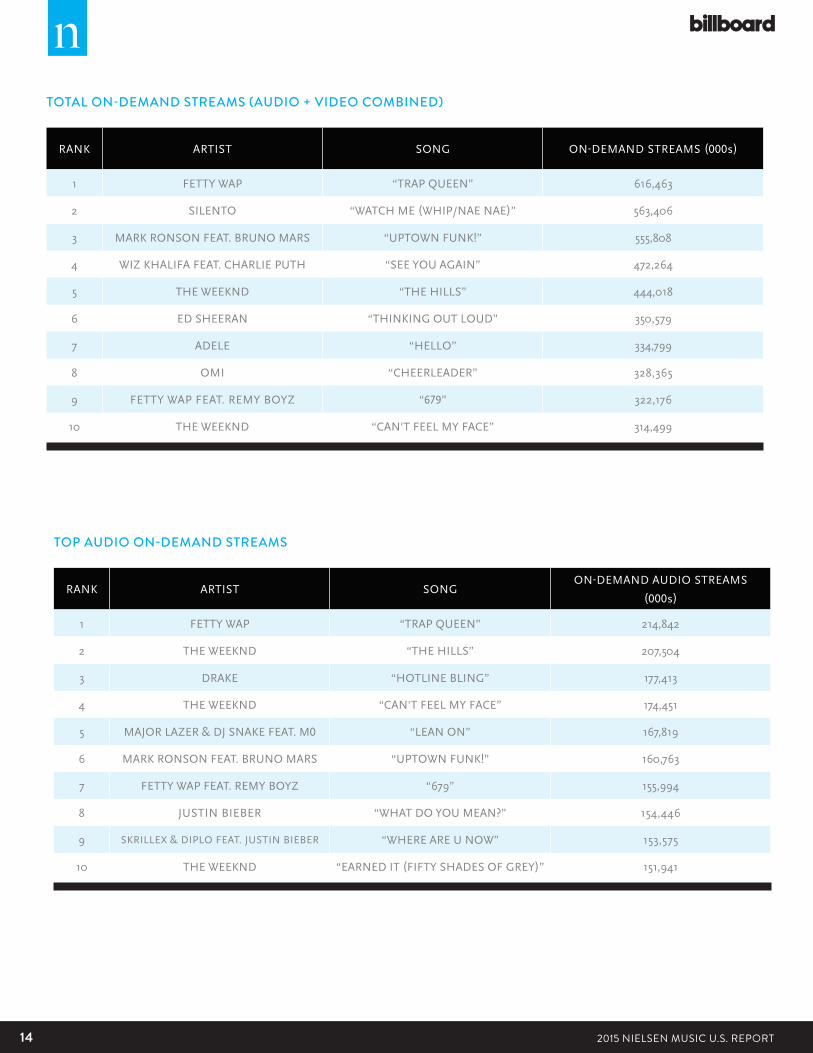
RANK ARTIST SONG ON-DEMAND STREAMS (000s)
1 FETTY WAP “TRAP QUEEN” 616,463
2 SILENTO “WATCH ME (WHIP/NAE NAE)” 563,406
3 MARK RONSON FEAT. BRUNO MARS “UPTOWN FUNK!” 555,808
4 WIZ KHALIFA FEAT. CHARLIE PUTH “SEE YOU AGAIN” 472,264
5 THE WEEKND “THE HILLS” 444,018
6 ED SHEERAN “THINKING OUT LOUD” 350,579
7 ADELE “HELLO” 334,799
8 OMI “CHEERLEADER” 328,365
9 FETTY WAP FEAT. REMY BOYZ “679” 322,176
10 THE WEEKND “CAN'T FEEL MY FACE” 314,499
TOTAL ON-DEMAND STREAMS (AUDIO + VIDEO COMBINED)
RANK ARTIST SONGON-DEMAND AUDIO STREAMS
(000s)
1 FETTY WAP “TRAP QUEEN” 214,842
2 THE WEEKND “THE HILLS” 207,504
3 DRAKE “HOTLINE BLING” 177,413
4 THE WEEKND “CAN'T FEEL MY FACE” 174,451
5 MAJOR LAZER & DJ SNAKE FEAT. M0 “LEAN ON” 167,819
6 MARK RONSON FEAT. BRUNO MARS “UPTOWN FUNK!” 160,763
7 FETTY WAP FEAT. REMY BOYZ “679” 155,994
8 JUSTIN BIEBER “WHAT DO YOU MEAN?” 154,446
9 SKRILLEX & DIPLO FEAT. JUSTIN BIEBER “WHERE ARE U NOW” 153,575
10 THE WEEKND “EARNED IT (FIFTY SHADES OF GREY)” 151,941
TOP AUDIO ON-DEMAND STREAMS
152015 NIELSEN MUSIC U.S. REPORT Copyright © 2016 The Nielsen Company
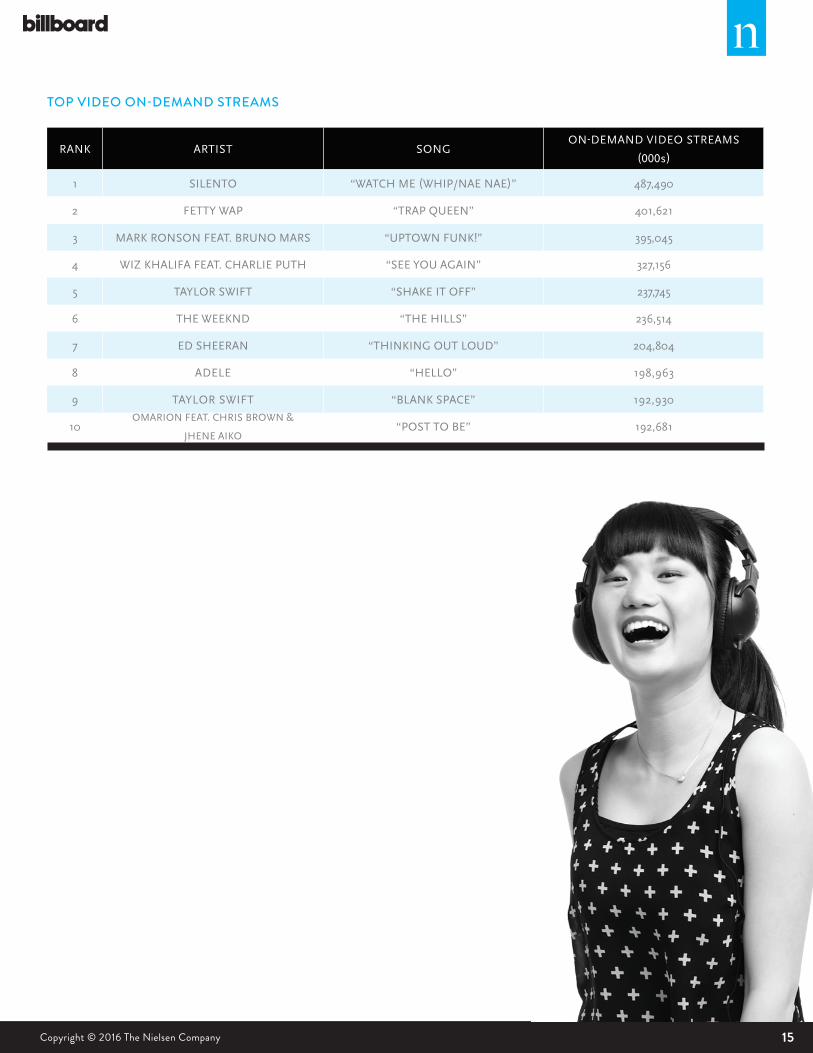
RANK ARTIST SONGON-DEMAND VIDEO STREAMS
(000s)
1 SILENTO “WATCH ME (WHIP/NAE NAE)” 487,490
2 FETTY WAP “TRAP QUEEN” 401,621
3 MARK RONSON FEAT. BRUNO MARS “UPTOWN FUNK!” 395,045
4 WIZ KHALIFA FEAT. CHARLIE PUTH “SEE YOU AGAIN” 327,156
5 TAYLOR SWIFT “SHAKE IT OFF” 237,745
6 THE WEEKND “THE HILLS” 236,514
7 ED SHEERAN “THINKING OUT LOUD” 204,804
8 ADELE “HELLO” 198,963
9 TAYLOR SWIFT “BLANK SPACE” 192,930
10OMARION FEAT. CHRIS BROWN &
JHENE AIKO“POST TO BE” 192,681
TOP VIDEO ON-DEMAND STREAMS

16 2015 NIELSEN MUSIC U.S. REPORT
ADELE
BUILDING ON THE SUCCESS OF 21
2015 WAS THE YEAR OF ADELE
After a four year break, Adele’s long-awaited new album 25 arrived in late fall and has been breaking records ever since. With over 7.4 million YTD album sales (in just six weeks), Adele and 25 were the feel-good story of the year for the music industry. We break down the numbers…
253 consecutive weeks in the chart… and counting!
11.3M sales to date
2 YEARStop-selling album in a row
6Grammy Awardsincluding 'Album of The Year '
“HELLO” RELEASED OCTOBER 23
1.1million record-setting downloads in one week
129million audio streams to date
188million video streams to date
Vll
Vll
Vll
3.38million record-setting sales first week
1.1million record-setting sales second week
1.2million sales week-ending 12.24; only album to sell more than 1 million in 3 different weeks – ever
25RELEASEDNOVEMBER 20, 2015
TV APPEARANCES (all NBC)
THE FANS
12 - 17
2% 3%
18 - 34 35 - 54 55+
13% 13%11%
18%22%
19%
38%62%
Streaming Impact: 41% of people who purchased 25 the first week said that its lack of availability on streaming services impacted their purchase decision
But 86% of those people that they would have bought it anyway
Likeable and relatable: 55% of fans said that Adele is “someone I can relate to”
Adele is the most-liked current artist out of the 800+ artists that Nielsen tracks
41% 55%
How many can she sell? In a survey of U.S consumers, 32% either bought or intend to buy 25
She reaches people who don’t normally buy music - 20% of those who bought or intend to buy 25 identified as “non-music buyers”
32% 20%
SATURDAY NIGHT LIVETHE TONIGHT SHOW WITH JIMMY FALLON THE TODAY SHOW
“ADELE LIVE IN NEW YORK CITY” on NBC 12/14/15
NOV. 21ST
TOTAL P2+ VIEWERS
6,220,00AVERAGE 4,490,00
NOV. 23RD
TOTAL P2+ VIEWERS
3,973,00AVERAGE 3,430,00
NOV. 25TH
TOTAL P2+ VIEWERS
4,768,00AVERAGE 4,608,00
1.3 million people saw one or more of 51k Tweets about the show
2.4 million people saw one or more of 121k Tweets
about the show
641k people saw one or more of 20k Tweets about the show
The top hashtag was #AdeleLiveInNYC - mentioned in 31,700 Tweets
The highest rated TV concert special in over ten years.
"Hello" has been played over 270k times on U.S. radio with over 1.56 billion audience impressions.
of those who purchased 25 said the time that passed since her last release "made me want to buy it even more"
72%
23%More likely to try to eat gourmet food whenever they can
18%More likely to follow a favorite brand or company on a social net. site
22%More likely to buy new when in the market to
purchase an automobile
14%More likely to get their news from the internet
10%More likely to listen to
the radio every day
15%Less likely to enjoy television advertising

172015 NIELSEN MUSIC U.S. REPORT Copyright © 2016 The Nielsen Company
ADELE
BUILDING ON THE SUCCESS OF 21
2015 WAS THE YEAR OF ADELE
After a four year break, Adele’s long-awaited new album 25 arrived in late fall and has been breaking records ever since. With over 7.4 million YTD album sales (in just six weeks), Adele and 25 were the feel-good story of the year for the music industry. We break down the numbers…
253 consecutive weeks in the chart… and counting!
11.3M sales to date
2 YEARStop-selling album in a row
6Grammy Awardsincluding 'Album of The Year '
“HELLO” RELEASED OCTOBER 23
1.1million record-setting downloads in one week
129million audio streams to date
188million video streams to date
Vll
Vll
Vll
3.38million record-setting sales first week
1.1million record-setting sales second week
1.2million sales week-ending 12.24; only album to sell more than 1 million in 3 different weeks – ever
25RELEASEDNOVEMBER 20, 2015
TV APPEARANCES (all NBC)
THE FANS
12 - 17
2% 3%
18 - 34 35 - 54 55+
13% 13%11%
18%22%
19%
38%62%
Streaming Impact: 41% of people who purchased 25 the first week said that its lack of availability on streaming services impacted their purchase decision
But 86% of those people that they would have bought it anyway
Likeable and relatable: 55% of fans said that Adele is “someone I can relate to”
Adele is the most-liked current artist out of the 800+ artists that Nielsen tracks
41% 55%
How many can she sell? In a survey of U.S consumers, 32% either bought or intend to buy 25
She reaches people who don’t normally buy music - 20% of those who bought or intend to buy 25 identified as “non-music buyers”
32% 20%
SATURDAY NIGHT LIVETHE TONIGHT SHOW WITH JIMMY FALLON THE TODAY SHOW
“ADELE LIVE IN NEW YORK CITY” on NBC 12/14/15
NOV. 21ST
TOTAL P2+ VIEWERS
6,220,00AVERAGE 4,490,00
NOV. 23RD
TOTAL P2+ VIEWERS
3,973,00AVERAGE 3,430,00
NOV. 25TH
TOTAL P2+ VIEWERS
4,768,00AVERAGE 4,608,00
1.3 million people saw one or more of 51k Tweets about the show
2.4 million people saw one or more of 121k Tweets
about the show
641k people saw one or more of 20k Tweets about the show
The top hashtag was #AdeleLiveInNYC - mentioned in 31,700 Tweets
The highest rated TV concert special in over ten years.
"Hello" has been played over 270k times on U.S. radio with over 1.56 billion audience impressions.
of those who purchased 25 said the time that passed since her last release "made me want to buy it even more"
72%
23%More likely to try to eat gourmet food whenever they can
18%More likely to follow a favorite brand or company on a social net. site
22%More likely to buy new when in the market to
purchase an automobile
14%More likely to get their news from the internet
10%More likely to listen to
the radio every day
15%Less likely to enjoy television advertising

18 2015 NIELSEN MUSIC U.S. REPORT
2015 TOP 10 MUSICIANS AMONG MILLENNIALS (18-34)
N-SCORE Nielsen N-Score measures fans’ perception of top talent in music, sports, books, film and TV across 10
attributes including “Awareness,” “Likeability,” “Influential” and “Trendsetter.” N-Score is used by brands,
talent and content developers to understand endorsement value.
Source: Nielsen Talent Analytics
PINK
JENNIFER LOPEZ THE BEATLES
TAYLOR SWIFT KATY PERRY
ADELE KELLY CLARKSON
BEYONCÉ USHER
1 6
2 7
3 8
4 9
5 10
JUSTIN TIMBERLAKE

192015 NIELSEN MUSIC U.S. REPORT Copyright © 2016 The Nielsen Company
RADIORadio reaches more Americans than any other device or platform. 93%
of adult consumers (18+) use radio each week, more than TV (87%),
smartphones (71%), PCs (54%), TV-connected devices (40%) and tablets
(29%).
• In the 48 Nielsen portable people meter (PPM) markets, Pop
Contemporary Hit Radio (CHR) and Country were again the leading
music formats in 2015, followed by Adult Contemporary (AC), Hot
AC and Classic Hits.
• Urban Contemporary (aka Hip-Hop) radio had a record-breaking
year in 2015, reaching its highest share of 18-34 audience ever
recorded in PPM measurement. The format moved from 6th place in
2014 to 4th place this year on the 18-34 ranker, growing its audience
by 12% year-over-year.
• And during the summer, Classic Hits once again saw the most
audience growth in warm-weather months of any format. 2015
marked the second consecutive summer that Classic Hits listening
spiked more than any other type of radio across the U.S.
RANK ARTIST SONG PLAYS (000s)IMPRESSIONS
(000s)
1 MARK RONSON FEAT. BRUNO MARS “UPTOWN FUNK!” 854 4,804,496
2 WALK THE MOON “SHUT UP AND DANCE” 706 3,981,730
3 ED SHEERAN “THINKING OUT LOUD” 632 3,586,173
4 MAROON 5 “SUGAR” 618 3,470,501
5 JASON DERULO “WANT TO WANT ME” 568 3,071,643
6 WIZ KHALIFA FEAT. CHARLIE PUTH “SEE YOU AGAIN” 564 3,140,899
7 TAYLOR SWIFT “STYLE” 550 3,163,189
8 THE WEEKND “EARNED IT (FIFTY SHADES OF GREY)” 543 2,928,354
9 ELLIE GOULDING “LOVE ME LIKE YOU DO” 530 2,928,018
10 THE WEEKND “CAN'T FEEL MY FACE” 528 2,900,066
2015 TOP RADIO SONGS (U.S. RADIO – ALL FORMATS, INCLUDING NETWORK & SATELLITE)
20 2015 NIELSEN MUSIC U.S. REPORT
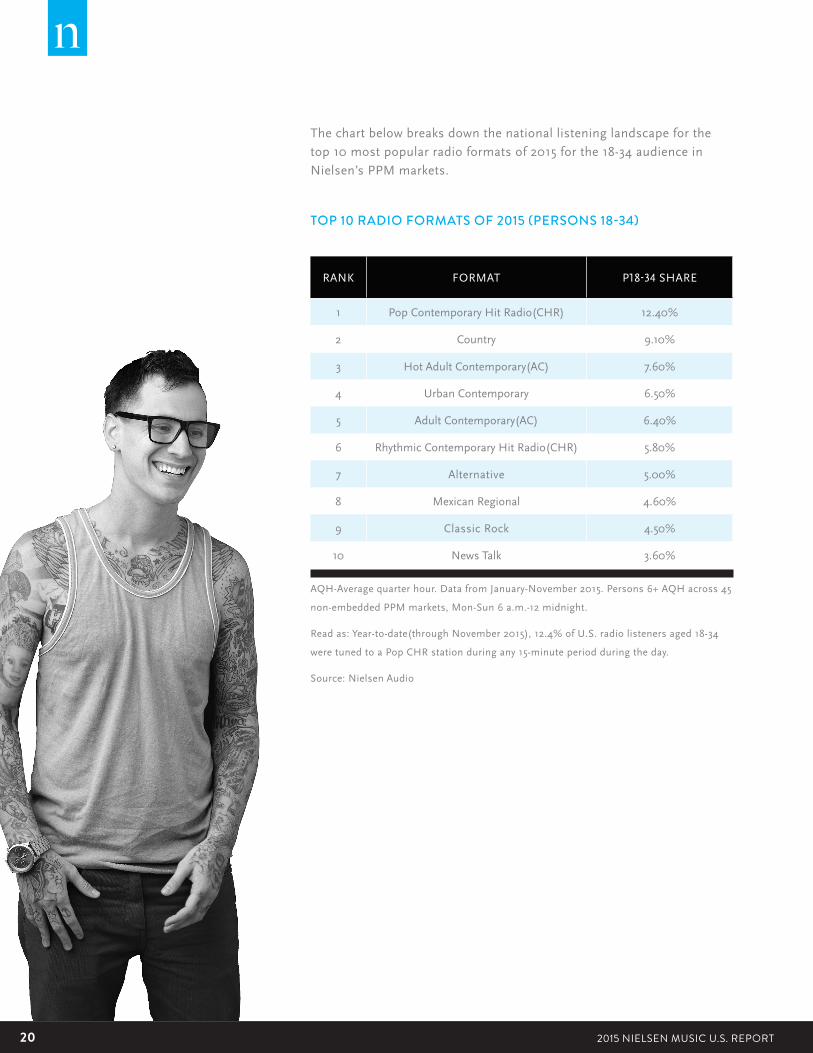
RANK FORMAT P18-34 SHARE
1 Pop Contemporary Hit Radio(CHR) 12.40%
2 Country 9.10%
3 Hot Adult Contemporary(AC) 7.60%
4 Urban Contemporary 6.50%
5 Adult Contemporary(AC) 6.40%
6 Rhythmic Contemporary Hit Radio(CHR) 5.80%
7 Alternative 5.00%
8 Mexican Regional 4.60%
9 Classic Rock 4.50%
10 News Talk 3.60%
AQH-Average quarter hour. Data from January-November 2015. Persons 6+ AQH across 45
non-embedded PPM markets, Mon-Sun 6 a.m.-12 midnight.
Read as: Year-to-date(through November 2015), 12.4% of U.S. radio listeners aged 18-34
were tuned to a Pop CHR station during any 15-minute period during the day.
Source: Nielsen Audio
The chart below breaks down the national listening landscape for the
top 10 most popular radio formats of 2015 for the 18-34 audience in
Nielsen’s PPM markets.
TOP 10 RADIO FORMATS OF 2015 (PERSONS 18-34)
212015 NIELSEN MUSIC U.S. REPORT Copyright © 2016 The Nielsen Company
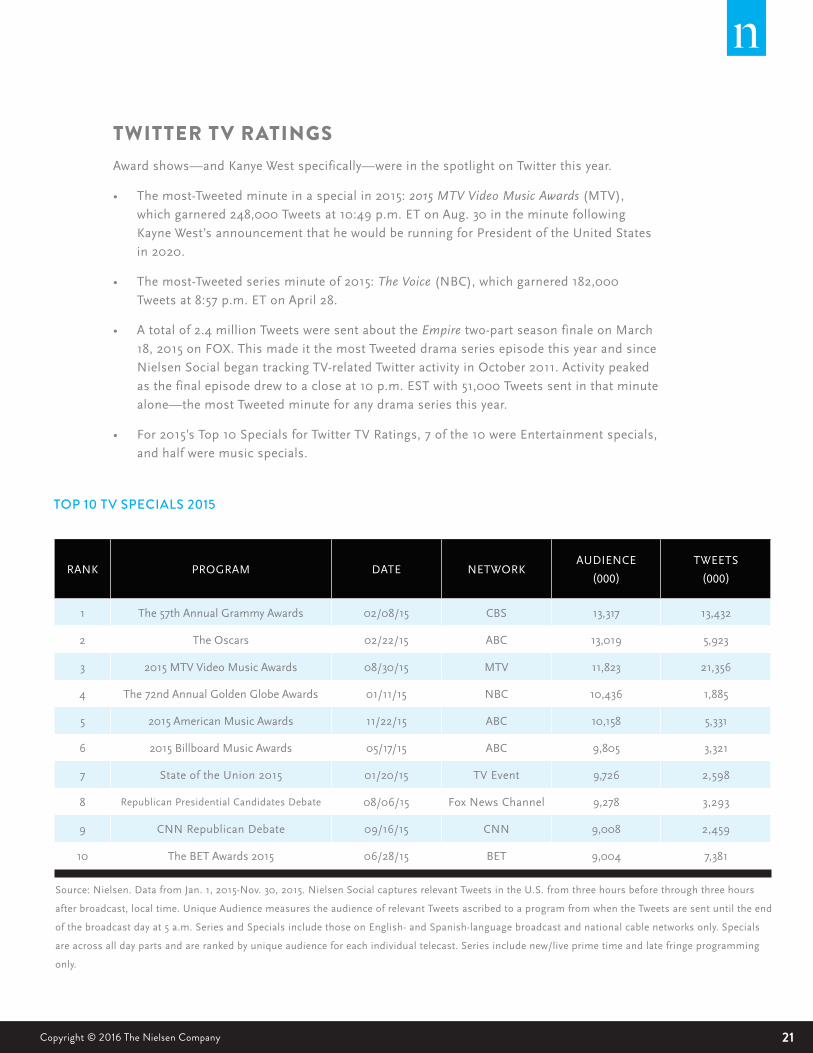
TWITTER TV RATINGSAward shows—and Kanye West specifically—were in the spotlight on Twitter this year.
• The most-Tweeted minute in a special in 2015: 2015 MTV Video Music Awards (MTV),
which garnered 248,000 Tweets at 10:49 p.m. ET on Aug. 30 in the minute following
Kayne West’s announcement that he would be running for President of the United States
in 2020.
• The most-Tweeted series minute of 2015: The Voice (NBC), which garnered 182,000
Tweets at 8:57 p.m. ET on April 28.
• A total of 2.4 million Tweets were sent about the Empire two-part season finale on March
18, 2015 on FOX. This made it the most Tweeted drama series episode this year and since
Nielsen Social began tracking TV-related Twitter activity in October 2011. Activity peaked
as the final episode drew to a close at 10 p.m. EST with 51,000 Tweets sent in that minute
alone—the most Tweeted minute for any drama series this year.
• For 2015’s Top 10 Specials for Twitter TV Ratings, 7 of the 10 were Entertainment specials,
and half were music specials.
RANK PROGRAM DATE NETWORKAUDIENCE
(000)
TWEETS
(000)
1 The 57th Annual Grammy Awards 02/08/15 CBS 13,317 13,432
2 The Oscars 02/22/15 ABC 13,019 5,923
3 2015 MTV Video Music Awards 08/30/15 MTV 11,823 21,356
4 The 72nd Annual Golden Globe Awards 01/11/15 NBC 10,436 1,885
5 2015 American Music Awards 11/22/15 ABC 10,158 5,331
6 2015 Billboard Music Awards 05/17/15 ABC 9,805 3,321
7 State of the Union 2015 01/20/15 TV Event 9,726 2,598
8 Republican Presidential Candidates Debate 08/06/15 Fox News Channel 9,278 3,293
9 CNN Republican Debate 09/16/15 CNN 9,008 2,459
10 The BET Awards 2015 06/28/15 BET 9,004 7,381
TOP 10 TV SPECIALS 2015
Source: Nielsen. Data from Jan. 1, 2015-Nov. 30, 2015. Nielsen Social captures relevant Tweets in the U.S. from three hours before through three hours
after broadcast, local time. Unique Audience measures the audience of relevant Tweets ascribed to a program from when the Tweets are sent until the end
of the broadcast day at 5 a.m. Series and Specials include those on English- and Spanish-language broadcast and national cable networks only. Specials
are across all day parts and are ranked by unique audience for each individual telecast. Series include new/live prime time and late fringe programming
only.

22 2015 NIELSEN MUSIC U.S. REPORT
GLOBAL TOP 10 ARTISTS, BASED ON SOCIAL & WEB ENGAGEMENTSocial/Web Engagement in 2015 based upon total RTD activity as of year
end.
KATY PERRY LADY GAGA
JUSTIN BIEBER EMINEM
TAYLOR SWIFT SELENA GOMEZ
SHAKIRA ADELE
RIHANNA JUSTIN TIMBERLAKE
1 6
2 7
3 8
4 9
5 10
Source: Nielsen Music Conncect

232015 NIELSEN MUSIC U.S. REPORT Copyright © 2016 The Nielsen Company
FAN INSIGHTS
Source: Nielsen Music 360 U.S. 2015

24 2015 NIELSEN MUSIC U.S. REPORT
HOW WE DISCOVER MUSIC
Source: Nielsen Music 360 U.S. 2015
Question: Which of the following are ways you discover new music?
Base: Total Respondents (3305)
Since 2014, more people are discovering music on the radio and at live events.

252015 NIELSEN MUSIC U.S. REPORT Copyright © 2016 The Nielsen Company
5% 5%11%5% 3%
7%7% 8%
3%11%
25% 12%
13%
13%
9%
7%
8%
9%
11%
1%
5%
10% 9%17%
32% 31% 29%
TOTAL TEENS (AGE 13-17)
MILLENNIALS (AGE 18-34)
ADMISSION TO LIVE MUSIC CONCERTS
ADMISSIONS TO MUSIC FESTIVALS
SATELLITE RADIO SUBSCRIPTION
PAID ONLINE MUSIC STREAMING SERVICES
PHYSICAL FORMS OF MUSIC (E.G. CDS, VINYL)
DIGITAL TRACKS/ALBUMS
MUSIC GIFT CARDS
ADMISSION TO SMALL LIVE MUSIC SESSIONS
ADMISSION TO DJ EVENT
HOW WE SPEND ON MUSIC
HOW WE SPEND ON MUSIC
About one-third of consumer spending on music is used towards live music events. Teens spend on
digital tracks and albums, while Millennials spend on music festivals.
$152 $80 $163
Source: Nielsen Music 360 U.S. 2015
Question: In a typical year about how much money do you spend on the following entertainment activities?

26 2015 NIELSEN MUSIC U.S. REPORT
LIVE MUSIC ATTENDANCE
Overall, live music attendance is up in 2015, with one half of Americans stating they’ve been to a
live music event. Club events, with or without a headlining DJ, are up since 2014. Millennials and
Hispanics are more likely to attend live music events compared to the general population.
Source: Nielsen Music 360 U.S. 2015
Question: About how many of the following types of live events, if any, do you attend per year?

272015 NIELSEN MUSIC U.S. REPORT Copyright © 2016 The Nielsen Company
When selecting a streaming service, most users cite cost and ease of
use as most important factors, followed by song library.
MOST IMPORTANT FACTORS IN CHOOSING A STREAMING SERVICE
Source: Nielsen Music 360 U.S. 2015

28 2015 NIELSEN MUSIC U.S. REPORT
ABOUT NIELSEN Nielsen Holdings plc (NYSE: NLSN) is a global performance
management company that provides a comprehensive understanding
of what consumers watch and buy. Nielsen’s Watch segment provides
media and advertising clients with Total Audience measurement
services for all devices on which content — video, audio and text
— is consumed. The Buy segment offers consumer packaged goods
manufacturers and retailers the industry’s only global view of retail
performance measurement. By integrating information from its Watch
and Buy segments and other data sources, Nielsen also provides its
clients with analytics that help improve performance. Nielsen, an S&P
500 company, has operations in over 100 countries, covering more than
90% of the world’s population.
For more information, visit www.nielsen.com.
Copyright © 2016 The Nielsen Company. All rights reserved. Nielsen and
the Nielsen logo are trademarks or registered trademarks of CZT/ACN
Trademarks, L.L.C. Other product and service names are trademarks or
registered trademarks of their respective companies.15/9032

2015 NIELSEN MUSIC U.S. REPORT