Safety 4900 CMSU Living with High Risk Technologies Charles Perrow, “Normal Accidents”

Organizational change in the Arizona funeralhome industry,1968-1999: Density, concentration,
and vital rates in a measured resource space
Item Type text; Dissertation-Reproduction (electronic)
Authors Breckenridge, Robert S.
Publisher The University of Arizona.
Rights Copyright © is held by the author. Digital access to this materialis made possible by the University Libraries, University of Arizona.Further transmission, reproduction or presentation (such aspublic display or performance) of protected items is prohibitedexcept with permission of the author.
Download date 12/06/2018 03:38:14
Link to Item http://hdl.handle.net/10150/280134

INFORMATION TO USERS
This manuscript has been reproduced from the microfilm master. UMI films
the text directly from the original or copy submitted. Thus, some thesis and
dissertation copies are in typewriter face, while others may be from any type of
computer printer.
The quality of this reproduction is dependent upon the quality of the
copy submitted. Broken or indistinct print, colored or poor quality illustrations
and photographs, print bleedthrough, substandard margins, and improper
alignment can adversely affect reproduction.
In the unlikely event that the author did not send UMI a complete manuscript
and there are missing pages, these will be noted. Also, if unauthorized
copyright material had to be removed, a note will indicate the deletion.
Oversize materials (e.g., maps, drawings, charts) are reproduced by
sectioning the original, beginning at the upper left-hand corner and continuing
from left to right in equal sections with small overiaps.
ProQuest Information and Learning 300 North Zeeb Road, Ann Arbor, Ml 48106-1346 USA
800-521-0600


ORGANIZATIONAL CHANGE IN THE
ARIZONA FUNERAL HOME INDUSTRY, 1968-1999:
DENSITY, CONCENTRATION, AND VITAL RATES IN
A MEASURED RESOURCE SPACE
by
Robert Saylor Breckenridge
Copyright © Robert Saylor Breckenridge 2002
A Dissertation Submitted to the Faculty of the
DEPARTMENT OF SOCIOLOGY
In Partial Fulfillment of the Requirements For the Degree of
DOCTOR OF PHILOSOPHY
In the Graduate College
THE UNIVERSITY OF ARIZONA
2 0 0 2

UMI Number; 3061017
Copyright 2002 by
Breckenridge, Robert Saylor
Ail rights reserved.
®
UMI UMI Microform 3061017
Copyright 2002 by ProQuest Information and Learning Company.
All rights reserved. This microform edition is protected against unauthorized copying under Title 17, United States Code.
ProQuest Information and Learning Company 300 North Zeeb Road
P.O. Box 1346 Ann Arbor, Ml 48106-1346

THE UNIVERSITY OF ARIZONA s,
GRADUATE COLLEGE
As members of the Final Examination Committee, we certify chat we have
read t h e d i s s e r t a t i o n p r e p a r e d b y Robert Saylor Breckenrl"dqe
e n t i t l e d ORGANIZATIONAL CHANGE IN THE ARIZONA FUNERAL HOME
INDUSTRY. 1968 - 1999: DENSITY. CONCENTRATION.
AND VITAL RATES IN A MEASURED RESOURCE SPACF
and recommend that it be accepted as fulfilling the dissertation
requ i r e m e n t f o r t h e D e g r e e o f Doctor of Philosophy
Ronald Breiger
t ^ g a — < - W i a I ^ I ̂ Q O ^
Elis^eth Clemens P^T
Sh^^ey Dace
Dace
Date
Final approval and acceptance of this dissertation is contingent upon
the candidate's submission of the final copy of the dissercacion to the
Graduate College.
I hereby certify that I have read this dissertation prepared under my
direction and recommend that it be accepted as fulfilling the dissertation
requirement.
L Dissertation Director
Ronald Breiger
S" '>'^ / C -2 T_ Date
3
STATEMENT BY AUTHOR
This dissertation has been submitted in partial fulfillment of requirements for an advanced degree at The University of Arizona and is deposited in the University Library to be made available to borrowers under rules of the Library.
Brief quotations from this dissertation are allowable without special permission, provided that accurate acknowledgment of source is made. Requests for permission for extended quotation from or reproduction of this manuscript in whole or in part may be granted by the copyright holder.
SIGNED

4
ACKNOWLEDGEMENTS
This dissertation could not have come to fruition without the help of the scholars, academicians, students, and friends with whom I have had the privilege of interacting. In particular I would like to thank the faculty, graduate students, and staff of the Department of Sociology at the University of Arizona - their assistance in this dissertation and my pursuit of sociology has been invaluable.
Special thanks are due to my dissertation co-chairs. Ronald L. Breiger revitalized my joie de sociologie by reminding me that social relationships are at the heart of our field, and that the social world is an interesting place; and Elisabeth S. Clemens, whose course on the State and Social Policy served early on to remind of the importance of the institutional environment, and who was available for a talk and a smile through the best and worst days of graduate school. Only through their unending support and patience has this project been possible. They have proved to be models for my professional career, my continuing enthusiasm for sociology, and my patience with my own students.
I thank my present and past committee members - James Shockey, who taught my first graduate sociology course, demography, which continues to provide a guiding set of ideas; James Ranger-Moore who introduced me to the arena of ecological analysis; and Marc Schneiberg, who focused my attention on firms and markets. The ideas and advice they have given me made this project possible and will continue to be guiding forces in my pursuit of sociology.
I would also like to acknowledge the faculty members who have been influential during my academic career - Albert Bergesen, Ted Borhek, Michael Hechter, Miller McPherson, Calvin Morrill, Charles Perrow, Walter Powell, Kathleen Schwartzman, David Snow, Michael Sobel, and Larry Wright. These Professors imparted the insight, wisdom, skill, and information necessary forme to pursue scholarship in Sociology.
My fellow graduate students and friends have always been good for ideas, criticism, inspiration and laughs. The following people have been of particular assistance in the completion of this project: Tim Bartley, Martin Bazant, Peter Catalanotte, Anne Chase, Ingrid Downey, Pat Goldsmith, Andy Halper, Christine Home, Jennifer Earl, Jenny Irons, Dan Jones, Garth McCallum-Keeler, Jason Miller, Michael Mulcahy, Kellie Rife, Wade Roberts, Alan Schussman, Laurel Smith-Doerr, Mary Nell Trautner, and Marcia Underwood. Further, Tom and Allison Munch-RotoIo deserve special thanks for being so especially special.
Thanks go to the staff of the Department of Sociology. Without the ongoing assistance of Sherry Enderle, Bonnie Thompson, Beverly Gilbert, and Vienna Marum this project would have been an even more Herculean task.
Finally, my thanks to the Arizona State Board of Funeral Directors and Embalmers, whose assistance in developing my understanding the Funeral Home Industry and acquiring historical data was necessary to the pursuit of this project.

TABLE OF CONTENTS
ABSTRACT
CHAPTER 1 - INTRODUCTION 10
TOPICAL, THEORETICAL, AND METHODOLOGICAL PUZZLES 18
FUNDAMENTALS OF CONCENTRATION 23
FORMALIZING THE DISSERTATION 25
THE PLAN OF THE DISSERTATION 30
CHAPTER 2 - THE CASE OF THE FUNERAL HOME INDUSTRY 35
FUNERAL ORGANIZATIONS AND HUMAN DEATH 38
INSTITUTIONS AND REGULATIONS 41
ORGANIZATIONAL STRUCTURES 44
CHAPTER 3 - THEORETICAL OVERVIEW AND HYPOTHESES 52
CHAPTER 4 - DATA, MODELS, AND METHODS 60
DATA 60
MODELS 68
METHODS 70
CHAPTER 5 - ORGANIZATIONAL DENSITIES 74
REVIEWING ORGANIZATIONAL DENSITY 75
HYPOTHESES AND EXPLORATIONS 77
DATA, MODELS, AND METHODS 81
DISCUSSION OF RESULTS 85
6
CHAPTER 6 - ORGANIZATIONAL CONCENTRATION 89
REVIEWING ORGANIZATIONAL CONCENTRATION 92
HYPOTHESES AND EXPLORATIONS 95
DATA, MODELS. AND METHODS 99
DISCUSSION OF RESULTS 103
CHAPTER 7 - ORGANIZATIONAL VITAL RATES 106
REVIEWING VITAL RATES 107
HYPOTHESES AND EXPLORATIONS 108
DATA, MODELS, AND METHODS 112
DISCUSSION OF RESULTS 116
CHAPTER 8-CONCLUSION 121
EXPLAINING CHANGES IN THE ARIZONA FUNERAL 123 HOME INDUSTRY
THEORETICAL CONTRIBUTIONS 128
FUTURE RESEARCH 129
APPENDIX A - FIGURES AND TABLES 131
Figure 1 131
Figure 2 132
Figure 3 133
Figure 4 134
Figure 5 135
Figure 6 136
Figure 7 137
7
Figure 8 138
Figure 9 139
Figure 10 140
Figure 11 141
Figure 12 142
Table 1 143
Table 2 147
Table 3 150
Table 4 151
Tables 152
Table 6 153
Table 7 154
Tables 155
Table 9 156
Table 10 157
Table 11 158
Table 12 159
Table 13 160
Table 14 161
Table 15 162
Table 16 163
Table 17 164

8
Table 18 165
Table 19 166
REFERENCES 169

9
ABSTRACT
In this dissertation, I examine organizational density and ownership relations in
the Funeral Home Industry in the state of Arizona between 1968 and 1999. I incorporate
the theories of organizational ecology and resource dependence alongside institutional
theory to analyze changing numbers and concentrations of organizations. In pursuit of
this research, I distinguish between establishments, the actual funeral home storefront
building operation, and firms, the organizations that own and manage one or more
establishments.
Focus is placed on two particular institutions in the funeral home industry: 1) the
tight social linkage between the industry and human deaths, and 2) the traditions that
limited growth among funeral home organizations. 1 use these institutional forces along
with the size of the resource space and organizational variables to examine competition
and concentration as forces affecting the numbers, relationships, and vital rates of
organizations via time-series cross-sectional methods.
My findings indicate that hyper-legitimacy of the industry relative to resources
plays a key role in population change by promoting organizational growth under
conditions of a growing resources space, leading to economies of scale. In general, my
results show that establishments develop in localized competitive markets in manners
compatible with theories of density and resource dependence; and firms operate at the
aggregated state level - across multiple county markets - in mamiers compatible with the
theories of resource partitioning.
10
CHAPTER 1 - INTRODUCTION
The ftineral home industry' presents itself as a particularly fascinating arena of
study, keyed by its direct relation to the unavoidable human condition of death. The
industry has been approached within the context of the sociology of death and dying and
labor issues", but it has been relatively neglected from the viewpoint of organizational
sociology^. In this dissertation, 1 pursue research precisely from the organizational
perspective, examining the roles of institutions, resources, and patterns of ownership in
the changing size and structure of the population of funeral home organizations operating
in the state of Arizona between 1968 and 1999.
My research stems from the idea that the funeral home industry in the United
States during the 20th century has been embedded in powerful social institutions that
affect its operations (Torres 1983; Torres 1988). First, at the intersection of funeral
operations with consumers, rigid institutions direct people to use funeral homes for the
formal processing of human deaths, and create strong expectations of propriety in the
services rendered; second, among funeral homes themselves, institutions established via
industry associations determine the manner in which businesses should be structured and
managed, and affect how organizations engage in the competitive marketplace; and third,
' The industry as bounded here includes business commonly referred to as funeral homes and mortuaries, interacting directly with consumers, providing services (e.g. embalming or cremation) and sales (e.g. caskets), but neither interment, which is the realm of cemeteries and mausoleums, nor exclusively secondary service - doing business exclusively with other funeral organizations. " See, for example, Kearl 1996 or Reynolds and Kalish 1974.

II
external, state-based legislation has imposed boundaries on the operation of funeral
homes by requiring licensing of both businesses and employees, and creating laws that
force the complete revelation of available service options and their prices (Torres 1983;
Torres 1988; Iserson 1994; Smith 1996; Roberts 1997; Mitford 1998; Arizona State
Board of Funeral Directors 2000). Broadly, these institutional forces have two important
consequences: they tightly link the industry and human deaths; and they place limitations
on variation in organizational form and behavior.
From the 1940s through the 1960s these institutions remained relatively stable.
The traditions of the industry encouraged funeral homes to operate primarily as "mom
and pop" businesses, remaining small in size and servicing geographically or socially
determined locales such as neighborhoods or specific religious groups. Further, funeral
directors were linked to these communities as professionals, akin to doctors, lawyers, or
clergy; and the industry operated without specific state or federal regulation (Habenstein
and Lamers 1955; Farrell 1980; Torres 1988; Smith 1997). For their part, the general
population depended on the services of funeral homes - typically pursuing embalming as
the method of final preparation of human deaths - and placed great trust in f\meral
directors, in part as a function of the industry's professional nature (Farrell 1980; Iserson
1994; Smith 1997; Mitford 1998). David Torres (1988) has shown that these institutional
patterns, along with a relatively stable numbers of deaths (around 1.5 million per year
during the 1940s and 50s, rising steadily to just under 2 million in the 1970s) discouraged
^ See Torres (1988) for a notable exception that directly informs this dissertation; and Parsons (1999) for an example from the UK.
12
fierce competition among businesses and resulted in a stable number of funeral homes
(around 18,000) operating in the U.S. during this time frame.
However, starting the 1960s and continuing through the 1990s, these institutions
have experienced flex; the "mom and pop" standard of operation has been augmented
with the acceptance of chain-form funeral homes that operate across county, state, and
national borders, and promote "business models" of profit maximization and fierce
competition; Federal regulation has come into existence, specifically directing methods
of operating ftjneral business; and the attitudes and choices of consumers, though not
their dependence on the services provided, have been altered via increasing suspicions of
price-gouging by the industry and increasing rates of cremation (Torres 1983; Torres
1988; Smith 1997; Mitford 1998). Thus, while the industry and human deaths have
remained firmly tied to one another, the manner in which they are linked has changed, as
has the acceptable range of organizational forms and modes of operation.
In this dissertation, I use these conditions to answer the question "How has the
history of institutions in the industry affected the numbers and forms of flineral home
organizations?" In particular, I take advantage of the tight linkage of the industry to the
resource of human deaths to answer the question "How have changing resources in
conjunction with changing institutions affected the numbers and forms of funeral home
organizations?" In pursuing this question, I draw on the theories of organizational
ecology and the logic of canying capacity; developing the idea that these changing
13
institutions and resources affect the legitimacy of organizational forms and the ferocity
and consequences of competition"* for limited resources.
Carrying capacity is a term taken from bio-ecology, where it has be used to
describe the set of possible combinations of numbers, types, and sizes of a specified
animal population (e.g. mammals, primates, or gorillas) that can be supported by the
conditions and resources (e.g. temperature, food, water, and other animals) found in a
given environment^ (Kingsland 1985). This same notion has been applied to populations
of organizations and the environments in which they operate, forming a basis for the field
of organizational ecology (Hannan and Freeman 1977; Haiman and Freeman 1989;
Carroll and Hannan 2000). In either case, carrying capacity is particularly important as
an indicator of competition and selection: as a population approaches the limits of the
See, for example, Baum and Oliver (1992) and Dobbin and Dowd (1997) for exemplary studies of the effects of institutions on competitive processes. ^ Consider a hypothetical biological example: a population of gorillas living on a mountainside. The gorilla-carrying capacity of this environment is determined by a wide range of factors, some of which describe gorillas themselves and others their external environment. Characterizing the target population, for example, the social structures common to gorillas limits the distribution of sex and age among the population (e.g. only one silverback "alpha-male" can live in a group, with fiercely competitive battles arising among multiple contenders to that status); the genetic structure of gorillas limits their size, preventing the need to consider the possibility of King Kong-like growth; and their biology determines them to be vegetarians, focused on a limited food source (Napier 1972). External to the target population, the volume of vegetation limits the number of gorillas that can exist without the occurrence of famine (and resultant deaths); and the set of other animal populations, in particular possible food competitors (e.g. chimpanzees but not bats) and predators (e.g. human-poachers but not Great White Sharks), fiorther limits the set of possible gorilla populations that can exist on the given mountainside. If we were to suddenly alter these rules such that, say, gorillas followed an alpha-female, or King Kong-like growth were possible, or gorillas were no longer vegetarians, then the set of conceivable gorilla populations that could live on the mountain would change dramatically, as gorillas themselves changed. Similarly, if a drought were to wipe away

14
resource space (perhaps by growing in numbers or having some members grow
particularly large), competitive forces increase in ferocity; and dramatic changes in the
environment can act as selective forces against population characteristics.
It is particularly important to recognize that carrying capacity refers to neither an
infinitely large, nor a constant set of hypothetical populations. Further, if a population
exists at all, then it must be being "carried" and is operating within carrying capacity.
The issue at hand is determining how close a population is to some boundary of carrying
capacity - this will reflect the extent of competitive and selective pressure being felt by
that population^.
Though it is very difficult, if not impossible, to precisely measure carrying
capacity, it is nonetheless determined by characteristics of the target population and
features of the environment, both of which are flexible and possibly measurable (see, for
example, McPherson 1983). Thus, carrying capacity is bounded by, and varies in
accordance with, many contingencies; for organizations these might include, say for
example, the volume of raw materials, demand for services, and legal constraints against
certain business practices. As such, measuring these types of features provides some
definition to carrying capacity; and more importantly for the ecological perspective, these
conditions combined with measures of the organizational mass itself provide indicators of
food sources or a band of poachers did move onto the mountain, then additional changes to carrying capacity would occur. '' If a hundred additional gorillas are placed on the aforementioned mountaintop, then competitive pressure will increases dramatically, resulting in the death of some portion of the population. Alternately, a Great White Shark can exist on the African mountaintop (or on a dune in the Sahara desert or in my kitchen), however environmental pressures combined with the creature's biology will quickly "select against" the shark.
15
competitive and selective pressures being experienced in organizational populations, and
can be used to model the vitality of organizational populations (Hannan and Freeman
1989; Hannan and Carroll 1992; Carroll and Hannan 2000).
Institutionally informed ecological research, the project at hand included, often
focuses on the following conditions as key to understanding populations of organizations
and the competitive and selective pressures they face: the amount of resources available
to organizations (Stinchcombe 1965; Hannan and Freeman 1977; see Baum and Oliver
(1992) for example); the number of organizations in the population (Harman and Freeman
1989; Hannan and Carroll 1992; see Hannan and Freeman (1987) for example); the sizes
of these organizations or the size distribution of a population of organizations (see
Bamett and Amburgey (1990) for example); and social institutions - which can be
envisioned as both constraints (see Bamett and Carroll (1993) for an example on formal
regulation) and encouragements (see Tucker, Singh, and Meinhard (1990) for an example
on endorsement) to the manners in which organizations are structured, how they interact
with each other, and how they approach the environment (Fligstein 1990; DiMaggio and
Powell 1991; Scott and Meyer 1994; Scott 1995). As played out in terms of the logic of
carrying capacity, these institutions can by forces of both selection, as might be the case
if regulation suddenly forbids a certain type of operation (e.g. the effect of Prohibition
laws on beer breweries), or competition, as might be the case when social arrangements
between actors change (e.g. the affect of de-regulation on the telephone industry).
With this in mind, the story of institutional change in the funeral home industry
links to changing populations and ideas of carrying capacity: as institutions change so do
16
the structures, behaviors, and relationships of funeral homes, affecting the relative
positioning of the population and the boundary of carrying capacity. At the same time,
the stable institutions that produce a tight linkage to the external resource of deaths afford
another identifiable feature of carrying capacity. I propose to use these conditions, as
indicators of variation in competitive and selective pressure felt within the population,
alongside measures of the size of organizational populations, thus allowing me to answer
more detailed questions of the form "How do institutions, resources, and numbers of
organizations combine to affect the founding and failure of funeral home organizations?"
As presented above, relationships between organizations are also features of
carrying capacity and, in turn, components of organizational populations affecting
competition and selection. In the funeral home industry, the change in institutional
structure which allowed for the rise of "chain-form" organizations is specifically
describing such a relationship: the ties between establishments and the firms that own
them^. Historically, the industry consisted predominantly of independent, family owned,
single-establishment firms. However, since the early 1970s local, interstate, and
international chains of funeral homes - with a single firm owning multiple
establishments, perhaps in multiple markets - have developed as large and powerful
entities (Smith 1996; Roberts 1997; Mitford 1998). This concentration of ownership is,
at least in part, a consequence of institutional change, but it has also dramatically altered
the nature of the industry, affecting competition and cooperation among firms and
^ "Establishment" refers to an actual place-of-business (e.g. the hypothetical Peaceful Funeral Home) and "firm" refers to an entity, such as a corporation (e.g. the hypothetical Mortuary Services Inc.), that owns and operates one or more such establishments.

17
establishments, channeling business between funeral homes and cemeteries with common
owners, and constraining the options available to consumers (Smith 1996; Mitford 1998).
As a consequence, including a measure of concentration of ownership will further
delineate carrying capacity and allow for a more detailed picture of the competitive
landscape.
Consider the specifics of the case at hand. In the state of Arizona between 1968
and 1999, the number of human deaths per year increased from 13,681 to 39,673; the
number of funeral establishments increased from 85 to 145; and the number of funeral
firms initially increased from 72 to 103 in 1984, then declined to 76 in 1999 (see Figure
I). One possible set of relations among this set of firms and establishments is an equal
distribution of ownership, where each firm owns an equal number of establishments.
However, this was certainly not the case in Arizona. Instead, the ownership of
establishments became increasingly concentrated (i.e. unequally distributed) within a
subset of multi-unit firms, such that in 1968, 24% of establishments were owned by 12%
of firms within the context of multi-unit operations; and by 1999,60% of the
establishments were linked with 24% of the firms in such organizations.
Unwrapping the forces behind these changes within the industry forms the basis
of my dissertation. Reformulating those presented above, I pursue answers to two broad
questions: 1) "How have changing industry institutions and resources affected the
numbers of organizations and concentration of ownership in the industry?" and 2) "How
have changing institutions, resources, numbers of organizations and organizational
concentration combined to affect the vital rates of the population of organizations?"
18
TOPICAL, THEORETICAL, AND METHODOLOGICAL PUZZLES
While the funeral home industry may be substantively intriguing, it presents as
uniquely suited for approaching several important theoretical and methodological issues
of organizational studies. Foremost to my dissertation, the industry's orientation to a
single resource affords an insightful foray into the study of institutional forces.
Specifically, I can compare the effects of the stable and strong institutions that tie deaths
to the industry against time-varying institutions that affect organizational and inter-
organizational structure and operations: by measuring deaths I can compare the effects of
changing elements within secure institutions against institutions that, themselves, change
over time. Organizational institutions are constructed in a variety of ways, including
habituation, associations among organizations, and/or regulations (Scott 1995); and they
can have powerful effects on organizational goals, structures, and relationships (Meyer
and Rowan 1977; DiMaggio and Powell 1983; North 1991; Scott 1995). In the fiineral
home industry, previous research (Torres 1988) has focused on stability in association-
based institutions as the explanation for the historic structuring of the industry, however
this research was pursued during a period, and at a level of aggregation, that featured a
stable number of deaths as well. In contrast, the case I examine presents changes in both
the resources space, associational guidelines, and federal regulation, allowing for a more
detailed examination of these forces. These institutions together identify a duality of
institutions in the industry - those affecting the structuring of organizations and those
operating at the level of the resources. These linkages of institutional and organizational

19
changes encourage the incorporation of time-varying period effects and the measurement
of the resources to which institutions are oriented in statistical models to account for
changing institutions and institutional forces (see, for example, Baum and Oliver (1992)),
enabling the pursuit of an understanding of how institutions affect organizational
densities and concentration in the industry.
A second puzzle relates precisely to resources. As indicated above, theories of
industrial development and organizational cooperation and competition often emphasize
the importance of resources. Two theoretical traditions which inform my dissertation,
organizational ecology (Hannan and Freeman 1977; Carroll and Hannan 2000) and
resource dependence (Pfeffer and Salancik 1978), specifically present competition for
limited resources as a force driving the vital organizational processes of founding, failure,
and consolidation. However, ambiguity in the identification and definition of resources,
unreliable measures of their availability, and difficulty in measuring the changing
economic force of demand can prove problematic to this area. For example, Carroll and
Swaminathan (1991; 1992; 2000) study the population of U.S. breweries, but would have
great difficulty measuring either raw materials or, perhaps more importantly, consumers
in order to control for the size of the resource space as a feature affecting these
organizations. Measuring, say, hops production would likely be ineffective at
establishing a constraint on the density of breweries, as breweries can have influence on
the production of hops flowers, and these flowers are resources for other industries as
well. Similarly, measuring beer drinkers, or potential drinkers, is extremely difficult.
Everyone is a potential consumer, but people can conceivably drink nothing or a great
20
deal from many different breweries in any given time period and consumptive tastes may
well be affected by the organizations themselves. These brewery studies, and other
similar ecological research, assume an unmeasured, but finite, level of resources upon
which the population of organizations depends. To explicate this basic theoretical
assumption, I am examining an industry in which the primary resource is unambiguous,
reliably documented, fully exploited, and exists prior to, and unaffected by, the industry
itself (Iserson 1994; Smith 1996). The fimeral home industry's minimalist orientation
toward the singular resource of dead bodies allows for this measure to be readily
incorporated into statistical models of organizational processes as a measure of raw
materials, an indicator of demand for the industry's services, and a feature of the
competitive landscape.
A third puzzle has faced the examination of the development of organizational
populations: what is the appropriate unit of analysis (Hannan and Freeman 1977, Carroll
and Hannan 2000)? The ecological tradition of organizational analysis focuses on the
study of some geographically, temporally, and topically bounded population of
organizations - tor example, California wineries between 1940 and 1985 (Delacroix et al.
1989), Pennsylvania telephone companies between 1879 and 1934 (Bamett and
Amburgey 1990) or Toronto daycare centers between 1971 and 1989 (Baum and Oliver
1992). However within populations, distinctions between firm- and establishment-form
organizations may not be clearly drawn and are rarely examined separately, despite the
fact that these are different organizational structures and may well respond differently to
identical environmental conditions. To return to breweries, Carroll and Swaminathan
21
(2000; 716) point to disconnections in their research precisely because some data is
collected at the level of the brewery and other data at the level of the brewing firm. If we
follow the tack of the importance of raw materials and consumers as resources, the
resource environment and process of competition is likely to be different for
establishments fi-om the firms that own them - i.e. the brewing firm operating many
different breweries and beer labels is a different organization fi"om one of its individual
brewery-labels, and the two entities relate to the resource environment in decidedly
different manners. Carroll and Swaminathan (2000) address this by identifying the
population of organizations as "identities, based on their socially coded properties rather
than on only official classifications or structural architecture" (p. 719) - specifically
avoiding this distinction in form which might affect the competitive process and focusing
on perception to identify the unique organizational players. I approach this puzzle from a
different, and perhaps simpler, perspective. I use formal identification of legal entities
and physical operations to separately analyze the complete populations of both firm- and
establishment-form organizations operating in the industry, allowing me to compare how
ecological forces differently affect organizations by form.
A fourth puzzle is that studies of organizational populations have not fiilly
approached the notion of relationships between organizations (Haveman 2000). In
particular, I consider that organizational relationships might mitigate or enhance the
competitive effect of organizational densities. By considering the dual populations of
firms and establishments, I telegraph the discussion of the ownership relations between
the two, leading to the dynamic issue of organizational concentration.
22
Concentration in organizational studies typically references the frequency
distribution of organizational size based on sales or market share among a population of
organizations (Carroll and Hannan 2000). In the aforementioned brewery study (Carroll
and Swaminathan 2000), organizational concentration is measured in terms of the
distribution of market shares of beer sales (the proportion of the market held by the five
largest organizations) and is shown to have a positive effect on organizational foundings.
I propose to extend the idea of concentration to one of ties between organizations, adding
a peculiar social quality to what is often a measure of financial fortitude. In my case, I
consider the ownership ties among the population of firm- and establishment-form
organizations, so that concentration describes the distribution of the "market share" of
control over existing establishments, not of total sales in the industry. This perspective
affords insight into two conceptualizations of concentration, determined by unit of
analysis. First, from the perspective of firms, the concentration of ownership ties is also a
measure of the concentration of the size distribution, where size is measured in number of
firms owned. Second, from the perspective of establishments, common ownership
implies a "sibling" relationship that might buffer, or otherwise affect, the effects of
competition between those establishments. By measuring concentration via this set of
ownership ties, I help to develop theories about how the distribution of organizational
sizes affects industrial development by attaching the ideas power and social relationships
(e.g. ownership) to that of size. Concentration in my case reflects not only size as
organizational mass, instead of the more typical sales mass, but as an actual "bounded-
togetherness," or integration, of organizations.
23
FUNDAMENTALS OF ORGANIZATIONAL CONCENTRATION
A straightforward conceptualization from the case at hand can provide a dynamic
understanding of concentration. Consider an organizational environment consisting of
ownership relations between establishments and firms. For establishments, concentration
reveals ties binding potential competitors together; for firms, concentration refers to the
distribution of the total size of population - where size is measured in establishments
owned by each firm in the population. A low concentration means that each existing firm
owns one and only one establishment (see Figure 2). Concentration increases as one or
more firms own disproportionately large numbers of existing establishments - perhaps as
a function of firm merger or failure that results in changing ownership of establishments,
or via the founding of new establishments by existing firms (see Figure 3). If a single
firm owns all existing establishments, then total concentration exists (see Figure 4).
Concentration can thus be seen as the outcome of three vital processes of organizations:
founding and failure for both establishments and firms, and changing ownership of
establishments.
The practical implications of concentration can be illustrated via the different
organizational forms beings studied. From the perspective of the firms, concentration
enables economies of scale. A multi-unit firm may be able to centralize services and
benefit from reduced costs of operation. Further, these firms can own establishments in
multiple geographic markets and thus shelter themselves from fluctuations occurring in
isolated areas (i.e. multi-unit firms can operate in coarsely grained resource environment

24
by dispersing their units such that they increase the likelihood of having establishments in
resource-rich areas). Additionally, these firms are larger in size and thus have a reduced
likelihood of failure (Ranger-Moore 1997). As such, high concentration may reveal a
small subset of firms with a particular competitive advantage in a given market, and
across multiple markets. The population of establishments is affected by concentration
via common bonds to these firms. If a firm has dispersed establishments, then any
establishment can be sheltered from local resource deficiencies by the firm's robust
holdings in other areas.
Operationalizing concentration can occur in a variety of ways. Two common
methods are the gini coefficient of inequality, and the identification of the percent of total
o
size (in this case number of establishments) captured by the largest, say, five firms .
However, these measures can be problematic and imprecise. Equal gini scores can be
established within populations featuring very different resource distributions and, thus,
inequality profiles; and, for the case at hand, the number of firms and establishments
determines the possible range of gini scores (i.e. a population of firms and establishments
might have maximal ownership concentration, but still have a low gini coefficient). It is
thus problematic to compare scores over time and space featuring different organizational
populations. In the case of measuring concentration exclusively via the five largest firms,
a great deal of detail in the profile of the population is lost (Hannan, Ranger-Moore and
Banaszak-Holl 1990); in my case, that would be information regarding the particularly at-
^ See Carroll (1985) for example.

25
risk population of single-establishment firms (the smallest possible firm size thus never a
part of the top five).
I propose the use of a modified version of the Herfindahl index (Herfindahl 1974,
Tirole 1988), to measure concentration. Often used in legal studies to measure market
share (Finkelstein and Levin 1990), it has been used successfully in organizational
studies as a feature of the organizational landscape (Dobbin and Dowd 1997). This is an
aggregate score, like the gini, based on the sum of the proportion of the total market size
captured by each individual firm. The advantage to its use here is twofold; first it
captures at least some information fi'om every firm and establishment operating in a
market; and, second, it can be adjusted to control for the total number of firms and
establishments operating at any one time, thus creating a standardized score.
Examining the case at hand, I find that the percentage of establishments operating
singularly during 1968, 1984, and 1999 decreased from 76%, to 62%, to 40%; and the
percentage of firms owning only one establishment decreased from 88%, to 84%, to 74%.
By using the Herfindahl-based method (described thoroughly in Chapter 4), this trend can
be measured with a single score to reveal the changing level of concentration of
ownership in the industry (Figure 5).
FORMALIZING THE DISSERTATION
Size of organizational populations, competition for limited resources, and
concentration of organizations are core, long-lived topics of interest to sociology: Emile
Durkheim, in The Division of Labor in 5oc/e/>- (1984), identifies increasing population
26
size as the source of competition which, in turn, drives the division of labor, producing
specialization in effort and resource orientation (Turner 1998); and Karl Marx, in The
Communist Manifesto (1978), presented the rise of the bourgeoisie leading to the
concentration of industry in the hands of a few owners and to the centralization of power.
In the twentieth century, the study of organizational populations has often focused
precisely on their competition for limited resources, the concentration of organizations,
and the domination of large, consolidated firms^. 1 study precisely these features as they
develop in the Arizona funeral home industry between 1968 and 1999.
From the perspective of the organizational environment, competition and
concentration, and the linkage between the two, have been developed in a variety of
ways. Institutional theory provides a schema by which to contextualize organizational
operations, enabling the identification of associational and regulatory forces as
determinants of limitations on variation in organizational structure, size, and operations
(Scott 1995). Such institutional forces have been specifically shown to impact the
process of competition (Baum and Oliver 1991; Dobbin and Dowd 1997) and the rise of
multi-unit organizations (Morris 2000). 1 use this platform to test the effects of changes
in three separate institutions - located at the levels of consumers, the industry and the
state, as presented above - on changes in the population of funeral homes. As is often the
case'", I pursue this by incorporating institutions into the logic of organizational ecology.
See Perrow (1986) or Scott (1987) for general overviews of these, and other, topics in organizational studies; see Scott, et al. (2000) for a specific analysis of these concepts among healthcare organizations.
See again, for example, Torres' (1988) previous, limited study of funeral homes; Baum and Oliver (1991) on day care centers; and Dobbin and Dowd (1997) on railroads.

27
One of the most robust and testable traditions in organizational studies,
organizational ecology focuses precisely on competition for limited resources as a key
force shaping organizational populations (Hannan and Freeman 1977; Hannan and
Freeman 1989; Carroll and Hannan 2000), in turn affecting vital rates of organizational
founding, growth, and failure". As forces of legitimation increase the social acceptance
and economic viability of an organizational form, the numbers and size of organizations
increase until the population approaches carrying capacity and competition increases,
leading to demographic changes that reduce the pressure of competition by altering the
size of the population. As presented above, resources and institutions serve here to adjust
carrying capacity and affect the timing and ferocity of competition. I test ecological
theories by taking advantage of the institutions which tightly link funeral homes and
human deaths, assuring me of the legitimacy of the industry and its overwhelming
orientation towards a single resource. Thus, 1 incorporate the size of the resource space
and organizational densities into quantitative models of organizational founding and
failure in order to capture the force of competition; and fiirther examine how this force
changes under varying institutional regimes.
TTie notion of organizational concentration is developed in organizational ecology
from three perspectives: 1) highly competitive markets lead to concentrated industries,
dominated by large, generalist organizations, but this allows for the rise of small
'' See Baum (1996) for an extensive review of results in this area.

28
specialist organizations'" (Peli and Nooteboom 1999); 2) the size distribution of
organizations is a measure of concentration and is a feature of the population affecting
competition'^ (Ranger-Moore, Breckenridge, and Jones 1995); and 3) organizational
mergers are a tbrm of failure event affected by competition (Hannan et al. 1998). I
approach all three perspectives in this dissertation: first, by examining concentration as a
dependent variable; second by including concentration as an independent variable in
analyses of founding and failure rates; and third, by examining change of ownership as a
dependent variable.
Concentration has also been studied from the perspective of the active
organization itself Resource dependence theory presents competition between
organizations for limited resources as a condition producing uncertainty, to which
organizations might actively respond with horizontal integration''', thus concentrating
ownership (Aldrich and Pfeffer 1976; Pfeffer and Salancik 1978). Similarly, transaction
cost economics ties the cost of operation in a market to the action of integrating
competitors into the organization in order to reduce the expense of contracting
(Williamson 1975, 1985). I use both of these logics to enhance the story of competition
as an ecological force affecting concentration.
This refers to resource partitioning - a condition describing the rise of large generalist organizations in the dense centers of a resource space, and allowing for small specialists in the areas outside of the mass market.
This refers to size-localized competition - a condition describing the increased intensity of competition between organizations of similar size. '•* Horizontal integration refers to merger or consolidation of organizations. In the case at hand this could be envisioned as one firm being purchased outright by another, so that the ownership of establishments changed hands, reducing competition.
29
Hence, my dissertation is an analysis of dual organizational populations, firms
and establishments, within the same industry being differentially affected by ecological
and institutional forces; augmented by the use of the logics of resource dependence and
transaction cost economics to inform my ecological hypotheses about concentration of
ownership ties between the forms, and the effect of concentration on organizational
processes.
Specifically, 1 provide answers to the following linked set of questions: I) How
do changes in social institutions and the size of the resource space differently affect the
populations of firm- and establishment form organizations operating in the same
industry? 2) How do competition for limited resources and changing institutions, along
with diverging populations of firms and establishments, affect concentration in a
population of organizations? And 3) how do resources, institutions, and organizational
concentration combine to affect the vital rates of founding, failure, and changing
ownership in population of firm- and establishment-form organizations? I pursue this via
a quantitative analysis of the Arizona Funeral Home Industry between 1968 and 1999.
Using time-series cross-sectional statistics, I examine the complete population of funeral
home firms and establishments operating in Arizona during this time period - taking
particular advantage of the industry's orientation toward the singular resource of human
deaths; the strong industrial and secular institutions surrounding the services it provides;
and my primary-source data revealing the complete history of ownership ties between
establishments and the firms that own them.
30
In the process of the addressing these questions, I approach an additional set of
theoretical and methodological puzzles: I) How is the concentration of ownership ties
within a population of organizations related to the concentration of size in that
population? 2) How can organizational concentration be measured consistently over time
and compared across the different markets within which organizations operate? 3) How
do the resource space and organizational population interact to affect competition? And
4) how is this competition mediated by changing institutional constraints? Finally, I
engage this dissertation via topical data that answers the substantively interesting
question; How has the funeral home industry developed over time as a function of
institutional and ecological processes?
THE PLAN OF THE DISSERTATION
This project is an examination of the demography of the population of funeral
home organizations operating in Arizona between 1968 and 1999. Precisely, this is a
two-population'^ demography of funeral home establishments and funeral home firms
incorporating measures of changing carrying capacity to explain organizational densities,
the ownership relationships between firms and establishments, and the vital rates of
market entry, market exit, and consolidation of ownership in order to test theories of
density- and resource-dependence. I model these conditions and processes, in part, as
functions of changes in resources and the institutional environment through the use of
The notion of "two-population" demography has been used when studying, say, both organizations and their employees (Stewman 1988). Here, this term is used to similarly capture the interactive features of the two linked organizational forms.

31
time-series cross-sectional multivariate analyses. In this dissertation, I develop a
historical and methodological background for analyzing the funeral home industry, then
proceeds to the specific set of proposed questions.
Chapter two presents a history of the United States funeral home industry in the
latter half of 20th century. This portion of the dissertation outlines the institutional
changes and economic structuring of the industry, focusing on their correspondence with
the rise of city, state, and national organizational consolidation. I provide a timeline that
identifies the key events that have shaped the industry, both nationally and at the state
level; I describe the secular institutions surrounding human death that affect industry-
consumer relations; 1 identify the changes in industry institutions that opened the door for
consolidation; and I describe the state-based regulations that constrain funeral home
operation. In particular, I examine the waning of the traditional "professional" period in
the industry and changing orientations of consumers that enable consolidation as
organizational behavior.
Chapter three establishes the theoretical bases for this undertaking, considering
organizational ecology and demography, resource dependence, and institutional theories
of organizational change. 1 focus on the features of these theories that concern
competition and its effects on organizational vitality and ownership relations. I use this
review to create general sets of hypotheses that will lead to the quantitative examination
of the data describing the development of the Arizona funeral home industry (recall
Figures 1 and 5).
32
Chapter four covers data, methods, and modeling in the project. I briefly describe
my primary data collection fi-om state regulatory agencies and the coding and
quantification used to produce the four distinct, time-series data sets used in the
dissertation: each has a market-year unit of analysis and is based on one of the
organizational populations (firms or establishments) and market boundaries (by county or
aggregated to the state level). 1 detail the construction of the standardized Herfindahl
index, the key variable measuring concentration; and 1 describe the range of statistical
methods used in the analytical chapters. Specifically, via the STATA (StataCorp 2001)
statistical software package, I use Prais-Winsten time-series analysis, generalized least-
squares time-series cross-sectional analysis, and/or negative-binomial general estimation
time-series depending on the dependent variable and level of aggregation of the data. To
supplement these time-series cross-sectional methods, I incorporate techniques of
discrete-time event history analysis (Allison 1984; Yamaguchi 1991) in modeling to
enhance understanding of time-dependency and the patterns it produces in changing
industry structures.
Chapter five focuses my empirical analyses. I disentangle organizational forms
and the resource space by separately analyzing the size of the population of funeral home
establishments and that of fianeral home firms as functions of the resource and
institutional environments. Playing on the singular resource-of-emphasis in the funeral
home industry, I use the number of human deaths as a basis from which to model the
density of organizations by form (firm or establishment) and by market boundary (state
or county) - for a total of four modeling efforts. I consider both period- and continuous

33
time effects to account for institutional changes that have affected the competitive and
structural nature of the industry; and interaction effects to further examine the importance
of institutional forces on organizational densities. In doing so, I separate the notions of
density and resource space, explicate ideas of carrying capacity as a fimction of
institutions and resources, and develop ideas about the differences between firms and
establishments as organizational forms.
Chapter six pursues concentration as dependent on the previously considered
densities of organizational forms. The divergence of firm and establishment populations
focuses attention on the relationship between them. 1 use resources, densities, and
institutional effects to model levels of concentration of ownership at both the state and
county level. Using time series techniques, I predict concentration based on features
affecting carrying capacity, which captures the market feature of competition - a critical
component of many theories of concentration. This reveals an increasing concentration
of ownership and hints at the importance of change in ownership and consolidation as
important vital rates of organizations.
Chapter seven then pursues the vital rates of organizational founding, failure, and
changes in ownership. Here, I separately model counts of foundings and failures, at both
the state and county level, for the populations of firm- and establishment-form
organizations. I addition to the consideration of institutions and resources, I develop the
idea of ownership linkages as mediators of competition among tied establishments, thus
mitigating failures; and propose that this concentration has a negative effect on founding
as well, via increasing organizational efficiencies. For firm-form organizations.

34
concentration allows testing of relative size distribution as a population characteristic
affecting vital rates. Considering the establishment population as that which is capable of
changing owners, 1 propose that increasing competition promotes change in ownership,
where competition is directly related to establishment density and inversely related to the
size of the resource space and level of concentration.
Chapter eight concludes the dissertation. I specifically recount answers to the
questions offered at the beginning of this chapter, presenting the contribution of my
dissertation broadly to sociology, and specifically to the study of organizations and the
ecological perspective. I also outline future research to which these findings, and this
project in particular, extend.
35
CHAPTER 2 - THE CASE OF THE FUNERAL HOME INDUSTRY
In this chapter, I describe the funeral home industry, paying special attention to its
economy relative to resources and changing institutions regarding formal structuring and
normal business operations. I identify the distinctions between funeral home firms and
establishments, their varied economies and modes of operation, and provide a brief
overview of cultural changes in the approach to death and death care that have affected
the industry.
The organizational field of death care'^ constitutes an essential part of the United
States' economy and culture: approximately 2.3 million deaths and over seven billion
dollars went into the U.S. death care industry in 1996 (Newman 1997); and Smith (1996)
points out that, accounting for inflation and fluctuating death rates, these numbers are
similar for the past century if not longer. This industry provides culturally essential
services, based on biologically unavoidable conditions, allowing the living to have dead
human bodies removed, processed (embalmed, cremated, or otherwise treated in
preparation for interment), disposed of (buried, scattered, placed in a mausoleum), and
memorialized (given a headstone or marker) - enabling dead bodies to be treated in such
a way as to be neither bacteriologically nor culturally offensive (Iserson 1994). This
industry is active almost exclusively in small local markets, has no name-brand
The boundaries of the Death Care field (Smith 1996) include a wide range of businesses, including funeral homes, crematories, cemeteries, mausoleums, casket production, gravestones and memorial markers, and even florists. However, the research presented here focuses exclusively on funeral homes, which includes all embalming

36
recognition, incorporates little price competition (Harmer 1963; Torres 1988; Smith
1996; Roberts 1997; Mitford 1998), and has only recently become home to large
vertically and horizontally integrated organizations (Torres 1988; Iserson 1994; Smith
1998).
The conception of funeral homes as private locations outside of the home where
the servicing of death takes place has existed in the United States since the early 1800s -
when cabinet makers first began to specialize in caskets (Farrell 1980; Smith 1996;
Mitford 1998). Embalming rose to great prominence in the United States during the U.S.
Civil War (Iserson 1994) and by the time of the creation of the National Funeral
Directors' Association in 1882, the funeral industry had organized itself as a set of profit-
making, service-oriented businesses (Farrell 1980; Torres 1983; Smith 1996). Funeral
homes have become a part of the traditional process of disposal of the dead in the United
States, and some sort of funeral home service has been incorporated into most deaths
since the early 20th Century, with these formal organizations becoming almost a certain
part of final disposition by the 1950s (Habenstein and Lamers 1955; Farrell 1980; Larson
1996; Smith 1996; Newman 1997; Service Corporation Intemational 1998; Loewen
Group 1998). This despite the fact that the services and processes provided by funeral
homes are not required by any state or federal law, except in specific cases with causes of
death that can affect public health (Iserson 1994)
Since the mid-20th century, the funeral home industry in the U.S. has undergone
dynamic changes in ownership structures. Through the first half of the 1900s, almost
facilities and crematoriums that are open to the public and not solely contractors with
37
all'^ funeral homes in the United States were singular operations, where a firm (a
corporation, partnership, or proprietorship) owned and operated one establishment (a
physical building service site); and when chains did exist, they were small, local, and
family-owned (Bowman 1959; Torres 1988; Smith 1996). The most primary and fully
enrolled funeral home association - the National Funeral Directors Association (NFDA),
with members from over 75% of active organizations in the United States (Torres 1988;
Smith 1996) - has served, in part, to organize the professional efforts of the industry,
promoting an organizational model that promoted small organizational sizes and intimate
community relations, and minimized competition in pursuit of professionalism (Torres
1988). However, by the end of the 1960s, the Association began to release pressure
against advertising, consolidation, and marketing, and promoted a more business like
atmosphere in the industry - this in response to the petitions of a few already growing
businesses, and the need to account for problems in successorship among small-business
owners, when family heirs did not choose to continue the business, that were necessarily
resulting, against the traditional guidelines, in local consolidations (Torres 1988; Iserson
1994; Smith 1996). By 1992, the U.S. featured 15,647 ftineral establishments owned by
12,423 different funeral firms; 68% of these establishments and 88% of the firms were
linked in singular businesses, where the remaining organizations (4714 establishments
and 1490 firms) were players in multi-unit systems - with the twenty largest firms
owning a total of 973 establishments across the country (Smith 1996). And by 1997,
other businesses. Bowman (1959) claims that, at his date of writing, around 90% of all funeral homes
were operating individually, outside of chains.
38
almost 2000 of the active funeral establishments in the U.S. were run by the three largest
death care firms in the United States: Service Corporation International, The Loewen
Group, and Stewart Enterprises'^ (Newman 1997; Stewart Enterprises 1998; Service
Corporation Intemational 1998; Loewen Group 1998; Horn 1998).
In the state of Arizona, numbers and relations in the funeral industry changed in
manner similar to that of the nation as a whole. Between 1968 and 1999, while the
number of human deaths increased monotonically, the number of funeral establishments
increased at a decreasing rate; and the number of funeral firms initially increased, only to
decrease in the latter third of the time span (recall Figure 1). During this time, the
ownership of establishments became increasingly concentrated, with large proportions of
establishments being owned by relatively few firms (recall Figure 5). Similar to what has
occurred in the rest of the country, large corporations, such as Service Corporation
Intemational and Stewart Enterprises, entered the state and bought or founded a large
number of establishments. By 1999, some individual firms owned almost 50% of the
establishment in county-level markets.
FUNERAL ORGANIZATIONS AND HUMAN DEATH
Despite the changing structures of ownership, this industry is noteworthy not for
volatility, but for stability. Since the early 20th Century, the funeral home industry has
Note that there have been upheavals in the operation of these large organizations since 1997, so that the names of operating corporations have changed along with ownership.

39
been nearly perfectly legitimated,'^ so that it services virtually all possible demand - and
does so in an inelastic fashion: it is primarily oriented toward that single, measurable
resource of human deaths; and nearly every human death is processed, in some way, via
the industry (Iserson 1994; Smith 1996; Mitford 1998); each death (unit of the resource
space) is typically processed only once and by one establishment; and the industry has no
reasonable way to affect the size of this resource space"". Consumers have few, if any,
other desirable options than to utilize the services of the industry when deaths occur.
Even with modem trends in cremation and direct disposal (where bodies are sent directly
to a crematorium, usually as part of membership in an group that pre-purchases a bulk of
services at a discount rate) bodies are processed through, and profits are obtained by,
funeral homes (Iserson 1994; Smith 1996; Roberts 1997). Still, it is possible, though
rare, to completely avoid fiineral home operations (and cemeteries) via home-based
preparation and interment (Mitford 1998), through alternate facilities such as cryonics
(freezing the dead in hopes of ftiture revival) (Iserson 1994), or through medical donation
(which often results in direct cremation at the medical institution). Nonetheless, choices
This refers to legitimation in the "taken-tbr-granted" sense of Meyer and Rowan (1977) and Meyer and Scott (1983); and the "desired and accepted" sense of Suchman (1995).
Note, however morbidly, that in mid 1997, the Loewens Group, an international death care chain owning cemeteries, crematoriums and the second largest number of fimeral homes of any firm in the U.S., began the purchasing of almost a dozen children's and elderly hospice centers tor the terminally ill (Loewens Group 1998). And do recall the foreboding claim "Soylent Green is people!" according to Police Detective Thorn (played by Charlton Heston), upon discovering that the popular food made by the ubiquitous mega-monopoly The Soylent Corporation is made from dead bodies processed through the Soylent Corporations funeral service branch, in the MGM motion picture "Soylent Green" (Harrison and Greenberg, 1973).

40
beyond the realm of funeral homes are an exception to typical cultural patterns in the
United States and were rarely pursued in the sample examined in this dissertation"'.
So, the nature of consumption in death care is very constrained: nearly every
consumer who has a dead body needs to have it processed and interred in a very timely
manner, and only people who are responsible for dead bodies have any need to use the
industry. Further, there is no realistic way for death care providers as a whole to increase
demand for their services from consumers; while the tobacco industry might try to
convince more people to smoke (because many possible smokers are not doing so), death
care providers have no one to appeal to for increased business — almost everyone who
could possibly use their services most certainly does. Here, it is important to note that
consumer choice, then, does not play a grand role in the existence of the industry itself,
but instead factors into the services provided by funeral businesses (say, cremation as
opposed to embalming) and the relative success and failure of the particular operations in
any competitive market (Iserson 1994; Smith 1996).
The carrying capacity of any death care market is, thus, bound tightly with the
number of dead bodies available. Just as the carrying capacity of rabbits might be
measured by the amount of grass available to eat, the mass of funeral home organizations
that can sur\'ive in a market is determined by the number of dead bodies available -
though, of course, there are a wide range of possible configurations of numbers and sizes
of firms and establishments that could make up this mass. Additionally, the fully
legitimated state of the industry has a second implication relative to human deaths: it
Evidence from Arizona indicates that less than 0.3% of deaths are processed

41
requires that all dead bodies be processed by funeral homes. As a result, the size of the
resource space will almost perfectly correspond to the mass of the industry.
INSTITUTIONS AND REGULATION
Tradition and culture are important factors when studying death care. The mere
though of death conjures up varieties of cultural and possibly quite strong religious
implications in many people's minds. In America, death is often associated with sorrow
and loss, and the industry and businesses associated with this event must somehow reflect
this cultural pattern. Funeral directors and cemeterians fought against morbid imagery of
their jobs by becoming civic leaders and upstanding citizens in their communities and by
creating educational requirements that limited practitioners - creating a professional
nature that was pursued in their endeavors and promoted by industry associations (Farrell
1980; Torres 1988; Iserson 1994; Smith 1996). Further, this professionalism played a
key role in structuring operations towards the traditional form of small business operation
that would more clearly represent the professional image and be more easily controlled
by the profession-promoting bodies themselves (Torres 1988). As mentioned above,
while this professionalism is still a valuable part of the culture of the industry (Smith
1996; Newman 1997), the notion of pursuing more standard business practices has begun
to dominate the field.
A stable number of deaths in the U.S. - resulting from an increasing population
and decreasing death rates - along with the described linkage between resources and the
completely outside of the industry.
42
industry, allowed for a reasonable equilibrium to come into existence, wherein the
number of funeral home establishments in the US remained stable, at around 18,000
businesses, from the middle to the end of the 20th Century (Torres 1988; Smith 1996;
Newman 1997). But this stability is dependent on some minimization of competition to
prevent the growth of some organizations that would then lead to the fatal shrinkage of
others. Torres (1988) points directly to the institution of professionalism, as promoted by
the NFDA, as the force behind this stability.
Institutional forces within the industry are undeniably strong. Throughout various
histories of the industry (Habenstein and Lamers 1955; Farrell 1980; Torres 1988; Smith
1996), the pursuit of a traditional, professionalized structure has been an important
feature of operations, in particular as evidenced by the efforts of the NFDA, and the
criticism of chain-form structuring that occurred from members of the industry (Torres
1988). The industry has primarily operated in a self-governing manner, with rules and
standards of operation created and enforced via the NFDA and other associations,
including state-localized, though not state-based, ftineral boards (Torres 1988). This
institutional governance was primarily focused on issues of education and regulating the
"expertise" associated with services tlineral homes provide - embalming, cremation, and
grief counseling (Torres 1988). For example Torres (1988, p. 383) points out that the
American Board of Funeral Service Education has existed since the turn of the 20th
century to accredit funeral and embalming educational operations, only receiving any
formal license by U.S. Office of education to do so in 1972. Nonetheless, this body is
able to control the educational process by which the industry is staffed.
43
For the purposes of my dissertation, the key feature of professional institutions
has been to limit the size and structure of organizations in the industry. Despite the
potential economic advantage of economies of scale, being an integrator and being
integrated, only a small proportion of firms have done so. Instead, organizations have
frequently been condemnatory of the integrators and attempts at integration as being both
antithetical to the purpose of the industry and predatorily competitive (Torres 1988;
Smith 1996; Horn 1998). In particular, Torres (1988) points to the inability of
associational regulations to efficiently control large corporations as a source of anti-
corporate sentiment in the industry. In the past, attempts at integration were often
considered to be not in the best interest of the image of the industry and antithetical to the
tradition and professionalism of the field, particularly as promoted by the NFDA (Torres
1988; Smith 1996). However, in coincidence with the rise of integration in the 1960s,
evidence shows that the NFDA changed its stance relative to issues of advertising,
marketing, pre-need sales, and integration. At this time the NFDA altered its designs on
the industry towards business enterprise as opposed to the more constrained ideals of
"professionalism" (Torres 1988; smith 1996). Further, Torres (1988) and Smith (1996)
both point to issues of succession in family owned business as a force behind changing
organizational structure and institutional guidelines. Family ownership has been a long
standing tradition in the death care industry. The small local funeral parlor was a staple
of both urban and rural communities and was steadfastly run by a particular family and
was typically branded with that family name. Even the first local consolidations were
under the auspices of family names. However, problems with successorship can easily

44
arise in these situations; and the death care industry might be a prime candidate for
dissention by heir. Starting in the 1960s, and continuing even now, this problem has
become quite significant. Increasingly fewer heirs are taking over the family death care
business (Smith 1996). This change in the tradition of the industry is key factor in
increasing sales of establishments to multi-unit firms, and to the rise of chain-form
business-modeled operations.
There is little history of federal regulation of the funeral home industry: in 1920 a
federal regulation banned the use of arsenic as an embalming agent (Iserson 1994); and in
1984, despite much opposition from industry associations, the Federal Trade Commission
passed the Funeral Law," establishing guidelines forcing death care establishments to
reveal, but in no way limit, the pricing of particular services to consumers (Torres 1988;
Smith 1996). Further, several forays into anti-trust violation lawsuits by the competing
chains, most notably in 1996 during SCI's attempted buy out of the Loewen Group, have
been pursued, but to no avail. State regulation is more pervasive, but primarily via the
pursuit of licensing which is used to enforce minimum operating conditions such as
cleanliness and the ability to provide the services claimed in the price lists.
ORGANIZATIONAL STRUCTURES
As Smith (1996, p.270) reveals, the dispersed, non-centralized funeral system of
the United States, with many small establishments scattered across the country, is not an
essential condition of the industry; he points to an industry journal (The American
~~ This is alternately referred to as the Funeral Rule, Funerary Rule, or Funerary Law.

45
Funeral Director 1993) presenting that in China, only 1376 death care establishments
operate for a population ten times that of the United States; all are state run and centrally
organized; funeral homes are almost saturated; crematoriums run constantly in urban
areas, where there is a near one hundred percent cremation rate; and cemeteries have full
schedules every day to bury the dead in rural areas.
In the United States, economic, cultural, and institutional forces all appear to be at
play during the cusp decade where change in structure towards integration occurs in the
industry. The most classic economic argument supporting the integration of
complementary elements of an industry, in this case cemeteries and mortuaries, is at play
in death care (Smith 1996). As Chandler (1990) would argue, the increased throughput
and reduction in operating costs associated with rurming these two industry elements at
the same location is a powerful force towards integration. The suburban sprawl centered
on the 1960s brought consumers closer to the cemeteries, which had once been on the
outskirts of town. Because of local purchasing trends in the death care industry, and the
traditional association of consumers with a successful cemetery, a funeral home added to
that cemetery would face none of the typical disadvantages of a new entrant to the
market, and be able to reap the benefits of consumers attracted by confidence in the
cemetery and the convenience of one-stop death care shopping.
Consolidation of funeral homes (or cemeteries) also increases potential profits. In
a local market, the consolidation of homes could allow for the centralization of facilities:
the use of a common embalming facility, crematorium, set of skilled death care
technicians (embalmers) and/or fleet of hearses could significantly cut overhead costs;

46
and the maintenance of original family home names could help to insure the return of
trusted clientele-families (Smith 1996). Managerial reform could help tum the non
business oriented homes of the past, into profit making machines of the present. Yet if
these integrations are so profitable, why do they only incorporate a small percentage of
establishments in the industry? One possible answer here concerns the reticence of
owners to sell stand-alone firms.
Funeral home establishments operate at geographically fixed positions and take
part in local markets such as neighborhoods, cities, or counties and often specialize even
further by catering to ethnic or religious sub-markets (Smith 1996; Newman 1997;
Loewen Group 1998; Service Corporation International 1998). This elemental
organization is focused directly on the resource space as a source for profits and success.
Funeral home firms, on the other hand, are the corporate or proprietary organizations that
own establishments, and can possibly operate simultaneously in multiple geographic and
cultural markets. The single-establishment firm, a "mom-and-pop" style operation that is
independent and unintegrated, is at the time of this writing, and has been for the history
of the industry, the most common type of organizational actor (Horn 1998, Newman
1997, Smith 1996, Larson 1996).
Funeral establishments in a given market are at the heart of competition in the
industry. The limited number of existing resources must be distributed among the market
actors; and new businesses entering the market must compete by taking part of this
limited resource. From the perspective of consumers, the most common characteristics
by which a choice among alternative establishments in this industry is made are

47
geography, family tradition, and specialization in procedure and service^ - price is not a
characteristic that determines the choice of funeral home (though it may affect choice of
casket, embalming, interment, and other details) (Iserson 1994; Larsen 1996; Smith 1996;
Newman 1997; Roberts 1997; Horn 1998)"'*.
The total of the death care industry consists of establishments as stand alone
firms; multi-unit sets of establishments that are horizontally integrated at the local,
regional, or national level under a single firm; and multi-unit sets of establishments that
are vertically integrated to include both cemeteries and funeral homes. Regarding funeral
homes, before 1960 virtually all establishments were independent firms in the industry,
with the small remainder being members of local or regional family-owned, non-
vertically integrated, chains (e.g. Simpson Funeral of Springfield East - on the east side
of town - and Simpson Funeral of Springfield West - on the west side of town) (Torres
1988; Smith 1996; Robert 1997; Mitford 1998). These simple, multi-unit firms were
merely localized extensions of successfiil funeral homes and were very rare before the
late 1960s (Habenstein and Lamers 1955; Bowman 1959; Smith 1996; Service
Corporation International 1998). Nonetheless, this growth in firms via the opening of
new establishments points to the possibility of pursuit of economies of scale despite
NFDA guidelines against such operation. During the 1960s, regionally oriented chains of
horizontally integrated firms in the industry became a reality and by the 1990s, these
were powerful players - owning large proportions of funeral operations in many large
None of this organizational level variation was consistently accessible for the sample included in this project and, as such, cannot be included in the research presented here.

48
cities - with both financial and competitive advantages in the markets in which they
operated (Smith 1996).
Funeral establishments operate with notable size flexibility - there is great
variation in the number of cases handled by ftineral homes. In the United States in 1987,
the number of cases handled per funeral home ranged from two to 2,427 with the mean,
median, and modal number of cases hovering around 100 (Smith 1996); in 1993, this
number had not notably changed (Newman 1997). In Arizona, one particular firm
operated continuously for almost ten years (until the end of my time period) with an
average of less than one case per month, while another in the same city handles close to
100 cases per month. This flexibility is due, in part, to low overhead and operating costs
once sunk costs have been recouped, and the multiple responsibilities that can be handled
by a single fijneral director (for example, in Arizona a funeral director must be a licensed
embalmer as well) reduces the necessary number of employees required by
establishments (Habenstein and Lamers 1955; Smith 1996). This average size is far
below the scale at which fianeral homes could operate (Torres 1988; Smith 1996), but a
large number of establishments - enabled by institutional structures that promote small
size and minimize competition - widely distributes raw materials (dead bodies) and
promotes such operation.
While establishments were traditionally and remain predominantly "small," and
operate in competitive markets, firms have grown and responded to resources in different
ways. Specifically, firms have grown by opening new "branch" establishments and
This topic is not presented further in the dissertation, though is surely worthy of further
49
consolidating ("buying out") existing firms and their establishments. Through this
competition can be minimized between establishments in the same market, and firms can
operate simultaneously in multiple geographic markets. Such multi-unit firms have
evidenced much higher profit margins than the traditional stand-alone firms by pursuing
economies of scale (Smith 1996).
This horizontal integration and pursuit of firm growth is, for the most part, a
recent advent in the fiineral home industry. While one large multi-unit, multi-market
firm. Memorial Gardens Association memorial parks, lasted through most of the 1930s
(Smith 1996) and the aforementioned local family chain combinations are evidence that
the ideas of economies of scale and chain-formation were not foreign to the industry
before 1930, it was extremely rare. In rural settings, several mortuaries and/or cemeteries
within a county might be run as separate establishments with one owner, and in the urban
setting a cluster of homes with centralized embalming, bookkeeping, and transportation
might be run by one owner; though these cases were exceptions to the standard of
fragmented specialized firms (Smith 1996). But, as evidenced above, by the 1990s the
number of multi-unit firms in death care and the percentage of establishments maintained
by consolidators and integrators had grown dramatically.
In the death care industries, consolidation of fiineral homes or cemeteries began to
occur non-anecdotally in the 1960s (Smith 1996; Loewen Group 1998; Service
Corporation International 1998; Stewart Enterprises 1998). In almost all cases the
consolidation process was virtually invisible to consumers, neither the names of firms nor
research.

50
the individual workers changed; but the benefits of centralized supply resources, local
centralized processing, and centralized bookkeeping and management were established
and the lack of name change retains long standing community consumers who may have
grown to trust the firm. This process helps maximize both economy of scope by allowing
one firm to own different fi^agments and specialized firms in one or more markets; and
economy of scale by allowing services to be centralized. By owning several firms in one
market, they can broaden services into a variety of specialized sub-markets (ethnic and/or
religious), centralize their services, and perhaps, gain a preponderance of business in the
market by owning the most, or the most successful establishments.
Regarding scope and scale, there is a wide range of possible organizational
operations. The scope of the funeral industry necessarily includes the processing of dead
bodies (via embalming, cremation, or other methods) but may extend to include the sale
of caskets, memorial markers, and in some cases cemetery plots as well (Torres 1988;
Smith 1996). Widening scope certainly widens the range of resources sought by these
organizations, yet it is still the singular resource of deaths that identifies the key feature
of organizations in the industry^^. However, it is economy of scale that most relates to
the questions at hand in this dissertation.
The industry response to these changes has been mixed, despite the evidence of
potential, and realized actual, profit (Horn 1998, Newman 1997, Smith 1996).
Establishments within the integrated firms tend to profit fi-om the integration, reaping the
I do not include analyses of scope conditions of firms and establishments (e.g. histories of the sale of grave markers or combinations of funeral homes and cemeteries) in the data analyzed in this dissertation.

51
rewards of economies of scale and scope and the centralization of control. The
detrimental aftects of competition on firms is quite visible, as single-establishment firms
try to stay afloat against the multi-unit firms whose increasing profits, and profit share as
a result of integration make success more and more difficult (Smith 1996).
52
CHAPTER 3 - THEORETICAL OVERVIEW AND GENERAL HYPOTHESES
When considering organizational change, both structure and strategy are key
forces to consider (Chandler 1977). The theoretical traditions informing this work
approach both perspectives: the strategic orientation of resource dependency and the
pursuit of economies of scale, and the structural orientation of organizational ecology and
institutional perspectives. I will provide a general overview of each theory, and consider
its specific application to the case at hand. I will also establish general hypotheses from
each tradition as applied to the funeral industry - these will be unfolded into specific,
variable oriented hypothesis in the following analytical chapters.
Simply stated, the tradition of organizational ecology makes an analogy to bio-
ecology such that the number of organizations in a population, referred to as density, is
dependent on the environment's carrying capacity - the total mass of organizations that
can be supported by the material and social conditions of the environment. Further, from
the inception of the industry the process of legitimation - developing recognition and
acceptance of the particular industry or organizational structure - increases the number of
organizations until carrying capacity is met, after which the process of competition for
limited resources in the environment selects against certain organizations, reducing the
size of the population. Social institutions affect the form and structure of the
organizations themselves and serve to alter the timing, intensity, and form of the
aforementioned processes. A wealth of research has been pursued in the testing and
development of this tradition, and the importance of the number of organizations

53
operating in a population has been well established as a strong predictor of organizational
founding, growth, and failure rates (Hannan and Freeman 1989; Carroll and Hannan
2000; see Baum 1996 for a general review of findings).
The two key forces within the ecology of organizations are legitimation and
competition, which affect organizational densities via founding and failure rates (Hannan
and Freeman 1989; Haiman and Carroll 2000). Legitimacy operates both within and
outside of organizational populations, describing the social and political acceptance and
economic viability of the organizational form - as Suchman (1995) presents, it can be
seen as the social acceptance and desirability of an organizational form's operation. This
can result in increasing availability of resources and demand for services (Scott et. al.
2000); and an increase in the founding of new organizations and minimization of
organizational failures at low levels of organizational density (Carroll and Haiman 2000).
Competitive processes operate between organizations, distributing both access to
resources, and the resources themselves, among the competitors. As competition for
limited resources increases, failures rise and foundings are minimized - thus negatively
affecting organizational densities (Hannan and Freeman 1977, 1989; Carroll and Hannan
2000). Legitmation and competition are not mutually exclusive processes, but instead are
countervailing forces, each with varying strengths: in early parts of the history of
industries, the effects of legitimation tend to be more powerful; and as the industry ages
and stabilizes relative to resources and demand, the effects of competition tend to be
dominant.

54
In general, these processes produce an inverted-u pattern of organizational density
over the course of an industrial history. Extensive research has shown that this pattern is
a function of density dependence: the founding and failure rates of organizations are
dependent on the number of organizations in operation (see Baum 1996 for a thorough
review). Organizational density is directly related both to legitimacy and to competition.
Increasing density presents robustness of the organizational form, leading to positive
trends in foundings; and it also raises the number of organizations in the enviroimient
increasing competition for limited resources, resulting in increased failures. The
traditional density pattern occurs as a result of the power of legitimation early in
industry's history, while competition gains strength in the latter stages.
This typical pattern is conditioned on features of the organizational environment
that affect the point at which population growth turns to population decline. An
environment's carrying capacity, determined, in part, by raw materials and social
institutions, is the set of possible organizational populations that can operate without
experiencing this fatalistic competition (Kingsland 1985; Hannan and Freeman 1989). It
is precisely the meeting of this capacity that triggers the tipping point to the dominance of
competitive processes, producing the typical history of organizational populations. As a
consequence, growth in the size of the resource space (e.g. raw materials or demand for
services) minimizes competition.

55
Changes in organizational density^^ and concentration of ownership occur, in part,
via the dynamic organizational processes of founding, failure, and changing ownership.
Precisely, density will have a positive first-order and negative second-order affect on
foundings; and a negative first-order and positive second-order affect on failures (see
Baum 1996 for a review of these findings). Similarly, the changing distribution of
ownership is dependent on variation in numbers of organizations of each form (firms and
establishments developing as in formula (1)) as well as changes in ownership (e.g. a firm
fails and the one establishment it owns changes ownership and continues to exist under
the control of another firm). As such, posing questions about this sort of industrial
development should tack towards variables that affect numbers and relations among
organizations. Specifically, 1 focus on competition for limited resources as a feature of
the environment affecting the density of organizations and the concentration of
ownership.
Populations of organizations are affected by the environments within which they
operate. In particular, demographic characteristics of these populations are closely linked
to elements external to the organizations themselves^^. Precisely, the tradition of
organizational ecology has focused on the numbers of organizations, the characteristics of
material and social resources, and social institutions as important elements that
significantly affect the founding and failure of organizations and, thus, features of the
"Density" refers to the number of organizations in a population, as used by Hannan and Freeman (1977).
While the focal forces I pursue in this research are ecological in nature, they are used to describe features of the demography of organizations. This terminology is well justified (Carroll and Hannan 2000) and is the perspective that directly informs this work.

56
population of organizations (Hannan and Freeman 1977, Hannan and Freeman 1989,
Carroll and Hannan 2000). I address this tradition by considering the feature of
concentration of ownership among organizations as a feature of the population that is
both directly affected by competition and mediates the effects of competition on
organizational founding and failure.
As presented in Chapter 1, this dissertation will address three puzzles within the
field of ecological analysis and the demography of organizations. Primarily, I will
address the issue of inter-organizational relationships as a feature mediating the effect of
density on organizational foundings and failures. This telegraphs to a consideration of
changing relations between organizations as a vital organizational event, itself dependent
on ecological processes.
General hypothesis: The fully legitimate state indicates that organizational
densities will be directly related to the size of the resources space. Further, it will be
operating primarily in the "competitive" phase of industrial development. As such
densities, mitigated by resources, will be inversely related to foundings and directly
related to failures and changing ownership. From the perspective of resource
partitioning, growth among firms should not be equal and increasing resources should
lead to concentration via inequality in numbers of establishments owned.
This theoretical traditions associated with organizational consolidation focus on
the importance of concentration as a feature of the organizational environment. From the
resource dependence and transaction cost perspectives, rational action and the need to
control uncertainty in access to resources and relationships with competitors and

57
suppliers, merger, consolidation and integration of organizations is an efRciency/profit
enhancing response to uncertainty and competition (Pfeflfer and Salancik 1978;
Williamson 1981).
Incorporating ideas from economic and organizational sociology, this project will
highlight the peculiarly social forces that can drive organizational and industrial
development. Considering some major theories in this arena reveals the perspective from
which this study will proceed. Alfred Chandler (1977, 1990) claims that the
consolidation of firms that represent successive steps in a process - such as rubber
growers and tire manufacturers or funeral homes and cemeteries - is pursued to
maximize efficiency and increase throughput speed by replacing the "invisible hand" of
the market with the "visible hand" of hierarchy. Here rational action by organizations is
used to pursue economies of scale and scope. Similarly, Oliver Williamson's ideas of
transaction cost economics (1985) propose that multi-level combinations (referred to as
vertical integration) serve to minimize the cost of economic transactions between
elements of the process. Both of these logics serve to illustrate a change from market
exchange between elements to a hierarchy of the elements that benefits profit
maximization.
The theories of resource dependence (Pfeffer and Salancik 1978) are more
oriented toward social process of minimizing uncertainty relative to the environment
external to the organization - and are readily applicable to the death care industry. Here,
horizontal integration (the consolidation of establishments, organizations at the same
stage of an industrial process) is pursued to minimize competition for limited resources.

58
where pursuit of economy of scale is merely an additional outcome of the process, not the
intent.
General Hypotheses: Competition among organizations for limited resources will
have a positive effect on the concentration via the process of merger/consolidation. This
concentration, in turn, will decrease competition and negatively effect failure rates of
organizations.
Institutional theories make arguments for the dependence of organizational and
industrial structure on the social environment of formal and informal regulations and
relationships in which they operate. My goal is to identify not only the effect of changing
legislative policy on the structure of the funeral home industry, but the effect changes in
non-formalized professional guidelines as well. I am asking questions about the maimer
in which changes in institutions affect ownership relationships among organizations and
their access to resources.
Informal institutions provide guidelines for the accepted ways of structuring
organizations (DiMaggio and Powell 1991). In particular, the process of imitation
produces isomorphic organizational populations - sets of organizations with similar
design and operational techniques, on the other hand, externally imposed constraints
establish rules and regulations that determine organizational operations via penalty on
non-conformity. Legislation is a key source of these policy changes, providing rules that
govern organizational behavior by affecting both the adoption and creation of specific
practices and operating techniques (Meyer and Rowan 1977; DiMaggio and Powell 1983;
Dobbin and Dowd 1997).

59
In particular for the pursuit of this project, institutions can be seen as features
affecting both competition and selection. With respect to competition, a wealth of
research (see Baum and Oliver (1991) or Dobbin and Dowd (1997) for example) has
show the policy and changes in institutional guidelines can shape organizational
competition by affect the manner in which organizations relate to one another and the
resources space. Further, following the logic of carrying capacity, legislation against
certain operations can act as a selective force preventing such organizations from
existing.
A variety of relationships will be modeled in the empirical chapters of the
dissertation in an attempt to link institutional, ecological, and resource dependence
theories of organizations (see Figures 6 and 7). The multi-level, time-series, structural
equation model implied by this is beyond the scope of this dissertation. Instead I
examine these relationships via more simple methods as described in the following
chapter.
60
CHAPTER 4 - DATA, MODELS, AND METHODS
In this chapter, I present the techniques and practices of data collection, modeling
traditions, and statistical techniques used in this dissertation. I focus on my acquisition of
primary source data tbrm the Arizona State Board of Funeral Directors and Embalmers
and the use of Arizona between 1968 and 1999 as a sample. 1 then turn to a discussion of
traditional models of density, concentration, and vital rates, identifying key covariates
and describing my use of the Herfindahl index as a measure of concentration. Finally, I
review the statistical techniques pursued for each of these models.
DATA
1 collected the primary, organizational data for this dissertation directly from the
records of the Arizona State Board of Funeral Directors and Embalmers . Created in
1968, this body serves, in part, to license all funeral homes operating in the state of
Arizona. As part of this licensing process, new establishments must be licensed before
they can open for business, every existing establishment must apply for renewal of their
operating license by December of the prior year, and new licenses must be obtained when
an establishment changes owners. As is indicated by this last point, the licensing records
include the name of the corporation, partnership, or sole-proprietor of each establishment.
The whole of these records allows for the identification of the geographic location of the
" 1 was freely given full access to the complete stored, paper records of this board. I collected data manually through direct observation and re-recording of the pertinent information from the licensing files.
61
total population of establishments and firms operating in Arizona in every year begirming
in 1968. This also provides complete information about the ownership relations between
all firms and establishments in the population; and enables identification of the first and
last year of operation of any organization being founded or failing after 1968. I identify
organizational location by year and county (or counties) of operation - with 14 counties in
the years 1968 through 1982, and a fifteenth county forming in the state in 1983 for a
total of 465 county-year records. The counties can be aggregated to 32 state-year
records.
This data is used to generate four essential variables in my analyses: density,
founding, failure, and ownership change. Organizational density is measured with the
number of organizations obtaining licenses in a given year. Thus, this is measured at the
end of every year, after all licenses have been issued. I measure this variable for both
firms and establishments, at both the county and state level.
Organizational vital events are again derived from license histories. Each
establishment facility, regardless of the name under which it is operating or the owner,
maintains a license; and the year in which an establishment is first issued a license is
considered the founding year. Note that founding dates are not available for any
establishment existing prior to 1969. The first year of licensing, 1968, cannot be
considered a founding year as it is unknown whether or not those establishments were in
operation prior to that date. Similarly, the first year in which a firm operates an
establishment is identified as the "founding" year for that organization as an operator in
Arizona funerals, regardless of any unknown prior existence in other states or industries.
61
Organizational failures are similarly identified. If an establishment applies for
license in year t-I, but not in year r, then year t is coded as the failure year for an
establishment (i.e. an establishment did not continue it's license for the year t+1 and so
failed in year r). Firms "fail" in the same fashion, with the year after the last licensing
year being coded as the year of "failure."
Licensing also indicates changes in ownership for establishments. These changes
require immediate re-licensing and, as such, the year in which this occurs is coded as the
year of change.
Another key variable in my analyses is that of organizational concentration. As
described in Chapter 1 (recall Figures 2, 3, and 4) this represents the linkages between
organizations operating in the population at hand. Because of this dual organizational
population and my complete data about linkages, I measure concentration via the use of
the Herfindahl Index, a measurement often used to describe market concentration (Tiroie
1988; Finkelstein and Levin 1990) but that has been used in ecological research as well to
measure the inequality of the size distribution of a population of organizations (Dobbin
and Dowd 1997). A common alternative method of measuring organizational
concentration is to examine the market share of the top, say, 5 largest firms (Carroll and
Hannan 2000; Carroll and Sawaminathan 2000). However, this technique loses the detail
of the entire size distribution, and would further limit the understanding of my funeral
home case by being unable to consider establishment-from organizations for which I have
no size measures.
63
In practice, the Herfindahl index measures the amount of concentration in the
market via the sum of the squares of each organizations market share. For a set of k
firms, if the i-th firm has a market share of a; then the index is:
K Herfindahl Index of concentration = H = ( aj)IOO]~
/ = I
In this case, a market with a single firm will have H = 10,000; for values of k greater than
1, the maximum an minimum values are limited such that 0<H< 10,000, though the
specific possible range in a market is determined by the actual number of firms and any
limitations that might be place on market share.
This concentration formula can be transformed for the given case of the funeral
home industry as follows. For a population of k firms and n establishments, we can
envision a market of establishments, where each firm must own some portion of the
establishments - the /-th firm owns .r, establishments. Thus we arrive at the equation
where x/n is the market share of establishments for firm /. Thus we can transform the
index as follows:
K Herfindahl Index of concentration = H = (.r/«)100]~
1=1
The number of establishments and firms operating in the market determines the range of
possible values for this measure. Again, if there is only one firm, then

64
H = 10,000, but with changing numbers of firms and establishments the range approaches
is specifically determined by the number of firms and establishments in operation. As a
consequence, in comparing scores across markets it is possible that two markets with
different numbers of firms and establishments might have equal scores for H, yet one
might be maximally concentrated for its organizational configuration while the other
would not be. To standardize across markets, I consider two possible techniques:
controlling for the number of establishments; and controlling for both number of
establishments and number of firms.
By controlling for establishments, I am considering the conceivable range of firm-
establishment ties that could exist for any given set of establishments, regardless of the
number of firms that are operating in the market. In this case I note that the maximum
value of H for any number of establishments is 10,000; and the minimum value is
(1///) 10000. As such, any market of establishments of size n must exist at a level of
concentration such that (1/n) 10000 < H < 10,0000. So, to compare across markets I
consider that any particular market of establishments will have a level of concentration
lying somewhere between maximum and minimum concentration. I then identify how
close a market is to maximal concentration - the case where the would be only a single
firm owing all the establishments - with the following formula for Concentration
Measure 1:
CI = [H -(l/«) 10000] / [lOOOO - (1/«)10000]

65
Note that this measure carmot be calculated for markets with only one establishment, a
case that would necessitate dividing by zero.
This measure can be interpreted as the concentration of linkages among
establishments - their bonded-togetherness via linkage to a common owner. If all
establishments are owned by a single firm, then they are all linked together via bonds to
their common owner and concentration of linkages is maximized - in this case, H= 10,000
and C1 = 1. If each establishment were to be owned by a separate firm, then they would
not be linked at all and concentration is minimized - in this case H = (l//i) 10000 and CI
= 0. Similarly, various values of H will fall along the continuum and represent minimal
or maximal concentration of ties among establishments in the mzirket.
By controlling for both the number of firms, k, and the number of establishments,
/I, I create a second measure of concentration that is quite different in both calculation
and interpretation. By considering not just the size of the market, measured by n, but the
number of firms operating in it as well, I constrain the set of possible configurations of
firm-establishment ties compared to the conditions used to create CI. In this case, I note
that the minimum value for H is (1/^)10000 if each firm were to own an equal share of
the market; while the maximum value occurs when k-l firms each own a single
establishment and one firm owns /7-(A-l) establishments. Note that this maximum value
decreases as k increases, furthering the need to standardize across markets with varying
organizational populations. I use these limits to again produce a standardized score
describing the percentage of maximal concentration that exists in any market of firms and
establishments as follows:

66
C2 = [H - (l/)t)10000] / {[(/!- + (2/i/t) + (2/i) - k) /«-] 10000 - ( l / / i )10000}
Note that this measure can only be calculated where there is a range of possible
ownership configurations, when k<n-\.
This measure can be interpreted as the inequality of the size distribution of firms.
As firm size, measured in numbers of establishments owned, is equalized, then C2 is
minimized - equal distribution will result in H = (1/^)10000 and C2 = 0. However, as a
single firm grows much larger than all others, then the size distribution is unequal and C2
is maximized.
There are three additional essential variables to this research: the quantity of
human deaths occurring by year - the size of the resource space - and the two period
effects representing institutional changes. Data regarding deaths were collected fi"om
Arizona Vital Statistics. Every death occurring in the state, whether the deceased was a
resident or not, must be reported to this body. As a consequence, this provides a
complete record of all deaths in the state. This information was coded by county-year so
that the score represents the total number of deaths occurring in a county during a year.
This data was then aggregated to determine state-year scores.
Periods of institutional change were determined via the history described in
Chapter 2. The acceptance of chains was coded based on the first foray of an inter-state
chain into the state in 1977. While such chains had existed nationally prior to this date,
the Arizona market had been relatively devoid of anything other than intra-city chain

67
structures. Hence, this year marks the inception of cross-market ownership and the
pursuit of such operation in the state. The passage of Federal regulation is determined by
the year of this event, 1984.
Tables 1 and 2 present a complete description and interpretation of these variables
and their manipulations and interactions as used in the analyses found in this dissertation.
Correlation coefficients between all variables, at both the state and county levels, can be
seen in Tables 3 and 4.
The use of Arizona as a sample is appropriate for several reasons. Arizona was
among the first states to require licensing of funeral homes and the first adopter of an
official state-run Board to oversee such licensing. As a result, Arizona affords perhaps
the longest, complete record of funeral home operations of any state. Further, Arizona's
15 counties have experienced a range of changing markets - some rural counties have
had consistent numbers of deaths, hovering around 500 per year, over the 32-year period
being analyzed, while other urban counties have experienced the dramatically increasing
numbers of deaths associated with the population growth, with numbers of deaths
increasing almost 100% to over 20,000 per year. As a result, the range of possible
changing markets is well represented by the counties that make up the state.
In particular, this is superior to previous research on the industry (Torres 1983,
1988) that uses only nationally aggregated organizational data obtained from the National
Funeral Directors Association; considers only establishment-form organizations; and
ends its time series prior to the rise of chain form funeral homes. In this case, data
conceming variation in local markets is lost via aggregation, funeral homes not members

68
of the NFDA are not included in the sample, and the issues of organizational form
examined here are lost.
MODELS
The analytical portion of this dissertation focuses on modeling five different
dependent variables: organizational density, organizational concentration, and the vital
rates of organizational founding, failure, and change in ownership.
Density is modeled according to the logic of carrying capacity where resources
and institutions combine and interact to affect the number of organizations operating in a
given environment. In a straightforward manner, density is modeled linearly on the set of
county- or state-aggregated covariates using models of the form:
Density, = X, P + e
where Xj represents the vector of covariates for each year t in the time-series. The
specific sets of independent variables pursued in these models will be described in the
analytical chapters.
Concentration is modeled in a similar linear fashion, based on the concepts of
resource dependence and partitioning as presented in Chapter 3, using models of the
form:
Concentration! = Xt P + e
69
Vital events are modeled in accordance with the traditions of organizational
ecology via the use of both linear and rate-based analyses (Baum 1996; Carroll and
Hannan 2000). Of particular note, the structure of the data requires that events in year t
are dependent on covariates measured at both year t and year t-1. At the level of the state
FoundingSt = Xt-i Pi + Xt P2 + e
At the county level, the distribution of vital events is over dispersed towards zero,
requiring the consideration of rate-based models (Ranger-Moore, Banazak-Holl, and
Hannan 1991; StataCorp 2001) of the form:
ln(FoundingSt) = Xt.| Pi + Xt P2 + ̂
Veering from traditions, foundings, failures, and ownership changes are all modeled
similarly with similar methods. While event-history analysis with organization-based
records including covariates describing variation in organizations is commonly used to
model failures (Hannan and Freeman 1989; Baum and Oliver 1992; Carroll and Harman
2000), and would also be appropriate for change-of-ownership models, my data has
limited organizational-level data and is, instead, focused on market-level analyses. As a
consequence all analyses presented in this dissertation are at a level of aggregation above
that of the organization itself.
70
METHODS
The data I utilize in this dissertation are time-series in nature - tracking the
development of the ftineral home industry in the state of Arizona over time - and in some
cases cross-sectional as well - comparing across counties over time. Additionally, I am
analyzing two types of dependent variables: the continuous, ratio variables of density and
concentration; and the count-form variables of organizational foundings, failures, and
changes in ownership. This leads me to consider three types of statistical methods in this
dissertation: Prais-Winsten time-series analysis, time-series cross-sectional generalized
least squares analysis, and negative-binomial time-series cross-sectional analysis. Each is
used in context particularly suited to the data and models at hand.
In modeling density, concentration, and state aggregated vital rates, as described
above, I am faced with continuous dependent variables and data organized as either a
time-series, in the case of state-level aggregated data, or a set of time-series representing
cross-sections of the state, in the case of county-level data. In the case of the aggregated
state-level data, models are faced with the potential problem of serial autocorrelation -
where the scores for variables are not independent over time, producing correlated
residuals and altering coefficients to produce a less accurate model (Judge et. al. 1985;
Allison 1999; StataCorp 2001). To detect whether or not this is a problem, traditional
ordinary least squares techniques are used to examine models and produce the Durbin-
Watson statistic that can identify this potential error: as values for this statistic diverge
from the null-hypothesis, no autocorrelation value of 2, the use of non-OLS models is

71
indicated (Judge et. al. 1985; Sayrs 1989; StataCorp 2001). In all cases, pursuit of time-
series models was indicated by low values of the Durbin-Watson statistic.
I considered three possible solutions to this problem: the Prais-Winsten estimator,
Cochrane-Orcutt estimator (1949), and a step-wise process (Hildreth and Lu 1960;
StataCorp 2001). These methods account for this serial autocorrelation when models are
of the form
y, = X, p + It , (StataCorp 2001)
where
u , = pii n + et
and the covariance matrix of the error term incorporates values of p (StataCorp 2001).
Further, the statistical software STATA (StataCorp 2001) can easily produce these
estimators. Two features of the data are important to consider in choosing the correction
method: the sample size and the order, or periodicity, of the autocorrelation. Regarding
sample size, at the level of the state, I have only 32 records of data (and only 31 in the
case of vital rate analysis which requires lagged independent variables). Both the
Cochrane-Orcutt and step-wise methods require the elimination of the first record in the
times series (StataCorp 2001) which would reduce my sample size by over three percent.
Further, these methods become most useful when autocorrelation is not of the first order
(i.e. when the correlations of residuals is not based on consecutive year records, but on
multi-year intervals), which is not addressed by Prais-Winsten estimation. The
combination of the results of the Durbin-Watson test, my small sample size, and the lack
of any indication of other than first order autocorrelation indicate that the Prais-Winsten

72
estimator is appropriate for these time series. Nonetheless, attempts were made at using
multiple methods but the alternate iterative techniques described here failed to converge,
providing no usable results. Hence, reported results incorporate the Prais-Winsten first-
order time-series estimator utilized via STATA (StataCorp 2001) statistical software.
Analyses of county-level data require a different tack. In these cases, there are
multiple cross-sections, each of which might experience autocorrelation differently.
Further, these cross-sections might be subject to spatial autocorrelation or heteroskedastic
error terms between cross-sections. This is an issue when models are of the form
v,7 = x„ p + (StataCorp 2001)
with / panels and t years.
The XTGLS procedure in STATA (StataCorp 2001) produces generalized least
squares estimators for just such data; and I follow the technique for county-level analysis
as described by Rabe-Hesketh and Everitt (2000) which points to the need to account for
heteroskedasticity when panels vary in scale as is the case in my data - where the size of
the resource space and density of organizations vary dramatically between the largest and
smallest counties. Single county analyses revealed Durbin-Watson scores much below
the non-autocorrelative null hypothesis value of 2, indicating the existence of
autocorrelation. By visually examining residual plots for analyses from a given year
across all counties, heteroskedastic pattems were evidenced. As such, I followed the
12,
recommended technique. Specifically, I allow for separate first order autocorrelation
patterns by county and account for unequal variance in error terms between counties.
A third method is required for use with counts of organizational founding, failure,
and change in ownership at the county level. Here the distribution of counts-by-year of is
highly skewed towards zero - as evidenced in Table 4. Such a distribution calls for the
use of poison or negative-binomial techniques (Judge et. al. 1985; Allison 1999). By
examination, it was determined that for each dependent variable at the county level, the
conditional variance exceeded the mean number of events indicating the necessity to use
negative binomial techniques to prevent underestimation of the standard errors (Ranger-
Moore, Banazak-Holl, and Hannan 1991). In pursuing this technique via pooled time-
series cross-sectional analysis, 1 follow the examples of Barron, Haiman, and Burton
(2001) and Dobrev, Kim, and Hannan (2001) using STATA (StataCorp 2001) software to
model such data via the XTGEE technique of general estimating equations (Liang and
Zeger 1986) that can account for unspecified serial and spatial autocorrelations when
approaching logit models of the form:
In {£•(>',/)} = x„ P + Si, V' ~ negative binomial (StataCorp 2001)
This produces a generalized linear model with robust coefficients that can accommodate
similar conditions to those necessitating XTGLS as described above.
This set of models and techniques is used in the following three chapters to
answer the specific questions pursued in this dissertation.

74
CHAPTER 5 - DENSITY: CHANGING NUMBERS OF ORGANIZATIONS IN THE ARIZONA FUNERAL HOME INDUSTRY, 1968-1999
In this chapter, I investigate the question "How have the size of the resource space
and changing industry institutions affected the density of funeral home organizations?" I
address this via data that describes the complete set of establishments and firms operating
in Arizona between 1968 and 1999, using time-series and time-series cross-sectional
analyses to study panel data.
As graphically revealed in Figure I, and discussed in Chapter 2, the number of
funeral home organizations tracks closely with the number of human deaths, with the
trajectory of resources being tracked more closely by establishments than firms. Of
particular note, this graph shows that resources do not have a static affect on either
density - that there is not a simple monotonic relationship between increasing deaths and
increasing numbers of funeral home organizations. The history of death care indicates
that this relationship is tied to four types of institutional forces: 1) the hyper-legitimated
condition of funeral homes and their services, which tightly links human deaths with the
industry; 2) the traditions and regulations which have affected the size and operational
strategies of fiineral organizations; 3) the traditions among consumers which have guided
how bodies are typically processed by funeral homes and increasingly allowed and
encouraged cremation; and 4) problems with succession that resulted in difficulties for
small, family owned businesses (Torres 1988; Smith 1996; Roberts 1997; Mitford 1998).
I examine these historical explanations via theories of organizational sociology that relate
the density of organizational populations to the amount of available resources and the
75
institutionally structured operations of the industry. Specifically, I consider the
ecological processes of legitimation and competition (Hannan and Freeman 1987; Scott
1995; Hannan and Carroll 2000); and the pursuit of efficiency and profit via economies
of scale (Chandler 1977, 1990; Williamson 1975, 1985). My research in this arena has
several unique dimensions: I precisely measure the resource space at each point in the
time-series; I identify distinct institutional periods; I distinguish establishments from
firms as organizational forms; and I am able to compare my research with that of a
previous ecological study on this industry.
REVIEWING ORGANIZATIONAL DENSITY
Ecological perspectives link the density of organizational populations to the
processes of legitimation and competition that affect organizational foundings and
failures (Hannan and Freeman 1989; Hannan and Carroll 2000). These processes are
dependent, in part, on the amount of resources available and the social forces that
constrain organizational structure, operation, and relationships - conditions that manifest
as a carrying capacity that provides boundaries to the number and types of organizations
that can operate in a given environment. Specifically, resources serve to provide an
upper boundary on the total mass (the combination of numbers and sizes) of an
organizational population, while institutions provide guidelines of operation and
interaction for both organizations and the extra-organizational environment (Scott 1994)
that determine the configuration of the existing organizational structures and operations.
Population densities grow during a period of legitimation, where increasing acceptance of
76
the organizational form (perhaps measured economically via demand for services)
solidifies the institutions that structure the industry and its relationships with consumers,
other organizations, and the state. As the institutionalized organizational population
approaches the limits of carrying capacity defined by resources, competitive forces act to
reduce growth or shrink population size (Hannan and Freeman 1989).
In ecological studies, the notion of legitimation is a source of great contention:
whether or not it is a process or an outcome has been debate with little final reconciliation
(see Hannan et. al (1995), Baum and Powell (1995), and Hannan and Carroll (1995) for a
debate on this issue). Yet this is a key aspect of theories of growth in organizational
populations. My research avoids this issue by independently identifying the funeral
home industry as being hyper-legitimate and taken-for-granted in the eyes of consumers -
the industry is the locus of the vast proportion of all activity regarding the processing and
disposal of human deaths - and governed by associational institutions which regulate
their operations (Torres 1988; Iserson 1994; Smith 1996; Mitford 1998). Thus, at the
start of the time period of my analysis, growth in organizational density is not dependent
on increasing legitimacy, but is instead keyed on resources: institutions limit
organizational size, so as human deaths increase so should organizational densities.
As presented in Chapters 1 and 3, carrying capacity flexes over time as a flmction
of changes in resources, social institutions, and other contingencies. These changes alter
the point at which the process of legitimation is overpowered by the force of competition
- when growth declines. As the size of the resource space increases, one parameter
limiting density is extended, thus allowing for population growth; and in the case of the
77
funeral home industry, the number of deaths also serves to identify the minimum
organizational mass: virtually all bodies must be processed by the industry so the total
number of cases handled by funeral homes in a given market (one conception of the mass
of organizations) must closely match, if not precisely equal, the number of deaths
occurring in that county. Further, when changes in the associational and regulatory
guidelines affecting organizations allow them to grow and increase efficiency via the
advantages of economies of scale (Chandler 1990), they gain larger mass (in this case
handling more cases) and the total numbers of organizations that can be supported by a
given resource space will decline. Thus by identifying changes in resources and
institutions, it should be possible to model organizational densities.
In his research, David Torres (1988) showed that the industry's strong
institutional legitimacy, both at the intersection with consumers and among organizations
themselves, along with a constant number of deaths in the United States, led to a constant
number of funeral homes. I extend this idea by examining a set of counties in a single
state where the number of deaths has not remained constant and institutions have
experienced change.
HYPOTHESES AND EXPLORATIONS
In the empirical analyses of this chapter, I test the relationship between numbers
of organizations and characteristics of the environment in which they operate. In
particular, the hypotheses being tested link organizational density to the availability of

78
resources and changes in the institutions that structure organizational relationships,
proposing both direct and interactive relationships.
The first hypothesis predicts the number of funeral home organizations on the
number of human deaths. Increases in essential resources and demand for organizational
services are theorized to be positively associated with organizational density as a part of
the process of legitimation (Hannan and Freeman 1987; Haruian and Carroll 2000).
However, because of social conditions that prevent the existence of large surpluses of
demand (i.e. all dead bodies must be processed in some timely maimer), any barriers to
the entry of new funeral homes into an expanding market (e.g. a lack of capital, skilled
labor, or geographic space to build) will force some funeral homes to grow in size in
order to meet the increased demand for service. Hence I arrive at the following
Hypothesis I: The number of funeral home organizations will increase at a decreasing
rate as the size of the resource space increases. Thus the first order affect of the size of
deaths on organizational density will be positive and the second order affect will be
negative.
The second and third hypotheses predict the effect of institutional change on
organizational densities. The traditional institutions of the funeral home industry have
undergone two key changes: the rise of national chains and the passage of federal
regulations (Torres 1988; Smith 1996). In Arizona, I identify the broad acceptance of
chain-form economies of scale via the arrival of the first national chain firm, which began
79
operating a single establishment in the state beginning in 1977. The second change took
place in 1984, with the FTC passage of the Funeral Rule requiring fimeral homes to
openly display all pricing and service options. These changes altered the organizational
environment by relaxing informal constraints against economies of scale and promoting
profit-maximizing business practices, and by inhibiting deception on the part of funeral
operators and thus reducing profit from those behaviors (Torres 1988). A consequence of
the first change should be that organizations will not be subjected to the risk of sanctions
stemming from large size. 1 predict that this will have a direct positive effect on
organizational densities by allowing for a new type of organization, the large
establishment or the chain-form firm, to come into existence in addition to those that had
previously existed. 1 propose the second change constrains against a specific type of
organization - those dependent on the behaviors that were made illegal. As such, those
organizations should no longer exist, nor could they be founded, thus further decreasing
organizational densities. Hence, 1 arrive at:
Hypothesis 2: The acceptance of chain form organizations should have a positive effect
on organizational densities.
Hypothesis 3: The passage of the Funeral Law should have a negative effect on
organizational densities.
The fourth hypothesis concerns the interactive effects of these institutional
changes with the size of the resources space. The acceptance of chains and their
80
economies of scale will allow organizations to grow as the resource space increases,
where there had previously been sanctions against such development (Smith 1996). As
such, this period should reduce the expected positive effect of resources on density.
Similarly, the passage of the Funeral Law should serve to reduce the expected positive
effect of resources as the ultra-high profits associated with misrepresentation are no
longer available, minimizing the viability of new organizations being founded based on
small increases in deaths. Thus I propose:
Hypothesis 4: Both period effects should reduce the effect of the resource space on
organizational densities.
An additional set of exploratory considerations revolves around empirical
questions concerning the distinctions between organizational forms and market
aggregations. The definition of both the population of organizations and the resource
space within which organizations exist is methodologically essential to ecological
analyses (Hannan and Freeman 1989). Firms, as organizational forms, represent a
different, legal entity in the organizational environment, while the establishment refers to
the operations precisely at the intersection with resources. By separately analyzing
forms, I hope to explore the notions that this simple form distinction may be a key feature
of organizational mass such that ecological forces can be proposed to have different
forces via these forms. Further, the over-aggregation of markets can mask differentially
localized and countervailing trends in numbers of organizations and resources. Similarly,
81
demarcating theoretically and empirically unsound market boundaries can result in an
underestimation of the resources available to organizations and, when pursuing pooled or
clustered analyses, in the oversampling of organizations operating across such
boundaries. While Chapter 2 points to the operation of funeral establishments in
localized markets, the condition of ownership allows firms to operate multiple
establishments, so that they exist both within and across local markets. By examining
both levels, I consider the possibility that within market dynamics are different fi"om
those across markets.
Further, 1 have no direct measures of either cremation patterns or issues of family
succession. As a consequence, I examine the variable "time" as a feature of institutional
landscape that might be capturing these forces and be worthy of pursuit in future
research.
DATA. MODELS, AND METHODS
The data used in this chapter represents the complete history of flmeral home
organizations operating in Arizona between 1968 and 1999: yearly records identifying
the location of each funeral home establishment and the firm that owns it, and the number
of deaths occurring in each of the state's fifteen counties. I study the state of Arizona
because it is an early adopter licensing for funeral homes, allowing for complete
information on all operating organizations, via coding of these licensing records, across a
history of changing institutional regimes and resource availability. These data enable me
to identify the point at which an establishment is first open for business, not when they

82
service their first customer or become a member of an association; and I am able to
disaggregate to the county level, the typical market area of death care. This is
advantageous compared to previous studies of the industry (Torres 1983, 1988) that use
voluntary membership in the National Funeral Directors Association as the basis for
identifying existing organizations, thus failing to include non-member organizations; has
a time-series which ends prior to the rise of large chains and the passage of federal
legislation; and aggregates death and organizational data to the national level obscuring
the localized distributions of human death that change over time as a function of human
migration.
The dependent variables modeled in this chapter measure organizational densities.
Because of the highly legitimated state of the industry, changes in these densities should
correspond to features of the organizational environment that affect carrying capacity: in
particular, resources and the institutions that shape organizational structure and operation.
Hence, the independent variables measure just those features.
Dependent Variables:
Establishments - This variable measures the density of establishment-form organizations
in operation at the end of each year in the time-series; and was coded from the records of
the Arizona State Board of Funeral Directors.
Firms - This variable measures the density of firm-form organizations in operation at the
end of each year in the time-series, and was coded from the records of the Arizona State
Board of Funeral Directors.
83
Independent Variables:
Deaths - This variable measures the number of human deaths at the end of each year in
the time-series; and was coded from Arizona Vital Statistics. Scores for this variable are
measured in thousands-units (deaths/1000) for ease of interpretation of the results; and a
squared term is included in all models to account for non-linear effects.
Period Effect I: the existence of national-chain firms in Arizona - This is a dichotomous
variable identifying the years after 1976 when national, chain firms first entered into
Arizona.
Period Effect 2: the passage of the Funeral Law - This is a dichotomous variable
identifying the years after 1983 when Federal regulation was enacted to enforce complete
and honest presentation of pricing and service options.
Interactions - The interactions of each period with deaths identify' the effects of the
institutional period on the relationship between organizations and resources.
Time - This variable controls for the passage time, which can capture the effects of the
unmeasured time-varying institutions and time-dependence for the effects of institutional
change, by simply measuring the number of years since the start of my time-series. A
squared term is included to account for non-linear effects.
1 use time-series analysis of state level data and time-series cross-sectional
analysis of county level data to predict organizational densities on a set of independent
variables. Analyses at the state level (Tables 5 and 7) require consideration of serial
autocorrelation. Models take the form:
y, = Xt P + M,
84
where
u , = p u t - i + e i
and the covariance matrix of the error term accounts for values of p.
Durbin-Watson test scores via simple ordinary least squares modeling indicated
the need to account for such autocorrelation (Sayrs 1989; StataCorp 2001). As a result, I
pursued Prais-Winsten time series analysis - which produces a first-order autocorrelation,
generalized least squares estimator (StataCorp 2001). Note that other time-series
techniques were considered: attempts at Chocrane-Orcutt (1949) estimation and a step
wise process (Hildreth and Lu I960) did not converge and require the loss of the first
record in the time series, which can be inefficient with small samples as I am using here
(StataCorp 2001).
Though counties are appropriate market boundaries for death care, it is possible to
transport bodies across county boundaries for services. As a result, analyses at the county
level must consider spatial as well as serial autocorrelative processes. I use time-series
cross-sectional generalized least squares approach these models of the form;
x'i, = x,v P + Sit (StataCorp 2001)
This method via STATA (StataCorp 2001) allows for the consideration of correlated and
heteroskedastic error terms across panels, an important issue with geographically
contiguous panel-units that vary in size (Rabe-Hesketh and Everitt 2000) as is the case in
this examination of counties.

85
Two important technical features of the models themselves are the incorporation
of the variable "time" and the use of interaction effects. As shown in Chapter 4, "time" is
highly correlated with "deaths" at the state level (r>.98). As a result, this control was
eliminated from the state level models to avoid problems of multicollinearity (Allison
1999) with the key measure of the resource space. Similarly, in consecutive models
within the same analysis, sets of interaction variables were progressively reduced across
models via elimination based on collinearity and statistical non-significance.
DISCUSSION OF RESULTS
Overall, the results of my analyses indicate that resources are key determinants of
organizational densities; and that the presented institutional changes do affect
establishments, but have no effect on firm densities. Additionally, 1 find that the passage
of time does affect both firm and establishment densities.
Tables 5"'' and 6 present the results of analyses of establishment density at the
state and county levels, respectively (note that in Table 5, model 3 explains 97% of the
variation in the dependent variable). All of the models in both of these tables reveal
statistically significant first-order positive and second-order negative effects of human
deaths on establishment density. This relationship supports hypothesis 1, that resources
are a key determinant of organizational densities and that organizations themselves, not
just populations, grow with increases in the resources space.
Analysis at the state level for establishments is an unnecessary aggregation of markets, however I include this table for purposes of reference and general interest.

86
Both period effects (representing the introduction of chain-form organizations to
the state and the passage of federal legislation) are shown to have positive effects on
establishment density at the state level; however, these effects become non-significant at
the county level where analyses control for time, indicating that these institutional
changes may, in fact, have no direct effect on establishment densities, while other time-
varying effects are at play. Nonetheless, these periods do interact negatively with the
resource space to affect density as predicted in Hypothesis 4. Focusing on Table 6,
model 3 shows that the effect of resources on density declines during after passage of the
Funeral Law.
Tables 7 and 8 present the results of analyses on firm-form organizations (note
that model 3 in Table 5.3 explains 81 % of the variance in the dependent variable). In all
cases, the first-order positive and second-order negative effect of resources that was
found for establishments is found for firms as well; again providing support for
hypothesis 1. Both direct and interactive institutional period effects are non-significant in
all cases (though the coefficients again refute hypotheses 2 and 3 and support hypothesis
4). As with establishments, the addition of time is notable for its significant negative
second-order effects, while both direct and interactive institutional effects are non
significant. This further hints, at gradual organizational change over time and additional
institutional changes, perhaps those associated with increasing cremation and issues of
succession, not identifiable by the individual period effects examined here.
In general, this provides evidence to suggest that the inflexible relationship
between deaths and organizations leads to a non-monotonic effect of deaths on funeral
home densities: as the size of the resource space grows, either new organizations must be
founded to meet increasing demand or some existing organizations must increase in size
- results here indicate that the latter certainly occurs, despite the existence of other
institutions that discourage such growth. Additionally, my analyses show that the rise of
chain-form organization and federal regulation both directly affect establishment
densities, and further interact to affect the way establishment densities respond to
numbers of deaths; but, interestingly, these institutional changes do not affect firm
densities. Finally, my results show that the passage of time has a positive, but declining,
effect on densities, hinting at the importance of forces such as consumers' increasing
preference for cremation, problems of succession in family businesses, and patterns of
entrepreneurship - none of which are directly measured.
These results add interesting findings to organizational studies. Despite a
constant increase in the size of the resource space, declining growth and actual decreases
in organizational densities are seen in Figure 1. The analysis here points to institutions as
key elements in these density patterns and indicates their importance in the determination
of carrying capacity. In particular, the institutions binding the industry to the resource
space have previously been thought to stabilize the population of organizations (Torres
1988), but I reveal the linkage to operate in a different fashion - when the resource space
is growing, the tight linkage forces organizations to respond as well, encouraging growth
of existing organizations in addition to the founding of new ones. Additionally, my
analyses show that changing institutional structures external to the industry operate not
just by constraining the organizations themselves, but by altering the way in which they

88
interact with the resource space as well. These findings highlight the importance of
institutions as determinants of carrying capacity, as forces that both alter the actual
structure of organizations and the manner in which they approach the environment.
Further, the effect of the variable "time" suggests that a range of other institutional forces
- including, perhaps, the issues of succession and changing consumer attitudes - may be
at play, and that the effect of changing acceptance of chain-forms may develop over time
instead of as a static event. Finally, my analyses highlight organizational form and the
boundaries of the resource space as ecological issues: I reveal differing effects of
particular institutions on firm- and establishment- form organizational densities.
These findings focus attention on how the forces that affect organizational
densities might affect the relationships between firms and establishments, and telegraph
fiarther questions about the processes of organizational founding, failure, and
consolidation that are at the heart of these changes in density - issues that I pursue in the
following two chapters. Additionally, the effects of the time variable leads to questions
about the forces behind institutional change and its timing: perhaps the tight linkage of
the industry to resources forces the rise of large firms and requires the adjustment of
associational institutions to match these structural changes. This notion is not addressed
further in the dissertation, but is left as a topic for future research.

89
CHAPTER 6 - ORGANIZATIONAL CONCENTRATION
In this chapter, I investigate organizational concentration in the population of
funeral home organizations operating in Arizona between 1968 and 1999: examining
ownership ties between firms and establishments, using time-series and time-series cross-
sectional analyses to study panel data. In doing so, I am pursuing an answer to the
question "How have changes in components of carrying capacity - resources,
organizational densities, and institutions - affected organizational concentration in the
flineral home industry?" Particularly, I link theories together by comparing the notions of
resource partitioning with those of resource dependence as related discussions of
organizational concentration.
As shown in Figure 5, and discussed in Chapter 2, concentration of ownership in
the industry has increased during the latter quarter of the 20th century - once featuring
almost exclusively single-establishment firms, the industry changed to feature large
national and regional chains along side traditional "mom and pop" organizations (Smith
1996; Roberts 1997). History indicates that this occurred, in part, as a function of 1)
relaxation in the institutions that had traditionally promoted the small size and simple
ownership structure of the industry; and 2) problems with successorship in family
businesses.
The results of Chapter 5 indicate that, because of the hyper-legitimated condition
of the industry, increases in resources are met with organizational growth in addition to
population growth. This is illustrated by Figure 1, which reveals that the densities of
establishments and the firms that own them diverge from the size of the resource space,
90
and from each other, over time. This presents that the average size of both
establishments (in number of cases serviced) and firms (in number of establishments
owned) must be growing. From the starting point in 1968 where there are almost equal
numbers of firms and establishments, this divergence could imply that either all firms are
growing equally, each owning a similarly increasing number of establishments, resulting
in an egalitarian distribution of firm size - a state of low organizational concentration.
However, Figure 5 illustrates that there is a growing inequality to the distribution of size,
with a few firms owning a large proportion of those existing establishments thus
producing high concentration.
1 examine changing organizational concentration within the context of the specific
competitive environments and institutional structures of the industry in the period of
analysis. Of key importance, again, is the ftilly legitimated state of the industry relative
to the resource space. Practically, this means that virtually all deaths are processed
through the industry, and the industry is focused on deaths as its primary resource.
Theoretically, this implies that the total mass of organizations (the sum of all their sizes
measured in number of cases processed) will be highly correlated with the number of
deaths - this stable institutional linkage establishes the resource space as a very strong
boundary of carrying capacity with both maximal and minimal implications: the
population of organizations must have a mass nearly equal to resources. Note, however,
that there remains flexibility in the population configurations that can represent this mass
(e.g. many small organizations or one very large organization). The prior chapter
examines density configurations under this condition; and this chapter investigates the

91
size configurations and ownership relationships among existing organizations via
examination of organizational concentration. Further the institutional changes that relax
constraint against large establishments and chain-form firms, and the creation of
regulation, affect the manners in which the industry and individual organizations operate.
As revealed in the previous chapter, these features have weak affects on organizational
densities, however they may play strong roles in the relationship between organizations.
1 analyze organizational concentration - here, both an indicator of the size
distribution of firms and the bonded-togetherness of competing establishments, as
described in Chapter 4 - via theories of resource partitioning, which predicts the rise of a
few, large "generalist" organizations in competitive environments and, consequently,
allows for small "specialist" organizations to prosper on the margins of the market, thus
producing concentrated populations where organizational size is disproportionately
distributed (Carroll 1985; Peli and Nooteboom 1999; Hannan and Carroll 2000; Ruef
2000); and resource dependency, which predicts increasing concentration of ownership as
organizations respond to competition and uncertainty with merger (Aldrich and Pfeffer
1976; Pfeffer and Salancik 1978; Aldrich 1979). Further, I specifically take into
consideration profit maximization and economies of scale - shown to be a part of
changes in organizational densities in the previous chapter - as the process behind the
organizational consequences of resource partitioning (Carroll and Hannan 2000); and
horizontal integration as the actual outcome of resource dependence (Pfeffer and Salancik
1978). In distinguishing between these two theories, it is important to note that the
resource partitioning perspective describes conditions of organizations (their sizes and the

92
size distribution within a population); and the resource dependence perspective describes
actions and the consequences of actions among a population (attempts to minimize
uncertainty via merger within a population).
As presented below, these two theoretical traditions predict differing effects of
organizational density and resources on concentration. As such, I am able to test these
theories alongside one another across a range of models predicting concentration.
Specifically, 1 consider the two, related measures of concentration derived from the same
population as presented in Chapter 4: one which measures the size distribution of firms
based on number of establishments owned; and another which captures the binding-
together of establishments under common ownership^*^.
REVIEWING ORGANIZATIONAL CONCENTRATION
I base my research on the typical definition that organizational concentration
refers to the size distribution of organizations, such that concentration increases as a
larger proportion of the total size of all organizations is held by a smaller proportion of
the total number of organizations (see Figures 2 - 4 for graphical insight into this idea).
Foremost to my analyses, 1 measure the size of a firm in terms of numbers of
establishments owned. This allows me to measure concentration for any set of firms and
establishments based on the ownership ties that bind them together - and enables me to
measure the maximally and minimally concentrated configurations of ownership for
In both cases, these are standardized proportional measures. I identify the minimal and maximal levels of concentration for given organizational populations, and assess the existing level of concentration along that continuum.

93
given numbers of organization^'. From the perspective of firms, I can measure the
distribution of ties that link them to establishments, the elements that make up their sizes,
thus capturing the level of equality in the size distribution of firms; and from the
perspective of establishments, 1 can identify the distribution of ties that represent binding
relationships stemming fi-om common ownership, thus capturing the level of bounded-
togetherness among the set of organizations. I do this via the use of the Herfindahl index
(Herfmdahl 1974; Tirole 1988) and a method of standardization that allows me to
measure the proportion of possible concentration that exists among any set of
organizations. These two measures, labeled "CI" for the establishment-oriented
technique and "C2" for that focused on firms, are highly correlated (see Tables 3 and 4)
and distinctively determined by the same ownership ties, however they are standardized
to different population parameters and can be interpreted to have different meanings:
standardizing by both number of firms and number of establishments produces a
percentage measure of maximal concentration representing the inequality of the
distribution of firm sizes; and standardizing by the number of establishments produces a
percentage measure of maximal concentration of the ties that could bind sets of
establishments together under common owning firms.
The theories of organizational concentration I consider here stem fi*om three
perspectives: resource partitioning and profit maximizing notions of the economies of
scale, resource dependence, and the forces of institutions. Resource partitioning indicates
Again see Figures 2 through 4, and the discussion fi-om Chapter 4, which help illustrate that for a given set of firms and establishments, there is a wide range of possible ownership configurations, some more concentrated than others.
94
that large "generalist" organizations rise out of competitive markets, but allow for the
simultaneous existence of many small, specialist organizations (Carroll 1985; Hannan
and Carroll 2000), thus producing an increasing organizational concentration. The
process here is one of expansion via economies of scale - that organizational growth,
instead of population growth, is the response to increasing resource availability and that
already large, general firms tend to continue that inertia growth (Carroll 1985). I also
take into account that this theory corresponds well with Chandler's (1977, 1990) ideas
about the profit maximizing actions of organizations: organizational management will
"choose" to grow when possible in order to take advantage of economy of scale.
Resource dependence (Pfeffer and Salancik 1978; Aldrich 1979) directly
considers competition for limited resources as a force increasing the likelihood of merger
among competitors. The binding together of organizations that occurs via merger buffers
against competition by mitigating uncertainty; and it also increases concentration by
linking together already existing organizations under common ownership. I use this
theoretical lens when approaching the establishment-based notion of concentration,
where concentration refers to the linkages that exist among a population of
establishments. Linkages would occur as a response to competition, as the firms that own
them would sell-out and merge, thus competition would lead to concentration.
This poses an interesting puzzle: the competitively oriented theories would
indicate that resources should mitigate competition, allow population growth, and reduce
concentration - particularly, that concentration which measures the bounded togetherness
of establishments; while the economic perspective would predict increasing concentration
95
via organizational growth associated with expansion under conditions of increasing
resources - particularly that concentration which measures the size distribution of firms.
Finally, as presented in previous chapter, institutions can play key roles in the
structuring of organizations (DiMaggio and Powell 1983; Scott and Meyer 1994; Scott
1995). In the funeral home industry, the institutions that guide this structuring are those
unwavering traditions which bind virtually all human deaths to the services it provides;
and those changing institutions which historically limited the industry to small "mom and
pop"-style operation, but have relaxed in recent decades to allow large chain-form
operations, and those regulations which govern its operation. This allowance of chains
reduces barriers to organizational growth by accepting economy of scale both for
establishments and firms.
HYPOTHESES AND EXPLORATIONS
My conceptualizations of concentration can be interpreted in the following
manners: the bonding-together of establishments is a reflection of efforts to buffer the
negative effects of competition among themselves; and the concentration of firms
similarly eliminates competition and minimizes uncertainty by allowing for access to a
wider share of the market - such consolidation would result in an increased proportion of
establishments under the ownership of a single firm. Following the theories of resource
dependence theory (Pfeffer and Salancik 1978), it is expected that uncertainty and
competition in a market should increase horizontal integration. However, from the
ecological perspective, growing markets are likely to produce a few large firms and a
96
variety by small fimis (Carroll 1985) - a concentrated environment. These are
countervailing forces: resource partitioning would indicate that as population size
increases, it will be an expansion of small organization, thus decreasing concentration;
while resource dependence would identify the competitive forces among many firms as a
force encouraging concentration. Similarly increasing resources will allow
organizational growth and increase concentration according to resource partitioning, but
will reduce competition and decrease concentration according to resource dependence.
Because the two measures of concentration approach size in different ways -
concentration of firms is precisely a measure of the size distribution, while concentration
of establishments references the amount of horizontal integration - these two theories
should apply to these populations differently. Firms are more oriented towards the
theories of resource partitioning, while establishments are oriented towards resource
dependence. Hence 1 arrive at the following:
Hypothesis la: From the perspective of resource partitioning, firm density should
decrease inequality in the size distribution of firms, thus decreasing concentration.
Hypothesis lb: From the perspective of resource dependence, establishment density will
increase uncertainty in ability to acquire necessary resources and lead to competition.
thus the number of organizations will have a positive effect on concentration.

97
Hypothesis 2a: Following the logic of resource partitioning, the size of the resource
space will positively affect growth of a few "generalist" organizations, thus having a
positive effect on concentration.
Hypothesis 2b: Following from the logic resource dependence, the size of the resource
space will negatively affect uncertainty and reduce the need for establishments to be
bound together, thus decreasing concentration.
Changes from the traditional modes of operation of establishments and firms in
the industry directly altered the structure of organizations. In particular, chain form
organizations, by definition, involve single firms owning multiple establishments. The
Funeral Law altered the operation of individual firms, but is not directly associated with
concentration - the organizations most affected by the law would be those who were
dependent on misrepresentation of costs and services and would, therefore, be the least
likely to be involved in mergers or expansion.
Hypothesis 3: The acceptance of chain-form organizations and economies of scale will
have a positive effect on both forms of concentration.
Hypothesis 4: The passage of Funeral Law will have no effect on organizational
concentration.
98
There are three interactive relationships that can be drawn for the theories of
concentration presented above:
Hypothesis 5a: The acceptance of chains should increase concentration by allowing
existing firms to open new establishments, increasing both inequality in the size
distribution of firms and the linkages among establishments, thus period I should interact
positively with deaths towards an increase in concentration.
Hypothesis 5b: The acceptance of chains should increase concentration by allowing
mergers in competitive markets, thus period I should interact positively with density
towards an increase in concentration.
As in the previous chapter, these analyses allow for the exploration of market
aggregation as features affecting analyses of concentration. As shown in Tables 3 and 4,
both forms of concentration vary in maximum, minimum, and average values between
the state- and county-level: changing the boundaries within which ownership
relationships are measured changes the number of organizations that can possible be
linked and will differentially consider any ties that exist across county boundaries. As a
consequence, I have high expectations that results may vary dramatically between these
levels of analysis.
And again, unmeasured institutional changes, including rising cremation rates and
succession issues, are captured at the county level via the variable "time." As was found

99
in the previous chapter, I expect that this variable will alter the ways in which institutions
affect organizational concentration.
DATA, MODELS, AND METHODS
The data used in this chapter represents the complete history of funeral home
organizations operating in Arizona between 1968 and 1999: yearly records identifying
the location of each funeral home establishment and the firm that owns it, and the number
of deaths occurring in each of the state's fifteen counties. I study the state of Arizona
because it is an early adopter licensing for funeral homes, allowing for complete
information on all operating organizations, via coding of these licensing records, across a
history of changing institutional regimes and resource availability. These data enable me
to identify the point at which an establishment is first open for business, not when they
service their first customer or become a member of an association; and I am able to
disaggregate to the county level, the typical market area of death care. This is
advantageous compared to previous studies of the industry (Torres 1983, 1988) that use
voluntary membership in the National Funeral Directors Association as the basis for
identifying existing establishments, thus failing to include non-member organizations and
neglecting to consider any issues of organizational form or concentration. Further, this
prior research has a time-series which ends prior to the rise of large chains and the
passage of federal legislation; and aggregates death and organizational data to the
national level obscuring the localized distributions of human death that change over time
as a function of human migration.

100
The dependent variables modeled in this chapter measure organizational
concentration. As implied in the previous chapter, and illustrated in Figures 1 and 5,
changes in these concentrations are, in part, evident in the diverging densities of the
different organizational forms. As such, they should correspond to features of the
organizational environment that affect carrying capacity. In particular, resources and the
institutions that shape organizational structure and operation. Hence, the independent
variables measure just those features.
Dependent Variables:
Concentration Measure 1: the proportion of maximal concentration of the size
distribution offirms within a given population, based on number of establishments
owned. This variable considers the sizes of all operating firms and increases as a smaller
proportions of firms own increasing proportions of the existing establishments.
Concentration Measure 2: the proportion of maximal concentration of ties among
establishments within a given population, based ownership by a common firm. This
variable considers all ties between establishments and increases as a larger proportion of
the population is linked together.
Independent Variables:
Establishments. This variable measures the density of establishment-form organizations
in operation at the end of each year in the time-series, capturing a key component of
competition among establishments. Scores for this variable are measured in hundreds-
units (establishments/1000) for ease of interpretation of the results.
101
Firms. This variable measures the density of firm-form organizations in operation at the
end of each year in the time-series, capturing a key component of competition among
firms. Scores for this variable are measured in hundreds-units (firms/1000) for ease of
interpretation of the results.
Deaths. This variable measures the number of human deaths at the end of each year,
capturing a second key feature of the competitive landscape. Scores for this variable are
measured in thousands-units (deaths/1000) for ease of interpretation of the results; and a
squared term is included in all models to account for non-linear effects.
Period Effect I: the existence of national-chain firms in Arizona. This is a dichotomous
variable identifying the years after 1976 when national, chain firms first entered into
Arizona.
Period Effect 2: the passage of the Funeral Law. This is a dichotomous variable
identifying the years after 1983 when Federal regulation was enacted to enforce complete
and honest presentation of pricing and service options.
Interactions - Three types of interactions are included in the models of this chapter: 1)
between deaths and period effects; 2) between density and period effects; and 3) between
density and deaths. The coefficients of these variables indicate the following: 1) the
change in the effect of deaths on concentration during the given period; 2) the change in
the effect of density on concentration during the given period; and 3) the change in the
effect of density on concentration for each unit increase in deaths.
Time - This variable controls for the passage time, which can capture the effects of
unmeasured time-varying institutions and time-dependence for the effects of institutional
102
change, by simply measuring the number of years since the start of my time-series.
Scores for this variable are measured in hundreds-units (time/1000) for ease of
interpretation of the results; and a squared term is included in all models to account for
non-linear effects.
1 use time-series analysis of state level data and time-series cross-sectional
analysis of county level data to predict organizational densities on a set of independent
variables. Analyses at the state level (Tables 9 and 10) require consideration of serial
autocorrelation. Durbin-Watson test scores via simple ordinary least squares modeling
indicated the need to account for such autocorrelation (Sayrs 1989; StataCorp 2001). As
a result, I pursued Prais-Winsten time series analysis - which produces a first-order
autocorrelation, generalized least squares estimator (StataCorp 2001). Note that other
time-series techniques were considered: attempts at Chocrane-Orcutt (1949) estimation
did not converge and the two-step process (Hildreth and Lu I960) is inefficient with
small samples as I am using here.
Though counties are appropriate market boundaries for death care, it is possible to
transport bodies across county boundaries for services. As a result, analyses at the county
level must consider spatial as well as serial autocorrelative processes. I use time-series
cross-sectional generalized least squares approach these models. This method via
STATA (StataCorp 2001) allows for the consideration of correlated and heteroskedastic
error terms across panels, an important issue with geographically contiguous panel-units
that vary in size (Rabe-Hesketh and Everitt 2000), as is the case in this examination of
counties.
103
Two important technical features of the models themselves are the incorporation
of the variable "time" and the use of interaction effects. As shown in Chapter 4, "time" is
highly correlated with "deaths" at the state level (r>.98). As a result, this control was
eliminated from the state level models to avoid problems of multicollinearity (Allison
1999) with the key measure of the resource space. Similarly, sets of interaction variables
were progressively reduced across models via elimination based on collinearity and
statistical non-significance.
DISCUSSION OF RESULTS
Overall, my results support elements of both the competition-based resource
dependence and resource partitioning theories of organizational concentration, as well as
theories of increasing concentration via economies of scale; and provide only weak
support for the idea that institutional changes impact the organizational concentration.
However, the findings presented below add interesting insight into the power of
legitimacy as an institutional force operating between resources and an industry. As
presented in the prior chapter, that tight linkage in the funeral home industry may force
both establishments and firms to grow in size as demand for services increases. In this
analysis, that same tight linkage and forced growth is indicated to impact the
relationships among organizations towards concentration.
Tables 9 and 10 present analyses of firm-based organizational concentration - the
proportion of maximal concentration of the size distribution of firms - at the state- and
county-levels, respectively. Model 2 of Table 6.1 (r^=.79) reveals a negative effect for

104
density and positive effects for institutional changes. At the county level, density has a
positive effect on concentration while resources have a negative effect; further the
acceptance of chains interactively increases the positive effect of firms, and federal
regulation minimizes the negative effect of resources.
This indicates support for Hypotheses la and 3 at the state level; and support for
only hypothesis 5b at the county level. The one consistent finding is that the relaxation
of institutional constraints against chains and economies of scale increases inequality in
the size distribution of firms - these institutional changes increase concentration.
Further, changing the aggregation of the market affects concentration so that at the state
level there is support for the conditions of resource partitioning, while at the county level
there appears to be support for the resource dependence model of operation among firms.
Tables 11 and 12 present analyses of the establishment-based organizational
concentration - the proportion of maximal concentration of ownership ties among
establishment-form organizations - at the state and county levels, respectively. Model 3
in Table 11 (r"=.95) reveals that establishment density and resources both directly serve
to decrease concentration; while institutional changes directly increase, but interactively
decrease concentration. At the county level, organizational density has a positive effect
on concentration; deaths have a negative effect - that further interacts positively with
density.
These results provide strong evidence to support resource dependence theories to
explain the concentration of linkages among establishments, particularly at the county
level. Further, by controlling for time in models at the county level, institutional effects

105
are reduced, hinting at the strength of competitive forces as those driving concentration in
the industry.
In general, I find that firm- and establishment-form concentration operate in
different ways: the concentration of the size distribution of firms fits well into the
theories of resource partitioning when data is aggregated at the state level; while the
concentration of the distribution of linkages among establishments^" operates at the
county level along the lines of resource dependence. While the operationalization and
conceptualization of concentration are different for these two organizational forms, the
finding that firms and establishments respond differently to elements of the
organizational environment is an important indicator that organizational form has bearing
on how generalized processes work. Further, that results differ between county and adds
import to the manner in which data is aggregated. In this case, because firms can operate
in multiple counties simultaneously, aggregation to the state level is the most appropriate
level of analysis. Establishments compete in local markets, so the county is the
appropriate level for their analysis. Nonetheless, the finding that firm concentration at
the county level corresponds to resource dependence theories hints at the importance of
market partitions as important features of the theories of organizational relations.
Yet, another way of conceiving of this is the concentration of the size distribution of establishments, where size is measured in the number of co-ownership ties to other establishments.
106
CHAPTER 7 - ORGANIZATIONAL VITAL RATES
In this chapter, I investigate founding, failure, and change in ownership in the
population of funeral home organizations operating in Arizona between 1968 and 1999,
using time-series and negative binomial time-series cross-sectional analyses to study
panel data. I examine theories of organizational sociology that predict these vital events
to be functions of competition, measured via organizational densities, resources,
relationships among organizations, and the institutional environment. This develops the
processes behind the changes in density and concentration presented in the previous
chapters; and provides answers to the question "How do the components of competition
combine to affect the vital processes of flineral home organizations?"
As presented in Figures 8 through 12, vital activities of founding, failure, and
changing ownership have varied over time in my sample of the industry. Of particular
note. Figures 9, 11, and 12 (showing the failures of firm- and establishment-form
organizations, and changing ownership of establishments, respectively) correspond well
with the information presented in Figures 1 and 5: the increasing numbers of firm and
establishment failures link to declining population growth, and the increase in ownership
change of establishments hints at rising concentration in the industry. Previous chapters
have looked at population level characteristics of density and concentration, but this
chapter looks inside processes to consider how the specific vital events that lead to
changes in these features are affected by forces of competition - as manifested in
organizational densities, resources, organizational concentration, and the changing
institutions of the industry.

107
REVIEWING VITAL RATES
I pursue this examination of vital rates from two perspectives, that of competition
and that of resource partitioning. In particular, from the perspective of competition, I
pursue the ideas of density dependence (Hannan and Freeman 1989; Baum 1996) and
resource dependence (Pfeffer and Salancik 1978). As opposed to previous chapters
where process was not examined directly, here I am able to get to the heart of these
theories. Theories of density dependence indicate that competition increases as density
increases - specifically that as density approaches carrying capacity, competition
becomes fierce. As a result, in a competitive environment, density positively affects
failures and negatively affects foundings (see Baum 1996 for a review of findings in this
area). With regard to resource dependence, the availability of resources dictates levels of
competition inversely (Pfeffer and Salancik 1978; Aldrich 1979). While this can of
course be extended to effect events of founding and failure vi the logic of carrying
capacity, resource dependence was specifically theorized in terms of organizational
merger - pursued here more broadly as change in ownership.
Further, these competitive processes are influenced by the concentration of
organizations. From the perspective of resource partitioning and size-localized
competition, concentration in the size distribution of firms should increase foundings and
decrease failures (Carroll 1985; Ranger-Moore et. al. 1995; Carroll and Hannan 2000;
Carroll and Swaminathan 2000). Here, two forces are at play: 1) the general trend in
competitive markets toward the rise of generalists who pursue economies of scale, but

108
allow small organizations into the specialized margins of the market; and 2) fierce
competition that occurs between those small specialists or between large generalists, but
not between the two different types. As a result, concentration of the size-distribution
becomes inversely related to competition. Another perspective on the role of
concentration comes fi"om resource dependency. Merger is a response to minimize
competition by aligning organizations cooperatively under common ownership. As a
result, concentrated markets experience less powerful competition; and, again,
concentration reduces competition leading to increasing foundings and decreasing
failures.
HYPOTHESES AND EXPLORATIONS
The near-wholly legitimated condition of the industry relative to the resource
space identifies competition as the key feature driving vital rates. I analyze those features
of the environment that can relax or intensify competition in order to predict the vital
rates of organizations. To this end, 1 focus on three key variables: organizational density,
deaths, and organizational concentration. Organizational density is positively related to
competition by way of placing the population closer to the limits of carrying capacity -
increasing the number of organizations operating within a given resource space decreases
the average amount of resources available, thus increasing competition. Resources
operate in the opposite direction by expanding the limits imposed by carrying capacity
and thus reducing competitive forces. The two forms of concentration approach
concentration in similar ways. The first form of organizational concentration, that

109
describing inequality in the size distribution of firms, should also decrease competition as
it represents a minimization of the equality of size that strengthens competition (Ranger-
Moore et. al. 1995). The second form of concentration, that which describes
relationships among establishments, should serve to decrease competition as it is
describing a "bound-togetherness" among possible competitors, such that others in a
network experience the success of any one establishment.
The first set of hypotheses focus on the classic ecological ideas of density
dependence, which should remain a key force behind the vital processes presented here.
Typically, there are opposing of first- and second-order effects (Hannan and Freeman
1989; Baum 1996; Hannan and Carroll 200) of density on vital rates across the history of
an industry: low densities are operating in the realm of legitimation and high densities are
operating under competition. Given the already legitimate state of the industry at the
starting date of my time period, density should serve only to increase competition and
should not be a force of legitimation. Hence 1 arrive at the following
Hypothesis la: Organizational density will have a negative effect on founding rates.
Hypothesis lb: Organizational density will have a positive effect on failure rates.
Hypothesis Ic: Organizational density will have a positive effect on rates of changing
ownership.
The second set of hypotheses focus on the key resource of deaths. As previously
presented, increasing the size of the resources space should mitigate competition by

110
expanding carrying capacity. Note again that the traditional process of legitimation is not
at play. Instead, as resource increases it is precisely this existing legitimacy that leads to
organizational foundings in response to increasing demand under institutional conditions
that limit size. As such. I arrive at:
Hypothesis 2a: Deaths will have a positive effect on founding rates.
Hypothesis 2b: Deaths will have a negative effect on failure rates.
Hypothesis 2c: Deaths will have a negative effect on rates of changing ownership.
As presented above, organizational concentration should serve as a buffer to
competition among organizations. This forms the basis for my third set of hypotheses.
Via quite different processes, both forms of concentration tie organizations together; in
the case of establishments, concentration serves to minimize competition among
members and redistribute finances so as to mitigate the negative consequences of
competition (Pfeffer and Salancik 1978; Williamson 1985); in the case of firms,
concentration describes variation in size which can serve to decrease the ferocity of
competition among them (Ranger-Moore et al. 1995; Carroll and Hannan 2000; Carroll
and Swaminathan 2000) and presents as resource partitioning - with a kind of symbiosis
among organizations existing in a population with a few large generalists and many small
specialists. Thus I arrive at:
I l l
Hypothesis 3a: Concentration will have a positive effect on organizational founding
rates.
Hypothesis 3 b: Concentration will have a negative effect on organizational failure rates.
Hypothesis 3c: Concentration will have a negative effect on rates of changing ownership
of establishments.
The fourth set of hypotheses returns to the institutional history of the industry.
While the institutions legitimating death care itself are stable across my time period,
those that govern organizational structure are not. The acceptance of chain form
organizations should allow for an increase in competition for resources. As organizations
are allowed to grow through economies of scale, the institutions that had prevented the
pursuit of large numbers of resources no longer exist, and competition for those resources
will increase. Regarding Funeral Law, the regulation of pricing will serve to increase
competition for limited resources as organizations are less able to depend on large profits
from a small number of services. As such, I propose the following:
Hypothesis 4a: The period effects for institutional change should have a negative effect
on organizational founding rates.
Hypothesis 4b: The period effects for institutional change should have a positive effect
on organizational failure rates.
Hypothesis 4c: The period effects for institutional change will have a positive effect on
the rate of change in establishment ownership.

112
The fifth set of hypotheses considers interactions between periods and density.
Hypothesis 5: The interaction between institutional periods and organizational density
will have a positive ejfect on competition and affect vital rates accordingly.
As in the previous chapters, the differing populations of firms and establishments,
at varying levels of market aggregation, are analyzed. This allows for consideration of
organizational form as a feature that may affect the processes of competition. If the
effects differ between firms and establishments, conclusions can be drawn about the
possibility the ecological process discussed here are contingent on the way organizations
are identified. Further, the consideration of both state- and county-level markets allows
for an investigation of how drawing market boundaries may affect the study of these
processes.
DATA, MODELS, AND METHODS
The data used in this chapter represents the complete history of fianeral home
organizations operating in Arizona between 1968 and 1999: yearly records identifying
the location of each funeral home establishment and the firm that owns it, and the number
of deaths occurring in each of the state's fifteen counties. I study the state of Arizona
because it is an early adopter licensing for funeral homes, allowing for complete
informafion on all operating organizations, via coding of these licensing records, across a
113
history of changing institutional regimes and resource availability. These data enable me
to identity the point at which an establishment is first open for business, not when they
service their first customer or become a member of an association; and I am able to
disaggregate to the county level, the typical market area of death care.
The dependent variables modeled in this chapter measure organizational vitality.
As presented above, they should correspond to features of the organizational environment
that affect carrying capacity and lead to competition. Note that because data is recorded
at the end of every year, the vital events occurring in year t are modeled with independent
variables measured in year t-l.
Dependent Variables:
Organizational Foundings, failures, changes in ownership. Each of these variables is a
count of the number of times these events occur in a given year.
Independent Variables: except for period effects, all are analyzed at year t-l.
Establishments. This variable measures the density of establishment-form organizations
in operation at the end of each year in the time-series, capturing a key component of
competition among establishments. Scores for this variable are measured in hundreds-
units (establishments/1000) for ease of interpretation of the results.
Firms. This variable measures the density of firm-form organizations in operation at the
end of each year in the time-series, capturing a key component of competition among
firms. Scores for this variable are measured in hundreds-units (firms/1000) for ease of
interpretation of the results.

114
Deaths. This variable measures the number of human deaths at the end of each year,
capturing a second key feature of the competitive landscape. Scores for this variable are
measured in thousands-units (deaths/1000) for ease of interpretation of the results; and a
squared term is included in all models to account for non-linear effects.
Period Effect I: the existence of national-chain firms in Arizona. This is a dichotomous
variable identifying the years after 1976 when national, chain firms first entered into
Arizona.
Period Effect 2: the passage of the Funeral Law. This is a dichotomous variable
identifying the years after 1983 when Federal regulation was enacted to enforce complete
and honest presentation of pricing and service options.
Concentration Measure I: the proportion of maximal concentration of the size
distribution offirms within a given population, based on number of establishments
owned. This variable considers the sizes of all operating firms and increases as a smaller
proportions of firms own increasing proportions of the existing establishments.
Concentration Measure 2: the proportion of maximal concentration of ties among
establishments within a given population, based ownership by a common firm. This
variable considers all ties between establishments and increases as a larger proportion of
the population is linked together.
Interactions - Three types of interactions are included in the models of this chapter: 1)
between deaths and period effects; 2) between density and period effects; and 3) between
density and deaths. The coefficients of these variables indicate the following: 1) the
change in the effect of deaths on concentration during the given period; 2) the change in

115
the effect of density on concentration during the given period; and 3) the change in the
effect of density on concentration for each unit increase in deaths.
Time - This variable controls for the passage time, which can capture the effects of
unmeasured time-varying institutions and time-dependence for the effects of institutional
change, by simply measuring the number of years since the start of my time-series.
Scores for this variable are measured in hundreds-units (time/1000) for ease of
interpretation of the results; and a squared term is included in all models to account for
non-linear effects.
In this chapter, the dependent variables are events: organizational foundings,
failures, and ownership changes. As a consequence, care must be taken in modeling to
ensure proper specification of the distribution of the dependent variable. In particular,
when aggregated to the state level, there are a wide range of possible value for the
dependent variable - see Table 3 and Figures 8 through 12. Thus at this level of analysis,
no special specification need be made, and the Prais-Winsten time-series estimator can be
pursued as in previous chapters.
However, at the county level, the distribution of counts-by-year of is highly
skewed towards zero - as evidenced in Table 4. Such a distribution calls for the use of
Poisson or negative-binomial techniques (Judge et. al. 1985; Allison 1999). By
examination, it was determined that for each dependent variable at the county level, the
conditional variance exceeded the mean number of events indicating the necessity to use
negative binomial techniques to prevent underestimation of the standard errors (Ranger-
Moore, Banazak-Holl, and Hannan 1991). In pursuing this technique via pooled time-

116
series cross-sectional analysis, I follow the example of Barron, Hannan, and Burton
(2001) that uses Stata (StataCorp 2001) software to model such data via the XTGEE
technique of general estimating equations that can account for unspecified serial and
spatial autocorrelations.
Two important technical features of the models themselves are the incorporation
of the variable "time" and the use of interaction effects. As shown in Chapter 4, "time" is
highly correlated with "deaths" at the state level (r>.98). As a result, this control was
eliminated from the state level models to avoid problems of multicollinearity (Allison
1999) with the key measure of the resource space. Similarly, sets of interaction variables
were progressively reduced across models via elimination based on collinearity and
statistical non-significance.
DISCUSSION OF RESULTS
Overall, the results of my analysis support some basic notions of how density and
resources are hypothesized to affect competition and vital rates. Further, I find support
for the logics that concentration decreases competition. However, I find little support for
the expected direct or interactive period effects.
Reviewing tables 13 and 14, which present the results of firm foundings and
failures at the state levels, I find, unexpectedly, that density has no significant effect on
these vital events; and the size of the resource space operates in a decidedly opposite
direction from that predicted; increasing deaths serve to decrease foundings and increase
failures. Both findings are in opposition to what is typically found in competitive

117
environments as represented by Hypotheses 1 and 2. Period 1, the rise of chains and
acceptance of economies of scale, operates in the predicted manner by decreasing
foundings and increasing failures, but federal regulation does not operate as predicted; it
increases foundings and decreases failures. Interactively, period 2 continues to operate
against prediction by decreasing the effect of density on competition. Finally,
concentration^^ has the expected positive effect on foundings, but has no effect on
failures, in support of Hypothesis 3a, but not 3b.
Briefly, the whole of these results indicates that firms are not operating in a
competitive manner at the state level, instead the rise of chains themselves and active
pursuit of economies of scale via merger and growth appear to be the force operating at
this level. In particular, these findings support ideas of resource partitioning and the rise
of large generalists, over the notions of an active competitive market.
Table 15 and 16 examine firms at the county level, modeling founding and failure
rates, respectively. These models provide little support for the notion that traditional
competition drives vital rates in this sample. While density does have a positive effect on
firm failure rates, its effects on foundings become positive^"* and non-significant in full
models. Further, the resource space is not a significant factor at this level of market
aggregation, though the coefficients do perform as expected. As at the state level,
concentration plays the key role in these models, increasing founding rates and
By combining the coefficient of the direct effect with the coefficients of the interactive effects across the possible range of scores for these variables, I find that the net effect is always positive. " Evaluation of the direct first and second order effects, and the interactive effects when appropriate, reveals the density has a consistently positive overall effect.

118
decreasing^^ failure rates as predicted in hypothesis 3. In opposition to the results found
at the state level, institutional period have no direct effect on these vital rates, and
interactions that do not support Hypotheses 4 or 5.
These results again indicate that simple competition for limited resources is not
driven firm-based vital rates. Further, the ability to control for time at the county level
removes the impact of institutional periods. This leaves concentration - in this case the
size distribution of firms - as the key factor affecting vital rates: for any given
population, concentration of the size distribution will increase foundings (or founding
rates) of new firms and decrease failures.
In Tables 17 and 18,1 turn to analyses of establishment founding and failure rates
at the county level. Here evidence suggests that competition operates as expected with
density having a true negative second order'^ effect on founding (though density has no
direct effect in the final model) and positively^' affecting failure rates. Further, deaths
are shown to positively impact founding and decrease failure rates. Thus Hypotheses I
and 2 find strong support. Concentration - here measured as linkages between
establishments - is shown to operate against predictions made in Hypothesis 3. It has a
positive effect on foundings only when density is low, while in high densities
" By combining the coefficient of the direct effect with the coefficients of the interactive effects across the possible range of scores for these variables, I find that the net effect is always negative.
Evaluation of the direct first and second order effects, and the interactive effects when appropriate, reveals that low levels of density have a positive effect on founding but high levels have a negative effect. " By combining the coefficient of the direct effect with the coefficients of the interactive effects across the possible range of scores for these variables, I find that the net effect is always positive.
119
concentration serves to decrease founding rates; comparably, concentration has a positive
effect on failures. These findings refute hypotheses 3a and 3b. Regarding institutions,
there is interactive evidence to show that period 1 increase foundings and period 2
decreases foundings; while regulation has a direct positive affect on failure rates, and the
period of chains interacts positively with establishments to increase failure rates as well.
Hence there is some evidence for hypothesis 4b but not 4a.
This duo of tables indicate that the vital process of establishments are strongly
tied to traditional competitive forces of density and resources; further the institutional
changes that have been a strong part of the history of the industry seem to play only a
secondary role in the vital events presented here. The distribution of ownership linkages,
which played a key role in the vitality of firms as presented above, operates in opposite
directions here. However, while this does not support the ideas of resource dependence it
does correspond well with the notion that such networks serve as barriers to entry of new
firms in the market and distribute risk unequally, such that in a less concentrated market
all establishments share competitive risk equally, while in concentrated markets those
establishment not within networks feel competitive pressures much more strongly.
Table 19 presents the results of analyses of change in ownership among
establishments. As in the analysis of establishment failures, changing ownership operates
as a fiinction of competition much as would be predicted by resource dependence and
ecological theories. Density increase rates of change, while the size of the resource space
decreases these rates - in accordance with Hypotheses I and 2. Further, concentration
120
again increases^^ the rate of the vital event (i.e. concentration of linkages increases the
rate of further concentrating events).
In general, this corresponds directly with the findings concerning establishment
failure. As was expected by resource dependence, this vital event occurs as a
consequence of competition just as ecology focuses on failure as the consequence.
Further, ecology points to merger as a type of failure event (Hannan and Freeman 1989;
Hannan and Carroll 2000) and changing ownership is most often just that - an
establishment merging into an already existing network of organizations.
These results add particularly interesting finding to organizational studies and the
understanding of this specific industry. In particular, that competition - the effects of
density and resources - drives the vitality of establishments, while resource partitioning -
the effects of organizational concentration and the pursuit of economies of scale - drives
the vitality of firms. An important implication of this finding is that institutional change
to the acceptance of chain forms may have little actual affect on the structuring of
organizations - the densities and concentration illustrated in Figures 1 and 5 may well
occur because of ecological and economic processes regardless of how federal regulation
and associational institutions guided the industry. Finally, aggregation of markets is not
shown to significantly affect the results of the analyses.
By combining the coefficient of the direct effect with the coefficients of the interactive effects across the possible range of scores for these variables, I find that the net effect is always positive.

121
CHAPTER 8 - CONCLUSION
The fiinerai home industry in the United States has undergone a wide range of
structural changes in its history. In particular, the state of Arizona, between 1968 and
1999, experienced increasing numbers of human deaths, an increasing numbers of
establishments to service this growing market, and fluctuating numbers of firms (the
organizations that own establishments). In turn, a diverging number of establishments
and firms produced a growing concentration of organizational size - an increasing
inequality of the distribution of establishments among the existing firms. Further, these
changes occurred differently within the localized county-level markets of the state: some
counties experienced little change in resources and organizations over time, while others
grew considerably.
In this dissertation I have examined precisely these changes. Recall, that the
purpose of this dissertation has been to answer the following questions: 1) How do
changes in social institutions and the size of the resource space differently affect the
populations of firm- and establishment form ftineral home organizations? 2) How do
competition for limited resources and changing institutions, along with diverging
populations of firms and establishments, affect concentration in this population of
organizations? And 3) how do resources, institutions, and organizational concentration
combine to affect the vital rates of founding, failure, and changing ownership in
population of firm- and establishment-form organizations? These in service of the
122
broader question "How has the funeral home industry developed over time as a function
of institutional and ecological processes?"
In approaching these questions I have considered a range of theoretical traditions.
From the perspective of organizational ecology, the size of the resource space and levels
of legitimacy and competition are key factors affecting density via founding and failure
rates; from the perspective of the economic organization, the size of the resource space
affects opportunity for growth, in turn affecting concentration and the competitive
landscape; resource dependence theories point to competition as a driving force behind
the concentration of organizations; and institutional theorists point to regulatory policies
and isomorphic processes that can affect both the form of organizational structuring and
the nature of competition in the market.
A key feature of my approach to these theories is the idea of competition -
multiple organizations simultaneously operating to seek out a limited and necessary
resource. This is a particularly appropriate consideration here, given the institutionalized
nature of funeral services that create a rigid social environment necessitating nearly every
human death to be processed through the industry, and limiting the industry to focus
exclusively on that resource for profits. This then enhances the notion of an
organizational environment's "carrying capacity" by describing envirormiental conditions
that limit the minimum possible mass of organizations that can operate under a set of
conditions. I have used this state of hyper-legitimacy to enhance my examination of how
features of the organizational environment affect competition and the changing density,

123
concentration, and vital rates of funeral home organizations in Arizona between 1968 and
1999.
EXPLAINING CHANGES IN THE ARIZONA FUNERAL HOME INDUSTRY
Historic stability in the number of funeral homes establishments operating in the
United States has been explained via institutions of professionalism that limited the
pursuit of economies of scale and ferocious competition (Torres 1988; Smith 1996). The
changes in density and concentration evidenced in the late 20th Century, and the data
presented here, can be attributed to a range of forces: changes in the resources space,
changing associational institutions regarding the appropriate structuring of the industry,
the passage of federal legislation constraining operation, changes in the way consumers
approach the industry (e.g. increasing suspicion of "price-gouging" and use of
cremation), changes in the way family succession is approached by small, family-run
"mom and pop" organizations, and active pursuit of economies of scale by organizations
(Torres 1988; Smith 1996). I directly test the first three forces, and indirectly consider
the final three, within the analyses presented in Chapter 5 through 7.
In general, I find evidence to support the idea that increases in the number of
deaths in localized markets combined with the stable institutions which drive consumers
to the industry are at the heart of changing densities, concentrations, and vital rates;
though not in the simple "more deaths lead to more organizations" maimer that might be
implied by Torres' (1988) previous research. Instead, my findings indicate that
increasing resources are, themselves, a force promoting concentration of the industry net

124
of any effect of institutional change - that rising deaths are met with growth of
establishments, the founding of new establishments by already existing firms, and the
consolidation of existing firms. Further, competition for those resources by
establishments, and pursuit of economies of scale by firms, play key, complementary
roles in organizational concentration. The specific periods of institutional change
representing the acceptance of chains and the passage of regulation are shown to have
effects on organizations, but key indicators point to other time-varying changes as
important forces as well - of key interest here is the possibility that succession problems
in family firms drive the initial rise of concentration in the industry, a process not directly
discussed in this dissertation, but left to be pursued in ftiture research.
Organizational densities in the industry are typically directly attributed to the size
of the resource space and to institutional forces that limit organizational size (Torres
1988; Smith 1996). Net of institutional forces, I find that the number of organizations
does not track directly with resources. Instead establishment density grows more slowly,
and firm density even declines, as the size of the resource space increases (recall Figure
1). This implies that existing organizations must be servicing more deaths, growing in
size, instead of new organizations opening to service the increasing demand. I propose
that this is a result of the tight linkage between deaths and the industry, a state of inelastic
demand, which forces the growth of existing establishments (which increase numbers of
bodies serviced) and firms (which can open new establishments with their existing
capital) when there are barriers to entry by new organizations. I have no measures of
125
such barriers in this dissertation, indicating that research into these limitations would
prove valuable in understanding the operation of the industry.
My direct institutional measures are shown to have little effect on organizational
densities, the only strong finding being that the passage of the Funeral Law did decrease
the density of establishment-form organizations. In this case, regulation against price
deceptions may well have had a fatally detrimental effect on some small number of
establishments dependent on that sort of operation. However, it is quite telling that
"time" was a feature strongly affecting both establishment and firm densities. This
indicates that time-varying forces are at play in the industry, perhaps additional specific
institutional periods, or, as I suspect, gradually changing patterns affecting succession in
family businesses and leading to a non-periodic trend towards chain-form organization.
In any case, this encourages more detailed research into the time varying institutions
governing the industry, and the internal operations of both firms and establishments.
The relationships between firms and establishments, and among establishments,
respond to competition in apparently varied ways. For a given population of firms
operating at the state-level - that is, across markets - the concentration of the size
distribution responds negatively to the size of that population: more firms means a more
equitable distribution of establishment ownership among them. However, at the county
level, concentration responds positively to the number of firms and negatively to the
number of deaths: more firms leads to a more unequal distribution of establishments
among them, but large amounts of resources reduces this concentration. This difference
in markets is telling: across markets, decreasing firm density along with increasing deaths

126
is linked to high concentration within markets (as illustrated in Figures 1 and 5) - this
means an increase in size among only a small proportion of that small number of firms;
while within markets the more firms there are, the more concentrated the size
distribution. This can be imagined as follows: within small markets, there are a few
similarly sized small firms, but as markets grow new firms are founded and a small
number of firms grow by opening new establishments and merging; while across multiple
markets firm consolidation occurs so that the number of firms decrease, but a few of them
are growing disproportionately large. This coincides well with the logic of economies of
scale and profit maximization pursued by a few, large, national firms; and in all cases, the
existence of national chains, organizations that pursue concentration, and the passage of
regulation serve to increase levels of concentration. This consolidation across markets
over time further brings into question issues of successorship as a possible source of
consolidation, as there is no direct competition across counties.
Establishments themselves operate at the county level such that increasing
competition, more establishments and fewer deaths, increases concentration - here, the
binding together of establishments. A larger proportion of establishments tend to be
bound together as their number increases, but this concentration is mitigated by deaths.
This corresponds well with the county level findings for firms. As more establishments
are competing, they seek to be bound together to minimize competition - the firms that
own them merge, binding establishments together - and as the size of the resource space
grows new single-establishment firms are able to enter and successfiilly compete in the
environment.

127
Disentangling the actual processes behind changes in density and concentration
proves valuable in telling the detailed story of this case. Investigating the vital rates of
organizational founding and failure more closely, an interesting distinction develops: the
forces of competition operate differently for establishments and firms. Deaths have a
typical negative effect on competition among establishments - increasing foundings and
decreasing failures and changes in ownership of establishments. However, they have a
reversed effect on firms at the state level and no effect on firms in local markets:
increases in the resource space actually increase failures among firms and decrease
foundings. This implies that the establishment-level response to resources is birth and the
firm-level response to increasing resources is growth and merger. Further, by
considering organizational densities as a component of competition, establishments are
shown to operate in an actively competitive market where the number of organizations is
directly associated with failure rate; firm densities, on the other hand, have no bearing on
firm vitality. Establishments appear to be operating competitively, while firms appear to
have freedom to grow: a compatible, and fascinating finding.
Within these vital processes, I find that the acceptance of chain form
organizations plays a strong role in firm dynamics, increasing failures and decreasing
foundings, while federal regulation operates at the level of the establishment to increase
failures and decrease foundings.
Together, these findings imply that firms and establishments respond to their
environments in very different ways, but that both forms are pursuing economies of scale
regardless of institutional constraints against such operation, implying that the institutions
128
that bind human deaths with the industry are stronger than the institutions limiting
organizational growth. In particular here local markets are competitive for
establishments, but firms can operate across markets and take minimize risk by doing so.
Additionally, the changing acceptance of chain form organizations may not to be an
independent institution, but, instead, one that arise out of the necessity of establishment
and firm growth.
THEORETICAL CONTRIBUTIONS
Firms operate relative to the organizational environment differently than
establishments - they have different ecologies, in part because they operate at different
levels of the market and experience institutional demands differently. In particular, the
link between establishments and the resources space appears to produce competition in its
most traditional form, while firms link to it via growth.
Density dependence (Hannan and Freeman 1989; Carroll and Harman 2000) is
supported only in part by the results here. It holds for terminal events for establishments
and firms at the county level, but not for firms at the state level, nor for founding events
in any case. The other component of competition, the size of the resource space, is
shown to have expected effects on establishment foundings and failures, but to actually
increase the failure of firms.
As per the theories of resource partitioning (Carroll 1985; Peli and Nooteboom
1999; Carroll and Hannan 2000; Carroll and Swaminathan 2001), inequality in the size
distribution of firms produces an increase in firm foundings. Alternately, concentration
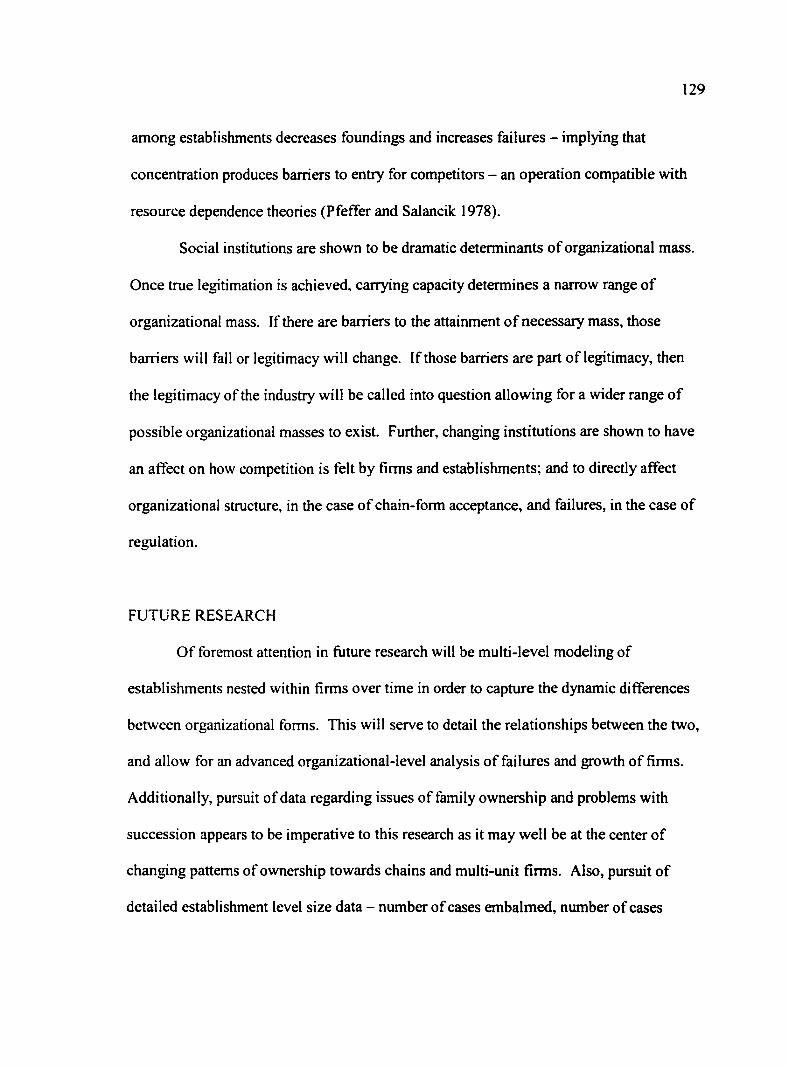
129
among establishments decreases foundings and increases failures - implying that
concentration produces barriers to entry for competitors - an operation compatible with
resource dependence theories (Pfeffer and Saiancik 1978).
Social institutions are shown to be dramatic determinants of organizational mass.
Once true legitimation is achieved, carrying capacity determines a narrow range of
organizational mass. If there are barriers to the attainment of necessary mass, those
barriers will fall or legitimacy will change. If those barriers are part of legitimacy, then
the legitimacy of the industry will be called into question allowing for a wider range of
possible organizational masses to exist. Further, changing institutions are shown to have
an affect on how competition is felt by firms and establishments; and to directly affect
organizational structure, in the case of chain-form acceptance, and failures, in the case of
regulation.
FUTURE RESEARCH
Of foremost attention in future research will be multi-level modeling of
establishments nested within firms over time in order to capture the dynamic differences
between organizational forms. This will serve to detail the relationships between the two,
and allow for an advanced organizational-level analysis of failures and growth of firms.
Additionally, pursuit of data regarding issues of family ownership and problems with
succession appears to be imperative to this research as it may well be at the center of
changing patterns of ownership towards chains and multi-unit firms. Also, pursuit of
detailed establishment level size data - number of cases embalmed, number of cases

130
cremated, number of cases shipped to other funeral homes, etc. - would be a value
augmentation to this existing data. Further, expanding this research to include cemeteries
and information about ownership and business linkages between the two would add to
both an understanding of the industry, and a more dynamic analysis of organizational
communities.
From the perspective of theory, the results here indicate that further delving into
the relationship between size-localized competition and organizational concentration is
worthy of further pursuit. But in this regard, a key arena should be the examining
competition among establishments and its effect on merger, in combination with growth
at the level of the firm - creating formal theoretical linkages between firm and
establishment dynamics. Further pursuit of the idea of "geographic generalism" is also
warranted. That operating in multiple markets is comparable to the varied resources and
"course grained niche" associated with theories of resource partitioning.
Finally, I hope to pursue additional research examining the embeddedness of
fiineral organizations in the resource space. That it is not just variation in the size of the
resource space, but variation in its content that can affect organizational processes. In
particular, by including measures of migration 1 can begin to examine how the
breakdown in traditional family bonds with local tlineral homes affects changes in the
industry.

131
APPENDIX A
Figure 1 - Numbers (Density) of Funeral Home Establishments, Funeral Home Firms, and Human Deaths by Year in the state of Arizona, 1968-1999
o e s t a b l i s h m e n t s a f i r m s o s c a l e d d e a t h s
2 6 4 . 4 8 7 ̂ • •
• ° a
• -I
•
• J •
• ! ^
G a G g o c o a ^ I AA A [ • g O O O ° ^ ^ ^ A A A A A ^ A A A ^ ^ ^ ^
i ° A A A ^ " ^ 7 2 - 1 A ̂ ^
1968 1999 year
square -circle -triangle -
Number of human deaths in Arizona, scaled (deaths/150) Number of funeral home establishments operating in Arizona Number of funeral home firms operating in Arizona

Figure 2 - Example of Firm-Establishment Linkages Presenting Low Organizational Concentration"^^
132
Note that Figures 2, 3, and 4 represent the level of concentration of both ownership ties between establishments and firm size (as measured in establishments owned, such that the total size of the population of firms is equally distributed among all firms).

133
Figure 3 - Example of Firm-Establishment Linkages Presenting Medium Organizational Concentration"*"
Note the change from Figure 2 implies the failure of firms B, C, E, and G, and establishments 5 and 7; the founding of firm H and establishments 8 and 9; and the change in ownership of establishments 2 and 3. Also, recall from Figure 2 that this can be interpreted as an increase in the concentration of both ownership ties between establishments and firm size (as measured in establishments owned, such that the total size of the population of firms is not equally distributed).
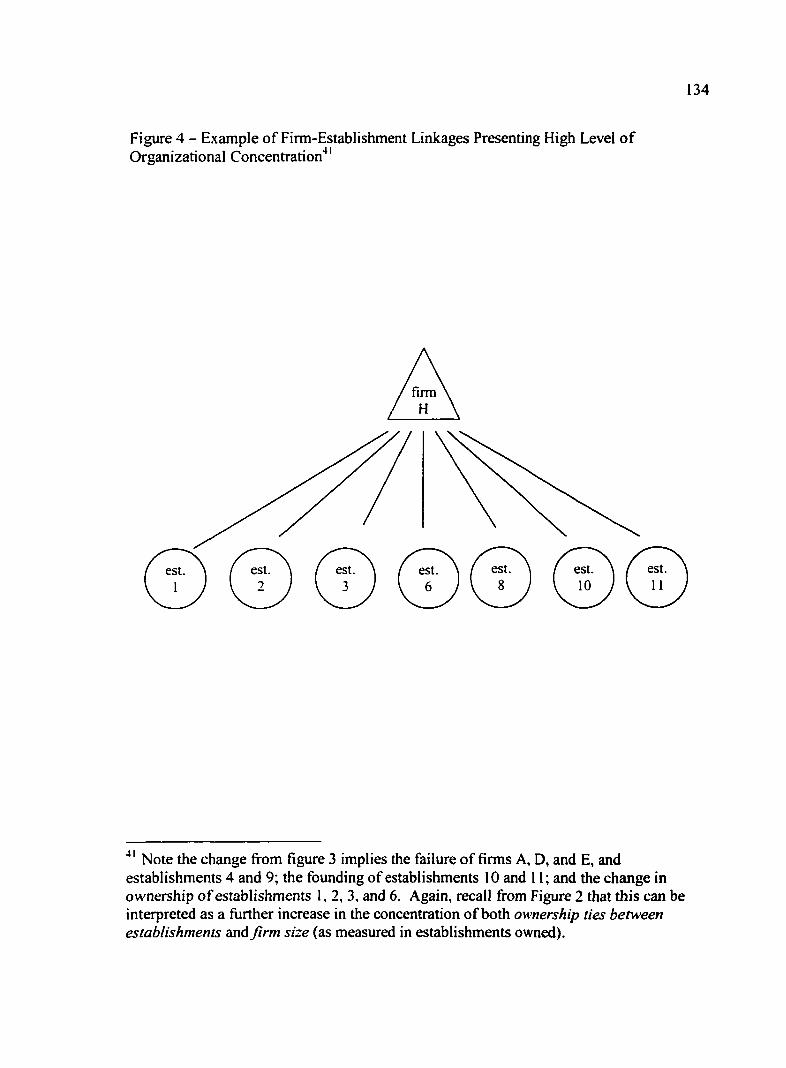
Figure 4 - Example of Firm-Establishment Linkages Presenting High Level of Organizational Concentration""
134
•*' Note the change from figure 3 implies the failure of firms A, D, and E, and establishments 4 and 9; the founding of establishments 10 and 11; and the change in ownership of establishments 1, 2, 3, and 6. Again, recall from Figure 2 that this can be interpreted as a further increase in the concentration of both ownership ties between establishments and firm size (as measured in establishments owned).
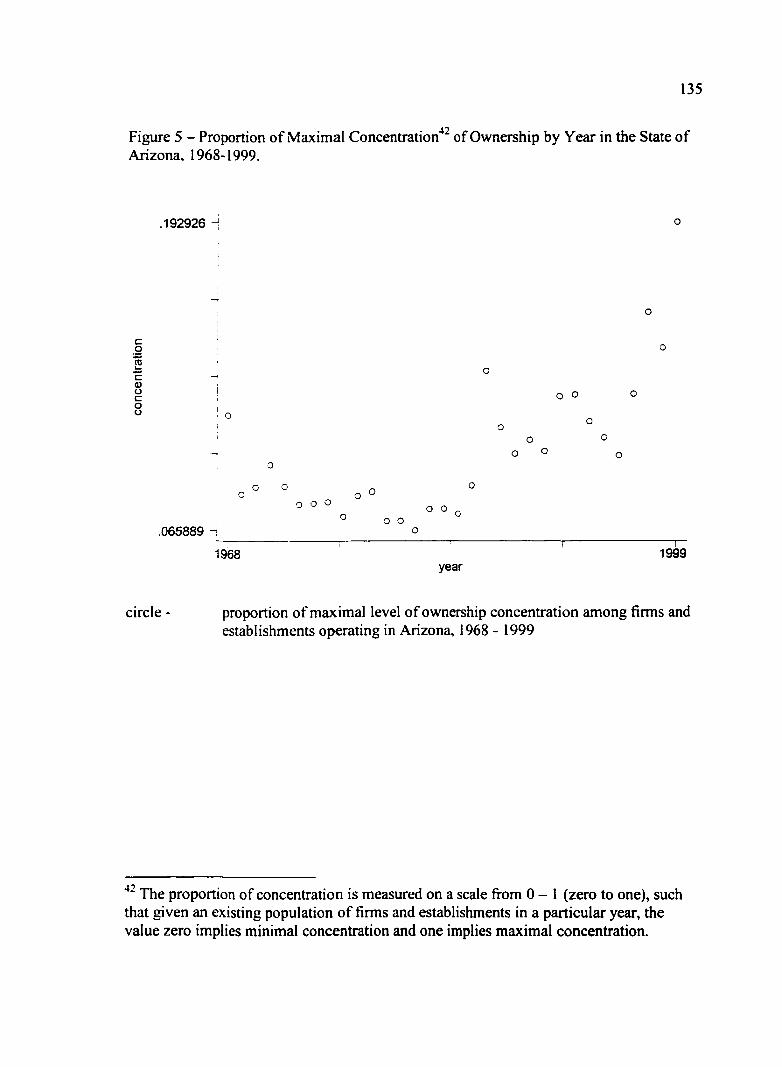
135
Figure 5 - Proportion of Maximal Concentration^^ of Ownership by Year in the State of Arizona, 1968-1999.
.192926
o
c g TO o c ^ 0) c ; o O O
! o c - O O o
; o
l o o „ o o o °
o o o o o o
o o 0
.065889 H o ; ^ , J—
1968 1999 year
circle - proportion of maximal level of ownership concentration among firms and establishments operating in Arizona, 1968 - 1999
The proportion of concentration is measured on a scale fi'om 0 - I (zero to one), such that given an existing population of firms and establishments in a particular year, the value zero implies minimal concentration and one implies maximal concentration.
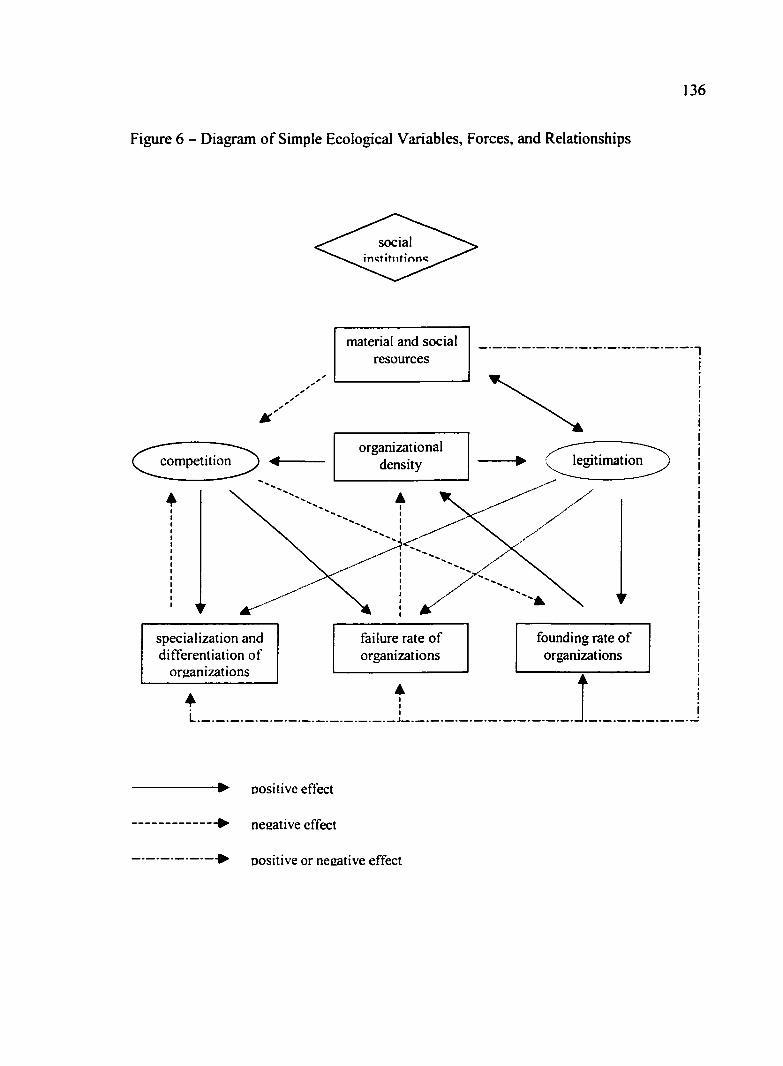
136
Figure 6 - Diagram of Simple Ecological Variables, Forces, and Relationships
social
material and social
resources
organizational
density legitimation
specialization and
differentiation of
organizations
i
failure rate of founding rate of
organizations organizations
A i i
1
>
>
>
positive effect
neaative effect
positive or necative effect

137
Figure 7- Diagram of Variables and Forces Analyzed in Chapters 5-7^^
social
material and social
resources
rate of change of
ownership
1
failure rate of
organizations
"• Dositive effect
organizational
concentration
"• negative effect
Dositive or negative effect
orgamzational
form
organizational
ion^ density competition
uncertainty
founding rate of
organizations
I
Features in bold provide novel additions to this tradition of research.
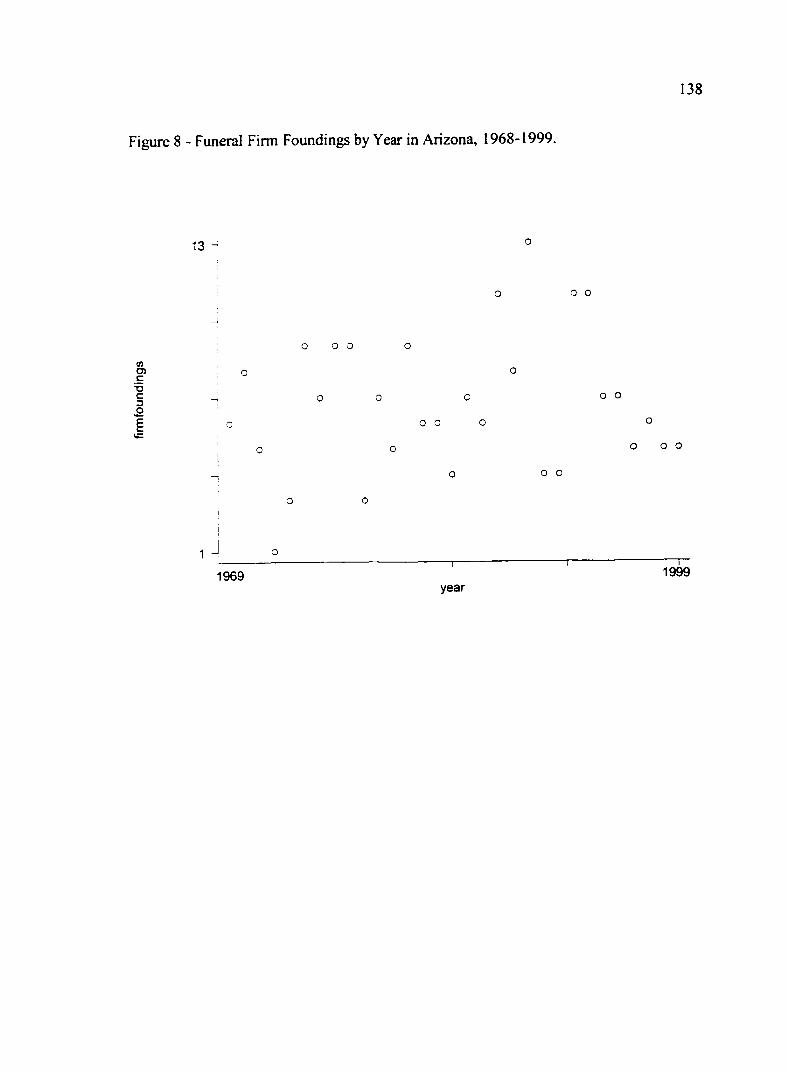
138
Figure 8 - Funeral Firm Foundings by Year in Arizona, 1968-1999.
1 3 -
o o
O CO 0) O) c
'•V c D o
-1
0 0 c
0 0 o
o
o
o
o o
o
o o o
o o
I
1 - Q
1969 year

139
Figure 9 - Funeral Firm Failures by Year in Arizona, 1968-1999.
1 3 i o o
o
o o
03 0)
E
o o
o o o o o
O 0
1968 1998 year

140
Figure 10 - Funeral Establishment Foundings by Year in Arizona, 1968-1999.
8 -i °
o
0) o> c
TS c 3 £ C O E
o o
o o o o o o
TO US 0} o o
o o
1
1969 1999 year
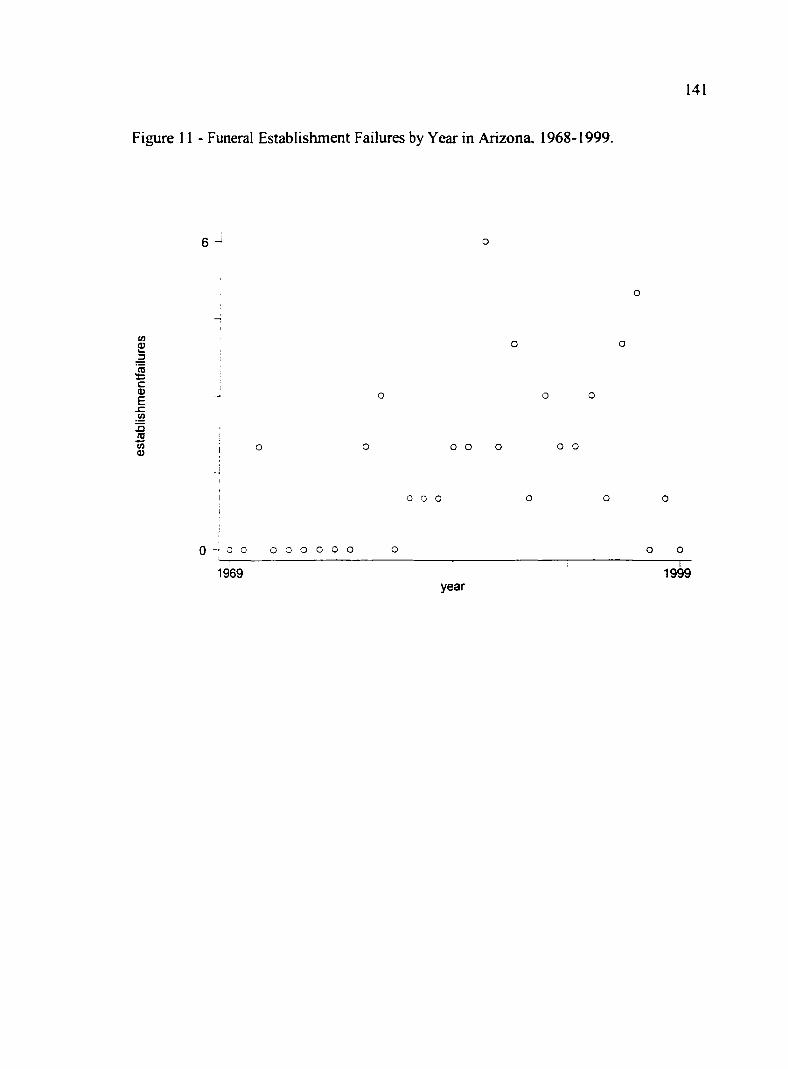
141
Figure 11 - Funeral Establishment Failures by Year in Arizona, 1968-1999.
6
CO
£
S C 0) E
o o
iS lo 0) o o o o o
o o o
0 0 o o o o o o o o o
1969 year
1999

142
Figure 12 - Funeral Establishment Ownership Changes by Year in Arizona, 1968-1999.
1 7
o o
5 o 0) O) c CD
O
o o
o o
o o o o
o o
o o
o o
0 o
1969 1999 year

143
Table I - Variable Descriptions, Sources, and Summary Statistics
Variable Name Variable Type Abbreviation
Description Construction and Source
Establishments
ratio
"ests" or "est'ments"
The number of fiineral home establishments operating in a given year, measured at the end of the year.
Obtained from official records at the Arizona State Board of Funeral Directors and Embalmers.
Firms
ratio
"firms"
The number of firms owning at least one funeral home establishment in a given year, measured at the end of the year.
Obtained fi^om official records at the Arizona State Board of Funeral Directors and Embalmers.
Deaths
ratio
"deaths"
The number of human deaths having occurred by the end of a given year.
Obtained fi-om official records of Arizona State Office of Vital Statistics.
Period 1
dichotomous
"pi"
The period after the arrival of national chain firms into the state, prior to the passage of the Funeral Rule (1977-1983).
Obtained by identifying the first year of operation of national chain firms - based on official records from the Arizona State Board of Funeral Directors and Embalmers.
Period 2
dichotomous
"p2"
The period after the arrival of national chain firms into the state, prior to the passage of the Funeral Rule (1977-1983).
Obtained via records of the passage of FTC Funeral Rule.

144
Table 1 - continued
Variable Name Variable Type Abbreviation
Description Construction and Source
Concentration, standardized by establishments
ratio
"CI"
The concentration of ownership ties linking any given set of establishments: this is the proportion of maximal concentration of linkages between establishments, where having a common owner links establishments.
Obtained fi-om official records at the Arizona State Board of Funeral Directors and Embalmers identifying firm-establishment ownership ties; and the use of mathematical formula fi-om chapter 4.
Concentration, standardized by firms and establishments
ratio
The concentration of the size distribution of firms for any given set of firms and establishments: this is the proportion of maximal inequality in the size distribution, where firm size is measure in establishments owned.
Obtained fi"om official records at the Arizona State Board of Funeral Directors and Embalmers identifying firm-establishment ownership ties; and the use of mathematical formula from chapter 4.
Firm Foundings
ratio
"f-founds"
The number of firms starting operation in a given year.
The count of firms for which no prior licensing record existed.
Firm Failures
ratio
"f-fails"
The number of firms tor which a given year is their last year of operation.
The count of firms that both failed to renew all of their licenses from the previous year and did not obtain any new licenses.
Lag Firm Foundings
ratio
"Lf-founds"
The number of firms starting operation in the prior year.
Obtained via manipulation of the variable "Firm Foundings."
Lag Firm Failures
ratio
"Lf-fails"
The number of firms ceasing operation in the prior year.
Obtained via manipulation of the variable "Firm Failures."
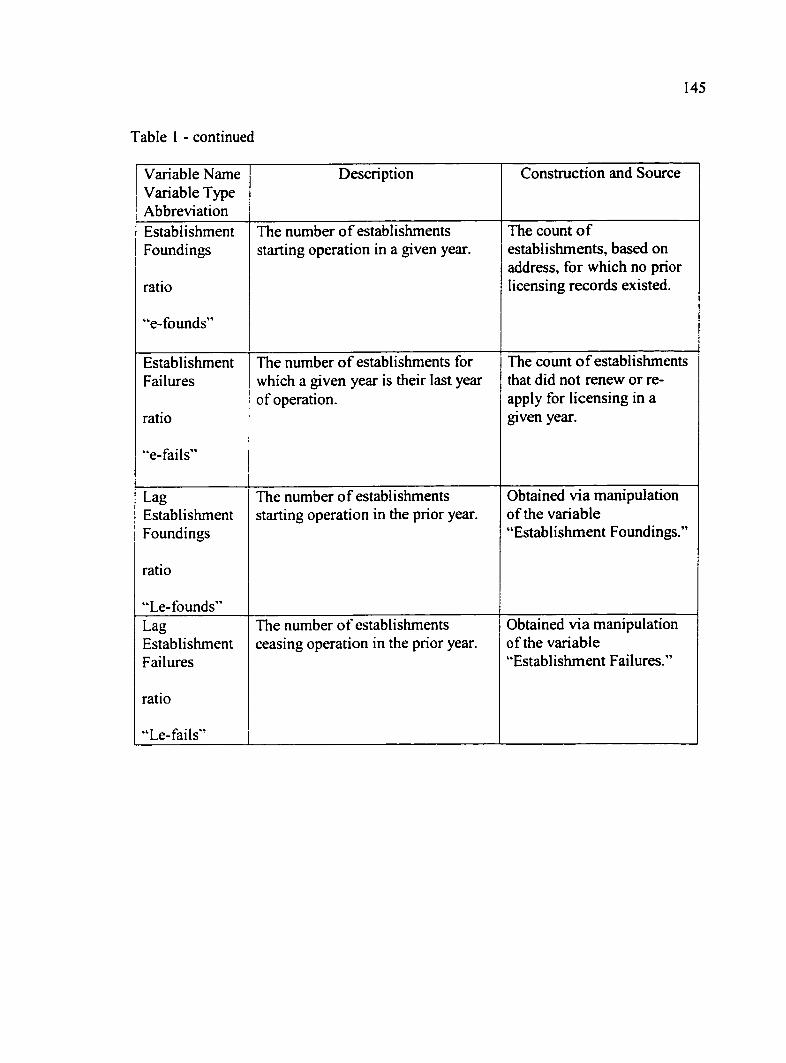
145
Table 1 - continued
Variable Name Variable Type Abbreviation
Description Construction and Source
Establishment Foundings
ratio
"e-founds"
The number of establishments starting operation in a given year.
The count of establishments, based on address, for which no prior licensing records existed.
Establishment Failures
ratio
"e-fails"
The number of establishments for which a given year is their last year of operation.
The count of establishments that did not renew or reapply for licensing in a given year.
Lag Establishment Foundings
ratio
"Le-founds"
The number of establishments starting operation in the prior year.
Obtained via manipulation of the variable "Establishment Foundings."
Lag Establishment Failures
ratio
"Le-fails"
The number of establishments ceasing operation in the prior year.
Obtained via manipulation of the variable "Establishment Failures."

146
Table 1 - continued
Variable Name Variable Type Abbreviation
Description Construction and Source
Changes in Ownership of Establishments
ratio
"e-change"
The number of establishments that change ownership in a given year.
Obtained from official records at the Arizona State Board of Funeral Directors and Embalmers.
Lag Changes in Ownership of Establishments
ratio
"Le-change"
The number of establishments that change ownership in the prior year.
Obtained via manipulation of the variable "Establishment Foundings."

147
Table 2 - Interaction Variables and Coefficient Descriptions
Variable Name Description and Interpretation
Deaths * Period I
The change in effect of Deaths on the dependent variable during Period 1 (1977-1983).
Establishments * Period 1
The change in effect of Establishments on the dependent variable during Period 1 (1977-1983).
Firms * Period 1
The change in effect of Firms on the dependent variable during Period 1 (1977-1983).
Concentration I * Period 1
The change in effect of Concentration I on the dependent variable during Period 1 (1977-1983).
Concentration2 * Period 1
The change in effect of Concentration 2 on the dependent variable during Period 1 (1977-1983).
Deaths * Period 2
The change in effect of deaths on the dependent variable during Period 2 (1984-1999).
Establishments * Period 2
The change in effect of Establishments on the dependent variable during Period 2 (1984-1999).
Firms * Period 2
The change in effect of Firms on the dependent variable during Period 2 (1984-1999).
Concentration I * Period 2
TTie change in effect of Concentration I on the dependent variable during Period 2 (1984-1999).
Concentration2 * Period 2
The change in effect of Concentration 2 on the dependent variable during Period 2 (1984-1999).

148
Table 2 - continued
Variable Name
Abbreviation
Description and Interpretation
Deaths * Concentration 1
The change in effect of Deaths on the dependent variable for a unit increase in Concentration 1 OR the change in effect of Concentration for a unit increase in Deaths.
Deaths * Concentration2
The change in effect of Deaths on the dependent variable for a unit increase in Concentration 2 OR the change in effect of Concentration for a unit increase in Deaths.
Deaths * Firms
The change in effect of Deaths on the dependent variable for a unit increase in Firms OR the change in effect of Firms for a unit increase in Deaths.
Deaths * Establishments
The change in effect of Deaths on the dependent variable for a unit increase in Establishments OR the change in effect of Establishments for a unit increase in Deaths.
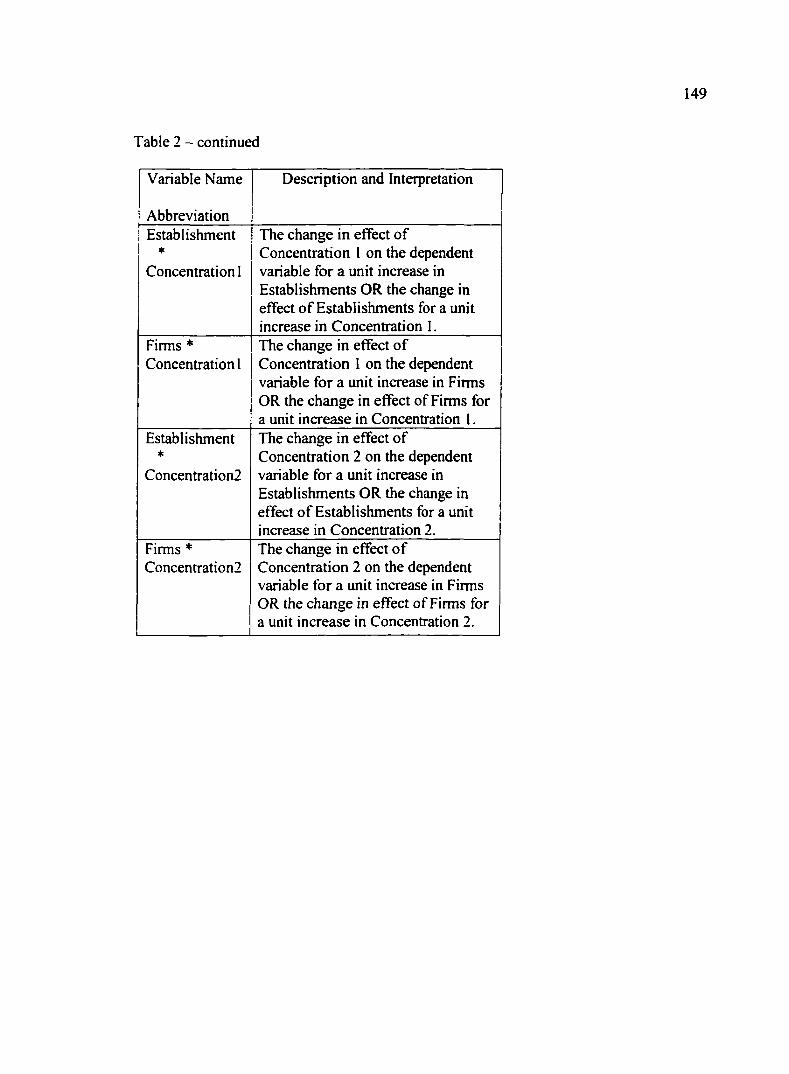
149
Table 2 - continued
Variable Name
Abbreviation
Description and Interpretation
Establishment *
Concentration 1
The change in effect of Concentration 1 on the dependent variable for a unit increase in Establishments OR the change in effect of Establishments for a unit increase in Concentration 1.
Firms * Concentration 1
The change in effect of Concentration 1 on the dependent variable for a unit increase in Firms OR the change in effect of Firms for a unit increase in Concentration 1.
Establishment *
Concentration2
The change in effect of Concentration 2 on the dependent variable for a unit increase in Establishments OR the change in effect of Establishments for a unit increase in Concentration 2.
Firms * Concentration!
The change in effect of Concentration 2 on the dependent variable for a unit increase in Firms OR the change in effect of Firms for a unit increase in Concentration 2.

150
Table 3 - State Level Summary Statistics and Pearson Correlations
Variable Mean Std. Dev. Min Max
ests 119.2 15.8732 85 143 e-founds 3.5 1.717054 1 8 e-fails 1.6 1.631585 0 6 e-change 6.5 3.794279 1 17 firms 91.43333 8.198752 72 103 f-tbunds 6.733333 2.72831 1 13 f-fails 6.7 3.495317 1 13 deaths 24384.33 7432.2 13959 38395 CI .0089812 .0081853 .0034479 .0346269 C2 .0943838 .0233553 .0658889 .1558813 period 1 .7333333 .4497764 0 1 period2 .5 .5085476 0 1
ests e-found e-fails e-chang firms f-found f-fails
ests 1.0000 efounds 0.2872 1.0000 efails 0.4799 -0.0246 1.0000 echange 0.5565 0.0609 0.3064 1.0000 firms 0.4985 0.2413 0.2892 -0.0183 1.0000 ffounds 0.2091 0.5889 -0.0015 0.3831 0.3013 1.0000 f-fails 0.6518 0.0316 0.3047 0.4355 0.3548 0.1613 1.0000 deaths 0.9375 0.2075 0.4741 0.6214 0.2122 0.1484 0.6395 CI 0.6822 0.0790 0.2173 0.6187 -0.2698 -0.0354 0.4004 C2 0.6245 0.0143 0.3746 0.6146 -0.1694 0.0667 0.4859 period 1 0.8385 0.1339 0.5075 0.4243 0.6870 0.1649 0.4738 period2 0.8159 0.0987 0.5818 0.5987 0.2936 0.1988 0.7275
deaths CI C2 period 1 period2
deaths 1.0000 CI 0.8287 1.0000 C2 0.7755 0.8545 1.0000 period 1 0.6874 0.3695 0.3625 1.0000 period2 0.8541 0.6138 0.7384 0.6030 1.0000

151
Table 4 - County Level Summary Statistics and Pearson Correlations
Variable Mean Std. Dev. Min Max
ests 13.96535 16.42483 0 68 e-founds .3910891 .7265538 0 4 e-fails .1534653 .4127482 0 3 e-change .8069307 1.478655 0 10 firms 10.47525 11.98099 0 45 f-founds .8168317 1.180738 0 5 f-fails .7821782 1.289868 0 8 deaths 3197.733 4815.561 278 21041 CI .1358463 .2167145 .0068028 1 C2 .3169271 .132104 0 .5714288 period I .8118812 .391778 0 1 period2 .6188119 .4868853 0 1
ests e-found e-fail echange firms f-found f-fails
ests 1.0000 efounds 0.6628 1.0000 e-fails 0.3296 0.2136 1.0000 echange 0.6966 0.5337 0.2852 1.0000 firms 0.9806 0.6524 0.3031 0.6261 1.0000 ffounds 0.7411 0.7393 0.2315 0.7633 0.7489 1.0000 f-fails 0.6905 0.5267 0.4369 0.9273 0.6342 0.7707 1.0000 deaths 0.9808 0.6337 0.3525 0.6997 0.9408 0.7106 0.6967 CI -0.3058 -0.1878 -0.0157 -0.1799 -0.337 -0.2544 -0.1761 C2 -0.3659 -0.2662 -0.1838 -0.2060 -0.358 -0.2518 -0.2308 period 1 -0.0087 -0.0024 0.1794 0.0916 -0.032 0.0327 0.1351 period2 -0.0334 -0.0547 0.1440 0.1184 -0.081 -0.0009 0.1444
deaths CI C2 period 1 period2
deaths 1.0000 CI -0.2696 1.0000 C2 -0.3899 -0.4829 1.0000 period 1 0.0418 0.1084 0.0117 1.0000 period2 0.0424 0.1691 -0.0379 0.6133 1.0000
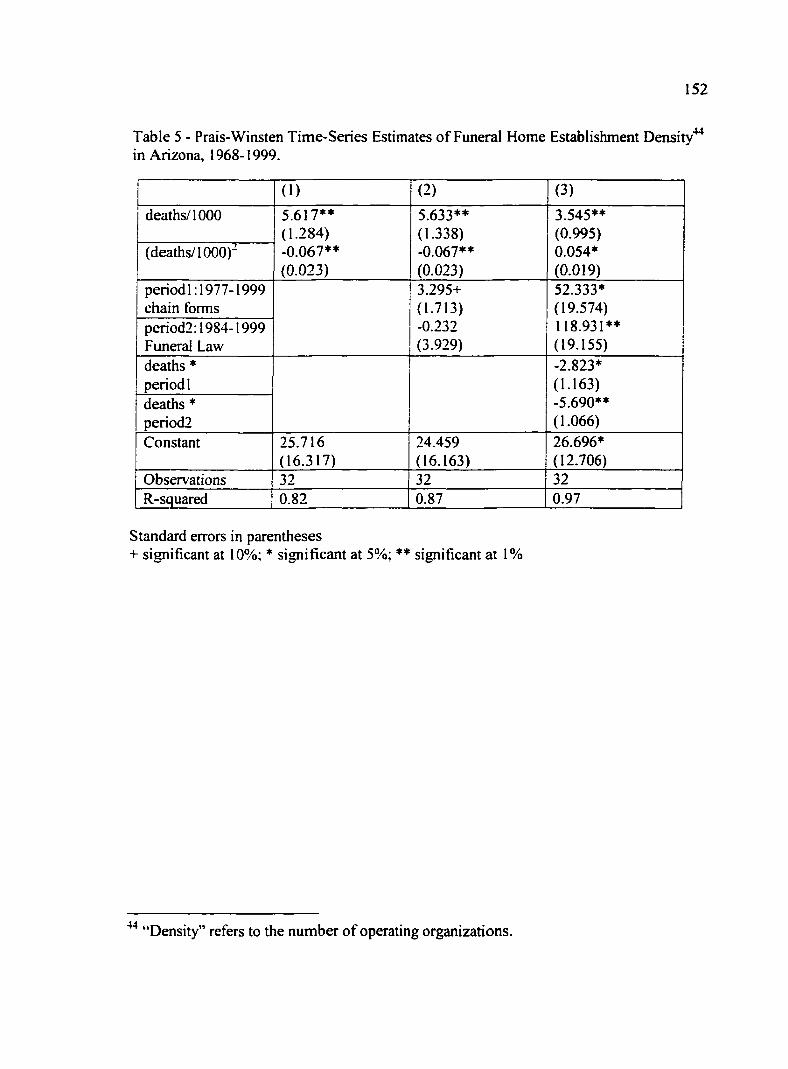
152
Table 5 - Prais-Winsten Time-Series Estimates of Funeral Home Establishment Density"" in Arizona, 1968-1999.
(1) (2) (3)
deaths/1000 5.617»* 5.633** 3.545** (1.284) (1.338) (0.995)
(deaths/1000)- -0.067** -0.067** 0.054* (0.023) (0.023) (0.019)
periodl: 1977-1999 3.295+ 52.333* chain forms (1.713) (19.574) period2:1984-1999 -0.232 118.931** Funeral Law (3.929) (19.155) deaths * -2.823* period I (1.163) deaths * -5.690** period2 (1.066)
Constant 25.716 24.459 26.696* (16.317) (16.163) (12.706)
Observations 32 32 32 R-squared 0.82 0.87 0.97
Standard errors in parentheses + significant at 10%; * significant at 5%; ** significant at 1%
^ "Density" refers to the number of operating organizations.
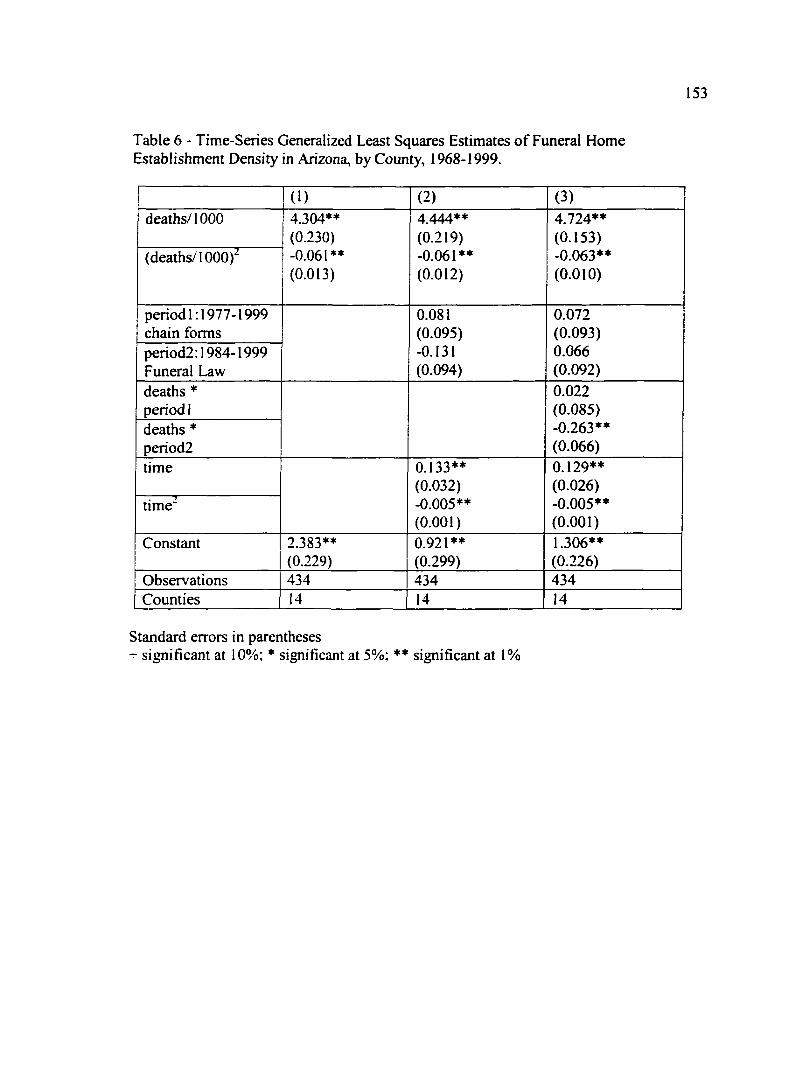
153
Table 6 - Time-Series Generalized Least Squares Estimates of Funeral Home Establishment Density in Arizona, by County, 1968-1999.
(1) (2) (3)
deaths/1000 4.304** 4.444** 4.724»» (0.230) (0.219) (0.153)
(deaths/1000)" -0.061** -0.061** -0.063** (0.013) (0.012) (0.010)
periodl:1977-I999 0.081 0.072 chain forms (0.095) (0.093) period2:1984-1999 -0.131 0.066 Funeral Law (0.094) (0.092)
deaths * 0.022 period 1 (0.085) deaths * -0.263** period2 (0.066)
time 0.133** 0.129** (0.032) (0.026)
time" -0.005** -0.005** (0.001) (0.001)
Constant 2.383** 0.921** 1.306** (0.229) (0.299) (0.226)
Observations 434 434 434 Counties 14 14 14
Standard errors in parentheses + significant at 10%; * significant at 5%; ** significant at 1%

154
Table 7 - Prais-Winsten Time-Series Estimates of Funeral Home Firm Density"*^ in Arizona, 1968-1999.
(1) (2) (3)
deaths/1000 7.825»* 7.960** 7.620»* (0.914) (0.977) (1.557)
(deaths/1000)~ -0.146** -0.147** -0.111* (0.017) (0.016) (0.042)
periodi .1977-1999 2.028 24.628 chain forms (2.045) (23.182) period2:1984-1999 -1.108 37.243 Funeral Law (4.673) (35.917)
deaths * -1.306 period 1 (1.373) deaths * -1.925 period2 (1.711) Constant -4.981 -7 All -10.877
(11.008) (11.346) (16.169) Observations 32 32 32 R-squared 0.79 0.80 0.81
Standard errors in parentheses + significant at 10%: * significant at 5%; ** significant at 1%
"Density" refers to the number of operating organizations.

155
Table 8 - Time-Series Generalized Least Squares Estimates of Funeral Home Firm Density in Arizona, by County, 1968-1999.
(1) (2) (3)
deaths/1000 2.400»* 3.076** 3.772** (0.255) (0.285) (0.278)
(deaths/1000)" -0.087** -0.088** -0.102** (0.014) (0.014) (0.013)
periodl: 1977-1999 0.051 0.016 chain forms (0.111) (0.121) period2:1984-1999 -0.083 -0.013 Funeral Law (0.109) (0.119) deaths * 0.060 period 1 (0.117) deaths * -0.115 period2 (0.089)
time 0.141** 0.106** (0.036) (0.033)
time" -0.005** -0.005** (0.001) (0.001)
Constant 2.304** 1.339** 1.628** (0.147) (0.328) (0.282)
Observations 434 434 434 Counties 14 14 14
Standard errors in parentheses -r significant at 10%; * significant at 5%; ** significant at 1%

156
Table 9 - Prais-Winsten"*^ Time-Series Estimates of the Firm-based Concentration of Ownership"*^ in Arizona, 1968-1999.
(1) (2) (3)
firms/100 -0.161»* (0.041) 0.003** (0.001)
-0.212** (0.048) 0.001 (0.001)
-0.035 (0.329) -0.001 (0.014)
deaths/1000
-0.161»* (0.041) 0.003** (0.001)
-0.212** (0.048) 0.001 (0.001)
-0.035 (0.329) -0.001 (0.014)
periodl: 1977-1999 chain forms
0.017+ (0.009) 0.021 + (0.010)
-0.177 (0.173) 0.312 (0.301)
period2:1984-1999 Funeral Law
0.017+ (0.009) 0.021 + (0.010)
-0.177 (0.173) 0.312 (0.301)
deaths * periodI
-0.000 (0.007) 0.004 (0.002) 0.206 (0.148) -0.371 (0.285) -0.003 (0.018)
deaths * period2
-0.000 (0.007) 0.004 (0.002) 0.206 (0.148) -0.371 (0.285) -0.003 (0.018)
firms * period 1
-0.000 (0.007) 0.004 (0.002) 0.206 (0.148) -0.371 (0.285) -0.003 (0.018)
firms * period2
-0.000 (0.007) 0.004 (0.002) 0.206 (0.148) -0.371 (0.285) -0.003 (0.018)
firms * deaths
-0.000 (0.007) 0.004 (0.002) 0.206 (0.148) -0.371 (0.285) -0.003 (0.018)
Constant 0.171** (0.034)
0.237** (0.045)
0.165 (0.241)
Observations 32 32 32 R-squared 0.70 0.79 0.82
Standard errors in parentheses + significant at 10%; * significant at 5%; ** significant at 1%
Note that other time-series techniques were considered: attempts at Chocrane-Orcutt (1949) estimation and step-wise processes (Hildreth and Lu 1960) do not converge and may be inappropriate with small samples (StataCorp 2001).
This measure is analogous to the concentration of the size distribution of firms (measured in establishments owned) and is standardized by number of firms and establishments in operation - higher scores mean that firm sizes are more unequally distributed.
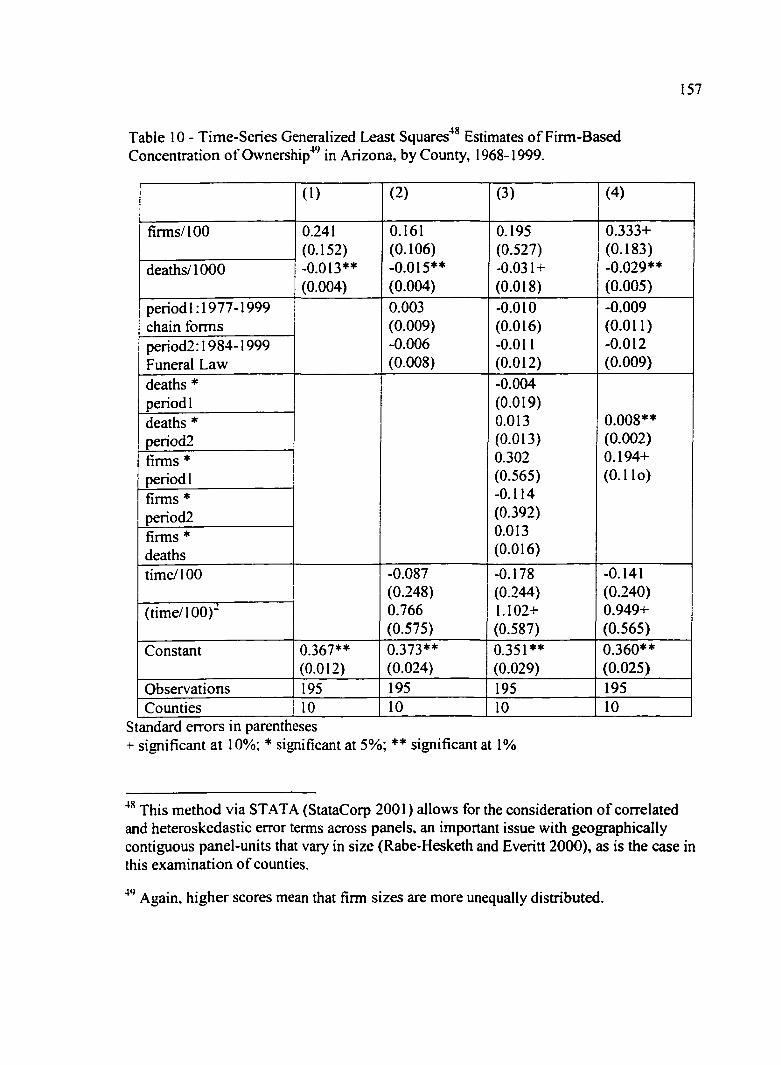
157
. f Q Table 10 - Time-Series Generalized Least Squares Estimates of Firm-Based Concentration of Ownership"**^ in Arizona, by County, 1968-1999.
(I) (2) (3) (4)
firms/100 0.241 (0.152) -0.013** (0.004)
0.161 (0.106) -0.015** (0.004)
0.195 (0.527) -0.031 + (0.018)
0.333+ (0.183) -0.029** (0.005)
deaths/1000
0.241 (0.152) -0.013** (0.004)
0.161 (0.106) -0.015** (0.004)
0.195 (0.527) -0.031 + (0.018)
0.333+ (0.183) -0.029** (0.005)
period 1:1977-1999 chain forms
0.003 (0.009) -0.006 (0.008)
-0.010 (0.016) -0.011 (0.012)
-0.009 (0.011) -0.012 (0.009)
period2:1984-1999 Funeral Law
0.003 (0.009) -0.006 (0.008)
-0.010 (0.016) -0.011 (0.012)
-0.009 (0.011) -0.012 (0.009)
deaths * period 1
-0.004 (0.019) 0.013 (0.013) 0.302 (0.565) -0.114 (0.392) 0.013 (0.016)
0.008** (0.002) 0.194+ (0.1 lo)
deaths * period2
-0.004 (0.019) 0.013 (0.013) 0.302 (0.565) -0.114 (0.392) 0.013 (0.016)
0.008** (0.002) 0.194+ (0.1 lo)
firms * period 1
-0.004 (0.019) 0.013 (0.013) 0.302 (0.565) -0.114 (0.392) 0.013 (0.016)
0.008** (0.002) 0.194+ (0.1 lo)
firms * period2
-0.004 (0.019) 0.013 (0.013) 0.302 (0.565) -0.114 (0.392) 0.013 (0.016)
0.008** (0.002) 0.194+ (0.1 lo)
firms * deaths
-0.004 (0.019) 0.013 (0.013) 0.302 (0.565) -0.114 (0.392) 0.013 (0.016)
0.008** (0.002) 0.194+ (0.1 lo)
time/100 -0.087 (0.248) 0.766 (0.575)
-0.178 (0.244) 1.102+ (0.587)
-0.141 (0.240) 0.949+ (0.565)
(time/100)"
-0.087 (0.248) 0.766 (0.575)
-0.178 (0.244) 1.102+ (0.587)
-0.141 (0.240) 0.949+ (0.565)
Constant 0.367** (0.012)
0.373** (0.024)
0.351** (0.029)
0.360** (0.025)
Observations 195 195 195 195 Counties 10 10 10 10
Standard errors in parentheses + significant at 10%; * significant at 5%; ** significant at 1%
This method via STATA (StataCorp 2001) allows for the consideration of correlated and heteroskedastic error terms across panels, an important issue with geographically contiguous panel-units that vary in size (Rabe-Hesketh and Everitt 2000), as is the case in this examination of counties.
Again, higher scores mean that firm sizes are more unequally distributed.
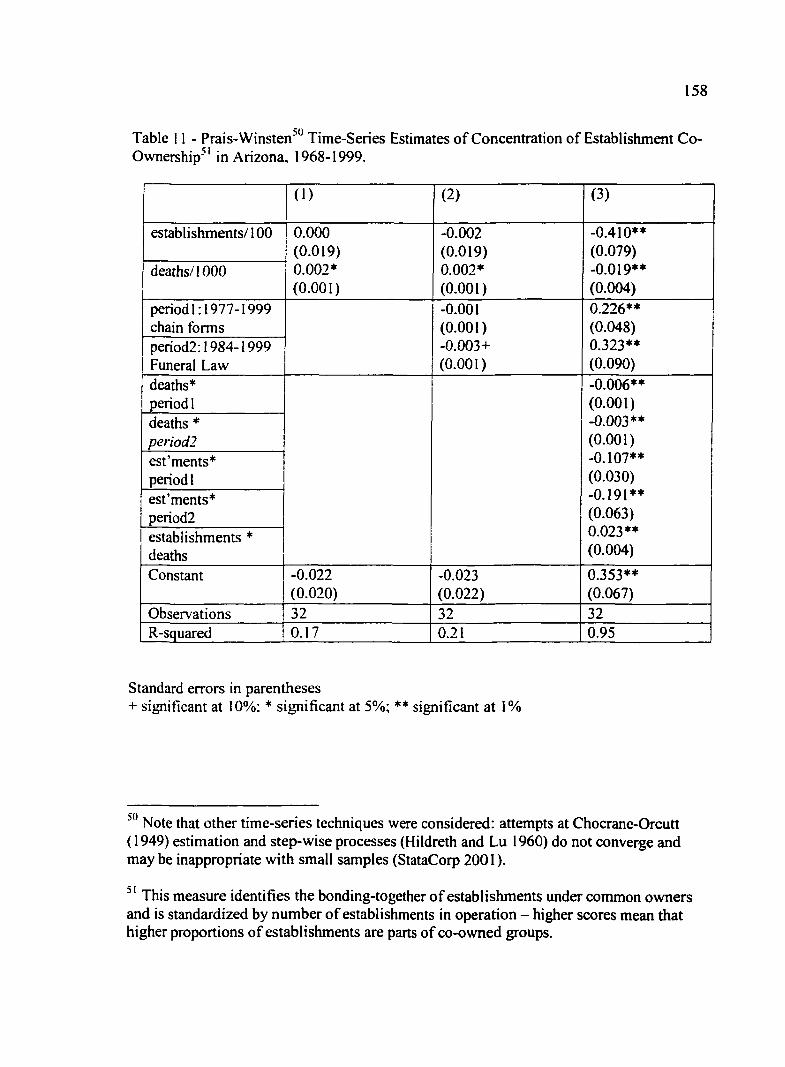
158
Table 11 - Prais-Winsten^" Time-Series Estimates of Concentration of Establishment Co-Ownership'^' in Arizona, 1968-1999.
(1) (2) (3)
establishments/100 0.000 (0.019) 0.002* (0.001)
-0.002 (0.019) 0.002* (0.001)
-0.410** (0.079) -0.019** (0.004)
deaths/1000
0.000 (0.019) 0.002* (0.001)
-0.002 (0.019) 0.002* (0.001)
-0.410** (0.079) -0.019** (0.004)
periodl: 1977-1999 chain forms
-0.001 (0.001) -0.003+ (0.001)
0.226** (0.048) 0.323** (0.090)
period2:I984-1999 Funeral Law
-0.001 (0.001) -0.003+ (0.001)
0.226** (0.048) 0.323** (0.090)
deaths* periodl
-0.006** (0.001) -0.003** (0.001) -0.107** (0.030) -0.191** (0.063) 0.023** (0.004)
deaths * period!
-0.006** (0.001) -0.003** (0.001) -0.107** (0.030) -0.191** (0.063) 0.023** (0.004)
est'ments* periodl
-0.006** (0.001) -0.003** (0.001) -0.107** (0.030) -0.191** (0.063) 0.023** (0.004)
est'ments* period2
-0.006** (0.001) -0.003** (0.001) -0.107** (0.030) -0.191** (0.063) 0.023** (0.004)
establishments * deaths
-0.006** (0.001) -0.003** (0.001) -0.107** (0.030) -0.191** (0.063) 0.023** (0.004)
Constant -0.022 (0.020)
-0.023 (0.022)
0.353** (0.067)
Observations 32 32 32 R-squared 0.17 0.21 0.95
Standard errors in parentheses + significant at 10%; * significant at 5%; ** significant at 1%
Note that other time-series techniques were considered: attempts at Chocrane-Orcutt (1949) estimation and step-wise processes (Hildreth and Lu 1960) do not converge and maybe inappropriate with small samples (StataCorp 2001).
This measure identifies the bonding-together of establishments under common owners and is standardized by number of establishments in operation - higher scores mean that higher proportions of establishments are parts of co-owned groups.
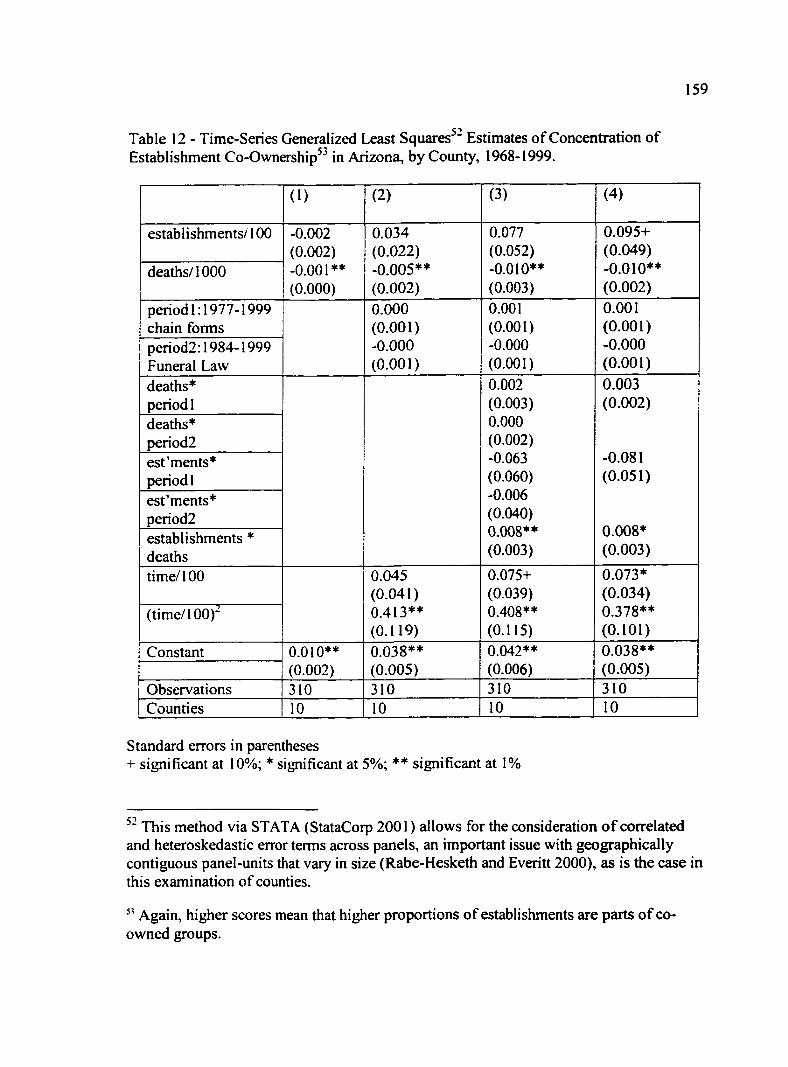
159
Table 12 - Time-Series Generalized Least Squares^" Estimates of Concentration of Establishment Co-Ownership^^ in Arizona, by County, 1968-1999.
(1) (2) (3) (4)
establishments/100 -0.002 (0.002) -0.001** (0.000)
0.034 (0.022) -0.005** (0.002)
0.077 (0.052) -0.010** (0.003)
0.095+ (0.049) -0.010** (0.002)
deaths/1000
-0.002 (0.002) -0.001** (0.000)
0.034 (0.022) -0.005** (0.002)
0.077 (0.052) -0.010** (0.003)
0.095+ (0.049) -0.010** (0.002)
periodl: 1977-1999 chain forms
0.000 (0.001) -0.000 (0.001)
0.001 (0.001) -0.000 (0.001)
0.001 (0.001) -0.000 (0.001)
period2;1984-I999 Funeral Law
0.000 (0.001) -0.000 (0.001)
0.001 (0.001) -0.000 (0.001)
0.001 (0.001) -0.000 (0.001)
deaths* period 1
0.002 (0.003) 0.000 (0.002) -0.063 (0.060) -0.006 (0.040) 0.008** (0.003)
0.003 (0.002)
-0.081 (0.051)
0.008* (0.003)
deaths* period2
0.002 (0.003) 0.000 (0.002) -0.063 (0.060) -0.006 (0.040) 0.008** (0.003)
0.003 (0.002)
-0.081 (0.051)
0.008* (0.003)
est'ments* period1
0.002 (0.003) 0.000 (0.002) -0.063 (0.060) -0.006 (0.040) 0.008** (0.003)
0.003 (0.002)
-0.081 (0.051)
0.008* (0.003)
est'ments* period2
0.002 (0.003) 0.000 (0.002) -0.063 (0.060) -0.006 (0.040) 0.008** (0.003)
0.003 (0.002)
-0.081 (0.051)
0.008* (0.003)
establishments * deaths
0.002 (0.003) 0.000 (0.002) -0.063 (0.060) -0.006 (0.040) 0.008** (0.003)
0.003 (0.002)
-0.081 (0.051)
0.008* (0.003)
time/100 0.045 (0.041) 0.413** (0.119)
0.075+ (0.039) 0.408** (0.115)
0.073* (0.034) 0.378** (0.101)
(time/100)'
0.045 (0.041) 0.413** (0.119)
0.075+ (0.039) 0.408** (0.115)
0.073* (0.034) 0.378** (0.101)
Constant 0.010** (0.002)
0.038** (0.005)
0.042** (0.006)
0.038** (0.005)
0.010** (0.002)
0.038** (0.005)
0.042** (0.006)
0.038** (0.005)
Observations 310 310 310 310 Counties 10 10 10 10
Standard errors in parentheses + significant at 10%; * significant at 5%; ** significant at 1%
This method via STATA (StataCorp 2001) allows for the consideration of correlated and heteroskedastic error terms across panels, an important issue with geographically contiguous panel-units that vary in size (Rabe-Hesketh and Everitt 2000), as is the case in this examination of counties.
" Again, higher scores mean that higher proportions of establishments are parts of co-owned groups.
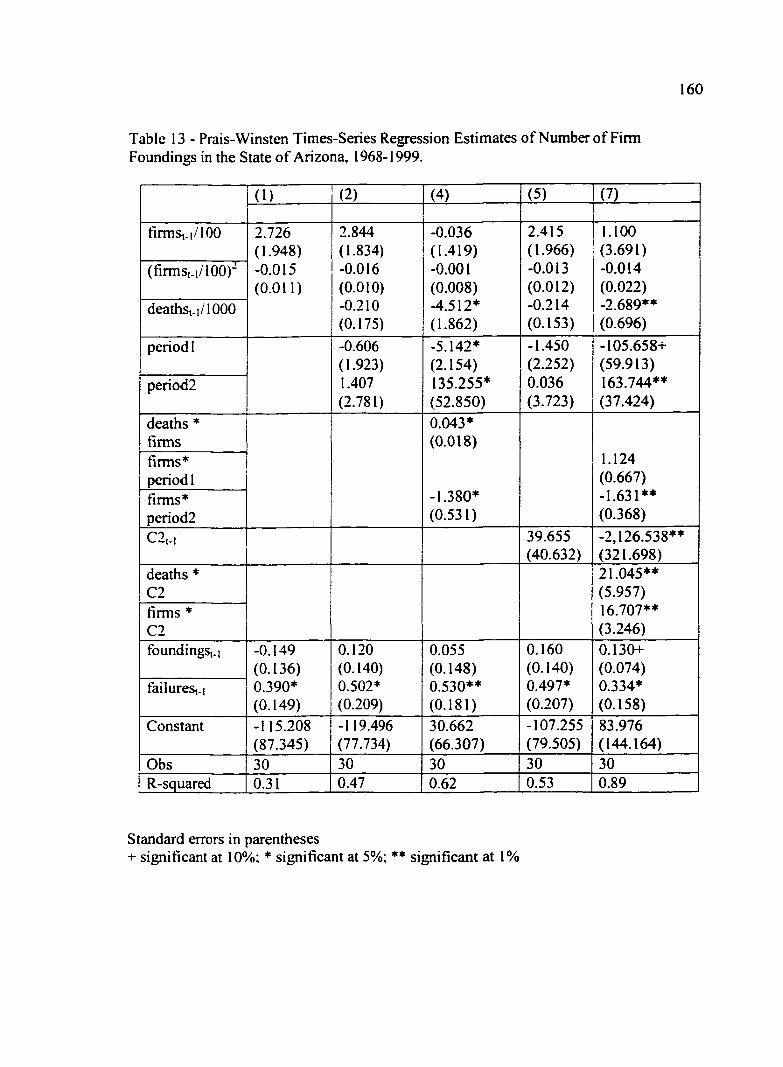
160
Table 13 - Prais-Winsten Times-Series Regression Estimates of Number of Firm Foundings in the State of Arizona, 1968-1999.
(1) (2) (4) (5) (7)
firms,.]/100 2.726 (1.948) -0.015 (0.011)
2.844 (1.834) -0.016 (0.010) -0.210 (0.175)
-0.036 (1.419) -0.001 (0.008) -4.512* (1.862)
2.415 (1.966) -0.013 (0.012) -0.214 (0.153)
1.100 (3.691) -0.014 (0.022) -2.689** (0.696)
(firmst.i/100)~
2.726 (1.948) -0.015 (0.011)
2.844 (1.834) -0.016 (0.010) -0.210 (0.175)
-0.036 (1.419) -0.001 (0.008) -4.512* (1.862)
2.415 (1.966) -0.013 (0.012) -0.214 (0.153)
1.100 (3.691) -0.014 (0.022) -2.689** (0.696)
deathst-|/1000
2.726 (1.948) -0.015 (0.011)
2.844 (1.834) -0.016 (0.010) -0.210 (0.175)
-0.036 (1.419) -0.001 (0.008) -4.512* (1.862)
2.415 (1.966) -0.013 (0.012) -0.214 (0.153)
1.100 (3.691) -0.014 (0.022) -2.689** (0.696)
period 1 -0.606 (1.923) 1.407 (2.781)
-5.142* (2.154) 135.255* (52.850)
-1.450 (2.252) 0.036 (3.723)
-105.658+ (59.913) 163.744** (37.424)
period2
-0.606 (1.923) 1.407 (2.781)
-5.142* (2.154) 135.255* (52.850)
-1.450 (2.252) 0.036 (3.723)
-105.658+ (59.913) 163.744** (37.424)
deaths * firms
0.043* (0.018)
-1.380* (0.531)
1.124 (0.667) -1.631** (0.368)
firms* period 1
0.043* (0.018)
-1.380* (0.531)
1.124 (0.667) -1.631** (0.368)
firms* period2
0.043* (0.018)
-1.380* (0.531)
1.124 (0.667) -1.631** (0.368)
C2.., 39.655 (40.632)
-2,126.538** (321.698)
deaths * C2
21.045** (5.957) 16.707** (3.246)
firms * C2
21.045** (5.957) 16.707** (3.246)
foundingSi-i -0.149 (0.136) 0.390* (0.149)
0.120 (0.140) 0.502* (0.209)
0.055 (0.148) 0.530** (0.181)
0.160 (0.140) 0.497* (0.207)
0.130+ (0.074) 0.334* (0.158)
failures,-!
-0.149 (0.136) 0.390* (0.149)
0.120 (0.140) 0.502* (0.209)
0.055 (0.148) 0.530** (0.181)
0.160 (0.140) 0.497* (0.207)
0.130+ (0.074) 0.334* (0.158)
Constant -115.208 (87.345)
-119.496 (77.734)
30.662 (66.307)
-107.255 (79.505)
83.976 (144.164)
Obs 30 30 30 30 30 R-squared 0.31 0.47 0.62 0.53 0.89
Standard errors in parentheses + significant at 10%: * significant at 5%; *• significant at 1%
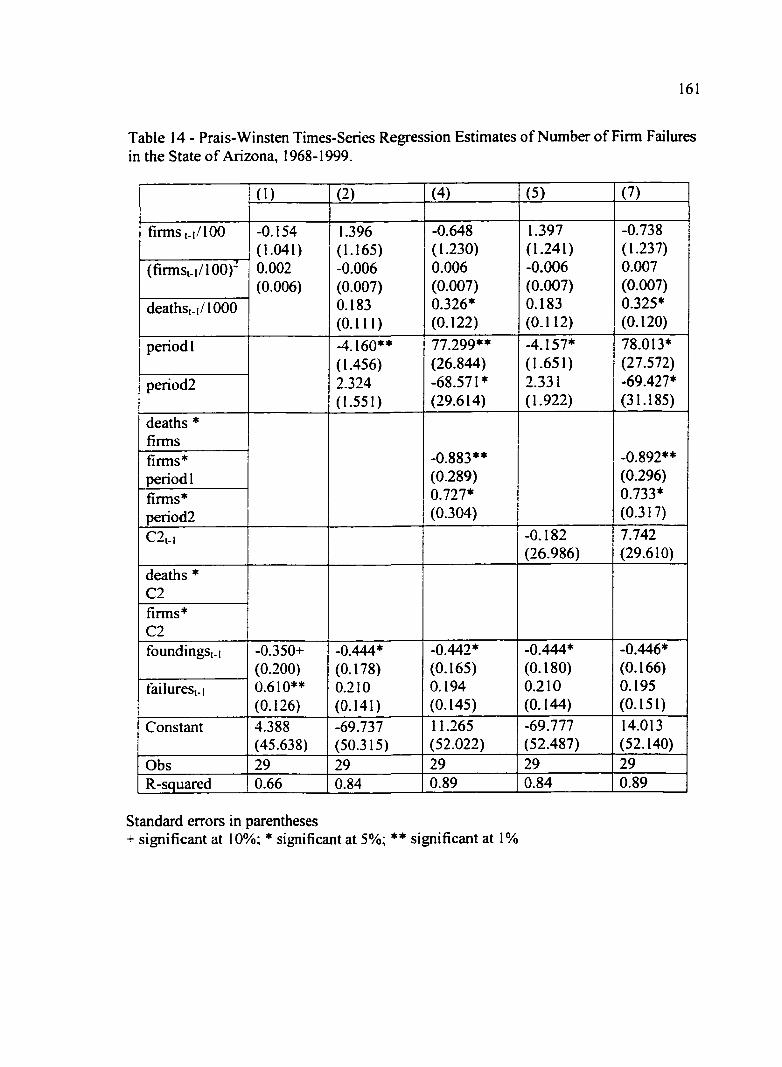
161
Table 14 - Prais-Winsten Times-Series Regression Estimates of Number of Firm Failures in the State of Arizona, 1968-1999.
(I) (2) (4) (5) (7)
firms t-i/100 -0.154 (1.041) 0.002 (0.006)
1.396 (1.165) -0.006 (0.007) 0.183 (0.111)
-0.648 (1.230) 0.006 (0.007) 0.326* (0.122)
1.397 (1.241) -0.006 (0.007) 0.183 (0.112)
-0.738 (1.237) 0.007 (0.007) 0.325* (0.120)
(firmSt-i/100)"
-0.154 (1.041) 0.002 (0.006)
1.396 (1.165) -0.006 (0.007) 0.183 (0.111)
-0.648 (1.230) 0.006 (0.007) 0.326* (0.122)
1.397 (1.241) -0.006 (0.007) 0.183 (0.112)
-0.738 (1.237) 0.007 (0.007) 0.325* (0.120)
deathst-i/IOOO
-0.154 (1.041) 0.002 (0.006)
1.396 (1.165) -0.006 (0.007) 0.183 (0.111)
-0.648 (1.230) 0.006 (0.007) 0.326* (0.122)
1.397 (1.241) -0.006 (0.007) 0.183 (0.112)
-0.738 (1.237) 0.007 (0.007) 0.325* (0.120)
period 1 -4.160** (1.456) 2.324 (1.551)
77.299** (26.844) -68.571* (29.614)
-4.157* (1.651) 2.331 (1.922)
78.013* (27.572) -69.427* (31.185)
period2
-4.160** (1.456) 2.324 (1.551)
77.299** (26.844) -68.571* (29.614)
-4.157* (1.651) 2.331 (1.922)
78.013* (27.572) -69.427* (31.185)
deaths * firms
-0.883** (0.289) 0.727* (0.304)
-0.892** (0.296) 0.733* (0.317)
firms* period 1
-0.883** (0.289) 0.727* (0.304)
-0.892** (0.296) 0.733* (0.317)
firms* period2
-0.883** (0.289) 0.727* (0.304)
-0.892** (0.296) 0.733* (0.317)
C2m -0.182 (26.986)
7.742 (29.610)
deaths * C2 firms* C2 foundingSt-i -0.350+
(0.200) 0.610** (0.126)
-0.444* (0.178) 0.210 (0.141)
-0.442* (0.165) 0.194 (0.145)
-0.444* (0.180) 0.210 (0.144)
-0.446* (0.166) 0.195 (0.151)
failures,-!
-0.350+ (0.200) 0.610** (0.126)
-0.444* (0.178) 0.210 (0.141)
-0.442* (0.165) 0.194 (0.145)
-0.444* (0.180) 0.210 (0.144)
-0.446* (0.166) 0.195 (0.151)
Constant 4.388 (45.638)
-69.737 (50.315)
11.265 (52.022)
-69.777 (52.487)
14.013 (52.140)
Obs 29 29 29 29 29 R-squared 0.66 0.84 0.89 0.84 0.89
Standard errors in parentheses + significant at 10%; * significant at 5%; ** significant at 1%

162
Table 15 - Negative Binomial Time-Series Cross-Sectional Generalized Estimating Equation Estimates of the Rate of Firm Founding by County in Arizona, 1968-1999.
(1) (2) (3) (4) (6)
firms t-i/100 13.334** (3.112) -16.754* (7.326)
15.734** (3.987) -17.345* (6.960) -0.056 (0.036)
19.975** (6.001) -35.033* (15.755) -0.187+ (0.106)
7.036* (3.053) -6.081 (4.642) 0.059 (0.053)
3.884 (3.833) -3.984 (6.118) 0.114 (0.081)
(firmsi.|/100)"
13.334** (3.112) -16.754* (7.326)
15.734** (3.987) -17.345* (6.960) -0.056 (0.036)
19.975** (6.001) -35.033* (15.755) -0.187+ (0.106)
7.036* (3.053) -6.081 (4.642) 0.059 (0.053)
3.884 (3.833) -3.984 (6.118) 0.114 (0.081)
deathst.|/1000
13.334** (3.112) -16.754* (7.326)
15.734** (3.987) -17.345* (6.960) -0.056 (0.036)
19.975** (6.001) -35.033* (15.755) -0.187+ (0.106)
7.036* (3.053) -6.081 (4.642) 0.059 (0.053)
3.884 (3.833) -3.984 (6.118) 0.114 (0.081)
period I -0.106 (0.432) 0.187 (0.341)
-0.476 (0.519) 0.272 (0.383)
-0.155 (0.509) -0.056 (0.397)
-0.508 (0.686) 0.356 (0.373)
period2
-0.106 (0.432) 0.187 (0.341)
-0.476 (0.519) 0.272 (0.383)
-0.155 (0.509) -0.056 (0.397)
-0.508 (0.686) 0.356 (0.373)
deaths * firms
0.393 (0.333) 3.420** (1.172) -0.867 (0.739)
2.451 + (1.366) -2.629** (0.793)
firms* period 1
0.393 (0.333) 3.420** (1.172) -0.867 (0.739)
2.451 + (1.366) -2.629** (0.793)
firms* period2
0.393 (0.333) 3.420** (1.172) -0.867 (0.739)
2.451 + (1.366) -2.629** (0.793)
C2M 2.564** (0.270)
2.895** (0.328)
deaths * C2 firms * C2 time/100 -1.093
(10.655) 5.113 (23.369)
0.078 (10.723) 3.096 (23.457)
1.412 (8.728) -4.929 (19.301)
0.302 (9.470) -3.674 (20.328)
(time/100)"
-1.093 (10.655) 5.113 (23.369)
0.078 (10.723) 3.096 (23.457)
1.412 (8.728) -4.929 (19.301)
0.302 (9.470) -3.674 (20.328)
foundings,. 1 0.009 (0.117) 0.041 (0.040)
-0.004 (0.120) 0.054 (0.062)
-0.029 (0.123) 0.049 (0.057)
0.028 (0.128) 0.015 (0.049)
-0.024 (0.134) 0.053 (0.049)
failurest-i
0.009 (0.117) 0.041 (0.040)
-0.004 (0.120) 0.054 (0.062)
-0.029 (0.123) 0.049 (0.057)
0.028 (0.128) 0.015 (0.049)
-0.024 (0.134) 0.053 (0.049)
Constant -1.676** (0.198)
-1.766* (0.692)
-1.797** (0.690)
-2.020** (0.504)
-1.860** (0.502)
Obs 436 436 436 202 202 Counties 15 15 15 10 10
Standard errors in parentheses + significant at 10%; * significant at 5%; ** significant at 1%
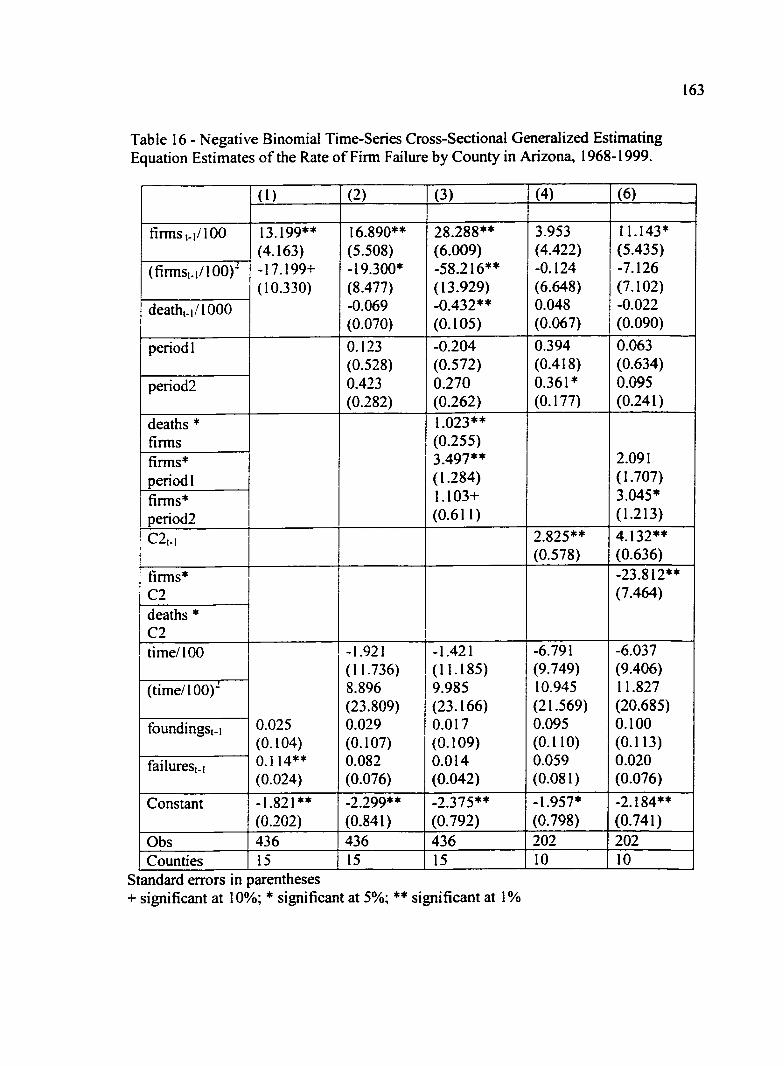
163
Table 16 - Negative Binomial Time-Series Cross-Sectional Generalized Estimating Equation Estimates of the Rate of Firm Failure by County in Arizona, 1968-1999.
(1) (2) (3) (4) (6)
firms t-i/lOO 13.199** (4.163) -17.199+ (10.330)
16.890** (5.508) -19.300* (8.477) -0.069 (0.070)
28.288** (6.009) -58.216** (13.929) -0.432** (0.105)
3.953 (4.422) -0.124 (6.648) 0.048 (0.067)
11.143* (5.435) -7.126 (7.102) -0.022 (0.090)
(firmSt-i/lOO)"
13.199** (4.163) -17.199+ (10.330)
16.890** (5.508) -19.300* (8.477) -0.069 (0.070)
28.288** (6.009) -58.216** (13.929) -0.432** (0.105)
3.953 (4.422) -0.124 (6.648) 0.048 (0.067)
11.143* (5.435) -7.126 (7.102) -0.022 (0.090)
death,.i/1000
13.199** (4.163) -17.199+ (10.330)
16.890** (5.508) -19.300* (8.477) -0.069 (0.070)
28.288** (6.009) -58.216** (13.929) -0.432** (0.105)
3.953 (4.422) -0.124 (6.648) 0.048 (0.067)
11.143* (5.435) -7.126 (7.102) -0.022 (0.090)
period 1 0.123 (0.528) 0.423 (0.282)
-0.204 (0.572) 0.270 (0.262)
0.394 (0.418) 0.361* (0.177)
0.063 (0.634) 0.095 (0.241)
period2
0.123 (0.528) 0.423 (0.282)
-0.204 (0.572) 0.270 (0.262)
0.394 (0.418) 0.361* (0.177)
0.063 (0.634) 0.095 (0.241)
deaths * firms
1.023** (0.255) 3.497** (1.284) 1.103+ (0.611)
2.091 (1.707) 3.045* (1.213)
firms* period 1
1.023** (0.255) 3.497** (1.284) 1.103+ (0.611)
2.091 (1.707) 3.045* (1.213)
firms* period2
1.023** (0.255) 3.497** (1.284) 1.103+ (0.611)
2.091 (1.707) 3.045* (1.213)
C2M 2.825** (0.578)
4.132** (0.636)
firms* C2
-23.812** (7.464)
deaths * C2
-23.812** (7.464)
time/100
0.025 (0.104) 0.114** (0.024)
-1.921 (11.736) 8.896 (23.809) 0.029 (0.107) 0.082 (0.076)
-1.421 (11.185) 9.985 (23.166) 0.017 (0.109) 0.014 (0.042)
-6.791 (9.749) 10.945 (21.569) 0.095 (0.110) 0.059 (0.081)
-6.037 (9.406) 11.827 (20.685) 0.100 (0.113) 0.020 (0.076)
(time/100)"
0.025 (0.104) 0.114** (0.024)
-1.921 (11.736) 8.896 (23.809) 0.029 (0.107) 0.082 (0.076)
-1.421 (11.185) 9.985 (23.166) 0.017 (0.109) 0.014 (0.042)
-6.791 (9.749) 10.945 (21.569) 0.095 (0.110) 0.059 (0.081)
-6.037 (9.406) 11.827 (20.685) 0.100 (0.113) 0.020 (0.076)
foundingst-i 0.025 (0.104) 0.114** (0.024)
-1.921 (11.736) 8.896 (23.809) 0.029 (0.107) 0.082 (0.076)
-1.421 (11.185) 9.985 (23.166) 0.017 (0.109) 0.014 (0.042)
-6.791 (9.749) 10.945 (21.569) 0.095 (0.110) 0.059 (0.081)
-6.037 (9.406) 11.827 (20.685) 0.100 (0.113) 0.020 (0.076)
failurest-i
0.025 (0.104) 0.114** (0.024)
-1.921 (11.736) 8.896 (23.809) 0.029 (0.107) 0.082 (0.076)
-1.421 (11.185) 9.985 (23.166) 0.017 (0.109) 0.014 (0.042)
-6.791 (9.749) 10.945 (21.569) 0.095 (0.110) 0.059 (0.081)
-6.037 (9.406) 11.827 (20.685) 0.100 (0.113) 0.020 (0.076)
Constant -1.821** (0.202)
-2.299** (0.841)
-2.375** (0.792)
-1.957* (0.798)
-2.184** (0.741)
Obs 436 436 436 202 202 Counties 15 15 15 10 10
Standard errors in parentheses + significant at 10%; * significant at 5%; ** significant at 1%
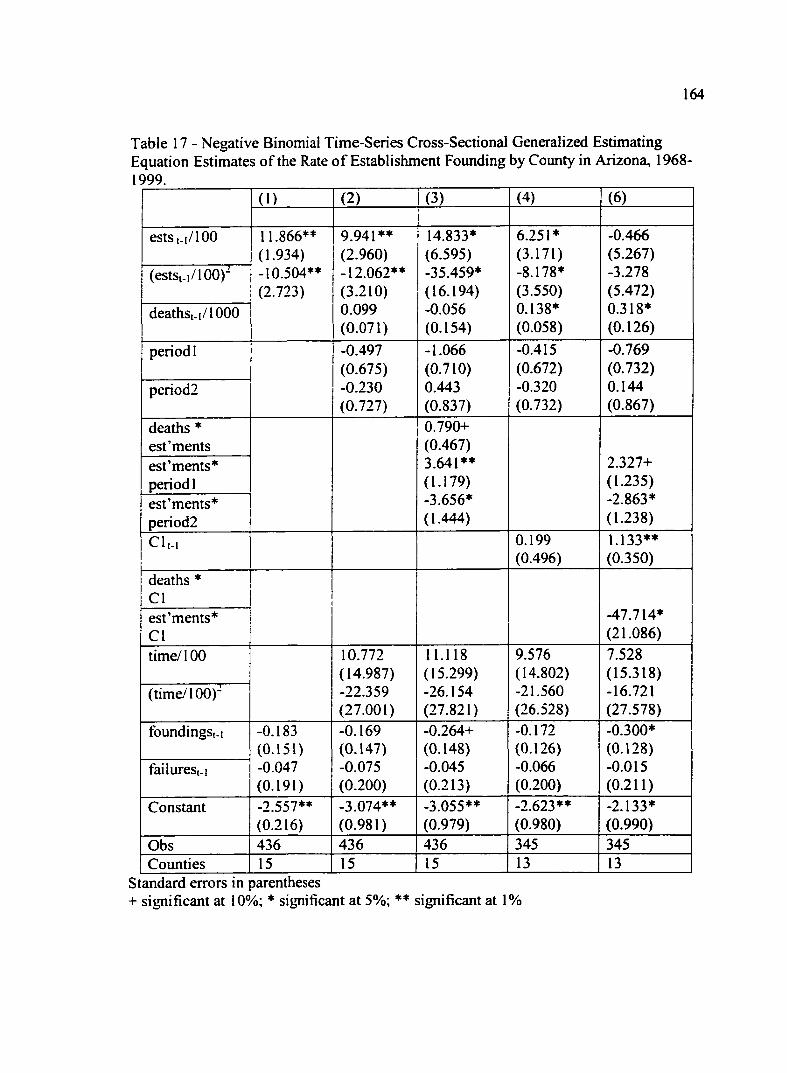
164
Table 17 - Negative Binomial Time-Series Cross-Sectional Generalized Estimating Equation Estimates of the Rate of Establishment Founding by County in Arizona, 1968-1999.
(1) (2) (3) (4) (6)
ests t-i/lOO 11.866** (1.934) -10.504** (2.723)
9.941** (2.960) -12.062** (3.210) 0.099 (0.071)
14.833* (6.595) -35.459* (16.194) -0.056 (0.154)
6.251* (3.171) -8.178* (3.550) 0.138* (0.058)
-0.466 (5.267) -3.278 (5.472) 0.318* (0.126)
(estSt-i/lOO)"
11.866** (1.934) -10.504** (2.723)
9.941** (2.960) -12.062** (3.210) 0.099 (0.071)
14.833* (6.595) -35.459* (16.194) -0.056 (0.154)
6.251* (3.171) -8.178* (3.550) 0.138* (0.058)
-0.466 (5.267) -3.278 (5.472) 0.318* (0.126)
deathSt-i/lOOO
11.866** (1.934) -10.504** (2.723)
9.941** (2.960) -12.062** (3.210) 0.099 (0.071)
14.833* (6.595) -35.459* (16.194) -0.056 (0.154)
6.251* (3.171) -8.178* (3.550) 0.138* (0.058)
-0.466 (5.267) -3.278 (5.472) 0.318* (0.126)
period 1 -0.497 (0.675) -0.230 (0.727)
-1.066 (0.710) 0.443 (0.837)
-0.415 (0.672) -0.320 (0.732)
-0.769 (0.732) 0.144 (0.867)
period2
-0.497 (0.675) -0.230 (0.727)
-1.066 (0.710) 0.443 (0.837)
-0.415 (0.672) -0.320 (0.732)
-0.769 (0.732) 0.144 (0.867)
deaths * est'ments
0.790+ (0.467) 3.641** (1.179) -3.656* (1.444)
2.327+ (1.235) -2.863* (1.238)
est'ments* period 1
0.790+ (0.467) 3.641** (1.179) -3.656* (1.444)
2.327+ (1.235) -2.863* (1.238)
est'ments* period2
0.790+ (0.467) 3.641** (1.179) -3.656* (1.444)
2.327+ (1.235) -2.863* (1.238)
Clf, 0.199 (0.496)
1.133** (0.350)
deaths * CI
-47.714* (21.086)
est'ments* CI
-47.714* (21.086)
time/100 10.772 (14.987) -22.359 (27.001)
11.118 (15.299) -26.154 (27.821)
9.576 (14.802) -21.560 (26.528)
7.528 (15.318) -16.721 (27.578)
(time/100)'
10.772 (14.987) -22.359 (27.001)
11.118 (15.299) -26.154 (27.821)
9.576 (14.802) -21.560 (26.528)
7.528 (15.318) -16.721 (27.578)
foundings,. 1 -0.183 (0.151) -0.047 (0.191)
-0.169 (0.147) -0.075 (0.200)
-0.264+ (0.148) -0.045 (0.213)
-0.172 (0.126) -0.066 (0.200)
-0.300* (0.128) -0.015 (0.211)
failures,-!
-0.183 (0.151) -0.047 (0.191)
-0.169 (0.147) -0.075 (0.200)
-0.264+ (0.148) -0.045 (0.213)
-0.172 (0.126) -0.066 (0.200)
-0.300* (0.128) -0.015 (0.211)
Constant -2.557** (0.216)
-3.074** (0.981)
-3.055** (0.979)
-2.623** (0.980)
-2.133* (0.990)
Obs 436 436 436 345 345 Counties 15 15 15 13 13
Standard errors in parentheses + significant at 10%; * significant at 5%; ** significant at 1%

165
Table 18 - Negative Binomial Time-Series Cross-Sectional Generalized Estimating Equation Estimates of the Rate of Establishment Failure by County in Arizona, 1968-1999.
( I ) (2) (3) (4) (5)
est'mentSt-i/100 9.882** (2.900) -11.139* (5.628)
20.197** (5.918) -12.982** (4.924) -0.315* (0.131)
28.592** (8.301) -60.896** (18.471) -0.740** (0.198)
18.126* (7.332) -11.770* (5.945) -0.268+ (0.152)
34.292** (8.159) -76.865** (14.844) -0.892** (0.201)
(ests,.|/100)~
9.882** (2.900) -11.139* (5.628)
20.197** (5.918) -12.982** (4.924) -0.315* (0.131)
28.592** (8.301) -60.896** (18.471) -0.740** (0.198)
18.126* (7.332) -11.770* (5.945) -0.268+ (0.152)
34.292** (8.159) -76.865** (14.844) -0.892** (0.201)
deaths,.|/1000
9.882** (2.900) -11.139* (5.628)
20.197** (5.918) -12.982** (4.924) -0.315* (0.131)
28.592** (8.301) -60.896** (18.471) -0.740** (0.198)
18.126* (7.332) -11.770* (5.945) -0.268+ (0.152)
34.292** (8.159) -76.865** (14.844) -0.892** (0.201)
period 1 1.423* (0.706) 1.525** (0.580)
0.482 (0.907) 1.500* (0.732)
1.438* (0.713) 1.532** (0.592)
0.123 (1.044) 1.328+ (0.716)
period2
1.423* (0.706) 1.525** (0.580)
0.482 (0.907) 1.500* (0.732)
1.438* (0.713) 1.532** (0.592)
0.123 (1.044) 1.328+ (0.716)
deaths * est'ments
1.510** (0.521) 7.887* (3.515) -0.084 (1.434)
1.894** (0.446) 9.355** (3.624) 0.594 (1.526)
est'ments* period 1
1.510** (0.521) 7.887* (3.515) -0.084 (1.434)
1.894** (0.446) 9.355** (3.624) 0.594 (1.526)
est'ments* period2
1.510** (0.521) 7.887* (3.515) -0.084 (1.434)
1.894** (0.446) 9.355** (3.624) 0.594 (1.526)
CI,., 0.710* (0.312)
1.396* (0.664)
deaths* CI
0.653 (2.559) -12.988 (72.349)
est'ments* CI
0.653 (2.559) -12.988 (72.349)
time/100
0.244 (0.190) 0.002 (0.332)
-4.681 (16.937) 4.237 (36.649) 0.206 (0.212) -0.319 (0.457)
-2.517 (17.397) -4.404 (38.523) 0.204 (0.178) -0.304 (0.386)
-4.059 (17.550) -1.631 (39.128) 0.206 (0.216) -0.332 (0.464)
3.118 (20.412) -21.770 (47.200) 0.248 (0.177) -0.282 (0.399)
(time/100)"
0.244 (0.190) 0.002 (0.332)
-4.681 (16.937) 4.237 (36.649) 0.206 (0.212) -0.319 (0.457)
-2.517 (17.397) -4.404 (38.523) 0.204 (0.178) -0.304 (0.386)
-4.059 (17.550) -1.631 (39.128) 0.206 (0.216) -0.332 (0.464)
3.118 (20.412) -21.770 (47.200) 0.248 (0.177) -0.282 (0.399)
foundings,.! 0.244 (0.190) 0.002 (0.332)
-4.681 (16.937) 4.237 (36.649) 0.206 (0.212) -0.319 (0.457)
-2.517 (17.397) -4.404 (38.523) 0.204 (0.178) -0.304 (0.386)
-4.059 (17.550) -1.631 (39.128) 0.206 (0.216) -0.332 (0.464)
3.118 (20.412) -21.770 (47.200) 0.248 (0.177) -0.282 (0.399)
failures,-!
0.244 (0.190) 0.002 (0.332)
-4.681 (16.937) 4.237 (36.649) 0.206 (0.212) -0.319 (0.457)
-2.517 (17.397) -4.404 (38.523) 0.204 (0.178) -0.304 (0.386)
-4.059 (17.550) -1.631 (39.128) 0.206 (0.216) -0.332 (0.464)
3.118 (20.412) -21.770 (47.200) 0.248 (0.177) -0.282 (0.399)
Constant -3.183** (0.234)
-5.029** (1.533)
-4.649** (1.364)
-4.851** (1.562)
-5.012** (1.408)
Obs 436 436 436 345 345 Counties 15 15 15 13 13
Standard errors in parentheses + significant at 10%; * significant at 5%; *• significant at 1%

Table 19 - Negative Binomial Time-Series Cross-Sectional Generalized Estimating Equation Estimates of the Rate of Change in Ownership of Establishments by County Arizona, 1968-1999.
(1) (2) (3)
est'ments t.|/100 8.538** (3.054) -5.962 (5.386)
12.021 + (7.013) -5.028 (4.419) -0.158 (0.121)
18.912** (5.401) -12.298** (4.500) -0.338** (0.117)
(estSt-i/lOO)"
8.538** (3.054) -5.962 (5.386)
12.021 + (7.013) -5.028 (4.419) -0.158 (0.121)
18.912** (5.401) -12.298** (4.500) -0.338** (0.117)
deathst-i/1000
8.538** (3.054) -5.962 (5.386)
12.021 + (7.013) -5.028 (4.419) -0.158 (0.121)
18.912** (5.401) -12.298** (4.500) -0.338** (0.117)
period 1 0.222 (0.511) 0.365 (0.427)
-0.249 (0.561) -0.007 (0.532)
period2
0.222 (0.511) 0.365 (0.427)
-0.249 (0.561) -0.007 (0.532)
est'ments* period 1
3.558** (1.360) 2.254** (0.720)
est'ments* period2
3.558** (1.360) 2.254** (0.720)
time/100
0.134 (0.100) -0.075 (0.126) -0.255 (0.191)
-7.726 (11.448) 23.223 (24.281) 0.773 (2.998) 0.118 (0.084) -0.108 (0.167) -0.268 (0.197)
-5.361 (10.941) 21.270 (22.834) -2.277 (2.843) 0.092 (0.084) -0.099 (0.193) -0.343 (0.222)
(time/100)"
0.134 (0.100) -0.075 (0.126) -0.255 (0.191)
-7.726 (11.448) 23.223 (24.281) 0.773 (2.998) 0.118 (0.084) -0.108 (0.167) -0.268 (0.197)
-5.361 (10.941) 21.270 (22.834) -2.277 (2.843) 0.092 (0.084) -0.099 (0.193) -0.343 (0.222)
firmst.|/100
0.134 (0.100) -0.075 (0.126) -0.255 (0.191)
-7.726 (11.448) 23.223 (24.281) 0.773 (2.998) 0.118 (0.084) -0.108 (0.167) -0.268 (0.197)
-5.361 (10.941) 21.270 (22.834) -2.277 (2.843) 0.092 (0.084) -0.099 (0.193) -0.343 (0.222)
own changes,. 1 0.134 (0.100) -0.075 (0.126) -0.255 (0.191)
-7.726 (11.448) 23.223 (24.281) 0.773 (2.998) 0.118 (0.084) -0.108 (0.167) -0.268 (0.197)
-5.361 (10.941) 21.270 (22.834) -2.277 (2.843) 0.092 (0.084) -0.099 (0.193) -0.343 (0.222)
foundingst-i
0.134 (0.100) -0.075 (0.126) -0.255 (0.191)
-7.726 (11.448) 23.223 (24.281) 0.773 (2.998) 0.118 (0.084) -0.108 (0.167) -0.268 (0.197)
-5.361 (10.941) 21.270 (22.834) -2.277 (2.843) 0.092 (0.084) -0.099 (0.193) -0.343 (0.222)
failurest-i
0.134 (0.100) -0.075 (0.126) -0.255 (0.191)
-7.726 (11.448) 23.223 (24.281) 0.773 (2.998) 0.118 (0.084) -0.108 (0.167) -0.268 (0.197)
-5.361 (10.941) 21.270 (22.834) -2.277 (2.843) 0.092 (0.084) -0.099 (0.193) -0.343 (0.222)
Constant -1.797** (0.206)
-1.822* (0.827)
-1.844* (0.764)
Observations 436 436 436 Counties 15 15 15
Standard errors in parentheses + significant at 10%; * significant at 5%; ** significant at 1%

167
Table 19 - continued
(3) (4)
est'ments t-i/100 10.463 (7.838) -1.413 (4.328) -0.178 (0.113)
20.575** (6.931) -37.448* (15.231) -0.360* (0.176)
(estst-|/100)"
10.463 (7.838) -1.413 (4.328) -0.178 (0.113)
20.575** (6.931) -37.448* (15.231) -0.360* (0.176)
deathst-|/1000
10.463 (7.838) -1.413 (4.328) -0.178 (0.113)
20.575** (6.931) -37.448* (15.231) -0.360* (0.176)
period 1 0.346 (0.507) 0.450 (0.440)
-0.020 (0.610) 0.405 (0.630)
period!
0.346 (0.507) 0.450 (0.440)
-0.020 (0.610) 0.405 (0.630)
deaths* est'ments
0.963+ (0.526) 3.542** (1.156) 0.189 (1.177)
est'ments* period 1
0.963+ (0.526) 3.542** (1.156) 0.189 (1.177)
est'ments* period2
0.963+ (0.526) 3.542** (1.156) 0.189 (1.177)
CI,., -1.419 (1.050)
-1.685 (1.325)
deaths* CI
-4.455** (1.714) 101.006* (50.639)
est'ments * CI
-4.455** (1.714) 101.006* (50.639)
deaths * C2
-4.455** (1.714) 101.006* (50.639)
est'ments * C2
-4.455** (1.714) 101.006* (50.639)
Columns continued on following page.

Table 19 - continued
time/100 -9.942 (11.415) 28.090 (23.452) 0.230 (3.704) 0.099 (0.077) -0.113 (0.163) -0.244 (0.189)
-12.110 (11.594) 34.669 (23.518) -1.384 (6.871) 0.107 (0.094) -0.201 (0.176) -0.316 (0.197)
(time/100)"
-9.942 (11.415) 28.090 (23.452) 0.230 (3.704) 0.099 (0.077) -0.113 (0.163) -0.244 (0.189)
-12.110 (11.594) 34.669 (23.518) -1.384 (6.871) 0.107 (0.094) -0.201 (0.176) -0.316 (0.197)
firmst-i/100
-9.942 (11.415) 28.090 (23.452) 0.230 (3.704) 0.099 (0.077) -0.113 (0.163) -0.244 (0.189)
-12.110 (11.594) 34.669 (23.518) -1.384 (6.871) 0.107 (0.094) -0.201 (0.176) -0.316 (0.197)
own changest-i
-9.942 (11.415) 28.090 (23.452) 0.230 (3.704) 0.099 (0.077) -0.113 (0.163) -0.244 (0.189)
-12.110 (11.594) 34.669 (23.518) -1.384 (6.871) 0.107 (0.094) -0.201 (0.176) -0.316 (0.197)
foundingSt-i
-9.942 (11.415) 28.090 (23.452) 0.230 (3.704) 0.099 (0.077) -0.113 (0.163) -0.244 (0.189)
-12.110 (11.594) 34.669 (23.518) -1.384 (6.871) 0.107 (0.094) -0.201 (0.176) -0.316 (0.197)
failurest-i
-9.942 (11.415) 28.090 (23.452) 0.230 (3.704) 0.099 (0.077) -0.113 (0.163) -0.244 (0.189)
-12.110 (11.594) 34.669 (23.518) -1.384 (6.871) 0.107 (0.094) -0.201 (0.176) -0.316 (0.197)
Constant -1.441+ (0.875)
-1.557* (0.789)
Observations 345 345 Counties 13 13
Standard errors in parentheses + significant at 10%; * significant at 5%; ** significant at 1%
169
REFERENCES
Aldrich, Howard. 1979. Organizations and Environments. Englewood Cliffs, NJ: Prentice-Hall.
Aldrich, Howard and Jeffrey Pfeffer. 1976. "Environments of Organizations." Annual Review of Sociology 2: 79-105.
Allison, Paul D. 1984. Event History Analysis: Regression for Longitudinal Event Data. Newbury Park, CA: Sage Publications Ltd.
Allison, Paul D. 1999. Multiple Regression : A Primer. Thousand Oaks, CA: Pine Forge Press.
Bamett, William P. and T. Amburgey. 1990. "Do Larger Organizations Generate Stronger Competition?" In Organizational Evolution: New Directions, edited by J.V. Singh. Newbury Park, CA: Sage.
Bamett, William P. and Glenn R. Carroll. 1993. "How Institutional Constraints Affected the Organization of Early U.S. Telephony." Journal of Law, Economics, and Organization 9: 98-126.
Baron, James N., Michael T. Hannan, and M. Diane Burton. 2001. "Labor Pains: Change in Organizational Models and Employee Turnover in Young High Tech Firms." American Journal of Sociology 106:4 960-1012.
Baum, Joel A.C. 1996. "Organizational Ecology." In 5/Mrfv/rtg O/'gamra/zo/ts; Theory and Method, edited by Stewart R. Clegg and Cynthia Hardy. Thousand Oaks, CA: Sage Publications Inc.
Baum, Joel A. C. and Christine Oliver. 1992. "Institutional Embeddedness and the Dynamics of Organizational Populations." American Sociological Review 57: 540-559.
Baum, Joel A. C. and Walter W. Powell. 1995. "Cultivating an Institutional Ecology of Organizations: Comment on Hannan, Carroll, Dundon, and Torres." American Sociological Review 60: 529-538.
Bowman, Leroy. 1959. The American Funeral: A Study in Guilt, Extravagance, and Sublimity. Washington, DC: Public Affairs Press.
Carroll, Glenn R. 1985. "Concentration and Specialization: Dynamics of Niche Width in Populations of Organizations." American Journal of Sociology 90: 1262-1283.
170
Carroll, Glenn R. and Michael T. Hannan. 1989. "Density Delay in the Evolution of Organizational Populations: A Model and Five Empirical Tests." Administrative Science Quarterly 34: 411-430.
Carroll, Glenn R. and Michael T. Hannan. 2000. The Demography of Corporations and Industries. Princeton, NJ: Princeton University Press.
Carroll, Glenn R. and Anand Swaminathan. 1991. "Density dependent Organizational Evolution in the American Brewing Industry from 1633 to 1988." Acta Sociologica 34:155-175.
Carroll, Glenn R. and Anand Swaminathan. 1992. "The Organizational Ecology of Strategic Groups in the American Brewing Industry from 1975-1990." Industrial and Corporate Change 1: 65-97.
Carroll, Glenn R. and Anand Swaminathan. 2000. "Why the Microbrewery Movement? Organizational Dynamics of Resource Partitioning in the U.S. Brewing Industry." American Journal of Sociology 106: 715-762.
Chandler, Alfred. 1977. The Visible Hand. Cambridge, MA: Harvard University Press.
Chandler, Alfred. 1990. Scale and Scope. Cambridge, MA: Harvard University Press.
Cochrane D. and G.H. Orcutt. 1949. "Application of Least-Squares Regression to Relationships Containing Autocorrelated Error Terms." Journal of the American Statistical Association 44: 32-61.
Delacroix, Jacques, Anand Swaminathan, and Michael E. Solt. 1989. "Density Dependence versus Population Dynamics: An Ecological Study of Failings in the California Wine Industry." American Sociological Review 54:245-262.
DiMaggio, Paul J. and Walter W. Powell. 1983. "The Iron Cage Revisited: Institutional Isomorphism and Collective Rationality in Organizational Fields." American Sociological Review 48:147-160.
DiMaggio, Paul J. and Walter W. Powell, eds. 1991. The New Institutionalism in Organizational Analysis. Chicago, IL: University of Chicago Press.
Dobbin, Frank, and Timothy Dowd. 1997. "How Policy Shapes Competition: Early Railroad Founding in Massachusetts." Administrative Science Quarterly 42:501-529.
Dobrev, Stanislav, T.-Y. Kim, and M. T. Hannan. 2001. "Dynamics ofNich Width and Resource Partitioning" American Journal of Sociology 106: 1299-1337

171
Durkheim, Emile. 1984. The Division of Labor in Society. New York, NY: The Free Press. [Originally published in 1893].
Farrell, James J. 1980. Inventing the American Way of Death, 1830-1920. Philadelphia, PA: Temple University Press.
Finkelstein, Michael O. and Bruce Levin. 1990. Statistics for Lawyers. New York, NY: Springer Verlag, Inc.
Fligstein, Neil. 1990. The Transformation of Corporate Control. Cambridge, MA: Harvard University Press.
Habenstein, Robert W and W. Lamers. 1955. The History of the American Funeral Directing. Milwaukee: Bulfin Printers
Hannan, Michael T. and Glenn R. Carroll. 1992. Dynamics of Organizational Populations: Density, Legitimation, and Competition. New York: Oxford University Press.
Hannan, Michael T. and Glenn R. Carroll. 1995. '^Reply: Cheap Talk about Legitimation." American Sociological Review 60: 539-544.
Hannan, Michael T., Glenn R. Carroll, Stanislav D. Dobrev, and Joon Han. 1998. "Organizational Mortality in European and American Automobile Industries, Part I: Revisiting the Effects of Age and Size." European Sociological Review 14: 279-302.
Hannan, Michael T., Glenn R. Carroll, Elizabeth A. Dundon, and John Charles Torres. 1995. "Organizational Evolution in a Multinational Context." American Sociological Review 60: 509-528.
Hannan, Michael T. and John Freeman. 1977. "The Population Ecology of Organizations." American Journal of Sociology 82:929-964.
Hannan, Michael T. and John Freeman. 1987. "The Ecology of Organizational Founding: American Labor Unions, 1836 - 1985." American Journal of Sociology 92: 910-943.
Hannan, Michael T. and John Freeman. 1989. Organizational Ecology. Cambridge, MA: Harvard University Press.
Hannan, Michael T., James Ranger-Moore, and Jane Banaszak-Holl. 1990. "Competition and the Evolution of Organizational Size Distributions." Pp. 246-268 in Organizational Evolution: New Directions, edited by J. Singh. Newbury Park, CA: Sage.
172
Harmer. Ruth M. 1963. The High Cost of Dying. New York, NY: Collier Books
Harrison, Harry and Stanley R. Green berg. 1973. Soylent Green. Hollywood, CA: MGM.
Haveman, Heather A. 2000. "The Future of Organizational Sociology." Contemporary 5bc/o/og>'29(3):476-486. .
Hildreth, C. and J. Y. Lu. I960. "Demand Relations on Autocorrelated Disturbances." Agricultural Experiment Station Technical Bulletin 276. East Lansing, MI: Michigan State University.
Horn, Miriam. 1998. "The Deathcare Business: The Goliaths of the funeral industry are making lots of money off your grief," U.S. News and World Report 3/23/98
Iserson, Kenneth V. 1994. Death to Dust: What Happens to Dead Bodies? Tucson, AZ: Galen Press, Ltd.
Jaccard, James, R. Turrisi, and C. Wan. 1990. Interaction Ejfects in Multiple Regression. Newbury Park, CA: Sage Publications.
Judge, G.G., W.E. Griffiths, R.C. Hill, H. Lutkepohl, and T.C. Lee. 1985. The Theory and Practice of Econometrics. Second Edition. New York, NY: John Wiley & Sons.
Keari, M.C. 1996. "Dying Well - The Unspoken Dimension of Aging Well." American Behavioral Scientist 39: 336-360.
FCingsland, Sharon. 1985. Modeling Mature: Episodes in the History of Population Ecology. Chicago: University of Chicago Press.
Lamoreaux, Naiomi. 1985. The Great Merger Wave in American Business, 1895-1904. New York: Cambridge University Press.
Larson, Eric. 1996. "Fight to the Death" Time December 9, 1996.
Liang, K.-Y. and S. L. Zeger. 1986. "Longitudinal Data Analysis Using Generalized Linear Models." Biometrika 12: 13-22.
Loewens Group. 1998. Annual Report. Loewens Group.
Marx, Karl. 1978. "The Manifesto of the Communist Party," in The Marx-Engels Reader, Robert C. Tucker, ed. New York, NY: W.W. Norton & Company, Inc. [Originally published in 1848].
173
McPherson, J. Miller. 1983. "An Ecology of Affiliation." American Sociological Review 48: 519-535.
Meyer, John W., and Brian Rowan. 1977. "Institutionalized Organizations: Formal Structure as Myth and Ceremony." American Journal of Sociology 83: 340-363.
Mitford, Jessica. 1998. The American Way of Death Revisited. New York, NY: Knopf.
Morris, Theresa. 2000. "Transformations in the Organization of Banking: The Effects of Government Policy, 1977-1998." Ph.D. dissertation, Texas A&M University.
Napier, Prue. 1972. Monkeys and Apes. New York, NY: Cosset & Dunlap, Inc.
Newman, Judith. 1996. "At Your Disposal: The funeral industry prepares for boom times." Harper's Magazine November, 1997.
North, Douglass C. 1990. Institutions. Institutional Change and Economic Performance. New York, NY: Cambridge University Press.
Parsons, Brian. 1999. "Yesterday, Today, and Tomorrow: The Lifecycle of the UK Funeral Industry." Mortality A: 127-145.
Peli, Gabor, and Bart Nooteboom. 1999. "Market Partitioning and the Geometry of the Resource Space." American Journal of Sociology 104: 1132-1153.
Perrow, Charles. 1992. "Small Firm Networks." In Networks and Organizations, edited by Nitin Nohria and Robert Eccles. Boston, MA: Harvard Business School Press.
Perrow, Charles. 1986. Complex Organizations: A Critical Essay. New York, NY: McGraw-Hill.
Pfeffer, Jeffrey and Gerald Salancik. 1978. The External Control of Organizations. New York, NY: Harper and Row.
Rabe-Hesketh, Sophis, and B. Everitt. 2000. A Handbook of Statistical Analysis with Stata. Washington, DC: Chapman & Hall/CRC.
Ranger-Moore, James. 1997. "If Bigger is Better, Is Older Wiser? Organizational Age and Size in the New York Life Insurance Industry." American Sociological Review 58: 901-20.
174
Ranger-Moore, James, Jane Banazak-Holl, and Michael T. Hanna. 1991. "Density-dependent Dynamic in Regulated Industries: Founding Rates of Banks and Life insurance Companies." Administrative Science Quarterly, 36: 36-65.
Ranger-Moore, James, Robert S. Breckenridge, and Daniel L. Jones. 1995. "Patterns of Growth and Size-Localized Competition in the New York State Life Insurance Industry, 1860-1985." Social Forces ly. 1027-1049.
Reynolds, David K. and R. Kalish. 1974. "Work Roles in Death Related Occupations." The Journal of Vocational Behavior 233-335.
Roberts, Darryl J. 1997. The Profits of Death: An Insider Exposes the Death Care Industries. Chandler, AZ: Five Star Publications, Inc.
Ruef, Martin. 2000. "The Emergence of Organizational Forms: A Community Ecology Approach." American Journal of Sociology 106:3 658-714.
Sayrs, Lois W. 1989. Pooled Time Series Analysis. New Park, CA: Sage Publications.
Scott, W. Richard. 1987. Organizations: Rational, Natural, and Open Systems. Englewood Cliffs, NJ: Prentice-Hall.
Scott, W. Richard. 1995. Institutions and Organizations. Thousand Oaks, CA: Sage Publications, Inc.
Scott, W. Richard and John W. Meyer. 1994. Institutional Environments and Organizations. Thousand Oaks, CA: Sage Publications, Inc.
Scott, W. Richard, Martin Reuf, Peter J. Mendel, and Carol A. Caronna. 2000. Institutional Change and Healthcare Organizations: From Professional Dominance to Managed Care. Chicago: The University of Chicago Press.
Service Corporation International. 1998. Annual Report. Service Corporation International.
Smith, Ronald G.E. 1996. The Death Care Industries in the United States. Jefferson, NC: McFarland & Company.
StataCorp. 2001. Stata Statistical Software: Release 7.0. College Station, TX: Stata Corporation
Stewart Enterprises. 1998. Annual Report. Stewart Enterprises

175
Stinchcombe, Arthur L. 1965. "Social Structure and Organizations." In Handbook of Organizations, edited by James March. Chicago: Rand McNally.
Suchman, Mark. 1995. "Managing Legitimacy: Strategic and Institutional Approaches." Academy of Management Review 20: 571-610.
Tirole, Jean. 1988. The Theory of Industrial Organization. Cambridge, MA; MIT Press.
Torres, David L. 1983. "An Industry and is Environment: Professionalism and its Effects on the Funeral Industry." Ph.D. dissertation. Northwestern University.
Torres, David L. 1988. "Professionalism, Variation, and Organizational Survival." American Sociological Review 53:380-394.
Tucker, David J., J.V. Singh, and A. G. Meinhard. 1990. "Organizational Form, Population Dynamics, and Institutional Change: The Founding Patterns of Voluntary Organizations." Academy of Management Journal, 32: 151-178
Tumer, Jonathan H. 1998. The Structure of Sociological Theory. Belmont, CA: Wadsworth Publishing Co.
Williamson, Oliver E. 1975. Markets and Hierarchies. New York, NY: Free Press.
Williamson, Oliver E. 1985. The Economic Institutions of Capitalism. New York, N.Y.: Free Press.
Yamaguchi, Kazuo. 1991. Event History Analysis. Newbury Park, CA: Sage Publications Ltd.