Information Technology Asset Management Strategy · PDF file · 2017-06-162. IT...
36
B O N N E V I L L E P O W E R A D M I N I S T R A T I O N 2010 Integrated Program Review Information Technology Asset Management Strategy Integrated Program Review May 25, 2010
-
Upload
trinhxuyen -
Category
Documents
-
view
217 -
download
2
Transcript of Information Technology Asset Management Strategy · PDF file · 2017-06-162. IT...
B O N N E V I L L E P O W E R A D M I N I S T R A T I O N
2010 Integrated Program Review
Information Technology Asset Management Strategy
Integrated Program Review May 25, 2010
22
IT Asset Strategy HighlightsThe IT asset strategy includes four portfolios:
– Network – Data, voice and video capability.– Data Center – Servers, operating systems, and database management systems and tools.– Office Automation – Desktops, laptops, printers and desktop software.– Applications – Critical business systems, business systems, general purpose systems and
general task systems.
The IT asset strategy is focused on ensuring that assets are:– Reliable and available when needed;– Adequate in capacity;– Interoperable and efficient;– Compliant with NERC CIP and FSMA requirements; and– Maintained and supported within standards.
IT’s asset management strategy addresses several key challenges, including the need to:
– Optimize the total cost of ownership by balancing the cost of upgrades and replacements with operations and maintenance costs;
– Balance the business unit’s immediate requirements with Agency strategic objectives by delivering flexible and extensible assets;
– Build a strategic partnership with business units to advise and assist them in leveraging technology to meet business objectives; and
– Institutionalize operational excellence to continuously improve processes and service delivery to maximize the utilization and value of IT assets.
3
IT Asset Strategy and Asset Plans
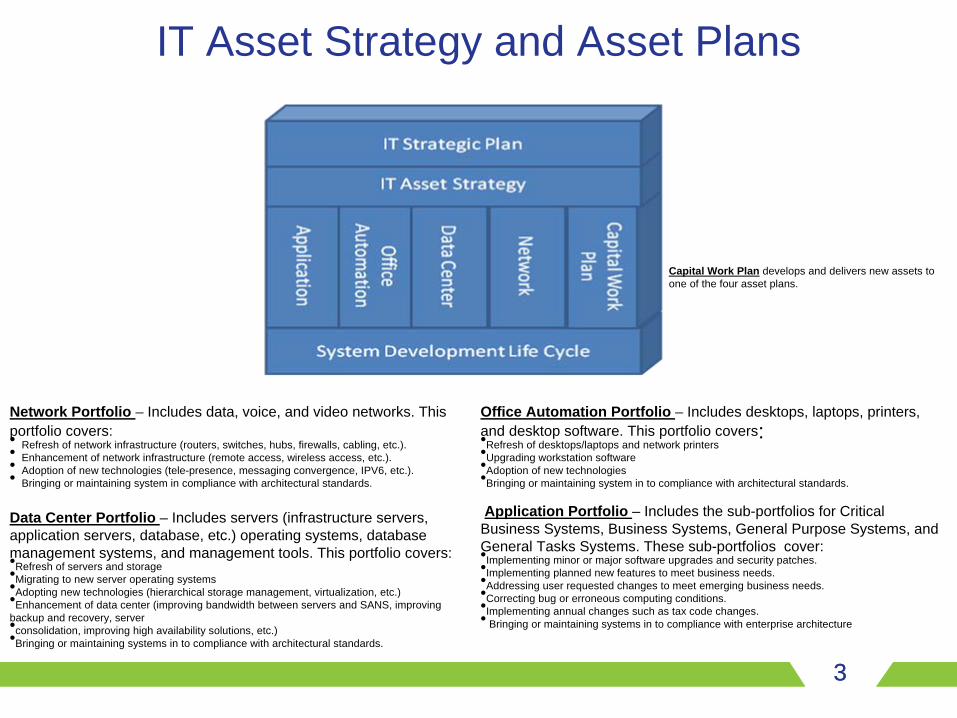
Network Portfolio – Includes data, voice, and video networks. This portfolio covers:• Refresh of network infrastructure (routers, switches, hubs, firewalls, cabling, etc.).• Enhancement of network infrastructure (remote access, wireless access, etc.).• Adoption of new technologies (tele-presence, messaging convergence, IPV6, etc.).• Bringing or maintaining system in compliance with architectural standards.
Data Center Portfolio – Includes servers (infrastructure servers, application servers, database, etc.) operating systems, databasemanagement systems, and management tools. This portfolio covers:•Refresh of servers and storage•Migrating to new server operating systems•Adopting new technologies (hierarchical storage management, virtualization, etc.)•Enhancement of data center (improving bandwidth between servers and SANS, improving backup and recovery, server •consolidation, improving high availability solutions, etc.)•Bringing or maintaining systems in to compliance with architectural standards.
Office Automation Portfolio – Includes desktops, laptops, printers, and desktop software. This portfolio covers:•Refresh of desktops/laptops and network printers •Upgrading workstation software•Adoption of new technologies•Bringing or maintaining system in to compliance with architectural standards.
Application Portfolio – Includes the sub-portfolios for Critical Business Systems, Business Systems, General Purpose Systems, andGeneral Tasks Systems. These sub-portfolios cover:•Implementing minor or major software upgrades and security patches.•Implementing planned new features to meet business needs.•Addressing user requested changes to meet emerging business needs.•Correcting bug or erroneous computing conditions.•Implementing annual changes such as tax code changes.• Bringing or maintaining systems in to compliance with enterprise architecture
Capital Work Plan develops and delivers new assets to one of the four asset plans.
3
4
Office Automation
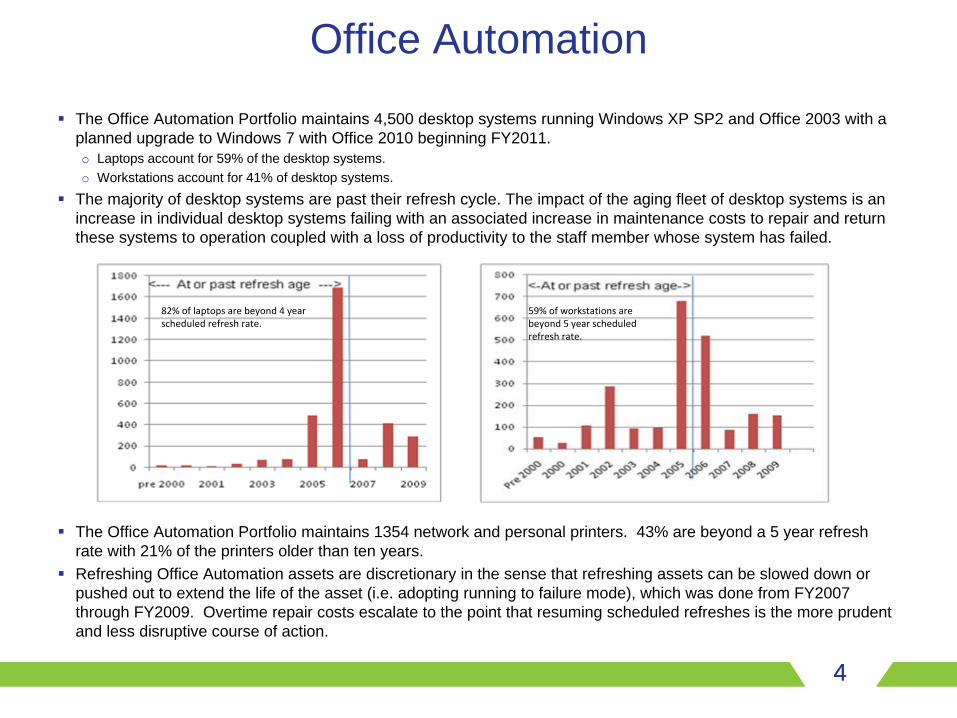
The Office Automation Portfolio maintains 4,500 desktop systems running Windows XP SP2 and Office 2003 with a planned upgrade to Windows 7 with Office 2010 beginning FY2011.o Laptops account for 59% of the desktop systems.o Workstations account for 41% of desktop systems.
The majority of desktop systems are past their refresh cycle. The impact of the aging fleet of desktop systems is an increase in individual desktop systems failing with an associated increase in maintenance costs to repair and return these systems to operation coupled with a loss of productivity to the staff member whose system has failed.
The Office Automation Portfolio maintains 1354 network and personal printers. 43% are beyond a 5 year refresh rate with 21% of the printers older than ten years. Refreshing Office Automation assets are discretionary in the sense that refreshing assets can be slowed down or pushed out to extend the life of the asset (i.e. adopting running to failure mode), which was done from FY2007 through FY2009. Overtime repair costs escalate to the point that resuming scheduled refreshes is the more prudent and less disruptive course of action.
82% of laptops are beyond 4 year scheduled refresh rate.
59% of workstations are beyond 5 year scheduled refresh rate.
4
5
Office Automation Objectives and Status
Office AutomationObjectives
Status Meeting Objectives
Comments
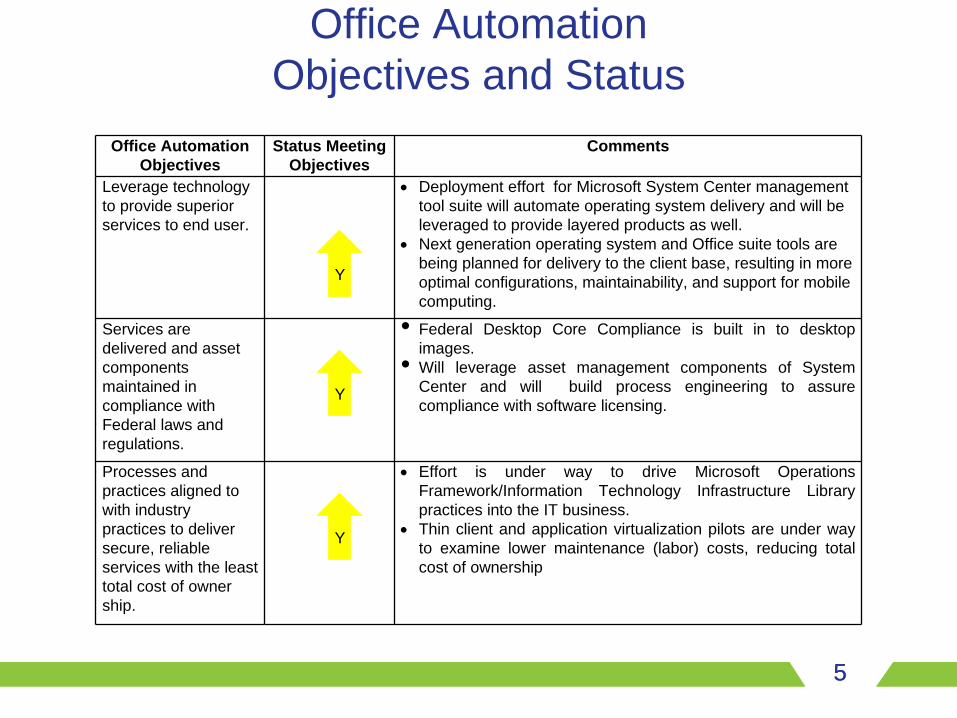
Leverage technology to provide superior services to end user.
•
Deployment effort for Microsoft System Center management tool suite will automate operating system delivery and will be leveraged to provide layered products as well.
•
Next generation operating system and Office suite tools are being planned for delivery to the client base, resulting in more optimal configurations, maintainability, and support for mobile computing.
Services are delivered and asset components maintained in compliance with Federal laws and regulations.
• Federal Desktop Core Compliance is built in to desktop images.
• Will leverage asset management components of System Center and will build process engineering to assure compliance with software licensing.
Processes and practices aligned to with industry practices to deliver secure, reliable services with the least total cost of owner ship.
•
Effort is under way to drive Microsoft Operations Framework/Information Technology Infrastructure Library practices into the IT business.
•
Thin client and application virtualization pilots are under way to examine lower maintenance (labor) costs, reducing total cost of ownership
Y
Y
Y
5
6
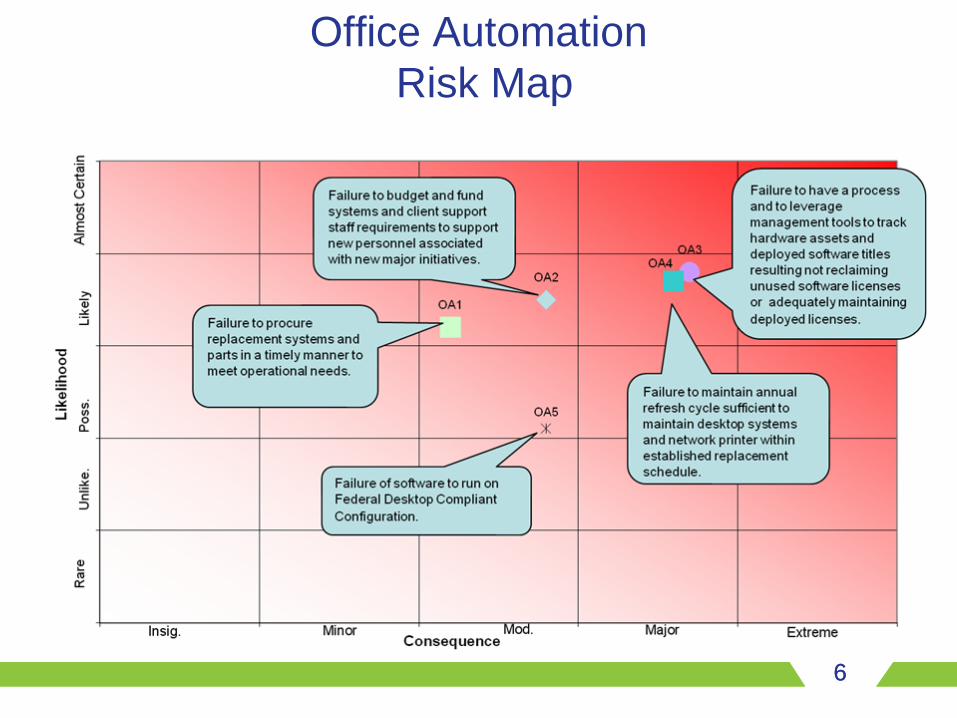
Office Automation Risk Map
6
7
Office Automation Risks
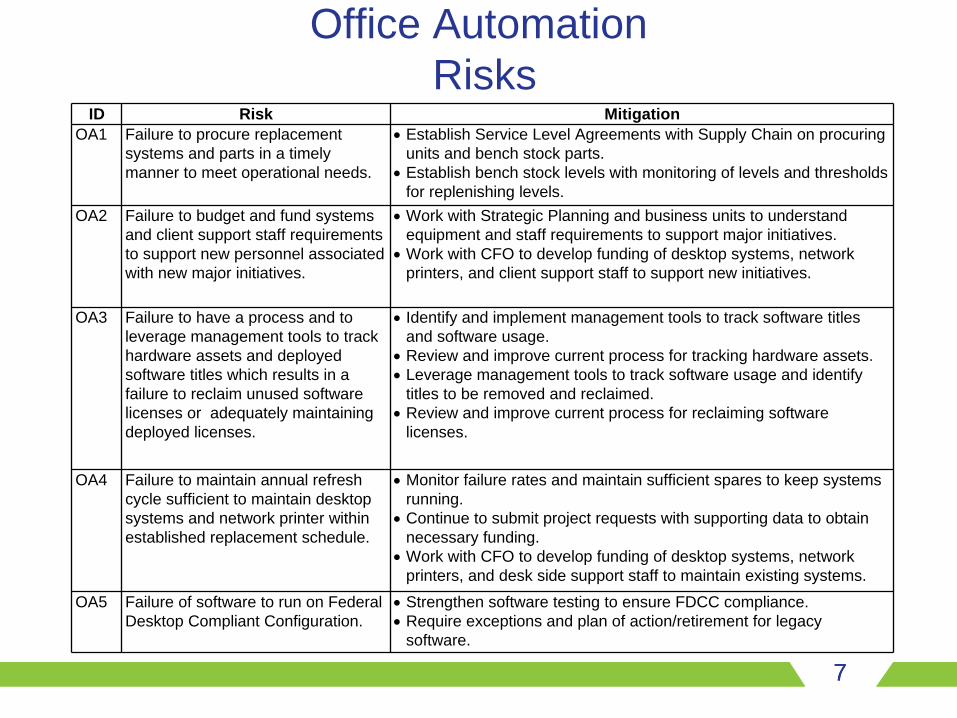
ID Risk MitigationOA1 Failure to procure replacement
systems and parts in a timely manner to meet operational needs.
•
Establish Service Level Agreements with Supply Chain on procuring units and bench stock parts.
•
Establish bench stock levels with monitoring of levels and thresholds for replenishing levels.
OA2 Failure to budget and fund systems and client support staff requirements to support new personnel associated with new major initiatives.
•
Work with Strategic Planning and business units to understand equipment and staff requirements to support major initiatives.
•
Work with CFO to develop funding of desktop systems, network printers, and client support staff to support new initiatives.
OA3 Failure to have a process and to leverage management tools to track hardware assets and deployed software titles which results in a failure to reclaim unused software licenses or adequately maintaining deployed licenses.
•
Identify and implement management tools to track software titles and software usage.
•
Review and improve current process for tracking hardware assets.•
Leverage management tools to track software usage and identify titles to be removed and reclaimed.
•
Review and improve current process for reclaiming software licenses.
OA4 Failure to maintain annual refresh cycle sufficient to maintain desktop systems and network printer within established replacement schedule.
•
Monitor failure rates and maintain sufficient spares to keep systems running.
•
Continue to submit project requests with supporting data to obtain necessary funding.
•
Work with CFO to develop funding of desktop systems, network printers, and desk side support staff to maintain existing systems.
OA5 Failure of software to run on Federal Desktop Compliant Configuration.
•
Strengthen software testing to ensure FDCC compliance.•
Require exceptions and plan of action/retirement for legacy software.
7
8
Office Automation Strategies and Actions
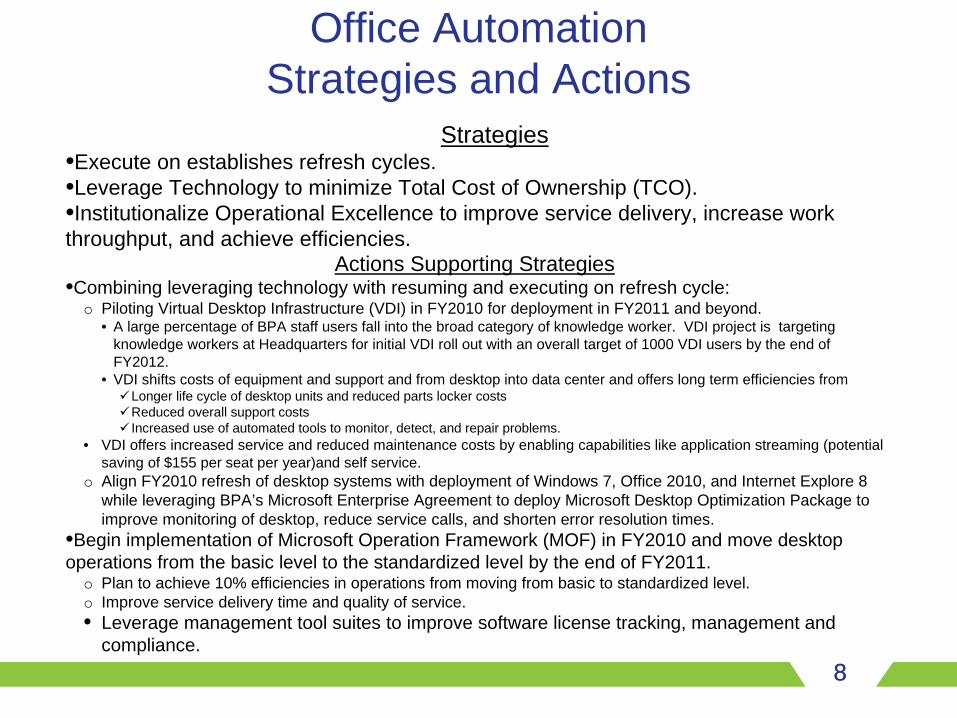
Strategies•Execute on establishes refresh cycles.•Leverage Technology to minimize Total Cost of Ownership (TCO).•Institutionalize Operational Excellence to improve service delivery, increase work throughput, and achieve efficiencies.
Actions Supporting Strategies•Combining leveraging technology with resuming and executing on refresh cycle:
o Piloting Virtual Desktop Infrastructure (VDI) in FY2010 for deployment in FY2011 and beyond.• A large percentage of BPA staff users fall into the broad category of knowledge worker. VDI project is targeting
knowledge workers at Headquarters for initial VDI roll out with an overall target of 1000 VDI users by the end of FY2012.
• VDI shifts costs of equipment and support and from desktop into data center and offers long term efficiencies fromLonger life cycle of desktop units and reduced parts locker costsReduced overall support costsIncreased use of automated tools to monitor, detect, and repair problems.
• VDI offers increased service and reduced maintenance costs by enabling capabilities like application streaming (potential saving of $155 per seat per year)and self service.
o Align FY2010 refresh of desktop systems with deployment of Windows 7, Office 2010, and Internet Explore 8 while leveraging BPA’s Microsoft Enterprise Agreement to deploy Microsoft Desktop Optimization Package to improve monitoring of desktop, reduce service calls, and shorten error resolution times.
•Begin implementation of Microsoft Operation Framework (MOF) in FY2010 and move desktop operations from the basic level to the standardized level by the end of FY2011.
o Plan to achieve 10% efficiencies in operations from moving from basic to standardized level.o Improve service delivery time and quality of service.• Leverage management tool suites to improve software license tracking, management and
compliance.8
9
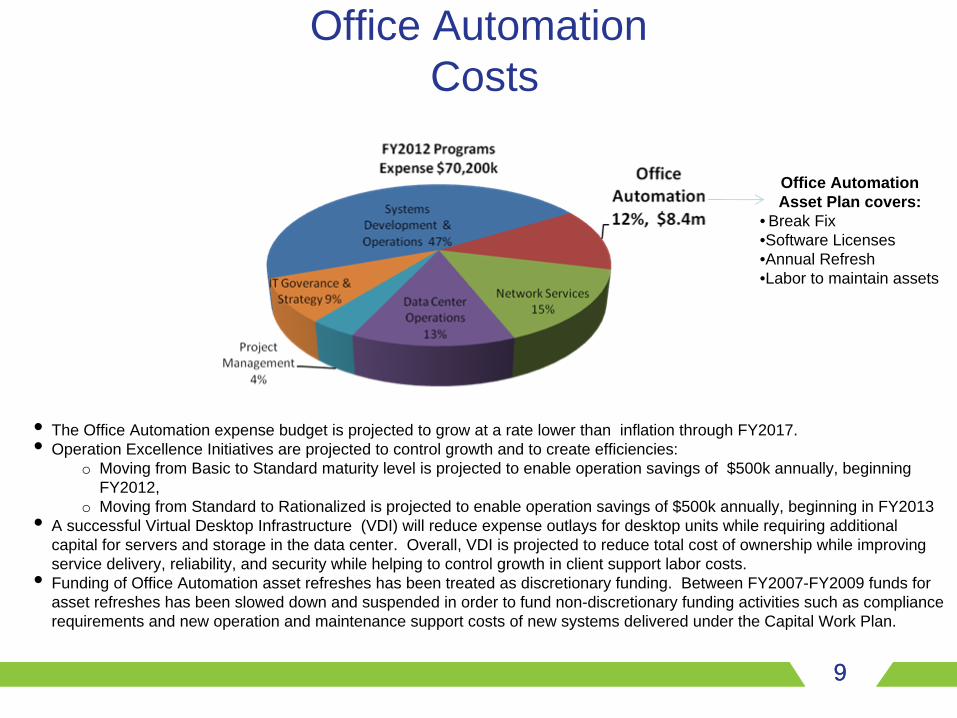
Office Automation Costs
• The Office Automation expense budget is projected to grow at a rate lower than inflation through FY2017.• Operation Excellence Initiatives are projected to control growth and to create efficiencies:
o Moving from Basic to Standard maturity level is projected to enable operation savings of $500k annually, beginning FY2012,
o Moving from Standard to Rationalized is projected to enable operation savings of $500k annually, beginning in FY2013• A successful Virtual Desktop Infrastructure (VDI) will reduce expense outlays for desktop units while requiring additional
capital for servers and storage in the data center. Overall, VDI is projected to reduce total cost of ownership while improving service delivery, reliability, and security while helping to control growth in client support labor costs.
• Funding of Office Automation asset refreshes has been treated as discretionary funding. Between FY2007-FY2009 funds for asset refreshes has been slowed down and suspended in order to fund non-discretionary funding activities such as compliance requirements and new operation and maintenance support costs of new systems delivered under the Capital Work Plan.
Office Automation Asset Plan covers:
• Break Fix•Software Licenses•Annual Refresh •Labor to maintain assets
9
10
Data Center General Description
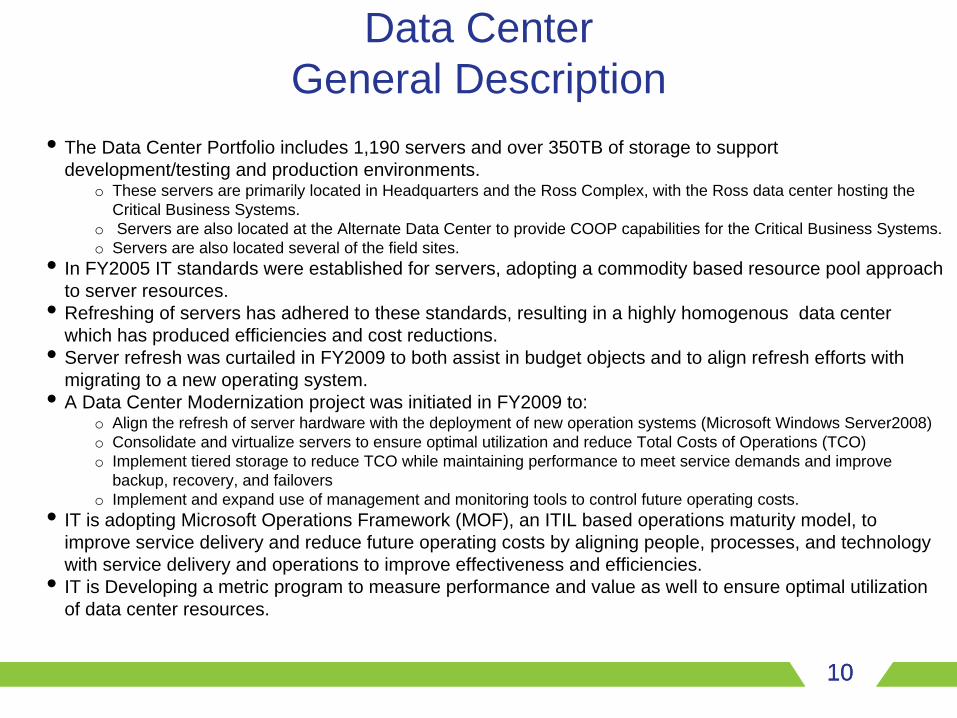
• The Data Center Portfolio includes 1,190 servers and over 350TB of storage to support development/testing and production environments.
o These servers are primarily located in Headquarters and the Ross Complex, with the Ross data center hosting the Critical Business Systems.
o Servers are also located at the Alternate Data Center to provide COOP capabilities for the Critical Business Systems. o Servers are also located several of the field sites.
• In FY2005 IT standards were established for servers, adopting a commodity based resource pool approach to server resources.
• Refreshing of servers has adhered to these standards, resulting in a highly homogenous data center which has produced efficiencies and cost reductions.
• Server refresh was curtailed in FY2009 to both assist in budget objects and to align refresh efforts with migrating to a new operating system.
• A Data Center Modernization project was initiated in FY2009 to:o Align the refresh of server hardware with the deployment of new operation systems (Microsoft Windows Server2008)o Consolidate and virtualize servers to ensure optimal utilization and reduce Total Costs of Operations (TCO)o Implement tiered storage to reduce TCO while maintaining performance to meet service demands and improve
backup, recovery, and failoverso Implement and expand use of management and monitoring tools to control future operating costs.
• IT is adopting Microsoft Operations Framework (MOF), an ITIL based operations maturity model, to improve service delivery and reduce future operating costs by aligning people, processes, and technology with service delivery and operations to improve effectiveness and efficiencies.
• IT is Developing a metric program to measure performance and value as well to ensure optimal utilization of data center resources.
10
11
Data Center Performance Objectives and Status
Data Center Objectives
Status Meeting Objectives
Comments
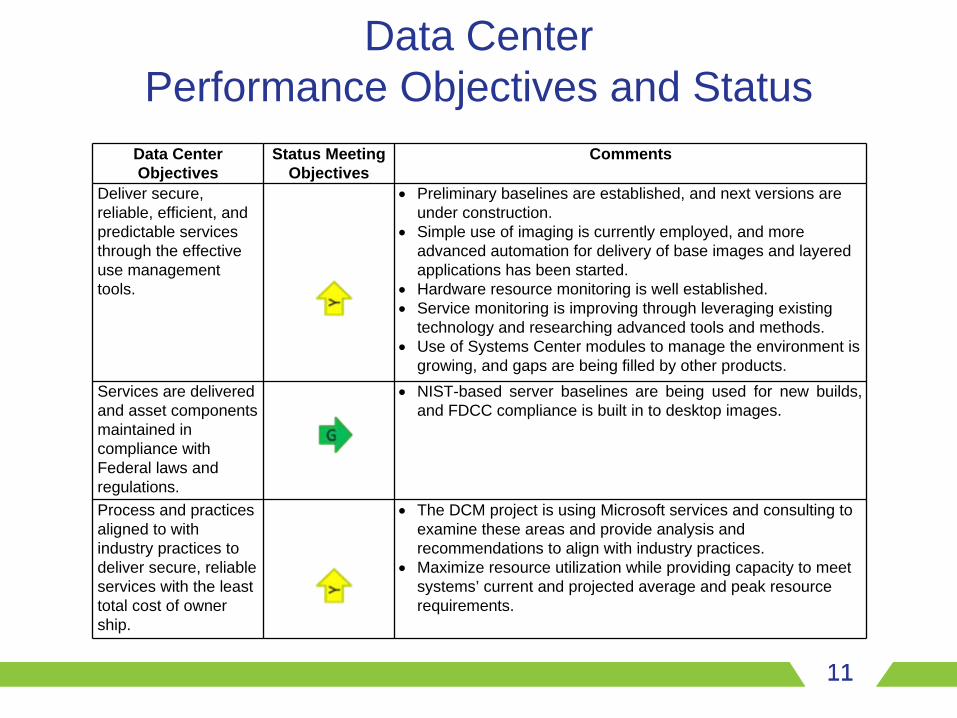
Deliver secure, reliable, efficient, and predictable services through the effective use management tools.
•
Preliminary baselines are established, and next versions are under construction.
•
Simple use of imaging is currently employed, and more advanced automation for delivery of base images and layered applications has been started.
•
Hardware resource monitoring is well established.•
Service monitoring is improving through leveraging existing technology and researching advanced tools and methods.
•
Use of Systems Center modules to manage the environment is growing, and gaps are being filled by other products.
Services are delivered and asset components maintained in compliance with Federal laws and regulations.
•
NIST-based server baselines are being used for new builds, and FDCC compliance is built in to desktop images.
Process and practices aligned to with industry practices to deliver secure, reliable services with the least total cost of owner ship.
•
The DCM project is using Microsoft services and consulting to examine these areas and provide analysis and recommendations to align with industry practices.
•
Maximize resource utilization while providing capacity to meet systems’ current and projected average and peak resource requirements.
11
12
Data Center Risk Map
12
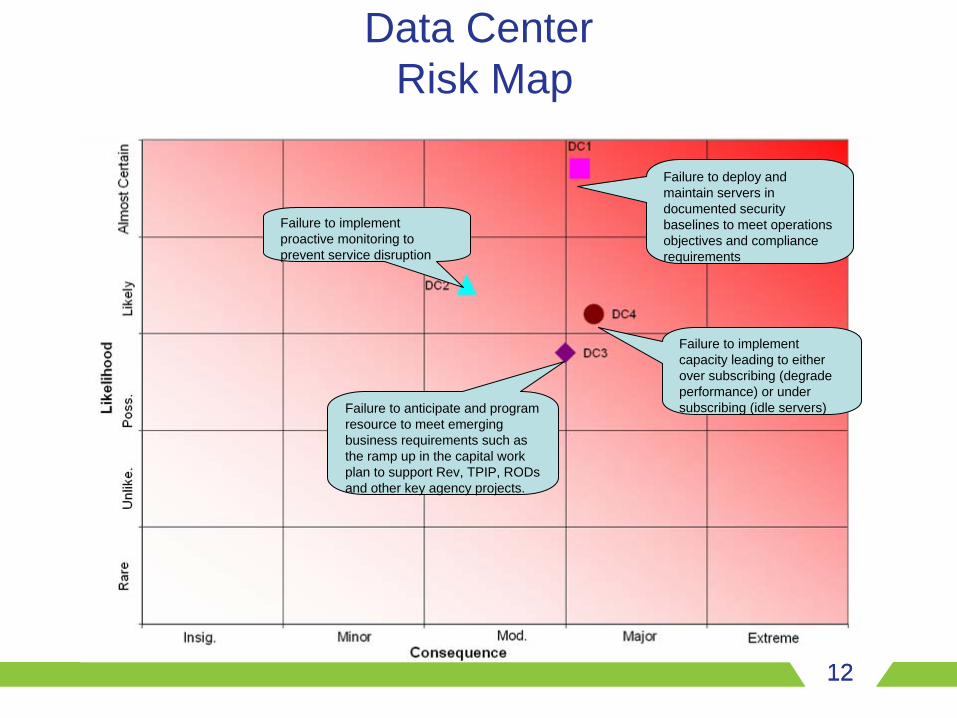
Failure to deploy and maintain servers in documented security baselines to meet operations objectives and compliance requirements
Failure to implement capacity leading to either over subscribing (degrade performance) or under subscribing (idle servers)Failure to anticipate and program
resource to meet emerging business requirements such as the ramp up in the capital work plan to support Rev, TPIP, RODs and other key agency projects.
Failure to implement proactive monitoring to prevent service disruption
13
Data Center Asset Risks
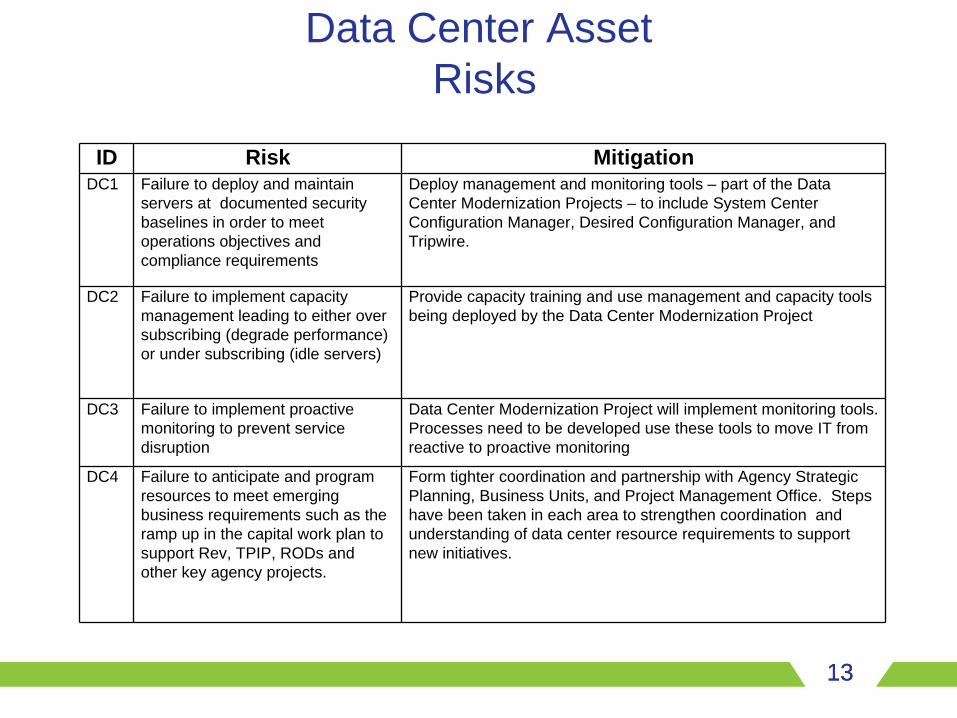
ID Risk MitigationDC1 Failure to deploy and maintain
servers at documented security baselines in order to meet operations objectives and compliance requirements
Deploy management and monitoring tools – part of the Data Center Modernization Projects – to include System Center Configuration Manager, Desired Configuration Manager, and Tripwire.
DC2 Failure to implement capacity management leading to either over subscribing (degrade performance) or under subscribing (idle servers)
Provide capacity training and use management and capacity tools being deployed by the Data Center Modernization Project
DC3 Failure to implement proactive monitoring to prevent service disruption
Data Center Modernization Project will implement monitoring tools. Processes need to be developed use these tools to move IT from reactive to proactive monitoring
DC4 Failure to anticipate and program resources to meet emerging business requirements such as the ramp up in the capital work plan to support Rev, TPIP, RODs and other key agency projects.
Form tighter coordination and partnership with Agency Strategic Planning, Business Units, and Project Management Office. Steps have been taken in each area to strengthen coordination and understanding of data center resource requirements to support new initiatives.
13
14
Data Center Strategies and Actions
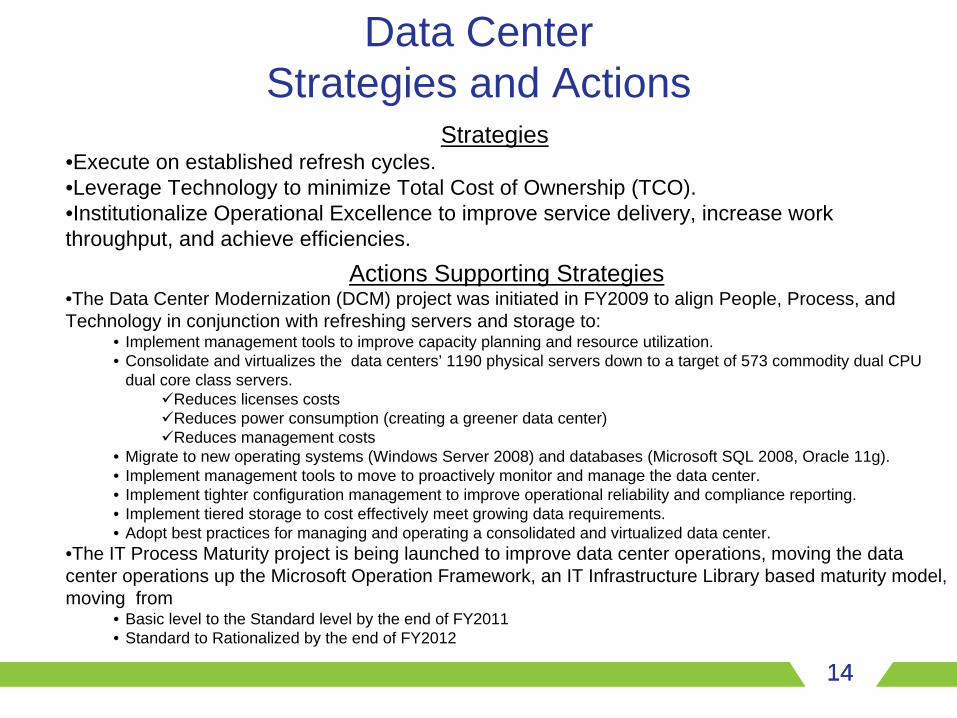
Strategies•Execute on established refresh cycles.•Leverage Technology to minimize Total Cost of Ownership (TCO).•Institutionalize Operational Excellence to improve service delivery, increase work throughput, and achieve efficiencies.
Actions Supporting Strategies•The Data Center Modernization (DCM) project was initiated in FY2009 to align People, Process, and Technology in conjunction with refreshing servers and storage to:
• Implement management tools to improve capacity planning and resource utilization. • Consolidate and virtualizes the data centers’ 1190 physical servers down to a target of 573 commodity dual CPU
dual core class servers.Reduces licenses costsReduces power consumption (creating a greener data center)Reduces management costs
• Migrate to new operating systems (Windows Server 2008) and databases (Microsoft SQL 2008, Oracle 11g).• Implement management tools to move to proactively monitor and manage the data center.• Implement tighter configuration management to improve operational reliability and compliance reporting.• Implement tiered storage to cost effectively meet growing data requirements.• Adopt best practices for managing and operating a consolidated and virtualized data center.
•The IT Process Maturity project is being launched to improve data center operations, moving the data center operations up the Microsoft Operation Framework, an IT Infrastructure Library based maturity model, moving from
• Basic level to the Standard level by the end of FY2011 • Standard to Rationalized by the end of FY2012
14
15
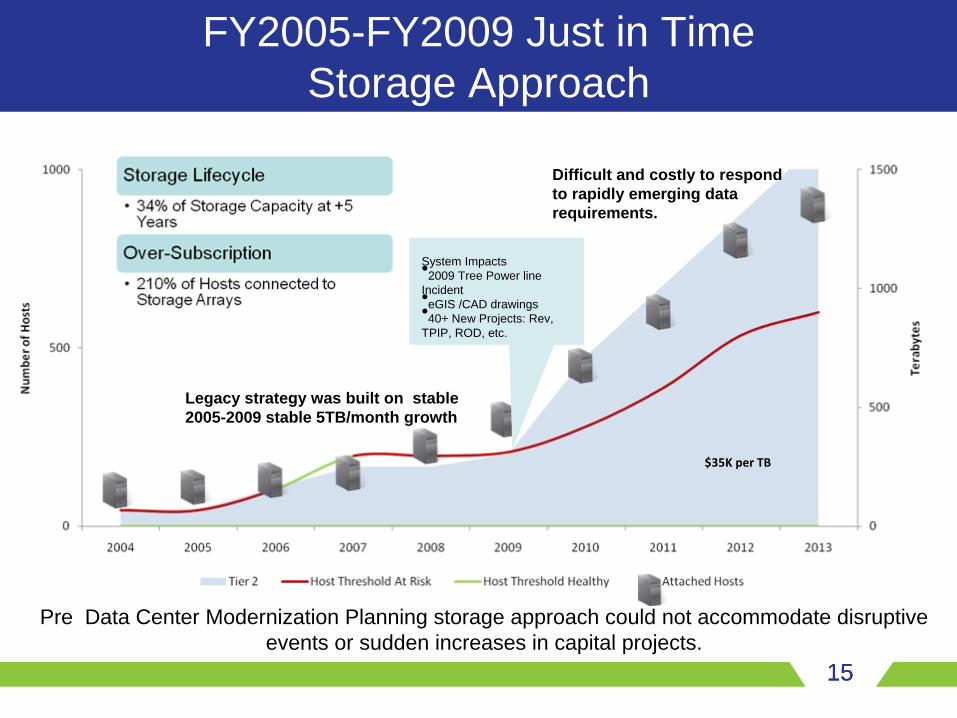
$35K per TB
System Impacts•2009 Tree Power line Incident•eGIS /CAD drawings•40+ New Projects: Rev, TPIP, ROD, etc.
Legacy strategy was built on stable2005-2009 stable 5TB/month growth
15
Pre Data Center Modernization Planning storage approach could not accommodate disruptive events or sudden increases in capital projects.
FY2005-FY2009 Just in TimeStorage Approach
Difficult and costly to respond to rapidly emerging data requirements.
16
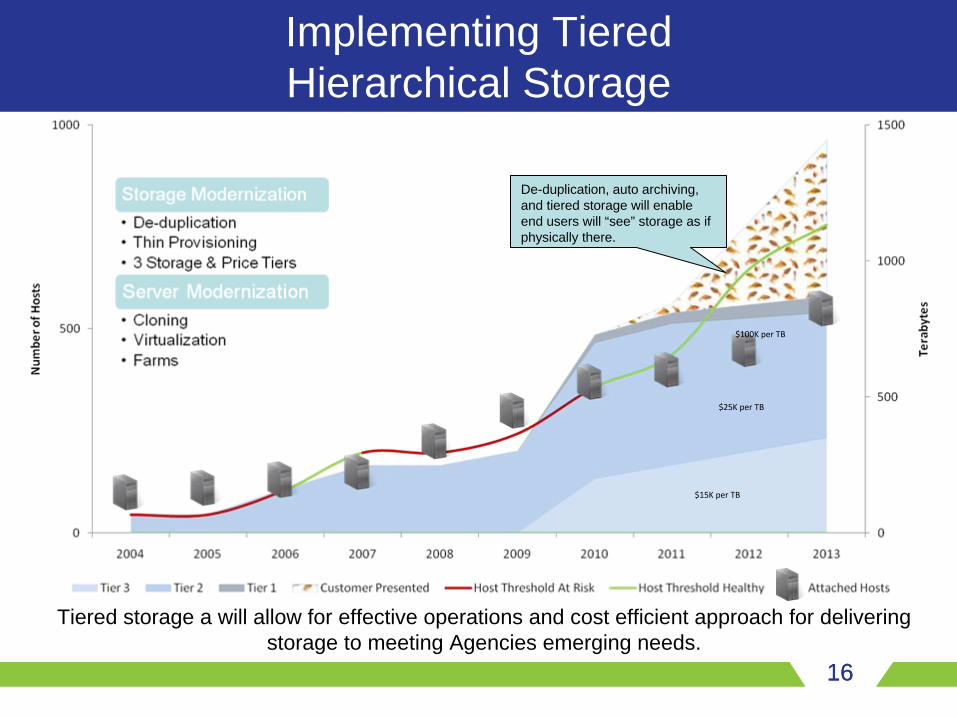
$15K per TB
$25K per TB
$100K per TB
16
Implementing Tiered Hierarchical Storage
Tiered storage a will allow for effective operations and cost efficient approach for delivering storage to meeting Agencies emerging needs.
De-duplication, auto archiving, and tiered storage will enable end users will “see” storage as if physically there.
17
Data Center Costs
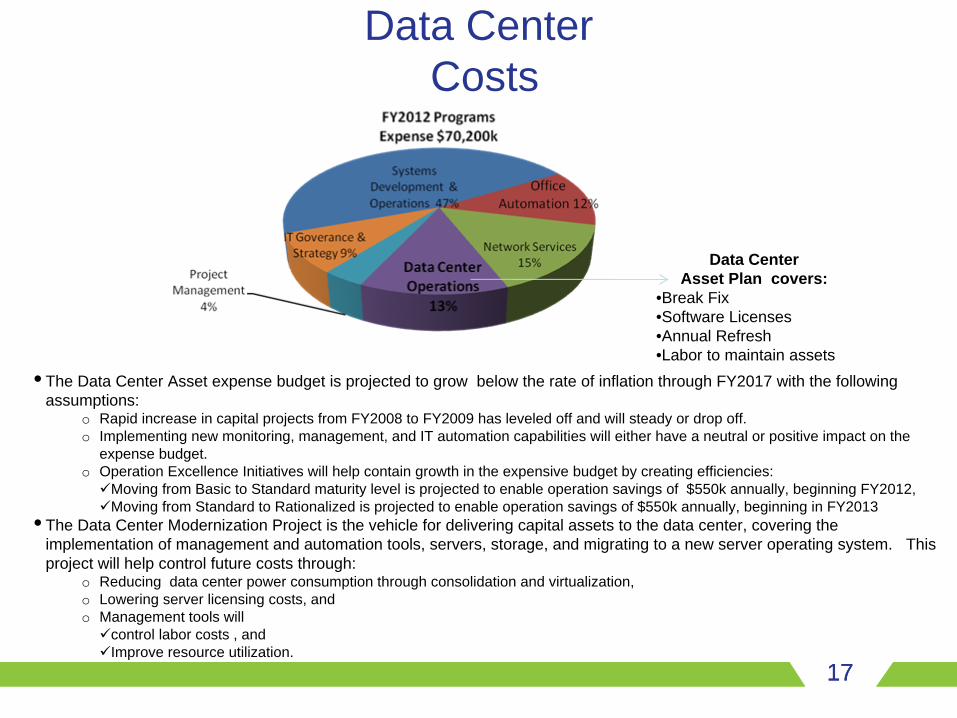
• The Data Center Asset expense budget is projected to grow below the rate of inflation through FY2017 with the following assumptions:
o Rapid increase in capital projects from FY2008 to FY2009 has leveled off and will steady or drop off. o Implementing new monitoring, management, and IT automation capabilities will either have a neutral or positive impact on the
expense budget.o Operation Excellence Initiatives will help contain growth in the expensive budget by creating efficiencies:
Moving from Basic to Standard maturity level is projected to enable operation savings of $550k annually, beginning FY2012, Moving from Standard to Rationalized is projected to enable operation savings of $550k annually, beginning in FY2013
• The Data Center Modernization Project is the vehicle for delivering capital assets to the data center, covering the implementation of management and automation tools, servers, storage, and migrating to a new server operating system. This project will help control future costs through:
o Reducing data center power consumption through consolidation and virtualization,o Lowering server licensing costs, ando Management tools will
control labor costs , andImprove resource utilization.
Data CenterAsset Plan covers:
•Break Fix•Software Licenses•Annual Refresh •Labor to maintain assets
17
18
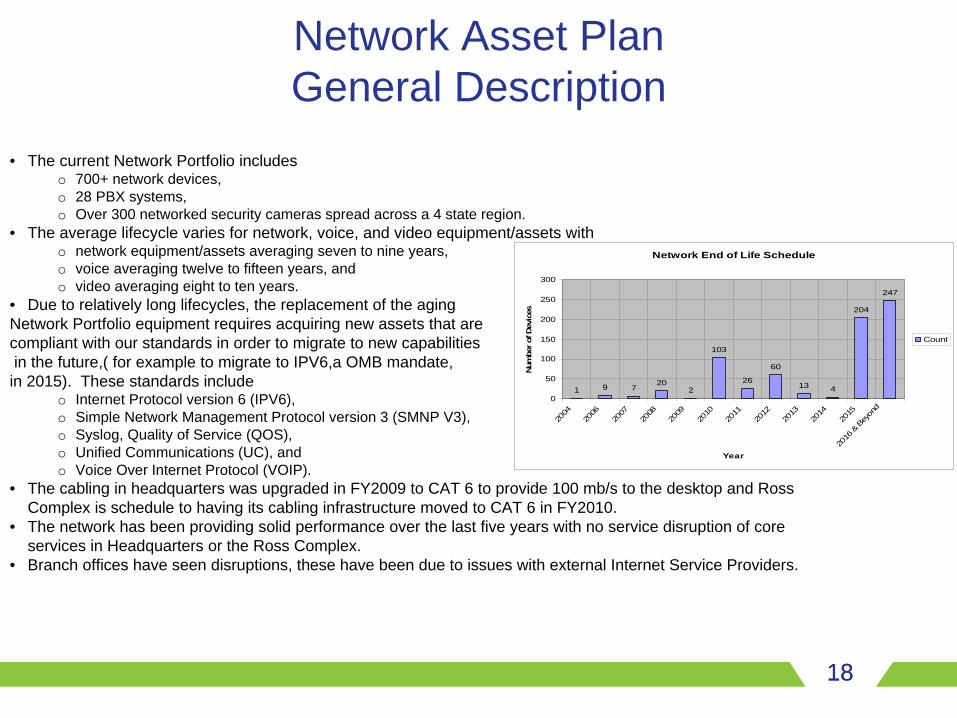
Network End of Life Schedule
1 9 720
2
103
26
60
13 4
204
247
0
50
100
150
200
250
300
2004
2006
2007
2008
2009
2010
2011
2012
2013
2014
2015
2016
& B
eyon
d
Year
Num
ber o
f Dev
ices
Count
Network Asset Plan General Description
• The current Network Portfolio includes o 700+ network devices, o 28 PBX systems, o Over 300 networked security cameras spread across a 4 state region.
• The average lifecycle varies for network, voice, and video equipment/assets with o network equipment/assets averaging seven to nine years, o voice averaging twelve to fifteen years, and o video averaging eight to ten years.
• Due to relatively long lifecycles, the replacement of the aging Network Portfolio equipment requires acquiring new assets that are compliant with our standards in order to migrate to new capabilitiesin the future,( for example to migrate to IPV6,a OMB mandate,
in 2015). These standards include o Internet Protocol version 6 (IPV6), o Simple Network Management Protocol version 3 (SMNP V3), o Syslog, Quality of Service (QOS), o Unified Communications (UC), and o Voice Over Internet Protocol (VOIP).
• The cabling in headquarters was upgraded in FY2009 to CAT 6 to provide 100 mb/s to the desktop and Ross Complex is schedule to having its cabling infrastructure moved to CAT 6 in FY2010.
• The network has been providing solid performance over the last five years with no service disruption of core services in Headquarters or the Ross Complex.
• Branch offices have seen disruptions, these have been due to issues with external Internet Service Providers.
18
19
Network Performance Objectives and Status
Network Objectives
Status Meeting Objectives
Comments
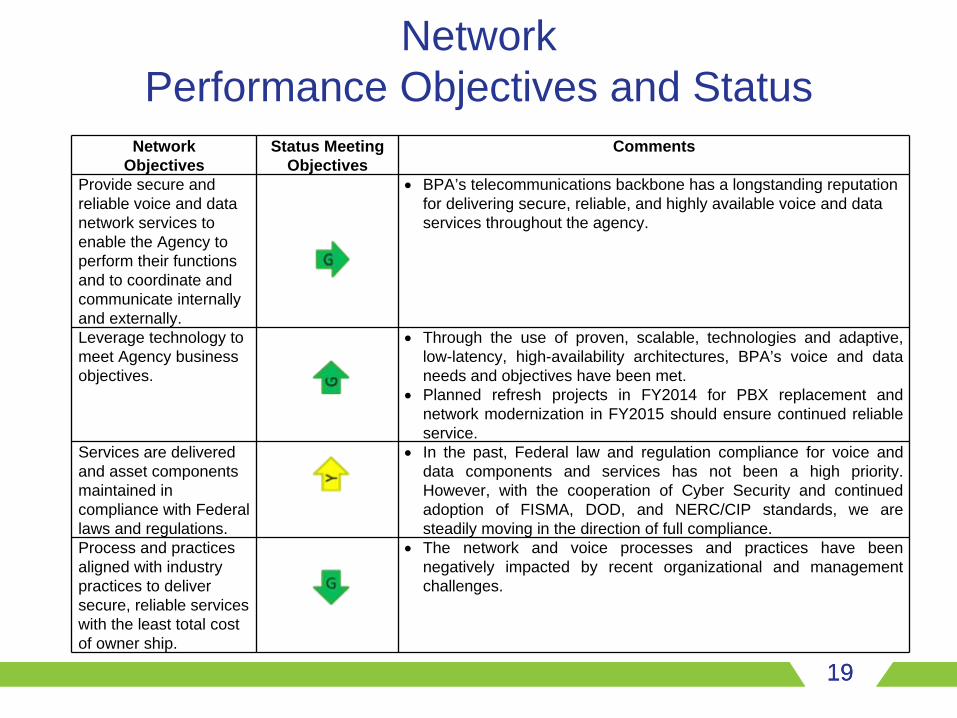
Provide secure and reliable voice and data network services to enable the Agency to perform their functions and to coordinate and communicate internally and externally.
•
BPA’s telecommunications backbone has a longstanding reputation for delivering secure, reliable, and highly available voice and data services throughout the agency.
Leverage technology to meet Agency business objectives.
•
Through the use of proven, scalable, technologies and adaptive, low-latency, high-availability architectures, BPA’s voice and data needs and objectives have been met.
•
Planned refresh projects in FY2014 for PBX replacement and network modernization in FY2015 should ensure continued reliable service.
Services are delivered and asset components maintained in compliance with Federal laws and regulations.
•
In the past, Federal law and regulation compliance for voice and data components and services has not been a high priority. However, with the cooperation of Cyber Security and continued adoption of FISMA, DOD, and NERC/CIP standards, we are steadily moving in the direction of full compliance.
Process and practices aligned with industry practices to deliver secure, reliable services with the least total cost of owner ship.
•
The network and voice processes and practices have been negatively impacted by recent organizational and management challenges.
19

20
Network Risk Map
20
Failure to adequately train staff will to ensure staff can support evolution of network to support new technologies and management techniques.
Failure to procure network components and application software to support network standards to enable the evolution of the network to support IPv6, SNMPv3, Power over Ethernet (POE), multicast, fault tolerance, and Quality of Services.
21
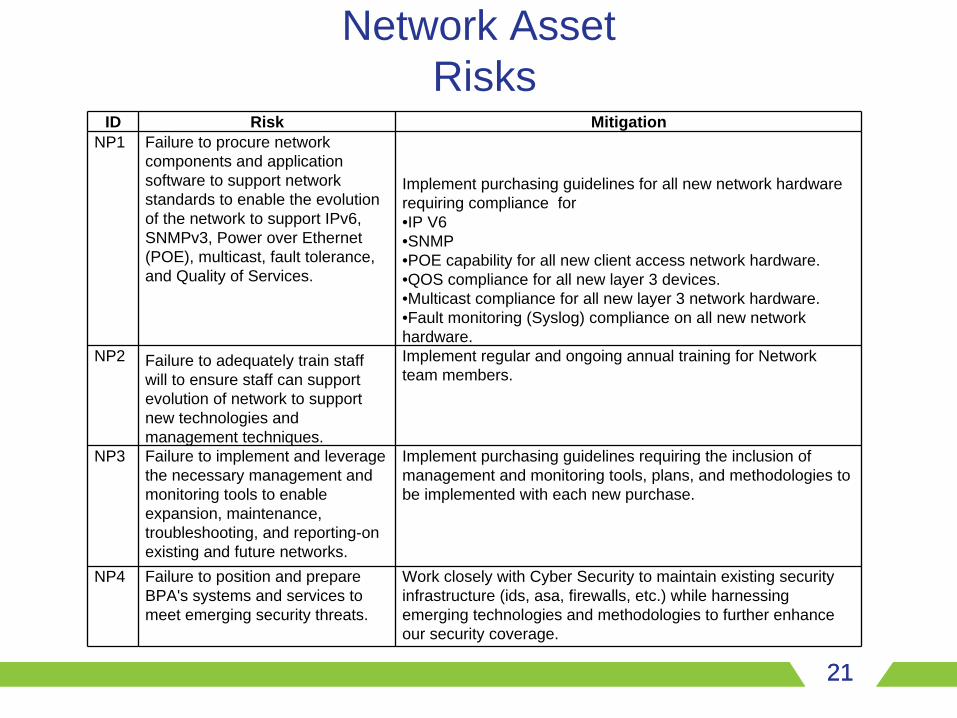
Network Asset Risks
ID Risk MitigationNP1 Failure to procure network
components and application software to support network standards to enable the evolution of the network to support IPv6, SNMPv3, Power over Ethernet (POE), multicast, fault tolerance, and Quality of Services.
Implement purchasing guidelines for all new network hardware requiring compliance for•IP V6•SNMP•POE capability for all new client access network hardware.•QOS compliance for all new layer 3 devices.•Multicast compliance for all new layer 3 network hardware.•Fault monitoring (Syslog) compliance on all new network hardware.
NP2 Failure to adequately train staff will to ensure staff can support evolution of network to support new technologies and management techniques.
Implement regular and ongoing annual training for Network team members.
NP3 Failure to implement and leverage the necessary management and monitoring tools to enable expansion, maintenance, troubleshooting, and reporting-on existing and future networks.
Implement purchasing guidelines requiring the inclusion of management and monitoring tools, plans, and methodologies to be implemented with each new purchase.
NP4 Failure to position and prepare BPA's systems and services to meet emerging security threats.
Work closely with Cyber Security to maintain existing security infrastructure (ids, asa, firewalls, etc.) while harnessing emerging technologies and methodologies to further enhance our security coverage.
21

22
Network Strategies and Actions
Strategies•Execute on establishes refresh cycles.•Leverage Technology to minimize Total Cost of Ownership (TCO).•Institutionalize Operational Excellence to improve service delivery, increase work throughput, and achieve efficiencies.
Actions Supporting Strategies•The IT Process Maturity project is being launched to improve data center operations, moving the data center operations up the Microsoft Operation Framework, an IT Infrastructure Library based maturity mode, moving from
o Basic level to the Standard level by the end of FY2011 o Standard to Rationalized by the end of FY2012
•Planning network upgrade and migration to IPv6 in the FY2015/FY2016 time frame.•Reviewing and planning upgrade of Headquarter and Ross PBX, to include supporting Voice over IP, in FY2014/FY2015 time frame. This effort may be accelerated to ensure upgrades are completed prior to next major data center modernization effort which are currently planned to begin in the FY2015 timeframe.•Exploring a small scale pilot (~$150k expense) for Voice over IP in the FY2011/FY2012 timeframe.
22
23
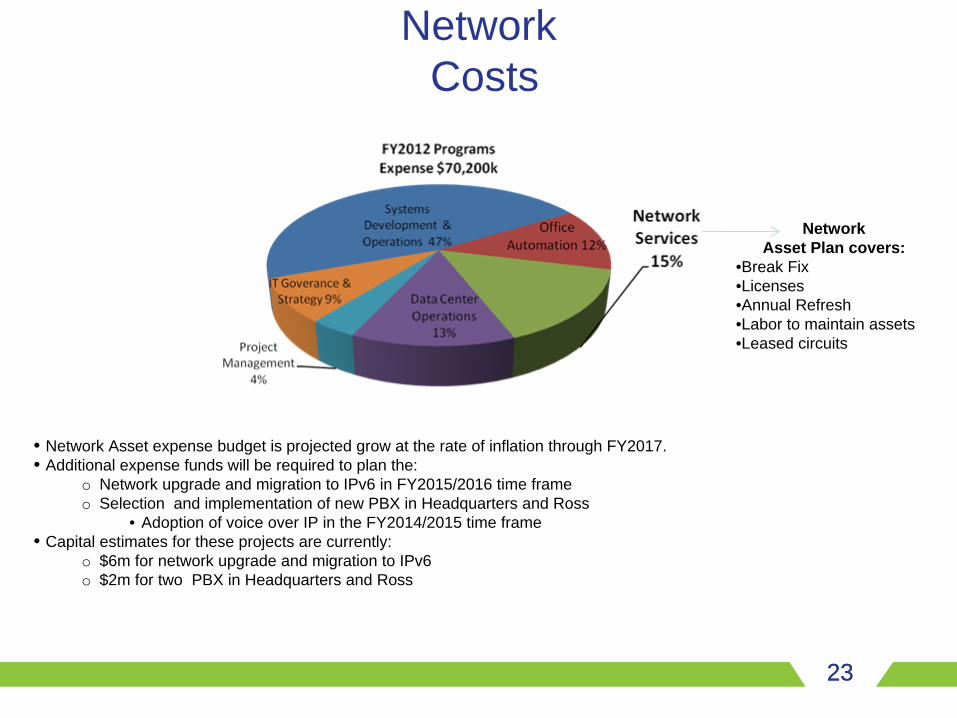
Network Costs
• Network Asset expense budget is projected grow at the rate of inflation through FY2017.• Additional expense funds will be required to plan the:
o Network upgrade and migration to IPv6 in FY2015/2016 time frameo Selection and implementation of new PBX in Headquarters and Ross
• Adoption of voice over IP in the FY2014/2015 time frame• Capital estimates for these projects are currently:
o $6m for network upgrade and migration to IPv6o $2m for two PBX in Headquarters and Ross
NetworkAsset Plan covers:
•Break Fix•Licenses•Annual Refresh •Labor to maintain assets•Leased circuits
23

24
Application Asset Plan General Description
• The major aspects of the Application Portfolio can be summarized as: o Operating, maintaining, and evolving
45 Critical Business Systems (24x7 systems) covering power and transmission marketing and scheduling functions,68 Business systems covering financial systems, fish and wildlife conservation contracts, NERC CIP security systems, and other cooperate activities and services,250+ intranet based web applicationsManaging a growing portfolio of Software As A Service solutions
o Managing a rising bar on security and compliance requirements
• IT currently allocates 47% of its expense budget to operating the Application Portfolio with 16% being allocated for enhancements such as upgrades and customization to meet new business needs.
• The Capital Work Plan also needs to be factored in when discussing the Application Portfolio. The FY2010 work plan has roughly 48 projects (the number changes as projects complete and new projects are added). This work plan will deliver
o Projected net benefit of $20m to the Agency by FY2013o 21 new systems to the Agency
Eleven new systems to the Application Portfolio in FY2010 and eight new systems in FY2011. The eleven systems that are scheduled to be delivered in FY2012 are estimated to generate an additional annual $3m operation and maintenance tail.The Eight new systems that are scheduled delivered in FY2011 are projected to generate an additional $2m in new annual operation and maintenance expense tails.
• A new trend has emerged over the last three years that needs to be accounted for in both the funding and staffing strategy for supporting the Application Portfolio. This trend is the adoption of Software as a Service (SAAS). This trend has IT contracting with a vendor to provide automated systems and services from the vendor owned and operated facilities. This introduces data integration, security and funding issues (shifting implementation from capital to expense) that need to be carefully worked out.
24
25
Application Performance Objectives and Status
Application Objectives
Status Meeting Objectives
Comments
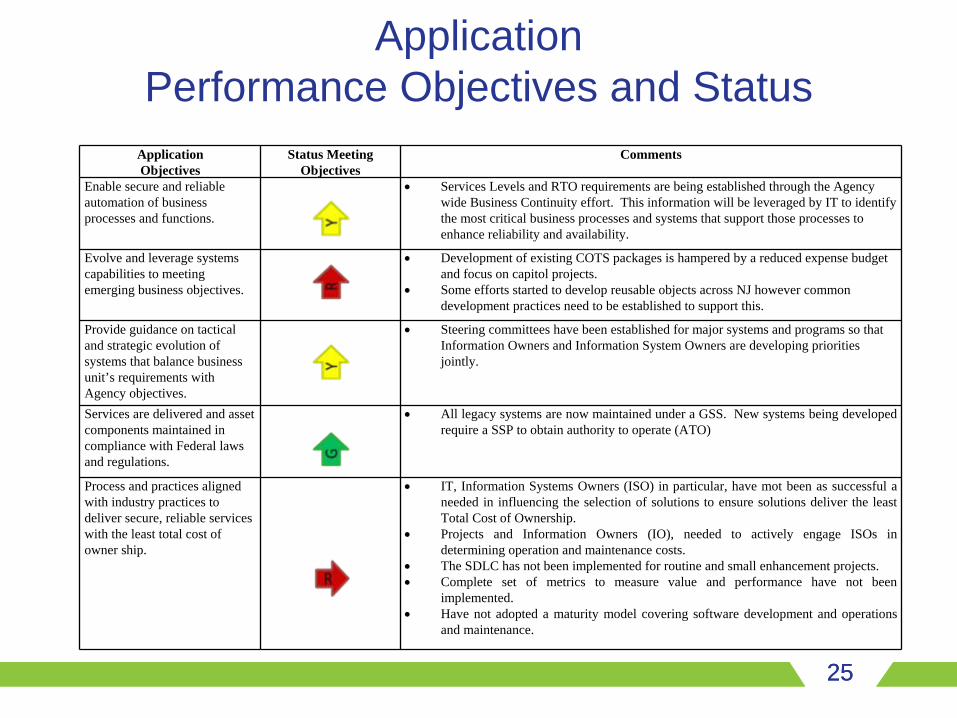
Enable secure and reliable automation of business processes and functions.
•
Services Levels and RTO requirements are being established through the Agency wide Business Continuity effort. This information will be leveraged by IT to identify the most critical business processes and systems that support those processes to enhance reliability and availability.
Evolve and leverage systems capabilities to meeting emerging business objectives.
•
Development of existing COTS packages is hampered by a reduced expense budget and focus on capitol projects.
•
Some efforts started to develop reusable objects across NJ however common development practices need to be established to support this.
Provide guidance on tactical and strategic evolution of systems that balance business unit’s requirements with Agency objectives.
•
Steering committees have been established for major systems and programs so that Information Owners and Information System Owners are developing priorities jointly.
Services are delivered and asset components maintained in compliance with Federal laws and regulations.
•
All legacy systems are now maintained under a GSS. New systems being developed require a SSP to obtain authority to operate (ATO)
Process and practices aligned with industry practices to deliver secure, reliable services with the least total cost of owner ship.
•
IT, Information Systems Owners (ISO) in particular, have mot been as successful a needed in influencing the selection of solutions to ensure solutions deliver the least Total Cost of Ownership.
•
Projects and Information Owners (IO), needed to actively engage ISOs in determining operation and maintenance costs.
•
The SDLC has not been implemented for routine and small enhancement projects.•
Complete set of metrics to measure value and performance have not been implemented.
•
Have not adopted a maturity model covering software development and operations and maintenance.
25
26
Application Risk Map
26
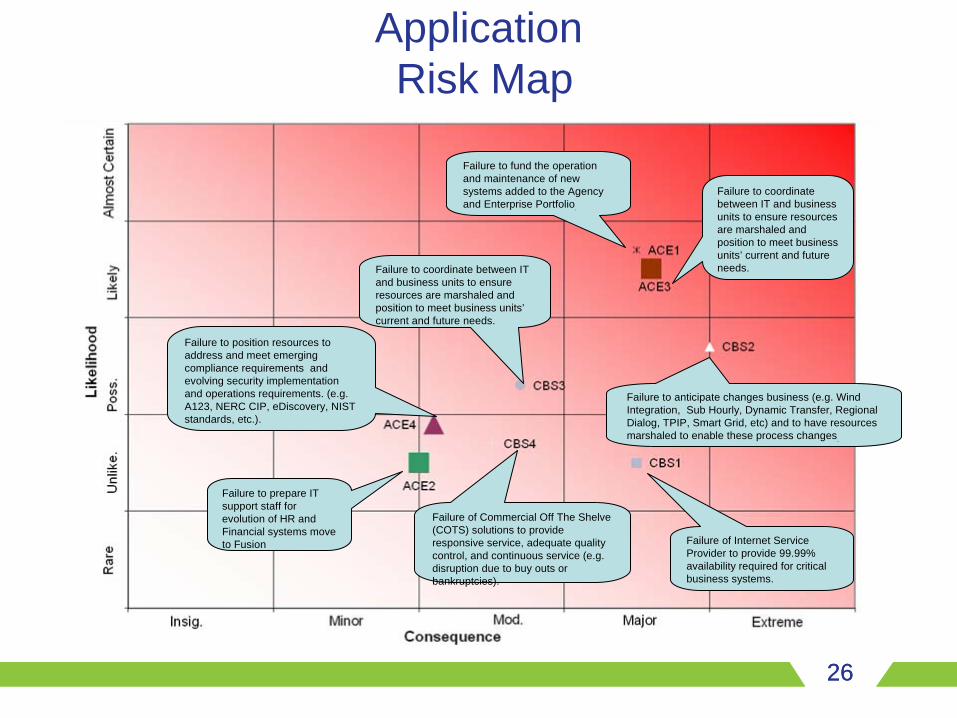
Failure to fund the operation and maintenance of new systems added to the Agency and Enterprise Portfolio.
Failure to coordinate between IT and business units to ensure resources are marshaled and position to meet business units’ current and future needs.
Failure to anticipate changes business (e.g. Wind Integration, Sub Hourly, Dynamic Transfer, Regional Dialog, TPIP, Smart Grid, etc) and to have resources marshaled to enable these process changes.
Failure of Internet Service Provider to provide 99.99% availability required for critical business systems.
Failure of Commercial Off The Shelve (COTS) solutions to provide responsive service, adequate quality control, and continuous service (e.g. disruption due to buy outs or bankruptcies).
Failure to coordinate between IT and business units to ensure resources are marshaled and position to meet business units’ current and future needs.
Failure to position resources to address and meet emerging compliance requirements and evolving security implementation and operations requirements. (e.g. A123, NERC CIP, eDiscovery, NIST standards, etc.).
Failure to prepare IT support staff for evolution of HR and Financial systems move to Fusion
27
Application Asset Risks (Critical Business Systems)
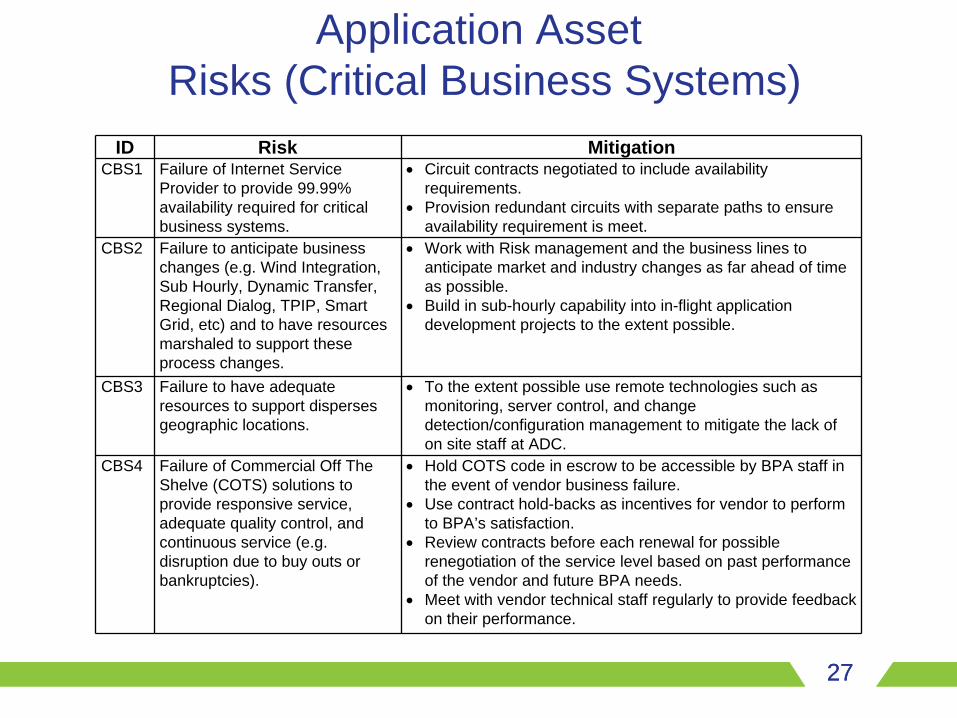
ID Risk MitigationCBS1 Failure of Internet Service
Provider to provide 99.99% availability required for critical business systems.
•
Circuit contracts negotiated to include availability requirements.
•
Provision redundant circuits with separate paths to ensure availability requirement is meet.
CBS2 Failure to anticipate business changes (e.g. Wind Integration, Sub Hourly, Dynamic Transfer, Regional Dialog, TPIP, Smart Grid, etc) and to have resources marshaled to support these process changes.
•
Work with Risk management and the business lines to anticipate market and industry changes as far ahead of time as possible.
•
Build in sub-hourly capability into in-flight application development projects to the extent possible.
CBS3 Failure to have adequate resources to support disperses geographic locations.
•
To the extent possible use remote technologies such as monitoring, server control, and change detection/configuration management to mitigate the lack of on site staff at ADC.
CBS4 Failure of Commercial Off The Shelve (COTS) solutions to provide responsive service, adequate quality control, and continuous service (e.g. disruption due to buy outs or bankruptcies).
•
Hold COTS code in escrow to be accessible by BPA staff in the event of vendor business failure.
•
Use contract hold-backs as incentives for vendor to perform to BPA’s satisfaction.
•
Review contracts before each renewal for possible renegotiation of the service level based on past performance of the vendor and future BPA needs.
•
Meet with vendor technical staff regularly to provide feedback on their performance.
27
28
Application Asset Risks (Agency Commercial Enterprise)
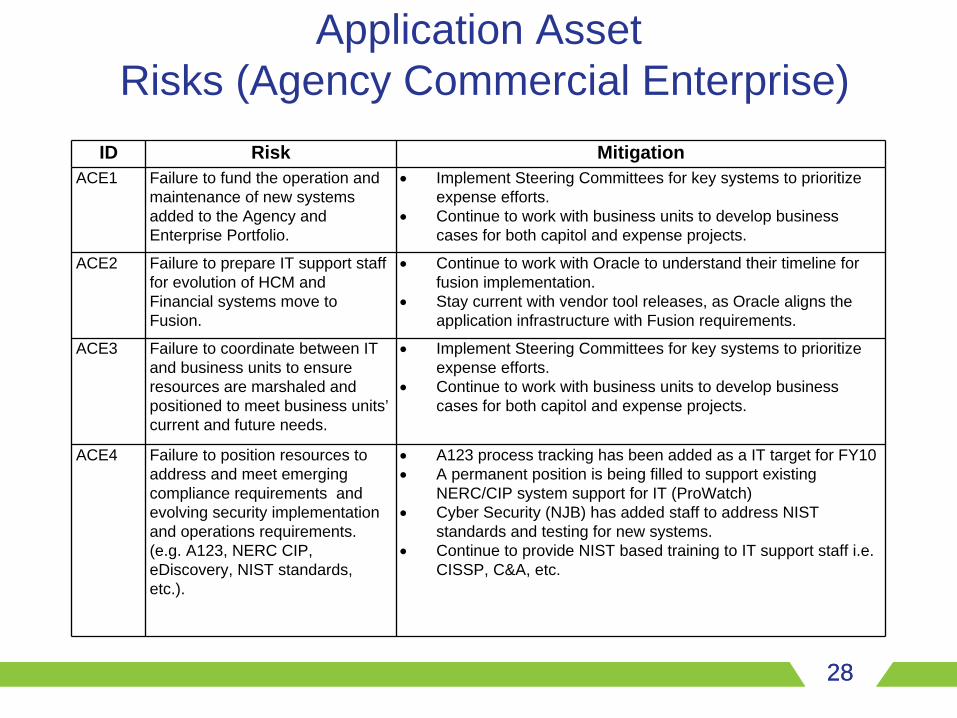
ID Risk MitigationACE1 Failure to fund the operation and
maintenance of new systems added to the Agency and Enterprise Portfolio.
•
Implement Steering Committees for key systems to prioritize expense efforts.
•
Continue to work with business units to develop business cases for both capitol and expense projects.
ACE2 Failure to prepare IT support staff for evolution of HCM and Financial systems move to Fusion.
•
Continue to work with Oracle to understand their timeline for fusion implementation.
•
Stay current with vendor tool releases, as Oracle aligns the application infrastructure with Fusion requirements.
ACE3 Failure to coordinate between IT and business units to ensure resources are marshaled and positioned to meet business units’ current and future needs.
•
Implement Steering Committees for key systems to prioritize expense efforts.
•
Continue to work with business units to develop business cases for both capitol and expense projects.
ACE4 Failure to position resources to address and meet emerging compliance requirements and evolving security implementation and operations requirements. (e.g. A123, NERC CIP, eDiscovery, NIST standards, etc.).
•
A123 process tracking has been added as a IT target for FY10•
A permanent position is being filled to support existing NERC/CIP system support for IT (ProWatch)
•
Cyber Security (NJB) has added staff to address NIST standards and testing for new systems.
•
Continue to provide NIST based training to IT support staff i.e. CISSP, C&A, etc.
28
29
Application Strategies and Actions
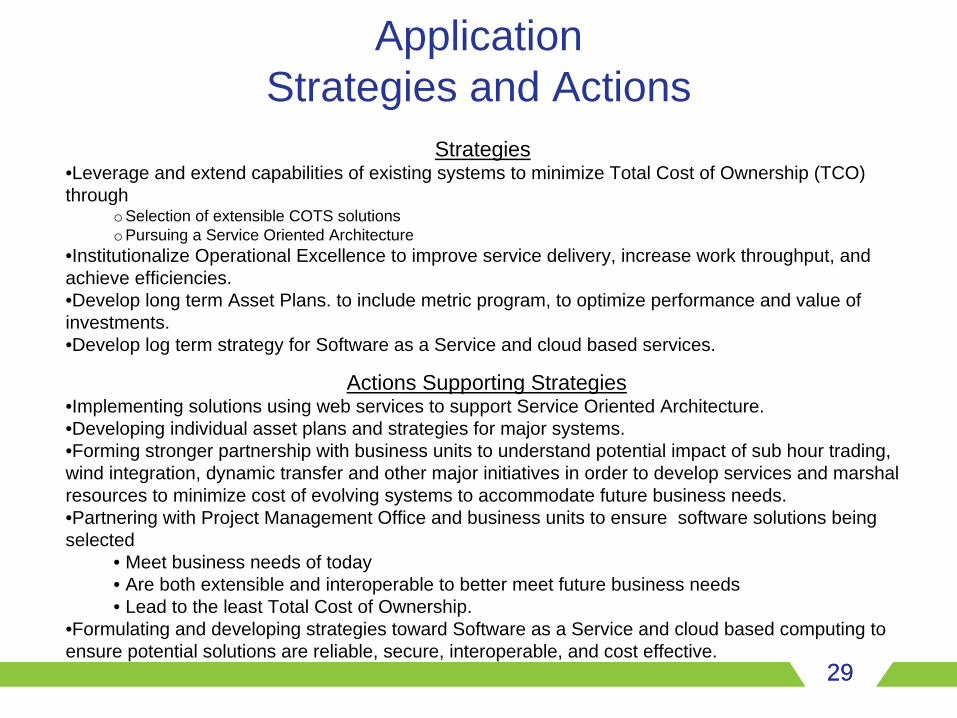
Strategies•Leverage and extend capabilities of existing systems to minimize Total Cost of Ownership (TCO) through
o Selection of extensible COTS solutionso Pursuing a Service Oriented Architecture
•Institutionalize Operational Excellence to improve service delivery, increase work throughput, and achieve efficiencies. •Develop long term Asset Plans. to include metric program, to optimize performance and value of investments.•Develop log term strategy for Software as a Service and cloud based services.
Actions Supporting Strategies•Implementing solutions using web services to support Service Oriented Architecture.•Developing individual asset plans and strategies for major systems.•Forming stronger partnership with business units to understand potential impact of sub hour trading, wind integration, dynamic transfer and other major initiatives in order to develop services and marshal resources to minimize cost of evolving systems to accommodate future business needs.•Partnering with Project Management Office and business units to ensure software solutions being selected
• Meet business needs of today • Are both extensible and interoperable to better meet future business needs• Lead to the least Total Cost of Ownership.
•Formulating and developing strategies toward Software as a Service and cloud based computing to ensure potential solutions are reliable, secure, interoperable, and cost effective.
29

30
Application Portfolio Costs
• Majority of capital projects are delivering systems with new capabilities as opposed to replacing existing systems. These new systems are generating an average growth of 2.5% in the operation and maintenance costs for the Application Asset Plan per million invested. This is an accumulative growth in operation and maintenance costs.
o The FY2010 work plan has roughly 48 projects (the number changes as projects complete and new projects are added). This work plan will deliver :
Projected net benefit of $20m to the Agency by FY201321 new systems to the Agency
• Eleven new systems to the Application Portfolio in FY2010 and eight new systems in FY2011. These eleven systems are estimated to generate an additional annual $3m operation and maintenance tail.
• Eight new systems are scheduled delivered in FY2011 are projected to generate an additional $2m in new annual operation and maintenance expense tails.
• Software as a Service (SAAS) is a growing component for the Applications Portfolio expense budget (projected to grow from 7% of the Systems Development & Operation expense budget in FY2012 to 9% by FY2017)
o Existing SAAS solutions are projected to cost $5.5M in FY2012 ando Existing SAAS solutions are projected to cost $5.M in FY2013 and then grow to $7M by FY2017.
Emerging business requiring enhancements to existing SAAS may cause an additional increase in expense SAAS costs.Adopting new SAAS solutions will reduce capital resource requirements while increasing expense requirements above current projections.
ApplicationAsset Plan•Enhancements•Software Licenses•Annual Refresh •Labor to maintain assets•Software As A Service
30
31
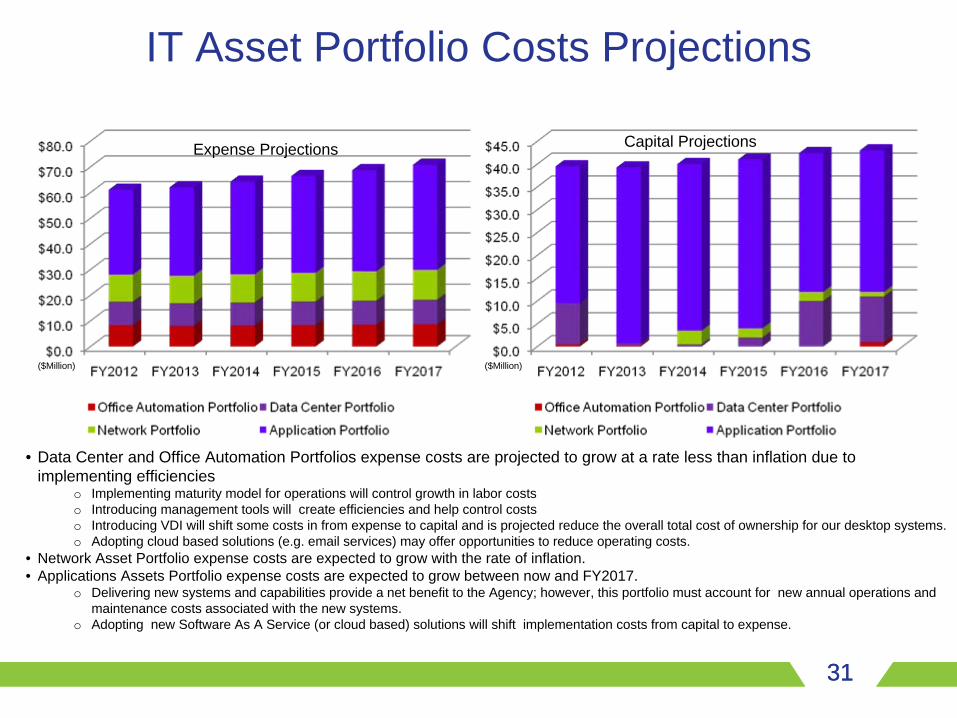
IT Asset Portfolio Costs Projections
Expense Projections Capital Projections
• Data Center and Office Automation Portfolios expense costs are projected to grow at a rate less than inflation due to implementing efficiencies
o Implementing maturity model for operations will control growth in labor costso Introducing management tools will create efficiencies and help control costso Introducing VDI will shift some costs in from expense to capital and is projected reduce the overall total cost of ownership for our desktop systems.o Adopting cloud based solutions (e.g. email services) may offer opportunities to reduce operating costs.
• Network Asset Portfolio expense costs are expected to grow with the rate of inflation.• Applications Assets Portfolio expense costs are expected to grow between now and FY2017.
o Delivering new systems and capabilities provide a net benefit to the Agency; however, this portfolio must account for new annual operations and maintenance costs associated with the new systems.
o Adopting new Software As A Service (or cloud based) solutions will shift implementation costs from capital to expense.
31
($Million) ($Million)
32
Next Steps
33
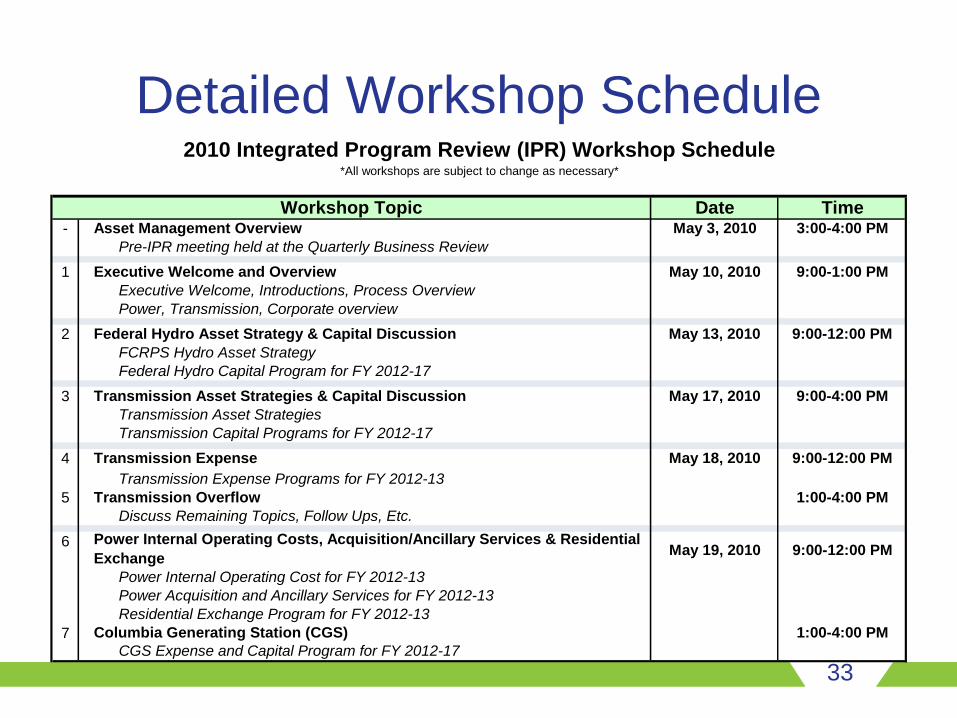
Detailed Workshop Schedule
Date Time- May 3, 2010 3:00-4:00 PM
Pre-IPR meeting held at the Quarterly Business Review
1 Executive Welcome and Overview May 10, 2010 9:00-1:00 PMExecutive Welcome, Introductions, Process OverviewPower, Transmission, Corporate overview
2 Federal Hydro Asset Strategy & Capital Discussion May 13, 2010 9:00-12:00 PMFCRPS Hydro Asset StrategyFederal Hydro Capital Program for FY 2012-17
3 Transmission Asset Strategies & Capital Discussion May 17, 2010 9:00-4:00 PMTransmission Asset Strategies Transmission Capital Programs for FY 2012-17
4 Transmission Expense May 18, 2010 9:00-12:00 PMTransmission Expense Programs for FY 2012-13
5 Transmission Overflow 1:00-4:00 PMDiscuss Remaining Topics, Follow Ups, Etc.
6 May 19, 2010 9:00-12:00 PM
Power Internal Operating Cost for FY 2012-13Power Acquisition and Ancillary Services for FY 2012-13Residential Exchange Program for FY 2012-13
7 1:00-4:00 PMCGS Expense and Capital Program for FY 2012-17
Asset Management Overview
Power Internal Operating Costs, Acquisition/Ancillary Services & Residential Exchange
Columbia Generating Station (CGS)
2010 Integrated Program Review (IPR) Workshop Schedule*All workshops are subject to change as necessary*
Workshop Topic
34
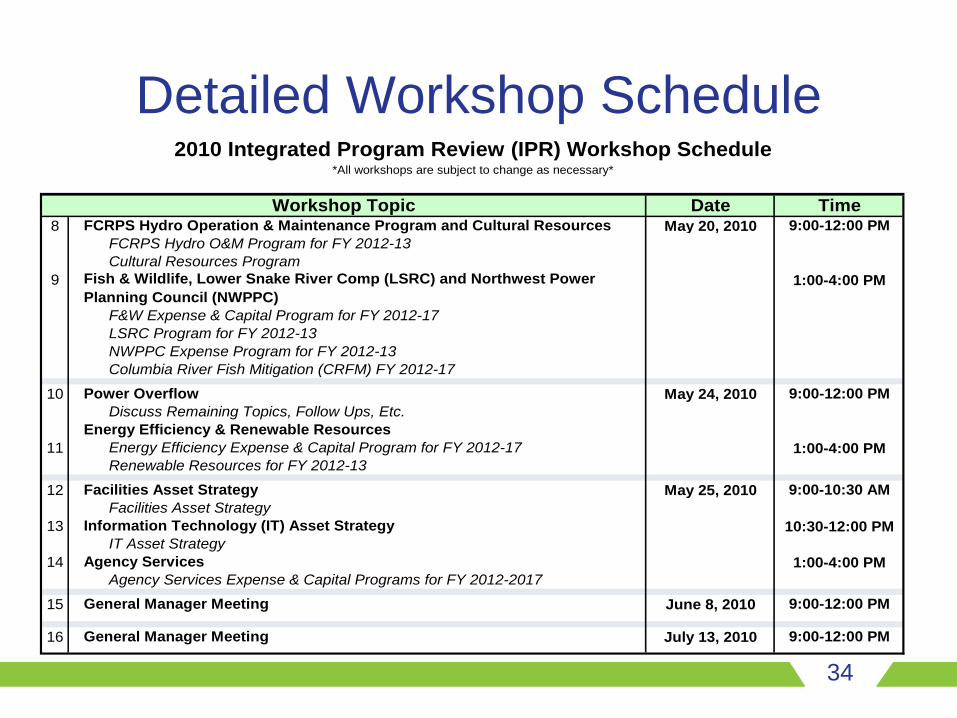
Detailed Workshop Schedule
Date Time8 FCRPS Hydro Operation & Maintenance Program and Cultural Resources May 20, 2010 9:00-12:00 PM
FCRPS Hydro O&M Program for FY 2012-13Cultural Resources Program
9 1:00-4:00 PM
F&W Expense & Capital Program for FY 2012-17LSRC Program for FY 2012-13NWPPC Expense Program for FY 2012-13Columbia River Fish Mitigation (CRFM) FY 2012-17
10 May 24, 2010 9:00-12:00 PMDiscuss Remaining Topics, Follow Ups, Etc.
Energy Efficiency & Renewable Resources11 Energy Efficiency Expense & Capital Program for FY 2012-17 1:00-4:00 PM
Renewable Resources for FY 2012-13
12 Facilities Asset Strategy May 25, 2010 9:00-10:30 AMFacilities Asset Strategy
13 10:30-12:00 PMIT Asset Strategy
14 1:00-4:00 PMAgency Services Expense & Capital Programs for FY 2012-2017
15 General Manager Meeting June 8, 2010 9:00-12:00 PM
16 General Manager Meeting July 13, 2010 9:00-12:00 PM
Information Technology (IT) Asset Strategy
Agency Services
Fish & Wildlife, Lower Snake River Comp (LSRC) and Northwest Power Planning Council (NWPPC)
2010 Integrated Program Review (IPR) Workshop Schedule*All workshops are subject to change as necessary*
Workshop Topic
Power Overflow
35
Ways to ParticipateAll forums are open to the public and will be noticed on the Integrated Program Review (IPR) external website at: http://www.bpa.gov/corporate/Finance/IBR/IPR/.
Representatives from the Corps of Engineers, Bureau of Reclamation and Energy Northwest will be participating in the IPR process including presentations.
All technical and managerial workshops will be held at BPA Headquarters.
If participating by phone please dial into the bridge at 503-230-5566, then any time during or after the message and the double beep, enter 3981#. Presentation material will be posted on the IPR external website prior to the workshop taking place.
The IPR process will include a public comment period for proposed program spending levels. The comment period opens May 10, 2010 and will close on July 29, 2010.
Comments can be submitted at any of the scheduled workshops or submitted in writing to:
– Bonneville Power Administration, P.O. Box 14428, Portland, OR 97293-4428,
– Email to [email protected],
– Faxed to (503) 230-3285
36
BPA’s Financial Disclosure InformationAll FY 2010-2017 information has been made publicly available by BPA on May 21, 2010 and does not contain Agency-approved Financial Information.
All FY 2009 information has been made publicly available by BPA and contains Agency-approved Financial Information.
All FY 2011 Rate Case data has been developed for publication in rates proceeding documents and is being provided by BPA.