Information Retrieval and Web Search Lecture 8: Evaluation
32
Introduction to Information Retrieval Introduction to Information Retrieval Information Retrieval and Web Search Lecture 8: Evaluation
description
Information Retrieval and Web Search Lecture 8: Evaluation. Sec. 6.2. This lecture. How do we know if our results are any good? Evaluating a search engine Results summaries: Making our good results usable to a user. Evaluating search engines. Sec. 8.6. Measures for a search engine. - PowerPoint PPT Presentation
Transcript of Information Retrieval and Web Search Lecture 8: Evaluation

Introduction to Information Retrieval
Introduction to
Information Retrieval
Information Retrieval and Web Search
Lecture 8: Evaluation

Introduction to Information Retrieval
2
This lecture How do we know if our results are any good?
Evaluating a search engine
Results summaries: Making our good results usable to a user
Sec. 6.2

Introduction to Information Retrieval
EVALUATING SEARCH ENGINES
Introduction to Information Retrieval
4
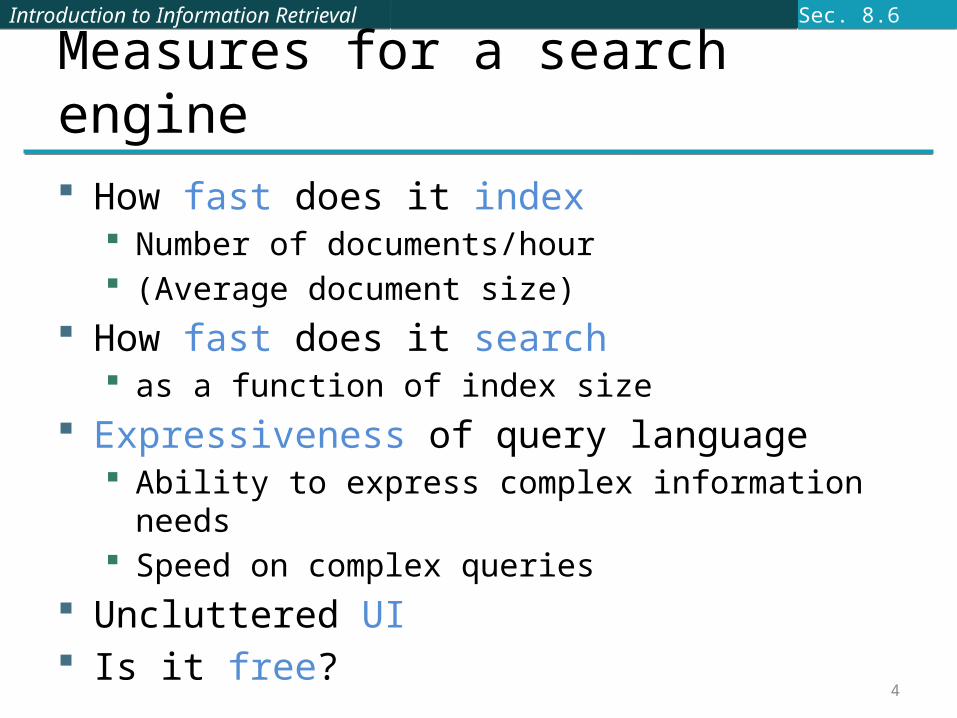
Measures for a search engine How fast does it index
Number of documents/hour (Average document size)
How fast does it search as a function of index size
Expressiveness of query language Ability to express complex information needs Speed on complex queries
Uncluttered UI Is it free?
Sec. 8.6

Introduction to Information Retrieval
5
Measures for a search engine The key measure: user happiness
Speed of response/size of index are factors But blindingly fast, useless answers won’t make a user
happy Need a way of quantifying user happiness
Sec. 8.6

Introduction to Information Retrieval
6
Measuring user happiness Issue: who is the user we are trying to make happy?
Web engine: User finds what s/he wants and returns to the engine
Can measure rate of return users http://dmrussell.googlepages.com/JCDL-talk-June-2007-short.pdf
eCommerce site: user finds what s/he wants and buys Measure time to purchase, or fraction of searchers who
become buyers?
Sec. 8.6.2

Introduction to Information Retrieval
7
Measuring user happiness Enterprise (company/govt/academic):
Care about “user productivity” How much time do my users save when looking
for information?
Sec. 8.6.2

Introduction to Information Retrieval
8
Happiness: elusive to measure
Most common proxy: relevance of search results But how do you measure relevance?
We will detail a methodology here, then examine its issues
Relevance measurement requires 3 elements:1. A benchmark document collection2. A benchmark suite of queries3. A usually binary assessment of either Relevant or
Nonrelevant for each query and each document
Sec. 8.1

Introduction to Information Retrieval
9
Evaluating an IR system Note: the information need is translated into a query Relevance is assessed relative to the information
need not the query E.g., Information need: I'm looking for information on
whether eating vegetable is more effective at reducing your risk of heart attacks than meat.
Query: vegetable meat heart attack effective Evaluate whether the doc addresses the information
need, not whether it has these words
Sec. 8.1

Introduction to Information Retrieval
10
Standard relevance benchmarks TREC - National Institute of Standards and
Technology (NIST) has run a large IR test bed for many years
Human experts mark, for each query and for each doc, Relevant or Nonrelevant
Sec. 8.2

Introduction to Information Retrieval
11
Unranked retrieval evaluation:Precision and Recall Precision: fraction of retrieved docs that are relevant
= P(relevant|retrieved) Recall: fraction of relevant docs that are retrieved
= P(retrieved|relevant)
Precision P = tp/(tp + fp) Recall R = tp/(tp + fn)
Relevant Nonrelevant
Retrieved tp fp
Not Retrieved fn tn
Sec. 8.3

Introduction to Information Retrieval
12
Should we instead use the accuracy measure for evaluation? Given a query, an engine classifies each doc as
“Relevant” or “Nonrelevant” The accuracy of an engine: the fraction of these
classifications that are correct (tp + tn) / ( tp + fp + fn + tn)
Accuracy is a commonly used evaluation measure in machine learning classification work
Why is this not a very useful evaluation measure in IR?
Sec. 8.3

Introduction to Information Retrieval
13
Why not just use accuracy? How to build a 99.9999% accurate search engine on a
low budget….
Search for: 0 matching results found.
Sec. 8.3

Introduction to Information Retrieval
14
Precision/Recall
You can get high recall (but low precision) by retrieving all docs for all queries!
Recall is a non-decreasing function of the number of docs retrieved
In a good system, precision decreases as either the number of docs retrieved or recall increases This is not a theorem, but a result with strong empirical
confirmation
Sec. 8.3

Introduction to Information Retrieval
15
Combined measures
Combined Measures
0
20
40
60
80
100
0 20 40 60 80 100
Precision (Recall fixed at 70%)
Minimum
Maximum
Arithmetic
Geometric
Harmonic
Sec. 8.3

Introduction to Information Retrieval
16
A combined measure: F
RPPR
RP
F
2
2 )1(1)1(1
1
Sec. 8.3

Introduction to Information Retrieval
17
Evaluating ranked results Evaluation of ranked results:
The system can return any number of results By taking various numbers of the top returned documents
(levels of recall), the evaluator can produce a precision-recall curve
Sec. 8.4
Introduction to Information Retrieval
18
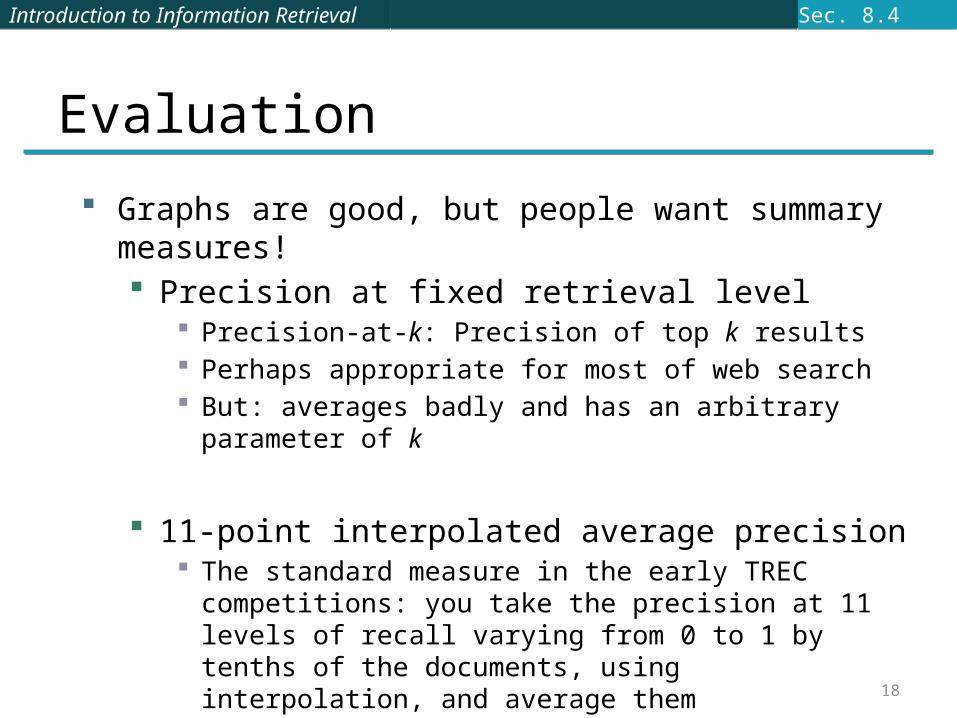
Evaluation Graphs are good, but people want summary measures!
Precision at fixed retrieval level Precision-at-k: Precision of top k results Perhaps appropriate for most of web search But: averages badly and has an arbitrary parameter of k
11-point interpolated average precision The standard measure in the early TREC competitions: you take
the precision at 11 levels of recall varying from 0 to 1 by tenths of the documents, using interpolation, and average them
Sec. 8.4

Introduction to Information Retrieval
19
Typical (good) 11 point precisions
0
0.2
0.4
0.6
0.8
1
0 0.2 0.4 0.6 0.8 1
Recall
Prec
isio
n
Sec. 8.4

Introduction to Information Retrieval
CREATING TEST COLLECTIONSFOR IR EVALUATION

Introduction to Information Retrieval
21
Test Collections
Sec. 8.5

Introduction to Information Retrieval
22
From document collections to test collections Still need
Test queries Relevance assessments
Test queries Must be germane to docs available Best designed by domain experts Random query terms generally not a good idea
Relevance assessments Human judges, time-consuming
Sec. 8.5

Introduction to Information Retrieval
23
Kappa measure for inter-judge (dis)agreement
Kappa measure Agreement measure among judges Corrects for chance agreement
Kappa = [ P(A) – P(E) ] / [ 1 – P(E) ] P(A) – proportion of time judges agree P(E) – what agreement would be by chance Kappa = 0 for chance agreement, 1 for total agreement.
Sec. 8.5

Introduction to Information Retrieval
24
Kappa Measure: Example
Number of docs Judge 1 Judge 2
300 Relevant Relevant
70 Nonrelevant Nonrelevant
20 Relevant Nonrelevant
10 Nonrelevant Relevant
Sec. 8.5

Introduction to Information Retrieval
25
Kappa Example
P(A) = 370/400 = 0.925 P(nonrelevant) = (10+20+70+70)/800 = 0.2125 P(relevant) = (10+20+300+300)/800 = 0.7878 P(E) = 0.2125^2 + 0.7878^2 = 0.665 Kappa = (0.925 – 0.665)/(1-0.665) = 0.776
For >2 judges: average pairwise kappas
Sec. 8.5

Introduction to Information Retrieval
RESULTS PRESENTATION
26
Sec. 8.7

Introduction to Information Retrieval
27
Result Summaries Having ranked the documents matching a query, we
wish to present a results list Most commonly, a list of the document titles plus a
short summary, aka “10 blue links”
Sec. 8.7

Introduction to Information Retrieval
28
Summaries The title is often automatically extracted from document
metadata. What about the summaries? This description is crucial. User can identify good/relevant hits based on description.
Two basic kinds: Static Dynamic
A static summary of a document is always the same, regardless of the query that hit the doc
A dynamic summary is a query-dependent attempt to explain why the document was retrieved for the query at hand
Sec. 8.7

Introduction to Information Retrieval
29
Static summaries In typical systems, the static summary is a subset of
the document Simplest heuristic: the first 50 (or so – this can be
varied) words of the document Summary cached at indexing time
More sophisticated: extract from each document a set of “key” sentences Simple NLP heuristics to score each sentence Summary is made up of top-scoring sentences.
Most sophisticated: NLP used to synthesize a summary Seldom used in IR
Sec. 8.7

Introduction to Information Retrieval
30
Dynamic summaries Present one or more “windows” within the document that
contain several of the query terms
Sec. 8.7

Introduction to Information Retrieval
Techniques for dynamic summaries Find small windows in doc that contain query terms
Requires fast window lookup in a document cache Score each window wrt query
Use various features such as window width, position in document, etc.
Combine features through a scoring function
31
Sec. 8.7

Introduction to Information Retrieval
32
Resources for this lecture IIR 8 MIR Chapter 3 MG 4.5 Carbonell and Goldstein 1998. The use of MMR,
diversity-based reranking for reordering documents and producing summaries. SIGIR 21.