INFORMATION, KNOWLEDGE, AND DEMAND FOR …€¦ · INPUTS: EXPERIMENTAL EVIDENCE OF PESTICIDE USE...
205
INFORMATION, KNOWLEDGE, AND DEMAND FOR SUBSTITUTE HEALTH INPUTS: EXPERIMENTAL EVIDENCE OF PESTICIDE USE IN ZAMBIA By Joseph Christopher Goeb A DISSERTATION Submitted to Michigan State University in partial fulfillment of the requirements for the degree of Agricultural, Food, and Resource Economics – Doctor of Philosophy 2017
Transcript of INFORMATION, KNOWLEDGE, AND DEMAND FOR …€¦ · INPUTS: EXPERIMENTAL EVIDENCE OF PESTICIDE USE...
INFORMATION, KNOWLEDGE, AND DEMAND FOR SUBSTITUTE HEALTH
INPUTS: EXPERIMENTAL EVIDENCE OF PESTICIDE USE IN ZAMBIA
By
Joseph Christopher Goeb
A DISSERTATION
Submitted to Michigan State University
in partial fulfillment of the requirements for the degree of
Agricultural, Food, and Resource Economics – Doctor of Philosophy
2017

ABSTRACT
INFORMATION, KNOWLEDGE, AND DEMAND FOR SUBSTITUTE HEALTH INPUTS: EXPERIMENTAL EVIDENCE OF PESTICIDE USE IN ZAMBIA
By
Joseph Christopher Goeb
Many goods carry health risks that have important impacts on demand and behavior.
However, the risks are rarely transparent and, as a result, consumers often have incomplete
knowledge of the health risks associated with many of their consumption decisions. This can
lead to inefficient behavior. With that in mind, economists have studied the impacts of risk
information on consumer behavior, though the effects are rarely straightforward as there may be
risk compensation and substitution effects across inputs and behaviors. This dissertation tests the
effects of information on knowledge and demand for two substitute health inputs using a
randomized control trial of pesticide users in rural Zambia.
Essay 1 contributes to the broader literature on information, knowledge, and preventative
health demands, and to the pesticide safety literature by presenting the first randomly controlled
test of the impacts of pesticide safety information on willingness-to-pay (WTP) for personal
protective equipment (PPE) measured using two Becker-DeGroot-Marschak mechanisms.
Despite knowledge improvements from the training, overall effects on demand for PPE were
insignificant. We also find that demand for both gloves and masks is highly elastic near their
market prices.
Essay 2 shows that information significantly changed pesticide choices, which were
assessed using stated choice experiments and actual purchase decisions before and after the
information intervention. We find that farmers held an erroneous positive price-quality
perception for pesticides prior to receiving information, and that information effectively broke

that perception. Importantly for health, farmers chose less toxic pesticides more often after
receiving information on relative toxicities and health risks.
Essay 3 presents a detailed assessment of farmer pesticide knowledge using 22 questions
covering pesticide control properties and health risks. We find that Zambian tomato farmers
generally know pesticides are harmful to their health, but they lack product-specific knowledge
on pesticide toxicity and pesticide control properties. The training program caused an increase in
overall pesticide knowledge with large increases in toxicity knowledge, pest control knowledge,
and pesticide efficacy knowledge. The effects of information on protective equipment knowledge
were insignificant.
Copyright by JOSEPH CHRISTOPHER GOEB 2017

v
This dissertation is dedicated to my Joy.
vi
ACKNOWLEDGMENTS
First and foremost, I thank Dave Tschirley, Andrew Dillon and Frank Lupi for their
individual and collective impacts on this dissertation. Dave helped me hone my research
objectives and supported me as I pursued them. Andrew provided conceptual assistance and
much-needed perspective. Frank gave consistent methodological guidance and support from
origin to completion. I am also grateful for detailed comments and contributions from my
remaining committee members; Robby Richardson and Scott Swinton. I would not have reached
the doctoral dissertation stage without assistance in many forms from my fellow graduate
students, including (but not limited to) Serge Adjognon, Oui Chitchumnong, Joshua Gill, Hamza
Haider, Sarah Kopper, Mukesh Ray, and Jason Snyder. A great debt of gratitude is also owed to
my friends in Zambia Jeremy Selby, Remy Kasonteka, Joshua Banda, Avis Chitafu, and Judith
Banda for teaching me about agriculture and about life. I also thank the U.S. Borlaug Fellows in
Global Food Security for partially funding this research. Last and certainly not least, I am forever
grateful for my family – Joy, Stephen, and Clara, as well as Mary, Carrie, and Sarah – for their
unwavering love and support.
vii
TABLE OF CONTENTS
LIST OF TABLES x LIST OF FIGURES xiii KEY TO ABBREVIATIONS xiv INTRODUCTION 1
Essay 1 2 Essay 2 4 Essay 3 5 REFERENCES 7
1 INFORMATION, KNOWLEDGE, AND DEMAND FOR PREVENTATIVE HEALTH GOODS 11
1.1 Introduction 11 1.2 Pesticide application context 17 1.3 Theoretical model 20
1.3.1 Knowledge and information 21 1.3.2 Health knowledge and PPE demand 22
1.4 Data 23 1.4.1 Eliciting willingness-to-pay: Becker-DeGroot-Marschak mechanisms 25 1.4.2 Experimental design 26 1.4.3 Sample balance 27 1.4.4 Information intervention 29
1.5 Empirical strategy 31 1.5.1 Intention-to-treat effects of information on WTP 31 1.5.2 Risk substitution effects of relative toxicity knowledge on WTP 34
1.6 Results 35 1.6.1 PPE ownership, pesticide toxicity, and health effects 35 1.6.2 PPE demand curves 38 1.6.3 Price elasticities 40 1.6.4 Pesticide safety knowledge 41 1.6.5 The effects of information on WTP 43 1.6.6 Heterogeneous effects of information on WTP 45 1.6.7 The effects of relative toxicity knowledge on WTP 47 1.6.8 Exogenous effects of knowledge on WTP 48 1.6.9 Revealed PPE demand robustness check 51
1.7 Conclusion 52 APPENDIX 57 REFERENCES 72
2 TOXICITY AND EFFICACY INFORMATION AND PESTICIDE CHOICE 79 2.1 Introduction 79 2.2 Pesticide use in Southern Africa 83 2.3 Theoretical model 84
2.3.1 Tomato profits 85

viii
2.3.2 Health production 86 2.3.3 Knowledge and information 86 2.3.4 Choice rule 87 2.3.5 Toxicity information and choices 87 2.3.6 Efficacy information and choices 90
2.4 Data & experimental design 91 2.4.1 Data 91 2.4.2 Information intervention 93 2.4.3 Treatment compliance 95 2.4.4 Pesticide choice experiments 95 2.4.5 Sample balance 99
2.5 Empirical methods 101 2.5.1 Choice shares 101 2.5.2 Choice-level toxicity regressions 102 2.5.3 Random utility model and conditional logit estimation 103 2.5.4 Revealed demand comparisons 104
2.6 Results 104 2.6.1 Pest incidence and pesticide use 104 2.6.2 Toxicity choice share comparisons 106 2.6.3 Choice-level toxicity differences 109 2.6.4 Conditional logit results 111 2.6.5 Revealed demand results 114
2.7 Conclusion 116 APPENDIX 120 REFERENCES 125
3 THE EFFECTS OF A FARMER-TO-FARMER TRAINING PROGRAM ON PESTICIDE KNOWLEDGE 129
3.1 Introduction 129 3.2 Literature review 133
3.2.1 Pesticide knowledge 133 3.2.2 Farmer-to-farmer trainings 136
3.3 Agricultural production setting 136 3.4 Conceptual model of learning 138 3.5 Data and research design 140
3.5.1 Data 140 3.5.2 Knowledge assessments 142 3.5.3 Research design 145 3.5.4 Information intervention 146
3.6 Empirical strategy 150 3.6.1 Outcome variables 152 3.6.2 Multiple hypothesis tests 153
3.7 Results 154 3.7.1 Treatment compliance 154 3.7.2 Correlates of treatment type received 155 3.7.3 Baseline pesticide knowledge 158 3.7.4 Training effects on total pesticide knowledge 161

ix
3.7.5 Training effects on toxicity knowledge 163 3.7.6 Training effects on exposure knowledge 168 3.7.7 Training effects on price-efficacy knowledge 168 3.7.8 Training effects on bollworm control and nematode control knowledge 168
3.8 Conclusion 171 APPENDIX 175 REFERENCES 181
CONCLUSION 187 REFERENCES 190

x
LIST OF TABLES
Table 1.1: Balance tests of random treatment assignment across important covariates 28
Table 1.2: PPE ownership and use for tomato farmers in Mkushi, Zambia at the baseline 37
Table 1.3: Price elasticity of demand estimates by price 41
Table 1.4: OLS intention to treat effects of information on knowledge of PPE benefits and relative toxicity knowledge 42
Table 1.5: OLS and Tobit estimates of intention to treat effects of information on WTP for gloves and masks 44
Table 1.6: Heterogenous effects of information on WTP for gloves and masks – ITT LPM estimates 46
Table 1.7: Effects of endogenous knowledge on WTP for gloves and masks 47
Table 1.8: Marginal effects of knowledge of PPE benefits and relative toxicity knowledge on WTP for gloves and masks (exogenous information) 48
Table 1.9: Endline PPE purchases by treatment assignment 51
Table 1A.1: OLS regression tests of random BDM mechanism price draws 58
Table 1A.2: BDM mechanism bid comparisons conditional on (i) item order, and (ii) first item result (i.e., won or lost). 59
Table 1A.3: LPM estimates of intention to treat effects of information on the decision to offer a positive WTP bid for gloves and masks (dependent variable is an indicator variable equal to one if WTP>0) 60
Table 1A.4: OLS intention to treat effects of information on relative toxicity knowledge (alternative definition). Comparison: Table 1.4. 61
Table 1A.5: Effects of endogenous knowledge (alternative definition) on WTP for gloves and masks -comparison: Table 1.7 62
Table 1A.6: Marginal effects of knowledge of PPE benefits and relative toxicity knowledge (alternative definition) on WTP for gloves and masks (exogenous knowledge). Comparison: Table 1.8. 63
Table 1A.7: Full sample comparison to Table 1.4. OLS intention to treat effects of information on knowledge of PPE benefits and relative toxicity knowledge 64
xi
Table 1A.8: Full sample comparison to Table 1.5. OLS and Tobit estimates of intention to treat effects of information on WTP for gloves and masks 65
Table 1A.9: Full sample effects of endogenous knowledge on WTP for gloves and masks -comparison: Table 1.7 66
Table 1A.10: Full sample comparison to Table 1.8. Marginal effects of knowledge of PPE benefits and relative toxicity knowledge on WTP for gloves and masks 67
Table 2.1: Pesticide perceived toxicity by WHO toxicity class for Zambian horticultural producers (N=247) 88
Table 2.2: Pesticide products and prices used in choice experiment choice sets 98
Table 2.3: Sample balance tests for full and trimmed samples 100
Table 2.4: Share of farmers experiencing pests on their tomato plots in the year prior to baseline 105
Table 2.5: Share of farmers applying pesticides by WHO toxicity class (N=425) 106
Table 2.6: Stated choice toxicity market shares by treatment and control group assignment 109
Table 2.7: First-difference effects of treatment assignment on choice toxicity OLS and OP estimates for both experiments 110
Table 2.8: Conditional logit assignment to treatment effects on choice probabilities for each pesticide in each choice set by survey round and by experiment 112
Table 2.9: Conditional logit price and price*treatment effects on choice probabilities by survey round and by experiment 113
Table 2.10: Revealed demand toxicity market shares by pest and by survey round 115
Table 2A.1: Full sample comparison to Table 2.4. Share of farmers experiencing pests on their tomato plots in the year prior to baseline 121
Table 2A.2: Full sample comparison to Table 2.5. Share of farmers applying pesticides by WHO toxicity class 121
Table 2A.3: Full sample comparison to Table 2.6. Stated choice toxicity choice shares by treatment and control group assignment 122
Table 2A.4: Full sample comparison to Table 2.7. First-difference effects of treatment assignment on choice toxicity OLS and OP estimates for both experiments 122
Table 2A5: Full sample comparison to Table 2.8. Conditional logit assignment to treatment effects on choice probabilities for each pesticide in each choice set by survey round and by experiment 123

xii
Table 2A.6: Comparison to Table 2.9. Conditional logit price and price*treatment effects on choice probabilities by survey round and by experiment 124
Table 3.1: Knowledge questions and correct responses 144
Table 3.2: Correlates of treatment type received for farmers assigned to treatment group – LPM estimates 158
Table 3.3: Baseline knowledge means and differences by treatment assignment, education, and tomato experience 159
Table 3.4: Training program effects on total pesticide knowledge with heterogeneous effects by education and experience 163
Table 3.5: Training effects on knowledge indices - ITT and heterogeneous effects by education and experience 166
Table 3.6: Effects of training on endline knowledge assessments - ITT and heterogeneous effects by education and experience (endline estimates) 167
Table 3A.1: Most trusted sources of information for horticulture producers in Zambia 178
Table 3A.2: Sample balance tests of treatment assignment over key variables (N=488) 179
Table 3A.3: Lead farmer training program total cost breakdown and costs per farmer reached (values are in USD) 180
xiii
LIST OF FIGURES
Figure 1.1: Map of study region in Mkushi, Zambia 24
Figure 1.2: Experimental design and information compliance 31
Figure 1.3: Inverse demand curves for protective gloves and masks. 39
Figure 1.4: Glove and mask inverse demand curves by treatment assignment 43
Figure 1A.1: Protective gloves and masks used in BDM mechanisms 68
Figure 1A.2: Sample Becker-DeGroot-Marschak mechanism script 69
Figure 1A.3: Pesticide training summary letter (page 1) 70
Figure 1A.4: Pesticide training summary letter (page 2) 71
Figure 2.1: Sample breakdown of treatment assignment and information types received 95
Figure 2A.1: Sample icon array 124
Figure 3.1: Sample breakdown of treatment assignment and information types received 155
Figure 3A.1: Pesticide training summary letter print-out (page 1) 176
Figure 3A.2: Pesticide training summary letter (page 2) 177

xiv
KEY TO ABBREVIATIONS
APE Average partial effect
BDM Becker-DeGroot-Marschak
DiD Difference in difference
EA Enumeration area
F2F Farmer-to-farmer
ITT Intention to treat
LPM Linear projection model
OLS Ordinary least squares
OP Ordered probit
PPE Personal protective equipment
RCT Randomized control trial
SSA Sub-Saharan Africa
WTP Willingness to pay
WHO World Health Organization

1
INTRODUCTION
Many goods carry direct or indirect health risks that have important impacts on demand
and behavior. However, the risks are rarely transparent and, as a result, consumers often have
incomplete knowledge of the health risks associated with many of their consumption decisions.
This can lead to inefficient behavior. With that in mind, economists have long studied the
impacts of risk information on consumer behavior though the effects are rarely straightforward,
as there may be risk compensation and substitution effects across inputs and behaviors
(Peltzman, 1975). This dissertation tests the effects of information on knowledge and on demand
for two substitute health inputs in the context of pesticide application behaviors by smallscale
farmers in rural Zambia.
Global pesticide use has increased steadily for more than forty years and is expected to
more than double by 2050 (Tilman et al., 2001). Sub-Saharan Africa (SSA) is no exception to
this trend as farmers have increasingly turned to synthetic pesticides to mitigate potential crop
losses from pest damage (Williamson et al., 2008). Use rates there are also projected to increase
in the future (Snyder et al., 2015). While pesticides offer large benefits to farmers and consumers
through better pest control and increased food production, they also have large health and
environmental costs (Tilman et al., 2001). Perhaps no population faces greater pesticide health
risks than farmers in developing countries who often have access to highly hazardous class Ib1
pesticides (Crissman et al., 1994; Snyder et al., 2015) and face potentially severe acute and
chronic illness risks including cancers, neuropsychological effects, and Parkinson’s disease
(Gorell et al., 1998; Savage et al., 1988). These risks are exacerbated by the fact that farmers
1 Throughout this dissertation, we use the World Health Organization (WHO) toxicity classifications of human health risks (WHO, 2001).

2
seldom use complete personal protective equipment (PPE) when handling and applying
pesticides (see for example Matthews et al., 2003). As a result, farmers often incur large
pesticide related health effects (Sheahan et al., 2016) that have large financial costs (Maumbe
and Swinton, 2003) and can lead to negative net marginal benefits of pesticide use (Pingali et al.,
1994).
The literature agrees that pesticide health effects are a major problem for smallholder
farmers and largely agrees on a solution; farmers need more accurate and more complete
information delivered through trainings or extension to improve pesticide safety (see for example
Ntow et al., 2006). However, previous research has not yet tested whether better pesticide safety
information improves safety behaviors. This dissertation addresses this literature gap with three
focused essays using data from a randomized control trial (RCT) of a farmer-to-farmer (f2f)
training program for tomato farmers in rural Zambia. We chose Zambian tomato farmers as the
study population because they face large health risks in applying multiple highly toxic class Ib
pesticides (Snyder et al., 2015).
Essay 1
There are two primary components of a farmer’s pesticide health risks: exposure (how
much pesticide contacts their body) and toxicity (the potential health risks of the pesticide). PPE
(e.g., gloves, rubber boots, dust masks, goggles, and coveralls) use has large health benefits in
reducing the volume of pesticide to which a farmer is exposed when working with pesticides
(Kiefer, 2000). Yet previous research shows low PPE adoption rates for farmers in developing
countries (Matthews et al., 2003). This is consistent with the broader literature that shows
farmers in developing countries are often slow to adopt repeated use preventative health goods
despite potentially large health benefits (Dupas, 2014; Ashraf et al., 2010). While there may be
3
multiple causes of low PPE use rates, the literature is mostly unified in its recommendation to
increase PPE adoption through trainings and targeted information (Matthews et al., 2003;
Hashemi et al., 2011; Ntow et al., 2006; Tijani et al., 2006). The literature does not offer a
controlled test of information’s effect on demand for PPE, and the evidence of the effects of
information on demand for other health goods is mixed (see for example Madajewicz et al.,
2007; Meredith et al., 2013).
In Essay 1, we test the impacts of information on demand for protective equipment by
randomly assigning farmers to receive information and assessing willingness-to-pay (WTP) for
PPE using two Becker-DeGroot-Marschak (BDM) mechanisms (Becker et al., 1964). We find an
insignificant overall effect of information on WTP. Further, information did not significantly
improve farmer knowledge of PPE health benefits as both control and treatment group farmers
demonstrated high knowledge of PPE benefits prior to the intervention. Thus, for our sample,
information is not likely to be a constraint to PPE adoption. However, information did
significantly improve farmer knowledge of pesticide toxicity, and reducing toxicity may be a
substitute to PPE in the farmer’s health production function. We test for possible substitution
effects from increased toxicity risk knowledge. We find insignificant causal effects of toxicity
knowledge on PPE demand using an instrumental variables approach, but specification tests fail
to reject the assumption that toxicity knowledge is exogenous. When we treat knowledge as
exogenous, we find that toxicity knowledge has a significant and negative effect on PPE demand
for farmers with low knowledge of PPE health benefits. Thus, there is limited evidence of a
substitution effect of information for a subset of our sample.

4
We also estimate the price elasticity of demand for PPE items. We find that PPE demand
is highly elastic around the market prices for each item. Thus, demand may be highly responsive
to small subsidies in PPE prices.
Essay 2
With high exposure, farmer pesticide health risks hinge on the toxicity of pesticides a
farmer chooses, and small-scale farmers often have access to some of the most toxic pesticides
commercially produced – World Health Organization (WHO) class Ib (highly hazardous)
pesticides – as pesticide regulations and enforcement in developing countries often lag behind
more developed countries. Previous research has identified a positive willingness-to-pay (WTP)
for pesticides with a reduced health risk (Kouser and Qaim, 2013; Cuyno et al., 2001; Garming
and Waibel, 2009; Khan, 2009). However, it is not immediately clear how this positive WTP
would manifest itself in farmer pesticide choices. Valuing a reduced pesticide health risk does
not translate well to actual pesticide attributes – namely toxicity – as farmers often misinterpret
or misunderstand toxicity (Ntow et al., 2006; Rother, 2008; Maumbe, 2001). There is evidence
from more developed countries that health information can drive product substitution in demand
for butter (Marette et al., 2007) and fish (Chang and Kinnucan, 1991). However, the literature
has not yet tested how toxicity information might change farmer demand for pesticides across
toxicity classes.
In Essay 2, we use stated choice experiments to perform three tests of farmer pesticide
substitution across toxicity classes by comparing demand for pesticide toxicity classes pre- and
post-information intervention for farmers randomly assigned to receive information with those in
the control group. First, we compare the choice share distributions for pesticide choice toxicity
classes for the treatment and control groups at both the baseline and endline. Second, we use a

5
difference-in-difference regression that compares the toxicities of individual choices at the
baseline and endline for the treatment and control group. Third, we estimate conditional logit
regressions on farmer choices and analyze differences between the treatment and control group
at the baseline and endline. For robustness, we show that the subset of farmers with actual
pesticide purchases in at the baseline and endline surveys show the same pattern as the stated
preferences. We conclude that providing farmers with pesticide toxicity information can increase
demand for lower toxicity pesticides.
Further, our research is the first to document a price-efficacy perception for pesticides
among smallholder farmers; prior to receiving information, farmers perceived that higher priced
pesticides were more effective at controlling pests. This is consistent with previous research
showing that consumers with low product information use price as a cue for product quality in
several products unrelated to pesticides (Zeithaml, 1988; Wolinsky, 1983; Bagwell and Riordan,
1988). We also find that information countering this price-efficacy perception can diminish the
relationship between price and perceived pesticide efficacy.
Essay 3
Lastly, the theoretical model shows that changes in pesticide safety behaviors resulting
from new information likely stem from changes in farmer knowledge. The literature presents
multiple assessments of farmer pesticide knowledge, but these assessments are typically broad
and shallow, often containing fewer than ten questions. The literature also does not test the
effects of a training program on pesticide knowledge. Thus, we do not know where the largest
knowledge gaps may lie, nor do we know if information can close those gaps.
Essay 3 addresses these issues using a detailed knowledge assessment of 22 questions
covering pesticide health risks and pest control benefits from specific pesticides to test the effects

6
of the f2f training on farmer knowledge. We make four knowledge observations that align well
with existing literature; (i) farmers are generally aware of the harmful health effects of
pesticides; (ii) farmers have a basic understanding of exposure risks; (iii) farmers lack detailed
toxicity knowledge; and (iv) farmers lack detailed knowledge of pesticide control properties.
Using intention-to-treat regressions, we find that the information intervention
significantly increased knowledge of pesticide toxicity and efficacy, but had insignificant effects
on knowledge of the effects of PPE on exposure. Farmers with more experience had lower
knowledge of toxicity and the relationship between pesticide price and efficacy, suggesting that
experience alone does not lead to accurate knowledge. However, the more experienced farmers
had a significantly larger knowledge increase from the training.

7
REFERENCES

8
REFERENCES
Ashraf, N., Berry, J., & Shapiro, J. M. (2010). Can higher prices stimulate product use? Evidence
from a field experiment in Zambia. The American Economic Review, 100(5), 2383–2413.
Bagwell, K., & Riordan, M. H. (1991). High and declining prices signal product quality. The
American Economic Review, 224–239.
Becker, G. M., DeGroot, M. H., & Marschak, J. (1964). Measuring Utility by a Single-Response Sequential Method. Behavioral Science, 9(3). 226-32.
Chang, H.-S., & Kinnucan, H. W. (1991). Advertising, information, and product quality: the case of butter. American Journal of Agricultural Economics, 73(4), 1195–1203.
Crissman, C. C., Cole, D. C., & Carpio, F. (1994). Pesticide use and farm worker health in Ecuadorian potato production. American Journal of Agricultural Economics, 76(3), 593–597.
Cuyno, L., Norton, G. W., & Rola, A. (2001). Economic analysis of environmental benefits of integrated pest management: a Philippine case study. Agricultural Economics, 25(2–3), 227–233.
Dupas, P. (2014). Short-run subsidies and long-run adoption of new health products: Evidence from a field experiment. Econometrica, 82(1), 197–228.
Garming, H., & Waibel, H. (2009). Pesticides and farmer health in Nicaragua: a willingness-to-pay approach to evaluation. The European Journal of Health Economics, 10(2), 125–133.
Gorell, J. M., Johnson, C. C., Rybicki, B. A., Peterson, E. L., & Richardson, R. J. (1998). The risk of Parkinson’s disease with exposure to pesticides, farming, well water, and rural living. Neurology, 50(5), 1346–1350.
Hashemi, S. M., Hosseini, S. M., & Hashemi, M. K. (2012). Farmers’ perceptions of safe use of pesticides: determinants and training needs. International Archives of Occupational and
Environmental Health, 85(1), 57–66. https://doi.org/10.1007/s00420-011-0641-8
Khan, M. (2009). Economic Evaluation of Health Cost of Pesticide Use: Willingness to Pay Method. The Pakistan Development Review, 459–470.
Kouser, S., & Qaim, M. (2013). Valuing financial, health, and environmental benefits of Bt cotton in Pakistan. Agricultural Economics, 44(3), 323–335.
Madajewicz, M., Pfaff, A., van Geen, A., Graziano, J., Hussein, I., Momotaj, H., … Ahsan, H. (2007). Can information alone change behavior? Response to arsenic contamination of groundwater in Bangladesh. Journal of Development Economics, 84(2), 731–754. https://doi.org/10.1016/j.jdeveco.2006.12.002

9
Marette, S., Roosen, J., & Blanchemanche, S. (2008). Health information and substitution between fish: lessons from laboratory and field experiments. Food Policy, 33(3), 197–208.
Matthews, G. A. (2008). Attitudes and behaviours regarding use of crop protection products—A survey of more than 8500 smallholders in 26 countries. Crop Protection, 27(3–5), 834–846. https://doi.org/10.1016/j.cropro.2007.10.013
Maumbe, B. M., & Swinton, S. M. (2003). Hidden health costs of pesticide use in Zimbabwe’s smallholder cotton growers. Social Science & Medicine, 57(9), 1559–1571.
Meredith, J., Robinson, J., Walker, S., & Wydick, B. (2013). Keeping the Doctor Away: Experimental Evidence on Investment in Preventative Health Products. Journal of
Development Economics, 105, 196–210.
Ntow, W. J., Gijzen, H. J., Kelderman, P., & Drechsel, P. (2006). Farmer perceptions and pesticide use practices in vegetable production in Ghana. Pest Management Science, 62(4), 356–365. https://doi.org/10.1002/ps.1178
Peltzman, S. (1975). The effects of automobile safety regulation. The Journal of Political
Economy, 677–725.
Pingali, P. L., Marquez, C. B., & Palis, F. G. (1994). Pesticides and Philippine rice farmer health: a medical and economic analysis. American Journal of Agricultural Economics, 76(3), 587–592.
Rother, H.-A. (2008). South African farm workers’ interpretation of risk assessment data expressed as pictograms on pesticide labels. Environmental Research, 108(3), 419–427.
Sheahan, M., Barrett, C. B., & Goldvale, C. (n.d.). Human health and pesticide use in Sub-Saharan Africa. Retrieved from http://barrett.dyson.cornell.edu/files/papers/Sheahan%20Barrett%20Goldvale%20-%20SSA%20pesticide%20and%20human%20health%20paper%20-%20Sept.pdf
Savage, E. P., Keefe, T. J., Mounce, L. M., Heaton, R. K., Lewis, J. A., & Burcar, P. J. (1988). Chronic neurological sequelae of acute organophosphate pesticide poisoning. Archives of
Environmental Health: An International Journal, 43(1), 38–45.
Snyder, J., Smart, J., Goeb, J., Tschirley, D., & others. (2015). Pesticide use in Sub-Saharan
Africa: Estimates, Projections, and Implications in the Context of Food System
Transformation. Michigan State University, Department of Agricultural, Food, and Resource Economics. Retrieved from https://ideas.repec.org/p/ags/midamp/230980.html
Tijani, A. A. (2006). Pesticide use practices and safety issues: The case of Cocoa farmers in Ondo State, Nigeria. J Hum Ecol, 19(3), 183–90.
Tilman, D., Fargione, J., Wolff, B., D’Antonio, C., Dobson, A., Howarth, R., Schindler, D., Schlesinger, W. H., Simberloff, D., and Swackhamer, D. (2001). Forecasting agriculturally driven global environmental change. Science, 292(5515), 281–284.

10
Williamson, S., Ball, A., & Pretty, J. (2008). Trends in pesticide use and drivers for safer pest management in four African countries. Crop Protection, 27(10), 1327–1334.
Wolinsky, A. (1983). Prices as signals of product quality. The Review of Economic Studies, 647–658.
Zeithaml, V. A. (1988). Consumer perceptions of price, quality, and value: a means-end model and synthesis of evidence. The Journal of Marketing, 2–22.

11
1 INFORMATION, KNOWLEDGE, AND DEMAND FOR PREVENTATIVE
HEALTH GOODS
1.1 Introduction
The health production framework pioneered by Grossman (1972) emphasizes that
individuals use health inputs to produce their health. Health inputs help prevent adverse health
outcomes or otherwise diminish their effects. Despite potentially large benefits in preventing
illnesses, the literature shows generally low adoption of health input goods in developing
countries (Dupas, 2011) including slow uptake by at-risk households of preventative repeated
use health inputs like bed nets (Dupas, 2014) and water treatment methods (Ashraf et al., 2010).
These inputs provide large health benefits in preventing common illnesses like malaria and
diarrhea, yet those benefits are fully achieved only after an upfront investment and consistent
use. A similar example of low adoption of preventative health goods is the small share of famers
in developing countries that use personal protective equipment (PPE) when applying pesticides
in their fields.
While pesticide related illnesses do not have the broad-reaching impacts of malaria or
diarrhea, they are a real health risk for farmers in developing countries (Sheahan et al., 2016;
WHO, 1990; Crissman et al., 1994; Pingali et al., 1994), many of whom apply highly toxic class
Ib2 pesticides that have very serious health risks from exposure (WHO, 1990). While pesticides
have been shown to have long-term health risks including cancers, Parkinson’s disease (Gorell et
al., 1998), and neuropsychological effects (Savage et al., 1988), most research in developing
countries focuses on the more immediate acute health risks (see for example Maumbe and
2 Throughout this paper, we use World Health Organization (WHO) human health risk classifications of toxicity (WHO, 2010).
12
Swinton, 2003). A leading recommendation to mitigate these health risks is to reduce farmer
exposure through use of PPE including protective gloves, rubber boots, dust masks, goggles, or
coveralls (Matthews et al., 2003; Hashemi et al., 2011; Tijani, 2006). By using PPE, a farmer can
reduce the pesticide dose that contacts their body and passes into their bloodstream, consequently
lowering the probability of poisoning and adverse health effects.
Despite these potentially large preventative health benefits, the pesticide use literature
shows that smallholder farmer use of PPE is low in many developing countries and in sub-
Saharan Africa (SSA) specifically (Maumbe and Swinton, 2003; Ntow et al., 2006; Negatu et al.,
2016; Matthews et al., 2003; Dasgupta et al., 2007). There may be several reasons for the low
PPE use rates including lack of PPE availability and high prices (Matthews et al., 2008), and
cultural and social norms (Feola and Binder, 2013). Information may also be important
constraint. The literature is mostly unified in its recommendation to improve PPE use and farmer
safety practices by providing farmers with information through trainings (Matthews et al., 2003;
Hashemi et al., 2011; Ntow et al., 2006; Tijani et al., 2006).
This recommendation is justified by the wide literature documenting the causal effects of
education on health and health behaviors (see for example Silles, 2009). The pesticide safety
literature also shows education, awareness of integrated pest management programs, and
extension meetings attended to be important determinants of PPE use (Wilson, 2005; Maumbe
and Swinton, 2003). However, the literature has not yet directly tested the impacts of pesticide
information on demand for PPE, and the evidence of information’s impact on demand and
specifically on health behaviors is mixed.
Jack (2013) surveys the literature on information and technology adoption and
emphasizes that market failures in information are likely for new, complicated technologies.

13
Information and extension programs can have a significant effect on farmer behavior, but the
effects are dependent on delivery mechanism and the technology itself. Madajewicz et al. (2007)
find that information on water safety and the potential health effects from unclean water led to
safer water behaviors. Fitzsimmons et al. (2012) find that information on infant nutrition and
health can improve infant feeding practices. There is also evidence that the effects of information
are stronger when individuals have priors that are substantially different from the message
presented by new information. Dillon et al. (2014) find significant effects of health information
on labor productivity, especially for farmers that are surprised by the information. Gong (2014)
shows that HIV test result information has stronger effects on behavior when people are
surprised by them.
Yet, other studies show little effect of information on health behaviors. Meredith et al.
(2013) conduct a series of controlled experiments and conclude that information by itself does
not impact household investment in preventative health goods. Dupas (2011) offers a selected
review of health behavior literature in developing countries. She notes that although households
often spend a large share of their income on health, they do not often invest in preventative
goods, and she mentions that information can impact behavior, but information alone is not
always enough.
This paper tests the impacts of information on protective equipment demand using a
randomized control trial (RCT) of a pesticide safety training program for rural tomato farmers in
Zambia. We selected Zambian tomato farmers as the population for this study because they
apply several highly toxic pesticides (Snyder et al., 2015) and face large health risks. Thus, they
stand to have large health gains from improved safety behaviors. We randomly assigned farmers
to receive pesticide safety information through an informational letter and a farmer-to-farmer
14
training program that utilizes local farmers to train others in their communities. The information
treatment provided farmers with information on both (i) the benefits of PPE in reducing pesticide
exposure and (ii) the varied health risks of pesticide toxicity classes and how to identify the
toxicity class of a pesticide. We implemented two Becker-DeGroot-Marschak (BDM)
mechanisms (Becker et al., 1964) to assess farmer demand for protective gloves and masks – the
outcome variables of interest. BDM mechanisms have long been employed in economic
experiments, though they are only recently becoming more widely applied in field (see for
example Berry et al., 2015).
The WTP point estimates from the BDM mechanisms allow us to map demand curves for
protective gloves and masks. We are the first study to calculate the price elasticity of demand for
protective equipment. This is an important contribution as it helps us understand how sensitive
demand is to price changes. We find demand for both gloves and masks to be highly elastic
around their market prices (price elasticities greater than 5). Thus, subsidies could be an effective
policy tool to increase PPE demand.
We also find significant effects of information on farmer knowledge. Farmer knowledge
of relative pesticide health risks increased after farmers received information; the farmers
randomly assigned to receive information were better able to identify pesticide health risks by
toxicity labels than the control group. However, the information treatment did not significantly
increase farmer knowledge of PPE benefits measured by five true/false questions as the
treatment group and control group demonstrated similar knowledge. This insignificant effect is
likely due to unexpectedly high prior knowledge as the baseline median number of correct
responses to the five true/false questions was four. The literature mentioned above often implies
15
that there is a knowledge gap by recommending trainings to improve farmer PPE use, though we
find only a small knowledge gap measured by our questions.
Despite some causal increases in knowledge from information, we find insignificant
overall effects of information on demand. In intention-to-treat regressions with block fixed
effects, control variables for farmer characteristics, and standard errors clustered by enumeration
area, we find no significant differences in WTP for gloves or masks between the farmers
assigned to receive the safety information treatment and those assigned to the control group.
Thus, in our sample, information is unlikely to be a binding constraint in PPE demand.
The theoretical model shows that knowledge has overall ambiguous effects on PPE
demand, and that PPE use and pesticide toxicity are both inputs in a farmer’s health production
function. Therefore, it is possible that there is substitution effect between knowledge of PPE
benefits and toxicity knowledge that impacts the overall insignificant effect of information.
Farmers with better knowledge of relative toxicity may be more likely to reduce their health risks
by choosing less toxic pesticides, and, thus, may be more willing to accept more exposure risk by
offering lower WTP bids for protective equipment.
The theory of risk compensation suggests that risk reductions through a safer
environment may be partially or completely offset by behavioral responses that leave overall risk
levels similar to their initial levels or unchanged. However, previous research shows mixed
evidence of risk compensating behaviors. Peltzman (1975) shows that mandatory seatbelt laws
do not decrease traffic accidents as drivers respond to increased safety by driving less carefully.
However, Cohen and Einav (2003) also test for risk compensating behaviors among drivers and
find no evidence that seatbelt use leads to riskier behavior. Vicusi (1979) finds evidence of risk
compensation for occupational safety and health regulations and provides a theoretical model

16
that shows how efforts to increase safety in the workplace are met by lower effort on the part of
workers to prevent adverse health outcomes. Evans (1985) reviews 26 studies and concludes that
the magnitudes of behavioral responses to safety changes vary, but that all analyses of safety
change should consider possible behavior feedbacks (i.e., risk compensation). More recently, de
Walque et al. (2011) find evidence that awareness of antiretroviral therapy leads to an increase in
risky sexual behaviors in Mozambique. They argue that this is a risk compensating behavior as
awareness of antiretroviral therapy likely decreases the cost of risky sex.
While the risk compensation literature discusses a behavioral response to a policy or
exogenous shock, we examine a possible risk substitution response where farmers may change
their demand for PPE after learning that they can reduce their health risks by choosing lower
toxicity pesticides. We test for a risk substitution effect of relative toxicity knowledge using an
instrumental variables approach to control for the possible endogeneity of health knowledge.
Unobservable health preferences may be correlated to an individual’s health behaviors and to
their health knowledge, thereby making knowledge endogenous to health behaviors (see for
example Kenkel, 1991). We use the random assignment to treatment as an instrumental variable
for relative toxicity knowledge to identify causal effects on WTP for gloves and masks.
We find no evidence of a causal effect of relative pesticide toxicity knowledge on WTP
for gloves and masks. However, our Hausman specification tests fail to reject the assumption that
toxicity knowledge is exogenous in our estimations. When we estimate the effects of knowledge
of PPE benefits and relative toxicity knowledge treating each as exogenous we find some
evidence of a substitution effect. Knowledge of PPE benefits shows a strong positive correlation
to WTP for both masks and gloves, while relative toxicity knowledge has significant negative
relationship to WTP for masks for the subset of farmers with low knowledge of PPE benefits (a
17
relatively small share of our sample). Thus, our PPE demand results are consistent with the
theory of risk substitution.
To summarize, this paper presents three important results. First, we estimate the price
elasticity of demand for PPE which has important implications for how responsive demand
might be to subsidies targeting rural farmers. Second, we test the effects of information on WTP
for PPE to determine whether information campaigns are likely to improve farmer safety through
PPE use. Third, we test for possible risk substitution effects of toxicity knowledge on PPE
demand.
The paper proceeds as follows: in the next section, we provide context on PPE use and
pesticide health risks in SSA. Section 3 lays out the theoretical model of health production and
PPE demand. The fourth section describes our data including the BDM mechanisms used to
elicit WTP, outlines the experimental design and presents sample balance tests. Section 5
describes the information intervention, and Section 6 details the empirical strategy. The seventh
section presents our results. Section 8 concludes with the implications from key results and
policy recommendations.
1.2 Pesticide application context
Horticultural production is an important source of income for many smallholder farmers
in SSA. In Zambia, vegetable production has gross margins well above those of field crops, and
tomatoes in particular had an estimated gross margin 179 times that of maize, the dominant field
crop (Hichaambwa et al., 2015). These higher returns come with nearly ubiquitous crop loss
risks from pests. In Zambia, pest pressure was the leading reason cited for horticultural crop loss
by a wide margin (Snyder et al., 2015).

18
The pests affecting horticultural production vary geographically and across specific
crops. The most relevant literature comparison for this paper comes from Sibanda et al. (2000)
who observed multiple pests attacking smallholder tomato plots in Zimbabwe including
nematodes, aphids, leaf miners, red spider mites, and fungal diseases. Even this list presents an
incomplete picture of pest pressure, as the authors could only observe pests that farmers had not
yet controlled. Each of these pests has the potential to dramatically reduce production and the
share of production that meets the informal market standards for quality.
Smallholder vegetable farmers in SSA overwhelming turn to synthetic pesticides to
mitigate crop losses. Ntow et al. (2006) show that each of the 137 farmers in their sample of
vegetable farmers in Ghana applied a pesticide and 43 different pesticides were reported by
farmers. Snyder et al. (2015) found that horticultural producers applied an average of 2.2 and 2.8
pesticides in each of their two study regions in Mozambique. By applying pesticides, farmers
subject themselves to various acute and chronic health risks, but specific human health hazards
vary for each pesticide and the World Health Organization (WHO) provides the standard toxicity
classification used to differentiate the health risks of pesticide products (WHO, 2010). Many of
the pesticides available in SSA carry large health risks to the farmers that apply them. Matthews
et al. (2003) find that farmers in Cameroon applied several class II (moderately hazardous)
pesticides and multiple WHO class Ib (highly hazardous) pesticides. Snyder et al. (2015) show
that more than three quarters of vegetable farmers in Mozambique and Zambia applied a class Ib
pesticide. Thus, Zambian farmers may face relatively high pesticide health risks even within
SSA.
However, these potential health risks are realized only when farmers become exposed to
pesticides, and using PPE such as rubber boots, gloves, a cotton work suit, and a dust mask can
19
greatly reduce the probability of acute poisoning. Keifer (2000) reviewed 17 small sample
studies of pesticide exposure and found PPE items to decrease pesticide exposure in uncontrolled
field environments. Yet in much of SSA, farmers often use only incomplete PPE if any at all.
Ntow et al. (2006) found that only one quarter of vegetable farmers in Ghana used complete
PPE, and Negatu et al. (2016) found that only one tenth of farmers used full PPE in Ethiopia.
Matthews (2003) shows that over 85% of farmers in Cameroon did not use any PPE when
handling or applying pesticides. In Kenya, Macharia et al. (2013) found 88% of farmers to use
boots, but only one third used protective gloves. Sosan and Akingbohungbe (2009) observed
lower PPE use rates in Nigeria where less than one third of farmers used boots and only 5% used
gloves. In Mozambique, less than 60% of vegetable producers wore boots when working with
pesticides and less than 25% wore protective gloves (Goeb et al., 2015). These and other studies
show that complete protection from pesticide exposure through PPE use is exceedingly rare for
smallholder farmers in SSA.
The high toxicity of pesticides applied and the low use of PPE lead to acute illnesses
from pesticide exposure. In Ghana, almost one third of vegetable farmers experienced headache
or dizziness after applying pesticides, and only 18% had not experienced any insecticide
poisoning symptom (Ntow et al., 2006). Cotton farmers in Zimbabwe also regularly experienced
dizziness after applying pesticides and 16% experienced multiple acute health symptoms while
only 44% experienced no symptoms (Maumbe and Swinton, 2003). The average pesticide related
health costs for these farmers was between $5 and $8 per season or between 3 and 5.5 times the
daily wage rate (ibid.).

20
1.3 Theoretical model
The theoretical model uses a health production framework where a tomato farmer’s
utility is a direct function of their health � and consumption of a numeraire good � (1). A farmer
makes single period choices for the quantities of �, protective equipment (���), two pesticide
inputs (�� and ��), and a vector of additional tomato production inputs (�) to maximize their
utility (1) subject to a budget constraint (2) including an exogenous income variable ω. Farmers
do not know their production processes with certainty. They hold beliefs about how inputs affect
outputs, and make decisions based on these beliefs3. All goods are non-durable and farmers are
concerned only with maximizing utility in the current time period.
(1) ��� ,��,��,�,� �� = �(�, �) s.t.
(2) ω + ��� ≥ ��� ��� + ����� + ����� + ��� + �
(3) � = �(�� , ��, �|!)
(4) � = ℎ − $(���, �� , ��|%�&' , %�� , (, ))
The farmer purchases pesticides to control pests and increase tomato production (3). We
model two continuous pesticide inputs (�� and ��) that represent low and high toxicity options,
respectively. Tomato output is increasing in each pesticide4 and decreasing in pest pressure !
which we assume to be stochastic. Unlike many health production models, health does not affect
tomato production in this setup, yet the model is inherently non-separable because tomato
production decisions affect a farmer’s utility directly through their health.
In addition to their positive effects on tomato production, pesticides also impact a
farmer’s health. We model a health production function (4) similar to Pitt and Rosenzweig
3 We refrain from using the word “expected” because we do not model uncertainty. 4 For simplicity, we assume that pesticides directly increase production though the damage control literature suggests that pesticides increase production only by reducing pest damage (Lichtenberg and Zilberman, 1986).

21
(1986). A farmer’s health is defined as unobservable initial health stock ℎ minus the sickness
level produced from pesticide use $. A farmer’s sickness is a function of ���, �� , and ��, and
is conditional on the farmer’s knowledge of toxicity (%�&') and PPE (%�� ), health preferences
((), and a stochastic shock ) that includes exogenous environmental factors that affect acute
pesticide illnesses (e.g., weather at the time of pesticide application)5.
A farmer may make different pesticide and PPE choices based on their knowledge of how
each input affects sickness. We define %�� as the farmer’s knowledge of PPE benefits in
preventing acute illnesses. We define %�&' as knowledge of relative toxicity, and it represents an
ability to distinguish the health risks of �� and ��. If a farmer perceives both pesticides to be
equally toxic, then there is no believed health benefit from choosing one over the other. Thus, a
farmer’s beliefs of relative pesticide health effects are an important factor in health input
decisions.
We assume that sickness is decreasing in PPE and increasing in each pesticide (*+
*�� <0; *+
*�� , *+*�� > 0). As a farmer uses more protective equipment their exposure to pesticides
decreases and sickness decreases. The more pesticides a farmer applies, the higher their health
risks become and sickness increases.
1.3.1 Knowledge and information
Knowledge is not static. Rather, farmers update their knowledge based on new
information available to them. We therefore model a farmer’s knowledge for health input 0 as a
function of their knowledge endowment 1 and new information 2; %3 = %(13 , 23|4), where 4 is
an unobservable learning process that converts new information into knowledge. Mobius et al.
5 A special case of our sickness production function is a multiplicative function of pesticide health risk factors as presented by Sexton et al. (2007).
22
(2015) discuss a difference between diffusion of information and aggregation of information in
social learning. In our model, the learning process 4 represents aggregation of new information
into knowledge, but it takes place prior to the static production decisions in (1).
Gong (2014) and Dillon et al. (2014) show larger information effects when a farmer is
surprised by new information. Our model allows for this effect as information’s effect on farmer
knowledge may be increasing in the difference between the farmer’s endowment and the signal
from new information.
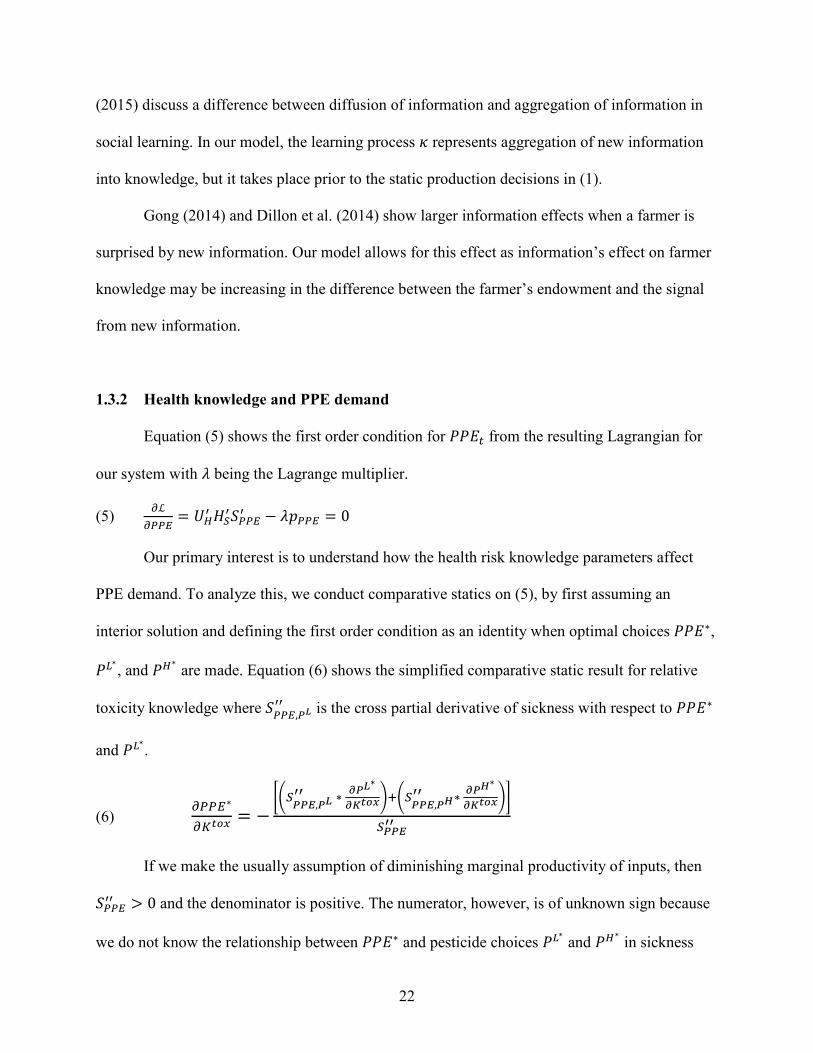
1.3.2 Health knowledge and PPE demand
Equation (5) shows the first order condition for ���� from the resulting Lagrangian for
our system with 5 being the Lagrange multiplier.
(5) *ℒ
*�� = ��7 �+7$�� 7 − 5��� = 0
Our primary interest is to understand how the health risk knowledge parameters affect
PPE demand. To analyze this, we conduct comparative statics on (5), by first assuming an
interior solution and defining the first order condition as an identity when optimal choices ���∗,
��∗, and ��∗
are made. Equation (6) shows the simplified comparative static result for relative
toxicity knowledge where $�� ,��77 is the cross partial derivative of sickness with respect to ���∗
and ��∗.
(6) *�� ∗*9:;< = − =>+??@,?�AA ∗ B?�∗
BC:;<DE>+??@,?�AA ∗ B?�∗BC:;<DF
+??@AA
If we make the usually assumption of diminishing marginal productivity of inputs, then
$�� 77 > 0 and the denominator is positive. The numerator, however, is of unknown sign because
we do not know the relationship between ���∗ and pesticide choices ��∗ and ��∗
in sickness

23
production. Intuition suggests that the cross partial derivatives $�� ,��77 and $�� ,��77 are negative;
as a farmer increases the quantity of pesticide applied, PPE use has a greater negative effect on
sickness and a greater positive effect on health. Yet, even if we make that assumption we do not
know how pesticide choices will change with an increase in relative toxicity knowledge and the
sign of the numerator is unknown.
Despite these unknown effects, the comparative static (6) yields an intuitive result. If an
increase in %�&' leads to changes in optimal pesticide decisions that increase the marginal
perceived benefit of PPE (i.e., if the numerator is negative), then ���∗ increases. The
comparative static result for %�� is analogous, and an important implication of the model is that
%�&' and %�� may have opposing effects on PPE demand. For instance, an increase in %�&'
may lead to pesticide choices that increase the perceived benefit of PPE use, while an increase in
%�� may lead to pesticide choices that decrease the perceived benefit of PPE use, in which case
the overall effect on PPE demand from an increase in both %�� and %�&' is ambiguous. Thus, a
priori, we cannot sign the individual effects of each type of knowledge on WTP, nor can we sign
their joint effect.
1.4 Data
We selected three Agricultural Camps in Mkushi District, Zambia as our study area
(shown in Figure 1.1) for the region’s high concentration of tomato farmers who regularly use
highly toxic pesticides. Within our study area, we identified 711 farmers that grew and sold
tomatoes in the year prior to the baseline survey. To facilitate a village-level intervention, we
created 32 Enumeration Areas (EAs) of 20-30 farmers that lived in relative proximity to each
other using spatial data and natural delineations (e.g., rivers and hills) to separate the EAs

24
whenever possible. We then randomly selected 16 farmers within each EA for a total sample of
512 farmers.
We developed our initial questionnaire after (i) 40 semi-structured interviews that
focused on pesticide purchasing behaviors, mixing and application techniques, and information
sources; (ii) observing four in-field pesticide applications; and (iii) visits to 16 pesticide retail
outlets to catalogue available pesticides and to talk with agronomists and salespeople. Prior to
collecting data, we pretested the questionnaire with approximately 50 farmers for comprehension
and to ensure that none of the modules were too cognitively taxing. We then modified the
questionnaire accordingly.
Figure 1.1: Map of study region in Mkushi, Zambia
For the baseline data collection, we conducted detailed interviews with our sample of 512
farmers and obtained information on household and farmer demographics, pesticide purchases
and knowledge, extension and information sources, and acute symptoms experienced from
pesticide use. Approximately three months after the baseline interviews, and approximately two
25
months after the information intervention for the treatment group, we conducted an endline
survey that closely mirrored the baseline. The endline surveys included two additional modules
to assess farmer WTP for protective equipment.
1.4.1 Eliciting willingness-to-pay: Becker-DeGroot-Marschak mechanisms
Each farmer participated in two Becker-DeGroot-Marschak mechanisms to conclude the
endline survey: one for protective gloves, and one for dust masks. BDM mechanisms reveal a
point estimate of willingness-to-pay (WTP) for each farmer and Davis and Holt (1993 p 461)
emphasize that they are incentive compatible experiments for expected utility maximizers. Our
BDM mechanism procedures closely follow Berry et al. (2015) but are modified to our context
based on our pretesting results.
Farmers played a practice round of the BDM mechanism for a bar of soap before playing
for the two protective items. We randomly selected the order in which we presented the PPE
items to farmers; half of our sample played the BDM mechanism for gloves first and the other
half played the BDM mechanism for a dust mask first. Each item had the same script and
procedure (a sample script and pictures of the gloves and masks are included in appendix Figure
1A.1).
To begin each BDM mechanism round, we showed the farmer the relevant item and
asked them to report the maximum price they were willing to pay. Farmers could hold and
interact with the items which were all in their original packaging. After the farmer offered their
bid G, the interviewer reviewed possible outcomes to confirm that the farmer understood the
game. The farmer then had the opportunity to adjust their bid if they so desired. When the farmer
settled on their best WTP bid, we asked them to retrieve cash at least covering their bid amount
and show it to the enumerator to ensure that they were able to pay their bid price. The farmer
26
then drew a price card H from the relevant distribution6. If the farmer had a ‘winning’ bid (G >H), then the transaction took place immediately, before continuing with the questionnaire.
We selected the price distribution for each item based on the distribution of bids offered
during pretest interviews. We wanted about half of the farmers’ bids to be greater than the draws
for each item. We used a uniform distribution in one Kwacha increments for each item; for
masks the distribution was 1 to 10 Zambian Kwacha (ZMW7) and for gloves the distribution was
1 to 15 ZMW. We deliberately left 0 ZMW out of our distributions to eliminate the possibility of
a farmer winning an item for free. We were concerned that word of ‘free’ items might spread
quickly through our research area and adversely affect future BDM mechanism bids, while
requiring farmers to pay even one Kwacha would greatly reduce that risk.
1.4.2 Experimental design
In assessing the impact of information on behavior the researcher must overcome
potentially large selection challenges. Individuals are more likely to accept greater search costs
for information about which they care more deeply, but we do not observe the underlying
preferences that drive their search. These same unobservable preferences are likely correlated
with behaviors, therefore making identification a central problem.
We address this challenge by randomly assigning farmers – at the enumeration area (EA)
level – to receive pesticide safety information, thus making information (or at least assignment to
receive information) completely exogenous to the farmers’ behaviors. To implement this
randomization, we blocked the 32 EAs into pairs by their mean baseline pesticide knowledge
scored over twelve true/false questions, and we randomly selected one EA from each pair to
6 The next section contains robustness checks on random price draws. 7 At the time of our study the exchange rate was approximates 11 ZMW to 1 USD.

27
receive information. Thus, the treatment and control groups are balanced in design; each has 256
farmers (16 EAs of 16 farmers).
Blocking EAs by baseline knowledge ensures greater treatment and control group
balance over an important characteristic and improves statistical efficiency (Bruhn and
McKenzie, 2009). The impact of new information likely depends on what farmers already know
and how well they know it. Further, pesticide knowledge at the EA level is likely correlated with
access to information, which is, in turn, likely to be associated with health beliefs and behaviors.
Thus, blocking over pesticide knowledge prior to randomization likely reduces across-EA
variance between the treatment and control groups in their information sets.
1.4.3 Sample balance
The sample of 476 farmers used for analysis reflects 29 observations trimmed for
outlying data over important variables8 (asset ownership, tomato area, the number of pesticides
purchased, and BDM bids for masks or gloves), and 7 attrition observations between survey
rounds. The attrition observations are farmers that had moved away from their homesteads at the
time of endline data collection. In all cases, the other household members said the move was
temporary though the farmers were gone for at least one month and we were unable to interview
them at the endline. These attrition observations are well balanced across treatment assignment.
Four of the seven farmers were assigned to the treatment group and balance tests across 26
variables revealed only two significant differences for age and exposure knowledge9. Ultimately,
the full sample estimates are for 476 farmers, 242 of whom were in the treatment group.
8 We define outliers as three times the standard deviation from the mean. As a comparison to trimmed sample results, tables of key estimation results can be found in the appendix. 9 The attrition observations are only dissimilar to the sample of non-attrition farmers in age.
28
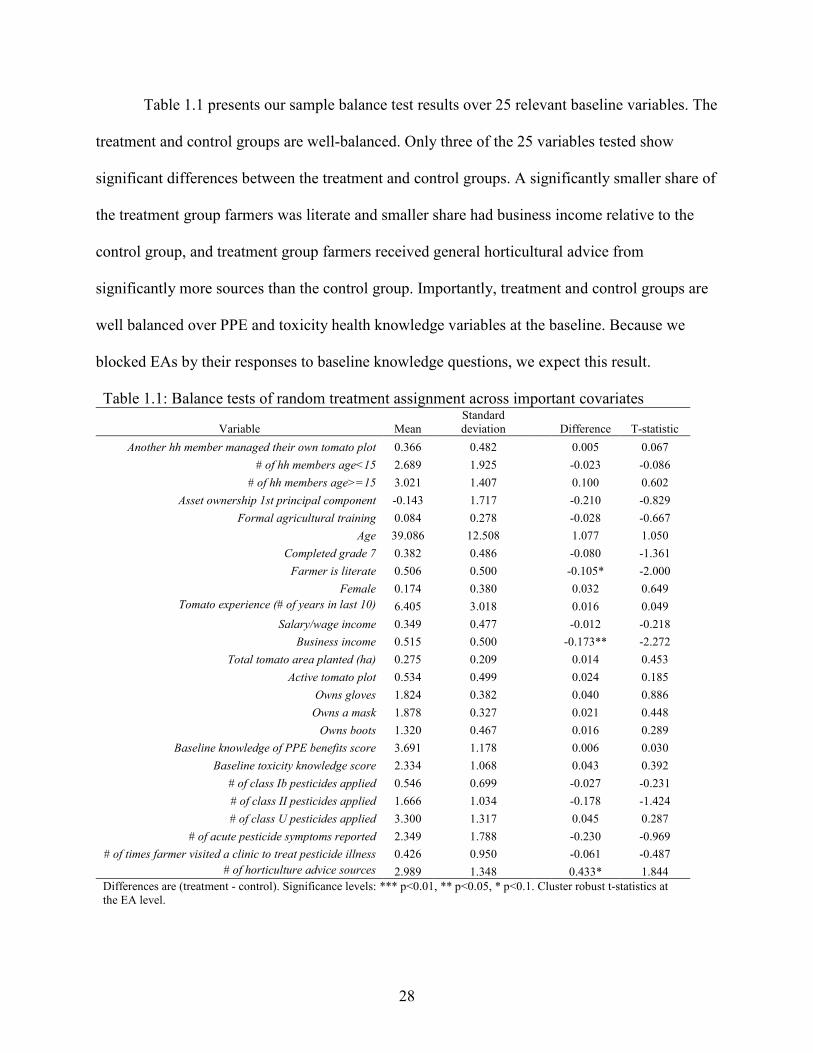
Table 1.1 presents our sample balance test results over 25 relevant baseline variables. The
treatment and control groups are well-balanced. Only three of the 25 variables tested show
significant differences between the treatment and control groups. A significantly smaller share of
the treatment group farmers was literate and smaller share had business income relative to the
control group, and treatment group farmers received general horticultural advice from
significantly more sources than the control group. Importantly, treatment and control groups are
well balanced over PPE and toxicity health knowledge variables at the baseline. Because we
blocked EAs by their responses to baseline knowledge questions, we expect this result.
Table 1.1: Balance tests of random treatment assignment across important covariates
Variable Mean Standard deviation Difference T-statistic
Another hh member managed their own tomato plot 0.366 0.482 0.005 0.067
# of hh members age<15 2.689 1.925 -0.023 -0.086
# of hh members age>=15 3.021 1.407 0.100 0.602
Asset ownership 1st principal component -0.143 1.717 -0.210 -0.829
Formal agricultural training 0.084 0.278 -0.028 -0.667
Age 39.086 12.508 1.077 1.050
Completed grade 7 0.382 0.486 -0.080 -1.361
Farmer is literate 0.506 0.500 -0.105* -2.000
Female 0.174 0.380 0.032 0.649
Tomato experience (# of years in last 10) 6.405 3.018 0.016 0.049
Salary/wage income 0.349 0.477 -0.012 -0.218
Business income 0.515 0.500 -0.173** -2.272
Total tomato area planted (ha) 0.275 0.209 0.014 0.453
Active tomato plot 0.534 0.499 0.024 0.185
Owns gloves 1.824 0.382 0.040 0.886
Owns a mask 1.878 0.327 0.021 0.448
Owns boots 1.320 0.467 0.016 0.289
Baseline knowledge of PPE benefits score 3.691 1.178 0.006 0.030
Baseline toxicity knowledge score 2.334 1.068 0.043 0.392
# of class Ib pesticides applied 0.546 0.699 -0.027 -0.231
# of class II pesticides applied 1.666 1.034 -0.178 -1.424
# of class U pesticides applied 3.300 1.317 0.045 0.287
# of acute pesticide symptoms reported 2.349 1.788 -0.230 -0.969
# of times farmer visited a clinic to treat pesticide illness 0.426 0.950 -0.061 -0.487
# of horticulture advice sources 2.989 1.348 0.433* 1.844
Differences are (treatment - control). Significance levels: *** p<0.01, ** p<0.05, * p<0.1. Cluster robust t-statistics at the EA level.

29
We also verified the randomization of price draws for both BDM mechanisms to ensure
that the draws were not significantly correlated with a farmer’s WTP bid or farmer
characteristics (Table 1A.1 in the appendix). Randomization is confirmed for both gloves and
masks and we find no evidence that the random price draws systematically varied over
covariates.
1.4.4 Information intervention
The overarching goal of the information intervention was to improve farmer pesticide
safety. Our semi-structured interviews and field observations conducted prior to the baseline
survey revealed two key pesticide risk behaviors that became the primary focal points of the
information intervention. First, farmers used little PPE when working with pesticides, and PPE
did not come through as a priority in reducing pesticide health outcomes during the
conversations. Many farmers had experienced acute illnesses from pesticides and some
mentioned “being careful” when working with pesticides, but even for those farmers PPE use
was low. Second, farmers did not understand pesticide toxicity labels and many did not
differentiate products by health risks. More than one farmer said, “poison is poison,” implying
that all pesticides are toxic and that one toxic product is as risky as another. Thus, our two main
points of emphasis in the information intervention were (i) to teach farmers to about pesticide
toxicity and how to identify toxicity labels, and (ii) to emphasize the importance of PPE in
reducing pesticide exposure and to teach farmers how to effectively protect themselves while
working with pesticides.
To deliver this pesticide information to the farmers assigned to the treatment group, we
used a farmer-to-farmer training program and personalized letters containing a summary sheet of
the training content. Farmer-to-farmer training programs are a common, low-cost extension

30
method, yet there are few controlled experiments that assesses their effectiveness in changing
behavior. BenYishay et al. (2016) offer a controlled test though they do not focus on pesticide
safety. They find that farmer-to-farmer training programs can significantly increase farmer
technology knowledge and adoption; however, the impacts vary by gender as women lead
farmers were less effective than men in encouraging adoption. Beaman and Dillon (2016) test the
diffusion of information through social networks by randomly assigning farmers to receive
information on composting. They find that farmers in treatment villages have significantly higher
composting knowledge after the information was distributed, and that social connectivity matters
in information diffusion as farmers with shorter social distance to the trained farmers learned
more (Beaman and Dillon, 2016).
We implemented the farmer-to-farmer training program as follows. Farmers in each EA
voted privately for one farmer to represent them as “lead farmers” and the majority vote recipient
attended a two-day pesticide safety training in a nearby town conducted by representatives of the
Ministry of Agriculture and Livestock. Upon completing the training, the lead farmers returned
home to conduct local trainings of the same content for the other farmers in their EAs. We
provided the lead farmers with sample pesticides and protective equipment so they could easily
demonstrate toxicity labels and PPE use. We also compensated them for their travel and time and
gave them a small stipend to serve a meal to those that attended their local training.
In addition to the local trainings, we asked the lead farmers to send letters through the
informal mail system to each of the farmers in their EAs. We provided all necessary materials for
the letters, including a one-page color summary of pesticide safety content in English (shown in
Figure 1A.3 in the appendix) and the local language, and materials to write personalized notes.
Lead farmers were directed to include a small, handwritten note to each individual encouraging
31
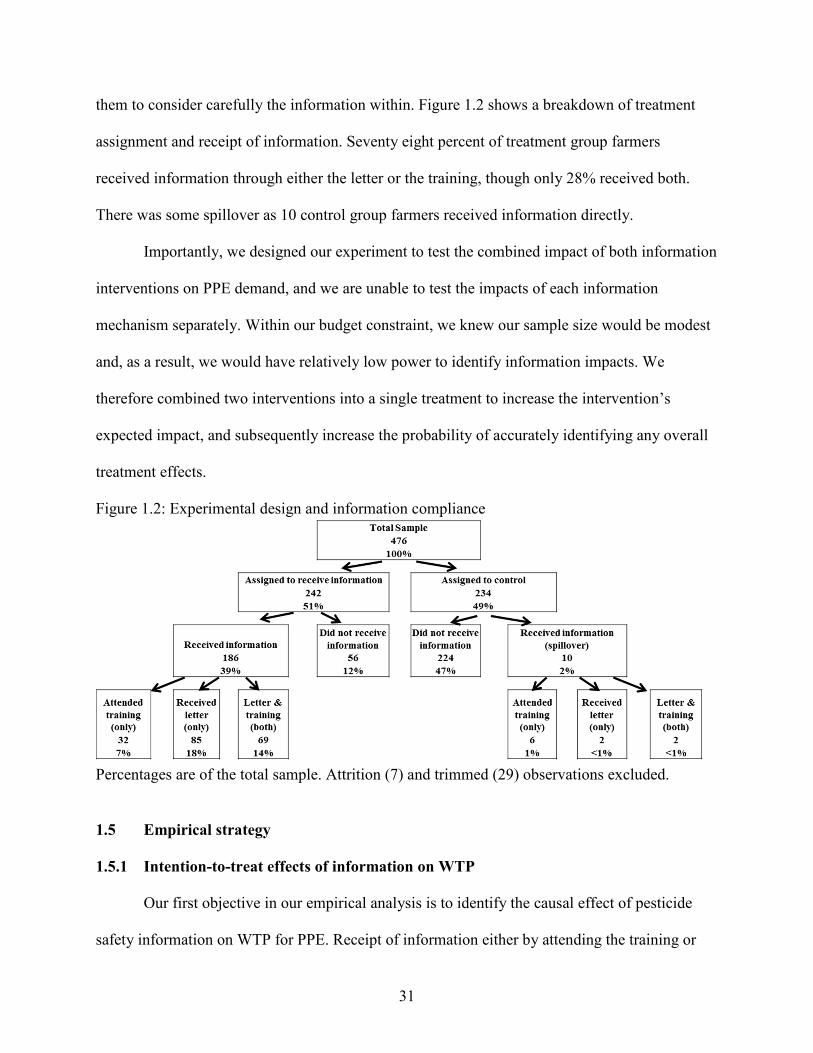
them to consider carefully the information within. Figure 1.2 shows a breakdown of treatment
assignment and receipt of information. Seventy eight percent of treatment group farmers
received information through either the letter or the training, though only 28% received both.
There was some spillover as 10 control group farmers received information directly.
Importantly, we designed our experiment to test the combined impact of both information
interventions on PPE demand, and we are unable to test the impacts of each information
mechanism separately. Within our budget constraint, we knew our sample size would be modest
and, as a result, we would have relatively low power to identify information impacts. We
therefore combined two interventions into a single treatment to increase the intervention’s
expected impact, and subsequently increase the probability of accurately identifying any overall
treatment effects.
Figure 1.2: Experimental design and information compliance
Percentages are of the total sample. Attrition (7) and trimmed (29) observations excluded.
1.5 Empirical strategy
1.5.1 Intention-to-treat effects of information on WTP
Our first objective in our empirical analysis is to identify the causal effect of pesticide
safety information on WTP for PPE. Receipt of information either by attending the training or

32
receiving a letter reflects choices made by both the farmer trainers and the village farmers. A
farmer’s training attendance or receipt of a letter may then be related to a farmer’s social
connectivity or other unobservable variables that also affect WTP, and thus may be endogenous.
To avoid these potential endogeneity problems, we rely on the experimental design’s random
assignment of farmers to receive information by estimating intention-to-treat (ITT) regressions
with the following specification:
(7) IJ�K3 = LM + LNJO)PQ)RPK + ∑ TU�UKU + V3 + WK3
where IJ�K3 is the willingness-to-pay bid for a PPE item for farmer i in block j. JO)PQ)RPK is
the random treatment assignment variable. �UK is a set of X covariate controls including an income
proxy variable defined as the first principal component of 17 asset ownership variables and land
ownership, a farmer age variable, an education indicator variable equal to one if the farmer
completed grade seven10, a sex indicator variable equal to one if the farmer is female, a tomato
experience variable defined as the number of years in the last 10 that a farmer grew tomatoes,
and two variables that were unbalanced across treatment assignment; an indicator variable for
business income, and a count variable of the number of sources of horticultural advice. V3 is a
block j fixed effect used to increase precision in the treatment effect estimates (Bruhn and
McKenzie, 2009). The block fixed effect increases the power of our estimates by controlling for
the baseline EA level mean knowledge (as discussed in section 1.4.2). This may also help control
for access to information sources (e.g., non-governmental organizations and government
extension agents) if EAs with similar baseline knowledge have similar access to these sources.
10 Grade 7 is a natural cut-off in education in Zambia, as there is a national level examination at the end of grade 7 that pupils must pass to advance to grade 8.
33
As is common in RCT analysis, we assume the error term WK is correlated within EAs –
our level of randomization – but uncorrelated across EAs. Therefore, we present cluster robust
standard errors at the EA level that provide more accurate inference of treatment effects as
discussed by Bertrand et al. (2004)11.
Our primary interest is the average partial effect (APE) of JO)PQ)RPK on IJ�K3, and
we estimate (7) by an ordinary least squares (OLS) linear projection model. However, we
observe a nontrivial share of corner solution BDM mechanism bids equal to zero (approximately
20% of the bids for each item). While imperfect in the face of corner solution data, linear
projection models and OLS can still provide good estimates of the average partial effects of
explanatory variables (Wooldridge, 2010 p 668). As a comparison to OLS, we also estimate (7)
by Tobit maximum likelihood estimation that explicitly accounts for the corner solution bids
where IJ�K3 = 012.
The estimator LN[ is the ITT effect of pesticide safety information on WTP. The common
literature recommendation that information is needed to improve pesticide safety behaviors
implicitly expects a positive effect of information. However, when accounting for possible health
input substitution the theoretical model provides no clear expected sign for LN[ as PPE
information and toxicity information may have opposing effects on WTP for PPE.
Information may have a greater or lesser impact for subsets of farmers within the
treatment group. Therefore, we test for heterogeneous effects of information by interacting
JO)PQ)RPK with multiple covariates. Our selected covariates include variables that might affect
11 Because there are only 32 clusters in the data, we also plan to present p-values for the treatment effects from the wild-cluster bootstrap-t method shown to provide accurate inference with as few as six clusters (Cameron et al., 2008). 12 Given the large share of corner solution responses, we also create an indicator variable equal to one if IJ�K3 > 0
to test whether treatment assignment affected the probability that a farmer offered a positive bid (Table A3 in the appendix).

34
the relative effects of information (education, tomato experience, and an indicator variable for
low baseline knowledge of PPE benefits), a variable that reflects farmer constraints other than
knowledge (the first principal component of asset ownership), and two variables of pesticide
toxicity experience (the number of class Ib and class U pesticides applied at the baseline).
Significant estimates of the treatment assignment interaction terms imply a significant ITT effect
across the relevant covariate.
1.5.2 Risk substitution effects of relative toxicity knowledge on WTP
To test for evidence of risk compensation, we estimate the causal impact of relative
toxicity knowledge on WTP for gloves and masks. We model knowledge as a parameter in PPE
demand, but it could also be the case that a farmer chooses their knowledge levels by obtaining
new information related to PPE and toxicity. Hanna et al. (2014) show that farmers may choose
what production information to attend to and learn from. In this case, a farmer’s choice to
acquire information is likely related to their health preferences ( which also affect PPE demand.
For example, a farmer that has a high preference for health may have a greater demand for PPE
and may be more likely to seek out health information and therefore have greater health
knowledge. In this case, knowledge would be endogenous13. Therefore, we use the following
instrumental variables specification:
(8) %K3�&' = \M + \NJO)PQ)RPK3 + ∑ ]U�UKU + V3 + !K3
(9) IJ�K3 = ^M + ^N%_�&'̀ + ∑ TU�UKU + V3 + �K3
13 Note that this endogeneity argument would apply to knowledge in the previous time period as well because %�aN3
is a function of 2�ab3which would still be related to a farmer’s health preferences.

35
where %K3�&' is the farmer’s relative toxicity knowledge defined as equal to one if the farmer
correctly identified the health risks of a WHO class Ib pesticide and a WHO class U pesticide14.
In the first stage (8), we regress our excluded instrument JO)PQ)RPK3, X included instruments
�UK that control for characteristics that might affect WTP (the same set of covariates from
equation 7), and block fixed effects V3 on %K3�&'. The predicted values of relative toxicity
knowledge %_�&'̀ are then estimated against IJ�K3 in the second stage (9). Valid identification of
(9) requires an excluded instrument that is correlated with %K3�&' and only correlated to IJ�K3
through %K3�&'. Treatment assignment JO)PQ)RPK3 meets these requirements because it affects a
farmer’s relative toxicity knowledge and is randomly assigned and uncorrelated (at least directly)
with IJ�K3.
1.6 Results
1.6.1 PPE ownership, pesticide toxicity, and health effects
To provide context and background to the WTP analysis, we first present the share of
farmers that owned PPE items at the baseline survey in Table 1.2. PPE ownership is low; the
median number of PPE items owned is only one. Each PPE item was available for sale in the
nearby town of Mkushi, so the low ownership does not reflect a complete lack of access to any
item. Complete protective coverage would include using all the listed PPE items (shown as “Full
PPE”) during mixing and application of pesticides, which is a possibility for only 1% of farmers.
Boots are by far the most common PPE item. Aragon et al. (2006) show that farmers that apply
14 We showed farmers a sample pesticide in each toxicity class and asked them to identify the toxicity of each. We somewhat generously code correct responses for the class Ib pesticide as either “extremely toxic” or “highly toxic” and correct responses for the class U pesticide as either “not very toxic” or “not toxic.” Responses of “I don’t know” to either pesticide are coded as incorrect knowledge (we include robustness checks on this decision in the appendix).

36
pesticides have high exposure on their feet and lower legs, thus boots provide valuable
protection. However, that is unlikely to explain the wide gap between boots and other PPE items.
For instance, gloves offer similarly high value in reducing exposure. The high ownership of
boots is likely due to the facts that (i) boots are durable goods that last several seasons, and (ii)
boots have other uses beyond protecting a farmer from pesticide exposure.
These observed PPE ownerships rates are generally within the reported range of PPE use
rates in Southern Africa (and those studies mentioned in section 1.2). Maumbe and Swinton
(2003) show that Zimbabwean cotton farmers owned an average of 1.76 and 3.76 PPE items in
the two districts they study. The lower ownership and use in our study could reflect differences
between cotton growers who have strong connections to cotton companies that may provide
information and inputs on credit and horticulture farmers that do not have these formal
relationships and connections to companies. Perhaps a better comparison is Goeb et al. (2015)
who show that vegetable farmers in Mozambique used PPE when applying pesticides at lower
rates to our ownership and use shares; 54% used boots compared to 68% ownership and 34% use
in our sample; 19% used gloves, which is similar to the 18% ownership and 11% use shares in
our sample, and 36% used a mask or goggles compared to 13% mask ownership and 6% use in
our sample. The takeaway observation from Table 1.2 is that Zambian tomato farmers use
incomplete PPE when working with pesticides, which is common for smallholder pesticide users
in SSA.
We define PPE “use” as farmers reporting that they “always use” an item, though the
majority of farmers either always use or never use a PPE item; for each item, less than 7% of the
sample reported occasional use. This suggests that farmers are not varying their PPE use

37
decisions with other health risk factors like weather at application time, pesticide toxicity,
pesticide type.
PPE use rates fall below ownership rates for each PPE item. This observation emphasizes
a distinction between PPE ownership and PPE use. Owning a PPE item does not ensure
reductions in pesticide exposure, though use of each item is significantly correlated with
ownership. A possible explanation for the low use rates is that PPE items are uncomfortable and
farmers may experience some disutility from using the items (Matthews, 2008a). PPE ownership
is a sunk cost at the time of pesticide application, and farmers may choose not to incur disutility
costs from use during application.
Table 1.2: PPE ownership and use for tomato farmers in Mkushi, Zambia at the baseline Share of farmers that…
PPE item Own the item Always use the item
Full PPE (all items below) 1% 1%
Gloves 18% 11%
Dust mask 13% 6%
Boots 68% 34%
Worksuit
35% 15%
Goggles 10% 3%
Median number of items 1 0
Mean number of items 1.4 0.7
The low PPE ownership together with the use of highly hazardous pesticides imply large
health risks for tomato farmers in our study. In the year prior to the baseline interview, 84% of
the sample reported experiencing an acute illness symptom within 24 hours of applying a
pesticide, and the average number of symptoms experienced was 2.8 for those that experienced
one. Thirty nine percent of our sample lost at least one work day from these acute illnesses and
nearly one quarter visited a health clinic for treatment of their symptoms.

38
1.6.2 PPE demand curves
Before analyzing the impacts of information and knowledge on PPE demand, it is useful
to discuss demand more generally. We begin by mapping demand curves for the two protective
equipment items. The BDM mechanisms provide bids of WTP for each farmer, and we use these
bids to map the share of farmers that bid greater than or equal to a range of prices for each item –
shown in Figure 1.3 for our full sample of 476 farmers. We make three observations from these
demand curves.
First, about 20% of the bids for each item were 0 ZMW. Ninety farmers bid 0 ZMW for
gloves and 98 did so for masks, and there is a lot of overlap between the two groups as 89
farmers bid 0 ZMW for both items. This is an alarming result as farmers were not limited in their
bid amounts, and could have bid as low as 0.5 ZMW (approximately $0.05). A BDM mechanism
conducted in Ghana showed that 95% of individuals had a positive WTP for a water filter (Berry
et al., 2015), so our result is somewhat surprising. The farmers that bid 0 ZMW had very low
valuations of the health benefits of PPE likely stemming from binding cash or other constraints,
though we acknowledge that the fact that our research was a foreign-funded project may have
caused some farmers to bid 0 (or lower than they otherwise would have) in the hopes that they
would receive the items for free (or at a discount).
The large share of bids equal to 0 ZMW is consistent with previous literature that shows
large decreases in demand for health goods when a positive price is charged relative to when the
goods or services are offered for free. Kremer and Miguel (2007) show that charging a small fee
reduced adoption of a deworming treatment by 58 percentage points in Kenya. Kremer et al.
(2009) show a large increase in use of a chlorine water treatment when households received the
treatment for free and an insignificant effect of a 50% subsidy relative to control group. The

39
goods in both of these examples are similar to protective gloves and masks in that they are non-
durable health inputs. Masks and gloves are only likely to last a single tomato cycle if they are
used regularly. Thus, a possible reason for low demand is that farmers may be reluctant to invest
in health goods with short-term benefits, and repeated capital investments may be unattractive.
We also acknowledge that the fact that our project was foreign funded may have some influence
on bidding behaviors. Farmers may have bid zero (or lower than their true WTP) in the hopes of
receiving the items for free (or at a discount) from foreign donors.
Our second observation is that the demand curve for gloves is higher than the demand
curve for masks at every price. We expect this difference across items because gloves offer better
protection from potential pesticide exposure, and, therefore, greater health benefits if used
properly, particularly when mixing pesticides prior to application. Further, gloves are more
durable and, therefore, offer protection for a longer period of time, though both items are not
likely to last more than one growing season if used regularly.
Figure 1.3: Inverse demand curves for protective gloves and masks.
0
5
10
15
20
25
0 0.2 0.4 0.6 0.8 1
Pri
ce (
ZM
W)
Share of farmers purchasing
Gloves
Mask
40
Our third observation is that the majority of bids for each item fell well below market
prices despite the potential savings in transportation and transaction costs associated with
purchasing the items at a farmer’s home instead of in the market. Bohm et al. (1997) suggest that
the market price for a commodity is a logical upper bound for BDM game bids, but we observe a
large gap between market prices and average bids. Retail outlets in the nearest major market sold
gloves for 20 ZMW per pair, and the observed median and mean bids for gloves were only 5
ZMW and 7.2 ZMW, respectively, while only 17 farmers (3.6% of our sample) offered bids
greater than or equal to the market price. Retail outlets sold masks for 9 ZMW a piece, and the
median and mean mask bids were 4 ZMW and 4.7 ZMW, respectively, while only 75 farmers
(16% of our sample) bid at least the market price. This result suggests that any intervention
without a subsidy needs to have large effects to increase observed market demands for PPE.
1.6.3 Price elasticities
Following Berry et al. (2015), we estimated the price elasticity of demand for gloves and
masks by using a local polynomial regression to smooth the demand curves and calculating the
elasticities at each price. Table 1.3 shows that demand is inelastic at low prices for both gloves
and masks, but elasticity increases with price for both items. Berry et al. (2015) show a very
similar elasticity relationship to price in demand for water filters in Ghana. However, there is
evidence of the opposite elasticity relationship to price as well. In reviewing the literature on
water safety, Ahuja et al. (2010) state the Kremer et al. (2009) find “evidence for very elastic
demand going from zero price to a low a positive price and inelastic demand as price increases.”
Importantly, demand is highly elastic (greater than 5) near the market price for each item,
suggesting that small discounts or subsidies could increase PPE demand. The demand curve
shows that a 5 ZMW discount from market prices nearly triples demand for both items.

41
Approximately 16% of farmers offered a WTP bid of 9 ZMW (the market price for masks) or
greater for masks, but more than 50% of farmers offered had a WTP of 4 ZMW or greater. For
gloves, only 4% had WTP greater than or equal to 20 ZMW (the market price for gloves), but
12% offered a bid of at least 15 ZMW.
Table 1.3: Price elasticity of demand estimates by price
Elasticity
Price Mask Gloves
1 0.19 0.09
5 1.70 0.79
10 5.12 2.48
15 11.33 4.65
20 5.30
1.6.4 Pesticide safety knowledge
As shown in the theoretical model, we expect information to impact PPE demand through
farmer knowledge. Thus, an important first step in our analysis is to determine the impacts of
information on knowledge. Our metric for knowledge of PPE benefits %�� is defined as the
sum of correct responses to five true/false questions about PPE health benefits and exposure, and
our metric for relative toxicity knowledge is %�&' (defined is section 1.5.2 above). Table 1.4
presents the effects of random treatment assignment on the knowledge of PPE benefits and
relative toxicity knowledge metrics through intention-to-treat regressions.
Information had a strong significant effect on relative toxicity knowledge. Treatment
group farmers were 24% more likely to correctly identify both the class Ib and class U pesticide
and the result is significant at the 1% level (Table 1.4). Further, relative toxicity knowledge is
low in the absence of information as only 12% of the control group correctly identified both
pesticide toxicities. There is a clear gap in knowledge of relative pesticide toxicity, and
information significantly increased farmer knowledge.

42
Table 1.4: OLS intention to treat effects of information on knowledge of PPE benefits and relative toxicity knowledge
Dependent Variable Relative toxicity knowledge (0,1) Knowledge of PPE benefits
(0-5)
Variables (1) (2)
Treatment assignment 0.244*** 0.101
(0.051) (0.161)
Control group mean knowledge 0.12 4.07
Observations 476 476
R-squared 0.218 0.138
Cluster robust standard errors at the EA level in parentheses. Block fixed effects included in each regression. Significance levels: *** p<0.01, ** p<0.05, * p<0.1
The significant effect of information on relative toxicity knowledge is largely driven by
correct identification of the class U pesticide. Only 25% of all farmers stated that the class U
pesticide was not toxic or of low toxicity, while 88% of all farmers stated that the class Ib
pesticide was extremely or highly toxic. The observed incorrect perceived toxicity for low
toxicity pesticides is consistent with Cachomba et al. (2013) who show that vegetable farmers in
Mozambique perceived more than three quarters of all pesticides used to be highly toxic and this
perception showed little relationship to a product’s true toxicity. This is also consistent with the
perception that “poison is poison,” held by many farmers in our study area.
Table 1.4 presents a much different story for our knowledge of PPE benefits metric.
Information did not have a significant effect on farmer knowledge of PPE benefits (shown in
column 2 of Table 1.4). The mean knowledge of PPE benefits score for the control group was 4.1
out of 5. Thus, there was little room for information to improve farmer knowledge of PPE
benefits as measured by our questions. Based on our observations of farmer practices and
conversations during semi-structured interviews, this is an unexpected result. Researchers may
be tempted to attribute low PPE use to a knowledge gap, but we find little evidence of a gap in
knowledge of PPE benefits. Yuantari et al. (2015) find Indonesian farmers to be similarly
43
knowledgeable of PPE health benefits, and we add to this result by finding new information had
an insignificant effect on knowledge of PPE benefits.
Hanna et al. (2014) explain farmer learning with a model describing how farmers only
learn about production parameters that they attend to. Our baseline knowledge results may be
consistent with that model. It is easy to observe pesticide exposure and learn that keeping
pesticides off one’s skin with PPE would be beneficial. Thus, farmers have high knowledge of
PPE benefits in part because it is easy to learn about exposure. Toxicity on the other hand is
much more difficult to attend to and learn about. Though each pesticide contains a color band
indicating the pesticide’s toxicity class, farmers regularly mix multiple pesticides together for a
single application, thus even if a farmer paid attention to the toxicity color band, the effect from
any one pesticide would be muted. Learning to relate the color bands to health risks would
require a great deal of effort and attention, and farmers would be less likely to have a high
knowledge of toxicity through experience and informal information sharing alone.
1.6.5 The effects of information on WTP
Having described knowledge and demand generally, we now focus on information’s
effect on WTP by analyzing demand curve differences for the treatment and control groups.
Figure 1.4 shows almost no differences in mask and glove demand by treatment assignment. ITT
regressions confirm these observations. Table 1.5 presents OLS and Tobit estimates of ITT
effects on WTP for gloves and masks with covariate controls – equation (7) above. Both models
reveal insignificant effects of treatment assignment on WTP for both gloves and masks –
estimates of LN[ in equation (7).
Figure 1.4: Glove and mask inverse demand curves by treatment assignment

44
The covariate controls show some interesting relationships to WTP. The first principal
component of asset ownership (our proxy for income) has a positive and significant effect for
both models and both PPE items, as expected. Farmers with higher asset ownership likely have
greater incomes and greater WTP for PPE. Farmers that successfully completed grade 7 have
significantly greater WTP for masks. Completing grade 7 is associated with a bid increase of 0.9
and 1.1 ZMW in the OLS and Tobit estimates for masks, respectively. This is consistent with
Maumbe and Swinton (2003) who found education to be positively and significantly related use
of PPE for part of their sample of Zimbabwean cotton farmers.
Table 1.5: OLS and Tobit estimates of intention to treat effects of information on WTP for gloves and masks
Model OLS Tobit
Mask Gloves Mask Gloves Variables (1) (2) (3) (4)
Treatment assignment 0.213 -0.323 0.130 -0.421
(0.549) (0.734) (0.689) (0.916) Asset ownership - 1st PC 0.357*** 0.555*** 0.440*** 0.666***
(0.101) (0.171) (0.124) (0.208) Farmer age -0.005 0.006 -0.009 0.000
(0.016) (0.017) (0.018) (0.021) Farmer completed grade 7 0.903** 0.399 1.107** 0.682
(0.429) (0.607) (0.508) (0.723) Farmer female -0.258 -0.451 -0.129 -0.361
(0.438) (0.804) (0.526) (0.936) Tomato experience (# of years in last 10) 0.051 0.145* 0.104* 0.223**
(0.048) (0.082) (0.063) (0.101) Business income 0.144 0.215 -0.008 -0.013
(0.302) (0.521) (0.387) (0.648) Number of horticultural advice sources 0.068 0.203 0.114 0.259
(0.134) (0.200) (0.156) (0.227)

45
Gloves were first item bid on -0.507** -0.530 -0.534* -0.545
(0.236) (0.375) (0.286) (0.438) Constant 3.293*** 5.566*** 2.381 4.357**
(1.180) (1.282) (1.543) (1.782) Sigma 4.172*** 6.016***
(0.227) (0.403)
Observations 476 476 476 476
R-squared 0.142 0.108
Cluster robust standard errors at the EA level in parentheses. Block fixed effects included in each regression. Significance levels: *** p<0.01, ** p<0.05, * p<0.1
Tomato experience shows a positive and significant effect on WTP for masks in both
models and WTP for gloves in the Tobit estimation. Experience could affect WTP in several
ways. One likely possibility is that more experienced tomato farmers have greater knowledge of
the benefits of exposure reduction from gloves or mask use. However, an auxiliary regression
shows that experience has a small and insignificant effect the knowledge of PPE benefits metric.
A more likely explanation is that more experienced farmers are more likely to have active tomato
plots when we implemented the BDM mechanism for each item and, thus, would experience
more immediate benefits from PPE.
Lastly, we include an indicator variable equal to one if gloves were the first item the
farmer bid on in the BDM mechanisms. This is to control for a possible sequencing effect shown
in Table 1A.2 in the appendix. Bidding on gloves first led to significantly lower average bids for
masks (columns 1 and 3). A possible explanation is that farmers that bid on gloves first and won
paid for the gloves prior to bidding on masks. Thus, they may have had a lower WTP for masks
if they had just purchased gloves because they are substitutes in reducing exposure, and they may
have had a tighter cash constraint.
1.6.6 Heterogeneous effects of information on WTP
While the overall effect of information is insignificant, information may have had
varying effects on WTP based on farmer characteristics. Table 1.6 tests for heterogeneous effects
of information across five potentially important covariates. We find little evidence that

46
information had varying effects by covariates. The interaction of treatment assignment and an
indicator variable for low knowledge of PPE benefits (bottom 30% of all farmers) shows an
insignificant relationship to WTP for both gloves and masks in all specifications. This suggests
that information did not have a significant effect on WTP for PPE for the farmers with
potentially large prior knowledge gaps. There are varied effects of information based on the
toxicity of pesticide applied at the baseline. The number of class Ib pesticides applied has a
positive and significant heterogeneous treatment effect in the mask estimation (column 7), while
the number of class U pesticides applied has a negative and significant heterogeneous effect for
gloves (column 10). These are intuitive results given the low knowledge of relative toxicity in
the absences of new information. New information taught farmers that class Ib pesticides are
have high health risks and that class U pesticides have low health risks. Thus, farmers using less
(more) toxic pesticides may have less (more) to gain from PPE use upon learning that their
pesticide health risks are lower (higher) than they may have previously believed.
Table 1.6: Heterogenous effects of information on WTP for gloves and masks – ITT LPM estimates
Covariate
Low baseline knowledge (<median)
Completed primary school
Tomato experience
# of class Ib pesticides used
# of class U pesticides used
Mask Gloves Mask Gloves Mask Gloves Mask Gloves Mask Gloves
(1) (2) (3) (4) (5) (6) (7) (8) (9) (10)
Treatment 0.196 -0.271 0.415 -0.109 0.661 -0.905 -0.154 -0.765 1.423 2.404
(0.768) (0.689) (0.988) (0.832) (1.032) (0.553) (0.852) (1.329) (1.677) Covariate 0.393 0.518 1.187* 0.674 0.095 0.105 -0.167 -0.093 0.217 0.542**
(0.922) (0.480) (0.963) (0.066) (0.115) (0.337) (0.477) (0.156) (0.251) Interaction 0.074 0.022 -0.511 -0.403 -0.069 0.101 0.703* 0.945 -0.364 -0.808**
(1.135) (0.924) (1.316) (0.108) (0.151) (0.385) (0.635) (0.308) (0.388) Observations 476 476 476 476 476 476 476 476 476 476
R-squared 0.144 0.107 0.142 0.105 0.142 0.106 0.146 0.11 0.145 0.115
Cluster robust standard errors at the EA level in parentheses. Block fixed effects included in each regression. Significance levels: *** p<0.01, ** p<0.05, * p<0.1. Baseline covariate controls included in estimation, but excluded from the table. Results are robust to econometric specification: Tobit and linear probability model show similar results.
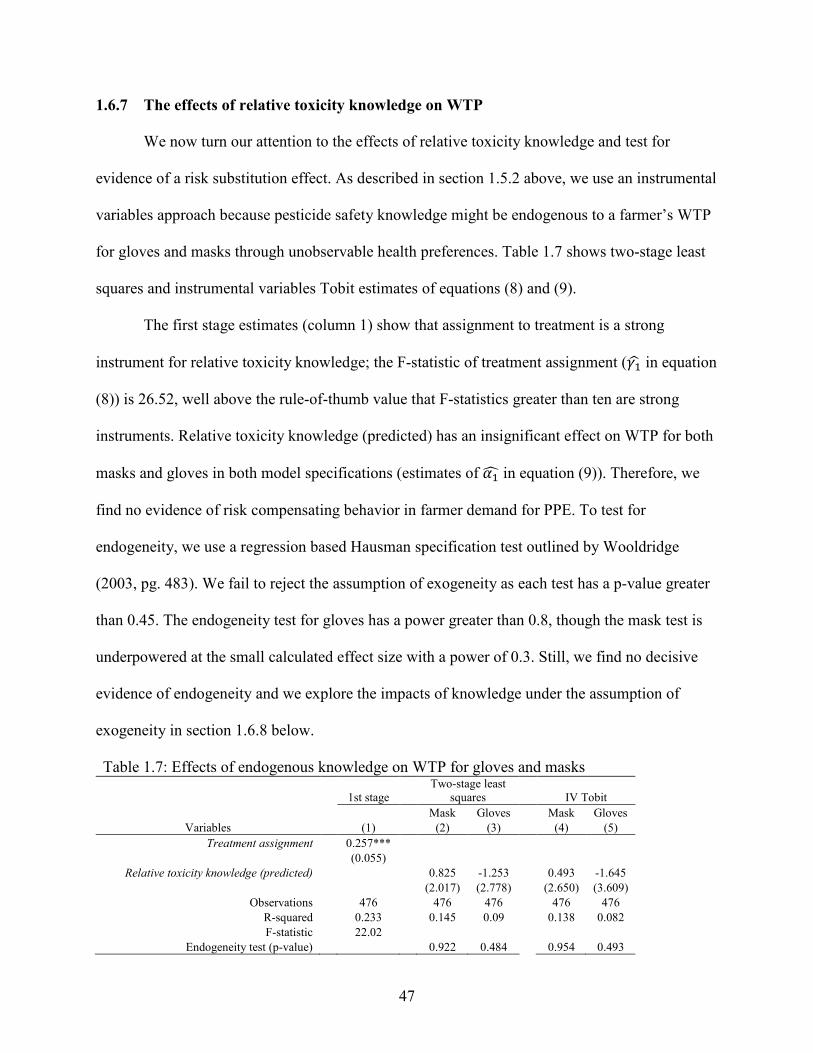
47
1.6.7 The effects of relative toxicity knowledge on WTP
We now turn our attention to the effects of relative toxicity knowledge and test for
evidence of a risk substitution effect. As described in section 1.5.2 above, we use an instrumental
variables approach because pesticide safety knowledge might be endogenous to a farmer’s WTP
for gloves and masks through unobservable health preferences. Table 1.7 shows two-stage least
squares and instrumental variables Tobit estimates of equations (8) and (9).
The first stage estimates (column 1) show that assignment to treatment is a strong
instrument for relative toxicity knowledge; the F-statistic of treatment assignment (\Nc in equation
(8)) is 26.52, well above the rule-of-thumb value that F-statistics greater than ten are strong
instruments. Relative toxicity knowledge (predicted) has an insignificant effect on WTP for both
masks and gloves in both model specifications (estimates of ^Nd in equation (9)). Therefore, we
find no evidence of risk compensating behavior in farmer demand for PPE. To test for
endogeneity, we use a regression based Hausman specification test outlined by Wooldridge
(2003, pg. 483). We fail to reject the assumption of exogeneity as each test has a p-value greater
than 0.45. The endogeneity test for gloves has a power greater than 0.8, though the mask test is
underpowered at the small calculated effect size with a power of 0.3. Still, we find no decisive
evidence of endogeneity and we explore the impacts of knowledge under the assumption of
exogeneity in section 1.6.8 below.
Table 1.7: Effects of endogenous knowledge on WTP for gloves and masks
1st stage Two-stage least
squares IV Tobit
Mask Gloves Mask Gloves
Variables (1) (2) (3) (4) (5)
Treatment assignment 0.257*** (0.055)
Relative toxicity knowledge (predicted) 0.825 -1.253 0.493 -1.645
(2.017) (2.778) (2.650) (3.609)
Observations 476 476 476 476 476
R-squared 0.233 0.145 0.09 0.138 0.082
F-statistic 22.02 Endogeneity test (p-value) 0.922 0.484 0.954 0.493

48
Cluster robust standard errors at the EA level in parentheses. Block fixed effects included in each regression. Significance levels: *** p<0.01, ** p<0.05, * p<0.1. All covariates are from the baseline data. Results are robust to econometric specification: LPM estimates show similar results. Covariate controls included in estimation, but excluded from the table.
1.6.8 Exogenous effects of knowledge on WTP
We also estimate the effects of knowledge on WTP for gloves and masks under the
assumption of exogeneity. We replace predicted knowledge in equation (8) with the knowledge
variable itself. To better understand the potentially competing effects of PPE information and
pesticide toxicity information on demand, we include three knowledge variables in each
regression; knowledge of PPE benefits %�� , relative toxicity knowledge %�&', and their
interaction (%�� ∗ %�&')15. Table 1.8 presents the marginal effects of knowledge of PPE
benefits at each level of relative toxicity knowledge and vice versa. We do not interpret these
results as causal due to concerns about knowledge endogeneity, though the relationships are still
worth exploring.
Knowledge of PPE benefits shows an overall positive and significant relationship to WTP
for gloves and masks in each specification. A one unit increase in the knowledge of PPE benefits
metric corresponds to a 0.7 and 1.0 ZMW increase in WTP for masks and gloves, respectively in
the Tobit estimations. The relationship between knowledge of PPE benefits and WTP is larger
for the farmers with better knowledge of relative toxicity, suggesting that greater knowledge of
each component of pesticide safety is correlated to an increased WTP for masks and gloves.
Table 1.8: Marginal effects of knowledge of PPE benefits and relative toxicity knowledge on WTP for gloves and masks (exogenous information)
Model OLS Tobit
Mask Gloves Mask Gloves
Variables (1) (2) (3) (4)
Marginal effects of knowledge of PPE benefits
15 We lack the three strong instruments necessary to estimate the effects of these three knowledge variables with an IV approach. We also do not have a strong instrument for knowledge of PPE benefits alone as the intervention had insignificant effects on knowledge of PPE benefits.

49
Overall marginal effect 0.527** 0.728** 0.708** 0.968***
(0.244) (0.289) (0.289) (0.353)
Relative toxicity knowledge = 0 0.277 0.517** 0.382 0.665**
(0.207) (0.237) (0.246) (0.292)
Relative toxicity knowledge = 1 1.293** 1.374** 1.709*** 1.897**
(0.477) (0.666) (0.596) (0.894)
Marginal effects of relative toxicity knowledge
Overall marginal effect 0.206 0.147 0.040 -0.018
(0.508) (0.787) (0.614) (0.946)
knowledge of PPE benefits = 0 -3.982** -3.388 -5.428*** -5.095
(1.479) (2.417) (2.099) (3.622)
knowledge of PPE benefits = 1 -2.965** -2.530 -4.101** -3.862
(1.109) (1.851) (1.610) (2.804)
knowledge of PPE benefits = 2 -1.945** -1.672 -2.773** -2.630
(0.765) (1.322) (1.147) (2.018)
knowledge of PPE benefits = 3 -0.932* -0.814 -1.446* -1.398
(0.506) (0.897) (0.757) (1.324)
knowledge of PPE benefits = 4 0.084 0.044 -0.119 -0.165
(0.489) (0.771) (0.604) (0.948)
knowledge of PPE benefits = 5 1.100 0.902 1.209 1.067
(0.732) (1.058) (0.832) (1.231)
Relative toxicity knowledge mean 0.246 0.246 0.246 0.246
knowledge of PPE benefits mean 4.12 4.12 4.12 4.12
Bid mean 4.43 6.7 4.43 6.7
N 476 476 476 476
Cluster robust standard errors at the EA level in parentheses. Significance levels: *** p<0.01, ** p<0.05, * p<0.1.

50
Relative toxicity knowledge has insignificant overall marginal effects on WTP, yet there
are significant marginal effects in the mask estimations when knowledge of PPE benefits is low
(three or less). In the mask regressions, there is a strong negative effect of relative toxicity
knowledge when knowledge of PPE benefits is zero; a one unit increase in relative toxicity
knowledge (i.e., a more accurate perceived toxicity difference between class U and class Ib
pesticides) corresponds to a 5.4 ZMW lower WTP for masks in the Tobit estimation: a large
effect relative to the average mask bid of 4.43 ZMW. That effect diminishes as knowledge of
PPE benefits increases. The average effect of a one unit increase in relative toxicity knowledge
corresponds to a 1.4 ZMW lower PPE bid when a farmer has a knowledge of PPE benefits score
of three in the Tobit, and an insignificant effect above three. The estimates for gloves are similar,
but show less statistical significance. The p-values for the marginal effects of relative toxicity
knowledge in the Tobit estimation for gloves are less than 0.2 for knowledge of PPE benefits
values less than 4. These effects hold when we remove observations that responded, “I don’t
know” to either pesticide toxicity evaluation (shown in Table 1A.6 in the appendix), but they are
less statistically significant for the full sample (estimates shown in Table 1A.10 in the appendix).
Farmers with relative toxicity knowledge scores equal to one perceive the health risks
from low toxicity pesticides to be less than those of high toxicity pesticides, and are better able to
choose pesticides with lower health risks. They may, therefore, have a lower expected benefit
from PPE use and a lower WTP. However, we observe relatively high knowledge of PPE
benefits and that result is consistent with other studies (see for example Yuantari et al., 2015).
Thus, increasing toxicity knowledge is not likely to reduce farmer demand for PPE on average
for many pesticide users. Note that we control for important covariates including farmer

51
education, asset ownership, and tomato area planted, so these results do not stem from farmers
with greater knowledge having generally higher education or income.
1.6.9 Revealed PPE demand robustness check
As a robustness check to our WTP estimates, we analyze market PPE purchases made
between the baseline and endline surveys. Table 1.9 shows similar patterns for the treatment and
control groups in the PPE items purchased at the endline survey (between August and October).
Note that we do not have data for when the PPE purchases were made, and therefore, we cannot
differentiate between purchases made before or after the information intervention. Demand for
boots clearly surpasses demand for other PPE items, though, as mentioned above, their
prevalence likely has to do with added protection and comfort that extend beyond pesticide
exposure reduction into field work and other daily tasks. Regression analyses of intention to treat
effects on PPE purchases show that all differences between treatment and control groups are
insignificant, supporting the insignificant ITT estimates on WTP bids.
Table 1.9: Endline PPE purchases by treatment assignment
All Treatment Control
PPE item
# of farmers
that purchased
Share of farmers
that purchased
# of farmers
that purchased
Share of farmers
that purchased
# of farmers
that purchased
Share of farmers that purchased
Gloves 18 0.04 8 0.03 10 0.04
Mask 14 0.03 6 0.03 8 0.03
Boots 78 0.16 35 0.15 43 0.18
Goggles 10 0.02 3 0.01 7 0.03
Coveralls 16 0.03 6 0.03 10 0.04
Any PPE item 98 0.21 47 0.20 51 0.21
Mean # of PPE items purchased 0.29 0.25 0.32
Lead-farmers excluded because they were given PPE items as demonstration tools for their trainings. Farmers that reported paying a zero price for the items are also excluded.

52
1.7 Conclusion
This paper examines farmer demand for two preventative health goods: protective masks
and gloves. We measured WTP with two BDM mechanisms, and we add to the growing
evidence that BDM mechanisms are useful tools for analyzing demands in field settings (Berry et
al., 2015); eighty nine percent of our sample expressed that the BDM mechanisms were easy to
understand.
We also estimate the effects of health information and knowledge on demand for
preventive health goods. Specifically, we present the first test of the effect of information on
WTP for personal protective equipment among smallholder farmers. We randomly assigned
tomato farmers in rural Zambia to receive pesticide safety information – delivered through a
farmer-to-farmer training and an informational letter – and estimated the effect of treatment
assignment on WTP for protective gloves and masks.
A central result of this paper is that information had an overall insignificant effect on
WTP for gloves and masks. This is consistent with several papers exploring the impacts of
information on demand for preventative health goods. Meredith et al. (2013) find that
information alone had no effect on demand for health goods in a series of experiments. Kremer
and Miguel (2007) find that a health education program implemented in schools has no impact
on hookworm prevention behaviors in Kenya.
This insignificant overall effect of information arises despite some significant knowledge
increases for farmers randomly assigned to receive information. Specifically, the information
improved farmer knowledge that the class U pesticide was not very toxic. However, information
had insignificant effects on knowledge of PPE benefits likely because overall knowledge of PPE
benefits was high prior to the training. Farmers in the control group correctly answered 4 of 5
53
questions on PPE health benefits at the endline. Thus, there was little room for information to
improve knowledge of PPE benefits. While this result is unexpected based on our observations
of farmer behaviors, our finding that farmers are generally knowledgeable of PPE health benefits
is consistent with studies conducted in other countries. Macharia et al. (2013) found Kenyan
vegetable growers to generally know about exposure risks and how PPE can prevent them.
Yuantari et al. (2015) also found that Indonesian farmers have high knowledge of PPE health
benefits. Despite these results, both Macharia et al. (2013) and Yuantari et al. (2015) echo the
common literature observation that trainings are needed to improve farmer safety, implying that
information is a constraint to farmer pesticide safety behaviors.
The theoretical model shows that PPE use and pesticide toxicity may be substitutes in a
farmer’s health production function. Thus, farmers may be substituting risk reducing inputs in
their health production functions by offering lower WTP bids for protective gloves and masks if
they can reduce their health risks through their choices of pesticide toxicities. When we treat
knowledge as exogenous, we find weak evidence consistent with the theory of risk substitution.
Farmers with higher knowledge of relative toxicity but lower knowledge of PPE health benefits
have a lower WTP for masks.
Our finding that relative toxicity knowledge may have a negative effect on WTP for PPE
has important implications for extension. Providing farmers with relative toxicity information
may be important for reducing their health risks by choosing less toxic pesticides (Essay 2), and
for farmers with high knowledge of PPE benefits (most of our sample) these health risk
reductions do not appear to be offset by farmers using less PPE. Therefore, we recommend that
information campaigns targeting safe pesticide use be adapted to farmers’ priors about PPE
benefits and relative toxicity risks. When farmers have low knowledge of PPE benefits and of

54
relative toxicity risks, information campaigns should target both PPE benefits and toxicity
identification and interpretation. When farmers have high knowledge of PPE benefits and low
knowledge of relative toxicity risks (as is the case in this study and is perhaps the most likely
environment in other countries as well), information campaigns should focus on relative
pesticide health risks and toxicity identification rather than the exposure reduction benefits of
PPE.
The overall insignificant effect of information suggests that information is not a major
constraint in farmer adoption of PPE when farmers are knowledgeable of PPE benefits. What,
then, are the main constraints? We find that the first principal component of asset ownership (a
proxy for income) has a significant and positive relationship to WTP for protective gloves and
masks. Thus, PPE is a normal good which is consistent with previous literature on health good
demand in developing countries (see for example Sauerborn et al., 1994). While an income
increase has a direct effect through an individual’s budget constraint, there may be a secondary
effect through a farmer’s health preferences, shown in our conceptual model as an unobservable
variable in PPE demand.
Previous research on other preventative health goods shows liquidity constraints to play
an important role in adoption (Dupas, 2009; Meredith et al., 2013). Though we do not measure
liquidity constraints, the BDM mechanisms allow us to plot demand curves estimate of the price
elasticity of demand for each PPE item. This is an important contribution as it helps us
understand how price changes effect PPE demand and it provides an important estimate of the
potential efficacy of price subsidies in increasing PPE demand. Conceptually, a subsidy would
decrease the marginal cost of investment in PPE and, other things being equal (i.e., if the
perceived marginal benefits of PPE use are unchanged) demand will increase. We find demand

55
to be highly sensitive to price changes near the market price for both gloves and masks (price
elasticity of demand estimates are greater than 5). Thus, subsidies may have large impacts on
PPE demand and PPE use and ultimately on farmer safety. PPE demand curves show that modest
subsidies of 5 ZMW increase demand by more than three times their unsubsidized levels for each
item. We recommend further research to directly test the effects of small price subsidies on
demand for PPE.
However, our results show that PPE ownership does not ensure consistent PPE use. Thus,
improving farmer pesticide safety must address use as well as ownership. One possible
explanation for the observed gap in ownership and use rates is that PPE is uncomfortable for
farmers in tropical climates which may limit its use (Matthews, 2008a). The marginal costs of
discomfort form PPE use could vary by application context (e.g., area to spray and weather at
time of application) and farmers would then choose to use PPE at sometimes but not others.
These discomfort costs of PPE use could of course also contribute to lower demand for PPE in
the first place. Our conversations with farmers in semi-structured interviews farmers confirmed
that farmers view PPE as uncomfortable. Rubber gloves, for example, do not fit tightly on a
farmer’s hands and make opening packaging and mixing pesticides prior to application a
challenge. Thus, designing more comfortable, cooler PPE could increase both demand and use
rates.
Yet another possible reason for low demand is that both PPE items are non-durable goods
that last approximately one growing season under consistent use. Thus, farmers may be reluctant
to make recurring capital investments to protect themselves. Overall, more research is needed to
identify possible constraints to PPE adoption and to identify possibilities to relax these

56
constraints, but we conclude that, when farmers have high knowledge of PPE benefits,
information is unlikely to be a constraint in PPE demand.

57
APPENDIX

58
1A.1 Randomization checks for the BDM mechanism price draws
Table 1A.1 shows regression based tests of randomization for both BDM mechanism
price draws discussed in section 4.c. All tested covariates are insignificant and randomization is
confirmed.
Table 1A.1: OLS regression tests of random BDM mechanism price draws Dependent variable Mask random price draw Gloves random price draw
Independent variables (1) (2)
WTP bid -0.021 -0.055
(0.040) (0.042)
Farmer completed grade 7 0.286 -0.659
(0.301) (0.441)
Farmer had business income 0.075 0.551
(0.290) (0.429)
Asset ownership - 1st principal component -0.104 -0.187
(0.089) (0.131)
Age 0.008 -0.012
(0.012) (0.018)
Female farmer -0.241 -0.416
(0.390) (0.580)
Tomato experience (# of years in last 10) -0.016 0.055
(0.050) (0.074)
Treatment assignment -0.393 -0.434
(0.287) (0.422)
R-squared 0.012 0.025
N 421 422
Farmers that bid '0' had no randomly drawn bid recorded, so they are excluded. Significance levels: *** p<0.01, ** p<0.05, * p<0.1
1A.2 BDM mechanism sequencing effects
We now analyze potential sequencing effects in the order of BDM mechanism bidding.
Table 1A.2 shows that, despite the randomized presentation order, bids are different based on
which item was presented first. Glove bids were 1.1 ZMW lower when presented first
(significant at 5% level), while mask bids were 1.1 ZMW higher when presented first (significant
at 5% level). Thus, farmers that bid on gloves first offered lower bids for each item. To control
for this sequencing in our regression analyses we include an indicator variable for the item
presentation order.

59
Table 1A.2: BDM mechanism bid comparisons conditional on (i) item order, and (ii) first
Mean bid by item order Mean bid by first bid result
Number of zero bids
1st bid 2nd bid Difference Lost 1st bid Won 1st bid Difference
Gloves 90 8.22 9.31 1.09*** 7.28 10.71 3.43***
Mask 98 6.36 5.44 -0.92** 4.61 6.11 1.50***
Means exclude zero bids.
Table 1A.2 also shows that farmers bid higher on each item after they won (purchased)
the first item. Bids for both items depend on the same variables including farmer knowledge, and
are therefore highly correlated. Further, the probability of winning an item is increasing in bid
value. Therefore, farmers that bid higher on the first item were more likely to have won that item
and more likely to bid higher on the second item. Thus, we do not attribute this difference to any
effects resulting directly from winning or losing the first bid, rather we expect that farmers that
bid higher on the first item also bid higher on the second.
1A.3 Intention to treat effects of information on the decision to offer a positive WTP bid
In the BDM mechanisms, we did not restrict the amount of money a farmer could bid.
They were restricted only by currency denominations and could have offered bids as low as 0.5
ZMW16, yet many farmers still chose to offer a zero bid. This might suggest a two-step decision
process in the BDM mechanisms whereby farmers first decided whether to offer a positive bid
and then, conditional on that decision, decided what their bid should be. Thus, in addition to the
overall APE of treatment, it also worth exploring the treatment effects on the two stages of bid
decisions. Cragg’s (1971) double hurdle model offers a more flexible version of the Tobit that
allows for separate estimation of the APEs for each stage (or tier) of the decision process.
However, the double hurdle model specification is restrictive in the sense that we could not use
block fixed effects. The first tier estimation proposed by Cragg (1971) is a probit which suffers
16 Currency denominations smaller than 0.5 ZMW are available in Zambia, but they are not widely accepted or used in rural areas.

60
from the incidental parameters problem in fixed effects estimators and APE estimates are
inconsistent and biased (Greene, 2002)17. An additional estimation problem is that in three
blocks every farmer offered a positive bid, and these 87 observations are dropped from probit
estimations. Rather than reduce the power of our treatment effect estimates by removing block
fixed effects and estimating a probit or a double hurdle model, we explore treatment effects on
the decision to offer a positive bid using a linear probability model (LPM) that provides
consistent fixed effect estimations (Table 1A.3).
Table 1A.3: LPM estimates of intention to treat effects of information on the decision to offer a positive WTP bid for gloves and masks (dependent variable is an indicator variable equal to one if WTP>0)
Model Linear Probability Model
Mask Gloves Variables (5) (6)
Treatment assignment -0.029 -0.027
(0.061) (0.058) Asset ownership - 1st PC 0.024** 0.025**
(0.012) (0.012) Farmer age -0.002 -0.002
(0.001) (0.001) Farmer completed grade 7 0.058 0.069*
(0.041) (0.037) Farmer female 0.052 0.035
(0.039) (0.039) Tomato experience (# of years in last 10) 0.019*** 0.019***
(0.006) (0.006) Business income -0.052 -0.054
(0.041) (0.047) Number of horticultural advice sources 0.015 0.014
(0.011) (0.011) Gloves were first item bid on 0.000 0.000
(0.025) (0.024) Constant 0.642*** 0.644***
(0.143) (0.142) Observations 476 476
R-squared 0.176 0.176
Cluster robust standard errors at the EA level in parentheses. Block fixed effects included in each regression. Significance levels: *** p<0.01, ** p<0.05, * p<0.1
Table 1A.3 shows results that are largely consistent with the OLS and Tobit estimates on
WTP bids in Table 1.5 above. Treatment assignment has an insignificant effect on the probability
17 The incidental parameters problem is an issue in most nonlinear models, but, importantly, Greene (2002) found that Tobit fixed effects estimates were “essentially consistently estimated.”

61
that a farmer offered a positive WTP bid. Asset ownership shows a positive and significant
relationship to the decision to offer a positive WTP bid for gloves and masks, while completing
grade 7 shows a positive effect for gloves only. An additional year of tomato experience
corresponds to a 2% increase in the probability that a farmer offered a positive WTP bid for both
gloves and masks.
1A.4 Relative toxicity knowledge variable robustness checks
As a robustness check on our knowledge estimation results, we define an alternative
relative toxicity knowledge score XP_g�&'. We define XP_g�&' as identical to %�&' (used in the
analysis above) only the farmers that responded, “I don’t know” to either the class Ib or class U
pesticide are coded as missing. %�&' defined these responses as incorrect. Ultimately, the
alternative relative toxicity knowledge variable drops an additional 106 observations from
analysis.
Table 1A.4 shows strong intention-to-treat effects on the alternative relative toxicity
knowledge score (g�&'), and low perceived toxicity differences for the control group. Each result
is consistent with %�&' used in the paper shown in Table 1.4.
Table 1A.4: OLS intention to treat effects of information on relative toxicity knowledge (alternative definition). Comparison: Table 1.4.
Dependent Variable Relative toxicity knowledge (alt) (0,1)
Variables (1)
Treatment assignment 0.227***
(0.058)
Control group mean knowledge 0.176
Observations 370
R-squared 0.23
Cluster robust standard errors at the EA level in parentheses. Block fixed effects included in each regression. Significance levels: *** p<0.01, ** p<0.05, * p<0.1

62
Table 1A.5 shows insignificant effects of the alternative relative toxicity knowledge
variable on WTP for both gloves and masks in our two-stage instrumental variable regressions.
The results are largely similar to those shown in Table 1.7 above.
Table 1A.5: Effects of endogenous knowledge (alternative definition) on WTP for gloves and masks -comparison: Table 1.7
1st stage Two-stage least
squares IV Tobit
Mask Gloves Mask Gloves Variables (1) (2) (3) (4) (5)
Treatment assignment 0.241*** (0.060)
Relative toxicity knowledge
(predicted) 1.123 -0.39 1.19 -0.152
(2.079) (2.762) (2.723) (3.619) Observations 370 370 370 370 370
R-squared 0.245 0.15 0.117 F-statistic 16.16
Endogeneity test (p-value) 0.791 0.733 0.876 0.216
Cluster robust standard errors at the EA level in parentheses. Block fixed effects included in each regression. Significance levels: *** p<0.01, ** p<0.05, * p<0.1. All covariates are from the baseline data. Results are robust to econometric specification: LPM estimates show similar results. Covariate controls included in estimation, but excluded from the table.
Table 1A.6 shows marginal effect estimates of exogenous knowledge variables for
comparison to Table 1.8 above. The results are similar to those discussed above, but are slightly
larger and more statistically significant. Thus, we conclude that our results are not sensitive to
including or excluding “I don’t know” responses in our definition of relative toxicity knowledge.

63
Table 1A.6: Marginal effects of knowledge of PPE benefits and relative toxicity knowledge (alternative definition) on WTP for gloves and masks (exogenous knowledge). Comparison: Table 1.8.
Model OLS Tobit
Mask Gloves Mask Gloves
Variables (1) (2) (3) (4)
Marginal effects of knowledge of PPE benefits
Overall marginal effect 0.550** 0.696* 0.704** 0.904**
(0.249) (0.356) (0.308) (0.451)
Relative toxicity knowledge = 0 0.167 0.363 0.232 0.472
(0.236) (0.317) (0.256) (0.353)
Relative toxicity knowledge = 1 1.378*** 1.417* 1.723*** 1.837*
(0.489) (0.717) (0.612) (0.941)
Marginal effects of relative toxicity knowledge
Overall marginal effect 0.267 0.342 0.199 0.323
(0.488) (0.801) (0.575) (0.938)
knowledge of PPE benefits = 0 -4.862** -4.123 -6.117*** -5.461
(1.940) (2.819) (2.302) (3.603)
knowledge of PPE benefits = 1 -3.652** -3.069 -4.627*** -4.096
(1.469) (2.158) (1.763) (2.776)
knowledge of PPE benefits = 2 -2.441** -2.016 -3.137** -2.731
(1.015) (1.528) (1.243) (1.982)
knowledge of PPE benefits = 3 -1.231* -0.962 -1.646** -1.367
(0.617) (0.990) (0.782) (1.281)
knowledge of PPE benefits = 4 -0.021 0.091 -0.156 -0.002
(0.457) (0.769) (0.556) (0.921)
knowledge of PPE benefits = 5 1.189 1.145 1.335 1.363
(0.717) (1.081) (0.799) (1.245)
Relative toxicity knowledge (alt) mean 0.316
knowledge of PPE benefits mean 4.24
Bid mean 4.69 6.92
4.69 6.92
N 370 370 370 370
Cluster robust standard errors at the EA level in parentheses. Significance levels: *** p<0.01, ** p<0.05, * p<0.1.

64
1A.5 Full sample robustness checks
As a robustness check to trimming our sample of outlying data, we present full sample
estimates of each table presented in the paper. Our results are largely robust to trimming, and we
limit our discussion to the few meaningful differences.
Table 1A.9 shows some evidence that relative toxicity knowledge may be endogenous to
WTP for protective gloves. The endogeneity test p-values are close to significant – 0.161 in the
two-stage least squares estimation, and 0.216 in the instrumental variables (IV) Tobit estimation.
Table 1A.10 shows full sample marginal effect estimates of exogenous relative toxicity
knowledge at each level of knowledge of PPE benefits and vice versa. While the results for
knowledge of PPE benefits are similar to the trimmed sample results presented in Table 1.9, the
marginal effects of relative toxicity knowledge show no significance in the full sample where the
Table 1.9 shows significant effects for mask estimations when knowledge of PPE benefits is low
(less than 3). Table 1A.10 shows that the marginal effects of relative toxicity knowledge on WTP
for masks when knowledge of PPE benefits is low have p-values less than 0.30 in both the OLS
and the Tobit. Thus, the exogenous knowledge estimates are not robust to trimming outlying
data.
Table 1A.7: Full sample comparison to Table 1.4. OLS intention to treat effects of information on knowledge of PPE benefits and relative toxicity knowledge
Dependent Variable Relative toxicity knowledge (0,1) knowledge of PPE
benefits (0-5)
Variables (1) (2)
Treatment assignment 0.260*** 0.134
(0.050) (0.161)
Control group mean knowledge 0.12 4.05
Observations 505 505
R-squared 0.219 0.132
Cluster robust standard errors at the EA level in parentheses. Block fixed effects included in each regression. Significance levels: *** p<0.01, ** p<0.05, * p<0.1

65
Table 1A.8: Full sample comparison to Table 1.5. OLS and Tobit estimates of intention to treat effects of information on WTP for gloves and masks
Model OLS Tobit
Mask Gloves Mask Gloves
Variables (1) (2) (3) (4)
Treatment assignment 0.244 -0.897 0.168 -1.025
(0.571) (0.797) (0.742) (1.020)
Asset ownership - 1st PC 0.293*** 0.564*** 0.366*** 0.670***
(0.098) (0.131) (0.108) (0.151)
Farmer age -0.017 -0.006 -0.023 -0.013
(0.016) (0.024) (0.019) (0.029)
Farmer completed grade 7 1.297** 1.213* 1.586*** 1.623**
(0.479) (0.638) (0.564) (0.776)
Farmer female -0.565 -0.624 -0.434 -0.515
(0.416) (0.912) (0.509) (1.065)
Tomato experience (# of years in last 10) 0.038 0.120 0.098 0.209
(0.058) (0.108) (0.074) (0.127)
Business income 0.096 0.008 -0.044 -0.236
(0.368) (0.598) (0.461) (0.738)
Number of horticultural advice sources 0.134 0.217 0.178 0.270
(0.141) (0.215) (0.165) (0.242)
Gloves were first item bid on -0.564* -0.683* -0.620* -0.725
(0.281) (0.385) (0.334) (0.466)
Constant 3.545*** 6.359*** 2.471 4.856**
(1.278) (1.405) (1.669) (1.900)
Sigma 4.694*** 7.010***
(0.214) (0.481)
Observations 505 505 505 505
R-squared 0.157 0.103
Cluster robust standard errors at the EA level in parentheses. Block fixed effects included in each regression. Significance levels: *** p<0.01, ** p<0.05, * p<0.1
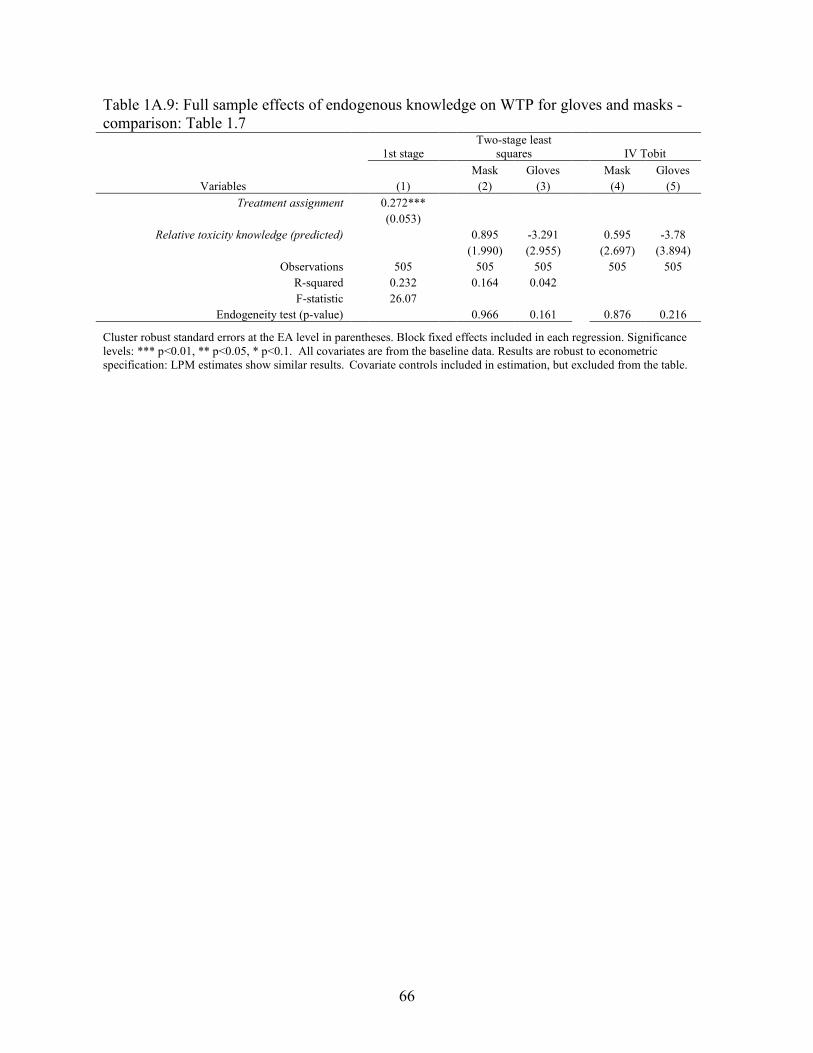
66
Table 1A.9: Full sample effects of endogenous knowledge on WTP for gloves and masks -comparison: Table 1.7
1st stage Two-stage least
squares IV Tobit
Mask Gloves Mask Gloves
Variables (1) (2) (3) (4) (5)
Treatment assignment 0.272***
(0.053) Relative toxicity knowledge (predicted) 0.895 -3.291 0.595 -3.78
(1.990) (2.955) (2.697) (3.894)
Observations 505 505 505 505 505
R-squared 0.232 0.164 0.042 F-statistic 26.07
Endogeneity test (p-value) 0.966 0.161 0.876 0.216
Cluster robust standard errors at the EA level in parentheses. Block fixed effects included in each regression. Significance levels: *** p<0.01, ** p<0.05, * p<0.1. All covariates are from the baseline data. Results are robust to econometric specification: LPM estimates show similar results. Covariate controls included in estimation, but excluded from the table.

67
Table 1A.10: Full sample comparison to Table 1.8. Marginal effects of knowledge of PPE benefits and relative toxicity knowledge on WTP for gloves and masks
Model OLS Tobit
Mask Gloves Mask Gloves
Variables (1) (2) (3) (4)
Marginal effects of knowledge of PPE benefits
Overall marginal effect 0.510** 0.829*** 0.708** 1.116***
(0.244) (0.304) (0.300) (0.385)
Relative toxicity knowledge = 0 0.308 0.743** 0.438* 0.937***
(0.209) (0.272) (0.257) (0.339)
Relative toxicity knowledge = 1 1.132* 1.093 1.539** 1.665
(0.578) (0.777) (0.748) (1.060)
Marginal effects of relative toxicity knowledge
Overall marginal effect 0.573 0.196 0.399 -0.023
(0.521) (0.753) (0.638) (0.943)
knowledge of PPE benefits = 0 -2.818 -1.245 -4.134 -3.019
(2.137) (3.187) (3.003) (4.588)
knowledge of PPE benefits = 1 -1.995 -0.895 -3.033 -2.292
(1.611) (2.439) (2.301) (3.542)
knowledge of PPE benefits = 2 -1.171 -0.545 -1.932 -1.564
(1.104) (1.716) (1.617) (2.522)
knowledge of PPE benefits = 3 -0.348 -0.195 -0.831 -0.836
(0.662) (1.072) (0.993) (1.576)
knowledge of PPE benefits = 4 0.476 0.155 0.270 -0.109
(0.504) (0.747) (0.637) (0.960)
knowledge of PPE benefits = 5 1.299 0.506 1.371 0.619
(0.817) (1.082) (0.936) (1.293)
Relative toxicity knowledge mean 0.256
knowledge of PPE benefits mean 4.117
Bid mean 4.78 7.3
4.78 7.3
N 505 505 505 505
Cluster robust standard errors at the EA level in parentheses. Significance levels: *** p<0.01, ** p<0.05, * p<0.1.

68
1A.6 Protective gloves and dust mask pictures
Figure 1A.1: Protective gloves and masks used in BDM mechanisms

69
1A.7 BDM mechanism introduction and sample script
Figure 1A.2: Sample Becker-DeGroot-Marschak mechanism script Interviewer: Please read this script in its entirety to the respondent and ensure that they understand its meaning.
You will now have the opportunity to purchase a pair of protective gloves and a dust mask. The price of each item will be determined by chance in a special game. You will not have to spend any more on any item than you truly want to. Let us begin by describing this procedure… First, I will show you an item available for sale and ask you to tell me the MAXIMUM PRICE you are willing to pay for the Item. After you state your MAXIMUM PRICE, you will be shown a stack of cards and you will be asked to draw one. Each card lists a price. The price on the card that you draw will be the price of the item. If the price that you stated as your maximum price is GREATER than the price on the card, then you will BUY the item AT THE PRICE ON THE CARD. If the price that you stated as your maximum price is LESS than the price on the card, then you will NOT BUY the item. You CANNOT change your bid after a card is drawn. If your MAXIMUM price is Less than the price on the card you will NOT be given another chance to buy the item. You must state a price that you are actually able to pay. We are about to begin a practice round, but do you have any questions?
SOAP SALE - PRACTICE GAME
Before we play for the Gloves and the Mask, we'll play a practice game for a bar of soap. The games for the Gloves and Mask will follow the exact same rules. What is the MAXIMUM price you are willing to pay for this soap? (let respondent handle the soap)
_______________________ Now, if you pick a number that is less than or equal to (BID), you will buy the soap at the price you pick. If you pick a number greater than (BID), you will not be able to purchase the soap, even if you are willing to pay the greater number. You cannot change your bid after you draw a price card. Do you understand? If farmer does not understand, please begin script again and allow for questions to ensure they understand.
If the farmer understands, please proceed. Please tell me if you pick a card with (BID + 1 Kwacha) on it, what happens? If respondent does not give correct
answer, explain the rules again.
Please tell me if you pick a card with (BID - 1 Kwacha) on it, what happens? If respondent does not give correct
answer, explain the rules again. So, if you draw (BID + 1 Kwacha) you will NOT be able to buy the soap at that price. Do you want to change your bid? If yes, What is the MAXIMUM price you are willing to pay for this soap? (let respondent handle the soap)
_______________________ If you draw a card with price (BID), then you must be able to pay (BID). Are you able to pay (BID) now? If NOT, What is the MAXIMUM price you are willing AND ABLE to pay for this soap? (let respondent handle the
soap) ________________ Could you please fetch the (BID) amount and show it to me? Now you will select a price card that will determine whether you buy the soap or not. Are you ready? Mix cards and
display them face down so respondent cannot see them.
PLEASE DRAW A CARD.
Enumerator- please record the price on the card drawn.
Is the price on the card LESS than the Maximum bid? (1 = Yes � BDM_PRAC18, 2 = No �BDM_PRAC19)
If YES, Do you wish you had bid less and reduced your chances of buying the soap?
If NO, Do you wish you had bid HIGHER to increase your chances of buying the soap?
If Card Price < Bid, then complete the transaction – accept payment and give the soap. If not, explain the outcome and why they did not buy the soap. Do you have any questions about the game?

70
1A.8 Pesticide training summary letter
Figure 1A.3: Pesticide training summary letter (page 1)

71
Figure 1A.4: Pesticide training summary letter (page 2)

72
REFERENCES

73
REFERENCES
Ahuja, A., Kremer, M., & Zwane, A. P. (2010). Providing safe water: Evidence from randomized
evaluations. Annu. Rev. Resour. Econ., 2(1), 237–256.
Ashraf, N., Berry, J., & Shapiro, J. M. (2007). Can higher prices stimulate product use? Evidence from a field experiment in Zambia. National Bureau of Economic Research. Retrieved from http://www.nber.org/papers/w13247
Baum, C. F., Schaffer, M. E., Stillman, S., & others. (2007). Enhanced routines for instrumental variables/GMM estimation and testing. Stata Journal, 7(4), 465–506.
Beauman, L., & Dillon, A. (2014). The diffusion of agricultural technologies within social networks: Evidence from composting in Mali. Enhancing women’s assets to manage risk under climate change: Potential for group-based approaches, 47-49.
Becker, G. M., DeGroot, M. H., & Marschak, J. (1964). Measuring Utility by a Single-Response Sequential Method. Behavioral Science, 9(3). 226-32.
Benyishay, A., Jones, M., Kondylis, F., Mobarak, A. M., & others. (2016). Are gender differences in performance innate or socially mediated? The World Bank. Retrieved from http://www-wds.worldbank.org/servlet/WDSContentServer/WDSP/IB/2016/05/31/090224b084380602/1_0/Rendered/PDF/Are0gender0dif00socially0mediated00.pdf
Berry, J., Fischer, G., & Guiteras, R. (2012). Eliciting and utilizing willingness to pay: evidence from field trials in Northern Ghana. Unpublished Manuscript. Retrieved from http://personal.lse.ac.uk/fischerg/Assets/BFG-BDM-April-2012.pdf
Bertrand, M., Duflo, E., & Mullainathan, S. (2004). How Much Should We Trust Differences-in-Differences Estimates? Quarterly Journal of Economics, 119(1), 249–275.
Bohm, P., Lindén, J., & Sonnegård, J. (1997). Eliciting reservation prices: Becker-DeGroot-Marschak mechanisms vs. markets. The Economic Journal, 107(443), 1079–1089.
Bruhn, M., & McKenzie, D. (2009). In pursuit of balance: Randomization in practice in development field experiments. American Economic Journal: Applied Economics, 1(4), 200–232.
Cachomba, S., Cairns, J., Tschirley, D., & Snyder, J. (2013). Risk Perception and Behavior in Pesticide Use by the Horticultural Producers of. Retrieved from http://citeseerx.ist.psu.edu/viewdoc/summary?doi=10.1.1.644.8727
Cameron, A. C., Gelbach, J. B., & Miller, D. L. (2008). Bootstrap-based improvements for inference with clustered errors. The Review of Economics and Statistics, 90(3), 414–427.

74
Cohen, A., & Einav, L. (2003). The effects of mandatory seat belt laws on driving behavior and traffic fatalities. Review of Economics and Statistics, 85(4), 828–843.
Cole, S., Sampson, T., & Zia, B. (2011). Prices or knowledge? What drives demand for financial services in emerging markets? The Journal of Finance, 66(6), 1933–1967.
Cutler, D. M., & Lleras-Muney, A. (2010). Understanding differences in health behaviors by education. Journal of Health Economics, 29(1), 1–28.
Crissman, C. C., Cole, D. C., & Carpio, F. (1994). Pesticide use and farm worker health in Ecuadorian potato production. American Journal of Agricultural Economics, 76(3), 593–597.
Dasgupta, S., Meisner, C., & Huq, M. (2007). A pinch or a pint? Evidence of pesticide overuse in Bangladesh. Journal of Agricultural Economics, 58(1), 91–114.
Davis, D. D., & Holt, C. A. (1993). Experimental economics. Princeton university press.
De Walque, D., Kazianga, H., & Over, M. (2011). Antiretroviral therapy awareness and risky sexual behaviors: evidence from Mozambique. Center for Global Development Working
Paper, (239).
Dillon, A., Friedman, J., & Serneels, P. M. (2014). Health information, treatment, and worker productivity: Experimental evidence from malaria testing and treatment among Nigerian sugarcane cutters. World Bank Policy Research Working Paper, (7120).
Dupas, P. (2009). What matters (and what does not) in households’ decision to invest in malaria prevention? The American Economic Review, 99(2), 224–230.
Dupas, P. (2011). Health behavior in developing countries. Annu. Rev. Econ., 3(1), 425–449.
Dupas, P. (2014). Short-run subsidies and long-run adoption of new health products: Evidence from a field experiment. Econometrica, 82(1), 197–228.
Evans, L. (1985). Human behavior feedback and traffic safety. Human Factors: The Journal of
the Human Factors and Ergonomics Society, 27(5), 555–576.
Feder, G., Murgai, R., & Quizon, J. B. (2004). The acquisition and diffusion of knowledge: The case of pest management training in farmer field schools, Indonesia. Journal of Agricultural
Economics, 55(2), 221–243.
Feola, G., & Binder, C. R. (2010). Why Don’t Pesticide Applicators Protect Themselves? International Journal of Occupational and Environmental Health, 16(1), 11–23. https://doi.org/10.1179/oeh.2010.16.1.11
Fishman, R., Kishore, A., Rothler, Y., Ward, P. S., Jha, S., Singh, R. K. P., & others. (2016). Can information help reduce imbalanced application of fertilizers in India? Experimental

75
evidence from Bihar. International Food Policy Research Institute (IFPRI). Retrieved from https://ideas.repec.org/p/fpr/ifprid/1517.html
Fitzsimons, E., Malde, B., Mesnard, A., & Vera-Hernández, M. (2012). Household responses to information on child nutrition: experimental evidence from Malawi. Retrieved from https://papers.ssrn.com/sol3/papers.cfm?abstract_id=2034133
Goeb, J., Cairns Smart, J., Snyder, J., and Tschirley, D. (2015). Information, Pesticide Safety Behaviors, and Perceived Pesticide Health Risks in Maputo. Agricultural Research Institute of Mozambique (IIAM). Chapter 6. Special Issue Collection of Short Papers Focused on Horticultural Production in the Areas Supplying Maputo. http://fsg.afre.msu.edu/Mozambique/survey/Special%20Issue%20Collection%20English%20Version.pdf
Gong, E. (2014). HIV testing and risky sexual behaviour. The Economic Journal. Retrieved from http://onlinelibrary.wiley.com/doi/10.1111/ecoj.12125/full
Gorell, J. M., Johnson, C. C., Rybicki, B. A., Peterson, E. L., & Richardson, R. J. (1998). The risk of Parkinson’s disease with exposure to pesticides, farming, well water, and rural living. Neurology, 50(5), 1346–1350.
Greene, W. (2002). The bias of the fixed effects estimator in nonlinear models. Retrieved from http://people.stern.nyu.edu/wgreene/nonlinearfixedeffects.pdf
Grossman, M. (1972). On the Concept of Health Capital and the Demand for Health. Journal of
Political Economy, 80(2), 223–255.
Hanna, R., Mullainathan, S., & Schwartzstein, J. (2014). Learning through noticing: Theory and evidence from a field experiment. The Quarterly Journal of Economics, 129(3), 1311–1353.
Hashemi, S. M., Hosseini, S. M., & Hashemi, M. K. (2012). Farmers’ perceptions of safe use of pesticides: determinants and training needs. International Archives of Occupational and
Environmental Health, 85(1), 57–66. https://doi.org/10.1007/s00420-011-0641-8
Hichaambwa, M., Chamberlin, J., Kabwe, S., & others. (2015). Is Smallholder Horticulture the Unfunded Poverty Reduction Option in Zambia? A Comparative Assessment of Welfare Effects of Participation in Horticultural and Maize Markets. Citeseer. Retrieved from http://citeseerx.ist.psu.edu/viewdoc/download?doi=10.1.1.697.1482&rep=rep1&type=pdf
Horowitz, J. K. (2006). The Becker-DeGroot-Marschak mechanism is not necessarily incentive compatible, even for non-random goods. Economics Letters, 93(1), 6–11.
Jack, B. K. (2013). “Constraints on the adoption of agricultural technologies in developing countries.” Literature review, Agricultural Technology Adoption Initiative, J-PAL (MIT) and CEGA (UC Berkeley)
Keifer, M. C. (2000). Effectiveness of interventions in reducing pesticide overexposure and poisonings. American Journal of Preventive Medicine, 18(4), 80–89.

76
Kenkel, D. S. (1991). Health behavior, health knowledge, and schooling. Journal of Political
Economy, 287–305.
Kleibergen, F., & Paap, R. (2006). Generalized reduced rank tests using the singular value decomposition. Journal of Econometrics, 133(1), 97–126.
Kremer, M., & Miguel, E. (2007). The illusion of sustainability. The Quarterly Journal of
Economics, 122(3), 1007–1065.
Kremer, M., Miguel, E., Mullainathan, S., Null, C., & Zwane, A. P. (2009). Making water safe: Price, persuasion, peers, promoters, or product design. Unpublished Manuscript.
Lichtenberg, E., & Zilberman, D. (1986). The econometrics of damage control: why specification matters. American Journal of Agricultural Economics, 68(2), 261–273.
Macharia, I., Mithöfer, D., & Waibel, H. (2013). Pesticide handling practices by vegetable farmer in Kenya. Environment, Development and Sustainability, 15(4), 887–902.
Madajewicz, M., Pfaff, A., van Geen, A., Graziano, J., Hussein, I., Momotaj, H., Ahsan, H. (2007). Can information alone change behavior? Response to arsenic contamination of groundwater in Bangladesh. Journal of Development Economics, 84(2), 731–754. https://doi.org/10.1016/j.jdeveco.2006.12.002
Matthews, G. (2008a). Pesticides: Health, Safety and the environment. John Wiley & Sons.
Matthews, G. A. (2008b). Attitudes and behaviours regarding use of crop protection products—A survey of more than 8500 smallholders in 26 countries. Crop Protection, 27(3–5), 834–846. https://doi.org/10.1016/j.cropro.2007.10.013
Matthews, G., Wiles, T., & Baleguel, P. (2003). A survey of pesticide application in Cameroon. Crop Protection, 22(5), 707–714. https://doi.org/10.1016/S0261-2194(03)00008-5
Maumbe, B. M. (2001). Essays on the economics of cotton production in Zimbabwe: policy implications for technology adoption, farmer health and market liberalization. Dissertation. Michigan State University.
Maumbe, B. M., & Swinton, S. M. (2003). Hidden health costs of pesticide use in Zimbabwe’s smallholder cotton growers. Social Science & Medicine, 57(9), 1559–1571.
Meredith, J., Robinson, J., Walker, S., & Wydick, B. (2013). Keeping the Doctor Away: Experimental Evidence on Investment in Preventative Health Products. Journal of
Development Economics, 105, 196–210.
Mobius, M., Phan, T., & Szeidl, A. (2015). Treasure hunt: Social learning in the field. National Bureau of Economic Research. Retrieved from http://www.nber.org/papers/w21014
Negatu, B., Kromhout, H., Mekonnen, Y., & Vermeulen, R. (2016). Use of Chemical Pesticides in Ethiopia: A Cross-Sectional Comparative Study on Knowledge, Attitude and Practice of
77
Farmers and Farm Workers in Three Farming Systems. The Annals of Occupational
Hygiene, 60(5), 551–566. https://doi.org/10.1093/annhyg/mew004
Ntow, W. J., Gijzen, H. J., Kelderman, P., & Drechsel, P. (2006). Farmer perceptions and pesticide use practices in vegetable production in Ghana. Pest Management Science, 62(4), 356–365. https://doi.org/10.1002/ps.1178
Parente, S. T., Salkever, D. S., & DaVanzo, J. (2005). The role of consumer knowledge of insurance benefits in the demand for preventive health care among the elderly. Health
Economics, 14(1), 25–38.
Peltzman, S. (1975). The effects of automobile safety regulation. The Journal of Political
Economy, 677–725.
Pingali, P. L., Marquez, C. B., & Palis, F. G. (1994). Pesticides and Philippine rice farmer health: a medical and economic analysis. American Journal of Agricultural Economics, 76(3), 587–592.
Pitt, M. M., & Rosenzweig, M. R. (1984). Agricultural prices, food consumption, and the health and productivity of Indonesian farmers. In Singh, I., Squire, L., & Strauss, J. (Eds.), Agricultural household models: Extensions, applications, and policy (pp. 153-82). Baltimore, MD: The Johns Hopkins University Press.
Salameh, P. R., Baldi, I., Brochard, P., & Saleh, B. A. (2004). Pesticides in Lebanon: a knowledge, attitude, and practice study. Environmental Research, 94(1), 1–6.
Sauerborn, R., Nougtara, A., & Latimer, E. (1994). The elasticity of demand for health care in Burkina Faso: differences across age and income groups. Health Policy and Planning, 9(2), 185–192.
Savage, E. P., Keefe, T. J., Mounce, L. M., Heaton, R. K., Lewis, J. A., & Burcar, P. J. (1988). Chronic neurological sequelae of acute organophosphate pesticide poisoning. Archives of
Environmental Health: An International Journal, 43(1), 38–45.
Schmid, C. (2015). Consumer health information and the demand for physician visits. Health
Economics, 24(12), 1619–1631.
Sexton, S. E., Lei, Z., & Zilberman, D. (2007). The economics of pesticides and pest control. International Review of Environmental and Resource Economics, 1(3), 271–326.
Sheahan, M., Barrett, C. B., & Goldvale, C. (2016). Human health and pesticide use in Sub-Saharan Africa. Retrieved from http://barrett.dyson.cornell.edu/files/papers/Sheahan%20Barrett%20Goldvale%20-%20SSA%20pesticide%20and%20human%20health%20paper%20-%20Sept.pdf
Sibanda, T., Dobson, H. M., Cooper, J. F., Manyangarirwa, W., & Chiimba, W. (2000). Pest management challenges for smallholder vegetable farmers in Zimbabwe. Crop Protection, 19(8), 807–815.

78
Silles, M. A. (2009). The causal effect of education on health: Evidence from the United Kingdom. Economics of Education Review, 28(1), 122–128.
Snyder, J., Smart, J., Goeb, J., Tschirley, D., & others. (2015). Pesticide use in Sub-Saharan
Africa: Estimates, Projections, and Implications in the Context of Food System
Transformation. Michigan State University, Department of Agricultural, Food, and Resource Economics. Retrieved from https://ideas.repec.org/p/ags/midamp/230980.html
Sosan, M. B., & Akingbohungbe, A. E. (2009). Occupational insecticide exposure and perception of safety measures among cacao farmers in southwestern Nigeria. Archives of
Environmental & Occupational Health, 64(3), 185–193.
Tijani, A. A. (2006). Pesticide use practices and safety issues: The case of Cocoa farmers in Ondo State, Nigeria. J Hum Ecol, 19(3), 183–90.
Viscusi, W. K. (1979). The impact of occupational safety and health regulation. The Bell Journal
of Economics, 117–140.
Wilson, C. (2005). Exposure to pesticides, ill-health and averting behaviour: costs and determining the relationships. International Journal of Social Economics, 32(12), 1020–1034.
Wooldridge, J. M. (2003). Introductory Econometrics. Thomson South-Western. Mason, Ohio.
World Health Organization. (1990). Public health impact of pesticides used in agriculture. Retrieved from http://apps.who.int/iris/handle/10665/39772
World Health Organization. (2010). The WHO recommended classification of pesticides by hazard and guidelines to classification 2009. Retrieved from http://apps.who.int/iris/handle/10665/44271
Yuantari, M. G., Van Gestel, C. A., Van Straalen, N. M., Widianarko, B., Sunoko, H. R., & Shobib, M. N. (2015). Knowledge, attitude, and practice of Indonesian farmers regarding the use of personal protective equipment against pesticide exposure. Environmental
Monitoring and Assessment, 187(3), 1–7.

79
2 TOXICITY AND EFFICACY INFORMATION AND PESTICIDE CHOICE
2.1 Introduction
Pesticides offer large benefits in pest control for agricultural production. They also
present potentially large costs to human health and the environment (Tilman et al., 2001; Tilman
et al., 2002). No population faces larger health risks than small-scale farmers in developing
countries that work directly with the chemicals and are often highly exposed to them due to
incomplete use of personal protective equipment (PPE; see for example Maumbe and Swinton,
2003). With high exposure, farmer pesticide health risks hinge on the toxicity of pesticides a
farmer chooses. Unfortunately, small-scale farmers often have access to some of the most toxic
pesticides commercially produced – World Health Organization (WHO) class Ib (highly
hazardous) pesticides18 – as pesticide regulations and enforcement in developing countries often
lag behind more developed countries and patents on older, more toxic pesticides are often
expired allowing for cheaper imports in developing countries. Use of highly toxic pesticides
often leads to acute poisonings for farmers (Crissman et al., 1994; Pingali et al., 1994).
Antle and Capalbo (1994) offer two possible reasons for risky pesticide behaviors
observed in developing countries. First, farmers may be well informed about pesticide health
risks, but lack alternatives to reduce those risks. Second, farmers may not be well informed and
may unintentionally subject themselves to health risks. Farmers in many developing countries
lack access to reliable, accurate pesticide information. Based on this, many previous studies
recommend information interventions to reach small-scale farmers with accurate pesticide safety
18 This paper uses the World Health Organization’s toxicity classifications (WHO, 2009) to represent potential human health hazards of pesticide use, as is standard in the international pesticide literature. The toxicity classes are as follows; Ib, highly hazardous, II, moderately hazardous, III, slightly hazardous, and U, unlikely to be hazardous.

80
information in the hope that this will improve safety practices (see for example Ntow et al.,
2006). However, the safety practices most often described are PPE use and pesticide handling,
storage, and disposal methods (Matthews et al., 2003; Ntow et al., 2006; Hashemi et al., 2011;
Tijani, 2006). Pesticide choices and toxicity receive less direct attention. For example,
Athukorala et al. (2012) find that volume of pesticides applied and application frequency are
significantly related to farmer health costs in Sri Lanka, but the authors do not directly measure
of pesticide toxicity. Maumbe and Swinton (2003) account for volume of pesticides applied by
toxicity class for cotton farmers in Zimbabwe and find more toxic pesticides to be significantly
related to the number of acute illnesses experienced. Programs promoting Integrated Pest
Management (IPM) techniques have successfully reduced the quantities of pesticides applied
(Pimentel and Burgess, 2014), but the toxicity of the pesticides chosen is perhaps equally
important. There has yet to be any empirical investigation of the relationship between farmer
pesticide information and pesticide demand as it relates to toxicity. We thus do not know if
improved information will induce product substitution and cause farmers to select less toxic
pesticides and reduce health risks.
Inaccurate or incomplete pesticide information presents two potential problems of
misunderstanding for farmers choosing which pesticides to buy. First, farmers may misinterpret
pesticide toxicity labels, and may therefore be unable to properly adjust their choices to the
varied pesticide health risks. Researchers have used non-market valuation methods to identify a
positive willingness-to-pay (WTP) for pesticides with a reduced health risk (Kouser and Qaim,
2013; Cuyno et al., 2001; Garming and Waibel, 2009; Khan, 2009), though it is not immediately
clear how this positive WTP would manifest itself in farmer pesticide choices. Valuing a reduced
pesticide health risk does not translate well to actual pesticide attributes – namely toxicity – as

81
farmers often misinterpret or misunderstand toxicity (Ntow et al., 2006; Rother, 2008; Maumbe,
2001). There is evidence from more developed countries that health information can drive
product substitution in demand for butter (Marette et al., 2007) and fish (Chang and Kinnucan,
1991). However, the literature has not yet tested how toxicity information might change farmer
demand for pesticides across toxicity classes.
The second potential problem is that farmers with inaccurate or incomplete pesticide
information may resort to using price (a simple, and readily available pesticide attribute) as a
proxy for pest-kill efficacy (a more complex pesticide attribute) and therefore make relatively
inefficient pesticide purchase decisions. Consumers with low product information use price as a
cue for product quality for several products unrelated to pesticides (Zeithaml, 1988; Wolinsky,
1983; Bagwell and Riordan, 1988). Previous research has not identified a price-quality
perception for pesticides, though there is reason to expect one; farmers may have incomplete
efficacy information as acquiring pesticide efficacy information is costly for two reasons. First,
farmers face a wide and changing choice set of pesticides19 approved for use on tomatoes and use
only a small subset of the available pesticides in a given year; as a result, they slowly learn
product efficacy through experience. Second, farmers face heterogeneous production
environments that might make shared information on product efficacy less applicable to their
own plots. Previous research shows that better product information weakens the quality signal
indicated by price for products unrelated to pesticides (Zeithaml, 1988; Bagwell and Riordan,
1988). However, we are not aware of any research that tests if information refuting a price-
quality relationship changes pesticide demand20.
19 We observed variation in pesticide availability in most retail outlets as well as introduction of multiple new products over a five-month period. 20 We observed variations in price across retail outlets for the same product and at the same time. Thus, price is not likely to be a reliable signal of product quality.
82
The literature thus presents two important research gaps. First, we do not know if more
complete and more accurate toxicity information leads to changes in farmer pesticide demand as
it relates to toxicity. Second, we do not know if farmers hold a price-quality perception for
pesticides, nor do we know if price-efficacy information changes this perception. We address
these gaps by randomly assigning farmers to receive information on pesticide toxicity and price-
efficacy relationships through a farmer-to-farmer training21 and an informational letter. We test
for farmer pesticide substitution across toxicity classes by comparing treatment group demand
for pesticide toxicity classes pre- and post-information intervention with a control group in three
ways. First, we compare the choice share distributions for pesticide choice toxicity classes for the
treatment and control groups at both the baseline and endline. Second, we use a difference-in-
difference regression that compares the toxicities of individual choices at the baseline and
endline for the treatment and control group. Third, we estimate conditional logit regressions on
farmer choices and analyze differences between the treatment and control group at the baseline
and endline.
Our research is the first to document a price-efficacy perception for pesticides among
smallholder farmers and the first to identify a relationship between information and pesticide
demand by toxicity class. We present evidence that providing farmers with pesticide toxicity
information, and information countering a positive price-efficacy association can (i) increase
demand for lower toxicity pesticides, and (ii) diminish any perceived price-efficacy relationship.
To summarize, this paper makes three contributions to the pesticide demand and health
literature. First, we randomly assign farmers to receive pesticide information and can thus more
accurately identify the causal impact of information on pesticide demand. Second, we focus on
21 Farmer-to-farmer trainings are a common rural training method that utilize local “lead farmers” to train nearby farmers. We discuss farmer-to-farmer trainings in more detail in section 4.b. below.
83
toxicity and not on abstract health outcomes like “reductions in health risks,” which allows us to
learn about farmer toxicity preferences. Third, we test for a perceived price-efficacy relationship
and identify the effect of information against such a relationship on pesticide choices.
In the next section, we provide a brief discussion of pesticide use in Southern Africa. In
section 3, we describe the theoretical model that uses a health production framework to interpret
how information might impact (i) the toxicity of pesticides that are used and (ii) the effect of
price on farmer choices. Section 4 describes data collection procedures, lays out our randomized
control trial (RCT) design, and explains our choice experiments. Section 5 shows our estimation
methods and section 6 presents our results. Section 7 concludes the paper with implications of
our findings and suggestions for policy makers and researchers.
2.2 Pesticide use in Southern Africa
Pests can dramatically reduce production and the share of production that meets the
informal market standards for quality. Thus, pests are a major concern for vegetable farmers
worldwide and in Zambia specifically. Zambian vegetable farmers reported pest pressure as the
number one reason for crop loss (Snyder et al., 2015).
To reduce losses from pest damage, vegetable farmers in sub-Saharan Africa
overwhelmingly turn to synthetic pesticides (Sibanda et al., 2000), and smallholder horticulture
producers have access to a generally wide and growing choice set of pesticide products. In
Ghana, farmers applied 43 different pesticides to vegetable crops (Ntow et al., 2006).
Insecticides were the most toxic category of pesticides used; all six observed insecticides were
WHO class II products (ibid.). In Zambia, more than 500 pesticide import licenses were issued in
2007, and the number of licenses issued increased 77% over four years (Bwalya, 2010). While
84
those licenses include disinfectants and some household chemicals, agricultural pesticides
accounted for more than 90% of the value of chemicals imported (ibid.). Included in this wide
list of imported products are several highly hazardous chemicals. More than 75% and 86% of
vegetable producers in Zambia and Mozambique, respectively, applied a WHO class Ib
pesticide, and this class accounted for 25% of all pesticides applied on tomatoes in Zambia
(Snyder et al., 2015). Importantly, the choice sets of products targeting many pests for Zambian
farmers also includes several WHO class U pesticides that are unlikely to cause acute harm in
normal use. Seventy five percent of Zambian vegetable producers applied a WHO class U
pesticide and about one third of all pesticides applied on tomatoes were class U (ibid.). All of the
class Ib pesticides available are insecticides or nematicides, but there are multiple class II and
class U products with similar efficacies for controlling insects and nematodes available. Thus,
Zambian tomato farmers face a wide choice set of pesticides and they can choose less toxic
pesticides with similar efficacies for their target pests if they so desire.
2.3 Theoretical model
In the theoretical model, a risk neutral tomato farmer has one tomato plot in a single
period and makes a discrete pesticide choice to maximize utility from tomato profits and health.
A farmer applies pesticide responsively to pest pressure, meaning if they observe a pest on their
plot they then choose the pesticide that maximizes their utility; all other input decisions are fixed
at the time of the pesticide decision. We define a simple utility function as the sum of utility
from tomato profits h and utility of health � shown in (1) for a binary pesticide variable �22. We
22 By defining utility as a function of profits directly (and not a function of a numeraire consumption good with a budget constraint) we are using a conceptual framework similar to that used by Dillon et al. (2014).

85
assume that farmers do not know each production process perfectly, but they have beliefs about
how each input affects production23.
(1) �(h, �) = �(h) + �(�) s.t.
(2) h = �� ∗ �(�, ijk!, %lmm, �') − �' ∗ �
(3) � = �n − $(�| %�&')
2.3.1 Tomato profits
Tomato profit is tomato revenue – the price of tomatoes �� times the total tomato output
� – minus the cost of the chosen pesticide �' times the amount of pesticide used �. Lichtenberg
and Zilberman (1986) and the damage control literature emphasize that pesticides increase output
by reducing pest damage only, so in this responsive pesticide model tomato output is conditional
on the observed pest pressure ! in the farmer’s tomato plot. A farmer’s tomato output is a
function of pesticides �, and ij – fixed inputs at the time of the pesticide decision. We define the
efficacy of � as the partial derivative of � with respect to � conditional on !. Tomato output is
also a function of farmer knowledge of pesticide efficacy %lmm. A farmer that has higher or
lower knowledge of �’s efficacy in controlling pest ! may have different believed tomato output
from applying �. In addition to efficacy knowledge, we present a farmer’s tomato output as a
function of pesticide price �' (3). There is a wide literature on consumers using readily available
product attributes as cues for product quality when they have limited information about the
product and a leading cue in this literature is a product’s price (Zeithaml, 1988). Thus, farmers
may have varying beliefs of pesticide efficacy based on different price levels.
23 Farmers make decisions based on their beliefs of production processes. To facilitate easier reading, we use the words “beliefs” and “believed” selectively in the remainder of our discussion. We refrain from using the word “expected” because we do not introduce uncertainty in the model.

86
2.3.2 Health production
Pesticides also have well-known health risks that a farmer must consider when making
pesticide choices. We denote health production from pesticide � as a farmer’s initial health stock
�n minus acute sickness $. A product’s potential acute health hazard (or toxicity) is defined as the
partial derivative of � with respect to �. Given the single period decision made in our model, the
more immediate acute illness risks (rather than longer term chronic risks) represent the relevant
sickness effects for farmers choosing pesticides. A farmer’s believed sickness is a function of
pesticides � as well as their toxicity knowledge %�&'. A farmer with more toxicity knowledge is
likely better able to identify a given product’s toxicity and to change their mixing and application
behavior accordingly.
2.3.3 Knowledge and information
Our objective is to understand how information affects pesticide choices, and we model
information’s effect through knowledge: %lmm = glmm(2lmm|4) and %�&' = g�&'(2�&'|4).
Mobius et al. (2015) show that social learning depends on how individuals aggregate new
information into their opinions. We model knowledge as conditional on a learning process 4 that
converts new information into knowledge. For simplicity, this model treats efficacy information
2lmm and toxicity information 2�&' as accurate information only. Each information variable
represents the summation of all information available to the farmer (inclusive of past experience
and information), and knowledge of both efficacy and toxicity is non-decreasing in the
information a farmer has. We allow for a zero change in knowledge because information may
have zero effect if farmers have sufficiently high prior knowledge or if they do not convert new
information to knowledge.

87
2.3.4 Choice rule
A farmer makes discrete choices of which pesticides to purchase, and the resulting choice
rule is as follows: a farmer will choose pesticide �K from choice set o when �K achieves their
highest utility:
(4)
�p���'q(!, %lmm, �'q) − �'qr + �p�n − s'q(%�&')r> �p���'t(!, %lmm, �'t) − �'tr + �p�n − s't(%�&')r
∀ �3v o, 0 ≠ x. where �'q and s'q are the farmer’s believed tomato output and sickness, respectively, produced
by applying �K. The farmer may also choose no pesticide, which can be thought of as a special
element of o.
2.3.5 Toxicity information and choices
To capture the toxicity differences between pesticides, we define a choice set of three
products (o�), one for each of the most common pesticide toxicity classes in our study area; a
low toxicity pesticide �z representing class U products (unlikely to cause acute harm), a medium
pesticide toxicity �{{ representing class II products (moderately harmful), and a high toxicity
pesticide �{| representing class Ib products (very harmful). Sickness produced by each product is
a function of %�&' which is a non-decreasing function of toxicity information 2�&'. We assume
that a farmer becomes more accurate in their sickness beliefs as information increases, meaning
that the believed sickness approaches the true value produced for each product as %�&' increases.
Our model shows that utility is decreasing in the sickness a pesticide produces.
Therefore, if information increases the believed illness produced by one pesticide relative to
another, that pesticide will become relatively less attractive and the farmer will be less likely to
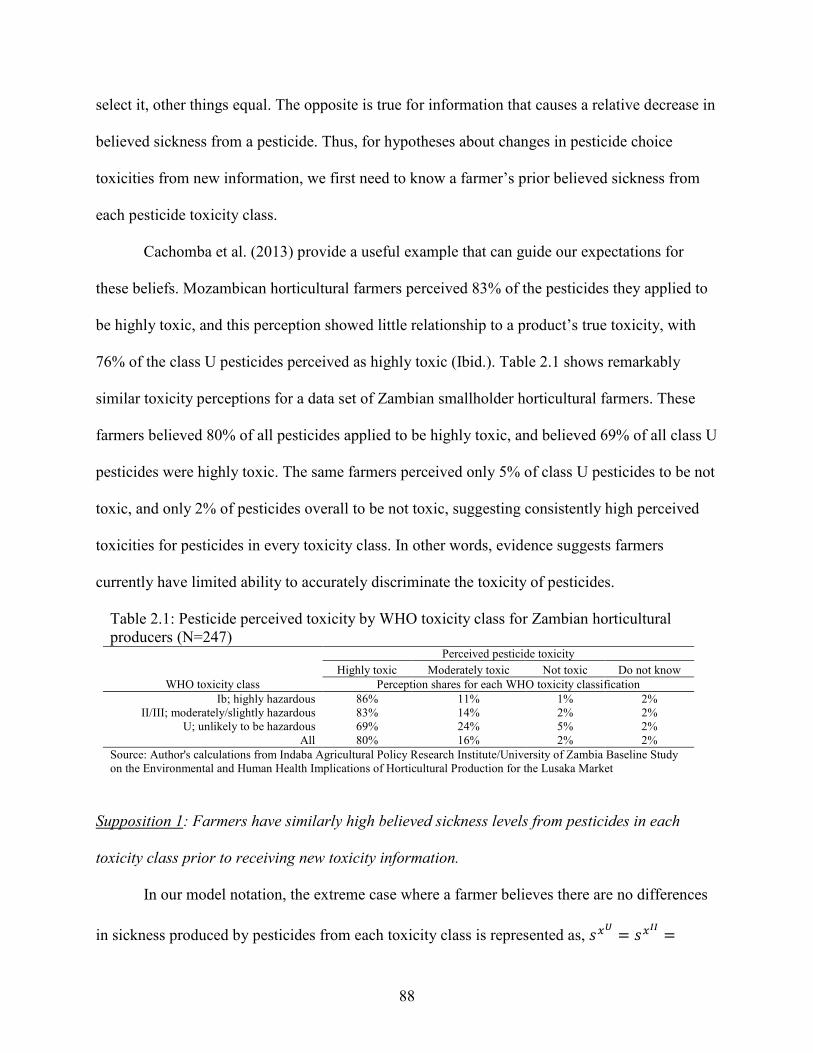
88
select it, other things equal. The opposite is true for information that causes a relative decrease in
believed sickness from a pesticide. Thus, for hypotheses about changes in pesticide choice
toxicities from new information, we first need to know a farmer’s prior believed sickness from
each pesticide toxicity class.
Cachomba et al. (2013) provide a useful example that can guide our expectations for
these beliefs. Mozambican horticultural farmers perceived 83% of the pesticides they applied to
be highly toxic, and this perception showed little relationship to a product’s true toxicity, with
76% of the class U pesticides perceived as highly toxic (Ibid.). Table 2.1 shows remarkably
similar toxicity perceptions for a data set of Zambian smallholder horticultural farmers. These
farmers believed 80% of all pesticides applied to be highly toxic, and believed 69% of all class U
pesticides were highly toxic. The same farmers perceived only 5% of class U pesticides to be not
toxic, and only 2% of pesticides overall to be not toxic, suggesting consistently high perceived
toxicities for pesticides in every toxicity class. In other words, evidence suggests farmers
currently have limited ability to accurately discriminate the toxicity of pesticides.
Table 2.1: Pesticide perceived toxicity by WHO toxicity class for Zambian horticultural producers (N=247) Perceived pesticide toxicity
Highly toxic Moderately toxic Not toxic Do not know
WHO toxicity class Perception shares for each WHO toxicity classification
Ib; highly hazardous 86% 11% 1% 2% II/III; moderately/slightly hazardous 83% 14% 2% 2%
U; unlikely to be hazardous 69% 24% 5% 2% All 80% 16% 2% 2%
Source: Author's calculations from Indaba Agricultural Policy Research Institute/University of Zambia Baseline Study on the Environmental and Human Health Implications of Horticultural Production for the Lusaka Market
Supposition 1: Farmers have similarly high believed sickness levels from pesticides in each
toxicity class prior to receiving new toxicity information.
In our model notation, the extreme case where a farmer believes there are no differences
in sickness produced by pesticides from each toxicity class is represented as, s'} = s'~~ =
89
s'~� = s̅. When no differences in sickness are perceived across products, farmers will make
pesticide decisions solely to maximize profits from pesticide use with no consideration of
sickness effects. Table 2.1 suggests s̅ ≈ s̅'~� where s̅'~�
represents the true sickness produced by
the high toxicity pesticide.
Hypothesis 1: After receiving more accurate toxicity information, farmers will choose less toxic
pesticides more often.
We expect farmers that receive toxicity information to adjust their sickness production
beliefs for less toxic pesticides downward. In our notation after receiving toxicity information, a
farmer has a more accurate ordering of sickness produced by pesticides in each toxicity class,
s'} < s'~~ < s'~�. This implies utility changes in the same order with the largest increase in
expected utility for WHO class U pesticides, other things equal. However, because choices are
discrete, actual choice differences by toxicity class will depend on the relative magnitudes of the
sickness differences across products and on the profits from each product which depend on the
efficacy of the pesticide on the observed pest.
While we expect many choice changes to be substitutions to less toxic pesticides away
from more toxic pesticides, a decrease in the perceive health risks of class U pesticides could
cause an increase in demand for pesticides when a farmer would not otherwise purchase a
pesticide. If the farmer’s prior perceived marginal health costs of using a pesticide are high such
that the total marginal costs exceed the marginal benefits from using a pesticide, then the farmer
will purchase no pesticide. If informed farmers then have decreased perceived health cost of a
class U pesticide, then the perceived benefit of using that pesticide may exceed the total
perceived costs and the farmer may purchase a pesticide. This type of substitution would
potentially have positive tomato production effects if farmers increased the pesticides applied to

90
their crop. Thus, decreasing health costs and increasing tomato production may both be benefits
of increasing demand for lower toxicity pesticides.
2.3.6 Efficacy information and choices
Pesticide efficacy information may play a similarly important role in farmer pesticide
choices. While we do not know a farmer’s believed tomato output produced by each pesticide
conditional on observed pest pressure, acquiring pesticide efficacy information is costly for rural
farmers for reasons discussed in section 2.1. In instances of low information for products
unrelated to pesticides, consumers often turn to more obvious cues as proxies of quality
(Zeithaml 1988), and price is perhaps the most obvious cue for pesticide decisions made by
farmers. As with toxicity information, we assume that a farmer becomes more accurate in their
beliefs on pest control efficacy for each pest as information increases.
Supposition 2: Farmers believe tomato output to be increasing in pesticide price (i.e., that higher
priced pesticides have greater efficacy) prior to receiving new pesticide efficacy information.
In our model notation, �' is conditional upon and increasing in �'. Under Supposition 2,
there may be a range of prices where a farmer could perceive that a pesticide with a higher price
would generate higher profits than a pesticide with a lower price, thereby creating greater utility
for the higher priced pesticide, other things equal.
Hypothesis 2: After receiving more accurate price-efficacy information farmers will choose
higher priced pesticides less often.
As 2lmm increases, farmers will rely less on price as a cue for efficacy (Zeithaml, 1988).
Therefore, the expected profit difference between the low and high priced options will decrease
as farmers increasingly rely on 2lmm rather than �' to guide their tomato production expectations.
With perfect information, price will have a strictly negative effect on utility as it enters the

91
farmers expected profits only as a cost. The benefits to the farmer will be in their tomato profits;
if a farmer chooses less costly products with similar efficacies, they will increase tomato profits.
2.4 Data & experimental design
The empirical strategy of this paper is to implement an RCT of the effects of information
on pesticide demand, where information is randomly assigned, and farmer pesticide choices are
elicited using a choice experiment. We implemented baseline interviews prior to the information
intervention, executed the intervention, and followed-up with endline interviews of the same
sample. We collected stated and revealed pesticide demand data at both the baseline and the
endline, allowing multiple tests of our two hypotheses.
2.4.1 Data
To allocate resources, the Zambian government divides each district into multiple
Agricultural Camps. We selected three Agricultural Camps in Mkushi District, Zambia as our
study area for the region’s high concentration of tomato farmers. Within this study area, we
identified 711 farmers that produced tomatoes in the year prior to the baseline survey by first
holding a camp level meeting introducing them to the program and then following up with a
listing of farmers at their respective households. After identifying the population of tomato
farmers, we designed the experiment to maximize our statistical power within our budget
constraint.
We could not use existing village structures as the unit of randomization due to variations
in size and inconsistent farmer definitions of what a “village” was24. Instead, we used spatial data
taken from our farmer listing to create 32 Enumeration Areas (EAs) of 20-30 farmers that lived
24 Many farmers defined their “village” as their household compound consisting mostly of family members, and many insisted that they were not part of a broader village structure containing many households.

92
in relative proximity to each other. We used natural delineations (e.g., rivers and hills) to
separate the EAs whenever possible. We then randomly selected 16 farmers from farmer lists
within each EA for a total sample of 512 farmers. To facilitate our EA-level information
intervention we randomly selected 16 EAs as the treatment group to receive pesticide
information. To increase our statistical power, we blocked EAs by their baseline pesticide safety
knowledge before randomly assigning EAs into treatment and control groups.
We conducted detailed baseline interviews with these 512 farmers and obtained data on
household and farmer demographics, pesticide purchases and knowledge, extension and
information sources, acute symptoms experienced from pesticide use, and pesticide choices from
two choice experiments (described below in section 2.4.4). Approximately three months after the
baseline interviews – and approximately two months after the information intervention for the
treatment group (described below in section 2.4.2) – we conducted an endline survey that closely
mirrored the baseline data. Notably, we implemented the exact same choice experiment scenarios
for each farmer during baseline and endline. Both interviews were conducted in the respondent’s
preferred language: English or the local dialect (Bemba or Lala).
We developed the initial questionnaire after 37 semi-structured, informal farmer
interviews focused on pesticide purchasing behaviors, mixing and application techniques, and
information sources. We also observed four in-field pesticide applications, and visited 16
pesticide retail outlets to catalogue available pesticides and to talk with agronomists and
salespeople. We then pretested the questionnaire with about 50 farmers for comprehension and to
ensure that none of the modules were too cognitively taxing, and we modified the final
questionnaire accordingly.
93
The final sample for analysis is a panel of 488 tomato farmers, which reflects 7
observations of attrition and 17 observations trimmed for outlying data points. The attrition
observations are well balanced over treatment and control groups and statistically similar to the
non-attrition farmers. The trimmed observations are outlying farmers (three times the standard
deviation from the mean) in the first principal component of 12 durable assets owned, the area of
tomatoes planted, or the number of pesticides applied, all of which are potentially meaningful
variables in pesticide demand.
2.4.2 Information intervention
Approximately one month after the baseline interviews, the treatment group received
pesticide information through a farmer-to-farmer (f2f) training program (also called lead farmer
training programs) and personalized letters containing a summary sheet of the pesticide content.
F2f training programs are a commonly used extension method that delivers information to rural
farmers through “lead farmers” (or farmer trainers) that are selected within the communities they
train. The f2f training literature, while limited, shows generally positive results. Amudavi et al.
(2009) and Alene and Manyong (2006) show that f2f trainings can increase farmer knowledge
and technical efficiency. BenYishay and Mobarak (2013) use an RCT to identify a f2f training
program’s effects on farmer knowledge and technology adoption. They find that the programs
are more effective when the lead farmers are more similar to their follower farmers, and when
the lead farmers are given small incentives compared to no incentives.
The general design of f2f programs, which is tailored and modified to meet specific
objectives in different contexts, is to first train the lead farmers together as a group in a central
location, then send them back to their communities to train other farmers on the same content.
By using local farmers as trainers, this method saves costs while simultaneously delivering

94
information through a well-respected member within the target community. Our training
followed this general structure.
At the baseline interview, each respondent voted for a lead farmer within their EA, and
the leading vote recipient for each treatment group EAs attended a two-day training workshop.
We designed the content to emphasize four points. The first was pesticide toxicity, specifically
highlighting the large relative health risk differences between class U pesticides and class Ib
pesticides. The second was farmer protection offered by using personal protective equipment
(PPE). The third point of emphasis was providing evidence against the common positive price-
efficacy perception, using market counterexamples. Fourth, we acquainted farmers with a subset
of locally available pesticides. The lead farmers then returned to their villages and, within one
week, held local trainings of the same content for the other tomato farmers in their EAs.
In addition to the local trainings, the lead farmers sent letters summarizing the training
content through the informal mail network in their communities. The informal mail network
delivers letters – locally referred to as bush notes – through the local schools and relies on
students from the surrounding area to carry and deliver letters to their intended recipients. The
training summary was a one-page, color printout that emphasized the three training focal points.
The letters also contained a personalized, hand-written note from the lead farmer to the village
farmer intended to make the letter more personal and impactful.
The two pieces together constituted the information intervention. Our objective was to
reach as many farmers as possible with the information, not to identify the effects of the training
and the letter independently.
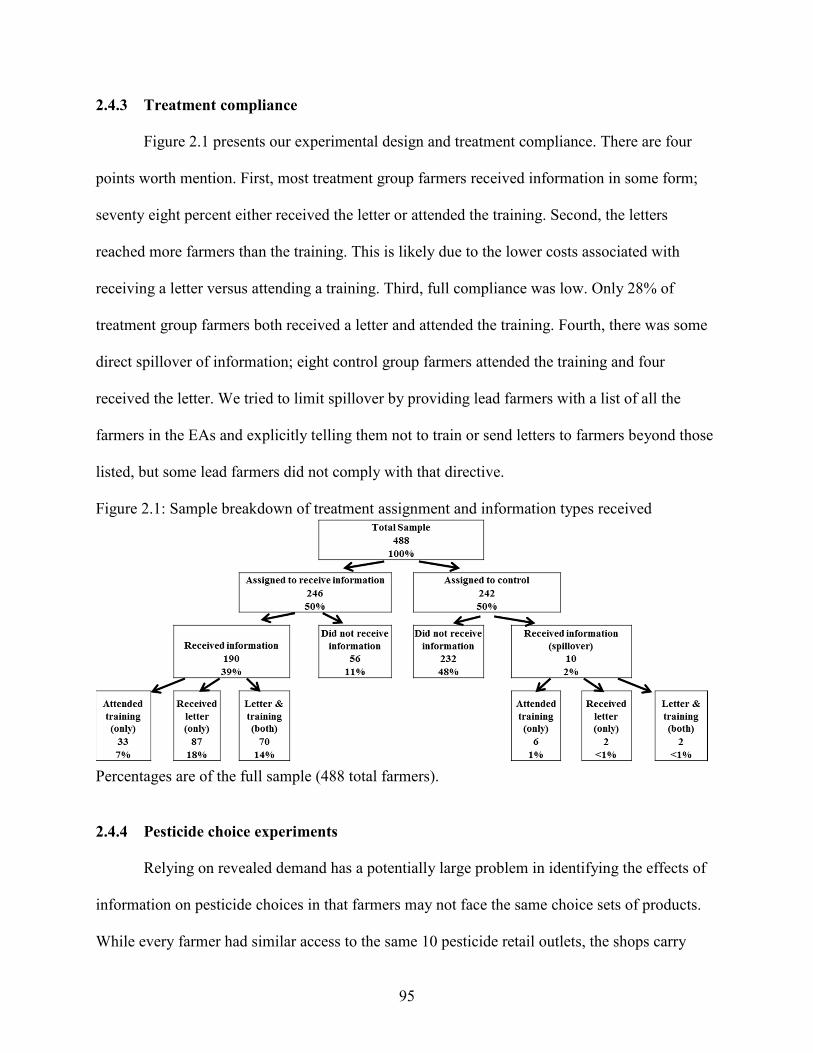
95
2.4.3 Treatment compliance
Figure 2.1 presents our experimental design and treatment compliance. There are four
points worth mention. First, most treatment group farmers received information in some form;
seventy eight percent either received the letter or attended the training. Second, the letters
reached more farmers than the training. This is likely due to the lower costs associated with
receiving a letter versus attending a training. Third, full compliance was low. Only 28% of
treatment group farmers both received a letter and attended the training. Fourth, there was some
direct spillover of information; eight control group farmers attended the training and four
received the letter. We tried to limit spillover by providing lead farmers with a list of all the
farmers in the EAs and explicitly telling them not to train or send letters to farmers beyond those
listed, but some lead farmers did not comply with that directive.
Figure 2.1: Sample breakdown of treatment assignment and information types received
Percentages are of the full sample (488 total farmers).
2.4.4 Pesticide choice experiments
Relying on revealed demand has a potentially large problem in identifying the effects of
information on pesticide choices in that farmers may not face the same choice sets of products.
While every farmer had similar access to the same 10 pesticide retail outlets, the shops carry

96
different products with variation across seasons and there is no way to ensure that farmers visited
the same shops when making pesticide purchase decisions. Further, farmers may self-select into
different choice sets if, for instance, certain retailers catered to more experienced or educated
farmers. To circumvent this identification problem, we used pesticide choice experiments to
examine pesticide preferences. The choice experiments allow us to control pesticide choice sets
and make choice sets consistent across treatment assignment and across survey rounds. This
design facilitates more direct comparisons of choices between baseline and endline for the
treatment and control groups. and therefore, estimate the causal effect of information on choices.
Choice experiments have two additional benefits over relying on revealed demand. First, choice
experiments allowed us to elicit farmer pesticide choices before and after our training. The
timing of the data collection activities – during the dry season – did not guarantee that we would
collect revealed pesticide demands for each farmer at both survey rounds. By using a choice
experiment design, we obtained choice data for the entire sample at both baseline and endline.
Second, the choice experiments allowed us to focus on the main variables of interest –
information, pesticide toxicity, and pesticide prices – by controlling for the heterogeneity across
farmers in their production techniques and pesticide choice sets.
We designed the experiments to mimic the pesticide decision processes reported by
tomato farmers in our qualitative interviews and pre-testing, and we implemented experiments
for the two pests for which farmers most often use WHO class Ib pesticides: nematodes and
bollworms. To motivate each pesticide choice, we described a production scenario with the pest
pressure on a hypothetical tomato plot and showed farmers an icon array to aid comprehension25.
This mirrors reality where farmers typically observe a pest in their plots prior to making a
25 Garcia-Retamaro and Galesic (2010) show that icon arrays can improve comprehension of numerical information. We present a sample icon array in Figure 2A.1 in the appendix.

97
pesticide purchase. The production scenarios held several key variables in the farmer’s tomato
production functions constant. These included plot size (0.25 hectares), plot history (new plot),
tomato variety planted (Tengeru 97), season (dry season), growth stage (beginning to fruit or
ready to transplant), weed pressure (none), crop health (well irrigated and healthy with no
observed pests or diseases), and previous pesticide use (no insecticide applications and
preventative fungicide applications every 10-14 days).
Immediately after each production scenario, we showed farmers a pesticide choice set of
several locally available pesticides. Table 2.2 shows the products and price levels that composed
the various choice sets. Within each experiment, we used the same pesticides in each choice set
and each pesticide was labelled to control the pest; this helps control for efficacy differences
across products as all products labelled to control their respective pests must meet a high
minimum efficacy requirement for labelling. There was one exception to this rule: Orizon was
not yet labelled for nematode control but was being heavily promoted as a nematicide26. We
emphasized that the stated pest pressure was the only pest observed on their plots to draw a
farmer’s focus to a specific pest and to minimize any perceived benefits from broad spectrum
controls – i.e., controlling other pests beyond either bollworms or nematodes.
The product variety reflects the fact that farmers often visit several retail outlets before
making a purchase. Farmers could choose not to purchase any pesticide if they so desired. To
remove the possibility of farmers opting out in favor of shopping around for a particular product,
we emphasized that their choice set was exhaustive – meaning there were no other products
available in the market beyond what we showed them. We deliberately chose at least one
26 Orizon is a pesticide that has been shown to effectively control nematodes (Sineria, 2015). There were no available class II pesticides labelled for nematode control, and it was important to have a product from each toxicity class in each choice set, so we decided to include Orizon in the nematode experiment.

98
pesticide from each available toxicity class (class Ib, class II, and class U) and one product for
each of the most prevalent active ingredients in the market. Lastly, we made sure that the
package sizes of alternatives covered approximately the same area. Each nematicide covered a
quarter hectare and each insecticide covered approximately 0.625 hectares at the recommended
application rates.
We set the initial prices for each pesticide based on discussions with agro-dealers. We
observed the price at baseline, and asked the salespeople to recall the highest and lowest prices
for each product in the past two years. We used these to bound the price levels. In effect, we used
recall market prices as proxies for farmers’ unobservable perceptions of feasible product prices.
We varied the prices of each pesticide across scenarios. To avoid counter factual combinations,
two restrictions were placed on the prices for the bollworm experiment. First, the price of
Profenofos could not be lower than the price of Phoskill in any choice set. These products were
Table 2.2: Pesticide products and prices used in choice experiment choice sets
Pesticide Trade
Name Active Ingredients Toxicity Class1
Initial Price Levels
(ZMW2)
Expanded Price Levels
(ZMW2)
Bollworm Experiment
Phoskill Monocrotophos Class Ib 10, 12, 14 7, 12, 17
Profenofos Profenofos Class II Phoskill Price +
(0, 1, 2) Phoskill Price +
(0, 2, 5)
Bollpack Lambda-cyhalothrin Class II 8, 10, 13 6, 10, 15
Blast Lambda-cyhalothrin &
imidacloprid Class II
Bollpack price + (4. 5, 6)
Bollpack price + (2. 5, 8)
Benefit Bifenthrin & imidacloprid
Class U 10, 12, 14 7, 12, 17
AlphaGold Alphacypermethrin Class II 9, 11, 13 6, 11, 16
Nematode Experiment
Umet Phorate Class Ib 70, 75, 80 60, 75, 90
Orizon Acetamiprid &
Abamectin Class II 84, 93, 102 74, 93, 112
Bio-Nematon Bacteria Class U 76, 84, 91 66, 84, 101 1 WHO toxicity classes: class Ib (highly hazardous), class II (moderately hazardous), class U (unlikely to cause acute harm). 2 Zambian Kwacha (ZMW) is the local currency. At the baseline survey the exchange rate was approximately 7.4 ZMW per USD
99
sold by the same retailers and Profenofos, being a newer product in this market, was always
priced at a premium. Second, the price of Blast was higher than the price of Bollpack in any
given choice set. These products were also sold by the same retailer and Blast was a newer
product composed of Lambda Cyhalothrin – Bollpack’s only active ingredient – plus
Imidacloprid making it more expensive.
We created an experimental design of 16 choice scenarios for each experiment that
captured the main effects along with interactions between pest pressure levels and each pesticide
alternative in a way that minimized D-error subject to the design constraints using N-gene
software. Four blocks were created for each experiment meaning farmers responded to eight
choice scenarios – four for the nematode experiment and four for the bollworm experiment. We
updated the experimental design twice during data collection; in an update, the data collected to
date were used to estimate models and update the priors used to generate the designs to further
increase design efficiency. First, we spread the price ranges for each pesticide to better identify
the impact of price on farmer choices (see expanded price levels column of Table 2.2). Second,
we increased the number of scenarios to five per experiment for each farmer. Respondents were
not overwhelmed or fatigued by the number of scenarios we presented to them; they reported
that they understood the designs and that it was not difficult for them to respond.
2.4.5 Sample balance
Table 2.3 presents selected sample balance test results. Overall, the treatment and control
groups are balanced over 45 of 51 variables tested (and over 13 of the 18 variables shown in the
table27). However, the control group had significantly higher literacy and more farmers with
27 The variables tested, but excluded from the table include 20 plot and harvest variables, 8 input variables, and 5 personal protective equipment ownership variables.

100
business income, while the treatment group received horticulture, pest management, and
pesticide safety advice from more sources.
Table 2.3: Sample balance tests for full and trimmed samples
Full Sample
Trimmed Sample
Variable Mean Std dev
Difference T-
statistic Difference
T-statistic
Observations N= 488 N=425 HH size 5.705 2.477 0.087 0.267 0.046 0.125
# HH members older than 15 3.008 1.405 0.082 0.487 0.018 0.098
Farmer age 38.945 12.486 1.194 1.165 1.784* 1.709
Farmer female 0.172 0.378 0.030 0.624 0.045 0.849
Completed grade 7 (d) 0.391 0.489 -0.092 -1.582 -0.081 -1.25
Literate (d) 0.514 0.500 -0.111** -2.12 -0.106* -1.949
Asset ownership (first principal component) -0.138 1.717 -0.224 -0.866 -0.221 -0.802
Salary or wage employment (d) 0.346 0.476 -0.018 -0.338 -0.047 -0.841
Business income (d) 0.512 0.500 -0.164** -2.159 -0.101 -1.33
Experience (# of years in last 10 years) 6.402 3.023 0.026 0.083 -0.090 -0.276
Total land area owned (ha) 4.024 3.049 -0.168 -0.356 -0.071 -0.135
Total tomato area (ha) 0.276 0.207 0.016 0.514 0.039 1.213
Dry season tomatoes (d) 0.537 0.499 0.024 0.184 -0.069 -0.499
# of pesticide acute symptoms 2.350 1.773 -0.231 -0.99 -0.132 -0.542
# of pesticide related clinic visits 0.418 0.940 -0.048 -0.39 -0.025 -0.186
# of horticulture advice sources 3.000 1.341 0.418* 1.776 0.423 1.588
# of pest control advice sources 3.160 1.268 0.333* 1.736 0.261 1.25
# pesticide safety advice sources 2.578 1.543 0.425* 1.729 0.392 1.459
(d) denotes dummy variable. Differences are treatment group minus control group. Trimmed differences exclude two unbalanced blocks. Significance levels; *=0.10, **=0.05, ***=0.01.
The sample imbalance in business income is particularly concerning to our analysis of
pesticide demand because we expect farmer income to affect their choices and, specifically, how
they respond to pesticide prices. Furthermore, access to business income may be correlated with
access to information and with access to pesticides which could impact farmer knowledge and
familiarity with products, and therefore affect choices. To help correct for these potential
problems, we trim our sample to exclude the two blocks (4 EAs, 13% of our sample) with the
largest differences in business income between treatment and control groups. In Table 2.3, the

101
trimmed sample columns show improved balance across treatment and control groups. There are
no longer significant differences in business income or the number of advice sources between
treatment and control groups. For the remainder of this paper we present results using the
trimmed sample, and we present key full sample results in the appendix and note any meaningful
differences between the two.
2.5 Empirical methods
We use our unique RCT and choice experiment data to test Hypothesis 1 in three ways.
First, we compare choice experiment choice shares for each pesticide toxicity class between
treatment and control groups and between baseline and endline choices. Second, we estimate
choice-level difference-in-difference regressions on pesticide choice toxicities. Third, we employ
a simple random utility model and conditional logit estimations that compare treatment and
control group choices at the baseline and endline; these latter estimations also serve as our test of
Hypothesis 2. As a robustness check on our stated choice results, we compare revealed pesticide
demand data from baseline to endline for the treatment and control groups.
2.5.1 Choice shares
We begin by analyzing choice shares by toxicity class for the stated choice data. We
compare the treatment and control group choice toxicity distributions using Pearson’s chi-square
tests, and we expect the treatment group farmers, after receiving pesticide toxicity information,
to have different choice shares for pesticide toxicity classes. Specifically, from Hypothesis 1, we
expect to see a larger increase in the choice share for class U pesticides for the treatment group
than the control group.
102
2.5.2 Choice-level toxicity regressions
The experimental design – specifically, the fact that each farmer responded to the exact
same scenarios at the baseline and endline, and therefore the prices and pest infestations are the
same for each farmer in each choice set at both interviews – allows us to test Hypothesis 1 with
comparisons of pesticide toxicities for individual choice occasions. We assign a simple toxicity
score to each pesticide choice; J��K�� is the toxicity score for farmer i in choice occasion c at
time t – defined as equal to one if the farmer’s choice is a class U pesticide (least toxic), three if
the farmer’s choice is a class II pesticide (moderately toxic), and 4 if the farmer’s choice is a
class Ib pesticide (highly toxic)28. This allows us to estimate the following first difference
regression with cluster robust standard errors at the enumeration area level by ordinary least
squares (OLS) and ordered probit (OP):
(6) ∆J��K3� = LM + LN JO)PQ)RPK3 + V3 + WK3�
where ∆J��K3� is the change in choice toxicity from baseline to endline for farmer i in block j
and choice occasion c defined as pJ��K3�,b − J��K3�,Nr, and JO)PQ)RPK is an indicator variable
for random assignment into treatment group, and V3 is a block fixed effect used to increase
estimation power29. A benefit to the first-differenced specification over a difference-in-difference
specification is that any time invariant variables drop from the model including unobservable
farmer level characteristics.
Estimation shows how the exogenous assignment to receive pesticide toxicity
information impacts (i) choice toxicity (OLS) and (ii) the probabilities of changing choices from
28 There were no WHO class III pesticides in either choice set so there is no J��K�� value equal to two. As a robustness check we estimate the same regressions with class II coded as two, and class Ib coded as three. All results are robust to the codification of choice toxicity classes. 29 The block fixed effect is excluded from the ordered probit estimation to avoid the incidental parameters problem.

103
one toxicity class to another (OP). Hypothesis 1 predicts that the treatment group will select
lower toxicity pesticides more often at endline; in our model, we expect the estimator L�N to be
negative.
2.5.3 Random utility model and conditional logit estimation
As an additional test of Hypothesis 1 and a concurrent test of Hypothesis 2 we turn to the
random utility model. Within their choice sets, risk neutral farmers will choose the pesticide that
gives them the highest utility level (including a no pesticide option). As outside researchers, we
are unable to observe all the information farmers use in making their choices, so we assume that
each individual’s utility from pesticide �K (denoted �'q) can be split into a deterministic
component �'q derived from observable information and a stochastic component W'q which is
unobservable – equation (7). To test the effects of information on price effects and on choices,
we use the specification in equation (8) where �'q is indirect utility, �'q is the pesticide’s price,
JO)PQ)RP is an indicator for treatment group assignment, and �$o'q is an alternative-specific
constant for pesticide �K.
(7) �'q = �'q + W'q
(8) �'q = LN�'q + Lb�JO)PQ)RP ∗ �'q� + L��$o'q + L��JO)PQ)RP ∗ �$o'q� + W'q
Packed in the ASC is the impact of product specific pesticide attributes other than price –
e.g., brand, active ingredient, and toxicity (our focus). Because we randomly assigned farmers to
receive toxicity information, we expect any effect on pesticide choices from other attributes to be
balanced across treatment and control groups. The stochastic W'q allows us to estimate the
probabilities that each option will be selected. If we assume W'q to be i.i.d. type 1 extreme value
distribution (the usual assumption), then we can reduce the probabilities to an empirical form
estimated using a conditional logit.

104
We estimate (8) separately for each survey round (baseline, endline) and for each
experiment (bollworms, nematodes). The estimator L�b, which we expect to be negative at the
endline, will test Hypothesis 2, and the estimator L��, which we expect to be positive for class U
pesticides at the endline, will test Hypothesis 1.
2.5.4 Revealed demand comparisons
As a robustness check for the choice experiment results, we compare revealed pesticide
demands by toxicity class across survey rounds and across group assignment. The comparisons
across survey rounds are imperfect, but we make two data restrictions to make them more
comparable. First, we limit our analysis to the subset of farmers that made pesticide purchases
between the baseline and endline interviews. Second, we restrict the baseline purchase data to
those pesticides applied on plots where tomatoes were transplanted between July and October to
more closely match the timeframe of the endline data. This will help control for the types of
pests present on plots and likely makes the set of pesticides available for purchase more
consistent across interviews.
2.6 Results
2.6.1 Pest incidence and pesticide use
Table 2.4 shows that 99% of our sample reported pressure from at least one pest on
tomatoes in the year prior to our survey, and early blight, whiteflies, aphids, bollworms, red
spider mites, and nematodes were each reported by more than 50% of farmers. Bollworms were
the most prevalent pest, experienced by 87% of farmers.
Each of these pests can cause substantial crop damage, so farmers overwhelmingly turn
to pesticides to mitigate pest-induced crop losses. Every farmer used at least one pesticide in the

105
year prior to the baseline interviews. Table 2.5 shows that farmers applied insecticides more
often than nematicides; 94% of farmers purchased at least one insecticide and the average
number used among those using was 2.7, while only 7% of farmers used a nematicide and the
average number used among those using was 1.0. Nematicides control nematodes and the lower
use rate could partly be attributed to lower reported nematode pressure than each of the listed
insects in Table 2.4. However, more than half of the farmers reported nematode pressure and we
expect that the majority of the difference in use rates between nematicides and insecticides is
likely due to costs. To treat a quarter hectare tomato plot with nematicides costs between 70 and
102 ZMW30, while an insecticide treatment of the same plot costs less than 14 ZMW. Nearly
every farmer applied a fungicide despite relatively low reported pressure from fungal diseases
late and early blight in Table 2.4. This reflects the fact that fungicides are typically applied
preventatively prior to observing a fungal disease.
Table 2.4: Share of farmers experiencing pests on their tomato plots in the year prior to baseline
Pest Share of farmers reporting pressure
N 425
Any pest 99%
Nematodes 58%
Red spider mites 74%
Bollworms 87%
Aphids 69%
Whiteflies 79%
Early blight 62%
Late blight 42%
As discussed in the theoretical model, pesticides generate additional health costs borne by
the farmer. Acute health risks are particularly large for WHO class Ib and class II pesticides,
30 Zambian Kwacha (ZMW) is the local currency. At the time of the baseline interview the exchange rate was approximately 7.4 ZMW per United States dollar.

106
which are described as highly hazardous and moderately hazardous, respectively. Zambian
tomato growers have access to several class Ib and class II pesticides from the many agricultural
input suppliers. The clear majority of farmers (90%) used at least one class II pesticide, and a
large share of farmers (44%) used at least one class Ib pesticide. All of the highly toxic pesticides
used were insecticides or nematicides, and, for this reason, our study focuses on these two
pesticide categories.
Table 2.5: Share of farmers applying pesticides by WHO toxicity class (N=425)
Share of farmers that applied by WHO toxicity class
Mean number applied among those applying
Any Ib II III U
Insecticide 2.7 94% 44% 75% 2% 74% Fungicide 3.1 99% 0% 55% 0% 97% Nematicide 1.0 7% 6% 1% 0% 0%
As we might expect with the use of highly toxic pesticides, many farmers experienced
adverse health effects. Eight-four percent of farmers experienced at least one acute poisoning
symptom within 24 hours of pesticide use during the year prior to our interviews. The mean
number of symptoms among those that experienced one was 2.8. Stemming from these
symptoms, 39% of our sample was unable to work at least one day, and 23% visited a health
clinic.
2.6.2 Toxicity choice share comparisons
Table 2.6 presents a comparison of toxicity choice shares by round for treatment and
control groups using Pearson’s chi-squared statistics comparing the treatment and control group
distributions for each round. Note that we do not expect the experimental design to cause any
differences in choice shares; our design is balanced across treatment and control groups, so each
treatment arm saw the same choice sets in the same proportions. Each baseline to endline

107
comparison has the same number of observations, and the differences across treatment and
control groups for a given experiment reflect small differences from trimming.
The treatment and control group baseline distribution comparisons are insignificant with
chi-square test p-values of 0.51 and 0.87 for the bollworm and nematode experiments,
respectively. Consistent with Hypothesis 1, the endline distribution differences are all highly
significant, with the largest differences between the groups in class U. The treatment group had
larger increases in choice shares for class U pesticides than the control group for both
experiments – approximately 3.0 times greater for bollworms and 3.7 times greater for
nematodes.
While the share of class U pesticide choices increased dramatically for the treatment
group in each experiment, there are interesting differences in the class Ib and class II pesticide
choice shares. In the bollworm experiment, the class Ib choice share decreased for the treatment
group by only four percentage points while the class II choice share decreased by fifteen
percentage points. In the nematode experiment, class Ib pesticides had the larger decrease in
choice share for the treatment group, dropping nine percentage points, while class II choice share
decreased five percentage points. When we look at the choice changes as percentages of baseline
choice shares, however, class Ib pesticides had the largest decrease for both experiments; a 25%
decrease in choice share in the bollworm experiment, and a 23% decrease for the nematode
experiment across survey rounds. Further, while Hypothesis 1 predicts shifts from class II to
class U, it also predicts shifts from class Ib to class II, thus there is no clear prediction for how
class II choice shares will change from toxicity information. We will revisit these toxicity
changes in section 2.6.3 below.

108
Table 2.6 shows that even the control group had sizeable choice share changes across
survey rounds for each experiment. We see two possible mechanisms driving these changes. One
possibility is that farmers learned from the baseline survey, which showed farmers a choice set of
pesticides, some of which may have been previously unfamiliar to farmers. It is possible that at
the endline they either remembered the choice sets from the baseline, or after being asked several
questions about pesticides and health, took it upon themselves to learn about the products and
their efficacies. The second possible driver of changes in control group choice at the endline is
information spillover from the treatment group. Direct spillover was limited as only ten control
group farmers received pesticide information directly from the intervention. News of a training
event may have spread outside of a lead farmer’s EA as eight control group farmers attended a
training. Lead farmers also sent four informational letters to control group farmers, implying that
they took it upon themselves to reach out to farmers not on their lists. An additional eleven
farmers had a conversation with a treatment group farmer about the training content. Together
only 23 control group farmers (less than 10%) reported receiving spillover information, but we
cannot rule out the possibility that the training content spilled into the control group in less direct
ways. Note that these control group choice shifts may suggest that our analyses underestimate
the effects of the information intervention.
As a final observation from Table 2.6, less than 1% of the choices for each experiment
were to purchase no pesticide. This is a stark contrast to the low share (7%) of farmers that
purchased a nematicide in the year prior to the baseline interviews; however, we argue that this
makes sense in the context of the choice experiments. We deliberately removed several sources
of uncertainty in the farmer’s decision-making that likely led to farmers choosing to purchase a
pesticide in a large share of the scenarios. First, we removed any doubts about pest pressure –

109
both which pests were present and the share of the crop that was affected – by stating a pest
pressure upfront in the production scenarios. Second, and possibly more important, is the fact
that the scenarios placed the farmers in a hypothetical market face-to-face with a pesticide choice
set for pesticides they were told would control the pest. This removed any uncertainty about
whether they should purchase a new pesticide rather than applying a pesticide they already had
in hopes that it controls the pest.
Table 2.6: Stated choice toxicity market shares by treatment and control group assignment Experiment Bollworms Nematodes
Survey Baseline Endline Baseline Endline
Treatment
Class Ib 16% 12% 39% 30%
Class II 70% 55% 33% 28%
Class U 13% 33% 27% 42% Control
Class Ib 18% 12% 41% 39%
Class II 71% 71% 33% 31%
Class U 12% 18% 26% 30%
Chi Square1 1.34 63.15 0.27 31.88
p-value 0.511 p<0.001 0.872 p<0.001
Observations N= 425 1 Pearson's chi-square tests are for treatment vs. control group distributions. Fewer than ten choices (less than 1%) for each experiment were "no pesticide" so they are excluded from the table.
2.6.3 Choice-level toxicity differences
Table 2.7 presents estimates of equation (6), and offers more evidence supporting
Hypothesis 1. The OLS coefficients are estimates of L�N, while the OP estimates show the
marginal effect of treatment assignment on the probability of each toxicity change value. The
OLS estimates show negative and significant effects (at the 10% level) of being in the treatment
group on choosing a less toxic pesticide at the endline for both experiments. The OP estimates
show that the treatment group was between 1% and 4% more likely to have a negative toxicity
change value and between 1% and 3% less likely to have a positive toxicity change value, for
both experiments. All estimates but the no change (0) estimates in both experiments and the -3

110
change in the bollworm experiment are significant at least at the 10% level. This suggests a
general movement away from higher toxicity pesticides towards low toxicity pesticides for the
treatment group in both experiments. The full sample estimates are similar, but show slightly
larger effects with greater statistical significance across the table.
Table 2.7: First-difference effects of treatment assignment on choice toxicity OLS and OP estimates for both experiments Experiment Bollworms Nematodes
OLS
-0.267* -0.314*
(.142) (0.169) OP - Marginal effects
Ib to U (-3) 0.018 0.042*
(0.011) (0.024)
II to U (-2) 0.045* 0.019*
(0.027) (0.010)
Ib to II (-1) 0.013** 0.010**
(0.006) (0.005)
No change (0) -0.024 -0.010
(0.017) (0.008)
II to Ib (+1) -0.019** -0.016*
(0.009) (0.009)
U to II (+2) -0.027* -0.016*
(0.015) (0.009)
U to Ib (+3) -0.006* -0.030**
(0.004) (0.015)
Observations N= 425
Cluster robust SEs at the EA level in parentheses. Estimates are of LN in equation (6).
Table 2.7 confirms our observation in Table 2.6 that farmers changed their choices from
class II to class U in the bollworm experiment and from class Ib to class U in the nematode
experiment. The largest predicted probability change for the bollworm experiment is from class
II to class U and for the nematode experiment the largest change is from class Ib to U. Both
experiments show the treatment group to be significantly more likely than the control group to
change their choice toxicity from a class Ib to a class II pesticide and from a class II to a class U,
suggesting that farmers that received information perceived larger toxicity differences across
each toxicity class. However, in the bollworm experiment, class II pesticides had by far the

111
largest choice share at the baseline (Table 2.6), suggesting that farmers preferred pesticides in
this class for reasons other than toxicity, which justifies the choice shifts at the endline away
from class Ib pesticides to class II pesticides rather than to class U pesticides in the bollworm
experiment. In the nematode experiment, baseline choice shares for class II and class U
pesticides were comparable, and farmers were more willing to change pesticide choices from a
class Ib to a class U pesticide after receiving toxicity information.
2.6.4 Conditional logit results
The conditional logit results presented in Table 2.8 also corroborate Hypothesis 1 and
show a shift towards class U pesticides for the treatment group after the information intervention.
In the baseline experiments, we do not reject the null hypothesis that treatment and control group
farmers were equally likely to select class U pesticides at baseline. However, at endline – and
after the information intervention – we see large and significant differences in these probabilities.
Treatment group farmers were 16% and 13% more likely to select the class U pesticide for the
bollworm and nematode experiments, respectively (both significant at the 5% level).
For the nematode experiment, treatment group farmers were 17% less likely to select the
class Ib pesticide (significant at the 1% level). The bollworm experiment shows a significant
difference for a class II pesticide in choice probability between the treatment and control groups
at the endline; treatment group farmers were less likely to select Bollpack (significant at the 10%
level). These results are consistent with the choice share analysis, and the full sample results
show similar changes across surveys.
Hypothesis 2 suggests that the treatment-price interaction term will be negative at
endline. Table 2.9 provides evidence supporting this claim with estimates of equation (8); L�N
estimates are shown by the price coefficients, and the Price*Treatment coefficients show

112
estimates of L�b. For both the full and trimmed samples, price has a positive relationship to choice
probability for each experiment at baseline, suggesting a positive perceived effect of pesticide
price on utility. In our model, this is possible only if expected tomato production is higher for
higher priced pesticides, suggesting that farmers perceived a positive price-efficacy relationship
prior to the information intervention. Information volunteered by farmers during baseline
interviews support this result as many farmers reported that higher priced pesticides were
stronger (i.e., more effective at killing pests). The baseline results for the bollworm experiments
show a large and significant (at 1%) positive price relationship, while the nematode experiment
shows a smaller and insignificant positive price relationship (although when estimated without
the price-treatment interaction, the price coefficient is positive and significantly different than
zero).
Table 2.8: Conditional logit assignment to treatment effects on choice probabilities for each pesticide in each choice set by survey round and by experiment
Pesticide (Toxicity label) Baseline Endline
Observations N= 425 Marginal effect of treatment assignment
Nematodes Umet (Ib) 0.009 -0.167***
(0.046) (0.051)
Orizon (II) -0.026 0.041
(0.048) (0.041)
Bio-Nematon (U) 0.007 0.126***
(0.032) (0.043)
Bollworms Phoskill (Ib) -0.010 -0.003
(0.018) (0.030)
Benefit (U) 0.016 0.155**
(0.020) (0.064)
AlphaGold (II) 0.004 -0.023
(0.018) (0.015)
Blast (II) 0.013 -0.030
(0.028) (0.028)
Bollpack (II) -0.001 -0.082*
(0.033) (0.042)
Profenofos (II) -0.024 -0.017
(0.018) (0.021)
Estimates are for L� in equation (8). Baseline and endline estimations done separately with a price*treatment interaction term included. Cluster robust standard errors at the EA level in parentheses. "No pesticide" selections excluded from table but not from calculations (less than 1% of choices were on pesticides).
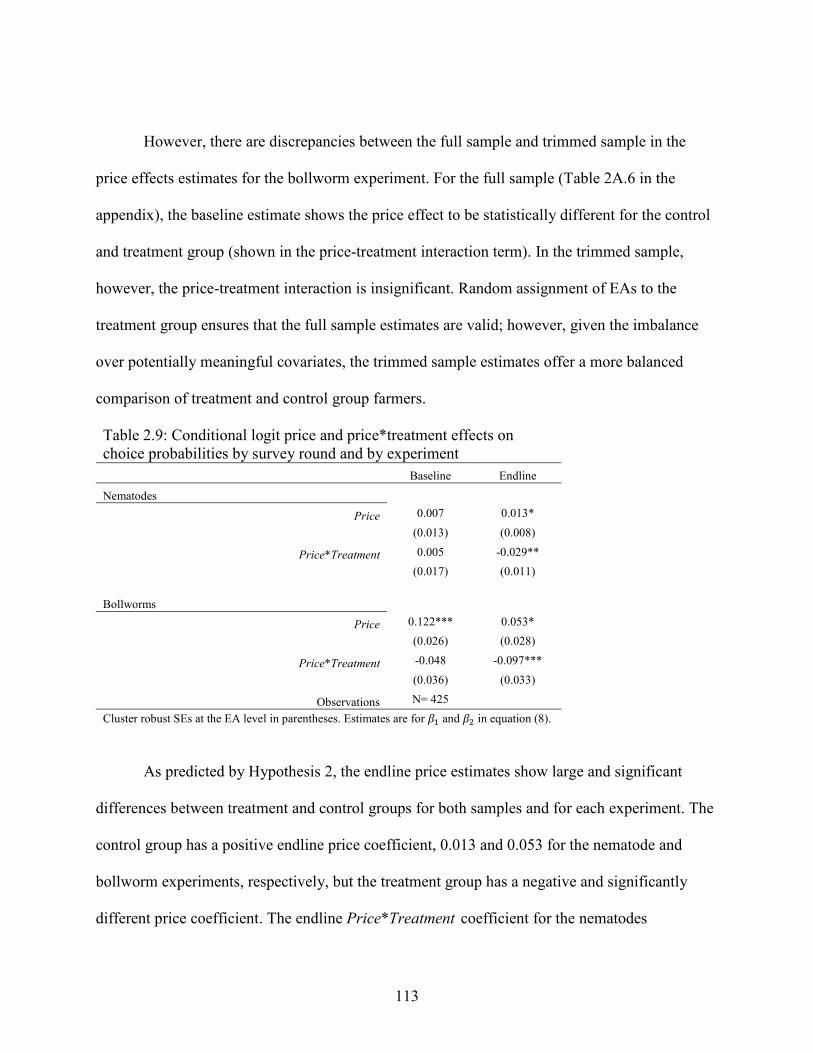
113
However, there are discrepancies between the full sample and trimmed sample in the
price effects estimates for the bollworm experiment. For the full sample (Table 2A.6 in the
appendix), the baseline estimate shows the price effect to be statistically different for the control
and treatment group (shown in the price-treatment interaction term). In the trimmed sample,
however, the price-treatment interaction is insignificant. Random assignment of EAs to the
treatment group ensures that the full sample estimates are valid; however, given the imbalance
over potentially meaningful covariates, the trimmed sample estimates offer a more balanced
comparison of treatment and control group farmers.
Table 2.9: Conditional logit price and price*treatment effects on choice probabilities by survey round and by experiment
Baseline Endline
Nematodes
Price 0.007 0.013*
(0.013) (0.008)
Price*Treatment 0.005 -0.029**
(0.017) (0.011)
Bollworms
Price 0.122*** 0.053*
(0.026) (0.028)
Price*Treatment -0.048 -0.097***
(0.036) (0.033)
Observations N= 425
Cluster robust SEs at the EA level in parentheses. Estimates are for LN and Lb in equation (8).
As predicted by Hypothesis 2, the endline price estimates show large and significant
differences between treatment and control groups for both samples and for each experiment. The
control group has a positive endline price coefficient, 0.013 and 0.053 for the nematode and
bollworm experiments, respectively, but the treatment group has a negative and significantly
different price coefficient. The endline Price*Treatment coefficient for the nematodes

114
experiment is -0.029, while the same estimate for the bollworms experiment is -0.097 (both
estimates significant at 5%).
These results suggest that information against a price-efficacy relationship corrected the
misperception that higher priced pesticides are more effective. Farmers in the treatment group
were less likely to choose higher price pesticides after the information intervention, but control
group farmers demonstrated a positive relationship between price and choice probability at both
survey rounds.
2.6.5 Revealed demand results
We now turn to observed demands as a robustness check for our stated demand tests of
Hypothesis 1. Table 2.10 compares toxicity market shares of pesticide purchases for nematicides
and bollworm controlling pesticides by treatment assignment and by survey round. For direct
comparisons between endline and baseline revealed demands, we limit the sample to farmers that
purchased pesticides between the survey rounds. Consistent with our choice experiments, we see
larger increases in market shares for class U pesticides for the treatment group than for the
control group for both pesticide types. The treatment group purchased 3 class U nematicides at
the endline compared to 0 at the baseline, and 8 class U bollworm pesticides at the endline
compared to just 2 at the baseline. In contrast, the control group farmers purchased 5 class U
insecticides and 0 class U nematicides at the baseline, and 0 of each at the endline. The revealed
demand market shares for class U pesticides are lower than the stated choice shares in each
experiment, though as argued above this is consistent with our framing of the choice
experiments.
As mentioned above, we do not know a farmer’s choice set when making revealed
demand purchases. The class U bollworm pesticide and the class U nematicide used in the choice
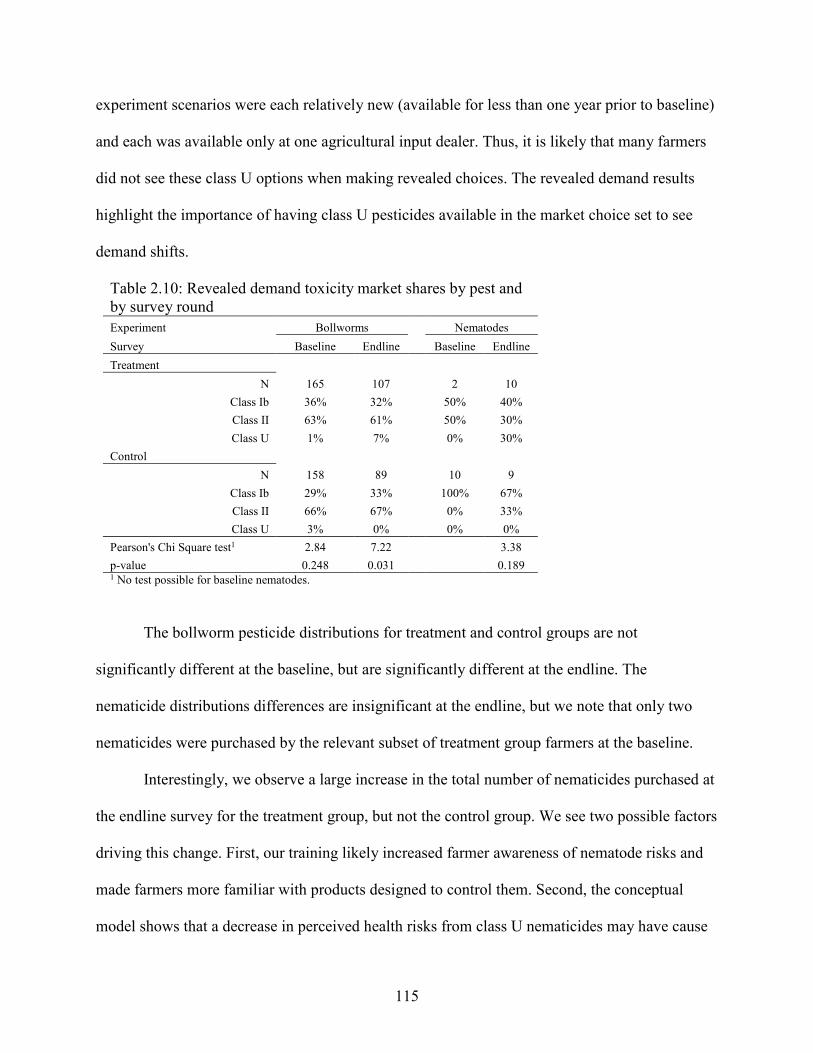
115
experiment scenarios were each relatively new (available for less than one year prior to baseline)
and each was available only at one agricultural input dealer. Thus, it is likely that many farmers
did not see these class U options when making revealed choices. The revealed demand results
highlight the importance of having class U pesticides available in the market choice set to see
demand shifts.
Table 2.10: Revealed demand toxicity market shares by pest and by survey round
Experiment Bollworms Nematodes
Survey Baseline Endline Baseline Endline
Treatment
N 165 107 2 10
Class Ib 36% 32% 50% 40%
Class II 63% 61% 50% 30%
Class U 1% 7% 0% 30%
Control
N 158 89 10 9
Class Ib 29% 33% 100% 67%
Class II 66% 67% 0% 33%
Class U 3% 0% 0% 0%
Pearson's Chi Square test1 2.84 7.22 3.38
p-value 0.248 0.031 0.189 1 No test possible for baseline nematodes.
The bollworm pesticide distributions for treatment and control groups are not
significantly different at the baseline, but are significantly different at the endline. The
nematicide distributions differences are insignificant at the endline, but we note that only two
nematicides were purchased by the relevant subset of treatment group farmers at the baseline.
Interestingly, we observe a large increase in the total number of nematicides purchased at
the endline survey for the treatment group, but not the control group. We see two possible factors
driving this change. First, our training likely increased farmer awareness of nematode risks and
made farmers more familiar with products designed to control them. Second, the conceptual
model shows that a decrease in perceived health risks from class U nematicides may have cause
116
farmers to increase their nematicide use up to the point where marginal benefits equal marginal
costs. Most available nematicides are highly toxic, and the decreased perceived health risk of
class U pesticides could have caused farmers to make the discrete switch from no nematicides to
a class U nematicide treatment.
2.7 Conclusion
Farmers can substantially reduce their acute pesticide health risks by choosing lower
toxicity pesticides, and multiple agricultural input suppliers offer class U toxicity pesticides that
target the same pests as the class Ib and class II products. However, there is evidence that
farmers do not understand toxicity labels (Maumbe and Swinton, 2003), which makes
substituting pesticides to reduce health risks unlikely. Moreover, farmers face a large and
dynamic choice set of pesticide products as the agricultural input suppliers vary the products they
import from season to season. Learning about even the most basic pesticide attributes like what
pests a product controls can therefore be a challenge.
This paper analyzes the effects of pesticide toxicity and price efficacy information on
pesticide demand for smallholder tomato farmers in Zambia. We randomly assigned farmers to
receive information delivered through a farmer-to-farmer training program and a personalized
letter, and we assessed farmer pesticide choices before and after the training program with two
choice experiments. We summarize our findings into three main results.
First, we find evidence that farmers hold a positive price-efficacy perception for
pesticides. Farmers in the control group demonstrated a positive relationship between pesticide
price and choice probability in both experiments. This is consistent with a wide literature on
positive price-quality perceptions for consumers with low product information (Zeithaml, 1988),

117
but this perception is broadly inaccurate for the pesticide market in our study and likely leads to
inefficient pesticide choices and decreased tomato profits. However, our second main result is
that this perceived correlation can be reduced with price-efficacy information. The farmers in the
treatment group demonstrated a negative relationship between price and choice probability after
receiving information. This result is consistent with existing literature (Zeithaml, 1988), and
information interventions aimed at changing farmer demands may be less effective if farmers
hold similar price-quality heuristics.
Our third key result is that pesticide toxicity and price-efficacy information together can
increase smallholder farmer demand for lower toxicity pesticides. The literature clearly shows
that farmers are willing to pay a premium to reduce health risks from pesticide use (Kouser and
Qaim, 2013; Garming and Waibel, 2009; Cuyno et al., 2001; Khan, 2009). This study supports
previous research and relates it directly to substitutions across pesticide toxicity classes. Farmers
randomly assigned to receive information demonstrated larger choice share increases for class U
pesticides across the two survey rounds than the control group. The treatment group was 16%
more likely to choose a class U pesticide in the bollworm experiment and 13% more likely to
choose a class U pesticide in the nematode experiment. Importantly, farmers did not demonstrate
a pesticide choice strategy of exclusively choosing the low toxicity option after receiving
pesticide safety information. Repeated use of any single pesticide can engender pest resistance
and decrease efficacy, which would make the few available class U pesticides unattractive in the
long run. The varied pesticide choices suggest that farmers are willing to make substitutions
across products and across toxicity classes based on price conditions, which is important to the
continued efficacy of class U pesticides.

118
These results likely underestimate the true effect of the training as the information
intervention did not have full compliance; seventy eight percent of the treatment group received
information, but only 28% received both the training and the letter (Figure 2.1). We
acknowledge that the test only the short run effects of information as the endline demand
elicitation happened two months after the information was delivered. Still, these results have
large implications for farmer pesticide health as class U pesticides carry much lower health risks
than class Ib and class II products.
Together with other research describing low adoption of personal protective equipment
(Yuantari et al., 2015; Maumbe and Swinton, 2003; Goeb, Essay 1), this paper suggests
information interventions targeting farmer understanding of toxicity may have larger impacts on
farmer health than information targeting personal protective equipment use and farmer exposure.
Of course, toxicity information is meaningless if farmers do not have access to lower toxicity
pesticides. Therefore, this research also stresses the importance of availability in the market of a
diverse set of pesticides that includes those in the low toxicity WHO class U.
There are several policy approaches to improving farmer health and safety. This paper
shows that providing farmers with toxicity information could be an effective policy to improve
farmer health with limited market distortion. After receiving pesticide information, farmers are
better able to balance the health risk and production tradeoffs of the pesticides they use and may
make more optimal decisions. This supports the hypothesis presented by Antle and Capalbo
(1994) that farmers may be inadvertently subjecting themselves to large toxicity risks due to
incomplete information.
However, we also acknowledge that the training program did not reach every intended
tomato farmer, and that reaching all tomato farmers in a region may be prohibitively costly.

119
Further, there are potentially large external environmental costs of class Ib pesticide use (Tilman
et al., 2001). Thus, the common policy approach of banning highly toxic class Ib pesticides may
still be an attractive policy option. Zilberman et al. (1991) show that bans might have large costs
from decreased production, but the costs are reduced when there are less toxic substitutes to the
banned products with similar efficacies available, as is the case in Zambia. Still, this research
shows that farmers with better toxicity information willingly substituted away from class II
pesticides to class U pesticides, implying that even countries with bans on class Ib products
should consider complementary information campaigns targeting farmer choices of pesticide
toxicities.
Another policy option to improve farmer health is a tax on hazardous pesticides (Tilman
et al., 2002). Zilberman et al. (1991) suggest that a tax is more flexible and perhaps less costly
than a ban. A tax on class Ib pesticides would ideally cause most farmers to substitute to cheaper
less toxic options as the marginal cost of use increases, while still allowing the farmers for whom
the class Ib pesticides are profitable to use them. This paper shows that in the absence of
information on pesticide price and efficacy, a pesticide tax might have the opposite of its
intended effect and could potentially increase demand for the taxed pesticides. Thus, policy
makers considering pesticide taxes should first break any possible price-efficacy perceptions
amongst farmers.

120
APPENDIX

121
2A.1 Full sample estimations
Table 2A.1 shows no meaningful differences between the full and trimmed samples in
pest pressure.
Table 2A.1: Full sample comparison to Table 2.4. Share of farmers experiencing pests on their tomato plots in the year prior to baseline
Pest Share of farmers reporting pressure
N 488
Any pest 99%
Nematodes 60%
Red spider mites 75%
Bollworms 87%
Aphids 69%
Whiteflies 79%
Early blight 62%
Late blight 45%
Table 2A.2 shows no meaningful differences between the full and trimmed samples in the
shares of farmers applying pesticides by toxicity class.
Table 2A.2: Full sample comparison to Table 2.5. Share of farmers applying pesticides by WHO toxicity class
Share of farmers that applied by WHO toxicity class
Mean number applied among those applying
Any Ib II III IV
Full Sample (n=488)
Insecticide 2.7 94% 43% 74% 3% 73%
Fungicide 3.2 99% 0% 54% 0% 98%
Nematicide 1.0 6% 5% 1% 0% 0%
Table 2A.3 shows some differences to the trimmed sample in the baseline choice share
comparisons between the treatment and control groups. In the full sample, the chi-square tests for
the baseline comparisons are close to significant (p-values <0.13), but in the trimmed sample

122
(Table 2.6) the p-values are greater than 0.5 for both experiments. Thus, the trimmed sample
shows better balance in baseline choice shares for each experiment.
Table 2A.4 shows similar effects between the full and trimmed sample estimates of
treatment effects on first differenced choice toxicities. The full sample shows greater statistical
significance but similar effect sizes. Table 2A.5 shows full sample conditional logit estimates of
treatment effects on choice probabilities. There are no meaningful differences between the full
and trimmed sample. Table 2A.6 presents full sample estimates of price effects on choice
probabilities. There are meaningful differences between the full sample and trimmed sample
estimates. Table 2A.6 shows a significantly different effect of price for the treatment group in the
bollworm experiment at baseline. Specifically, the treatment group had a significantly lower
price effect than the control group.
Table 2A.3: Full sample comparison to Table 2.6. Stated choice toxicity choice shares by treatment and control group assignment Experiment Bollworms Nematodes
Survey Baseline Endline Baseline Endline
Treatment Class Ib 16% 12% 42% 29%
Class II 69% 54% 31% 27%
Class U 15% 34% 26% 44%
Control Class Ib 17% 13% 39% 38%
Class II 71% 71% 35% 33%
Class U 12% 17% 25% 29%
Chi Square1 4.4 95 4.2 51
p-value 0.108 p<0.001 0.124 p<0.001
Fewer than ten choices (less than 1%) for each experiment were "no pesticide" so they are excluded from the table. 1 Pearson's chi-square tests are for treatment vs. control group distributions

123
Table 2A.4: Full sample comparison to Table 2.7. First-difference effects of treatment assignment on choice toxicity OLS and OP estimates for both experiments Experiment Bollworms Nematodes
OLS
-0.298** -0.396**
(0.141) (0.155)
OP - Marginal effects
Ib to U (-3) 0.020* 0.055**
(0.011) (0.024)
II to U (-2) 0.049* 0.023***
(0.026) (0.009)
Ib to II (-1) 0.015** 0.013***
(0.006) (0.005)
No change (0) -0.024 -0.014*
(0.016) (0.008)
II to Ib (+1) -0.021** -0.020**
(0.009) (0.008)
U to II (+2) -0.033** -0.020**
(0.015) (0.008)
U to Ib (+3) -0.008** -0.038***
(0.004) (0.014)
Cluster robust SEs at the EA level in parentheses Estimates are of LN in equation (6)
Table 2A5: Full sample comparison to Table 2.8. Conditional logit assignment to treatment effects on choice probabilities for each pesticide in each choice set by survey round and by experiment Baseline Endline
Pesticide (Toxicity label)
Marginal effect of treatment assignment
Marginal effect of treatment assignment
Nematodes Umet (Ib) 0.022 -0.164***
(0.044) (0.046) Orizon (II) -0.041 0.016
(0.043) (0.038) Bio-Nematon (U) 0.011 0.148***
(0.029) (0.040)
Bollworms Phoskill (Ib) -0.010 -0.010
(0.017) (0.027) Benefit (U) 0.028 0.179***
(0.023) (0.058) AlphaGold (II) 0.004 -0.026
(0.016) (0.016) Blast (II) 0.005 -0.046*
(0.026) (0.026) Bollpack (II) -0.008 -0.075*
(0.030) (0.039) Profenofos (II) -0.022 -0.021
(0.016) (0.018)
Estimates are for Treatment*ASC interactions in equation (8) Baseline and endline estimations done separately with a price*treatment interaction term included Cluster robust standard errors at the EA level in parentheses "No pesticide" selections excluded from table but not from calculations (less than 1% of choices were on pesticides)
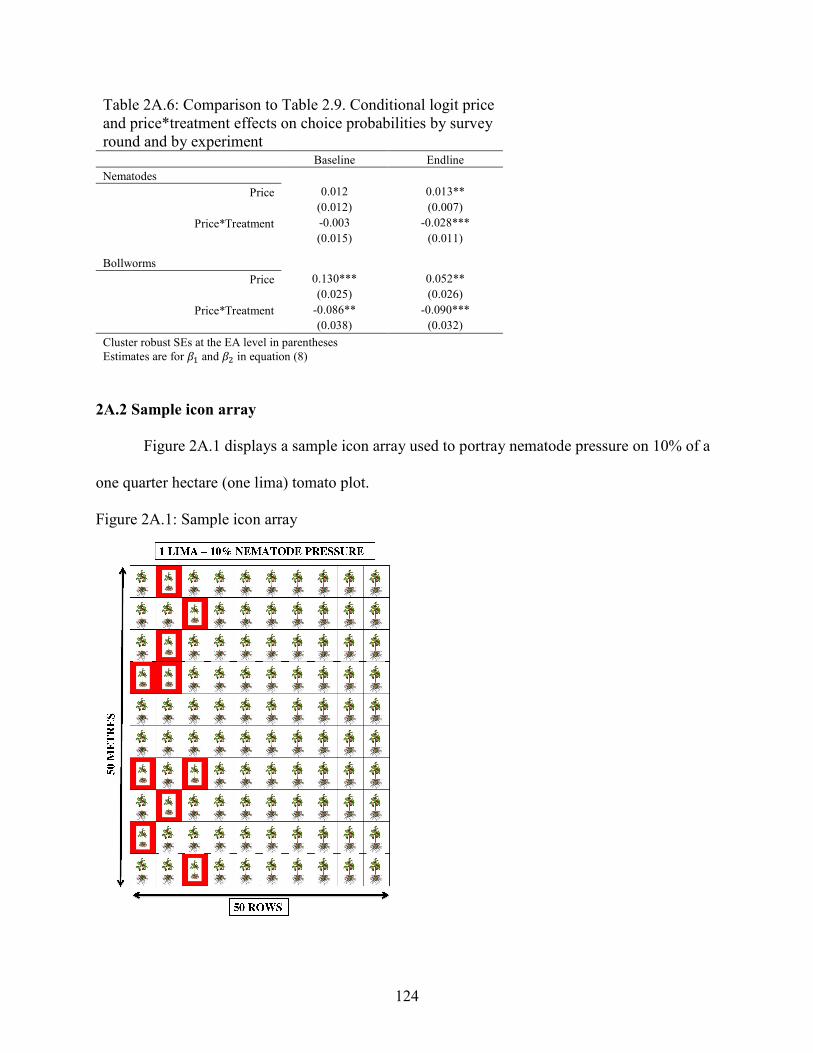
124
Table 2A.6: Comparison to Table 2.9. Conditional logit price and price*treatment effects on choice probabilities by survey round and by experiment Baseline Endline
Nematodes Price 0.012 0.013**
(0.012) (0.007)
Price*Treatment -0.003 -0.028***
(0.015) (0.011)
Bollworms Price 0.130*** 0.052**
(0.025) (0.026)
Price*Treatment -0.086** -0.090***
(0.038) (0.032)
Cluster robust SEs at the EA level in parentheses
Estimates are for LN and Lb in equation (8)
2A.2 Sample icon array
Figure 2A.1 displays a sample icon array used to portray nematode pressure on 10% of a
one quarter hectare (one lima) tomato plot.
Figure 2A.1: Sample icon array

125
REFERENCES

126
REFERENCES
Alene, A. D., & Manyong, V. M. (2006). Farmer-to-farmer technology diffusion and yield
variation among adopters: the case of improved cowpea in northern Nigeria. Agricultural
Economics, 35(2), 203–211.
Amudavi, D. M., Khan, Z. R., Wanyama, J. M., Midega, C. A., Pittchar, J., Hassanali, A., & Pickett, J. A. (2009). Evaluation of farmers’ field days as a dissemination tool for push-pull technology in Western Kenya. Crop Protection, 28(3), 225–235.
Antle, J. M., Cole, D. C., & Crissman, C. C. (1998). Further evidence on pesticides, productivity and farmer health: Potato production in Ecuador. Agricultural Economics, 18(2), 199–207.
Athukorala, W., Wilson, C., & Robinson, T. (2012). Determinants of health costs due to farmers’ exposure to pesticides: an empirical analysis. Journal of Agricultural Economics, 63(1), 158–174.
Bagwell, K., & Riordan, M. H. (1991). High and declining prices signal product quality. The
American Economic Review, 224–239.
BenYishay, A., & Mobarak, A. M. (2013). Communicating with farmers through social networks. Yale University Economic Growth Center Discussion Paper, (1030). Retrieved from http://papers.ssrn.com/sol3/papers.cfm?abstract_id=2315229
Bwalya, S. M. (n.d.). Environmental Council of Zambia. Retrieved from http://new.unep.org/chemicalsandwaste/Portals/9/Mainstreaming/smc%20final%20report%20Cost%20Benefit%20Kafue%20Basin.doc
Cachomba, S., Cairns, J., Tschirley, D., & Snyder, J. (2013). Risk Perception and Behavior in Pesticide Use by the Horticultural Producers of. Retrieved from http://citeseerx.ist.psu.edu/viewdoc/summary?doi=10.1.1.644.8727
Chang, H.-S., & Kinnucan, H. W. (1991). Advertising, information, and product quality: the case of butter. American Journal of Agricultural Economics, 73(4), 1195–1203.
Crissman, C. C., Cole, D. C., & Carpio, F. (1994). Pesticide use and farm worker health in Ecuadorian potato production. American Journal of Agricultural Economics, 76(3), 593–597.
Cuyno, L., Norton, G. W., & Rola, A. (2001). Economic analysis of environmental benefits of integrated pest management: a Philippine case study. Agricultural Economics, 25(2–3), 227–233.
Food and Agricultural Organization (FAO) of the United Nations. (2016). FAOstat database.

127
Garcia-Retamero, R., & Galesic, M. (2010). Who profits from visual aids: Overcoming challenges in people’s understanding of risks. Social Science & Medicine, 70(7), 1019–1025.
Garming, H., & Waibel, H. (2009). Pesticides and farmer health in Nicaragua: a willingness-to-pay approach to evaluation. The European Journal of Health Economics, 10(2), 125–133.
Hashemi, S. M., Hosseini, S. M., & Hashemi, M. K. (2012). Farmers’ perceptions of safe use of pesticides: determinants and training needs. International Archives of Occupational and
Environmental Health, 85(1), 57–66.
Hichaambwa, M., Chamberlin, J., Kabwe, S., & others. (2015). Is Smallholder Horticulture the
Unfunded Poverty Reduction Option in Zambia? A Comparative Assessment of Welfare
Effects of Participation in Horticultural and Maize Markets. Citeseer. Retrieved from http://citeseerx.ist.psu.edu/viewdoc/download?doi=10.1.1.697.1482&rep=rep1&type=pdf
Khan, M. (2009). Economic Evaluation of Health Cost of Pesticide Use: Willingness to Pay Method. The Pakistan Development Review, 459–470.
Kouser, S., & Qaim, M. (2014). Bt cotton, damage control and optimal levels of pesticide use in Pakistan. Environment and Development Economics, 19(06), 704–723.
Lichtenberg, E., & Zilberman, D. (1986). The econometrics of damage control: why specification matters. American Journal of Agricultural Economics, 68(2), 261–273.
Marette, S., Roosen, J., & Blanchemanche, S. (2008). Health information and substitution between fish: lessons from laboratory and field experiments. Food Policy, 33(3), 197–208.
Matthews, G., Wiles, T., & Baleguel, P. (2003). A survey of pesticide application in Cameroon. Crop Protection, 22(5), 707–714.
Maumbe, B. M. (2001). Essays on the economics of cotton production in Zimbabwe: policy
implications for technology adoption, farmer health and market liberalization.
Maumbe, B. M., & Swinton, S. M. (2003). Hidden health costs of pesticide use in Zimbabwe’s smallholder cotton growers. Social Science & Medicine, 57(9), 1559–1571.
Mobius, M., Phan, T., & Szeidl, A. (2015). Treasure hunt: Social learning in the field. National Bureau of Economic Research. Retrieved from http://www.nber.org/papers/w21014
Ntow, W. J., Gijzen, H. J., Kelderman, P., & Drechsel, P. (2006). Farmer perceptions and pesticide use practices in vegetable production in Ghana. Pest Management Science, 62(4), 356–365. https://doi.org/10.1002/ps.1178
Pimentel, D., & Burgess, M. (2014). Environmental and economic benefits of reducing pesticide use. In Integrated Pest Management (pp. 127–139). Springer.

128
Pingali, P. L., Marquez, C. B., & Palis, F. G. (1994). Pesticides and Philippine rice farmer health: a medical and economic analysis. American Journal of Agricultural Economics, 76(3), 587–592.
Rother, H.-A. (2008). South African farm workers’ interpretation of risk assessment data expressed as pictograms on pesticide labels. Environmental Research, 108(3), 419–427.
Sibanda, T., Dobson, H. M., Cooper, J. F., Manyangarirwa, W., & Chiimba, W. (2000). Pest management challenges for smallholder vegetable farmers in Zimbabwe. Crop Protection, 19(8), 807–815.
Sineria Industries Ltd. (2015). Orizon Fact Sheet. http://www.sineria.com/wp-content/uploads/2015/02/Orizon-Sineria.pdf
Snyder, J., Smart, J., Goeb, J., Tschirley, D., & others. (2015). Pesticide use in Sub-Saharan
Africa: Estimates, Projections, and Implications in the Context of Food System
Transformation. Michigan State University, Department of Agricultural, Food, and Resource Economics. Retrieved from https://ideas.repec.org/p/ags/midamp/230980.html
Tijani, A. A. (2006). Pesticide use practices and safety issues: The case of Cocoa farmers in Ondo State, Nigeria. J Hum Ecol, 19(3), 183–90.
Tilman, D., Cassman, K. G., Matson, P. A., Naylor, R., & Polasky, S. (2002). Agricultural sustainability and intensive production practices. Nature, 418(6898), 671–677.
Tilman, D., Fargione, J., Wolff, B., D’Antonio, C., Dobson, A., Howarth, R., … Swackhamer, D. (2001). Forecasting agriculturally driven global environmental change. Science, 292(5515), 281–284.
Wolinsky, A. (1983). Prices as signals of product quality. The Review of Economic Studies, 647–658.
World Health Organization (WHO) of the United Nations. (2010). The WHO recommended classification of pesticides by hazard and guidelines to classification 2009.
Zeithaml, V. A. (1988). Consumer perceptions of price, quality, and value: a means-end model and synthesis of evidence. The Journal of Marketing, 2–22.
Zilberman, D., Schmitz, A., Casterline, G., Lichtenberg, E., & Siebert, J. B. (1991). The Economics of Pesticide Use and Regulation. Science, 253(5019), 518–522.

129
3 THE EFFECTS OF A FARMER-TO-FARMER TRAINING PROGRAM ON
PESTICIDE KNOWLEDGE
3.1 Introduction
Agricultural extension programs have long been an important part of development
agendas and the estimated benefits of such programs are often well above the costs (Birkhaeuser
et al., 1991). Yet, there is wide variance in the benefits across programs and information delivery
methods. The economic literature on learning provides conceptual foundation for programs
designed to disseminate new information. Under that framework, farmers do not know the true
shape of their production functions. In other words, they do not know the effects of their inputs
with certainty. Farmers must learn these effects through their own experiences (Hanna et al.,
2014), other farmers’ experiences (Conley and Udry, 2010), an outside information source, or
some combination of the three. The economic learning arguments extend to health inputs as
well31 where individuals learn about health inputs from their own experiences (Corno, 2014) and
extension services (Banteyerga, 2011). Some inputs may have production effects on agricultural
output and health. A leading example is pesticides, which have positive yield effects (Crissman
et al., 1994) but negative health effects (Sheahan et al., 2016; Pingali et al., 1994; Gorrell et al.,
1998).
Both the health risks and the production benefits of pesticides are complicated processes
that may be difficult to learn through experience alone. Jack (2013) surveys the literature on
information and technology adoption and emphasizes that market failures in information are
31 The health production framework pioneered by Grossman (1972) models health as a production process. Health production models typically allow health to affect agricultural production through labor quantity and quality (Pitt and Rosenzweig, 1984).
130
likely for new, complicated technologies. Further complicating the learning process is the fact
that vegetable farmers in sub-Saharan Africa (SSA) face a wide choice set of pesticides (Ntow et
al., 2006) that might make learning about the production benefits and health costs of any single
product a slow process. As a result, the clear majority of pesticide studies conclude with a
recommendation to increase knowledge with better information (Dasgupta et al., 2007; Ngowi et
al., 2007; Ntow et al., 2006; Hashemi et al., 2012; Macharia et al., 2013; Madisa et al., 2012;
Matthews et al., 2003; Mekonnen et al., 2002; Nonga et al., 2011; Obopile et al., 2008; Okello
and Swinton, 2010; Oluwole and Cheke, 2009; Tijani, 2006).
There are, however, two unresolved issues with this recommendation. First, we do not
have a clear, complete picture of farmer pesticide knowledge, and thus do not know if and where
information can have an impact. Second, we do not know whether new information delivered
through a training program changes farmer pesticide knowledge. The social learning literature
shows that under certain conditions acquiring new information over time need not lead to
accurate knowledge or beliefs (Acemoglu et al., 2010; Hanna et al., 2014). Thus, experience and
information sharing, even over an extended period, do not guarantee accurate or complete
knowledge of pesticides.
The most common framework used to research farmer pesticide health knowledge is the
knowledge, attitudes, and practice (KAP) method. Pesticide KAP assessments typically ask
farmers if they agree or disagree with a limited set of knowledge and attitude questions about
pesticide safety (usually fewer than ten questions), and collect data on a related set of reported
pesticide practices. The KAP literature takes a useful step towards understanding farmer
pesticide safety by relating pesticide knowledge to safety behaviors and helping to identify gaps
that might be filled with more complete information. However, one drawback of many KAP

131
studies is they do not offer a complete picture of farmer pesticide knowledge. This study presents
detailed pesticide knowledge assessments for tomato growers in rural Zambia with 22 questions
covering both pesticide health risk knowledge and knowledge of crop production benefits from
specific pesticides. We find two general knowledge results that align well with existing pesticide
literature and with economic learning theories. First, farmers appear to have reached an accurate
consensus on two general facts pertaining to pesticide safety: (i) pesticides are generally harmful
to human health and (ii) exposure risks can be mitigated with personal protective equipment
(PPE). Second, farmers lack detailed knowledge of two more complex pesticide effects: (i)
toxicity identification and relative health risks and (ii) pesticide control properties (i.e., what
pests each pesticide controls).
The learning literature shows that information signals may have varying effects on beliefs
based on how (or from whom) the information is delivered (Chandrasekhar et al., 2012;
Acemoglu et al., 2010; DeGroot, 1974). Thus, a knowledge increase from new information is not
guaranteed; it is possible for a training program to have a small or zero effect on farmer
knowledge. The limited previous research exploring information and pesticide knowledge is
descriptive and lacks a randomized control. Feder et al. (2004) test the diffusion of pesticide
knowledge in Indonesia stemming from farmer field school (FFS) training programs. They
identify small, but significant knowledge increases in farmer knowledge measured by six
questions related to pest management. However, the graduates of the FFS programs had smaller
knowledge increases on average than a non-random comparison group. Further, Feder et al.
(2004) emphasize that the FFS training approach is expensive; a result consistent with other FFS
assessments that suggest that other information delivery mechanisms may be more cost-effective
and impactful (Harris et al., 2013; Labarta, 2005).
132
Sam et al. (2008) examine the impacts of a one-on-one discussion of pesticide safety on
pesticide handlers’ KAP composite scores. While they observe significant improvements in KAP
scores with a large increase in knowledge after farmers received information, delivering
information face-to-face as promoted in the train and visit approach to extension has
prohibitively high costs that make it infeasible in many developing countries with tight
agriculture and rural extension budgets. Further, they do not use a control group as a comparison,
and, thus, do not isolate information’s impact on knowledge from any potential time trends or
interview effects stemming from being questioned in detail about pesticide safety.
This study improves on this literature by (i) conducting a randomly controlled test of
information’s impact on pesticide knowledge among tomato farmers in Zambia, (ii) using a low
cost, commonly used extension method – a farmer-to-farmer (f2f) training and informational
letter – to distribute pesticide information, and (iii) identifying heterogeneous effects of training
based on farmer education and experience. We present the first detailed, quantitative, and
randomly controlled assessment of the impacts of f2f training and an informational letter on
pesticide knowledge. F2f training programs are a commonly used avenue for information
delivery in rural areas throughout SSA. These programs are tailored and adapted to their field
contexts and objectives, but the basic framework is the same. Communities select a
representative (often referred to as the “lead farmer”) to receive detailed information about a
technology. These representatives then disseminate the same information in their communities
through local training meetings.
We find that pesticide information can improve farmer knowledge, but the effects of
information are uneven across knowledge categories. Farmer knowledge of pesticide toxicity and
efficacy increased significantly, but farmer knowledge of exposure and PPE benefits did not. We

133
also observe differences in knowledge changes based on farmer education. We also find
significant knowledge gains in pesticide control properties for control group farmers, particularly
those with high education, and we argue that these effects are likely the result of learning from
the baseline questionnaire. Lastly, experience alone does not lead to greater knowledge as more
experienced farmers have lower prior knowledge of class U pesticide health risks and the
relationship between pesticide efficacy and price. However, when provided with new
information, the more experienced farmers had significantly greater knowledge increases.
This paper proceeds as follows. The next section surveys the literature on pesticide
knowledge and f2f trainings. Section three describes the agricultural context for our study, and is
followed by a conceptual model of knowledge change in section four. The fifth section describes
our data, the experimental design, and the training program. The empirical strategy is outlined in
section six. Section seven presents our results including a description of training compliance, an
analysis of baseline pesticide knowledge, estimates of the impact of the information intervention
on several knowledge outcomes, and a discussion of the training program costs. Section eight
concludes the study by summarizing key results.
3.2 Literature review
3.2.1 Pesticide knowledge
Each pesticide knowledge study is unique; they are conducted in different countries with
heterogeneous production, policy, and market environments. As a result, farmers face different
pests that threaten their crops, have different choice sets of pesticides, and have varied access to
pesticide information. Further, each study asks unique questions and focuses on different
components of farmer knowledge. Despite this heterogeneity, we find four generalized pictures

134
of smallholder farmer pesticide knowledge in the literature. First, farmers generally understand
that pesticides are harmful to their health. Eighty one percent of vegetable farmers in Kenya
knew that pesticides have negative effects on human health (Macharia et al., 2013). In
Nicaragua, 97% of farmers were aware of pesticide health effects (Labarta, 2005). Crissman et
al. (1994) show that 70% of potato farmers in Ecuador very strongly agreed that pesticides cause
serious health problems. Salameh et al. (2004) find that 70% of their sample in Lebanon that
pesticides are toxic products. All surveyed farmers in Sri Lanka mentioned negative health
impacts from spraying pesticides (Van der hoek et al., 1998).
Second, farmers broadly know that exposure to pesticides can be harmful and that PPE is
important to reducing health risks. Ninety three percent of Ethiopian farmers mentioned that
handling pesticides carefully was very important (Mekonnen and Agonifir, 2002). Van der hoek
et al. (1998) found Sri Lankan farmers to be generally knowledgeable of exposure and how to
prevent it and Macharia et al. (2013) found Kenyan vegetable farmers to be similarly
knowledgeable. In Indonesia, Yuantari et al. (2015) found that more than 80% of farmers knew
about dermal pesticide exposure risks and more than 80% knew that PPE was necessary during
spraying or mixing.
The third knowledge generalization that emerges from previous research is that farmers
generally do not know the different pesticide toxicity classes nor are they able to identify them.
Maumbe (2001) found that less than half of his sample of Zimbabwean cotton farmers could
accurately identify and rank pesticide toxicity labels. Rother (2008) found that South African
farmers generally had trouble identifying and interpreting the hazard labels on pesticide
packaging and only 30% of farm workers correctly identified the toxicity label. There also
appears to be a general perception that all pesticides are highly toxic when there is considerable
135
variation in toxicities across products. Cachomba et al. (2013) and Goeb (Essay 2) find similar
toxicity perceptions for horticultural farmers in Mozambique and Zambia, respectively; nearly
80% of the pesticides used were perceived to be highly toxic and farmers demonstrated a very
limited ability to adjust their toxicity perceptions based on the actual toxicity of the pesticide.
Ntow et al. (2006) show that at least 84% of Ghanaian vegetable producers listed each of three
pesticides to be highly hazardous.
Fourth, farmers do not have a deep understanding of pesticide pest-control properties.
The primary reason a farmer applies pesticides is to reduce potential crop loss from pest damage
and therefore increase agricultural output (Lichtenberg and Zilberman, 1986). Cotton and
vegetable crops are highly susceptible to pest damage in SSA and the majority of farmers
cultivating these crops use synthetic pesticides to control a wide spectrum of pests (Sibanda et
al., 2000; Maumbe and Swinton, 2003; Williamson et al., 2008; Ngowi et al., 2007). Yet despite
the high pesticide use rates, previous research shows that farmers have limited knowledge of
pesticide efficacy and production effects. Many farmers do not understand the complicated
modes of action for pesticides indicating that they do not fully grasp how the products control
pests (Ngowi, 2003). Farmers also demonstrate low knowledge of pesticide efficacy by (i)
mixing too much (overdosing) or too little (underdosing) pesticide active ingredient prior to
application, and (ii) combining several pesticides into a single mixture against pesticide label
recommendations (Ngowi et al., 2007; Dasgupta et al., 2007). Farmers have also demonstrated
limited knowledge of what pesticides are available to them (Salameh, et al., 2004)
These generalized pictures of pesticide knowledge suggest that smallholder farmers that
work with pesticides have broad and imprecise knowledge of pesticide health and crop
production effects. Farmers generally know that pesticides are harmful to humans and useful
136
tools for controlling pests, but they do not have deep knowledge of pesticide control properties or
toxicity.
3.2.2 Farmer-to-farmer trainings
The literature on f2f trainings is limited, yet it shows the programs to be generally
effective. Lead farmers (or farmer trainers) and follower farmers demonstrate high technical
efficiencies in agricultural production (Alene and Manyong, 2006; Amudavi et al., 2009) and
high knowledge of the promoted technologies (Amudavi et al., 2009). Though these studies
focus on program farmers only, and do not make comparisons to a control group of farmers
unexposed to the programs, nor do they compare results before and after the program was
implemented. BenYishay and Mobarak (2013) overcome those pitfalls with a randomized control
trial of three extension methods – two f2f program variations and a training program through
government extension workers. When the farmer trainers were given a small incentive to
distribute information, the f2f programs outperformed the government extension program in
increasing farmer knowledge assessed using 6 or 7 questions about the promoted technologies.
This study adds to the f2f training literature as a randomized controlled trial with several
detailed pesticide knowledge outcomes including ten true/false questions, sixteen pest control
questions, two toxicity identification questions, and one question on perceived price-efficacy
relationship for pesticides. We explore these knowledge effects of training in the context of
tomato farmers in rural Zambia.
3.3 Agricultural production setting
Pesticide use in developing countries has increased markedly in recent years and sub-
Saharan Africa (SSA) is no exception (Williamson et al., 2008). A large share of pesticides used

137
in SSA is applied to horticultural crops where they offer large production benefits by controlling
a wide array of pests (Sibanda et al., 2000). As incomes in SSA continue to grow, demand for
horticultural produce is expected to increase, and pesticide use is expected to continue its
increasing trend as farmers increase production to meet the rising demand (Snyder et al., 2015).
Horticultural production is already an important source of income for many rural farmers in sub-
Saharan Africa. In 2012, an estimated 1.5 million Zambian farmers produced vegetable crops,
which are important for diet diversity for many rural households, many of whom consume
tomatoes on a daily basis. In Zambia, the area of land devoted to tomato production increased by
22% from 2008 to 2013 (FAO), and for good reason. Tomatoes offered smallholder farmers an
estimated gross margin 179 times that of the dominant field crop maize (Hichaambwa et al.,
2015). These higher returns, however, are only realized when crop losses from pests are
sufficiently controlled. The primary reason for horticultural crop loss in Zambia was pest
pressure (Snyder et al., 2015). To reduce their losses from pest damage, farmers overwhelmingly
turn to synthetic pesticides (Sibanda et al., 2000).
Smallholder horticultural producers in Zambia have access to a generally wide and
growing choice set of pesticide products. The number of pesticide import licenses increased 77%
from 2004 to 2007 when 565 licenses were issued (Bwalya, 2010). While those licenses also
include disinfectants and some household chemicals, agricultural pesticides accounted for more
than 90% of the value of chemicals imported (ibid.). Snyder et al. (2015) found that horticultural
producers applied an average of 2.2 and 2.8 pesticides in each of their two study regions on
Mozambique. Thus, farmers use only a small subset of the products available to them in a given
year, and the wide and growing choice set of pesticides available to farmers likely makes
learning about efficacy and health risks through product experience a major challenge. Further,
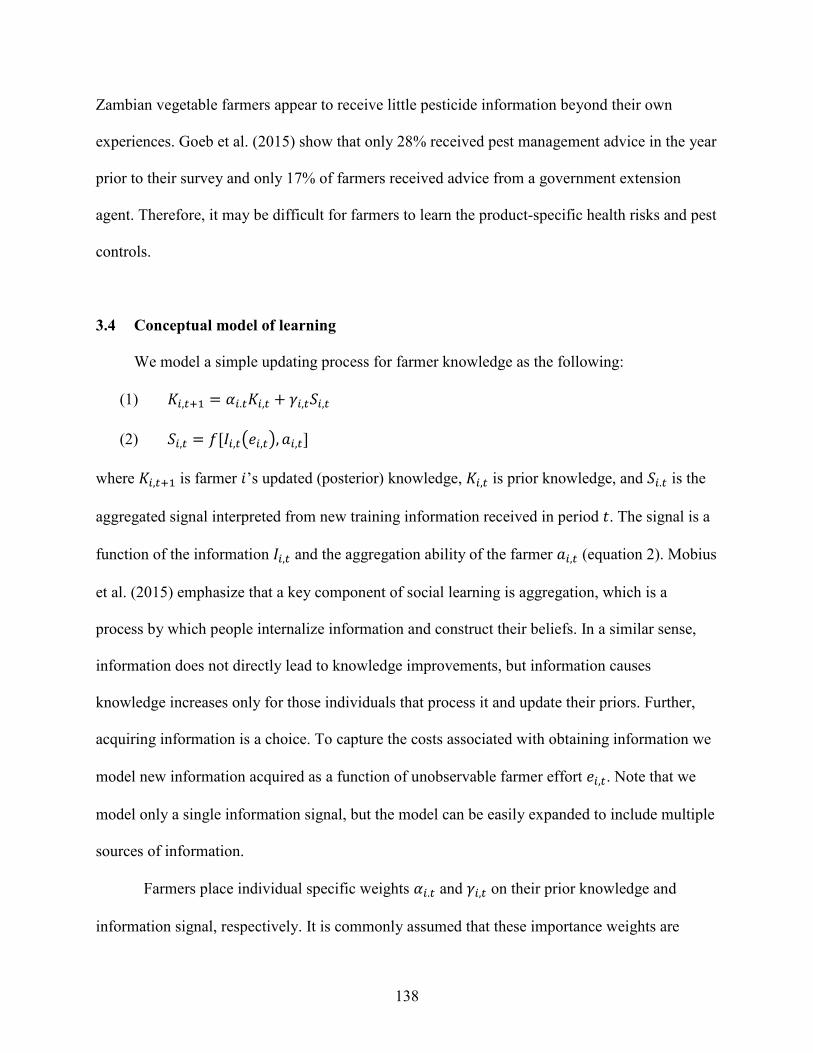
138
Zambian vegetable farmers appear to receive little pesticide information beyond their own
experiences. Goeb et al. (2015) show that only 28% received pest management advice in the year
prior to their survey and only 17% of farmers received advice from a government extension
agent. Therefore, it may be difficult for farmers to learn the product-specific health risks and pest
controls.
3.4 Conceptual model of learning
We model a simple updating process for farmer knowledge as the following:
(1) %K,�EN = ^K.�%K,� + \K,�$K,�
(2) $K,� = �p2K,��)K,��, K,�r where %K,�EN is farmer x’s updated (posterior) knowledge, %K,� is prior knowledge, and $K.� is the
aggregated signal interpreted from new training information received in period P. The signal is a
function of the information 2K,� and the aggregation ability of the farmer K,� (equation 2). Mobius
et al. (2015) emphasize that a key component of social learning is aggregation, which is a
process by which people internalize information and construct their beliefs. In a similar sense,
information does not directly lead to knowledge improvements, but information causes
knowledge increases only for those individuals that process it and update their priors. Further,
acquiring information is a choice. To capture the costs associated with obtaining information we
model new information acquired as a function of unobservable farmer effort )K,�. Note that we
model only a single information signal, but the model can be easily expanded to include multiple
sources of information.
Farmers place individual specific weights ^K.� and \K,� on their prior knowledge and
information signal, respectively. It is commonly assumed that these importance weights are
139
nonnegative and sum to one, i.e., that updated knowledge is a convex combination of previous
knowledge and the new information signal (Viscusi, 1987; Acemoglu et al., 2010), though
empirically testing the effects of information on knowledge, as we do in this paper, does not
require this assumption upfront.
Allowing the weights to be individual specific is not new. Acemoglu et al. (2010)
assumed different weights based on an individual’s type and the source of information’s type,
and Degroot (1974) also discussed variations in weights. Acemoglu et al. (2010) posit that some
individuals (“forceful agents” in their terminology) have a stronger influence on some people’s
beliefs than others – i.e., the weight on the signal from new information can vary based on who
is transmitting that signal. This is consistent with Benyishay et al. (2013) who conducted an
randomized control trial of an information intervention with different agents selected to
disseminate the information. They found heterogeneity in knowledge changes across the types of
individuals chosen to distribute the information. Specifically, they found that information had
larger effects on knowledge and behavior when those distributing the information were more
similar across observable characteristics to the farmers receiving it.
Degroot (1974) posited a similar variation in weights based on who delivered the
information and suggested that in some instances an individual will choose to put a very small
weight on the new information signal:
“If individual i feels that individual j is a leading expert … or if he thinks that individual j
has had access to a large amount of information … then individual i will choose a large
value of [the weight of information]. Alternatively, individual i may wish to assign a
large weight to his own distribution and a small total weight to the distributions of the

140
others. In this case, his revised subjective [belief] will probably differ very little from [his
prior].”
Thus, in our model, if a farmer has a large degree of confidence in their prior knowledge, then
^K.� will be large relative to \K.� and their knowledge will not change much from the new
information signal. Alternatively, if a farmer has a high degree of trust in the information source,
then \K.� will be large relative to ^K.� and their knowledge will change substantially from the new
information signal.
3.5 Data and research design
3.5.1 Data
While there are pockets of horticultural producers scattered throughout Zambia, there is
perhaps no greater concentration than the tomato farmers in the Eastern side of Mkushi district.
For this reason, we chose Mkushi for our study area, and tomato growers specifically for our
population. We used household spatial data for the full listing of 711 tomato farmers in our study
area to create 32 Enumeration Areas (EAs) of 20-30 farmers that lived in relative proximity to
each other – using the existing village structures in our study area was immediately intractable
due to variations in village size and inconsistent farmer definitions of a village. We used natural
delineations (e.g., rivers and hills) to separate the EAs whenever possible, thus creating at least
some boundary between EAs which also lends itself nicely to the information intervention design
(discussed below in section 3.5.4). After creating the EAs, we randomly selected 16 farmers
within each EA to be interviewed, thus achieving a total sample size of 512 farmers.
To develop the questionnaire, knowledge assessments, and training program, we
completed 37 semi-structured interviews with tomato farmers (section 3A.2 in the appendix

141
presents a timeline of research activities). We asked questions on pesticide purchasing behaviors,
mixing and application techniques, and information sources available to them, and allowed
farmers to expound on each category as they felt fit. We also observed in-field pesticide
applications that revealed that farmers regularly apply pesticides without PPE and many do not
observe toxicity labels on the products they purchase. Therefore, toxicity and PPE became two
immediate focal points for the training program.
To identify pesticides for the demand experiments, we visited 16 pesticide retail outlets to
catalogue available pesticides and to talk with agronomists and salespeople. We asked about
product sales (e.g., what were the most common products sold to combat specific pests), price
histories of these products, and the how long the retailers had been selling each product. After
developing a draft survey, we pretested the questionnaire with about 50 farmers for
comprehension and to ensure that none of the modules were too cognitively taxing. We modified
the final questionnaire accordingly.
The sample for analysis is 488 farmers – 246 of whom were assigned to the treatment
group – reflecting 17 observations trimmed for outlying data over important variables (asset
ownership, tomato area, or the number of pesticides purchased), and 7 attrition observations
between survey rounds (three from the control group, and four from the treatment group) 32. The
sample is balanced across treatment assignment for 13 of 16 variables tested (results shown in
appendix Table 3A.2)33. The treatment group received horticultural advice from more sources
than the control group, while the control group had a higher share of farmers with business
income and a higher literacy rate. Importantly, these differences do not correspond to higher
32 We define outliers as three times the standard deviation from the mean. 33 We also conducted balance tests over 33 variables not included in Table A2 (20 plot and harvest variables, 8 input variables, and 5 PPE ownership variables), and the differences are insignificant in 31 of the additional 33 tests.
142
knowledge for one group over the other as the groups are balanced over baseline knowledge
questions of exposure and toxicity (explored in more detail in Table 3.3 below).
3.5.2 Knowledge assessments
After identifying our sample of 512 farmers, we completed baseline and endline
questionnaire interviews that captured detailed information on their household demographics,
asset ownership, tomato production (e.g., inputs used, harvested volumes, and sales), pesticide
purchases, pest prevalence and perceptions, pesticide safety behaviors, information sources,
pesticide acute illness symptoms experienced, and pesticide demand experiments.
We also implemented five pesticide knowledge assessments shown in Table 3.1. The first
knowledge assessment captured farmer knowledge of toxicity risks and identification. At both
the baseline and endline, we asked five true/false questions of the varied pesticide health risks
relating to toxicity and at the endline we asked two toxicity identification questions where
farmers had to identify the health risks of low toxicity (Benefit) and a high toxicity (Phoskill)
pesticide34. In each case, farmers were shown a 100 mL bottle of the pesticide and were asked to
report its toxicity. The second knowledge assessment captured farmer knowledge of pesticide
exposure and the benefits of PPE with five true/false questions. All farmers responded to
questions covering the same content, but for the true/false questions we randomly assigned
farmers to one of two frames where the correct responses were opposite for each frame (e.g., if
the correct response for frame one was “true,” then we slightly altered the phrasing for frame two
to make the correct response “false”). The third and fourth knowledge assessments elicited
farmer knowledge of pesticide pest control properties for bollworm pesticides and nematicides,
34 We did not ask the toxicity identification questions at the baseline because we felt that the assessment itself would draw too much attention to toxicity identification – a key component of our pesticide training program – and potentially serve as an information intervention to the control group, therefore contaminating the treatment effect estimates.
143
respectively at both the baseline and endline surveys. In each case, we asked farmers an open-
ended question of what pesticides they knew to control each pest, as well as questions about their
knowledge of what specific bollworm pesticides and nematicides controlled. The fifth
knowledge assessment was a single question in the endline survey to assess farmer perceptions
of a positive price-efficacy relationship for pesticides. In total, we asked 18 knowledge
questions at both the endline and baseline and 22 knowledge questions at the endline.
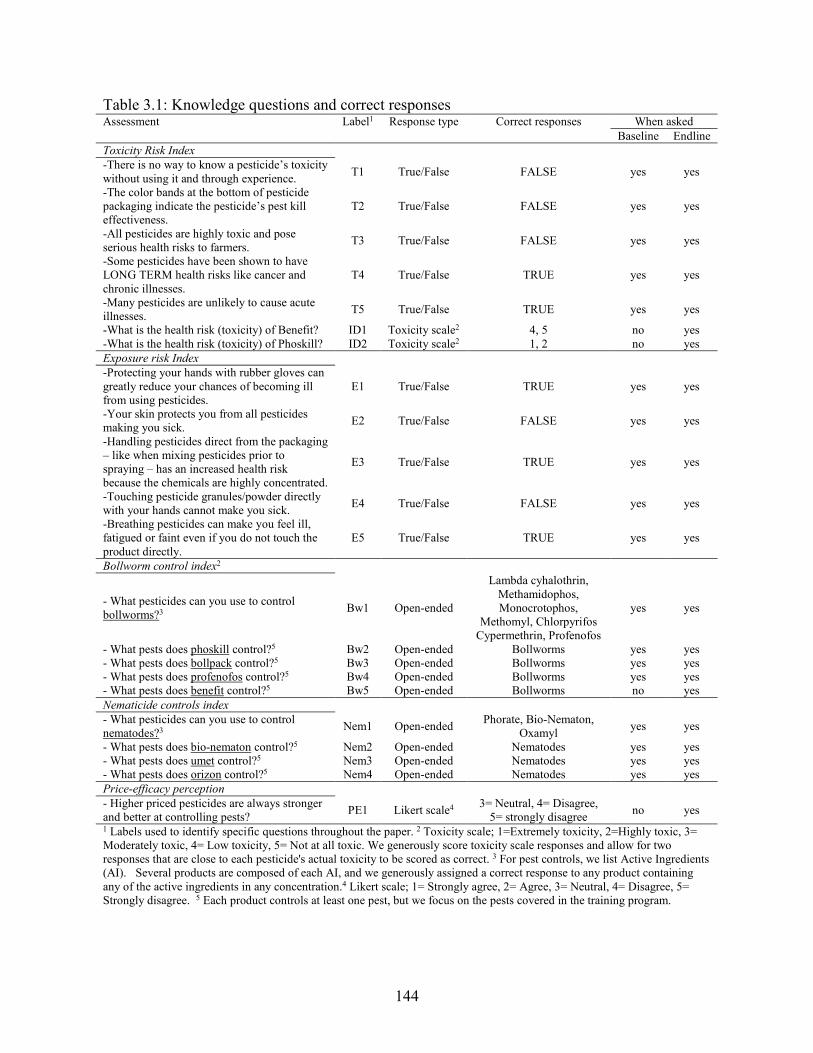
144
Table 3.1: Knowledge questions and correct responses Assessment Label1 Response type Correct responses When asked
Baseline Endline
Toxicity Risk Index -There is no way to know a pesticide’s toxicity without using it and through experience.
T1 True/False FALSE yes yes
-The color bands at the bottom of pesticide packaging indicate the pesticide’s pest kill effectiveness.
T2 True/False FALSE yes yes
-All pesticides are highly toxic and pose serious health risks to farmers.
T3 True/False FALSE yes yes
-Some pesticides have been shown to have LONG TERM health risks like cancer and chronic illnesses.
T4 True/False TRUE yes yes
-Many pesticides are unlikely to cause acute illnesses.
T5 True/False TRUE yes yes
-What is the health risk (toxicity) of Benefit? ID1 Toxicity scale2 4, 5 no yes -What is the health risk (toxicity) of Phoskill? ID2 Toxicity scale2 1, 2 no yes
Exposure risk Index
-Protecting your hands with rubber gloves can greatly reduce your chances of becoming ill from using pesticides.
E1 True/False TRUE yes yes
-Your skin protects you from all pesticides making you sick.
E2 True/False FALSE yes yes
-Handling pesticides direct from the packaging – like when mixing pesticides prior to spraying – has an increased health risk because the chemicals are highly concentrated.
E3 True/False TRUE yes yes
-Touching pesticide granules/powder directly with your hands cannot make you sick.
E4 True/False FALSE yes yes
-Breathing pesticides can make you feel ill, fatigued or faint even if you do not touch the product directly.
E5 True/False TRUE yes yes
Bollworm control index2
- What pesticides can you use to control bollworms?3
Bw1 Open-ended
Lambda cyhalothrin, Methamidophos, Monocrotophos,
Methomyl, Chlorpyrifos Cypermethrin, Profenofos
yes yes
- What pests does phoskill control?5 Bw2 Open-ended Bollworms yes yes - What pests does bollpack control?5 Bw3 Open-ended Bollworms yes yes - What pests does profenofos control?5 Bw4 Open-ended Bollworms yes yes - What pests does benefit control?5 Bw5 Open-ended Bollworms no yes
Nematicide controls index
- What pesticides can you use to control nematodes?3
Nem1 Open-ended Phorate, Bio-Nematon,
Oxamyl yes yes
- What pests does bio-nematon control?5 Nem2 Open-ended Nematodes yes yes - What pests does umet control?5 Nem3 Open-ended Nematodes yes yes - What pests does orizon control?5 Nem4 Open-ended Nematodes yes yes
Price-efficacy perception
- Higher priced pesticides are always stronger and better at controlling pests?
PE1 Likert scale4 3= Neutral, 4= Disagree,
5= strongly disagree no yes
1 Labels used to identify specific questions throughout the paper. 2 Toxicity scale; 1=Extremely toxicity, 2=Highly toxic, 3= Moderately toxic, 4= Low toxicity, 5= Not at all toxic. We generously score toxicity scale responses and allow for two responses that are close to each pesticide's actual toxicity to be scored as correct. 3 For pest controls, we list Active Ingredients (AI). Several products are composed of each AI, and we generously assigned a correct response to any product containing any of the active ingredients in any concentration.4 Likert scale; 1= Strongly agree, 2= Agree, 3= Neutral, 4= Disagree, 5= Strongly disagree. 5 Each product controls at least one pest, but we focus on the pests covered in the training program.

145
3.5.3 Research design
As the conceptual model of learning shows, acquiring information is a choice that
requires effort. To identify the causal effects of information on knowledge, we randomly
assigned farmers at the EA level to receive pesticide information. Opportunities for the control
group farmers to take part in the first round of information interventions were limited by design,
but the control group received an identical intervention after we completed endline data
collection.
We chose a blocked (or stratified) experimental design to maximize statistical power.
Within our budget constraint, we determined that we could complete two rounds of interviews
(baseline and endline) for approximately 500 farmers. Based on this constraint, we computed
minimum detectable effect sizes for several experimental designs, and arrived at our final design
of 32 EAs of 16 farmers each with half of the EAs being assigned to treatment and the other half
to the control. To implement the block randomization, we simply ordered the EAs from lowest to
highest on their EA-level mean composite knowledge score and paired EAs in order to create 16
blocks (or strata) 35. Then we randomly assigned one EA from each blocked pair to the treatment
group. This procedure ensures greater treatment and control group balance over an important
characteristic and improves statistical efficiency (Bruhn and McKenzie, 2009). A full
randomization of EAs (without blocking) increases the probability of selecting an unbalanced
share of more or less knowledgeable farmers into the treatment group, potentially resulting in an
inaccurate estimate of the information intervention’s effect in at least two possible ways. First,
farmers with lower initial knowledge potentially have more to gain from the information
intervention; the possible gain in knowledge is larger for farmers with low initial scores. Second,
35 Composite knowledge scores for each farmer are the number of correct responses to twelve true/false questions on pesticides.
146
farmers with higher initial knowledge may be better able to process training information and
therefore be more responsive to new information. By blocking over baseline knowledge, we
reduce the risk of either effect being captured in the treatment effect estimates.
3.5.4 Information intervention
Information gathered during semi-structured farmer interviews and informal
conversations prior to collecting data were used to motivate the training’s four objectives. First,
we sought to teach farmers to identify and understand pesticide toxicity labels. We gave special
emphasis to the large health risk differences between World Health Organization (WHO) class Ib
pesticides36 (highly hazardous) and WHO class U pesticides (unlikely to cause acute harm). The
second objective was to show farmers how to effectively protect themselves from pesticide
exposure through PPE use. These were the two primary objectives of the training program and
they were given more emphasis in the training. The third objective was to diminish the perceived
positive relationship between pesticide price and pesticide efficacy (how well a pesticide controls
a certain pest). Semi-structured interviews revealed that many farmers believed higher priced
pesticides were more effective at controlling pests, but in the markets, we found no evidence
supporting that perception37. The training taught farmers that a higher price does not imply that a
product is more effective at controlling pests. The fourth and final training objective was to
familiarize farmers with a subset of available pesticides; four bollworm controlling pesticides
(Benefit, Profenofos, Phoskill, and Bollpack), and three nematicides (Bio-nematon, Orizon, and
Umet). This objective was largely a byproduct of the toxicity objective, as it was important to
36 Throughout this paper, we use World Health Organization (WHO) human health risk classifications of toxicity (WHO, 2010). 37 We observed variations in prices across retailers for the same product at the same time. Further, some retailers adjusted their pesticide prices according to exchange rates, while others held prices fixed over time.
147
make our toxicity lesson concrete with actual pesticides and to increase farmer familiarity with
safer WHO class U pesticide options.
For any information intervention to successfully change farmer knowledge or
perceptions, farmers must believe the new information and trust its source. Farmers will
otherwise place a low importance weight on the new information (\K,� in the conceptual model).
In an effort to increase the training effects, we delivered information through farmers within their
villages. Zambian horticulturalists trust their fellow farmers and family members much more
than government extension agents and other information sources (Table 3A.1 in the appendix).
Salameh et al. (2004) show similar results in Lebanon as farmers are more likely to turn to their
own experience and to other farmers than to extension agents for advice. Thus, disseminating
information through local farmers as opposed to professional extension workers was a logical
choice in designing an effective, impactful training program. The f2f training concept was
specifically relevant as it ensures that the farmer trainers live in proximity to the farmer trainees.
Our first task in implementing a f2f training program was to identify lead farmers for
each EA in our sample38. To do this, we let each individual vote for the farmer they thought best
suited to host a local training. Upon completing the baseline interview, the interviewers showed
respondents the list of tomato farmers in their EA (if the respondent could not read, the names
were read aloud) and the farmer privately placed their vote with the restriction that they could
not vote for themselves. By allowing respondents to select their lead farmers, we likely obtain
selections that are more representative of the farmer population, which can lead to more effective
distribution of information (BenYishay and Mobarak, 2013). After we tallied the votes in each
38 Because randomization took place after the baseline interview, both the treatment and control group EAs selected lead farmers.
148
EA, our survey supervisor vetted each of the leading vote recipients to confirm their desire to be
a lead farmer and their ability to complete the required tasks39.
After identifying lead farmers and randomly selecting EAs to receive information, the 16
treatment group lead farmers were invited to a two-day training in the nearby town of Mkushi.
The researcher along with representatives from the Ministry of Agriculture and Livestock (MAL)
hosted the lead farmers in a MAL-operated training facility complete with dorms, a dining room,
and a classroom. Meals and lodging were provided for the duration of the training and lead
farmers received a cash stipend for the opportunity cost of their time ($4 per day40 for three
days), a two-way travel reimbursement ($4), cash to serve a chicken meal to the attendees of
their local training ($12), pesticide samples to demonstrate toxicity labels, and protective gear
(gloves, masks, and boots) to demonstrate PPE use. We implemented knowledge assessments
before and after the training program to ensure trainer comprehension of the content.
At the lead farmer training, we gave lead farmers a list of all the tomato growers in their
EAs and tasked them with training each of them. Asking lead farmers to target a pre-specified
list of people is a small departure from the standard f2f training protocol which typically gives
lead farmers a target number of people to train, but does not specify who those people should be.
This targeting protocol could lead to lower estimated treatment effects relative to the
conventional set-up in two ways. First, allowing a lead farmer to select their own trainees would
more likely ensure that the trainee and trainer have an established relationship and may lead to
increased weight on the new information and a larger knowledge increase. Second, attendance
would likely be higher if the lead farmer had the flexibility to invite whomever they wanted, in
part because they would most likely invite farmers with whom they have previous relationships.
39 In every case, the leading vote recipient was cleared to act as the lead farmer. 40 For comparison, the market wage rate was $2 per day.

149
Within one week of the lead farmer training, local trainings were conducted, and two
weeks after the lead farmer training, we brought the lead farmers back to the central training
facility for a one-day meeting to discuss the challenges and successes of the program. This
follow-up meeting also served as a strong incentive for lead farmers to complete the local
trainings in a timely manner and to reach as many farmers in their EAs as possible. We again
paid for housing and meals and compensated the farmers for their transport ($5) and time ($4 per
day for two days – one day at the training facility and one day hosting their local training). At
this follow-up meeting we gave lead farmers materials for the letter portion of the information
intervention.
In addition to the training, informative letters were also distributed. The letters served
two main purposes. First, they reinforced the training content and served as an informational
reminder for the farmers that attended the local trainings. Second, we correctly anticipated that
many treatment group farmers would not attend the local trainings, so the letters were an attempt
to reach a larger share of the treatment group with pesticide safety information (compliance
information is presented and discussed in section 3.7.1). We considered using mobile phone
Short Message Service (SMS) – a more contemporary method – to reach these farmers, but,
while a large share of our sample (399 of 488 farmers) had access to mobile devices, they were
not a reliable way to reach farmers with detailed information41. The informal letter system was a
more appropriate alternative. Informal letters, or “bush notes” as they are locally called, reach
their intended recipients through a network of people as they move through the rural areas in
their daily lives. They typically change hands several times, often through the school, utilizing
pupils from the surrounding area to act as couriers. Letters transferred through these informal
41 Further attempts at follow-up discussions after the endline survey largely failed to reach farmers through mobile phones, thus confirming our choice of using letters as the appropriate technology.

150
networks are given a high degree of importance both in transit and upon receipt, and therefore
letters are both more likely to reach recipients than SMS and more likely to be impactful when
they are received. Only about half of our sample was literate, though the illiterate farmers were
unlikely to discard the notes given the relative rarity of receiving a letter. They likely had the
letter read to them by a family member or neighbor.
The letters had two components. The first was a one-page, two-sided, color print out of
the training content in the local language. We also included the same printout in English (Figure
3A.1 in the appendix). The second component was a personalized note written to each local
farmer from the lead farmer. In the note, we asked the lead farmers to (i) begin with a brief and
personal greeting, (ii) ask the recipient to carefully consider the information within, and (iii)
briefly summarize key training points, specifically, that (i) WHO class U pesticides are much
less toxic than class Ib pesticides, (ii) protective equipment is important to their safety when
working with pesticides, and (iii) a high pesticide price does not imply a more effective product.
The two pieces were placed in a single envelope, sealed, addressed, and sent.
3.6 Empirical strategy
The empirical strategy is to use the random assignment to the treatment group to identify
the effect of information on farmer knowledge. We estimate intention-to-treat (ITT) effects that
compare knowledge outcomes between the control farmers and the farmers randomly assigned to
receive treatment across survey rounds:
(3) �K3� = LM + LN��sP + LbJO)P3 + L����sP ∗ JO)P3� + VX��g3 + ∑ ^��K�� + �K�
where �K3� is the knowledge outcome variable for person i in EA j at time t, ��sP is an indicator
variable for the endline survey, JO)P3 is a treatment group indicator variable equal to one if the
151
farmer was assigned to receive information, VX��g3 is a block fixed effect, and �K� are a set of k
covariates including (i) the farmer’s age, (ii) the farmer’s sex, (iii) an income proxy variable
defined as the first principal component of 12 assets ownership variables, (iv) an indicator for
business income, and (v) the number of horticultural advice sources. Lastly, �K� is an i.i.d. error
term that we assume to be correlated within EAs but uncorrelated across EAs.
The estimator L� will show the ITT average effects of the training on the farmer
knowledge outcome. Note that actual receipt of treatment is a choice and is therefore non-
random and potentially endogenous, so we deliberately do not consider whether a farmer actually
received information in our estimations. As is common in ITT estimations, we estimate linear
projection models (LPM) for our knowledge outcome variables. LPM provides a solid
approximation of the mean differences (Wooldridge, 2010). We also estimate the mean-
difference ITT effects of training on the knowledge assessments conducted at the endline only.
In effect, the ��sP and ��sP ∗ JO)P3 terms in (3) drop from estimation and Lb shows the ITT
effects of the training.
The conceptual model shows how knowledge change is a function of the individual’s
ability to aggregate information as well as the relative weights an individual places on new
information and prior knowledge. Farmers with more education or more experience may be
better able convert the information received through the training into knowledge. Conversely,
farmers with more knowledge or experience may place a higher weight on their prior knowledge
than on new information. Therefore, we also explore treatment effect heterogeneity based on
farmer education and farmer experience with tomatoes with the following specification:

152
(4)
�K3� = LM + LN��sP + LbJO)P3 + L����sP ∗ JO)P3� + L�o�!OxP)K
+ L�(o�!OxP)K ∗ ��sP) + L��o�!OxP)K ∗ JO)P3�+ L��o�!OxP)K ∗ ��sP ∗ JO)P3� + VX��g3 + � ^��K�
�+ �K�
where o�!OxP) is (i) an education indicator variable equal to one if the farmer completed
grade 7 in the first estimation, and (ii) an indicator variable equal to one if the farmer had greater
than 6 years of experience (the sample median) with tomato in the past 10 years in the second
estimation. There are several estimators of interest in (4); L� is the ITT difference in difference
(DiD) effect for farmers with o�!OxP) = 0 (either low education farmers or low experience),
L� is the level of effect of o�!OxP) for the control group at the baseline, L� is the time trend in
knowledge for farmers with o�!OxP) = 1 (either high education and highly experienced
control group farmers), and L� is heterogeneous ITT effect across o�!OxP). Again, we
estimate a version of (4) for endline knowledge assessments only where ��sP and all it’s
interaction terms drop from estimation.
3.6.1 Outcome variables
Using our detailed knowledge assessments, we construct three groups of outcome
variables. The first is a total knowledge index which we define as the sum of all correct
responses to the full set of knowledge assessment questions. Given that our endline survey
obtained responses to four more questions than our baseline survey, we construct two versions of
this index for the endline data. The first uses the 18 questions asked at both the baseline and

153
endline to facilitate across time comparisons, and the second uses all 22 questions asked at the
endline and is not used together with the baseline data in estimation42.
The second set of outcome variables provides more detail by breaking the total
knowledge index into four component knowledge indices for each knowledge assessment
(shown in Table 3.1); namely, a toxicity risk index, an exposure risk index, a bollworm pesticide
controls index, and a nematicide controls index. The third and final set of outcome variables
provides even more detail and simply treats each question as an individual outcome. This allows
us to test the impacts of training on individual questions to see where information had the
greatest effects.
3.6.2 Multiple hypothesis tests
With the second and third set of knowledge outcome variables, we are testing the impacts
of the training program on multiple outcomes. By doing so, we increase the probability of
identifying a statistically significant treatment effect by chance when no true treatment effect
exists. This is the multiple hypothesis test problem, and there are two general approaches to
solving it (Anderson, 2008). The first is to combine several outcome variables into a single
composite outcome and conduct a single test, thus avoiding misleading inference from multiple
tests. The KAP literature typically employs this technique, and we do so with our total
knowledge index. This method, however, loses details on where the treatment greater or lesser
effects. In our setting, it is interesting, for example, to determine which health risk knowledge
category the training was more successful in changing, toxicity or exposure. Answering these
42 When we estimate (1) and (2) with the endline data only, the ��sP� variable and all its interactions drop from the model, but otherwise the specifications are the same. The result is an ITT mean difference estimation with data from only one time period (the endline).

154
types of questions requires another solution to the multiple hypothesis testing problem; adjusting
the p-values to reflect the number of tests conducted.
The literature provides several adjustment techniques for multiple hypothesis tests (for a
summary of several methods see Newson, 2003). This study follows recent policy evaluation
literature (Banerjee et al., 2015, Ksoll et al., 2016) by using an improved false discovery rate
(FDR) control process from Benjamini et al. (2006) and demonstrated by Anderson (2008). The
FDR control process adjusts for the expected share of rejected tests that are false rejections, i.e.,
type I errors (Anderson, 2008). Using notation from Ksoll et al. (2016), the sharpened process
tests the inequality �K < (x QM)⁄ ∗ ^/(1 + ^), where �K is the p-value from test x after the tests
are ordered from lowest to highest �, Q is the number of tests performed, QM is the number of
rejected tests at significance level ^/(1 + ^), and α is the accepted probability of type I error.
By systematically iterating the process for α-levels starting at 1 and moving towards 0, we
ultimately obtain sharpened q-values which can be interpreted for inference in the same way a p-
value would. Note that this process can reward significant results, and, in some cases, report q-
values that are smaller than the original p-values. The opposite is also true; if a small portion of
the tests are significant, the q-values can be much greater than the original p-values.
3.7 Results
3.7.1 Treatment compliance
Although we randomly assigned farmers at the EA level to receive pesticide safety
information, actual receipt of information was not random: lead farmers made choices of whom
to invite to the trainings (though all farmers were told to expect a training, and lead farmers were
instructed to invite all the listed tomato farmers in their EA), and village farmers made decisions

155
of whether to attend the training. Figure 3.1 shows the treatment design and compliance with
each type of information.
Approximately 78% of the farmers assigned to the treatment group received information
through the intervention, though full compliance was low; only 28% of the treatment group both
attended a training and received a letter. The letter reached a larger share of treatment group
farmers (64%) than the training (42%), likely due to the lower letter costs for both the lead
farmers to send and the village farmers to receive. We do not know the share of letters that were
lost in transit, but we do know that not all the letters were sent out and we suspect that the
majority of farmers that did not receive a letter were never sent one by the lead farmer. We also
do not know the share of farmers that were made aware of the local training time and location,
but still chose not to attend. Thus, the low share of farmers that attended a training might reflect
the lead farmer’s failure to invite village farmers or the village farmer’s decision not to attend.
Figure 3.1: Sample breakdown of treatment assignment and information types received
Percentages are of the full sample.
3.7.2 Correlates of treatment type received
Unknown social connections and unobservable health preferences likely impact each side
of training attendance, but it is still informative to analyze the correlates of each type of

156
information received to explore possible differences in compliance across farmer characteristics.
Table 3.2 presents the correlates of each type of information received for the treatment group.
Attending a training has a greater effort and time cost (about half a day inclusive of travel time to
the local training site) than receiving a letter, so we might expect farmers with a higher
opportunity cost of time to be less likely to attend the training. We try to capture a farmer’s
opportunity cost of time with indicator variables for participating in a small business or working
for a wage or salary in the past year, though we find no support for this hypothesis. Overall there
is limited significance in the estimations. The first principle component of asset ownership shows
a positive and significant relationship to attending the training, possibly because wealthier
farmers are better connected or because the lead farmers were more likely to invite or
accommodate their wealthier neighbors to the training. Older farmers were more likely to
comply with each type of information.
Table 3.2 also shows correlation estimates of the same set of variables on whether a
farmer had a conversation with a farmer that either attended a training or received a letter.
Farmers with higher education (those that completed grade 7) were more likely to talk to farmers
that received information (significant at the 10% level for three of the four regressions),
suggesting that better educated farmers are either better connected socially, or seek out training
information from other farmers. Interestingly, receiving a letter is significantly related to
conversations with farmers that received both types treatment while attending a training is not.
Farmers that received a letter were 23% more likely to talk to a farmer that attended the training
and 12% more likely to talk to another farmer that received a letter. This could suggest that the
letter led farmers to seek out others with whom they could discuss the information. It could also

157
reflect illiterate farmers seeking out others with whom they could discuss the letter, though we
interpret these results with caution for the above-mentioned selection issues.

158
Table 3.2: Correlates of treatment type received for farmers assigned to treatment group – LPM estimates Treatment compliance Conversations with farmers that received treatment
Dependent variable Training Letter
Both letter and training
Talked to someone else that attended the training
Talked to someone that received a letter
Independent variables (1) (2) (3) (4) (5) (6) (7)
Received letter 0.228*** 0.120**
(0.075) (0.053)
Attended training -0.045 0.028
(0.091) (0.038)
Tomato experience 0.046 -0.021 -0.066 0.071 0.074 0.001 0.005
(0.062) (0.067) (0.052) (0.046) (0.046) (0.063) (0.063) Age 0.007** 0.006*** 0.006*** -0.003 -0.004 -0.001 -0.002
(0.002) (0.002) (0.002) (0.003) (0.003) (0.002) (0.002) Female -0.023 0.101 0.066 0.077 0.053 -0.031 -0.042
(0.078) (0.065) (0.063) (0.101) (0.098) (0.039) (0.043) Asset ownership 1st PC 0.056*** -0.015 0.023 0.013 0.019 0.025* 0.025
(0.016) (0.022) (0.018) (0.025) (0.027) (0.014) (0.016) Dry season tomatoes -0.093 0.116 0.007 -0.020 -0.051 -0.032 -0.044
(0.079) (0.105) (0.084) (0.100) (0.088) (0.069) (0.065) Completed grade 7 0.030 -0.066 -0.003 0.106 0.123* 0.055* 0.062*
(0.046) (0.056) (0.040) (0.063) (0.060) (0.030) (0.034) Salary/wage income 0.000 0.078 -0.005 -0.022 -0.040 0.017 0.008
(0.038) (0.050) (0.040) (0.060) (0.054) (0.041) (0.041) Business income -0.044 0.037 -0.013 0.024 0.013 -0.044 -0.047
(0.076) (0.055) (0.058) (0.071) (0.075) (0.037) (0.038) # of HH members -0.005 0.001 0.006 -0.015 -0.016 -0.010 -0.010
(0.013) (0.011) (0.013) (0.015) (0.015) (0.008) (0.008) Total land area (ha) -0.009 0.012 0.007 0.014 0.011 0.001 0.000
(0.010) (0.014) (0.010) (0.011) (0.013) (0.010) (0.010) Constant -0.046 0.419*** -0.253** 0.286* (0.188) (0.101) 0.052
(0.110) (0.130) (0.107) (0.142) (0.153) (0.073) (0.059)
N 246 246 246 246 246 246 246 R2 0.38 0.252 0.333 0.216 0.254 0.228 0.257
Cluster robust standard errors at the EA level in parentheses. Significance levels: *** p<0.01, ** p<0.05, * p<0.1. Block fixed effects included in estimations.
3.7.3 Baseline pesticide knowledge
Table 3.3 presents knowledge results for each of our baseline knowledge outcome
variables and explores differences in baseline knowledge by treatment assignment, education,
and experience. First, we discuss overall observations from the sample means and we follow by
discussing important differences across the three tested parameters. Overall pesticide knowledge
is low; farmers correctly answered an average of 7.8 questions out of a possible 18. Farmers
scored much higher on the true/false knowledge assessments (toxicity and exposure risk

159
questions) than on the open-ended questions, likely because simply guessing on the true/false
questions would yield a correct response 50% of the time.
Table 3.3: Baseline knowledge means and differences by treatment assignment, education, and tomato experience
Treatment vs Control Grade7 vs No Grade7
More experience vs less experience
Assessment Label Sample mean Difference Std Err Difference Std Err Difference Std Err
N 488 Total knowledge index (max=18)
7.826 -0.116 0.426 0.063 0.202 0.873*** 0.168
Toxicity Risk
Toxicity index (max=5)
2.332 0.006 0.109 0.031 0.105 0.134 0.095
T1 0.514 0.02 0.034 0.015 0.045 0.067* 0.039 T2 0.430 0.018 0.044 -0.002 0.057 0.079* 0.040 T3 0.389 0.018 0.047 0.048 0.042 -0.016 0.043 T4 0.645 -0.099 0.124 -0.011 0.041 -0.001 0.043 T5 0.352 0.002 0.068 -0.020 0.047 0.005 0.043
Exposure risk
Exposure index (max=5)
3.689 -0.003 0.203 -0.099 0.124 0.230* 0.115
E1 0.779 -0.054 0.054 -0.118*** 0.040 0.034 0.039 E2 0.557 0.048 0.057 0.039 0.052 0.01 0.056 E3 0.801 -0.001 0.056 0.017 0.041 0.073** 0.034 E4 0.766 0.028 0.057 0.014 0.034 0.041 0.032 E5 0.785 -0.025 0.052 -0.051 0.039 0.072 0.044
Bollworm controls
Bollworm control index (max=4)
1.607 -0.085 0.111 0.001 0.075 0.410*** 0.083
Bw1 0.727 -0.01 0.037 -0.025 0.043 0.082** 0.036 Bw2 0.488 -0.041 0.056 -0.053 0.039 0.192*** 0.048 Bw3 0.369 -0.072 0.060 0.065* 0.034 0.113*** 0.039 Bw4 0.023 0.028* 0.014 0.015 0.014 0.023 0.015
Nematode controls
Nematode control index (max=4)
0.199 -0.023 0.037 0.129** 0.055 0.099* 0.049
Nem1 0.090 -0.032 0.052 0.058* 0.033 0.043* 0.025 Nem2 0.031 -0.005 0.019 0.036 0.022 0.007 0.013 Nem3 0.068 -0.005 0.026 0.027 0.022 0.061** 0.027 Nem4 0.010 -0.012 0.008 0.009 0.010 -0.011 0.009
Knowledge assessment categories and labels from Table 3.1. Significance levels: *** p<0.01, ** p<0.05, * p<0.1.
Exploring the individual knowledge question results, we observe many of the same
generalized pictures of farmer pesticide knowledge reported in previous research and discussed
in section 2. The first generalization from the pesticide knowledge literature was that farmers
know that pesticides have negative health effects, and we find this to be true in our sample. Sixty
five percent of farmers correctly knew that some pesticides have long term health risks (T4), and

160
the same share of farmers thought that all pesticides are likely to cause acute illnesses (T5). From
our semi-structured interviews with farmers, we expect that an even greater share of farmers
knew that pesticides are harmful to human health, but we did not ask that question directly.
We also find support for the second generalization from the pesticide knowledge
literature, which was that farmers broadly know that pesticide exposure is harmful and that using
PPE is important. The average exposure risk index score at baseline was 3.7 out of 5 and the
median score was 4. Four of the five exposure risk questions had more than 75% of farmers
answer correctly, suggesting a generally sound understanding of exposure risks. The clear
majority of farmers correctly knew that handling pesticides directly can make you sick (E1, E3,
and E4).
The third generalized knowledge picture in the literature is that farmers have a poor
understanding of toxicity. Table 3.3 adds to that picture as the average toxicity risk score (2.3)
was significantly less than what we would expect if farmers simply guessed for all five
responses. Only 43% of farmers correctly knew that the pesticide toxicity color labels did not
represent the efficacy of the product (T2), and 61% of farmers incorrectly believed that all
pesticides are highly toxic (T3).
Table 3.3 also adds to the fourth generalized knowledge story, which was that pesticide
control properties are not well known. When asked about specific nematicides, less than 10% of
farmers correctly responded for each product. The average score for the nematicide index was
only 0.2 out of 4. Farmers demonstrated slightly higher knowledge of bollworm control products
with the average farmer correctly answering 1.6 of the four bollworm control questions.
Bollpack and Phoskill were the best-known products with 37% and 49% of farmers answering
correctly, respectively.

161
Overall, knowledge is well-balanced over treatment assignment as only three of the 31
tests are significant at the 10% level. Interestingly, the three differences are for the least known
bollworm pesticides. Two of the differences are positive and one is negative, suggesting that one
group does not consistently know more bollworm pesticides than the other. There are
surprisingly few differences between the high education farmers (those that completed grade 7)
and the low education farmers in their baseline knowledge assessments, as only 4 of the 22
comparisons are statistically significant. The better educated group had better knowledge of
nematicide controls as the index difference estimate is positive. There is a highly significant
negative difference correctly answering question E1, suggesting that farmers with higher
education believed that rubber gloves were less important to health on average.
There are more knowledge differences across farmer experience, confirming that a
substantial part of farmer learning comes from their own experiences. More experienced farmers
had significantly higher knowledge in 12 of the 22 comparisons including the overall knowledge
index. Interestingly, experience has a bigger effect on pest control knowledge as 5 of the 8
bollworm control and nematicide control questions are significantly different, but only 3 of the
10 toxicity and exposure questions show significant differences. The pest control questions were
open-ended while to toxicity and exposure questions were true/false, so the observed differences
could reflect the way knowledge was elicited. Specifically, open-ended questions may provide a
better, more accurate view of knowledge.
3.7.4 Training effects on total pesticide knowledge
We now turn our attention to the impacts of the training program on farmer knowledge.
Despite the relatively low full treatment compliance, the training program significantly increased
farmer pesticide knowledge shown in Table 3.4. The overall treatment effect is a 1.2 knowledge
162
index increase (significant at 10% level) in the pooled estimation (column 1) and a 2.1 point
increase (significant at the 1% level) in the endline estimation (column 4). The only significant
heterogenous effect of the training is a 1.1 point increase for farmers with more experience in the
difference in difference estimation. Thus, there is limited evidence that the training was more or
less effective overall by education or experience.
Table 3.4 shows a surprisingly large time trend for the control group. The column 1 Post
coefficient – LNfrom equation (3) – shows an average increase of 1.7 questions correctly
answered at the endline for the control group. This large knowledge increase for the group of
farmers not selected to receive information could result from (i) spillovers of information from
the treatment to the control group, (ii) control group farmers acquiring other information after the
baseline interview, or (iii) control group farmers learning directly from the baseline
questionnaire. Only 4% of the control group farmers directly received information from the
intervention and only 7% had a conversation about either the training or the letter with another
farmer, suggesting that the knowledge increase did not come from spillovers. It is more likely
that control group farmers either learned directly from the questionnaire or acquired new
information apart from the intervention after the baseline interview.
The heterogeneous effects of training by education shine more light on the strong time
trend for the control group. The better educated control group farmers had a significantly larger
increase over time than the less educated group with a 1.3 point increase shown by
Post*Covariate interaction term in column 1 – L� in equation (4). This effect is in addition to the
1.1 point knowledge score increase for the low education control group. We will explore this
effect further with our more detailed knowledge outcome variables, but as argued above, we do
not expect this to be the result of information spillover.

163
Table 3.4: Training program effects on total pesticide knowledge with heterogeneous effects by education and experience
Pooled (baseline and endline) Endline
Covariate for interactions Education Experience Education Experience
(1) (2) (3) (4) (5) (6)
Post 1.711*** 1.125** 1.883***
(0.372) (0.441) (0.364) Treat 0.024 -0.016 -0.194 2.060*** 2.331*** 1.552**
(0.220) (0.265) (0.273) (0.522) (0.547) (0.569)
Post*Treat 1.184* 1.558** 1.210*
(0.586) (0.643) (0.620) Covariate
-0.085 0.419* 1.326*** -0.401
(0.283) (0.228) (0.461) (0.313)
Post*Covariate 1.337*** -0.365
(0.480) (0.358) Covariate*Treat -0.030 0.458 -0.723 1.073*
(0.394) (0.353) (0.543) (0.536)
Post*Treat*Covariate -0.726 -0.053
(0.573) (0.664) N 976 976 976 488 488 488
R2 0.304 0.315 0.307 0.265 0.268 0.271
Control mean score 12.2 12.2 12.2 14.6 14.6 14.6
Cluster robust standard errors at the EA level in parentheses. Significance levels: *** p<0.01, ** p<0.05, * p<0.1. Block fixed effects and covariate controls included in estimations, but excluded from table.
3.7.5 Training effects on toxicity knowledge
We now explore the effects of the training program on the different knowledge
components listed in Table 3.3. Table 3.5 shows the pooled DiD estimates of training effects on
the individual index scores (columns 1, 4, 7, and 10) as well as the heterogeneous effect
estimates by education (columns 2, 5, 8, and 11) and by experience (columns 3, 6, 9, and 12).
The sharpened q-values from the FDR multiple hypothesis test adjustments represent corrections
for the family of four indices used as outcome variables. Table 3.6 shows the endline estimates
of training effects on three knowledge assessments captured only at the endline (columns 1, 4,
and 7) along with heterogeneous effects by education (columns 2, 5, and 8) and experience
(columns 3, 6, and 9). The q-values for the endline assessments represent adjustments for the
family of 22 individual knowledge questions asked at the endline.

164
One of the primary training focal points was toxicity. Columns 1, 2, and 3 in Table 3.5
present the pooled sample effects of the training on the toxicity knowledge index composed of
the five true/false toxicity knowledge questions. We observe no significant treatment effects on
the index, nor do we see any ITT effect differences by education. The more experienced farmers
show a significantly larger effect from the training at the 10% level (shown by the
Post*Treat*Covariate variable), suggesting that the treatment was more effective for more
experienced farmers. However, the sharpened q-value of 0.563 is highly insignificant. The
toxicity index shows a positive and significant time trend for the control group, indicating that
the control group had a better knowledge of toxicity at the endline and the q-value is significant
at the 1% level.
While Table 3.5 shows an insignificant overall training effect on the toxicity knowledge
index, Table 3.6 shows strong significant treatment effects on the two toxicity identification
questions asked at endline (columns 1 and 4). Treatment group farmers were significantly more
likely to correctly identify the class U pesticide as low toxicity or not at all harmful, and more
likely to correctly identify the class Ib pesticide as extremely or highly toxic. Both estimates are
significant at the 1% level when adjusted for multiple hypothesis tests, though the effect sizes are
much different. In identifying the class U pesticide, the treatment group effect size is 250% of
the control group mean, while the effect size in identifying the class Ib pesticide is only 13% of
the control group mean. The differences reflect the general perception that all pesticides are
highly toxic, thus information that class U pesticides are relatively less toxic presented a signal
that was much farther than farmers’ priors and there is a larger knowledge increase after the
training. There are no significant effect differences by education for either question, though more
experienced farmers show a larger treatment effect estimate for the class U pesticide, suggesting

165
that more experienced farmers learned more from the training across this question. Somewhat
surprisingly, the level effect of tomato experience shows a negative and significant effect on the
class U identification question, suggesting that more experienced farmers without a training were
worse at identifying the toxicity of a class U pesticide. This fits our field observation that farmers
misperceived all pesticides to be highly toxic and that “poison is poison.” The differences in
training effects on toxicity knowledge between the pooled (Table 3.5) and endline (Table 3.6)
likely reflect the fact that the toxicity knowledge index in the pooled estimates is composed
entirely of true/false questions for which random guessing would yield a correct response half of
the time, while the toxicity identification questions were less abstract and required the farmers to
demonstrate their knowledge.

166
Table 3.5: Training effects on knowledge indices - ITT and heterogeneous effects by education and experience
Toxicity index Exposure index Bollworm index Nematode index
Covariate for interactions (none) Education Experience (none) Education Experience (none) Education Experience (none) Education Experience
(1) (2) (3) (4) (5) (6) (7) (8) (9) (10) (11) (12)
Post 0.380*** 0.338** 0.547*** 0.384** 0.169 0.453** 0.376*** 0.176 0.328** 0.570*** 0.441*** 0.555***
(0.128) (0.152) (0.145) (0.166) (0.172) (0.220) (0.130) (0.162) (0.152) (0.162) (0.147) (0.155)
{0.008} {0.054} {0.003} {0.010} {0.200} {0.025} {0.008} {0.200} {0.025} {0.005} {0.021} {0.003}
Treat 0.078 0.215** 0.207 0.033 0.003 -0.075 -0.069 -0.154 -0.260* -0.018 -0.080 -0.066
(0.091) (0.103) (0.142) (0.134) (0.147) (0.169) (0.108) (0.122) (0.133) (0.094) (0.102) (0.111)
{1.000} {0.214} {0.309} {1.000} {0.965} {0.495} {1.000} {0.486} {0.309} {1.000} {0.774} {0.495}
Post* Treat 0.173 0.121 -0.051 0.104 0.297 0.252 0.323 0.488** 0.463* 0.584** 0.652** 0.546**
(0.184) (0.187) (0.243) (0.294) (0.288) (0.316) (0.192) (0.224) (0.235) (0.237) (0.253) (0.267)
{0.309} {0.353} {0.719} {0.572} {0.263} {0.404} {0.181} {0.064} {0.132} {0.083} {0.064} {0.132}
Covariate 0.205* 0.257* -0.131 0.053 -0.198* 0.124 0.038 -0.015
(0.117) (0.144) (0.170) (0.154) (0.107) (0.133) (0.111) (0.082)
{0.220} {0.516} {0.426} {1.000} {0.220} {1.000} {0.580} {1.000}
Post*
Covariate 0.096 -0.354** 0.491** -0.146 0.456*** 0.102 0.295** 0.033
(0.216) (0.163) (0.230) (0.226) (0.128) (0.178) (0.134) (0.125)
{0.198} {0.180} {0.043} {1.000} {0.005} {1.000} {0.043} {1.000}
Covariate*
Treat -0.383* -0.272 0.035 0.225 0.183 0.403** 0.135 0.101
(0.220) (0.204) (0.211) (0.225) (0.169) (0.164) (0.136) (0.107)
{0.583} {0.362} {0.778} {0.362} {0.583} {0.087} {0.583} {0.362}
Post*Treat
*Covariate 0.174 0.473* -0.428 -0.311 -0.355* -0.294 -0.117 0.080
(0.295) (0.271) (0.284) (0.372) (0.182) (0.234) (0.226) (0.239)
{0.559} {0.563} {0.142} {0.690} {0.060} {0.563} {0.608} {0.767}
N 976 976 976 976 976 976 976 976 976 976 976 976
R2 0.096 0.101 0.099 0.132 0.139 0.138 0.17 0.176 0.174 0.267 0.27 0.268
Control mean 2.5 2.5 2.5 3.9 3.9 3.9 1.9 1.9 1.9 0.5 0.5 0.5
Cluster robust standard errors at the EA level in parentheses. Sharpened q-values adjusted for four index tests in brackets. Naïve significance levels: *** p<0.01, ** p<0.05, * p<0.1. Block fixed effects and control variables included in estimations but excluded from table.

167
Table 3.6: Effects of training on endline knowledge assessments - ITT and heterogeneous effects by education and experience (endline estimates)
Class U toxicity knowledge (ID1) Class Ib toxicity knowledge (ID2) Price-efficacy knowledge (PE1)
Covariate for interactions Education Experience Education Experience Education Experience
(1) (2) (3) (4) (5) (6) (1) (2) (3)
Treat 0.264*** 0.250*** 0.175*** 0.101*** 0.102*** 0.079** 0.313*** 0.352*** 0.211***
(0.051) (0.055) (0.063) (0.024) (0.035) (0.033) (0.035) (0.050) (0.057)
{0.001} {0.001} {0.061} {0.001} {0.028} {0.122} {0.001} {0.001} {0.022}
Covariate (0.016) -0.136*** 0.071 (0.016) 0.148*** -0.135*
(0.049) (0.048) (0.042) (0.044) (0.043) (0.073)
{0.747} {0.202} {0.441} {1.000} {0.044} {0.392}
Treat*Covariate 0.037 0.188** (0.004) 0.047 (0.102) 0.215**
(0.077) (0.077) (0.057) (0.046) (0.077) (0.103)
{1.000} {0.250} {1.000} {1.000} {1.000} {0.387}
N 488 488 488 488 488 488 488 488 488
R2 0.234 0.235 0.245 0.14 0.14 0.141 0.162 0.164 0.173
Control mean 0.1 0.1 0.1 0.8 0.8 0.8 0.3 0.3 0.3
Cluster robust standard errors at the EA level in parentheses. Sharpened q-values in brackets adjusted for the full set of 22 individual endline questions. Naïve significance levels: *** p<0.01, ** p<0.05, * p<0.1. Block fixed effects and covariates included in estimations.
168
3.7.6 Training effects on exposure knowledge
The second major training focus was pesticide exposure and the benefits of PPE. The
training had no significant overall effects on exposure knowledge shown in column 4 of Table
3.5. There was a significant knowledge increase for the control group farmers with high
education shown by Post*Covariate in column 5 and the effect is significant even when
correcting for multiple hypothesis testing, but the heterogeneous effect of treatment is
insignificantly different from that increase. This suggests that farmers with high education
learned between the baseline and endline surveys. Note that the exposure knowledge index, like
the toxicity knowledge index, is composed of five true/false questions which may not capture
knowledge changes as well as open-ended or demonstrated knowledge assessments might have.
3.7.7 Training effects on price-efficacy knowledge
The third training objective was to break the strong positive price-efficacy perception,
which was only captured by a single question at the endline survey (columns 7, 8, and 9 in Table
3.6). The training successfully achieved that goal. The group of farmers assigned to receive
training were 31% more likely to correctly disagree that higher priced pesticides are always more
effective and the q-value is significant at the 1% level. The training effect is significantly larger
for farmers with more experience (though the q-value is insignificant). As with the identification
the class U pesticide, the more experienced farmers in the control group were significantly less
likely to answer correctly, suggesting that experience alone does not lead to accurate knowledge.
3.7.8 Training effects on bollworm control and nematode control knowledge
The fourth training objective was to acquaint farmers with a subset of pesticides that
control bollworms or nematodes, and the training program met that objective. The overall
average effect of the training on the bollworm knowledge index was a 0.32 point increase (p-

169
value of 0.102, though insignificant after FDR adjustment; shown in column 7 of Table 3.5), and
the overall average effect on the nematode knowledge index was a 0.58 point increase
(significant at the 5% level and at the 10% after FDR adjustment; shown in column 10 of Table
3.5). The larger effect for nematode knowledge reflects a lower prior knowledge and a signal
much different from farmers’ priors. There is a significant time trend for control group farmers in
both indices (significant at the 5% level after FDR adjustment). This again suggests that learning
happened between the baseline and endline surveys. Interestingly, farmers with more education
learned significantly more from the baseline survey (shown by the Post*Covariate estimate in
column 8 and 11) and each effect is significant at the 5% level after FDR adjustment.
These effects can be partly explained by the demand experiments at the baseline. Farmers
made a series of eight or ten pesticide choices from physical choice sets of actual bollworm
pesticides and nematicides. To mirror the market purchase environment, farmers were allowed to
hold each pesticide and read the labels if they so desired. It makes sense then that the higher
education group had higher knowledge of pesticide controls after the baseline interview because
they were more likely able to read the pesticide labels and learn about pest control properties (the
correlation between literacy and completing grade 7 is 0.67). This is an important and
unexpected result that suggests that when farmers have low pesticide knowledge but high
education the simple task of showing farmers different products and allowing them look at and
read the labels can significantly improve their product knowledge.
In summary, the pesticide training and informational letter had significant effects on
overall pesticide knowledge measured by the total pesticide knowledge index. The average effect
of the intervention on knowledge for the entire treatment group (not accounting for whether a
farmer received information) was an increase of 2.1 correct responses in the mean-difference

170
estimation (Table 3.4) which amounts to an average cost of $5 per knowledge question increase
(see Table 3A.3 in the appendix for a detailed cost summary). The modest program costs and
potentially large health and production benefits from pesticide knowledge increases suggest that
f2f trainings may be a cost-effective means of increasing smallholder tomato farmer welfare.
The training program significantly increased farmer knowledge of toxicity measured by
the two endline toxicity identification questions, though the knowledge increase was not
captured by the five true/false toxicity questions. This suggests that capturing knowledge with
more experiential metrics where farmers must demonstrate knowledge rather than simply
respond to a true/false question, for which a guess would yield a correct response 50% of the
time, may provide more detail and better insight into an individual’s true knowledge. We find no
evidence of knowledge improvements in exposure knowledge also measured by five true/false
questions. This effect is likely partly explained by farmers’ high prior knowledge, thus the signal
from new information was not far from recipient priors. The training program succeeded in
breaking the price-efficacy perception as treatment group farmers were less likely to agree that
higher priced pesticides are of higher quality. We also observe knowledge gains in pesticide
control knowledge attributable to the information intervention. Interestingly, the control group
farmers also demonstrated large knowledge gains in the pesticide control categories of questions
likely due to learning from the baseline interviews that asked farmers to make several pesticide
choices in two demand experiments that allowed farmers to interact with pesticides and read
labels, and as a result, the control group farmers with higher education benefited the most from
these experiments. Lastly, heterogeneous effects of the training by farmer experience show that
more experienced farmers had significantly lower prior knowledge of pesticide toxicity and the
relationship between price and pesticide efficacy. Yet, when these farmers received new
171
information – potentially far from their priors – they had significantly greater knowledge
improvements.
3.8 Conclusion
Pesticides are complicated technologies that offer important crop production benefits,
though they also have potentially large health costs. Thus, pesticide choices and behaviors have
important implications for farm profits and health. This is particularly true for vegetable
producers in SSA that face pressure from multiple pests and often apply highly toxic WHO class
Ib pesticides (Snyder et al., 2015). Pesticide choices and behaviors are closely linked to farmer
knowledge, yet previous research provides only a narrow picture of pesticide knowledge. This
paper provides a wider view of pesticide knowledge that captures both health and safety risks
and pest control knowledge. We find pesticide knowledge for Zambian tomato growers to be
consistent with four general trends from pesticide literature in other developing countries.
First, farmers know that pesticides are harmful to their health (Macharia et al., 2013;
Labarta, 2005; Salameh et al., 2004; Van der hoek et al., 1998). In this study, 65% of Zambian
tomato producers incorrectly thought that all pesticides were likely to cause acute harm, and the
same percentage correctly knew that some pesticides have long term health risks. Second,
farmers generally know that use of PPE can reduce their health risks (Mekonnen and Agonifir,
2002; Van der hoek et al., 1998; Macharia et al., 2013; Yuantari et al., 2015). In this study, four
of the five exposure risk questions were correctly answered by more than 75% of farmers. Third,
farmers have poor knowledge of pesticide toxicities (Cachomba et al., 2013; Maumbe, 2001;
Rother, 2008; Ntow et al., 2006). Farmers in this study correctly answered less than half of the
toxicity risk true/false questions at baseline. Fourth, farmers lack detailed knowledge of pesticide

172
control properties (Ngowi, 2003; Ngowi et al., 2007; Dasgupta et al., 2007; Salameh et al.,
2004). Of the five pests we asked about, farmers correctly knew a pesticide to control less than
half on average.
As a result of low farmer knowledge and observations of unsafe pesticide behaviors,
previous research commonly recommends training programs to improve farmer pesticide
knowledge, but few studies directly test the impacts of training on pesticide knowledge. We add
to this literature by using a randomized control trial of a f2f training program and an
informational letter to identify the impacts of information on farmer pesticide knowledge
measured with 22 questions. F2f trainings fall somewhere between high cost face-to-face visits
from extension officers and low-cost, less personal information dissemination methods (Harris et
al., 2013). The modest program costs and significant knowledge gains suggest that f2f training
programs could be a cost-effective way to deliver extension messages of pesticide use, and f2f
trainings and informal letters should be studied further to learn when and how they can be most
effective in improving farmer knowledge.
From ITT estimations of the effect of pesticide training on knowledge, we find a
significant knowledge change from the training, though the effects were uneven across
knowledge categories. The training program successfully increased farmer toxicity risk
knowledge measured by toxicity identification questions, but the effect was not captured by five
true/false questions. Farmers also responded well to information on the relationship between
pesticide price and efficacy and pest control properties. Treatment group farmers were
significantly less likely to hold a positive price-efficacy perception after the training and
demonstrated improved knowledge of pesticide controls. However, exposure knowledge did not
173
significantly increase as a result of the training, likely due to the relatively high baseline
exposure knowledge and limited room for improvement from new information.
We also test heterogeneous training effects by farmer experience and education. Farmers
with more education were not better able to aggregate the training information. The training
program effects for the high education group were mostly similar to the effects of the low
education group. Experience alone does not lead to greater or more accurate knowledge. Control
group farmers with more experience had significantly lower knowledge of class U pesticide
toxicity and the relationship between price and product efficacy. This suggests that information
interventions may be necessary even when farmers have more than 6 years of experience
working with pesticides. The training had larger effects on knowledge for more experienced
farmers. Farmers with more experience showed greater knowledge increases in identifying the
class U pesticide and in breaking the perception that pesticide price is positively correlated with
efficacy.
Lastly, simple interventions to increase farmer familiarity with products could have a
meaningful impact on pest control knowledge, particularly for more educated farmers. We
observe significant knowledge increases for the high education farmers in the control group
likely stemming directly from the baseline interview. After handling and observing certain
pesticides, farmers with high education had higher knowledge of pesticide control properties.
Overall, these results suggest that more training attention should be devoted to pesticide
control properties, pesticide toxicities, and the perceived relationships between pesticide price
and product efficacy. The training caused significant improvements to low prior knowledge in
these categories. Further, our results show simple messages can be effective, especially when
introducing farmers to pesticide products. Lastly, training programs should make efforts to

174
include experienced farmers as experience alone does not always lead to more accurate
knowledge.

175
APPENDIX

176
3A.1 Pesticide training summary letter Figure 3A.1: Pesticide training summary letter print-out (page 1)

177
Figure 3A.2: Pesticide training summary letter (page 2)

178
3A.2 Research activities timeline (2015) April – June: Conducted informal farmer interviews and focus group meetings; designed the questionnaire; enumerated tomato growers in the study area; pretested the questionnaire; trained enumerators July: Collected baseline data August: Implemented training program October: Collected endline data November: Implemented training program for the control group
3A.3 Trusted information sources
Table 3A.1 shows that Zambian horticulture producers have far greater trust in their
fellow farmers (both neighbors and family members) than formal extension agents (NGO and
government).
Table 3A.1: Most trusted sources of information for horticulture producers in Zambia
Source of information Share of farmers trusting each source
N=243
Neighbor/Farmer 62%
Family 61%
NGO 22%
Government 15%
Other 8%
Radio 5% Dealer/Retailer 5%
Note: Each household listed 2 most trusted sources, so shares do not sum to one. Source: Author's calculations from Indaba Agricultural Policy Research Institute/University of Zambia Baseline Study on the Environmental and Human Health Implications of Horticultural Production for the Lusaka Market

179
3A.4 Sample balance tests
Table 3A.2 shows that the treatment group and the control group are statistically similar
across 13 of 16 variables tested. The difference column shows the treatment group mean minus
the control group mean.
Table 3A.2: Sample balance tests of treatment assignment over key variables (N=488)
Variable Mean Std Dev
Diff. Balance p-value
HH size 5.705 2.477 0.087 0.699 # of HH members older than 15 3.008 1.405 0.082 0.521
Farmer Age 38.9 12.5 1.194 0.291 Completed grade 7 (d) 0.391 0.489 -0.092** 0.036
Asset ownership 1st principle component -0.138 1.717 -0.224 0.149 Salary or wage employment (d) 0.346 0.476 -0.018 0.677
Business Income (d) 0.512 0.500 -0.164*** 0.001 Tomato experience (>median; d) 0.473 0.500 0.005 0.920
Total Area Owned (ha) 3.953 2.958 -0.187 0.486 Total Tomato Area (ha) 0.276 0.207 0.016 0.403
Grows Dry Season Tomatoes (d) 1.434 0.496 -0.015 0.733 Baseline exposure knowledge index score 3.689 1.191 -0.003 0.977
Baseline toxicity knowledge index score 2.332 1.076 0.044 0.654 # of acute symptoms experienced 2.350 1.773 -0.231 0.15
# of clinic visits from acute symptoms 0.418 0.940 -0.048 0.575 # of Horticulture advice sources 3.004 1.351 0.426*** 0.001
Differences are treatment group minus control group. (d) denotes dummy variable. Significance levels; *<0.10, **<0.05, ***<0.01.

180
3A.5 Training program costs
Table 3A.3 presents a detailed cost breakdown of the information intervention. The total
cost was $2,601 which amounts to only $163 per lead farmer trained, $23 per local farmer that
attended a training, and $16 per farmer that received a letter.
Table 3A.3: Lead farmer training program total cost breakdown and costs per farmer reached (values are in USD)
Item Cost
Cost per lead
farmer
Cost per local farmer that attended a training
Cost per local farmer that received
a letter
2-day lead farmer training
Farmer listing $77 $5 $1 $0
Facilitation and planning $518 $32 $5 $3
Translation services $39 $2 $0 $0
Printing and supplies $63 $4 $1 $0
Lead farmer cash allocation1 $450 $28 $4 $3
Accommodation, training room rental, and meals $460 $29 $4 $3
Sample pesticides $144 $9 $1 $1
Personal protective equipment $257 $16 $2 $2
sub-total $2,008 $125 $17 $12
Follow-up meeting
Lead farmer cash allocation2 $202 $13 $2 $1
Training room rental and meals $78 $5 $1 $0
Letter materials3 $313 $20 $3 $2
sub-total $593 $37 $5 $4
Total $2,601 $163 $23 $16 1 Includes transport (roundtrip), per diem (3 days), and local training meal stipend. 2 Includes transport (roundtrip), and per diem (1 day). 3 Includes envelopes, paper, and color print-outs. Researcher costs excluded.

181
REFERENCES
182
REFERENCES
Acemoglu, D., Ozdaglar, A., & ParandehGheibi, A. (2010). Spread of (mis) information in social
networks. Games and Economic Behavior, 70(2), 194–227.
Alene, A. D., & Manyong, V. M. (2006). Farmer-to-farmer technology diffusion and yield variation among adopters: the case of improved cowpea in northern Nigeria. Agricultural
Economics, 35(2), 203–211.
Amudavi, D. M., Khan, Z. R., Wanyama, J. M., Midega, C. A., Pittchar, J., Hassanali, A., & Pickett, J. A. (2009). Evaluation of farmers’ field days as a dissemination tool for push-pull technology in Western Kenya. Crop Protection, 28(3), 225–235.
Anderson, M. L. (2012). Multiple inference and gender differences in the effects of early intervention: A reevaluation of the Abecedarian, Perry Preschool, and Early Training Projects. Journal of the American Statistical Association. Retrieved from http://amstat.tandfonline.com/doi/abs/10.1198/016214508000000841
Banerjee, A., Duflo, E., Goldberg, N., Karlan, D., Osei, R., Parienté, W., Udry, C. (2015). A multifaceted program causes lasting progress for the very poor: Evidence from six countries. Science, 348(6236), 1260799.
Banteyerga, H. (2011). Ethiopia’s health extension program: improving health through community involvement. MEDICC Review, 13(3), 46–49.
BenYishay, A., & Mobarak, A. M. (2013). Communicating with farmers through social networks. Yale University Economic Growth Center Discussion Paper, (1030). Retrieved from http://papers.ssrn.com/sol3/papers.cfm?abstract_id=2315229
Birkhaeuser, D., Evenson, R. E., & Feder, G. (1991). The economic impact of agricultural extension: A review. Economic Development and Cultural Change, 39(3), 607–650.
Bwalya, S. M. (2010). Environmental Council of Zambia. Retrieved from http://new.unep.org/chemicalsandwaste/Portals/9/Mainstreaming/smc%20final%20report%20Cost%20Benefit%20Kafue%20Basin.doc
Cachomba, S., Cairns, J., Tschirley, D., & Snyder, J. (2013). Risk Perception and Behavior in Pesticide Use by the Horticultural Producers of. Retrieved from http://citeseerx.ist.psu.edu/viewdoc/summary?doi=10.1.1.644.8727
Chandrasekhar, A. G., Larreguy, H., & Xandri, J. P. (2012). Testing models of social learning on networks: Evidence from a framed field experiment. Work. Pap., Mass. Inst. Technol.,
Cambridge, MA. Retrieved from http://faculty.bus.lsu.edu/sarangi/paper%20files/CLX_%20Arun.pdf
183
Conley, T. G., & Udry, C. R. (2010). Learning about a New Technology: Pineapple in Ghana. The American Economic Review, 100(1), 35–69.
Corno, L. (2014). Learning (or not) in health-seeking behavior: evidence from rural Tanzania. Economic Development and Cultural Change, 63(1), 27–72.
Crissman, C. C., Cole, D. C., & Carpio, F. (1994). Pesticide use and farm worker health in Ecuadorian potato production. American Journal of Agricultural Economics, 76(3), 593–597.
Dasgupta, S., Meisner, C., & Huq, M. (2007). A pinch or a pint? Evidence of pesticide overuse in Bangladesh. Journal of Agricultural Economics, 58(1), 91–114.
DeGroot, M. H. (1974). Reaching a consensus. Journal of the American Statistical Association, 69(345), 118–121.
Goeb, J., Cairns Smart, J., Snyder, J., and Tschirley, D. (2015). Information, Pesticide Safety Behaviors, and Perceived Pesticide Health Risks in Maputo. Agricultural Research Institute of Mozambique (IIAM). Chapter 6. Special Issue Collection of Short Papers Focused on Horticultural Production in the Areas Supplying Maputo. http://fsg.afre.msu.edu/Mozambique/survey/Special%20Issue%20Collection%20English%20Version.pdf
Gorell, J. M., Johnson, C. C., Rybicki, B. A., Peterson, E. L., & Richardson, R. J. (1998). The risk of Parkinson’s disease with exposure to pesticides, farming, well water, and rural living. Neurology, 50(5), 1346–1350.
Grossman, M. (1972). On the Concept of Health Capital and the Demand for Health. Journal of
Political Economy, 80(2), 223–255.
Hanna, R., Mullainathan, S., & Schwartzstein, J. (2014). Learning through noticing: Theory and evidence from a field experiment. The Quarterly Journal of Economics, 129(3), 1311–1353.
Harris, L. M., Norton, G. W., Karim, A. R., Alwang, J., & Taylor, D. B. (2013). Bridging the information gap with cost-effective dissemination strategies: The case of integrated pest management in Bangladesh. Journal of Agricultural and Applied Economics, 45(4), 639.
Hashemi, S. M., Hosseini, S. M., & Hashemi, M. K. (2012). Farmers’ perceptions of safe use of pesticides: determinants and training needs. International Archives of Occupational and
Environmental Health, 85(1), 57–66. https://doi.org/10.1007/s00420-011-0641-8
Hichaambwa, M., Chamberlin, J., Kabwe, S., & others. (2015). Is Smallholder Horticulture the Unfunded Poverty Reduction Option in Zambia? A Comparative Assessment of Welfare Effects of Participation in Horticultural and Maize Markets.
Ksoll, C., Lilleør, H. B., Lønborg, J. H., & Rasmussen, O. D. (2016). Impact of Village Savings and Loan Associations: Evidence from a cluster randomized trial. Journal of Development
Economics, 120, 70–85.
184
Labarta-Chávarri, R. A. (2005). Essays on the economic evaluation of integrated pest management extension in Nicaragua. Dissertation. Michigan State University.
Lichtenberg, E., & Zilberman, D. (1986). The econometrics of damage control: why specification matters. American Journal of Agricultural Economics, 68(2), 261–273.
Macharia, I., Mithöfer, D., & Waibel, H. (2013). Pesticide handling practices by vegetable farmer in Kenya. Environment, Development and Sustainability, 15(4), 887–902.
Maumbe, B. M. (2001). Essays on the economics of cotton production in Zimbabwe: policy implications for technology adoption, farmer health and market liberalization. PhD Dissertation. Michigan State University.
Maumbe, B. M., & Swinton, S. M. (2003). Hidden health costs of pesticide use in Zimbabwe’s smallholder cotton growers. Social Science & Medicine, 57(9), 1559–1571.
Mekonnen, Y., & Agonafir, T. (2002). Pesticide sprayers’ knowledge, attitude and practice of pesticide use on agricultural farms of Ethiopia. Occupational Medicine, 52(6), 311–315.
Mobius, M., Phan, T., & Szeidl, A. (2015). Treasure hunt: Social learning in the field. National Bureau of Economic Research. Retrieved from http://www.nber.org/papers/w21014
Newson, R., Team, A. S., & others. (2003). Multiple-test procedures and smile plots. Stata J, 3(2), 109–132.
Ngowi, A. V. F. (2003). A study of farmers’ knowledge, attitude and experience in the use of pesticides in coffee farming. African Newsletter on Occupational Health and Safety, 13(3), 62–64.
Ngowi, A. V. F., Mbise, T. J., Ijani, A. S. M., London, L., & Ajayi, O. C. (2007). Smallholder vegetable farmers in Northern Tanzania: Pesticides use practices, perceptions, cost and health effects. Crop Protection, 26(11), 1617–1624. https://doi.org/10.1016/j.cropro.2007.01.008
Ntow, W. J., Gijzen, H. J., Kelderman, P., & Drechsel, P. (2006). Farmer perceptions and pesticide use practices in vegetable production in Ghana. Pest Management Science, 62(4), 356–365. https://doi.org/10.1002/ps.1178
Obopile, M., Munthali, D. C., & Matilo, B. (2008). Farmers’ knowledge, perceptions and management of vegetable pests and diseases in Botswana. Crop Protection, 27(8), 1220–1224.
Okello, J. J., & Swinton, S. M. (2010). From circle of poison to circle of virtue: Pesticides, export standards and Kenya’s green bean farmers. Journal of Agricultural Economics, 61(2), 209–224.

185
Oluwole, O., & Cheke, R. A. (2009). Health and environmental impacts of pesticide use practices: a case study of farmers in Ekiti State, Nigeria. International Journal of
Agricultural Sustainability, 7(3), 153–163.
Pingali, P. L., Marquez, C. B., & Palis, F. G. (1994). Pesticides and Philippine rice farmer health: a medical and economic analysis. American Journal of Agricultural Economics, 76(3), 587–592.
Pitt, M. M., & Rosenzweig, M. R. (1984). Agricultural prices, food consumption, and the health and productivity of Indonesian farmers. In Singh, I., Squire, L., & Strauss, J. (Eds.), Agricultural household models: Extensions, applications, and policy (pp. 153-82). Baltimore, MD: The Johns Hopkins University Press.
Rother, H.-A. (2008). South African farm workers’ interpretation of risk assessment data expressed as pictograms on pesticide labels. Environmental Research, 108(3), 419–427.
Salameh, P. R., Baldi, I., Brochard, P., & Saleh, B. A. (2004). Pesticides in Lebanon: a knowledge, attitude, and practice study. Environmental Research, 94(1), 1–6.
Savage, E. P., Keefe, T. J., Mounce, L. M., Heaton, R. K., Lewis, J. A., & Burcar, P. J. (1988). Chronic neurological sequelae of acute organophosphate pesticide poisoning. Archives of
Environmental Health: An International Journal, 43(1), 38–45.
Sheahan, M., Barrett, C. B., & Goldvale, C. (2016). Human health and pesticide use in Sub-Saharan Africa. Retrieved from http://barrett.dyson.cornell.edu/files/papers/Sheahan%20Barrett%20Goldvale%20-%20SSA%20pesticide%20and%20human%20health%20paper%20-%20Sept.pdf
Sibanda, T., Dobson, H. M., Cooper, J. F., Manyangarirwa, W., & Chiimba, W. (2000). Pest management challenges for smallholder vegetable farmers in Zimbabwe. Crop Protection, 19(8), 807–815.
Snyder, J., Smart, J., Goeb, J., Tschirley, D., & others. (2015). Pesticide use in Sub-Saharan
Africa: Estimates, Projections, and Implications in the Context of Food System
Transformation. Michigan State University, Department of Agricultural, Food, and Resource Economics. Retrieved from https://ideas.repec.org/p/ags/midamp/230980.html
Tijani, A. A. (2006). Pesticide use practices and safety issues: The case of Cocoa farmers in Ondo State, Nigeria. J Hum Ecol, 19(3), 183–90.
Van Der Hoek, W., Konradsen, F., Athukorala, K., & Wanigadewa, T. (1998). Pesticide poisoning: a major health problem in Sri Lanka. Social Science & Medicine, 46(4), 495–504.
Viscusi, W. K. (1998). Rational Risk Policy: The 1996 Arne Ryde Memorial Lectures (Vol. 4). Oxford University Press.

186
Williamson, S., Ball, A., & Pretty, J. (2008). Trends in pesticide use and drivers for safer pest management in four African countries. Crop Protection, 27(10), 1327–1334.
Wooldridge, J. M. (2010). Econometric analysis of cross section and panel data. MIT press.
World Health Organization. (2010). The WHO recommended classification of pesticides by hazard and guidelines to classification 2009. Retrieved from http://apps.who.int/iris/handle/10665/44271
Yuantari, M. G., Van Gestel, C. A., Van Straalen, N. M., Widianarko, B., Sunoko, H. R., & Shobib, M. N. (2015). Knowledge, attitude, and practice of Indonesian farmers regarding the use of personal protective equipment against pesticide exposure. Environmental
Monitoring and Assessment, 187(3), 1–7.

187
CONCLUSION
Pesticides are a vital input in smallholder horticultural production and their use is
ubiquitous among tomato growers in rural Zambia. However, pesticides are complicated,
knowledge-intensive technologies and farmer choices about use of pesticides and personal
protective equipment (PPE) have important implications for health and profits from farming.
Previous research documents both the use of highly toxic pesticides (Ntow et al., 2006) and low
use of PPE (Matthews et al., 2003) for smallholder farmers in sub-Saharan Africa (SSA), which
together lead to high incidence of acute pesticide illness (Maumbe and Swinton, 2003; Sheahan
et al., 2016).
This research confirms each of these observations. A common recommendation from the
literature is to target pesticide users with information interventions to improve their health
outcomes (see for example Ntow et al., 2006). This dissertation used a randomized control trial
(RCT) to test whether an information intervention is an effective policy tool to (i) increase
farmer PPE demand, (ii) change farmer pesticide choices, and (iii) improve farmer knowledge.
Despite some strong knowledge increases directly attributable to the intervention, we find in
Essay 1 that information had an insignificant effect on PPE demand elicited using Becker-
DeGroot-Marschak (BDM) mechanisms. We also find that farmers were generally
knowledgeable of PPE health benefits prior to the intervention. Thus, the insignificant effects
could be partly attributed to the fact that new information could only have a small effect on
(already high) knowledge. We also test for possible risk substitution effects stemming from
increased knowledge of relative toxicity risks across pesticides, and find only limited evidence of
such an effect. Overall, for farmers similar to those in rural Zambia, information interventions

188
are unlikely to improve PPE demand. Lastly, we found that demand is highly sensitive to price.
Thus, relatively small subsidies could have large effects in PPE take-up and farmer safety. We
recommend that future research explore what other constraints might, if relieved, enhance
adoption of PPE.
Essay 2 shows that the information intervention had significant effects on farmer
pesticide choices measured with choice experiments. Treatment group farmers were significantly
more likely than those in a control group to select less toxic pesticides after the information
intervention. This result has important implications for farmer health considering the drastically
lower health risks from class U pesticides relative to class Ib pesticides. We also found that prior
to receiving price-efficacy information, farmers held a positive price-efficacy perception for
pesticides, which they also demonstrated in their choices. The information intervention
effectively broke that perception, with the result that price had a negative effect on choice
probability at the endline for the treatment group.
In the last essay, we describe large gaps in knowledge about relative toxicity across
pesticides, as well as gaps in knowledge of pesticide control properties. The farmer-to-farmer
training program and informational letter significantly improved farmer knowledge in both areas;
however, the intervention had insignificant effects on farmer knowledge of exposure. We also
found meaningful differences in response to information across farmer education as farmers with
lower education levels benefited more from the intervention. Overall, the farmer-to-farmer
training program and letter proved to be a cost-effective way to improve farmer pesticide
knowledge, though more research is needed to identify where and how these types of
intervention can be most effective.
189
Altogether, this dissertation supports two key policy recommendations for improving
farmer pesticide safety. First, small price subsidies may have a larger impact on use of PPE than
information interventions for farmers similar to those in rural Zambia. Second, information
interventions can improve farmer knowledge, but they should focus messages on relative toxicity
risks in cases where farmers have access to low toxicity alternatives. We recommend further
research to better identify the mechanisms underlying knowledge and behavior change in
developing countries. Specifically, more research is needed to identify the most impactful and
cost effective information delivery mechanisms particularly in rural areas.

190
REFERENCES

191
REFERENCES
Matthews, G., Wiles, T., & Baleguel, P. (2003). A survey of pesticide application in Cameroon. Crop Protection, 22(5), 707–714. https://doi.org/10.1016/S0261-2194(03)00008-5
Maumbe, B. M., & Swinton, S. M. (2003). Hidden health costs of pesticide use in Zimbabwe’s smallholder cotton growers. Social Science & Medicine, 57(9), 1559–1571.
Ntow, W. J., Gijzen, H. J., Kelderman, P., & Drechsel, P. (2006). Farmer perceptions and pesticide use practices in vegetable production in Ghana. Pest Management Science, 62(4), 356–365. https://doi.org/10.1002/ps.1178
Sheahan, M., Barrett, C. B., & Goldvale, C. (2016). Human health and pesticide use in Sub-Saharan Africa. Retrieved from http://barrett.dyson.cornell.edu/files/papers/Sheahan%20Barrett%20Goldvale%20-%20SSA%20pesticide%20and%20human%20health%20paper%20-%20Sept.pdf
Snyder, J., Smart, J., Goeb, J., Tschirley, D., & others. (2015). Pesticide use in Sub-Saharan
Africa: Estimates, Projections, and Implications in the Context of Food System
Transformation. Michigan State University, Department of Agricultural, Food, and Resource Economics. Retrieved from https://ideas.repec.org/p/ags/midamp/230980.html