Paradigms Lost – Towards and integration of conflicting approaches ...

Information Integration Information Integration Approaches toApproaches to
Analysis of Genomic DataAnalysis of Genomic DataJohn QuackenbushJohn Quackenbush
Wayne State UniversityWayne State University31 March 200931 March 2009

The Gene Index TeamThe Gene Index TeamCorina AntonescuCorina Antonescu
Valentin AntonescuValentin AntonescuFenglong LiuFenglong LiuGeo PerteaGeo Pertea
Razvan SultanaRazvan SultanaJohn QuackenbushJohn Quackenbush
Microarray Expression TeamMicroarray Expression Team Tove AnderssonTove Andersson
Thomas ChittendenThomas ChittendenAedin CulhaneAedin CulhaneKristina HoltonKristina Holton
Jane PakJane PakRenee RubioRenee Rubio
H. Lee Moffitt Center/USFH. Lee Moffitt Center/USFTimothy J. YeatmanTimothy J. Yeatman
Greg BloomGreg Bloom
<[email protected]><[email protected]>AcknowledgmentsAcknowledgments
http://compbio.dfci.harvard.eduhttp://compbio.dfci.harvard.edu
Stellar StudentsStellar StudentsMartin AryeeMartin Aryee
Kaveh Maghsoudi Kaveh Maghsoudi Jess MarJess Mar
Systems SupportSystems SupportStas Alekseev, Sys AdminStas Alekseev, Sys Admin
Array Software Hit TeamArray Software Hit TeamKatie FranklinKatie FranklinEleanor HoweEleanor Howe
Sarita NairSarita NairJerry PapenhausenJerry PapenhausenJohn QuackenbushJohn Quackenbush
Dan SchlauchDan SchlauchRaktim SinhaRaktim SinhaJoseph WhiteJoseph White
AssistantAssistantPatricia PapastamosPatricia Papastamos

Science is built with facts as a house is with Science is built with facts as a house is with stones – but a collection of facts is no more a stones – but a collection of facts is no more a science than a heap of stones is a house.science than a heap of stones is a house. – – Jules Henri PoincareJules Henri Poincare
Genomic science is wonderful in that it brings Genomic science is wonderful in that it brings together representatives of so many disciplinestogether representatives of so many disciplines
– – clinicians, bench biologists, statisticians, clinicians, bench biologists, statisticians, bioinformatics scientistsbioinformatics scientists
– – all of whom tend to consider the others all of whom tend to consider the others intellectual peasants.intellectual peasants.
– – Isaac “Zak” KohaneIsaac “Zak” Kohane

February 2001: Completion of the Draft Human GenomeFebruary 2001: Completion of the Draft Human Genome
Public HGPPublic HGP Celera GenomicsCelera GenomicsMay 2006: The “complete” human genomeMay 2006: The “complete” human genome
sequence is announcedsequence is announced

February 2001: Completion of the Draft Human GenomeFebruary 2001: Completion of the Draft Human Genome
Public HGPPublic HGP Celera GenomicsCelera Genomics
But what does But what does finishedfinished mean??? mean???
April 14, 2003:
April 14, 2003:
The Human Genome is completed – again!
The Human Genome is completed – again!
October 2004:
October 2004:
The Human Genome is now really finished!
The Human Genome is now really finished!
May 2006:May 2006:The last unfinished chromosome in theThe last unfinished chromosome in thefinished genome is now finished and thefinished genome is now finished and thegenome is now really done again!genome is now really done again!

The Genome Project has provided a The Genome Project has provided a “parts list” for a human cell“parts list” for a human cell

GeneGene
FunctionFunction
ProteinProteinRNARNA
StructureStructure
Fo
lding
Fo
lding
Re
gul
atio
nR
eg
ula
tion
Molecular Biology in 7 WordsMolecular Biology in 7 Words

Different cell types express different sets of genesDifferent cell types express different sets of genes
NeuronNeuron
Thyroid CellThyroid Cell
Lung CellLung Cell
Cardiac MuscleCardiac Muscle
Pancreatic CellPancreatic Cell
Kidney CellKidney Cell
Skeletal MuscleSkeletal Muscle
Skin CellSkin Cell

2006: State of the Art Sequencing 2006: State of the Art Sequencing
74x Capillary Sequencers74x Capillary Sequencers10 FTEs10 FTEs15-40 runs per day15-40 runs per day1-2Mb per instrument per day1-2Mb per instrument per day120Mb total capacity per day 120Mb total capacity per day
SEQUENCINGSEQUENCING
Rooms of equipmentRooms of equipmentSubcloning > picking > prepping Subcloning > picking > prepping 35 FTEs35 FTEs3-4 weeks3-4 weeks
PRODUCTIONPRODUCTION
Sequencing the genome took ~15 years and $3BSequencing the genome took ~15 years and $3B

2009: Enabling a New Era in Genome 2009: Enabling a New Era in Genome Analysis Analysis
1x Cluster Station1x Cluster Station1 FTE1 FTE1 day1 day
PRODUCTIONPRODUCTION
1x Genome Analyzer1x Genome AnalyzerSame FTE as aboveSame FTE as above1 run per 5 days1 run per 5 days15Gb per instrument per run15Gb per instrument per run>300Mb per day >300Mb per day
SEQUENCINGSEQUENCING
We can now re-sequence the genome in a <2 weeksWe can now re-sequence the genome in a <2 weeks

Transforming Biology?Transforming Biology?Assembling a reference genome has not, in and of itself, Assembling a reference genome has not, in and of itself, transformed biomedical researchtransformed biomedical research
Rather, the technologies spawned in producing that Rather, the technologies spawned in producing that reference genome sequence and by the availability of the reference genome sequence and by the availability of the sequence have opened new avenues of investigationsequence have opened new avenues of investigation
Genomics, Epigennomics, Cytogenomics, Transcriptomics, Genomics, Epigennomics, Cytogenomics, Transcriptomics, Proteomics, Metabolomics, etc.(omics), have increased Proteomics, Metabolomics, etc.(omics), have increased the rate at which we can amass datathe rate at which we can amass data
The challenge is to bring this information together with The challenge is to bring this information together with other information to better understand fundamental other information to better understand fundamental problems.problems.
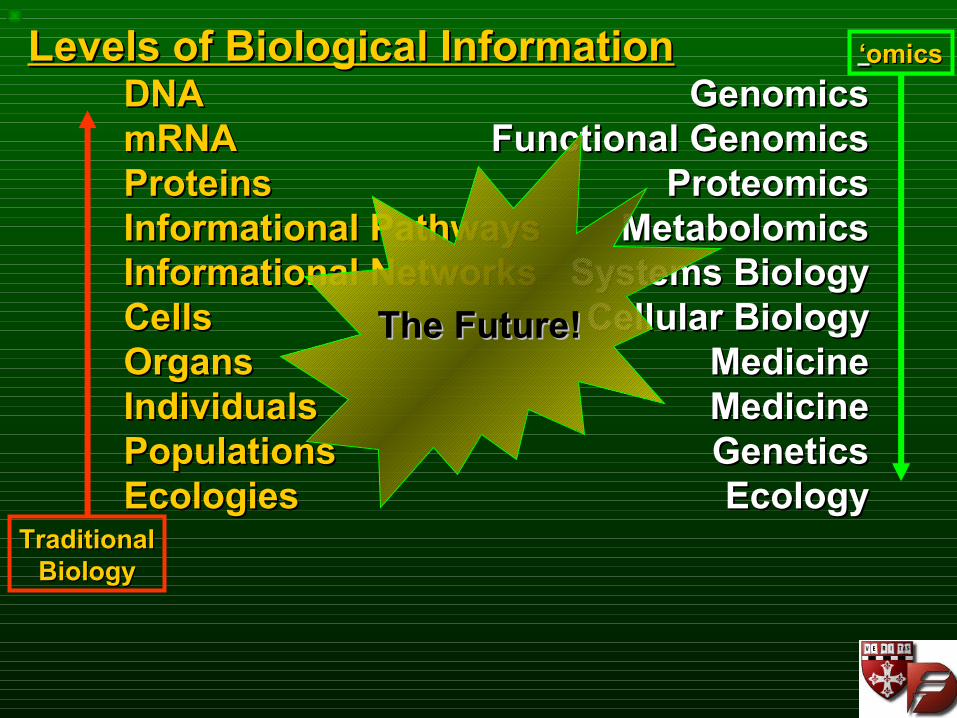
Levels of Biological InformationLevels of Biological InformationDNADNAmRNAmRNAProteinsProteinsInformational PathwaysInformational PathwaysInformational NetworksInformational NetworksCellsCellsOrgansOrgansIndividualsIndividualsPopulationsPopulationsEcologiesEcologies
TraditionalTraditionalBiologyBiology
‘‘omicsomics GenomicsGenomics
Functional GenomicsFunctional GenomicsProteomicsProteomics
MetabolomicsMetabolomicsSystems BiologySystems BiologyCellular BiologyCellular Biology
MedicineMedicineMedicineMedicineGeneticsGeneticsEcologyEcology
The Future!The Future!

GeneGene ProteinProteinRNARNA
NetworkNetwork
http://biocomp.dfci.harvard.eduhttp://biocomp.dfci.harvard.edu
Gene Index DatabasesGene Index Databases
ResourcererResourcererOther DatabasesOther Databases
TM4MicroarraySoftwareTM4MicroarraySoftware
Other toolsOther toolsMeSHerMeSHer
ClusterMedClusterMedBayesian NetsBayesian Nets
DNA MicroarrayDNA MicroarrayAnalysisAnalysis
Candidate Gene(s)Candidate Gene(s)
Perturb Network (RNAi)Perturb Network (RNAi)
Assay Response (Assay Response (µµ A)A)
Predict NetworkPredict Network
PatientPatient
DNA MicroarrayDNA MicroarrayAnalysisAnalysis
CentralCentralWarehouseWarehouse
Other Things:Other Things:Mesoscopic ExpressionMesoscopic ExpressionCorrelated SignaturesCorrelated SignaturesState Space Gene ModelsState Space Gene ModelsTiling Arrays to Genes Tiling Arrays to Genes

Dealing with anDealing with anInformation OverloadInformation Overload

ClinicalClinicalDataData MetabolomicsMetabolomics
ProteomicsProteomicsTranscriptomicsTranscriptomics
CytogenomicsCytogenomics
EpigenomicsEpigenomics
GenomicsGenomics
PublishedPublishedDatasetsDatasets
DrugDrugBankBank
TheTheHapMapHapMap
TheTheGenomeGenome
DiseaseDiseaseDatabasesDatabases
(OMIM)(OMIM)
PubMedPubMed
ClinicalClinicalTrialsTrials
ChemicalChemicalBiologyBiology
Etc.Etc.
Beating Information OverloadBeating Information Overload
CentralCentralWarehouseWarehouse
Improved DiagnosticsImproved DiagnosticsIndividualized TherapiesIndividualized TherapiesMore Effective AgentsMore Effective Agents

Portals
Web Center Portal
C
A B
D
Facts
Custom
C
A B
D
Facts
Business Intelligence
Build or Buy
Oracle
ExistingE
nterp
rise Service B
us
RulesEngine
BPEL
genomics
HTB ODS
De-identification Mapping
Terminology Security
EMPI
Auditing
IDX
Rx
Lab
Clinical Trial
……Dan
a F
arb
er C
lin
ical
Sys
tem
s
BAMDashboard
OMICS
Dan
a F
arb
erL
ab
Ext
ern
al
Partners
Clinical Pathways
Web Service Directory
Idm &Security
Severity Score…..
RFID
Ext
ern
al
mis
c
Pubmed
Genebank
Dana-Farber Research DB Conceptual Architecture

GeneChip Oncology DatabaseGeneChip Oncology Database
Fenglong Liu

GeneChip Oncology DatabaseGeneChip Oncology Database
Fenglong Liu

Analysis
An Example: Signature Analysis
Joe White, Aedin Culhane, Fenglong Liu, Tim Liu
PubMed
ArrayExpress
GEO
RandomWebsites
Fenglong Liu
TimLu
Warehouse
In-HouseStudies

Tumor SubtypeTumor Subtype
Her2Her2
Normal–likeNormal–like
Luminal ALuminal A
Luminal BLuminal B
BasalBasal
Histologically Histologically Normal Adjacent Normal Adjacent Tissue Tissue
Gene expression Gene expression dependent on tumor dependent on tumor subtype subtype
The Environment Reflects the TumorThe Environment Reflects the Tumor
Aedin Culhane, Timothy YeatmanAedin Culhane, Timothy Yeatman
How do published signatures How do published signatures reveal about our samples?reveal about our samples?

An Example: Signature AnalysisAn Example: Signature AnalysisHow do published signatures How do published signatures reveal about our samples?reveal about our samples?
Aedin Culhane, Renee Rubio, Tim YeatmanAedin Culhane, Renee Rubio, Tim Yeatman

Breast Cancer Subtypes SurvivalBreast Cancer Subtypes Survival
Different subtypes have different predicted survivalDifferent subtypes have different predicted survival

Ten Genes in Adjacent Tissue Ten Genes in Adjacent Tissue Distinguish Breast Cancer SubtypesDistinguish Breast Cancer Subtypes
histologically normal tissuehistologically normal tissue
SubtypeSubtype
Luminal ALuminal A
BasalBasal
2424
Aedin CulhaneAedin Culhane

A sample research question
How many Multiple Myeloma patients, with bone marrow or blood samples in the bank, and who have a chromosome 13 deletion, responded (complete, partial, or minor remission) to therapy and how many did not respond?

There was an onerous process to answer this There was an onerous process to answer this simple question:simple question:
• Fill out forms and get access to the tissue bank database application.
• Query for Multiple Myeloma patients with Chromosome 13 deletion abnormalities.
• Take a printout or spreadsheet of their Patient IDs to the hospital records system.
• Fill out more forms and look up each patient’s treatment history.
• Determine best response to treatment by scanning each record manually or matching in spreadsheets to identify appropriate patients for the study.

The warehouse can answer this question in seconds:
1. Select bone marrow sample type and chromosome 13 deletion abnormality on the rows.
2. Select response on the columns
3. Total “CR”, “PR” and “MR” versus other responses for patients who submitted bone marrow samples and have chromosome 13 deletions.

1a. Select Bone Marrow sample type on rows1a. Select Bone Marrow sample type on rows
Sample types: Sample types: BM=Bone MarrowBM=Bone MarrowPB=Peripheral BloodPB=Peripheral Blood

1b. Select Chromosome 13 Deletion abnormality (also on the rows)

2. Select treatment responses on columns
Columns: Sum Columns: Sum CR+PR+MR responsesCR+PR+MR responses
Rows: select Chrom. 13 within Rows: select Chrom. 13 within Bone Marrow samplesBone Marrow samples

Warehouse Use Cases (Integrated Analyses)
Use case #1: From all the genes in the human genome, give me a list of all of the kinases that are associated with disease in OMIM and show me the expression profiles in breast cancer.
Use case #2: For the genes in the KEGG human cell cycle pathway, what is the literature co-occurrence network I can derive and what are the expression profiles like in AML?
Use case #3: For genes that are up-regulated in lung cancer, which are transcription factors? Which genes do these potentially regulate (based on upstream TFBS)? Which of these are up-regulated in lung cancer?
Use case #4: I am interested in GIPC1. What are the genes that have a gene expression correlation coefficient greater than 0.8 with GIPC1 in human ovarian cancer? Which of these are linked by protein-protein interaction data?
Use case #5: Which genes are known to be mutated in pancreatic cancer? In this set, are particular pathways over-represented?

Warehouse Use Cases – Use case #1
From all the genes in the human genome, give me a list of all of the From all the genes in the human genome, give me a list of all of the kinases that are associated with disease in OMIM and show me the kinases that are associated with disease in OMIM and show me the expression profiles in breast cancer. expression profiles in breast cancer.
Approach:Approach:
Use Case #1Use Case #1
1.1. Search local Entrez Gene for human kinase genes.Search local Entrez Gene for human kinase genes.2.2. Select those with OMIM disease referencesSelect those with OMIM disease references3.3. Plot expression profiles in breast cancer samples Plot expression profiles in breast cancer samples 4.4. Determine expression profiles for these genes in breast Determine expression profiles for these genes in breast
cancer samples from local or remote repositoriescancer samples from local or remote repositories5.5. Filter and display the profilesFilter and display the profiles

Warehouse Use Cases – Use case #1Implementation using Implementation using InforSense TechnologyInforSense Technology The rest is done in our Oracle gene The rest is done in our Oracle gene
expression databases (InforSense expression databases (InforSense in-Oracle execution)in-Oracle execution)
Visualizing gene Visualizing gene expression (Ajax expression (Ajax browser graphics), browser graphics), export to toolsexport to tools
kinases associated w/ kinases associated w/ disease in OMIM disease in OMIM (external resources)(external resources)

Warehouse Use Cases – Use case #1Warehouse Use Cases – Use case #1
Export of data from all tumors to MeV data mining tool; >100k usersExport of data from all tumors to MeV data mining tool; >100k users

Warehouse Use Cases – Use case #5Warehouse Use Cases – Use case #5
Which genes are known to be mutated in pancreatic cancer? In this Which genes are known to be mutated in pancreatic cancer? In this set, are particular pathways over-represented?set, are particular pathways over-represented?
Approach:Approach:
Use Case #5Use Case #5
1.1. Find Entrez Gene genes annotated with pancreatic cancer in Find Entrez Gene genes annotated with pancreatic cancer in OMIM.OMIM.
2.2. Use local MEV or remote resource to find over-represented Use local MEV or remote resource to find over-represented pathways.pathways.

Warehouse Use Cases – Use case #5Implementation in InforSenseImplementation in InforSense
““human pancreatic cancer” geneshuman pancreatic cancer” genes
EASE: pathways over-representedEASE: pathways over-represented

Warehouse Use Cases – Use case #5KEGG PathwayKEGG Pathway FCFC P-value _ P-value _ HSA04510:FOCAL ADHESIONHSA04510:FOCAL ADHESION 5.35.3 1.49E-251.49E-25HSA04620:TOLL-LIKE RECEPTOR SIGNALING PATHWAYHSA04620:TOLL-LIKE RECEPTOR SIGNALING PATHWAY 7.17.1 2.63E-182.63E-18HSA04210:APOPTOSISHSA04210:APOPTOSIS 6.66.6 1.31E-151.31E-15HSA04010:MAPK SIGNALING PATHWAYHSA04010:MAPK SIGNALING PATHWAY 3.63.6 6.34E-156.34E-15HSA04664:FC EPSILON RI SIGNALING PATHWAYHSA04664:FC EPSILON RI SIGNALING PATHWAY 6.86.8 2.55E-142.55E-14HSA04662:B CELL RECEPTOR SIGNALING PATHWAYHSA04662:B CELL RECEPTOR SIGNALING PATHWAY 7.37.3 8.01E-148.01E-14HSA04930:TYPE II DIABETES MELLITUSHSA04930:TYPE II DIABETES MELLITUS 8.18.1 5.31E-115.31E-11HSA05120:EPITHELIAL CELL SIGNAL IN H. PYLORI INFECT.HSA05120:EPITHELIAL CELL SIGNAL IN H. PYLORI INFECT. 8.18.1 5.31E-115.31E-11HSA04660:T CELL RECEPTOR SIGNALING PATHWAYHSA04660:T CELL RECEPTOR SIGNALING PATHWAY 5.25.2 1.54E-101.54E-10HSA04520:ADHERENS JUNCTIONHSA04520:ADHERENS JUNCTION 5.75.7 1.70E-101.70E-10HSA04670:LEUKOCYTE TRANSENDOTHELIAL MIGRATIONHSA04670:LEUKOCYTE TRANSENDOTHELIAL MIGRATION 4.54.5 4.20E-104.20E-10HSA04910:INSULIN SIGNALING PATHWAYHSA04910:INSULIN SIGNALING PATHWAY 3.93.9 1.08E-081.08E-08HSA04630:JAK-STAT SIGNALING PATHWAYHSA04630:JAK-STAT SIGNALING PATHWAY 3.73.7 1.42E-1.42E-
0808HSA04110:CELL CYCLEHSA04110:CELL CYCLE 4.34.3 1.94E-081.94E-08HSA04350:TGF-BETA SIGNALING PATHWAYHSA04350:TGF-BETA SIGNALING PATHWAY 4.84.8 3.10E-083.10E-08HSA04810:REGULATION OF ACTIN CYTOSKELETONHSA04810:REGULATION OF ACTIN CYTOSKELETON 3.13.1 4.89E-084.89E-08HSA04920:ADIPOCYTOKINE SIGNALING PATHWAYHSA04920:ADIPOCYTOKINE SIGNALING PATHWAY 5.25.2 6.27E-086.27E-08HSA04650:NATURAL KILLER CELL MEDIATED CYTOTOXICITYHSA04650:NATURAL KILLER CELL MEDIATED CYTOTOXICITY 3.53.5 1.40E-061.40E-06HSA04060:CYTOKINE-CYTOKINE RECEPTOR INTERACTIONHSA04060:CYTOKINE-CYTOKINE RECEPTOR INTERACTION 2.62.6 2.91E-062.91E-06HSA04310:WNT SIGNALING PATHWAYHSA04310:WNT SIGNALING PATHWAY 3.03.0 1.17E-051.17E-05HSA04320:DORSO-VENTRAL AXIS FORMATIONHSA04320:DORSO-VENTRAL AXIS FORMATION 6.46.4 5.05E-055.05E-05HSA04640:HEMATOPOIETIC CELL LINEAGEHSA04640:HEMATOPOIETIC CELL LINEAGE 3.33.3 4.36E-044.36E-04HSA04360:AXON GUIDANCEHSA04360:AXON GUIDANCE 2.52.5 1.64E-031.64E-03HSA05030:AMYOTROPHIC LATERAL SCLEROSIS (ALS)HSA05030:AMYOTROPHIC LATERAL SCLEROSIS (ALS) 6.46.4 6.18E-036.18E-03HSA04530:TIGHT JUNCTIONHSA04530:TIGHT JUNCTION 2.32.3 9.40E-039.40E-03HSA01510:NEURODEGENERATIVE DISORDERSHSA01510:NEURODEGENERATIVE DISORDERS 3.73.7 1.97E-021.97E-02HSA04070:PHOSPHATIDYLINOSITOL SIGNALING SYSTEMHSA04070:PHOSPHATIDYLINOSITOL SIGNALING SYSTEM 2.02.0 7.59E-027.59E-02HSA04340:HEDGEHOG SIGNALING PATHWAYHSA04340:HEDGEHOG SIGNALING PATHWAY 2.42.4 9.69E-029.69E-02

Bayesian NetworksBayesian NetworksAmira DjebbariAmira DjebbariWendy WangWendy Wang

Why we care about networksWhy we care about networksBiological processes are driven not by genes Biological processes are driven not by genes but by networksbut by networks
We want to understand causal relationships in We want to understand causal relationships in biological systems wherever possiblebiological systems wherever possible
Correlations in gene expression can be Correlations in gene expression can be considered to be the result of network considered to be the result of network interactionsinteractions
We want to find networks using microarray We want to find networks using microarray and other expression dataand other expression data

What we What we are notare not talking about: talking about:
Metabolic pathways – KEGGMetabolic pathways – KEGG
Signal transduction pathways – BioCartaSignal transduction pathways – BioCarta
Biochemical Pathways – Roche (Bohringer)Biochemical Pathways – Roche (Bohringer)
Transcription Factor Networks Transcription Factor Networks
etc.etc.
NetworksNetworks

When we say “Networks” we mean…When we say “Networks” we mean…
Genes are represented as “nodes”Genes are represented as “nodes”
Interactions are represented by Interactions are represented by “edges”“edges”
Edges can be directed to show Edges can be directed to show “causal” interactions“causal” interactions
Edges are Edges are not necessarilynot necessarily direct direct interactionsinteractions

Gene networks from microarray dataGene networks from microarray data
Weight matrices (Weaver et al, 1999)Weight matrices (Weaver et al, 1999)
Differential equations (Chen et al, 1999)Differential equations (Chen et al, 1999)
Boolean networks are graphs in which genes are Boolean networks are graphs in which genes are either on or off and governed by Boolean either on or off and governed by Boolean functions (Akutsu et al, 1999)functions (Akutsu et al, 1999)
Bayesian networks are Bayesian networks are Directed Acyclic Graphs Directed Acyclic Graphs (DAGs)(DAGs) in which genes are random variables with in which genes are random variables with associated conditional probability distributions associated conditional probability distributions (Friedman et al, 2000)(Friedman et al, 2000)

Bayesian network - exampleBayesian network - example
Gene1Gene1 Gene2=1|Gene1Gene2=1|Gene1
-1-1 0.10.1
00 0.20.2
11 0.70.7
Conditional Conditional probability table at probability table at
node “Gene2”node “Gene2”
Edges represent dependenciesEdges represent dependencies
Learning Bayesian networks: Learning Bayesian networks: StructureStructure Conditional probability tablesConditional probability tables
Gene1
Gene4
Gene3Gene2

Bayesian networks - complexityBayesian networks - complexity
Learning BNs is NP-Hard (Chickering, 1996)Learning BNs is NP-Hard (Chickering, 1996)
Number of structures super-exponential in Number of structures super-exponential in number of variables: number of variables: O (n! 2 CO (n! 2 Cn,2n,2))
Example: number of structures Example: number of structures for 6 nodesfor 6 nodes 3.7×10 3.7×1066
for 8 nodesfor 8 nodes 7.8×10 7.8×101111
Given a training set D, a Bayesian network Given a training set D, a Bayesian network (G,(G,θθ)) that best matches D can be learned that best matches D can be learned
number of number of possible edgespossible edges
directionalitydirectionalitynumber of possible variable number of possible variable
orderingsorderings

Bayesian networks - learningBayesian networks - learningLearn Bayesian network by maximizing a score Learn Bayesian network by maximizing a score
using heuristic search algorithmsusing heuristic search algorithms
Example scoring scheme: BDe ScoreExample scoring scheme: BDe ScoreBDe score is proportional to the posterior BDe score is proportional to the posterior probability of the network given the dataprobability of the network given the data
Example search algorithm: greedy hill climbing Example search algorithm: greedy hill climbing Starts with a random networkStarts with a random networkAt each iteration, search the entire At each iteration, search the entire neighborhoodneighborhoodEvaluate possible local changesEvaluate possible local changesPick the change that improves the score Pick the change that improves the score the mostthe most

Bayesian networks - priorsBayesian networks - priorsNo free lunch theorem (Wolpert & MacReady, 1996):No free lunch theorem (Wolpert & MacReady, 1996):
The performance of general-purpose optimization algorithm iterated on cost function is The performance of general-purpose optimization algorithm iterated on cost function is independent of the algorithm when averaged over all cost functions. independent of the algorithm when averaged over all cost functions.
Suggests that when considering a specific application one can introduce a Suggests that when considering a specific application one can introduce a potentially potentially useful bias useful bias using domain knowledgeusing domain knowledge

A low-cost lunch?A low-cost lunch?
One can “help” the search along by One can “help” the search along by providing a seed structure representing providing a seed structure representing what we believe is the most likely networkwhat we believe is the most likely networkThe network search process will then use The network search process will then use gene expression data to look for gene expression data to look for perturbations on the structure that are perturbations on the structure that are supported by the datasupported by the dataThere are many possible sources of prior There are many possible sources of prior structures including the Biomedical structures including the Biomedical literature and large-scale interaction studiesliterature and large-scale interaction studies

Literature miningLiterature miningLarge amount of information contained in the Large amount of information contained in the
biological literature available through PubMedbiological literature available through PubMed
Gene naming problem: Gene naming problem: Synonymy: several names for one geneSynonymy: several names for one genePolysemy: one name for several genesPolysemy: one name for several genes
Constructs networks (Jenssen et al, 2001)Constructs networks (Jenssen et al, 2001)nodes: genesnodes: genesedge weights: number of gene co-occurrencesedge weights: number of gene co-occurrences
+ High-throughput+ High-throughput
– – Produces noisy results (retrieving some incorrect Produces noisy results (retrieving some incorrect relationships while not retrieving all relationships while not retrieving all correct ones) correct ones)
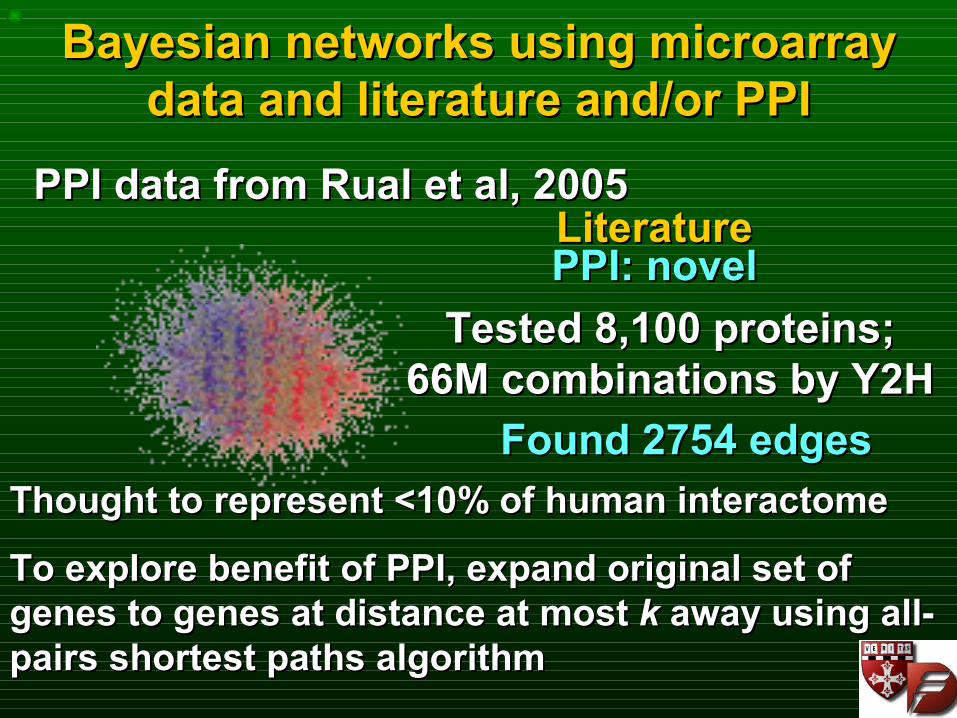
Bayesian networks using microarray Bayesian networks using microarray data and literature and/or PPIdata and literature and/or PPI
PPI data from Rual et al, 2005PPI data from Rual et al, 2005LiteratureLiteraturePPI: novelPPI: novel
Thought to represent <10% of human interactomeThought to represent <10% of human interactome
To explore benefit of PPI, expand original set of To explore benefit of PPI, expand original set of genes to genes at distance at most genes to genes at distance at most kk away using all- away using all-pairs shortest paths algorithmpairs shortest paths algorithm
Tested 8,100 proteins;Tested 8,100 proteins;66M combinations by Y2H66M combinations by Y2H
Found 2754 edgesFound 2754 edges

Microarray data only vs Microarray data only vs combined literature and/or PPI and combined literature and/or PPI and
microarray datamicroarray dataCan we recover known gene interactions?Can we recover known gene interactions?
Are confidence estimates different in prior Are confidence estimates different in prior (combined literature and/or PPI and microarray (combined literature and/or PPI and microarray data) vs. no prior (microarray data only)?data) vs. no prior (microarray data only)?
Is prior better than no prior approach?Is prior better than no prior approach?

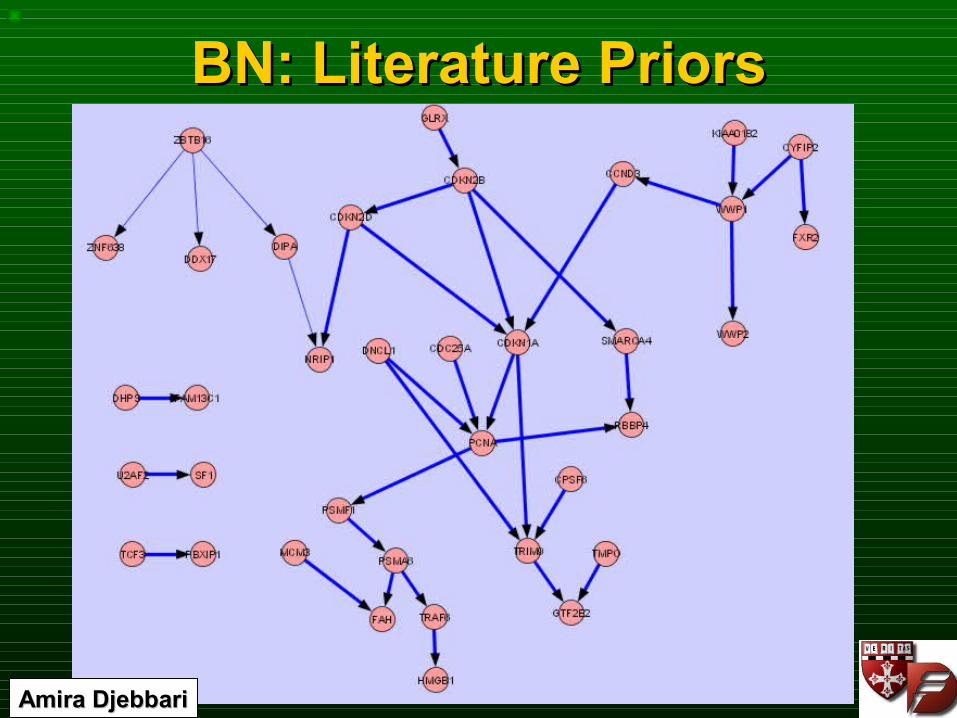
Bayesian networks using Bayesian networks using microarray data and literaturemicroarray data and literature
Test Set: Golub et al. ALL/AML datasetTest Set: Golub et al. ALL/AML dataset
Learn BN with literature network as prior Learn BN with literature network as prior structure, Protein-Protein Interaction data (PPI), structure, Protein-Protein Interaction data (PPI), and literature+PPIand literature+PPIPerform 200 bootstrap network estimations and Perform 200 bootstrap network estimations and find links that are “high confidence”find links that are “high confidence”Compare without prior (microarray data only)Compare without prior (microarray data only)vs. with prior structure from the literature to look vs. with prior structure from the literature to look for known interactions.for known interactions.

Amira DjebbariAmira Djebbari
BN: No PriorsBN: No Priors

Amira DjebbariAmira Djebbari
BN: PPI DataBN: PPI Data
Amira DjebbariAmira Djebbari
BN: Literature PriorsBN: Literature Priors

Amira DjebbariAmira Djebbari
BN: Literature + PPIBN: Literature + PPI
Cell Cycle Gene SubnetworkCell Cycle Gene Subnetwork
What does this give us?What does this give us?
A map, based on the data, of which A map, based on the data, of which genes influence which othersgenes influence which others
A predictive, testable model that can be A predictive, testable model that can be validatedvalidated
A basis for refinement of the model A basis for refinement of the model through controlled perturbationsthrough controlled perturbations
Software in TM4 for BN analysis.Software in TM4 for BN analysis.

What have we learned?What have we learned?
Bayesian network approaches recover sets Bayesian network approaches recover sets of interacting genesof interacting genes
These networks can be linked back to These networks can be linked back to known pathways, suggesting mechanistic known pathways, suggesting mechanistic linkslinks
However, these are incomplete pathways However, these are incomplete pathways and we need to understand how they relate and we need to understand how they relate to full pathwaysto full pathways
Amira DjebbariAmira Djebbari

State Space ModelsState Space Modelsof Gene Expressionof Gene Expression
Jess MarJess Mar

Modeling Cells as Complex SystemsModeling Cells as Complex SystemsConsider the expression levels of all genes in a single cell as a multivariate random variable or state vector: Consider the expression levels of all genes in a single cell as a multivariate random variable or state vector:
S(S(tt) = { ) = { XX11, …, , …, XXN N }. }.
• For For NN genes: S( genes: S(tt) ) represents a point in represents a point in NN dimensional space.dimensional space.
• As cells transition from As cells transition from one state to another, we one state to another, we map out a trajectory of map out a trajectory of points: points:
{S({S(tt11), S(), S(tt22), …, S(), …, S(ttTT) }. ) }.
Huang et al. Huang et al. PRL PRL 20052005 Jess MarJess Mar

Principal Principal ComponentsComponents
AnalysisAnalysis
Constructing a Trajectory in Gene Constructing a Trajectory in Gene Expression SpaceExpression Space
Gene expression matrix of time series data.Gene expression matrix of time series data.
−
NTN
TN
T
xx
x
xx
1
)1(
111
First 2 EigenvectorsFirst 2 Eigenvectors
T tim
e po
ints
T tim
e po
ints
N g
enes
N g
enes
T time pointsT time points
Eigenvector 1Eigenvector 1
Eig
enve
ctor
2E
igen
vect
or 2
E.g. trajectory for cell cycleE.g. trajectory for cell cycle
Jess MarJess Mar

Cells Converge to Attractive StatesCells Converge to Attractive States
Stuart Kauffman presented the idea of a gene expression landscape Stuart Kauffman presented the idea of a gene expression landscape with attractorswith attractors
•~250 stable cell types each represent attractors~250 stable cell types each represent attractors
•Cells can be "pushed" or induced to converge to an attractor. Cells can be "pushed" or induced to converge to an attractor.
•Once in the attractor, a cell is robust to small perturbations.Once in the attractor, a cell is robust to small perturbations.
Jess MarJess Mar

Differentiation of Promyelocytes into Differentiation of Promyelocytes into Neutrophil-Like CellsNeutrophil-Like Cells
PromyeloctyesPromyeloctyes
(HL-60 Cell Line)(HL-60 Cell Line)
Neutrophil-like Neutrophil-like CellsCells
Dimethyl Sulfoxide (DMSO)Dimethyl Sulfoxide (DMSO) All-Trans Retinoic Acid All-Trans Retinoic Acid (ATRA)(ATRA)
~6 days~6 days
Affymetrix Affymetrix GeneChipGeneChip
Time 0Time 0
Day 7Day 7
Collins et al. Collins et al. PNAS PNAS 19781978
RA used in differentiation RA used in differentiation therapy for acute therapy for acute promyelocytic leukemia.promyelocytic leukemia.
Combined with Combined with chemotherapy, complete chemotherapy, complete remission rates as high remission rates as high as 90-95% can be as 90-95% can be achieved.achieved.
Huang et al. Huang et al. PRL PRL 20052005Jess MarJess Mar
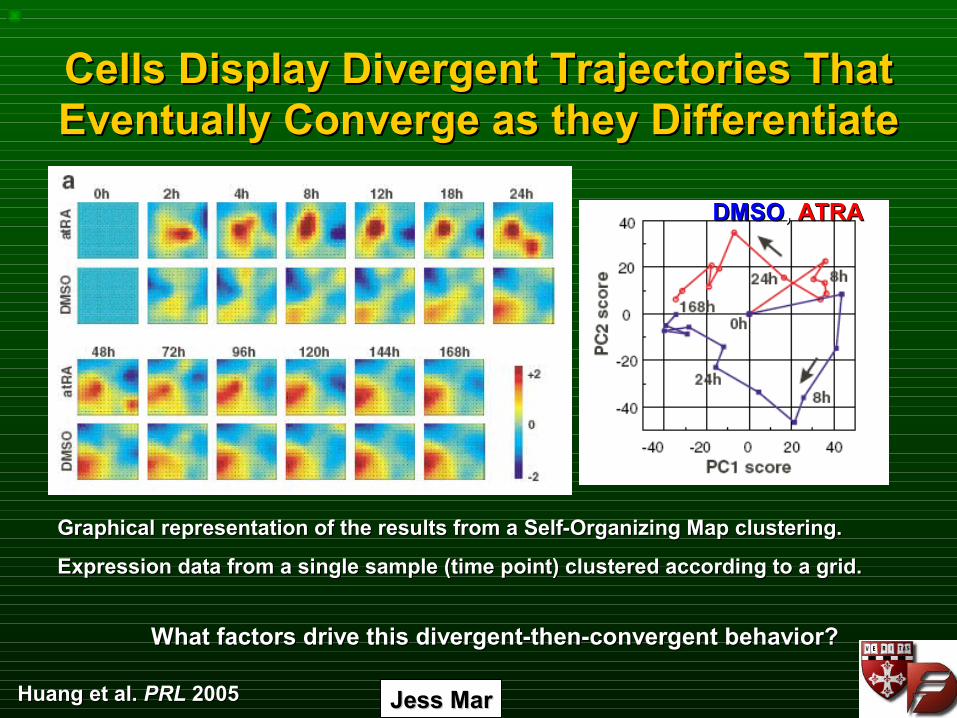
Cells Display Divergent Trajectories That Cells Display Divergent Trajectories That Eventually Converge as they DifferentiateEventually Converge as they Differentiate
Huang et al. Huang et al. PRL PRL 20052005
Graphical representation of the results from a Self-Organizing Map clustering.Graphical representation of the results from a Self-Organizing Map clustering.
Expression data from a single sample (time point) clustered according to a grid.Expression data from a single sample (time point) clustered according to a grid.
DMSODMSO, , ATRAATRA
What factors drive this divergent-then-convergent behavior?What factors drive this divergent-then-convergent behavior?
Jess MarJess Mar

State AState A
State BState B
State AState A
Core Core Differentiation Differentiation PathwayPathway
Transient Transient Pathway Pathway (Perturbation 2)(Perturbation 2)
Transient Transient Pathway Pathway (Perturbation 1)(Perturbation 1)
Observed Trajectory Observed Trajectory (Perturbation 1)(Perturbation 1)
Observed Trajectory Observed Trajectory (Perturbation 2)(Perturbation 2)
State BState B
Our HypothesisOur Hypothesis
Jess MarJess Mar

Core and Transient GenesCore and Transient Genes
Core GenesCore Genes
Integral to the differentiation process.Integral to the differentiation process.
Profiles are well preserved across Profiles are well preserved across perturbations. perturbations.
Transient GenesTransient Genes
Directly induced by the perturbation.Directly induced by the perturbation.
DMSO-specific, ATRA-specific. DMSO-specific, ATRA-specific.
Poorly correlated profiles across Poorly correlated profiles across perturbations.perturbations.
TimeTime
TimeTime
Exp
ress
ion
Exp
ress
ion
Exp
ress
ion
Exp
ress
ion
Perturbation 1Perturbation 1
Perturbation 2Perturbation 2
Perturbation 2Perturbation 2
Perturbation 1Perturbation 1
Jess MarJess Mar

Classifying Core and Transient GenesClassifying Core and Transient Genes
Full Model Full Model
Gene is in transient group.Gene is in transient group.
Reduced ModelReduced Model
Gene is in core group.Gene is in core group.
For each gene, we fit two cubic linear regression models.For each gene, we fit two cubic linear regression models.
Where Where tt = ( = (tt11, …, , …, tt1212))
expression measuresexpression measures
residual error residual error termterm
Jess MarJess Mar

Validating Our HypothesisValidating Our Hypothesis
Functional Enrichment AnalysisFunctional Enrichment Analysis
What functional classes are over-represented in the core group versus What functional classes are over-represented in the core group versus transient group?transient group?
Specific Biological ExamplesSpecific Biological Examples
Transient group has RA-specific genes, Transient group has RA-specific genes, DMSO-specific genes.DMSO-specific genes.
Core group has myeloid differentiation Core group has myeloid differentiation genes. genes.
TrajectoriesTrajectories
Similarities, convergent behavior for Similarities, convergent behavior for core trajectories. core trajectories.
Divergence in the transient group. Divergence in the transient group.
State AState A
Core PathwayCore Pathway
Transient Pathway (Perturbation 1)Transient Pathway (Perturbation 1)
Transient Pathway (Perturbation 2)Transient Pathway (Perturbation 2)
State BState B
Jess MarJess Mar

Core Gene ExamplesCore Gene Examples
1428 genes1428 genes
Jess MarJess Mar

Transient Gene ExamplesTransient Gene Examples
1462 genes1462 genes
Jess MarJess Mar

Functional Enrichment AnalysisFunctional Enrichment Analysis
RNA metabolic processRNA metabolic process
TranscriptionTranscription
RNA biosynthetic processRNA biosynthetic process
Steroid biosynthetic processSteroid biosynthetic process
Transcription, DNA-dependentTranscription, DNA-dependent
Regulation of transcription, DNA-dependentRegulation of transcription, DNA-dependent
Regulation of transcriptionRegulation of transcription
Nucleobase, nucleoside, nucleotide and Nucleobase, nucleoside, nucleotide and
nucleic acid metabolic processnucleic acid metabolic process
Defense responseDefense response
Response to external stimulusResponse to external stimulus
Response to woundingResponse to wounding
Inflammatory responseInflammatory response
Signal transductionSignal transduction
Response to stimulusResponse to stimulus
Cell communicationCell communication
Core Gene Core Gene GroupGroup
Transient Transient Gene GroupGene Group
Enriched GO functional classes in each group.Enriched GO functional classes in each group.
Jess MarJess Mar

DMSO Signaling DMSO Signaling Pathways in HL-60 CellsPathways in HL-60 Cells
ATRA Signaling Pathways ATRA Signaling Pathways in HL-60 Cellsin HL-60 Cells
Jess MarJess Mar

Core TrajectoryCore Trajectory
2 hrs2 hrs 4 hrs4 hrs 8 hrs8 hrs 12 hrs12 hrs 18 hrs18 hrs 1 day1 day
ATRAATRA
DMSODMSO
ATRAATRA
DMSODMSO
2 days2 days 3 days3 days 5 days5 days4 days4 days 7 days7 days6 days6 days
Jess MarJess Mar

2 hrs2 hrs 4 hrs4 hrs 8 hrs8 hrs 12 hrs12 hrs 18 hrs18 hrs 1 day1 day
Transient TrajectoryTransient Trajectory
ATRAATRA
DMSODMSO
ATRAATRA
DMSODMSO
2 days2 days 3 days3 days 5 days5 days4 days4 days 7 days7 days6 days6 days
Jess MarJess Mar

Observed TrajectoryObserved Trajectory
ATRAATRA
DMSODMSO
ATRAATRA
DMSODMSO
2 hrs2 hrs 4 hrs4 hrs 8 hrs8 hrs 12 hrs12 hrs 18 hrs18 hrs 1 day1 day
ATRAATRA
DMSODMSO
ATRAATRA
DMSODMSO
2 days2 days 3 days3 days 5 days5 days4 days4 days 7 days7 days6 days6 daysJess MarJess Mar

Conclusions + Future DirectionsConclusions + Future Directions
State State AA
Core Core PathwayPathway
Transient Pathway Transient Pathway (Perturbation 1)(Perturbation 1)
Transient Pathway (Perturbation 2)Transient Pathway (Perturbation 2)
State BState B
Our hypothesis sets up a modeling framework where we can: Our hypothesis sets up a modeling framework where we can:
• Identify core processes conserved across different perturbations to the same system.Identify core processes conserved across different perturbations to the same system. (Experiments are halfway there to apply this in a breast cancer cell line).(Experiments are halfway there to apply this in a breast cancer cell line).• With extensions, we hope to model trajectories as realizations of a stochastic With extensions, we hope to model trajectories as realizations of a stochastic
process.process.
Biological robustness and chemoresistance mechanisms.Biological robustness and chemoresistance mechanisms.Extend these models to capture the progression of a disease with a model that Extend these models to capture the progression of a disease with a model that
accounts for average behavior trajectories, as well as deviations.accounts for average behavior trajectories, as well as deviations.
Cells that transition from one Cells that transition from one state to another are influenced by state to another are influenced by the combination of two types of the combination of two types of processes – core and transient processes – core and transient groups.groups.
Jess MarJess Mar

Path Integral Formulation of Path Integral Formulation of Quantum MechanicsQuantum Mechanics
State AState A
Classical, Classical, Minimal Energy Minimal Energy
TrajectoryTrajectory
State BState B
•Consider all possible paths between starting and final statesConsider all possible paths between starting and final states
•Weight each by a complex phase factor ~exp(i*Energy)Weight each by a complex phase factor ~exp(i*Energy)
•Sum over all possible pathsSum over all possible paths

There is still a role for biology!There is still a role for biology!
We are approaching a time in which we can begin to We are approaching a time in which we can begin to look at cells and organisms holistically.look at cells and organisms holistically.
We also need to begin to think about integrating We also need to begin to think about integrating diverse data types in an intelligent way. diverse data types in an intelligent way.
This must include cross-species comparisons and This must include cross-species comparisons and inclusion of environmental effects.inclusion of environmental effects.
We may soon be in a position to begin development of We may soon be in a position to begin development of a theoretical biology. a theoretical biology.
Theoretical biology will require a transition from a Theoretical biology will require a transition from a Deterministic to a Stochastic approach.Deterministic to a Stochastic approach.
Where are we going?Where are we going?

Before I came here I was confused Before I came here I was confused about this subject. about this subject.
After listening to your lecture, After listening to your lecture, I am still confused but at a higher level. I am still confused but at a higher level.
- Enrico Fermi, (1901-1954)- Enrico Fermi, (1901-1954)

The Gene Index TeamThe Gene Index TeamCorina AntonescuCorina Antonescu
Valentin AntonescuValentin AntonescuFenglong LiuFenglong LiuGeo PerteaGeo Pertea
Razvan SultanaRazvan SultanaJohn QuackenbushJohn Quackenbush
Microarray Expression TeamMicroarray Expression Team Tove AnderssonTove Andersson
Thomas ChittendenThomas ChittendenAedin CulhaneAedin Culhane
Jane PakJane PakRenee RubioRenee Rubio
H. Lee Moffitt Center/USFH. Lee Moffitt Center/USFTimothy J. YeatmanTimothy J. Yeatman
Greg BloomGreg Bloom
<[email protected]><[email protected]>AcknowledgmentsAcknowledgments
http://compbio.dfci.harvard.eduhttp://compbio.dfci.harvard.edu
Stellar StudentsStellar StudentsMartin AryeeMartin Aryee
Kaveh Maghsoudi Kaveh Maghsoudi Jess MarJess Mar
Systems SupportSystems SupportStas Alekseev, Sys AdminStas Alekseev, Sys Admin
Michael Ferola, DBAMichael Ferola, DBA
Array Software Hit TeamArray Software Hit TeamAmira DjebbariAmira DjebbariEleanor HoweEleanor Howe
Sarita NairSarita NairJerry PapenhausenJerry PapenhausenJohn QuackenbushJohn Quackenbush
Wendy WangWendy WangJoseph WhiteJoseph White
AssistantAssistantPatricia PapastamosPatricia Papastamos