information as of 2010 - Legrand
71
20 10 information as of December 31, 2010
Transcript of information as of 2010 - Legrand

2010
information as of December 31, 2010
LEGRAND
STATUTORY AUDITORS’ REPORTON THE CONSOLIDATED FINANCIAL STATEMENTSFOR THE YEAR ENDED DECEMBER 31, 2010

PricewaterhouseCoopers Audit63, rue de Villiers
92208 Neuilly-sur-Seine cedex
Deloitte & Associés185, avenue Charles-de-Gaulle
92200 Neuilly-sur-Seine
Statutory Auditors’ Report on the Consolidated Financial Statements.For the Year ended December 31, 2010
This is a free translation into English of the Statutory Auditors’ report issued in French and is provided solelyfor the convenience of English speaking users. The Statutory Auditors’ report includes informationspecifically required by French law in such reports, whether modified or not. This information is presentedbelow the opinion on the consolidated financial statements and includes an explanatory paragraph discussingthe auditors’ assessments of certain significant accounting and auditing matters. These assessments wereconsidered for the purpose of issuing an audit opinion on the consolidated financial statements taken as awhole and not to provide separate assurance on individual account captions or on information taken outsideof the consolidated financial statements.
This report should be read in conjunction with, and construed in accordance with, French law andprofessional auditing standards applicable in France.
To the Shareholders
LEGRANDSociété anonyme128, avenue du Maréchal de Lattre de Tassigny87000 Limoges
In compliance with the assignment entrusted to us by your Annual General Meetings, we
hereby report to you for the year ended December 31, 2010 on: the audit of the accompanying consolidated financial statements of Legrand;
the justification of our assessments; the specific verification required by law.
The consolidated financial statements have been approved by the Board of Directors. Ourrole is to express an opinion on these consolidated financial statements based on our audit.
I - Opinion on the consolidated financial statements
We conducted our audit in accordance with professional standards applicable in France.Those standards require that we plan and perform the audit to obtain reasonable assuranceabout whether the consolidated financial statements are free of material misstatement. Anaudit includes examining, using sample testing techniques or other selection methods,evidence supporting the amounts and disclosures in the consolidated financial statements.An audit also includes assessing the accounting principles used and significant estimatesmade, as well as evaluating the overall financial statement presentation. We believe that theaudit evidence we have obtained is sufficient and appropriate to provide a basis for ouropinion.
LEGRANDStatutory Auditors’ Report on the Consolidated Financial Statementsfor the Year ended December 31, 2010
2 / 2
In our opinion, the consolidated financial statements give a true and fair view of the assetsand liabilities and of the financial position of the Group as at December 31, 2010 and of theresults of its operations for the year then ended in accordance with IFRSs as adopted by theEuropean Union.
II - Justification of our assessments
In accordance with the requirements of article L.823-9 of French Company Law (Code decommerce) relating to the justification of our assessments, we bring to your attention thefollowing matters:
Goodwill and intangible assets represent respectively € 2,132.2 million and€ 1,768.0 million of the total consolidated assets of your Company and have been recordedas a result of the acquisition of Legrand France in 2002 and of other subsidiariessince 2005. As mentioned in notes 1.f and 1.g of the consolidated financial statements, yourCompany performs, each year, an impairment test of the value of goodwill and intangibleassets with indefinite useful lives; and assesses whether changes or circumstances relatingto long term assets, which could lead to an impairment loss, have occurred during the year.We have reviewed the methods by which the impairment tests are performed as well as theprojected cash flow and assumptions used for these impairment tests and verified thatinformation disclosed in notes 2 and 3 of the consolidated financial statements isappropriate.
These assessments were made as part of our audit approach of the consolidated financialstatements taken as a whole, and therefore contributed to the opinion we formed which isexpressed in the first part of this report.
III - Specific verification
As required by law, we also verified the information presented in the Group managementreport in accordance with professional standards applicable in France.
We have no matters to report regarding its fair presentation and consistency with theconsolidated financial statements.
Neuilly-sur-Seine, February 9, 2011
The Statutory Auditors
PricewaterhouseCoopers Audit Deloitte & Associés
Gérard Morin Dominique Descours

- Consolidated financial statements – December 31, 2010 - 1 -
LEGRAND
CONSOLIDATED FINANCIAL STATEMENTS
December 31, 2010
Contents
Consolidated Statement of Income 2
Consolidated Balance Sheet 3
Consolidated Statement of Cash Flows 5
Consolidated Statement of Changes in Equity 6
Notes to the Consolidated Financial Statements 7
- Consolidated financial statements – December 31, 2010 - 2 -
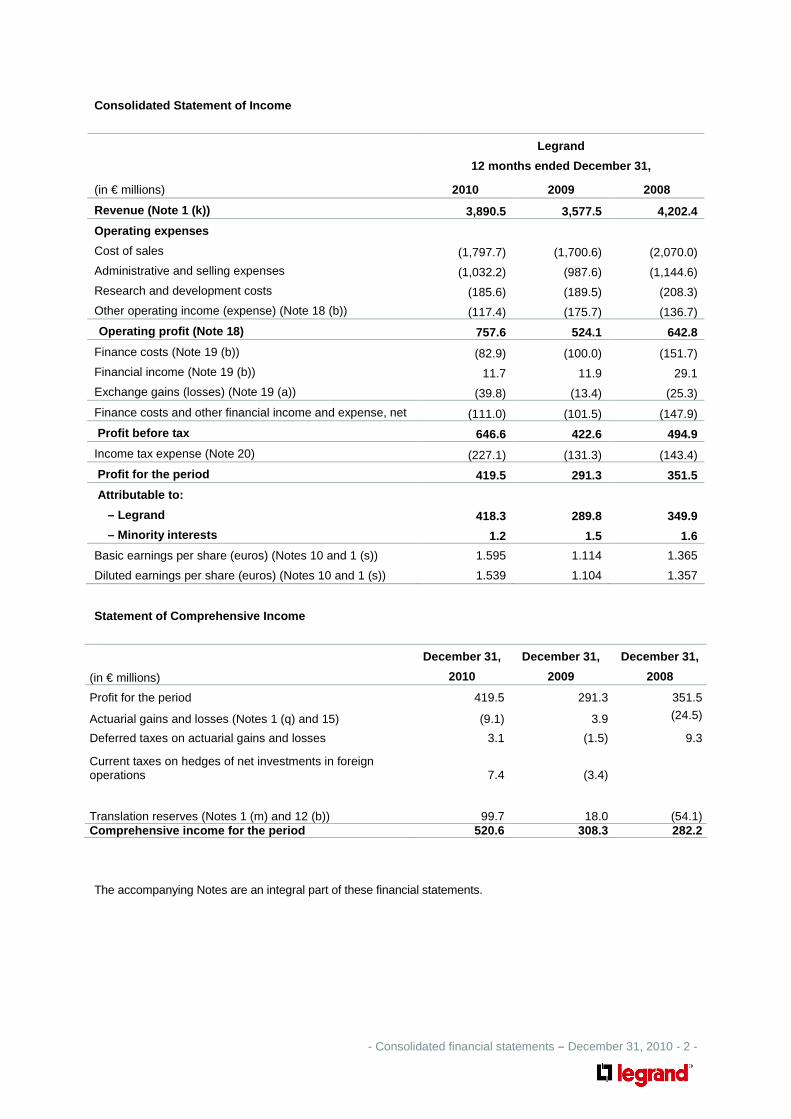
Consolidated Statement of Income
Legrand
12 months ended December 31,
(in € millions) 2010 2009 2008
Revenue (Note 1 (k)) 3,890.5 3,577.5 4,202.4
Operating expenses
Cost of sales (1,797.7) (1,700.6) (2,070.0)
Administrative and selling expenses (1,032.2) (987.6) (1,144.6)
Research and development costs (185.6) (189.5) (208.3)
Other operating income (expense) (Note 18 (b)) (117.4) (175.7) (136.7)
Operating profit (Note 18) 757.6 524.1 642.8
Finance costs (Note 19 (b)) (82.9) (100.0) (151.7)
Financial income (Note 19 (b)) 11.7 11.9 29.1
Exchange gains (losses) (Note 19 (a)) (39.8) (13.4) (25.3)
Finance costs and other financial income and expense, net (111.0) (101.5) (147.9)
Profit before tax 646.6 422.6 494.9
Income tax expense (Note 20) (227.1) (131.3) (143.4)
Profit for the period 419.5 291.3 351.5
Attributable to:
– Legrand 418.3 289.8 349.9
– Minority interests 1.2 1.5 1.6
Basic earnings per share (euros) (Notes 10 and 1 (s)) 1.595 1.114 1.365
Diluted earnings per share (euros) (Notes 10 and 1 (s)) 1.539 1.104 1.357
Statement of Comprehensive Income
(in € millions)
December 31,
2010
December 31,
2009
December 31,
2008
Profit for the period 419.5 291.3 351.5
Actuarial gains and losses (Notes 1 (q) and 15) (9.1) 3.9 (24.5)
Deferred taxes on actuarial gains and losses 3.1 (1.5) 9.3
Current taxes on hedges of net investments in foreign operations 7.4 (3.4) Translation reserves (Notes 1 (m) and 12 (b)) 99.7 18.0 (54.1) Comprehensive income for the period 520.6 308.3 282.2
The accompanying Notes are an integral part of these financial statements.
- Consolidated financial statements – December 31, 2010 - 3 -
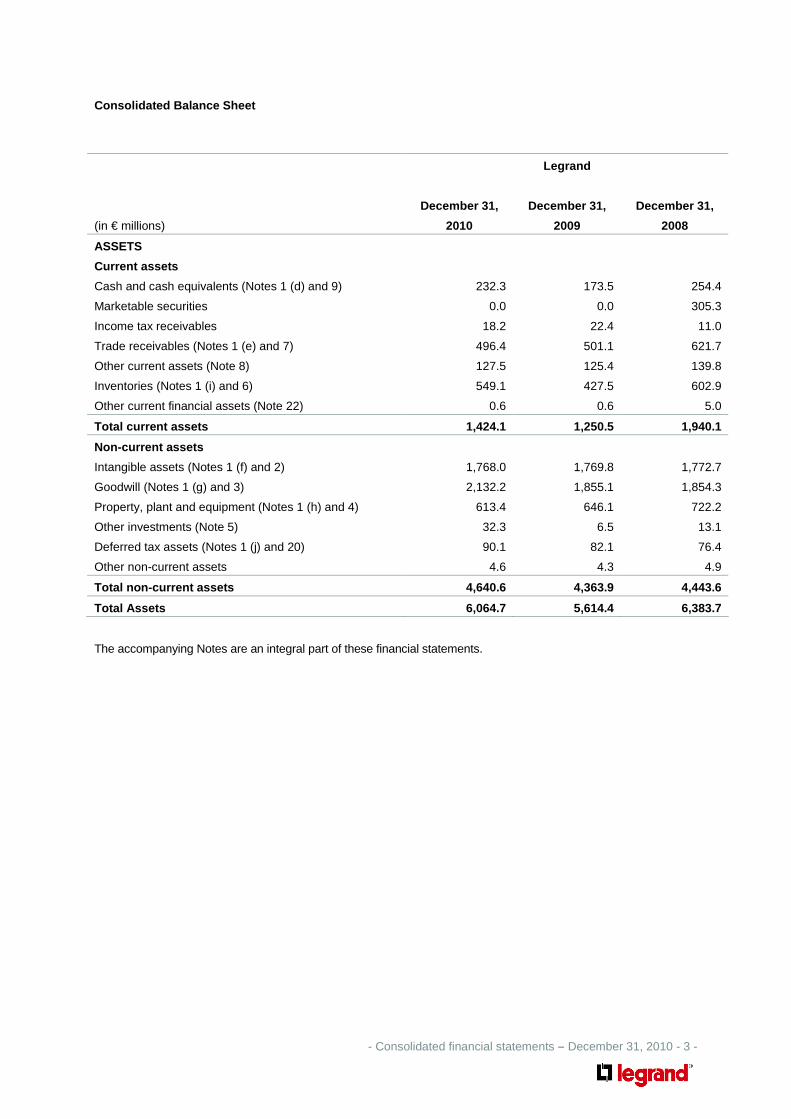
Consolidated Balance Sheet
Legrand
December 31, December 31, December 31,
(in € millions) 2010 2009 2008
ASSETS
Current assets
Cash and cash equivalents (Notes 1 (d) and 9) 232.3 173.5 254.4
Marketable securities 0.0 0.0 305.3
Income tax receivables 18.2 22.4 11.0
Trade receivables (Notes 1 (e) and 7) 496.4 501.1 621.7
Other current assets (Note 8) 127.5 125.4 139.8
Inventories (Notes 1 (i) and 6) 549.1 427.5 602.9
Other current financial assets (Note 22) 0.6 0.6 5.0
Total current assets 1,424.1 1,250.5 1,940.1
Non-current assets
Intangible assets (Notes 1 (f) and 2) 1,768.0 1,769.8 1,772.7
Goodwill (Notes 1 (g) and 3) 2,132.2 1,855.1 1,854.3
Property, plant and equipment (Notes 1 (h) and 4) 613.4 646.1 722.2
Other investments (Note 5) 32.3 6.5 13.1
Deferred tax assets (Notes 1 (j) and 20) 90.1 82.1 76.4
Other non-current assets 4.6 4.3 4.9
Total non-current assets 4,640.6 4,363.9 4,443.6
Total Assets 6,064.7 5,614.4 6,383.7
The accompanying Notes are an integral part of these financial statements.

- Consolidated financial statements – December 31, 2010 - 4 -
Legrand
December 31, December 31, December 31,
(in € millions) 2010 2009 2008
LIABILITIES AND EQUITY
Current liabilities
Short-term borrowings (Notes 1 (t) and 16) 216.8 445.5 401.3
Income tax payable 46.9 15.3 12.1
Trade payables 432.0 357.7 410.4
Short-term provisions (Note 14) 113.8 107.9 75.9
Other current liabilities (Note 17) 443.2 407.7 432.5
Other current financial liabilities (Note 22) 0.3 0.3 0.0
Total current liabilities 1,253.0 1,334.4 1,332.2
Non-current liabilities
Deferred tax liabilities (Notes 1 (j) and 20) 633.5 625.0 638.9
Long-term provisions (Note 14) 91.6 63.6 62.3
Other non-current liabilities 0.7 0.3 0.2
Provisions for pensions and other post-employment benefits
(Notes 1 (q) and 15) 136.9 128.9 144.1
Long-term borrowings (Notes 1 (t) and 13) 1,213.0 1,067.8 2,020.2
Total non-current liabilities 2,075.7 1,885.6 2,865.7
Equity
Share capital (Note 10) 1,052.6 1,052.4 1,051.3
Retained earnings (Note 12 (a)) 1,810.7 1,568.4 1,378.3
Translation reserves (Note 12 (b)) (132.7) (231.6) (249.4)
Equity attributable to equity holders of Legrand 2,730.6 2,389.2 2,180.2
Minority interests 5.4 5.2 5.6
Total equity 2,736.0 2,394.4 2,185.8
Total Liabilities and Equity 6,064.7 5,614.4 6,383.7
The accompanying Notes are an integral part of these financial statements.

- Consolidated financial statements – December 31, 2010 - 5 -
Consolidated Statement of Cash Flows
Legrand
12 months ended December 31, (in € millions) 2010 2009 2008 Profit for the period 419.5 291.3 351.5 Reconciliation of profit for the period to net cash provided by operating activities: – Depreciation expense (Note 18 (a)) 120.2 126.5 136.1 – Amortization expense (Note 18 (a)) 46.2 57.3 71.8 – Amortization of development costs (Note 18 (a)) 25.1 20.5 9.2 – Amortization of finance costs 2.0 1.8 1.4 – Impairment of goodwill (Notes 3 and 18 (b)) 0.0 16.6 0.0 – Changes in deferred taxes 1.7 (23.0) (15.0) – Changes in other non-current assets and liabilities 35.2 (0.7) 9.0 – Exchange (gains)/losses, net 23.3 1.4 20.2 – Other adjustments 1.7 0.9 8.2 (Gains)/losses on sales of assets, net (1.9) (8.5) 3.6 Changes in operating assets and liabilities: – Inventories (87.5) 186.5 22.7 – Trade receivables 47.2 135.5 24.0 – Trade payables 57.3 (56.4) (65.6) – Other operating assets and liabilities 59.4 (23.4) 0.4 Net cash provided by operating activities 749.4 726.3 577.5 Net proceeds from sales of fixed and financial assets 8.9 43.8 12.5 Capital expenditure (82.5) (84.3) (131.0) Capitalized development costs (30.3) (31.3) (29.4) Changes in non-current financial assets and liabilities 0.0 (0.7) (0.3) Acquisitions of subsidiaries, net of cash acquired (Note 3) (257.2) (4.6) (123.6) Investments in non-consolidated entities (31.4) 0.0 (8.7) Net cash used in investing activities (392.5) (77.1) (280.5) – Proceeds from issues of share capital and premium (Note 10) 0.4 1.3 3.9 – Sales (buybacks) of shares and transactions under the liquidity
contract (Note 10) 3.1 75.8 (85.5) – Dividends paid to equity holders of Legrand (183.7) (182.8) (180.0) – Dividends paid by Legrand subsidiaries (0.5) (1.5) (1.4) – Proceeds from new borrowings and drawdowns 330.6 72.0 770.9 – Repayment of borrowings (193.3) (916.7) (102.1) – Debt issuance costs (2.7) (1.4) 0.0 – Proceeds from sales (purchases) of marketable securities 0.0 305.2 (304.7) – Increase (reduction) in bank overdrafts (264.0) (74.9) (357.4) Net cash (used in) provided by financing activities (310.1) (723.0) (256.3) Effect of exchange rate changes on cash and cash equivalents 12.0 (7.1) (7.4) Increase in cash and cash equivalents 58.8 (80.9) 33.3 Cash and cash equivalents at the beginning of the period 173.5 254.4 221.1 Cash and cash equivalents at the end of the period (Note 9) 232.3 173.5 254.4 Items included in cash flows : – Free cash flow (Note 24) 645.5 654.5 429.6 – Interest paid during the period 50.6 106.6 101.7 – Income taxes paid during the period 152.2 153.5 177.4
The accompanying Notes are an integral part of these financial statements.

- Consolidated financial statements – December 31, 2010 - 6 -
Consolidated Statement of Changes in Equity
Equity attributable to equity holders of Legrand
Minority
interests
Total
equity
(in € millions) Share capital
Retained earnings
Translation reserves TOTAL
As of December 31, 2007 1,083.9 1,238.4 (194.0) 2,128.3 2.8 2,131.1 Profit for the period 349.9 349.9 1.6 351.5 Income (expenses) recognized directly in equity, net (15.2) (55.4) (70.6) 1.3 (69.3) Total recognized income and expenses, net 334.7 (55.4) 279.3 2.9 282.2 Dividends paid (180.0) (180.0) (1.4) (181.4) Issues of share capital (Note 10) 3.9 3.9 3.9 Cancellation of shares acquired under the share buyback program (Note 10) (36.5) 36.5 0.0 0.0 Share buybacks and transactions under the liquidity contract (Note 10) (85.5) (85.5) (85.5) Change in scope of consolidation 0.0 0.0 1.3 1.3 Current taxes on share buybacks 16.7 16.7 16.7 Stock options (Note 11 (b)) 17.5 17.5 17.5
As of December 31, 2008 1,051.3 1,378.3 (249.4) 2,180.2 5.6 2,185.8 Profit for the period 289.8 289.8 1.5 291.3 Income (expenses) recognized directly in equity, net (1.0) 17.8 16.8 0.2 17.0 Total recognized income and expenses, net 288.8 17.8 306.6 1.7 308.3
Dividends paid (182.8) (182.8) (1.5) (184.3) Issues of share capital and premium (Note 10) 1.1 0.2 1.3 1.3 Sales (buybacks) of shares and transactions under the liquidity contract (Note 10) 75.8 75.8 75.8 Change in scope of consolidation 0.0 0.0 (0.6) (0.6) Current taxes on share buybacks (0.9) (0.9) (0.9) Stock options (Note 11 (b)) 9.0 9.0 9.0 As of December 31, 2009 1,052.4 1,568.4 (231.6) 2,389.2 5.2 2,394.4 Profit for the period 418.3 418.3 1.2 419.5 Income (expenses) recognized directly in equity, net 1.4 98.9 100.3 0.8 101.1 Total recognized income and expenses, net 419.7 98.9 518.6 2.0 520.6
Dividends paid (183.7) (183.7) (0.5) (184.2) Issues of share capital and premium (Note 10) 0.2 0.2 0.4 0.4 Sales (buybacks) of shares and transactions under the liquidity contract (Note 10) 3.1 3.1 3.1 Change in scope of consolidation* (18.0) (18.0) (1.3) (19.3) Current taxes on share buybacks 0.3 0.3 0.3 Stock options (Note 11 (b)) 20.7 20.7 20.7 As of December 31, 2010 1,052.6 1,810.7 (132.7) 2,730.6 5.4 2,736.0
* In accordance with IFRS 3 (revised) – Business Combinations and IAS 27 (amended) – Consolidated and
Separate Financial Statements, the increase in the Group’s percentage interest in Egypt-based EMB Electrical
Industries SAE following the acquisition of an additional stake in the company in the second quarter of 2010 has
been recognized directly in equity for €13.1 million. This subsidiary is now wholly owned by the Group.
The accompanying Notes are an integral part of these financial statements. .

- Consolidated financial statements – December 31, 2010 - 7 -
DETAILED TABLE OF CONTENTS
NOTES TO THE CONSOLIDATED FINANCIAL STATEMENTS
Pages
General information 8
List of consolidated companies 8
Note 1 - Accounting policies 11
Note 2 - Intangible assets (Note 1 (f)) 24
Note 3 - Goodwill (Note 1 (g)) 26
Note 4 - Property, plant and equipment (Note 1 (h)) 28
Note 5 - Other investments 31
Note 6 - Inventories (Note 1 (i)) 32
Note 7 - Trade receivables (Note 1 (e)) 32
Note 8 - Other current assets 33
Note 9 - Cash and cash equivalents and marketable securities (Note 1 (d)) 33
Note 10 - Share capital and earnings per share (Note 1 (s)) 33
Note 11 - Stock option plans, share grant plans and employee profit-sharing (Note 1 (o)) 36
Note 12 - Retained earnings and translation reserves 39
Note 13 - Long-term borrowings (Note 1 (t)) 40
Note 14 - Provisions 44
Note 15 - Pension and other post-employment benefit obligations (Note 1 (q)) 44
Note 16 - Short-term borrowings (Note 1 (t)) 48
Note 17 - Other current liabilities 48
Note 18 - Analysis of certain expenses 48
Note 19 - Finance costs and other financial income and expense, net 49
Note 20 - Income tax expense (current and deferred) (Note 1 (j)) 49
Note 21 - Contingencies and commitments 52
Note 22 - Financial instruments and management of financial risks 52
Note 23 - Information relating to corporate officers 58
Note 24 - Information by geographical segment (Note 1 (r)) 61
Note 25 - Quarterly data – non-audited 64
Note 26 - Subsequent events 66
- Consolidated financial statements – December 31, 2010 - 8 -
NOTES TO THE CONSOLIDATED FINANCIAL STATEMENTS
General information
Legrand (‘the Company’) and its subsidiaries (together ‘Legrand’ or ‘the Group’) are the global specialist in electrical
and digital building infrastructures.
The Group has manufacturing and/or distribution subsidiaries and offices in more than 70 countries, and sells its
products in about 180 countries. Its key markets are France, Italy and the United States, which accounted for
approximately 53% of annual revenue in 2010 (2009: 56%, 2008: 54%), new economies keeping growing to account
for one third of revenue.
The Company is a société anonyme (public limited company) incorporated and domiciled in France. Its registered
office is located at 128, avenue du Maréchal de Lattre de Tassigny, 87000 Limoges (France).
The 2009 Registration Document was filed with the AMF on April 15, 2010 under no. D 10-0270.
The consolidated financial statements were approved by the Board of Directors on February 9, 2011.
List of consolidated companies
The consolidated financial statements comprise the financial statements of Legrand and 140 subsidiaries. All
Legrand Group subsidiaries are fully consolidated.
The main fully consolidated operating subsidiaries as of December 31, 2010 are as follows:
French subsidiaries:
Groupe Arnould
ICM Group
Legrand France
Legrand SNC
Planet-Wattohm
- Consolidated financial statements – December 31, 2010 - 9 -
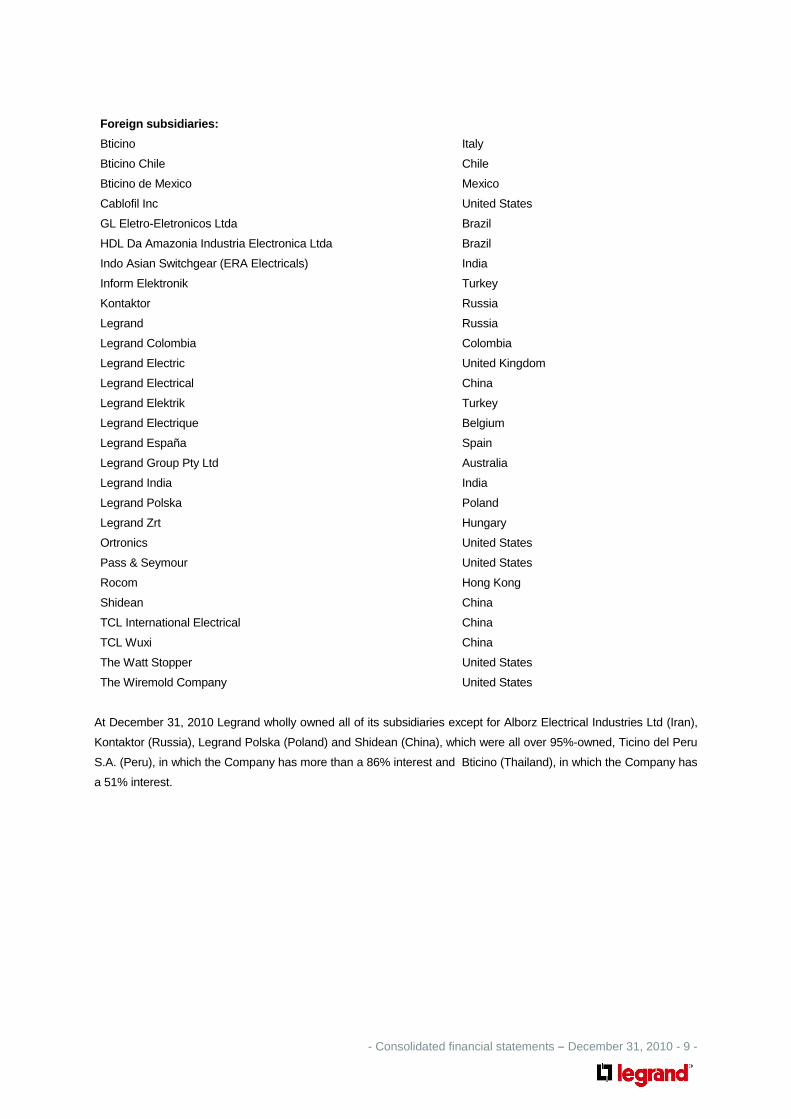
Foreign subsidiaries:
Bticino Italy
Bticino Chile Chile
Bticino de Mexico Mexico
Cablofil Inc United States
GL Eletro-Eletronicos Ltda Brazil
HDL Da Amazonia Industria Electronica Ltda Brazil
Indo Asian Switchgear (ERA Electricals) India
Inform Elektronik Turkey
Kontaktor Russia
Legrand Russia
Legrand Colombia Colombia
Legrand Electric United Kingdom
Legrand Electrical China
Legrand Elektrik Turkey
Legrand Electrique Belgium
Legrand España Spain
Legrand Group Pty Ltd Australia
Legrand India India
Legrand Polska Poland
Legrand Zrt Hungary
Ortronics United States
Pass & Seymour United States
Rocom Hong Kong
Shidean China
TCL International Electrical China
TCL Wuxi China
The Watt Stopper United States
The Wiremold Company United States
At December 31, 2010 Legrand wholly owned all of its subsidiaries except for Alborz Electrical Industries Ltd (Iran),
Kontaktor (Russia), Legrand Polska (Poland) and Shidean (China), which were all over 95%-owned, Ticino del Peru
S.A. (Peru), in which the Company has more than a 86% interest and Bticino (Thailand), in which the Company has
a 51% interest.

- Consolidated financial statements – December 31, 2010 - 10 -
The contributions to the consolidated balance sheets and income statements of companies acquired since January 1, 2008 were as follows:
2008 March 31 June 30 September 30 December 31
Kontaktor 3 months’ profit 6 months’ profit 9 months’ profit 12 months’ profit
Macse 3 months’ profit 6 months’ profit 9 months’ profit 12 months’ profit
Alpes Technologies 3 months’ profit 6 months’ profit 9 months’ profit 12 months’ profit
TCL Wuxi 3 months’ profit 6 months’ profit 9 months’ profit 12 months’ profit
PW Industries 2 months’ profit 5 months’ profit 8 months’ profit 11 months’ profit
Estap 3 months’ profit 6 months’ profit 9 months’ profit
HDL 3 months’ profit 6 months’ profit 9 months’ profit
Electrak 3 months’ profit 6 months’ profit 9 months’ profit
2009 March 31 June 30 September 30 December 31
Estap 3 months’ profit 6 months’ profit 9 months’ profit 12 months’ profit
HDL 3 months’ profit 6 months’ profit 9 months’ profit 12 months’ profit
Electrak 3 months’ profit 6 months’ profit 9 months’ profit 12 months’ profit
2010 December 31
Inform 6 months’ profit
Indo Asian Switchgear 4 months’ profit
Companies consolidated for the first time in 2010 on the basis presented in the above table contributed €41.1 million
to consolidated revenue and €1.8 million to consolidated profit for the year.
Acquisitions made in 2010 include in particular:
- In July, the Group acquired all the shares of Inform, an uninterruptible power supply (UPS) and secured
electrical equipment leader. Based in Istanbul (Turkey), Inform has 360 employees.
- In September, Legrand acquired the net assets of Indo Asian Switchgear (ERA Electricals) (a division of
Indo Asian Fusegear Limited), a key player in the Indian market for electrical protection devices. Located close to
New Delhi, Indo Asian Switchgear employs some 2,000 people.
- In December, the Group acquired all the shares of Meta System Energy, an Italian UPS specialist. Based
in Reggio nell’Emilia, Meta System Energy has some 50 employees. It will be consolidated as from January 1, 2011.
Total acquisitions of subsidiaries (net of cash acquired), purchase of minority shareholdings and investments in non-
consolidated entities amount to €288.6 million in 2010.
- Consolidated financial statements – December 31, 2010 - 11 -
1) Accounting policies
As a company incorporated in France, Legrand is governed by French company law, including the provisions of the
Commercial Code.
The consolidated financial statements cover the 12 months ended December 31, 2010. They have been prepared in
accordance with the International Financial Reporting Standards (IFRS) and International Financial Reporting
Interpretation Committee (IFRIC) interpretations adopted by the European Union and applicable or authorized for
early adoption as of December 31, 2010.
The preparation of financial statements in conformity with IFRS requires the use of certain critical accounting
estimates. It also requires management to exercise judgment in applying the Company’s accounting policies. The
areas involving a higher degree of judgment or complexity, or areas where assumptions and estimates are
significant to the consolidated financial statements are disclosed in Note 1 (v).
The consolidated financial statements have been prepared using the historical cost convention, except for certain
classes of assets and liabilities that are measured in accordance with IFRS. The classes concerned are mentioned
in the notes below.
In accordance with the recommendation of the French National Accounting Board (Conseil National de la
Comptabilité - CNC), the Group has elected to recognize France’s CVAE tax on the value added by the business
under ‘Income tax expense’ in the statement of income as from January 1, 2010.
a) New standards, amendments and interpretations
New standards, amendments and interpretations applied early by the Group in 2009 and compulsory in
2010 that have an impact on its financial statements
The Group has applied the revised IFRS 3 – Business Combinations and the amended IAS 27 – Consolidated and
Separate Financial Statements, which were adopted by the European Union on June 3, 2009.
As a result, the increase in the interest held in acquisition of an additional in 2010 is recognized directly in equity.
The cost of business combinations, as determined on the date when control was acquired, corresponds to the fair
value of the acquired entities. As such, it does not include acquisition-related costs and expenses but does include
contingent consideration (earn out) at fair value.
The Group has also applied IFRIC 16 – Hedges of a Net Investment in a Foreign Operation, which was adopted by
the European Union on June 4, 2009 (Note 12 (b)).

- Consolidated financial statements – December 31, 2010 - 12 -
New standards, amendments and interpretations applied by the Group in 2010 that have no impact on its
financial statements
The following amendments and interpretations do not have any impact on the Group’s consolidated financial
statements:
IFRIC 15 – Agreements for the Construction of Real Estate
This interpretation – which was published by the IASB in July 2008 and adopted by the European Union on July 22,
2009 – applies to the accounting for revenue and associated expenses by entities that undertake the construction of
real estate directly or through subcontractors.
IFRIC 15 is applicable for annual periods beginning on or after January 1, 2010.
IFRIC 17 – Distributions of Non-cash Assets to Owners
This interpretation – published by the IASB in November 2008 and adopted by the European Union on November
27, 2009 – applies to distributions of non-cash assets and distributions that give owners a choice of receiving either
non-cash assets or a cash alternative. It provides guidance on the recognition and measurement of dividends
payable and how entities should account for any difference between the carrying amount of the assets distributed
and the carrying amount of the dividend payable.
IFRIC 17 is applicable for annual periods beginning on or after November 1, 2009.
IFRIC 18 – Transfers of Assets from Customers
This interpretation – published in January 2009 and adopted by the European Union on December 1, 2009 – applies
to the accounting for transfers of items of property, plant and equipment by entities that receive such transfers from
their customers.
IFRIC 18 is applicable for annual periods beginning on or after July 1, 2009.
New standards, amendments or new interpretations not yet adopted by the European Union or whose
application by the Group is not compulsory in the annual period commencing January 1, 2011
(1) Standards, amendments and interpretations adopted by the European Union:
Amendment to IAS 32 – Classification of Rights Issues
In October 2009, the IASB published an amendment to IAS 32 on the classification of rights issues. Adopted by the
European Union on December 24, 2009 this amendment concerns certain rights issues offered for a fixed amount of
foreign currency that were previously accounted for as debt derivatives. According to the new amendment, under
certain conditions these rights should be classified as equity regardless of the currency in which the exercise price is
denominated.
Application of the amendment is compulsory for annual periods beginning on or after February 1, 2010.

- Consolidated financial statements – December 31, 2010 - 13 -
Amendment to IFRIC 14 – Prepayments of a Minimum Funding Requirement
In November 2009, the IASB published an amendment to IFRIC 14 – Prepayments of a Minimum Funding
Requirement. According to IFRIC 14 (unamended), in certain circumstances an entity may not recognize as an asset
voluntary prepayments of minimum funding requirements. Adopted by the European Union on July 19, 2010, the
purpose of the amendment is to correct the unintended consequences of this restriction.
Application of the amendment is compulsory for annual periods beginning on or after January 1, 2011.
IFRIC 19 – Extinguishing Financial Liabilities with Equity Instruments
In November 2009, the IASB published IFRIC 19 – Extinguishing Financial Liabilities with Equity Instruments.
Adopted by the European Union on July 23, 2010, this interpretation provides guidance on how to account for the
extinguishment of a financial liability by the issue of equity instruments.
Application of IFRIC 19 is compulsory for annual periods beginning on or after July 1, 2010.
IAS 24 (revised) – Related Party Disclosures
In November 2009, the IASB published the revised version of IAS 24 – Related Party Disclosures. Adopted by the
European Union on July 19, 2010, this version provides for a partial exemption from the disclosure requirements of
IAS 24 for government-related entities and clarifies the definition of a related party.
Application of the revised standard is compulsory for annual periods beginning on or after January 1, 2011.
(2) Standards and interpretations not yet adopted by the European Union:
IFRS 9 – Financial Instruments
In November 2009, the IASB published IFRS 9 – Financial Instruments to replace IAS 39 – Financial Instruments:
Recognition and Measurement. IFRS 9 uses a single approach to determine whether a financial asset is measured
at amortized cost or fair value, replacing the many different rules in IAS 39. The approach in IFRS 9 is based on how
an entity manages its financial instruments (its business model) and the contractual cash flow characteristics of the
financial assets. The new standard also requires a single impairment method to be used, replacing the many
different impairment methods in IAS 39.
In October 2010, the IASB issued additions to IFRS 9 – Financial Instruments for financial liability accounting. Under
the new requirements, which concern the classification and measurement of financial liabilities, an entity choosing to
measure a liability at fair value will present the portion of the change in its fair value due to changes in the entity’s
own credit risk in the other comprehensive income (OCI) section of the income statement, rather than within profit
and loss.

- Consolidated financial statements – December 31, 2010 - 14 -
This standard, including the latest additions, will be applicable for annual periods beginning on or after January 1,
2013. Its early adoption is not possible as it has not yet been approved by the European Union.
Amendments to IFRS 7 – Financial Instruments: Disclosures
In October 2010, the IASB issued amendments to IFRS 7 entitled Disclosures – Transfers of Financial Assets.
These amendments will allow users of financial statements to improve their understanding of transfer transactions of
financial assets, and will require additional disclosures if a disproportionate amount of transfer transactions are
undertaken around the end of the reporting period.
These amendments are applicable to annual periods beginning on or after July 1, 2011. They cannot be early
adopted as they have not yet been approved by the European Union.
Amendments to IAS 12 – Income Taxes
In December 2010, the IASB issued amendments to IAS 12 entitled Deferred Tax: Recovery of Underlying Assets.
The amendments introduce a presumption that recovery of the carrying amount of an asset based on which deferred
tax is measured will, normally, be through sale.
These amendments are applicable to annual periods beginning on or after January 1, 2012. Their early adoption is
not possible as they have not yet been approved by the European Union.
The Group is currently reviewing these standards, amendments and interpretations to assess their possible effect on
its financial information.
b) Basis of consolidation
Subsidiaries controlled by the Group are fully consolidated. Control is defined as the power to govern the financial
and operating policies of an entity so as to obtain benefits from its activities. Subsidiaries are consolidated from the
date when effective control is transferred to the Group. They are deconsolidated from the date on which control
ceases.
Associates are entities over which the Group has significant influence but not control. Significant influence is
generally considered to be exercised when the Group holds 20 to 50% of the voting rights. Investments in associates
are initially recognized at cost and are subsequently accounted for by the equity method.
c) Foreign currency translation
Items included in the financial statements of each Group entity are measured using the currency of the primary
economic environment in which the entity operates (the ‘functional currency’). The consolidated financial statements
are presented in euros, which is the Company’s functional and presentation currency.
Foreign currency transactions are translated into the presentation currency using the exchange rate on the
transaction date. Foreign exchange gains and losses resulting from the settlement of such transactions and from the

- Consolidated financial statements – December 31, 2010 - 15 -
translation of monetary assets and liabilities denominated in foreign currencies using the exchange rate at the
balance sheet date are recognized in the income statement under the heading ‘Exchange gains (losses)’.
Assets and liabilities of Group entities whose functional currency is different from the presentation currency are
translated using the exchange rate at the balance sheet date. Statements of income are translated using the
average exchange rate for the period. Gains or losses arising from the translation of the financial statements of
foreign subsidiaries are recognized directly in equity, under ‘Translation reserves’, until the entities are sold or
substantially liquidated.
d) Cash and cash equivalents
Cash and cash equivalents consist of cash, short-term deposits and all other financial assets with an original maturity
not in excess of three months. Cash equivalents are short-term (defined as maturing in less than three months),
highly liquid investments that are readily convertible to known amounts of cash and which are subject to an
insignificant risk of changes in value. Marketable securities are not considered as cash equivalents.
Bank overdrafts are considered to be a form of financing and are therefore included in short-term borrowings.
e) Trade receivables
Trade receivables are measured at fair value. A provision for impairment is recorded when there is objective
evidence that the Group will not be able to collect all amounts due according to the original terms of the receivables.
f) Intangible assets
In accordance with IAS 36 - Impairment of Assets, when events or changes in market environment indicate that an
intangible asset or item of property, plant and equipment may be impaired, the item concerned is tested for
impairment to determine whether its carrying amount is greater than its recoverable amount, defined as the higher of
fair value less costs to sell and value in use.
Fair value less costs to sell is the best estimate of the amount obtainable from the sale of an asset or cash-
generating unit in an arm’s length transaction between knowledgeable, willing parties, less the costs of disposal.
Value in use is the present value of the future cash flows expected to be derived from the use and subsequent sale
of the asset.
An impairment loss is recognized for the amount by which the asset’s carrying amount exceeds its recoverable
amount. Impairment losses on intangible assets may be reversed in subsequent periods if the impairment has
decreased, provided that the increased carrying amount of the asset does not exceed the amount that would have
been determined had no impairment loss been recognized.
Costs incurred for the Group’s principal development projects (relating to the design and testing of new or improved
products) are recognized as intangible assets when it is probable that the project will be a success, considering its
technical, commercial and technological feasibility, and costs can be measured reliably. Capitalized development
costs are amortized from the starting date of the sale of the product on a straight-line basis over the period in which
the asset’s future economic benefits are consumed, not to exceed 10 years.

- Consolidated financial statements – December 31, 2010 - 16 -
Other development costs that do not meet the definition of an intangible asset are recorded in research and
development costs for the year in which they are incurred.
Developed technology is amortized on an accelerated basis, in a manner that reflects the pattern in which the
assets’ economic benefits are consumed.
Trademarks with finite useful lives are amortized:
• Over 10 years when management plans to gradually replace them by other major trademarks
owned by the Group.
• Over 20 years when management plans to replace them by other major trademarks owned by
the Group only over the long term or when, in the absence of such an intention, management
considers that the trademarks may be threatened by a major competitor in the long term.
Amortization of developed technology is recognized in the income statement under ‘Research and development
costs’.
Amortization of trademarks is recognized in the income statement under ‘Administrative and selling expenses’.
Trademarks are classified as having an indefinite useful life when they have been in use for more than ten years and
management believes they will contribute indefinitely to future consolidated cash flows because it plans to continue
using them indefinitely. Useful lives are reviewed at regular intervals, leading in some cases to trademarks classified
as having an indefinite useful life being reclassified as trademarks with a finite useful life.
As Legrand’s trademarks that are classified as having an indefinite useful life are used internationally, they each
contribute to all of the Group's cash-generating units.
Trademarks are tested for impairment whenever events or changes in circumstances indicate that the carrying
amount may not be recoverable. An impairment loss is recognized for the amount by which the asset’s carrying
amount exceeds its recoverable amount. The recoverable amount is the higher of an asset’s fair value less costs to
sell and value in use.
g) Goodwill
Goodwill is tested for impairment annually, in the fourth quarter of each year, and whenever events or changes in
circumstance indicate that the carrying amount may not be recoverable.
For impairment testing purposes, goodwill is allocated to a cash-generating unit (CGU), corresponding to the lowest
level at which goodwill is monitored. Within the Legrand Group, CGUs are defined as corresponding to individual
countries, to a group of countries whose markets have similar characteristics or to a group of economic regions
managed as a single unit.
The need to record an impairment loss is assessed by comparing the carrying amount of the CGU’s assets and
liabilities, including goodwill, and their recoverable amount, defined as the higher of fair value less costs to sell and
value in use.

- Consolidated financial statements – December 31, 2010 - 17 -
In accordance with IAS 36, value in use is estimated based on discounted cash flows for the next three to five years
and a terminal value calculated by discounting data for the final year of the projection period. The cash flow data
used for the calculation is generally taken from the most recent medium-term business plans approved by the Group.
Cash flows beyond the projection period are estimated by applying a stable growth rate to subsequent years.
The discount rate applied corresponds to the weighed average cost of capital, adjusted to reflect the risks specific to
each cash-generating unit.
Fair value less costs to sell is the best estimate of the amount obtainable from the sale of an asset or cash-
generating unit in an arm’s length transaction between knowledgeable, willing parties, less the costs of disposal.
An impairment loss is recognized when the carrying amount is less than the recoverable amount. In accordance with
IAS 36, impairment losses recognized on goodwill are irreversible.
h) Property, plant and equipment
Land, buildings, machinery and equipment, and other fixed assets are carried at cost less accumulated depreciation
and any accumulated impairment losses. Impairment tests are performed annually and whenever events or changes
in circumstances indicate that the assets’ carrying amount may not be recoverable.
Assets acquired under lease agreements that transfer substantially all of the risks and rewards of ownership to the
Group are capitalized on the basis of the present value of future minimum lease payments and are depreciated over
the shorter of the lease period and the asset's useful life determined in accordance with Group policies (see below).
Depreciation is calculated on a straight-line basis over the estimated useful lives of the respective assets; the most
commonly adopted useful lives are the following:
Light buildings ........................................................................................................................... 25 years
Standard buildings .................................................................................................................... 40 years
Machinery and equipment ........................................................................................................ 8 to 10 years
Tooling ...................................................................................................................................... 5 years
Office furniture and equipment ................................................................................................. 5 to 10 years
The depreciable amount of assets is determined after deducting their residual value when the amounts involved are
material.
Each part of an item of property, plant and equipment with a useful life that is significantly different to the useful lives
of other parts is depreciated separately.
Assets held for sale are measured at the lower of their carrying amount and fair value less costs to sell.

- Consolidated financial statements – December 31, 2010 - 18 -
i) Inventories
Inventories are measured at the lower of cost and net realizable value, with cost determined principally on a first-in,
first-out (FIFO) basis. The cost of finished goods and work in progress comprises raw materials, direct labor, other
direct costs and related production overheads (based on normal operating capacity). It excludes borrowing costs.
Net realizable value is the estimated selling price in the ordinary course of business, less applicable variable selling
expenses.
j) Deferred taxes
In accordance with IAS 12, deferred taxes are recognized for temporary differences between the tax bases of assets
and liabilities and their carrying amount in the consolidated balance sheet. Deferred tax assets and liabilities are
measured at the tax rates that are expected to apply in the period when the asset is realized or the liability is settled,
based on tax rates that have been enacted or substantively enacted by the balance sheet date.
Deferred tax assets are recognized to the extent that it is probable that future taxable profit will be available against
which the temporary differences can be utilized.
Deferred tax assets and deferred tax liabilities are offset when the entity has a legally enforceable right of offset and
they relate to income taxes levied by the same taxation authority.
Concerning foreign subsidiaries, IAS 12, paragraph 39, stipulates that the consolidating entity should not recognize a
deferred tax liability on temporary differences associated with its investments when i) it is able to control the timing of
the reversal of the temporary difference, and ii) it is probable that the temporary difference will not reverse in the
foreseeable future. Accordingly, deferred taxes on the cumulative post-acquisition retained earnings of foreign
subsidiaries are generally not recognized.
k) Revenue recognition
Revenues from the sale of goods are recognized when all of the following conditions have been satisfied: (i) the
significant risks and rewards of ownership of the goods have been transferred to the buyer; (ii) the seller retains
neither continuing managerial involvement to the degree usually associated with ownership nor effective control over
the goods sold; (iii) the amount of revenue can be measured reliably; (iv) it is probable that the economic benefits
associated with the transaction will flow to the seller; and (v) the costs incurred or to be incurred in respect of the
transaction can be measured reliably. For the Group, this policy results in the recognition of revenue when title and
the risk of loss are transferred to the buyer, which is generally upon shipment.
The Group offers certain sales incentives to customers, consisting primarily of volume rebates and cash discounts.
Volume rebates are typically based on three, six, and twelve-month arrangements with customers, and rarely extend
beyond one year. Based on the trade of the current period, such rebates are recognized on a monthly basis as a
reduction in revenue from the underlying transactions that reflect progress by the customer towards earning the
rebate, with a corresponding deduction from the customer’s trade receivables balance.
- Consolidated financial statements – December 31, 2010 - 19 -
l) Financial instruments
(1) Fair value
Under the amended IFRS 7, financial instruments are classified in a three-level hierarchy based on the inputs used
to measure their fair value, as follows:
•••• Level 1: quoted prices for similar instruments;
•••• Level 2: directly observable market inputs other than level 1 inputs;
•••• Level 3: inputs not based on observable market data.
The carrying amounts of cash, short-term deposits, accounts receivable, accounts payable, accrued expenses and
short-term borrowings approximate their fair value because of these instruments’ short maturities. For short-term
investments, comprised of marketable securities, fair value corresponds to the securities’ market price. The fair value
of long-term borrowings is estimated on the basis of interest rates currently available for issuance of debt with similar
terms and remaining maturities. The fair value of interest rate swap agreements is the estimated amount that the
counterparty would receive or pay to terminate the agreements, and is calculated as the present value of the
estimated future cash flows.
(2) Financial instruments designated as hedges
Under IAS 39, non-derivative financial instruments may be designated as hedges only when they are used to hedge
foreign currency risk and provided that they qualify for hedge accounting.
Accordingly, in the case of hedges of a net investment in a foreign operation, the portion of the gain or loss on the
hedging instrument that is deemed to be an effective hedge is recognized in equity, as required under paragraph
102 of IAS 39.
Prior to 2009, debentures denominated in US dollars (“Yankee bonds”) were hedged using a cross currency swap
that matured in 2008. As a result, the Group was unable to apply paragraph 102 of IAS 39 until the following
period, i.e. beginning on January 1, 2009.
The unrealized foreign exchange gains and losses on the Yankee bonds designated as a hedge of the Group’s
net investment in the United States (Note 22) are therefore now recognized in “Translation reserves.”
b) Derivative financial and commodity instruments
Group policy consists of not entering into any transactions of a speculative nature involving financial instruments. All
transactions in these instruments are entered into exclusively for the purpose of managing or hedging currency or
interest rate risks, and changes in the prices of raw materials. For this purpose, the Group periodically enters into
contracts such as swaps, caps, options, futures and forward contracts, according to the nature of its exposure.
Derivatives are initially recognized at fair value at the contract inception date and are subsequently remeasured at
fair value at each reporting date. The method of recognizing the resulting gain or loss depends on whether the
derivative qualifies for hedge accounting, and if so, the nature of the item being hedged.

- Consolidated financial statements – December 31, 2010 - 20 -
Concerning hedges of a net investment in a foreign operation, the portion of the gain or loss on the derivative
instrument that is deemed to be an effective hedge is recognized in equity, as required under paragraph 102 of
IAS 39.
Although the Group’s other derivative instruments are also used to hedge risks, it has opted not to apply the hedge
accounting technique defined in IAS 39 but to measure all of these instruments at fair value through profit. The
resulting gains and losses are recognized in 'Other financial income and expense’ for interest rate hedges, in
‘Exchange gains (losses)’ for hedges of foreign currency transactions and in ‘Operating profit’ for commodity hedges.
The fair values of derivative instruments used for hedging purposes are disclosed in Note 22.
c) Environmental and product liabilities
In accordance with IAS 37, the Group recognizes losses and accrues liabilities relating to environmental and product
liability matters. A loss is recognized if available information indicates that it is probable and reasonably estimable. In
the event that a loss is neither probable nor reasonably estimable but remains possible, the contingency is disclosed
in the notes to the consolidated financial statements.
Losses arising from environmental liabilities are measured on a best-estimate basis, case by case, based on
available information.
Losses arising from product liability issues are estimated on the basis of current facts and circumstances, past
experience, the number of claims and the expected cost of administering, defending and, in some cases, settling
such cases.
In accordance with IFRIC 6 - Liabilities arising from Participating in a Specific Market - Waste Electrical and
Electronic Equipment, the Group manages waste equipment under the European Union Directive on waste electrical
and electronic equipment by paying financial contributions to a recycling platform.
d) Share based payment transactions
The Group operates equity-settled, share-based compensation plans.
The cost of stock options is measured at the fair value of the award on the grant date, using the Black & Scholes
option pricing model or the binomial model, and is recognized in the income statement under ‘Employee benefits
expense’ on a straight-line basis over the vesting period with a corresponding adjustment to equity. Changes in the
fair value of stock options after the grant date are not taken into account.
e) Transfers and use of financial assets
In accordance with IAS 39, financial assets are derecognized when the associated cash flows and substantially all
the related risks and rewards have been transferred.
- Consolidated financial statements – December 31, 2010 - 21 -
f) Pension and other post-employment benefit obliga tions
•••• Pension obligations
Group companies operate various pension plans. The plans are funded through payments to insurance companies
or trustee-administered funds, determined by periodic actuarial calculations. The Group has both defined
contribution and defined benefit plans.
Defined contribution plans
A defined contribution plan is a pension plan under which the Group pays fixed contributions into a separate entity.
Contributions are recognized as an expense for the period of payment.
The Group has no legal or constructive obligations to pay further contributions if the fund does not hold sufficient
assets to pay all employees the benefits relating to employee service in current and prior periods.
Defined benefit plans
A defined benefit plan is a pension plan that defines an amount of pension benefit that an employee will receive on
retirement, usually dependent on one or more factors such as age, years of service and end-of-career salary.
The liability recognized in the balance sheet for defined benefit pension plans is the present value of the defined
benefit obligation at the balance sheet date, as adjusted for unrecognized past service costs, less the fair value of
plan assets. Past service costs are recognized in the income statement on a straight-line basis over the average
remaining vesting period.
The Group has elected to recognize all actuarial gains and losses outside profit or loss, in the statement of
recognized income and expense, as allowed under IAS 19, paragraph 93A (amended).
Defined benefit obligations are calculated annually using the projected unit credit method. This method takes into
account estimated years of service at retirement, final salaries, life expectancy and staff turnover, based on actuarial
assumptions. The present value of the defined benefit obligation is determined by discounting the estimated future
cash outflows using interest rates of investment grade corporate bonds that are denominated in the currency in
which the benefits will be paid and have terms to maturity approximating the period to payment of the related
pension liability.
•••• Other post-employment benefit obligations
Some Group companies provide post-employment healthcare benefits to their retirees. The entitlement to these
benefits is usually conditional on the employee remaining with the company up to retirement age and completion of a
minimum service period.
The benefits are treated as post-employment benefits under the defined benefit scheme.
g) Segment information
The Group is organized by country for management purposes and by geographical segment for internal reporting
purposes. The geographical segments, determined according to the region of origin of invoicing, are France, Italy,
Rest of Europe, United States and Canada, and Rest of the World.
- Consolidated financial statements – December 31, 2010 - 22 -
h) Basic and diluted earnings per share
Basic earnings per share are calculated by dividing net profit attributable to equity holders of Legrand by the average
number of ordinary shares outstanding during the period.
Diluted earnings per share are calculated by dividing net profit attributable to equity holders of Legrand by the
average number of ordinary shares outstanding plus the number of dilutive potential ordinary shares at the balance
sheet date.
The average number of ordinary shares outstanding used in these calculations has been adjusted for the share
buybacks and sales carried out during the period and does not take into account shares held in treasury.
i) Short- and long-term borrowings
Short- and long-term borrowings mainly comprise bonds and bank loans. They are initially recognized at fair value,
taking into account any transaction costs directly attributable to the issue, and are subsequently measured at
amortized cost, using the effective interest method.
j) Borrowing costs
In accordance with the revised version of IAS 23, borrowing costs that are directly attributable to the acquisition,
construction or production of a qualifying asset are included in the cost of that asset. A qualifying asset is an asset
that necessarily takes a substantial period of time to get ready for its intended use or sale.
Other borrowing costs are recognized as an expense for the period in which they were incurred.
k) Use of estimates
The preparation of financial statements in conformity with generally accepted accounting principles requires
management to make estimates and assumptions that are reflected in the reported amounts of assets and liabilities
and disclosures of contingent assets and liabilities as of the date of the financial statements and the reported
amounts of revenues and expenses during the reporting period. Actual results may differ from those estimates.
Estimates and judgments are continually evaluated. They are based on historical experience and other factors,
including expectations of future events, and are believed to be reasonable under the circumstances.
(1) Impairment of goodwill and intangible assets
Goodwill and intangible assets with indefinite useful lives are tested for impairment at least annually in accordance
with the accounting policy described in Notes 1 (f) and 1 (g). Intangible assets with finite useful lives are amortized
over their estimated useful lives and are tested for impairment when there is any indication that their recoverable
amount may be less than their carrying amount.

- Consolidated financial statements – December 31, 2010 - 23 -
Judgments regarding the existence of indications of impairment are based on legal factors, market conditions and
operational performance of the acquired businesses. Future events could cause the Group to conclude that an
indication of impairment exists and that goodwill or other identifiable intangible assets associated with the acquired
businesses are impaired. Any resulting impairment loss could have a material adverse effect on the consolidated
financial condition and results of operations of the Group.
Recognition of goodwill and other intangible assets involves a number of critical management judgments, including:
• Determining which intangible assets, if any, have indefinite useful lives and, accordingly, should not be
amortized;
• Identifying events or changes in circumstances that may indicate that an impairment has occurred;
• Allocating goodwill to cash-generating units;
• Determining the recoverable amount of cash-generating units for the purposes of impairment tests of
goodwill;
• Estimating the future discounted cash flows to be used for the purposes of periodic impairment tests of
intangible assets with indefinite useful lives; and
• Determining the recoverable amount of intangible assets with indefinite useful lives for impairment testing
purposes.
The recoverable amount of an asset is based either on the asset’s quoted market price in an active market, if
available, or, in the absence of an active market, on discounted future cash flows from operations less investments.
The determination of recoverable amount requires the use of certain assumptions and estimates that may be
affected by changes in the Group's economic environment. Other estimates using different, but still reasonable,
assumptions could produce different results.
(2) Accounting for income taxes
As part of the process of preparing the consolidated financial statements, the Group is required to estimate income
taxes in each of the jurisdictions in which it operates. This involves estimating the actual current tax exposure and
assessing temporary differences resulting from differing treatment of items such as deferred revenue or prepaid
expenses for tax and accounting purposes. These differences result in deferred tax assets and liabilities, which are
reported in the consolidated balance sheet.
The Group must then assess the probability that deferred tax assets will be recovered from future taxable profit.
Deferred tax assets are recognized only when it is probable that taxable profit will be available against which the
underlying deductible temporary difference can be utilized.
The Group has not recognized all of its deferred tax assets because it is not probable that some of them will be
recovered before they expire. The amounts involved mainly concern operating losses carried forward and foreign
income tax credits. The assessment is based on estimates of future taxable profit by jurisdiction in which the Group
operates and the period over which the deferred tax assets are recoverable. If actual results differ from these
estimates or the estimates are adjusted in future periods, the Group may need to record a valuation allowance
against deferred tax assets carried in the balance sheet.

- Consolidated financial statements – December 31, 2010 - 24 -
(3) Other assets and liabilities based on estimates
Other assets and liabilities based on estimates include provisions for pensions and other post-employment benefits,
impairment of trade receivables, inventories and financial assets, stock options, provisions for product liabilities and
capitalized development costs.
2) Intangible assets (Note 1 (f))
Prior to December 10, 2002, Legrand (formerly Legrand Holding SA) had no significant operations of its own. On
December 10, 2002, it acquired 98% of the outstanding share capital of Legrand France, followed by the remaining
2% on October 2, 2003, to create the Group.
The purchase price of the shares in Legrand France and the related fees and commissions – representing a total of
€3,748.0 million – were allocated primarily to trademarks and developed technology.
Intangible assets are as follows:
(in € millions)
December 31,
2010
December 31,
2009
December 31,
2008 Trademarks with indefinite useful lives 1,408.0 1,408.0 1,418.6 Trademarks with finite useful lives 195.6 191.3 161.1 Developed technology 11.5 28.6 57.4 Other intangible assets 152.9 141.9 135.6 1,768.0 1,769.8 1,772.7
Following a review of useful lives as of December 31, 2008 and December 31, 2009 a trademark classified as
having an indefinite useful life was reclassified as a trademark with a finite useful life (see Note 1 (f)).
Trademarks can be analyzed as follows:
(in € millions)
December 31,
2010
December 31,
2009
December 31,
2008 At the beginning of the period 1,651.1 1,617.2 1,590.4 - Acquisitions 5.1 33.6 23.7 - Disposals 0.0 0.0 0.0 - Translation adjustments 17.9 0.3 3.1 1,674.1 1,651.1 1,617.2 Less accumulated amortization (70.5) (51.8) (37.5) At the end of the period 1,603.6 1,599.3 1,579.7
Trademarks with an indefinite useful life were tested for impairment using a pre-tax discount rate ranging from 10.0%
to 10.5% and a growth rate to perpetuity ranging from 2.9% to 3.4%.
No trademarks with an indefinite useful life were found to be impaired in the period ended December 31, 2010.
Sensitivity tests were performed on the discount rates and long-term growth rates used for impairment testing
purposes. Based on the results of these tests, a 100-basis point change in these rates would not lead to any
impairment losses being recognized on trademarks with an indefinite useful life.

- Consolidated financial statements – December 31, 2010 - 25 -
Developed technology can be analyzed as follows:
(in € millions)
December 31,
2010
December 31,
2009
December 31,
2008 At the beginning of the period 571.3 572.6 570.3 - Acquisitions 0.0 0.0 0.0 - Disposals 0.0 0.0 0.0 - Translation adjustments 3.8 (1.3) 2.3 575.1 571.3 572.6 Less accumulated amortization (563.6) (542.7) (515.2) At the end of the period 11.5 28.6 57.4
Amortization expense related to intangible assets, including capitalized development costs, amounted to €71.3
million in 2010 (€77.8 million in 2009, €81.0 million in 2008).
Amortization of trademarks and developed technology in 2010 breaks down as follows:
(in € millions) Developed technology Trademarks Total
France 9.3 1.8 11.1 Italy 4.6 0.0 4.6 Rest of Europe 1.3 1.5 2.8 USA/Canada 1.6 8.4 10.0 Rest of the World 0.5 4.6 5.1 17.3 16.3 33.6
Amortization expense for developed technology and trademarks for each of the next five years is expected to be as
follows:
(in € millions) Developed technology Trademarks Total
2011 11.5 15.4 26.9 2012 0.0 15.1 15.1 2013 0.0 15.1 15.1 2014 0.0 15.1 15.1 2015 0.0 15.1 15.1
Other intangible assets can be analyzed as follows:
(in € millions)
December 31,
2010
December 31,
2009
December 31,
2008 Capitalized development costs 107.4 101.6 90.9 Software 14.2 12.2 14.4 Other 31.3 28.1 30.3 152.9 141.9 135.6
- Consolidated financial statements – December 31, 2010 - 26 -
3) Goodwill (Note 1 (g))
Goodwill can be analyzed as follows:
(in € millions)
December 31,
2010
December 31,
2009
December 31,
2008 France 631.7 600.3 600.3 Italy 342.4 311.2 307.6 Rest of Europe 276.8 212.5 213.1 USA/Canada 320.9 301.0 307.6 Rest of the World 560.4 430.1 425.7 2,132.2 1,855.1 1,854.3
The geographic allocation of goodwill is based on the acquired company’s value, determined as of the date of the
business combination, taking into account synergies with other Group companies.
For business combinations carried out in the last 12 months, the fair values of the identifiable assets acquired and
liabilities and contingent liabilities assumed are determined on a provisional basis as of December 31 of the
acquisition year and goodwill recognized as of that date is therefore subject to adjustment the following year based
on the final fair values.
In the ‘Rest of Europe’ and ‘Rest of the World’ regions, no final amount of goodwill allocated to a CGU (cash-
generating unit) represents more than 10% of total goodwill.
Changes in goodwill can be analyzed as follows:
(in € millions)
December 31,
2010
December 31,
2009
December 31,
2008 At the beginning of the period 1,855.1 1,854.3 1,815.9 - Acquisitions 206.0 0.0 117.1 - Adjustments 0.0 (19.9) (30.0) - Impairment 0.0 (16.6) 0.0 - Translation adjustments 71.1 37.3 (48.7) At the end of the period 2,132.2 1,855.1 1,854.3
Adjustments correspond to the difference between provisional and final goodwill.
For impairment testing purposes, goodwill has been allocated to various country units (cash-generating units), which
represent the lowest level at which goodwill is monitored.
These CGU are tested for impairment annually, and whenever events or changes in circumstances indicate that their
value may be impaired, by comparing their carrying amount, including goodwill, to their value in use.
Value in use corresponds to the present value of the future cash flows expected to be derived from the subsidiaries
included in the cash-generating unit. As required by IAS 36, it is calculated by applying pre-tax discount rates to pre-
tax future cash flows.

- Consolidated financial statements – December 31, 2010 - 27 -
The following impairment testing parameters were used in the period ended December 31, 2010:
Value in use
Recoverable
amount
Carrying
amount of
goodwill
Discount rate
(before tax)
Growth rate to
perpetuity
France 631.7 11.0% 2.5%
Italy 342.4 10.6% 2.5%
Rest of Europe Value in use 276.8 8 to 15% 2.5 to 5%
USA/Canada 320.9 10.5% 3.25%
Rest of the World 560.4 11 to 16% 2.5 to 5%
2,132.2
No goodwill impairment losses were identified in the period ended December 31, 2010.
In addition, sensitivity tests were performed on the discount rates and long-term growth rates. These tests showed
that a 50 to 100-basis point unfavorable change (depending on the region) in each of these two parameters would
not lead to additional impairment of goodwill.
The following impairment testing parameters were used in the period ended December 31, 2009:
Value in use
Recoverable
amount
Carrying
amount of
goodwill
Discount rate
(before tax)
Growth rate to
perpetuity
France 600.3 10.6% 2.5%
Italy 311.2 10.3% 2.5%
Rest of Europe Value in use 212.5 8 to 15% 2.5 to 5%
USA/Canada 301.0 9.8% 3.25%
Rest of the World 430.1 11 to 16% 2.5 to 5%
1,855.1
For the period ended December 31, 2009, the Group recognized a goodwill impairment charge of €16.6 million
under “Other operating income (expense)” in the statement of income.
The following impairment testing parameters were used in the period ended December 31, 2008:
Value in use Recoverable
amount
Carrying
amount of
goodwill
Discount rate
(before tax)
Growth rate to
perpetuity
France 600.3 12.9% 2.5%
Italy 307.6 12.3% 2.5%
Rest of Europe 213.1 12 to 16% 2.5 to 5%
USA/Canada 307.6 12.5% 2.5 to 5%
Rest of the World
Value in use
425.7 12 to 23% 2.5 to 5%
1,854.3
- Consolidated financial statements – December 31, 2010 - 28 -
No goodwill impairment losses were identified in the period ended December 31, 2008.
Acquisitions of subsidiaries (net of cash acquired) came to €257.2 million in 2010.
The €4.6 million invested in acquisitions in 2009 corresponded mainly to price adjustments on subsidiaries acquired
in prior years.
Acquisitions of subsidiaries (net of cash acquired) came to €123.6 million in 2008.
For business combinations carried out in the last 12 months, the fair values of the identifiable assets acquired and
liabilities and contingent liabilities assumed are determined on a provisional basis as of December 31 of the
acquisition year and goodwill recognized as of that date is therefore subject to adjustment the following year based
on the final fair values.
Allocation of acquisition prices for the 12 months ended December 31, 2010, December 31, 2009 and December 31,
2008 has been as follows:
12 months ended
(in € millions)
December 31,
2010
December 31,
2009
December 31,
2008 - Trademarks 5.1 33.6 23.7 - Deferred taxes on trademarks (1.0) (7.9) (6.4) - Other intangible assets - - - - Deferred taxes on other intangible assets - - - - Goodwill 206.0 - 117.1
4) Property, plant and equipment (Note 1 (h))
a) Property, plant and equipment by geographic area
Property, plant and equipment, including finance leases, are as follows as of December 31, 2010:
December 31, 2010
(in € millions) France Italy Rest of Europe
USA/ Canada
Rest of the World Total
Land 22.2 5.5 12.4 1.9 7.1 49.1 Buildings 103.4 71.3 28.9 13.8 22.8 240.2 Machinery and equipment 82.9 65.6 25.3 11.7 60.2 245.7 Assets under construction and other 17.9 15.4 15.2 12.0 17.9 78.4 226.4 157.8 81.8 39.4 108.0 613.4
Total property, plant and equipment includes €16.6 million corresponding to assets held for sale, which are
measured at the lower of their carrying amount and fair value less costs to sell.
- Consolidated financial statements – December 31, 2010 - 29 -
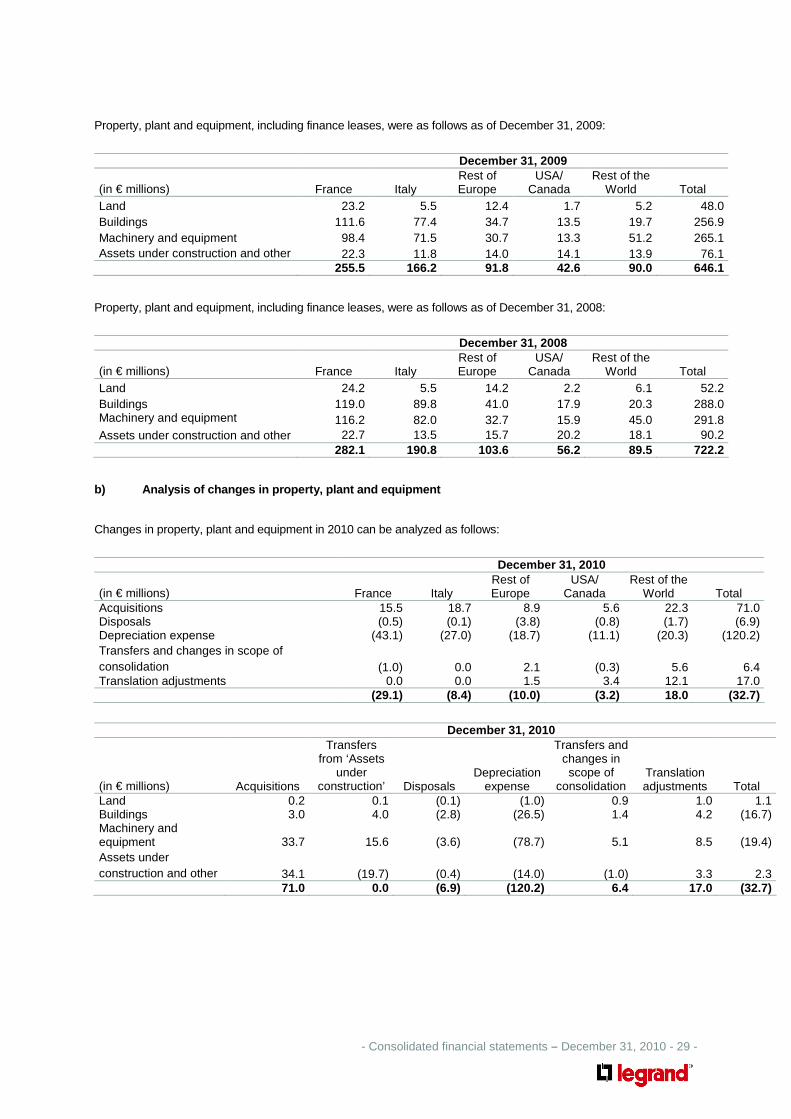
Property, plant and equipment, including finance leases, were as follows as of December 31, 2009:
December 31, 2009
(in € millions) France Italy Rest of Europe
USA/ Canada
Rest of the World Total
Land 23.2 5.5 12.4 1.7 5.2 48.0 Buildings 111.6 77.4 34.7 13.5 19.7 256.9 Machinery and equipment 98.4 71.5 30.7 13.3 51.2 265.1 Assets under construction and other 22.3 11.8 14.0 14.1 13.9 76.1 255.5 166.2 91.8 42.6 90.0 646.1
Property, plant and equipment, including finance leases, were as follows as of December 31, 2008:
December 31, 2008
(in € millions) France Italy Rest of Europe
USA/ Canada
Rest of the World Total
Land 24.2 5.5 14.2 2.2 6.1 52.2 Buildings 119.0 89.8 41.0 17.9 20.3 288.0 Machinery and equipment 116.2 82.0 32.7 15.9 45.0 291.8 Assets under construction and other 22.7 13.5 15.7 20.2 18.1 90.2 282.1 190.8 103.6 56.2 89.5 722.2
b) Analysis of changes in property, plant and equip ment
Changes in property, plant and equipment in 2010 can be analyzed as follows:
December 31, 2010
(in € millions) France Italy Rest of Europe
USA/ Canada
Rest of the World Total
Acquisitions 15.5 18.7 8.9 5.6 22.3 71.0 Disposals (0.5) (0.1) (3.8) (0.8) (1.7) (6.9) Depreciation expense (43.1) (27.0) (18.7) (11.1) (20.3) (120.2) Transfers and changes in scope of consolidation (1.0) 0.0 2.1 (0.3) 5.6 6.4 Translation adjustments 0.0 0.0 1.5 3.4 12.1 17.0 (29.1) (8.4) (10.0) (3.2) 18.0 (32.7)
December 31, 2010
(in € millions) Acquisitions
Transfers from ‘Assets
under construction’ Disposals
Depreciation expense
Transfers and changes in scope of
consolidation Translation adjustments Total
Land 0.2 0.1 (0.1) (1.0) 0.9 1.0 1.1 Buildings 3.0 4.0 (2.8) (26.5) 1.4 4.2 (16.7) Machinery and equipment 33.7 15.6 (3.6) (78.7) 5.1 8.5 (19.4) Assets under construction and other 34.1 (19.7) (0.4) (14.0) (1.0) 3.3 2.3 71.0 0.0 (6.9) (120.2) 6.4 17.0 (32.7)

- Consolidated financial statements – December 31, 2010 - 30 -
Changes in property, plant and equipment in 2009 can be analyzed as follows: December 31, 2009
(in € millions) France Italy Rest of Europe
USA/ Canada
Rest of the World Total
Acquisitions 25.5 18.8 11.1 4.3 15.5 75.2 Disposals (3.3) (14.6) (8.6) (4.6) (4.0) (35.1) Depreciation expense (47.1) (28.7) (17.9) (12.0) (20.8) (126.5) Transfers and changes in scope of consolidation (1.7) (0.1) 3.1 (0.5) 0.8 1.6 Translation adjustments 0.0 0.0 0.5 (0.8) 9.0 8.7 (26.6) (24.6) (11.8) (13.6) 0.5 (76.1)
December 31, 2009
(in € millions) Acquisitions
Transfers from ‘Assets
under construction’ Disposals
Depreciation expense
Transfers and changes in scope of
consolidation Translation adjustments Total
Land 0.2 0.5 (4.5) (1.0) (0.1) 0.7 (4.2) Buildings 6.8 7.7 (22.4) (26.3) 1.1 2.0 (31.1) Machinery and equipment 35.3 19.4 (5.9) (83.6) 2.9 5.2 (26.7) Assets under construction and other 32.9 (27.6) (2.3) (15.6) (2.3) 0.8 (14.1) 75.2 0.0 (35.1) (126.5) 1.6 8.7 (76.1)
Changes in property, plant and equipment in 2008 can be analyzed as follows:
December 31, 2008
(in € millions) France Italy Rest of Europe
USA/ Canada
Rest of the World Total
Acquisitions 34.2 32.3 16.2 10.7 25.9 119.3 Disposals (1.9) (7.2) (1.3) (3.3) (2.2) (15.9) Depreciation expense (54.5) (30.1) (17.6) (16.4) (17.5) (136.1) Transfers and changes in scope of consolidation (6.5) (0.3) 12.5 0.2 8.9 14.8 Translation adjustments 0.0 0.0 (9.0) 2.2 (9.8) (16.6) (28.7) (5.3) 0.8 (6.6) 5.3 (34.5)
December 31, 2008
(in € millions) Acquisitions
Transfers from ‘Assets
under construction’ Disposals
Depreciation expense
Transfers and changes in scope of
consolidation Translation adjustments Total
Land 0.0 1.2 (1.2) (0.6) (2.5) (1.1) (4.2) Buildings 23.4 14.4 (10.1) (29.6) 4.8 (4.4) (1.5) Machinery and equipment 46.8 24.9 (3.5) (90.2) 14.5 (8.3) (15.8) Assets under construction and other 49.1 (40.5) (1.1) (15.7) (2.0) (2.8) (13.0) 119.3 0.0 (15.9) (136.1) 14.8 (16.6) (34.5)
- Consolidated financial statements – December 31, 2010 - 31 -
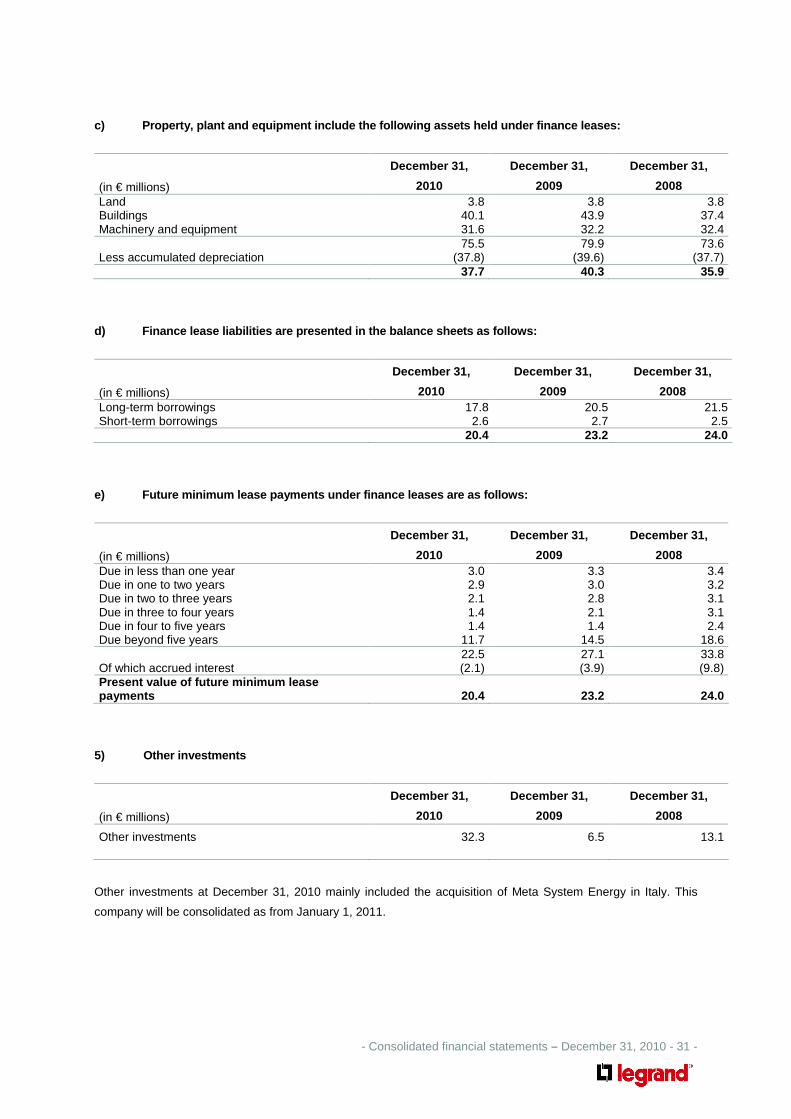
c) Property, plant and equipment include the follow ing assets held under finance leases:
(in € millions)
December 31,
2010
December 31,
2009
December 31,
2008 Land 3.8 3.8 3.8 Buildings 40.1 43.9 37.4 Machinery and equipment 31.6 32.2 32.4 75.5 79.9 73.6 Less accumulated depreciation (37.8) (39.6) (37.7) 37.7 40.3 35.9
d) Finance lease liabilities are presented in the b alance sheets as follows:
(in € millions)
December 31,
2010
December 31,
2009
December 31,
2008 Long-term borrowings 17.8 20.5 21.5 Short-term borrowings 2.6 2.7 2.5 20.4 23.2 24.0
e) Future minimum lease payments under finance leas es are as follows:
(in € millions)
December 31,
2010
December 31,
2009
December 31,
2008 Due in less than one year 3.0 3.3 3.4 Due in one to two years 2.9 3.0 3.2 Due in two to three years 2.1 2.8 3.1 Due in three to four years 1.4 2.1 3.1 Due in four to five years 1.4 1.4 2.4 Due beyond five years 11.7 14.5 18.6 22.5 27.1 33.8 Of which accrued interest (2.1) (3.9) (9.8) Present value of future minimum lease payments 20.4 23.2 24.0
5) Other investments
(in € millions)
December 31,
2010
December 31,
2009
December 31,
2008
Other investments 32.3 6.5 13.1
Other investments at December 31, 2010 mainly included the acquisition of Meta System Energy in Italy. This
company will be consolidated as from January 1, 2011.

- Consolidated financial statements – December 31, 2010 - 32 -
6) Inventories (Note 1 (i))
Inventories are as follows:
(in € millions)
December 31,
2010
December 31,
2009
December 31,
2008 Purchased raw materials and components 222.3 172.2 222.1 Sub-assemblies, work in progress 90.0 84.7 104.7 Finished products 336.6 270.6 364.5 648.9 527.5 691.3 Less impairment (99.8) (100.0) (88.4) 549.1 427.5 602.9
7) Trade receivables (Note 1 (e))
The Group derives over 95% of its revenue from sales to distributors of electrical equipment. The two largest
distributors account for approximately 27% of consolidated net revenue and no other distributor accounts for more
than 5% of consolidated net revenue.
(in € millions)
December 31,
2010
December 31,
2009
December 31,
2008 Trade accounts receivable 466.5 443.0 569.8 Notes receivable 89.2 108.5 82.9 555.7 551.5 652.7 Less impairment (59.3) (50.4) (31.0) 496.4 501.1 621.7
Since 2009, the Group has entered into contracts for the sale of receivables. The contract terms qualify the
receivables for derecognition under IAS 39. The amount derecognized as of December 31, 2010 was €11.1 million
(€18.1 million as of December 31, 2009).
Past-due trade receivables can be analyzed as follows:
(in € millions)
December 31,
2010
December 31,
2009
December 31,
2008
Less than 3 months past due 56.8 55.9 82.8 From 3 to 12 months past due 16.6 17.0 18.6 More than 12 months past due 16.8 10.2 12.2
90.2 83.1 113.6

- Consolidated financial statements – December 31, 2010 - 33 -
Provisions for impairment of past-due trade receivables amounted to €50.9 million as of December 31, 2010 (€43.5
million as of December 31, 2009; €27.9 million as of December 31, 2008). These provisions break down as follows:
(in € millions)
December 31,
2010
December 31,
2009
December 31,
2008 Provisions for receivables less than 3 months past due 24.3 21.6 7.1 Provisions for receivables 3 to 12 months past due 9.8 11.7 8.6 Provisions for receivables more than 12 months past due 16.8 10.2 12.2
50.9 43.5 27.9
8) Other current assets
Other current assets are as follows:
(in € millions)
December 31,
2010
December 31,
2009
December 31,
2008 Employee advances 3.6 3.2 3.1 Other receivables 25.2 31.3 41.6 Prepayments 17.0 13.9 18.9 Prepaid and recoverable taxes other than on income 81.7 77.0 76.2 127.5 125.4 139.8
These assets are valued at historical cost and there are no events or special circumstances indicating that they may
be impaired.
9) Cash and cash equivalents (Note 1 (d))
Cash and cash equivalents totaled €232.3 million as of December 31, 2010 and corresponded to deposits with
maturities of less than three months.
10) Share capital and earnings per share (Note 1 (s ))
Share capital as of December 31, 2010 amounted to €1,052,645,384 represented by 263,161,346 ordinary shares
with a par value of €4 each, for 369,393,488 voting rights.

- Consolidated financial statements – December 31, 2010 - 34 -
Changes in share capital were as follows:
Number of
shares
Par value Share capital
(euros)
Premiums
(euros)
As of December 31, 2008 262,815,128 4 1,051,260,512 1,069,445,732 Exercise of options under the 2004 plan 165,717 4 662,868
Exercise of options under the 2005 plan 115,834 4 463,336 185,334
As of December 31, 2009 263,096,679 4 1,052,386,716 1,069,631,066 Exercise of options under the 2005 plan 57,916 4 231,664 92,666
Exercise of options under
the 2007 plan 2,046 4 8,184 43,376
Exercise of options under
the 2008 plan 2,853 4 11,412 47,303
Exercise of options under
the 2009 plan 1,852 4 7,408 16,890
As of December 31, 2010 263,161,346 4 1,052,645,384 1,069,831,301
Share capital consists exclusively of ordinary shares, each with a par value of €4.
Fully paid-up shares registered in the name of the same shareholder for at least two years carry double voting rights.
In 2010, 64,667 shares were issued upon exercise of stock options granted under the 2005, 2007, 2008 and 2009
plans (Note 11 (a)), resulting in a €0.2 million capital increase with a €0.2 million premium.
a) Share buyback program and transactions under the liquidity contract
Share buyback program
As of December 31, 2010, the Group held 607,635 shares under the program, acquired at a total cost of
€13,872,893. These shares are being held for the following purposes:
- For allocation upon exercise of share grant (578,380 shares purchased at a cost of €13,143,858).
- For allocation to employees who choose to re-invest their profit-shares in Legrand stock through a
corporate mutual fund (29,255 shares purchased at a cost of €729,035).
During 2010, 27,508 shares acquired at a cost of €647,740 that were allocated to the corporate mutual fund were
transferred to the fund.
Also during the period, 330,504 shares were allocated to employees under share grant plans as described in Note
11 (b).

- Consolidated financial statements – December 31, 2010 - 35 -
Liquidity contract
On May 29, 2007, the Group appointed a financial institution to maintain a liquid market for its ordinary shares on the
NYSE Euronext™ Paris market under a liquidity contract complying with the Code of Conduct issued by the AMAFI
(French Financial Markets Association) approved by the AMF on March 22, 2005.
As of December 31, 2010, the Group held 192,500 shares under this contract, purchased at a total cost of
€5,385,349.
During 2010, a net 97,500 shares of Legrand stock were sold, generating proceeds, net of purchase costs, of
€2,469,019.
b) Earnings per share
Basic and diluted earnings per share, calculated on the basis of the average number of ordinary shares outstanding
during the period, are as follows:
December 31,
2010
December 31,
2009
December 31,
2008 Profit attributable to equity holders of Legrand (in € millions) A 418.3 289.8 349.9
Number of ordinary shares outstanding: - At the period-end
263,161,346 263,096,679 262,815,128
- O/w held in treasury 800,135 1,255,647 6,745,873 - Average for the period (excluding shares held in treasury) B 262,274,181 260,132,463 256,389,092 - Average for the period after dilution (excluding shares held in treasury) C 271,792,091 262,531,035 257,894,512 Number of stock options and share grants outstanding at the period end
9,517,910 5,919,305 5,083,315
Sales (buybacks) of shares and transactions under the liquidity contract (net during the period)
125,008 5,235,946 (4,498,980)
Shares allocated during the period under share grant plans
330,504 254,280 -
Basic earnings per share (euros) (Note 1 (s)) A/B 1.595 1.114 1.365 Diluted earnings per share (euros) (Note 1 (s)) A/C 1.539 1.104 1.357 Dividend per share (euros) 0.700 0.700 0.700
Also in accordance with IAS 33, a total of 64,667 shares were issued in 2010 upon exercise of stock options
granted under the 2005, 2007, 2008 and 2009 plans, 330,504 shares were transferred under share grant plans
and a net 125,008 shares were sold. These movements were taken into account on an accruals basis in the
computation of the average number of ordinary shares outstanding during the period, in accordance with IAS 33.
If the shares had been issued and bought back on January 1, 2010, basic earnings per share and diluted
earnings per share would have amounted to €1.594 and €1.539 respectively for the 12 months ended December
31, 2010.
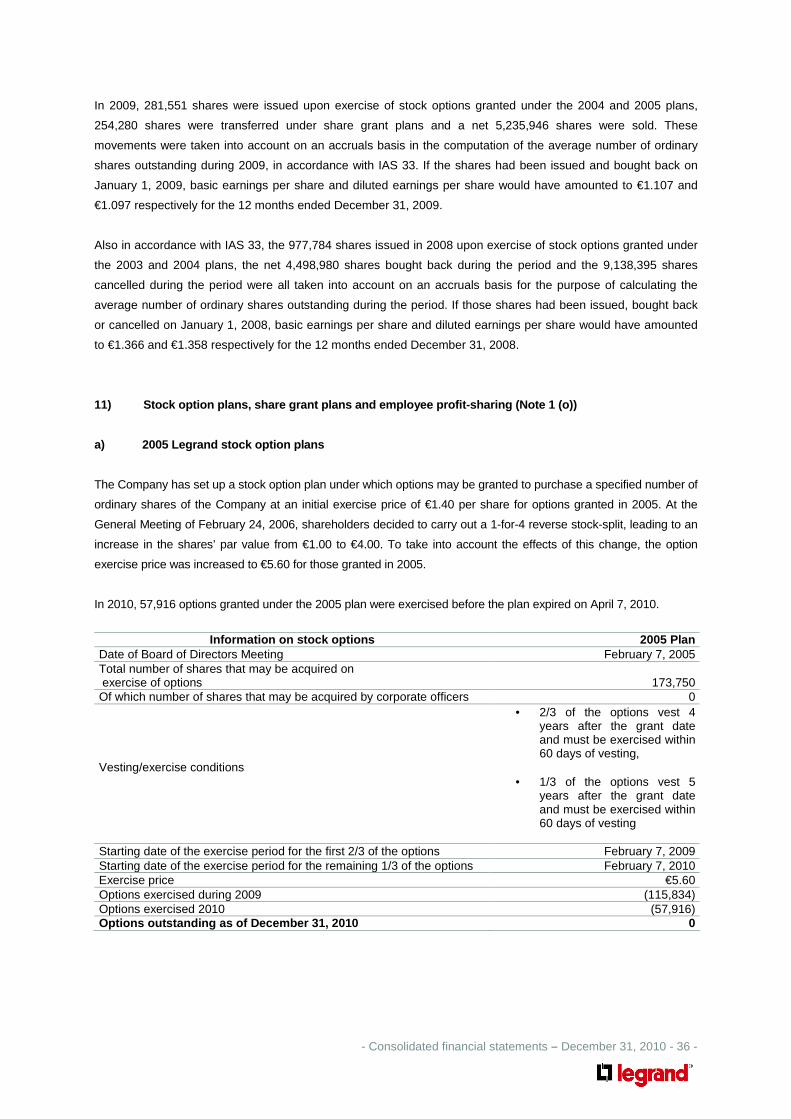
- Consolidated financial statements – December 31, 2010 - 36 -
In 2009, 281,551 shares were issued upon exercise of stock options granted under the 2004 and 2005 plans,
254,280 shares were transferred under share grant plans and a net 5,235,946 shares were sold. These
movements were taken into account on an accruals basis in the computation of the average number of ordinary
shares outstanding during 2009, in accordance with IAS 33. If the shares had been issued and bought back on
January 1, 2009, basic earnings per share and diluted earnings per share would have amounted to €1.107 and
€1.097 respectively for the 12 months ended December 31, 2009.
Also in accordance with IAS 33, the 977,784 shares issued in 2008 upon exercise of stock options granted under
the 2003 and 2004 plans, the net 4,498,980 shares bought back during the period and the 9,138,395 shares
cancelled during the period were all taken into account on an accruals basis for the purpose of calculating the
average number of ordinary shares outstanding during the period. If those shares had been issued, bought back
or cancelled on January 1, 2008, basic earnings per share and diluted earnings per share would have amounted
to €1.366 and €1.358 respectively for the 12 months ended December 31, 2008.
11) Stock option plans, share grant plans and emplo yee profit-sharing (Note 1 (o))
a) 2005 Legrand stock option plans
The Company has set up a stock option plan under which options may be granted to purchase a specified number of
ordinary shares of the Company at an initial exercise price of €1.40 per share for options granted in 2005. At the
General Meeting of February 24, 2006, shareholders decided to carry out a 1-for-4 reverse stock-split, leading to an
increase in the shares’ par value from €1.00 to €4.00. To take into account the effects of this change, the option
exercise price was increased to €5.60 for those granted in 2005.
In 2010, 57,916 options granted under the 2005 plan were exercised before the plan expired on April 7, 2010.
Information on stock options 2005 Plan
Date of Board of Directors Meeting February 7, 2005 Total number of shares that may be acquired on exercise of options 173,750 Of which number of shares that may be acquired by corporate officers 0
Vesting/exercise conditions
• 2/3 of the options vest 4 years after the grant date and must be exercised within 60 days of vesting,
• 1/3 of the options vest 5
years after the grant date and must be exercised within 60 days of vesting
Starting date of the exercise period for the first 2/3 of the options February 7, 2009 Starting date of the exercise period for the remaining 1/3 of the options February 7, 2010 Exercise price €5.60 Options exercised during 2009 (115,834) Options exercised 2010 (57,916) Options outstanding as of December 31, 2010 0

- Consolidated financial statements – December 31, 2010 - 37 -
b) 2007 to 2010 Legrand share grant and stock optio n plans
Share grant plans
On May 15, 2007, shareholders authorized the Board of Directors to grant shares to certain employees or
corporate officers of the Company and its subsidiaries, on one or several occasions. The total number of such
shares is capped at 5% of the capital as of the grant date.
Information on the share grant plans 2007 Plan 2008 Plan 2009 Plan 2010 Plan
Date of Board of Directors Meeting May 15, 2007 March 5, 2008 March 4, 2009 March 4, 2010 Total number of shares granted 533,494 654,058 288,963 896,556 Of which to corporate officers - Gilles Schnepp - Olivier Bazil
26,427
13,582 12,845
47,077
24,194 22,883
23,491
12,075 11,416
62,163
38,373 23,790
Vesting conditions
After a maximum of 4 years, except in the event of resignation or termination for willful misconduct.
Share grants cancelled during 2007 (8,695) Shares vested during 2008 (546) Share grants cancelled during 2008 (8,298) (6,145) Shares vested during 2009 (253,880) (400) Share grants cancelled during 2009 (6,428) (9,905) (6,281) Shares vested during 2010 (682) (329,359) (463) 0 Share grants cancelled during 2010 (2,397) (2,908) (3,845) (21,358) Total number of share grants outstanding as of December 31, 2010 252,568 305,341 278,374 875,198
If all these shares were to vest, the Company's capital would be diluted by 0.7%.
Stock option plans
On May 15, 2007, shareholders authorized the Board of Directors to grant stock options to certain employees or
corporate officers of the Company and its subsidiaries, on one or several occasions, entitling them to subscribe
new shares or purchase existing shares together representing no more than 5% of the capital as of the grant
date.
During 2010, 2,046 options granted under the 2007 plan, 2,853 options granted under the 2008 plan and 1,852
options granted under the 2009 plan were exercised.

- Consolidated financial statements – December 31, 2010 - 38 -
Information on stock options 2007 Plan 2008 Plan 200 9 Plan 2010 Plan
Date of Board of Directors Meeting May 15, 2007 March 5, 2008 March 4, 2009 March 4, 2010 Total number of options 1,638,137 2,015,239 1,185,812 3,254,726 Of which to corporate officers - Gilles Schnepp - Olivier Bazil
79,281
40,745 38,536
141,231
72,583 68,648
93,964
48,300 45,664
217,646
134,351 83,295
Vesting/exercise conditions
Options vest after a maximum of 4 years, except in the event of resignation or termination for willful misconduct.
Starting date of the option exercise period May 16, 2011 March 6, 2012 March 5, 2013 March 5, 2014 End of the option exercise period May 15, 2017 March 5, 2018 March 4, 2019 March 4, 2020 Option exercise price €25.20 €20.58 €13.12 €21.82 Options cancelled during 2007 (27,574) Options cancelled during 2008 (27,468) (20,439) Options cancelled during 2009 (25,105) (32,057) (21,093) Options cancelled during 2010 (13,830) (19,112) (18,739) (75,317) Options exercised during 2010 (2,046) (2,853) (1,852) Outstanding options as of December 31, 2010 1,542,1 14 1,940,778 1,144,128 3,179,409
If all these options were to be exercised, the Company's capital would be diluted by a maximum of 3.0% (this is a
maximum dilution as it does not take into account the exercise price of these options).
Valuation model applied to share grant plans and stock option plans
The fair value of share-based payment instruments is measured at the grant date, using the Black & Scholes
option-pricing model or the binomial model, based on the following assumptions:
Assumptions 2007 Plan 2008 Plan 2009 Plan 2010 Plan
Risk-free rate 4.35% 3.40% 2.25% 2.91% Expected volatility 28.70% 30.00% 38.40% 28.00% Expected return 1.98% 3.47% 5.00% 3.20%
In accordance with IFRS 2, which requires the cost of stock options to be recognized in the financial statements, a
charge of €20.7 million was recorded in 2010 (€9.0 million in 2009; €17.5 million in 2008) for all of these plans
combined (Notes 11 (a) and 11 (b)).
c) Employee profit-sharing
Under French law, the French entities in the Group are required to pay profit shares to employees when their after-
tax profit exceeds a certain level. Amounts accrued are generally payable to employees after a period of five years.
In addition to this obligation, a number of the Group’s French entities and foreign subsidiaries have set up
discretionary profit-sharing plans. Under these plans, employees receive a portion of the entity’s profit calculated on
the basis of predetermined formulas negotiated by each entity.
An accrual of €38.0 million was recorded in 2010 for statutory and discretionary profit-sharing plans (2009: €29.7
million; 2008: €32.7 million).

- Consolidated financial statements – December 31, 2010 - 39 -
12) Retained earnings and translation reserves
a) Retained earnings
Consolidated retained earnings of Legrand and its subsidiaries as of December 31, 2010 amounted to €1,810.7
million.
As of the same date, the parent company – Legrand – had retained earnings of €1,702.5 million available for
distribution.
b) Translation reserves
As explained in Note 1 (c), the translation reserve reflects the effects of currency fluctuations on the financial
statements of subsidiaries when they are translated into euros.
The translation reserve records the impact of fluctuations in the following currencies:
(in € millions)
December 31,
2010
December 31,
2009
December 31,
2008 US dollar (152.8) (158.3) (143.0) Other currencies 20.1 (73.3) (106.4) (132.7) (231.6) (249.4)
In accordance with Note 1 (m), the unrealized €21.6 million foreign exchange loss, as of December 31, 2010, on the
Group's Yankee bonds denominated in US dollars was recognized under “Translation reserves.”
The increase in the translation reserves is mainly due to strengthening of other foreign currencies against the euro.

- Consolidated financial statements – December 31, 2010 - 40 -
13) Long-term borrowings (Note 1 (t))
Long-term borrowings can be analyzed as follows:
(in € millions)
December 31,
2010
December 31,
2009
December 31,
2008 Facility Agreement 227.2 375.8 1,265.8 8 ½% debentures 292.0 269.9 279.2 Bonds 300.0 0.0 0.0 Bank borrowings 282.5 282.5 220.0 Other borrowings 114.3 141.9 258.0 1,216.0 1,070.1 2,023.0 Debt issuance costs (3.0) (2.3) (2.8) 1,213.0 1,067.8 2,020.2
Long-term borrowings are denominated in the following currencies:
(in € millions)
December 31,
2010
December 31,
2009
December 31,
2008 Euro 803.5 635.6 1,471.8 US dollar 307.0 297.9 423.1 Other currencies 105.5 136.6 128.1 1,216.0 1,070.1 2,023.0
Long-term borrowings can be analyzed by maturity as follows:
(in € millions)
December 31,
2010
December 31,
2009
December 31,
2008 Due in one to two years 134.1 108.4 202.0 Due in two to three years 376.9 158.8 129.5 Due in three to four years 77.2 431.0 116.0 Due in four to five years 15.0 76.3 1,239.6 Due beyond five years 612.8 295.6 335.9 1,216.0 1,070.1 2,023.0
Average interest rates on borrowings are as follows (the rates shown for the 8½% debentures 'Yankee bonds' take
into account interest rate swap up to their expiry date of February 2008):
December 31,
2010
December 31,
2009
December 31,
2008 Facility Agreement 0.70% 3.09% 4.69% 8½% debentures 8.50% 8.50% 8.25% Bond 4.25% - - Bank borrowing 1.50% 2.17% 6.06% Other borrowings 5.45% 6.18% 5.58%
These borrowings are secured as follows:
(in € millions)
December 31,
2010
December 31,
2009
December 31,
2008 Assets mortgaged or pledged as collateral 4.4 3.4 21.2 Guarantees given to banks 216.5 245.7 180.4 220.9 249.1 201.6
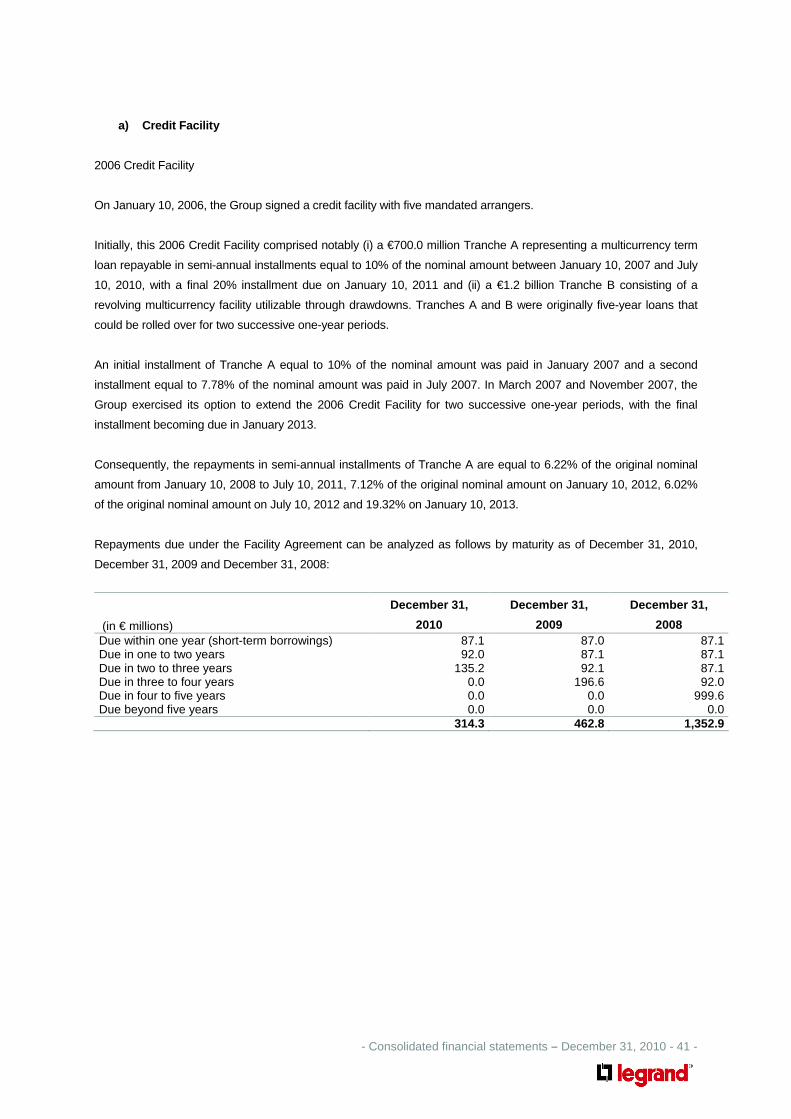
- Consolidated financial statements – December 31, 2010 - 41 -
a) Credit Facility
2006 Credit Facility
On January 10, 2006, the Group signed a credit facility with five mandated arrangers.
Initially, this 2006 Credit Facility comprised notably (i) a €700.0 million Tranche A representing a multicurrency term
loan repayable in semi-annual installments equal to 10% of the nominal amount between January 10, 2007 and July
10, 2010, with a final 20% installment due on January 10, 2011 and (ii) a €1.2 billion Tranche B consisting of a
revolving multicurrency facility utilizable through drawdowns. Tranches A and B were originally five-year loans that
could be rolled over for two successive one-year periods.
An initial installment of Tranche A equal to 10% of the nominal amount was paid in January 2007 and a second
installment equal to 7.78% of the nominal amount was paid in July 2007. In March 2007 and November 2007, the
Group exercised its option to extend the 2006 Credit Facility for two successive one-year periods, with the final
installment becoming due in January 2013.
Consequently, the repayments in semi-annual installments of Tranche A are equal to 6.22% of the original nominal
amount from January 10, 2008 to July 10, 2011, 7.12% of the original nominal amount on January 10, 2012, 6.02%
of the original nominal amount on July 10, 2012 and 19.32% on January 10, 2013.
Repayments due under the Facility Agreement can be analyzed as follows by maturity as of December 31, 2010,
December 31, 2009 and December 31, 2008:
(in € millions)
December 31,
2010
December 31,
2009
December 31,
2008 Due within one year (short-term borrowings) 87.1 87.0 87.1 Due in one to two years 92.0 87.1 87.1 Due in two to three years 135.2 92.1 87.1 Due in three to four years 0.0 196.6 92.0 Due in four to five years 0.0 0.0 999.6 Due beyond five years 0.0 0.0 0.0 314.3 462.8 1,352.9
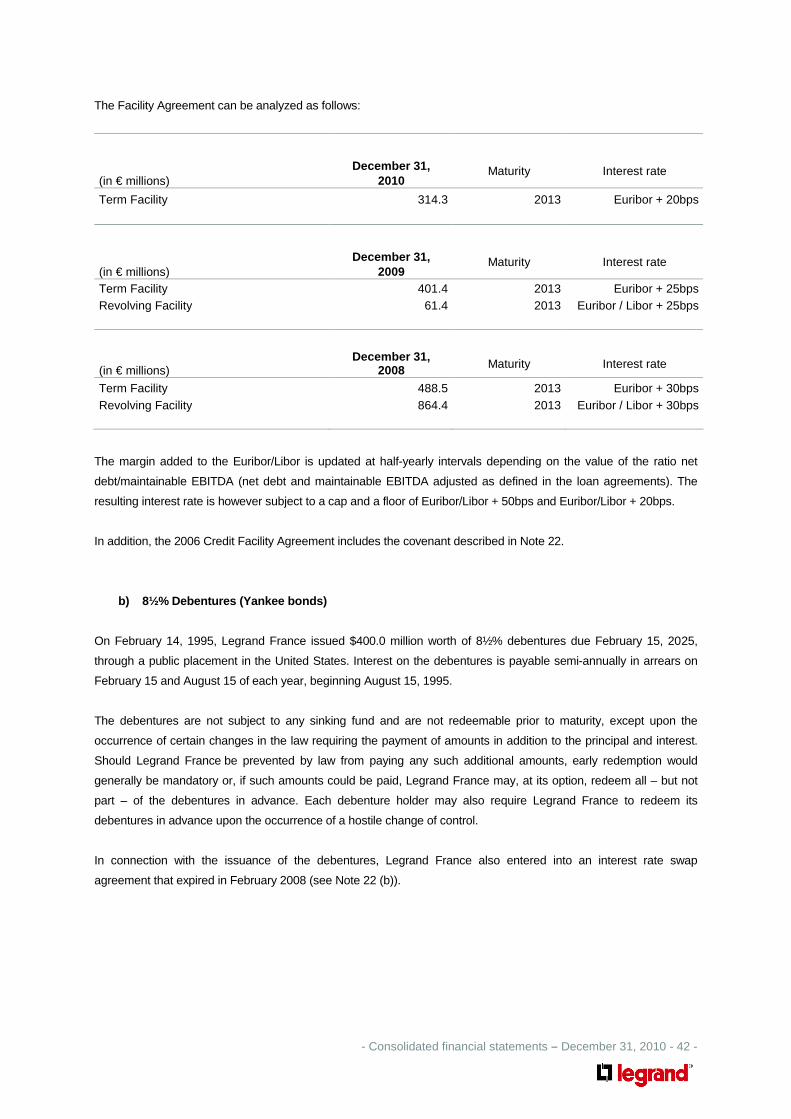
- Consolidated financial statements – December 31, 2010 - 42 -
The Facility Agreement can be analyzed as follows:
(in € millions) December 31,
2010 Maturity Interest rate
Term Facility 314.3 2013 Euribor + 20bps
(in € millions) December 31,
2009 Maturity Interest rate
Term Facility 401.4 2013 Euribor + 25bps Revolving Facility 61.4 2013 Euribor / Libor + 25bps
(in € millions) December 31,
2008 Maturity Interest rate
Term Facility 488.5 2013 Euribor + 30bps Revolving Facility 864.4 2013 Euribor / Libor + 30bps
The margin added to the Euribor/Libor is updated at half-yearly intervals depending on the value of the ratio net
debt/maintainable EBITDA (net debt and maintainable EBITDA adjusted as defined in the loan agreements). The
resulting interest rate is however subject to a cap and a floor of Euribor/Libor + 50bps and Euribor/Libor + 20bps.
In addition, the 2006 Credit Facility Agreement includes the covenant described in Note 22.
b) 8½% Debentures (Yankee bonds)
On February 14, 1995, Legrand France issued $400.0 million worth of 8½% debentures due February 15, 2025,
through a public placement in the United States. Interest on the debentures is payable semi-annually in arrears on
February 15 and August 15 of each year, beginning August 15, 1995.
The debentures are not subject to any sinking fund and are not redeemable prior to maturity, except upon the
occurrence of certain changes in the law requiring the payment of amounts in addition to the principal and interest.
Should Legrand France be prevented by law from paying any such additional amounts, early redemption would
generally be mandatory or, if such amounts could be paid, Legrand France may, at its option, redeem all – but not
part – of the debentures in advance. Each debenture holder may also require Legrand France to redeem its
debentures in advance upon the occurrence of a hostile change of control.
In connection with the issuance of the debentures, Legrand France also entered into an interest rate swap
agreement that expired in February 2008 (see Note 22 (b)).

- Consolidated financial statements – December 31, 2010 - 43 -
c) Bank borrowings
As of December 31, 2010, bank borrowings comprised:
• a €220.0 million loan obtained on May 21, 2007 from a pool of French financial institutions. The loan is for a
period of six years and four months, expiring September 21, 2013, and pays interest at the three-month
Euribor plus 45 bps,
• a €62.5 million loan obtained on March 12, 2009 from a pool of French financial institutions. The loan is for
a period of five years, expiring March 12, 2014, and pays interest at the three-month Euribor plus 210 bps.
Bank borrowing is subject to the covenant described in Note 22.
d) Bonds
In February 2010, the Group carried out a €300.0 million 4.25% seven-year bond issue. The bonds will be
redeemable at maturity on February 24, 2017.
e) Unused credit lines
As of December 31, 2010, the Group had access to drawdown capacity of €1,200.0 million on Tranche B (revolving
facility) of the 2006 Credit Facility.

- Consolidated financial statements – December 31, 2010 - 44 -
14) Provisions
Changes in provisions are as follows:
(in € millions)
December 31,
2010
December 31,
2009 At beginning of period 171.5 138.2 Changes in scope of consolidation 0.0 0.0 Increases 87.2 86.0 Utilizations (30.6) (33.7) Reversals of surplus provisions (29.4) (26.1) Transfers to current liabilities 0.0 0.0 Reclassifications (2.1) 0.6 Translation adjustments 8.8 6.5 At end of period 205.4 171.5 Of which non-current portion 91.6 63.6
15) Pension and other post-employment benefit oblig ations (Note 1 (q))
(in € millions)
December 31,
2010
December 31,
2009
December 31,
2008
Non-current portion
France (Note 15 (b)) 56.6 46.9 50.4 Italy (Note 15 (c)) 36.6 39.8 49.4 United States and United Kingdom (Note 15 (d)) 31.1 32.0 32.7 Other countries 12.6 10.2 11.6
136.9 128.9 144.1
Current portion
France (Note 15 (b)) 0.0 0.0 0.0 Italy (Note 15 (c)) 5.0 5.0 5.0 United States and United Kingdom (Note 15 (d)) 1.5 1.2 1.2 Other countries 0.6 0.9 0.2
7.1 7.1 6.4
144.0 136.0 150.5
The total amount of those liabilities is €144.0 million as of December 31, 2010 (December 31, 2009: €136.0 million;
December 31, 2008: €150.5 million) and is analyzed in Note 15 (a), which shows total liabilities of €278.1 million as of
December 31, 2010 (December 31, 2009: €247.9 million; December 31, 2008: €240.5 million) less total assets of
€124.4 million as of December 31, 2010 (December 31, 2009: €111.9 million; December 31, 2008: €89.9 million),
adjusted for an unrecognized past service cost of €9.7 million.
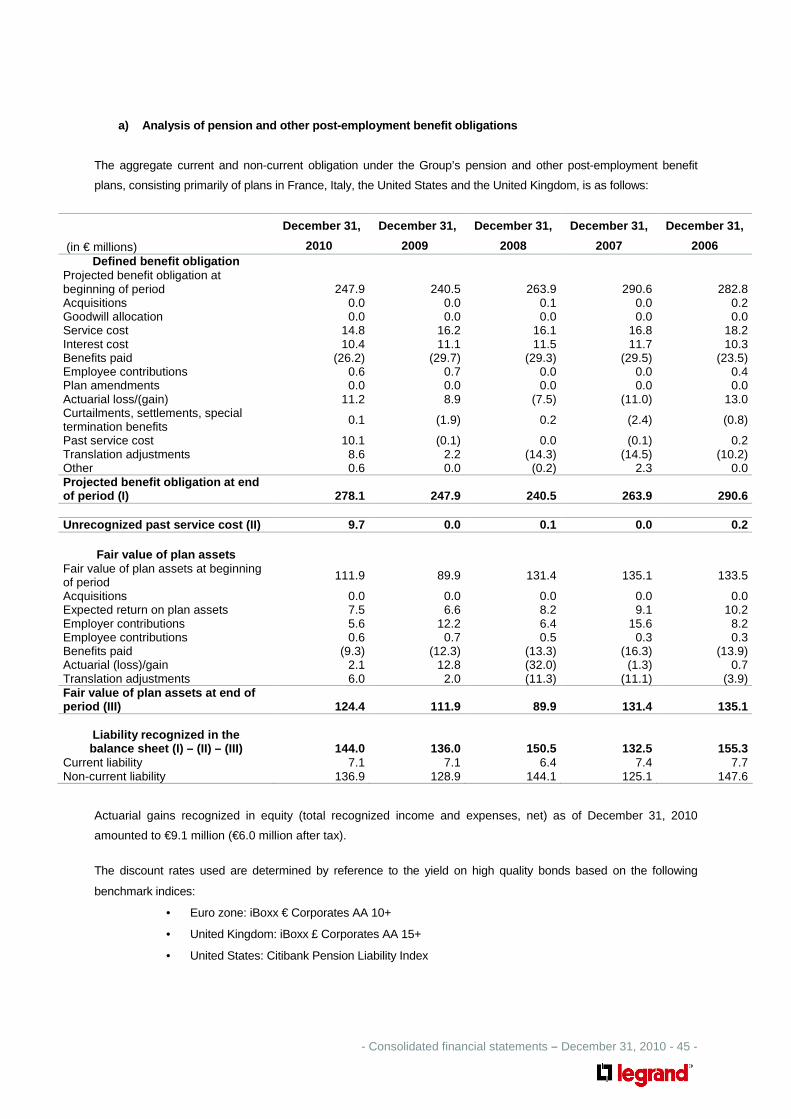
- Consolidated financial statements – December 31, 2010 - 45 -
a) Analysis of pension and other post-employment be nefit obligations
The aggregate current and non-current obligation under the Group’s pension and other post-employment benefit
plans, consisting primarily of plans in France, Italy, the United States and the United Kingdom, is as follows:
(in € millions)
December 31,
2010
December 31,
2009
December 31,
2008
December 31,
2007
December 31,
2006 Defined benefit obligation
Projected benefit obligation at beginning of period 247.9 240.5 263.9 290.6 282.8 Acquisitions 0.0 0.0 0.1 0.0 0.2 Goodwill allocation 0.0 0.0 0.0 0.0 0.0 Service cost 14.8 16.2 16.1 16.8 18.2 Interest cost 10.4 11.1 11.5 11.7 10.3 Benefits paid (26.2) (29.7) (29.3) (29.5) (23.5) Employee contributions 0.6 0.7 0.0 0.0 0.4 Plan amendments 0.0 0.0 0.0 0.0 0.0 Actuarial loss/(gain) 11.2 8.9 (7.5) (11.0) 13.0 Curtailments, settlements, special termination benefits 0.1 (1.9) 0.2 (2.4) (0.8)
Past service cost 10.1 (0.1) 0.0 (0.1) 0.2 Translation adjustments 8.6 2.2 (14.3) (14.5) (10.2) Other 0.6 0.0 (0.2) 2.3 0.0 Projected benefit obligation at end of period (I) 278.1 247.9 240.5 263.9 290.6 Unrecognized past service cost (II) 9.7 0.0 0.1 0.0 0.2
Fair value of plan assets Fair value of plan assets at beginning of period 111.9 89.9 131.4 135.1 133.5
Acquisitions 0.0 0.0 0.0 0.0 0.0 Expected return on plan assets 7.5 6.6 8.2 9.1 10.2 Employer contributions 5.6 12.2 6.4 15.6 8.2 Employee contributions 0.6 0.7 0.5 0.3 0.3 Benefits paid (9.3) (12.3) (13.3) (16.3) (13.9) Actuarial (loss)/gain 2.1 12.8 (32.0) (1.3) 0.7 Translation adjustments 6.0 2.0 (11.3) (11.1) (3.9) Fair value of plan assets at end of period (III) 124.4 111.9 89.9 131.4 135.1
Liability recognized in the balance sheet (I) – (II) – (III) 144.0 136.0 150.5 132.5 155.3
Current liability 7.1 7.1 6.4 7.4 7.7 Non-current liability 136.9 128.9 144.1 125.1 147.6
Actuarial gains recognized in equity (total recognized income and expenses, net) as of December 31, 2010
amounted to €9.1 million (€6.0 million after tax).
The discount rates used are determined by reference to the yield on high quality bonds based on the following
benchmark indices:
• Euro zone: iBoxx € Corporates AA 10+
• United Kingdom: iBoxx £ Corporates AA 15+
• United States: Citibank Pension Liability Index

- Consolidated financial statements – December 31, 2010 - 46 -
Sensitivity tests were performed on the discount rates applied and on the expected return on plan assets. According
to the results of these tests, a 50-basis point decline in discount rates and in the expected return on plan assets
would lead to the recognition of additional actuarial losses of around €14.0 million and would increase in proportion
the value of the defined obligation as of December 31, 2010.
The impact on profit is as follows:
(in € millions)
December 31,
2010
December 31,
2009
December 31,
2008 Service cost – rights acquired during the period (14.8) (16.2) (16.1) Service cost – cancellation of previous rights 0.0 0.0 0.0 Benefits paid (net of cancellation of liability recognized in prior periods) 0.0 0.0 0.0 Interest cost (10.4) (11.1) (11.5) Other (0.5) 2.0 (0.2) Expected return on plan assets 7.5 6.6 8.2 (18.2) (18.7) (19.6)
The weighted-average allocation of pension plan assets is as follows as of December 31, 2010:
(as a percentage) France
United States and United Kingdom Weighted total
Equity instruments 0.0 54.5 47.6 Debt instruments 0.0 40.6 35.4 Insurance funds 100.0 4.9 17.0 100.0 100.0 100.0
b) Provisions for retirement benefits and supplemen tary pension benefits in France
The provisions recorded in the consolidated balance sheet concern the unvested entitlements of active employees.
The Group has no obligation with respect to the vested entitlements of former employees, as the benefits were
settled at the time of their retirement, either directly or through payments to insurance companies in full discharge of
the liability.
In France, provisions recorded in the consolidated balance sheet amount to €56.6 million as of December 31, 2010
(December 31, 2009: €46.9 million; December 31, 2008: €50.4 million), corresponding to the difference between the
projected benefit obligation of €81.0 million as of December 31, 2010 (December 31, 2009: €61.6 million; December
31, 2008: €61.4 million) and the fair value of the related plan assets of €14.7 million as of December 31, 2010
(December 31, 2009: €14.7 million; December 31, 2008: €10.9 million), adjusted for an unrecognized past service
cost of €9.7 million.
Past service cost represents the increase in the present value of pension liabilities, in respect of employee service in
prior periods. It results from the June 21, 2010 addendum to the collective labor agreement for French metal
industries (‘Convention Collective de la Métallurgie’). For each French entity, past service cost is amortized on a
straight-line basis over the average period until the amended benefits become vested.
The projected benefit obligation is computed on the basis of staff turnover and mortality assumptions, estimated
rates of salary increases and an estimated discount rate. In France, the calculation was based on a salary increase
rate of 3.0%, a discount rate of 4.5% (3.0% and 5.0% in 2009, 2.5% and 5.6% in 2008) and an expected return on
plan assets of 3.8% (2009 and 2008: 4.0%). The provisions recorded in the consolidated balance sheet correspond
- Consolidated financial statements – December 31, 2010 - 47 -
to the portion of the total obligation remaining payable by the Group; this amount is equal to the difference between
the total obligation recalculated at each balance sheet date, based on the actuarial assumptions described above,
and the net residual value of the plan assets at that date.
The recent increase in the statutory retirement age in France had no material impact on the calculation of benefit
obligations as of December 31, 2010.
c) Provisions for termination benefits in Italy
The changes introduced in the Italian Act no.296 dated December 27, 2006 came into effect on January 1, 2007.
From this date, Italian termination benefit plans (Trattamento di fine rapporto, TFR) are qualified as defined
contribution plans under IFRS.
Termination benefit obligations arising prior to January 1, 2007 continue to be accounted for under IFRS as defined
benefit plans, but based on revised actuarial estimates that exclude the effect of future salary increases. Actuarial
gains and losses previously recognized in the statement of recognized income and expense have been reclassified
in retained earnings, in accordance with IAS 19 (revised), paragraph 93A s.
The resulting provisions for termination benefits amount to €41.6 million as of December 31, 2010 (December 31,
2009: €44.8 million; December 31, 2008: €54.4 million).
d) Provisions for retirement benefits and other pos t-employment benefits in the United States and
the United Kingdom
In the United States and the United Kingdom, the Group provides pension benefits for employees and health care
and life insurance for certain retired employees.
The provisions recorded in the consolidated balance sheet amounted to €32.6 million as of December 31, 2010
(December 31, 2009: €33.2 million; December 31, 2008: €33.9 million), corresponding to the difference between the
projected benefit obligation of €133.6 million (December 31, 2009: €123.4 million; December 31, 2008: €110.0
million) and the fair value of the related plan assets of €101.0 million (December 31, 2009: €90.2 million; December
31, 2008: €76.1 million).
The projected benefit obligation is computed on the basis of staff turnover and mortality assumptions, estimated
rates of salary increases and an estimated discount rate. In the United Sates, the calculation was based on a salary
increase rate of 3.5%, a discount rate of 4.9% (3.5% and 5.3% in 2009, 3.5% and 6.3% in 2008) and an expected
return on plan assets of 7.5% (7.5% in 2009 and 2008). In the United Kingdom, the calculation was based on a
salary increase rate of 4.4%, a discount rate of 5.4% (4.6% and 5.7% in 2009, 3.8% and 6.4% in 2008), and an
expected return on plan assets of 6.3% (6.6% in 2009; 6.7% in 2008).

- Consolidated financial statements – December 31, 2010 - 48 -
16) Short-term borrowings (Note 1 (t))
(in € millions)
December 31,
2010
December 31,
2009
December 31,
2008 Facility Agreement 87.1 87.0 87.1 Commercial paper 0.0 105.0 11.7 Other borrowings 129.7 253.5 302.5 216.8 445.5 401.3
17) Other current liabilities
(in € millions)
December 31,
2010
December 31,
2009
December 31,
2008 Tax liabilities 68.5 65.5 64.5 Accrued employee benefits expense 166.8 153.4 156.1 Current portion of statutory and discretionary profit-sharing reserve 35.7 29.9 31.5 Payables related to fixed asset purchases 14.2 12.9 16.9 Accrued expenses 70.2 70.8 70.1 Accrued interest 27.6 19.2 38.6 Deferred revenue 15.8 16.2 10.2 Current portion of pension and other post-employment benefit obligations 7.1 7.1 6.4 Other current liabilities 37.3 32.7 38.2 443.2 407.7 432.5
18) Analysis of certain expenses
a) Analysis of operating expenses
Operating expenses include the following categories of costs:
(in € millions)
December 31,
2010
December 31,
2009
December 31,
2008 Raw materials and component costs (1,125.7) (1,019.6) (1,276.0) Salaries and payroll taxes (980.9) (936.0) (1,049.3) Employee profit-sharing (38.0) (29.7) (32.7) Total personnel costs (1,018.9) (965.7) (1,082.0) Depreciation expense (120.2) (126.5) (136.1) Amortization expense (71.3) (77.8) (81.0)
As of December 31, 2010 the Group had 29,422 employees on the payroll (December 31, 2009: 28,314; December
31, 2008: 31,596).
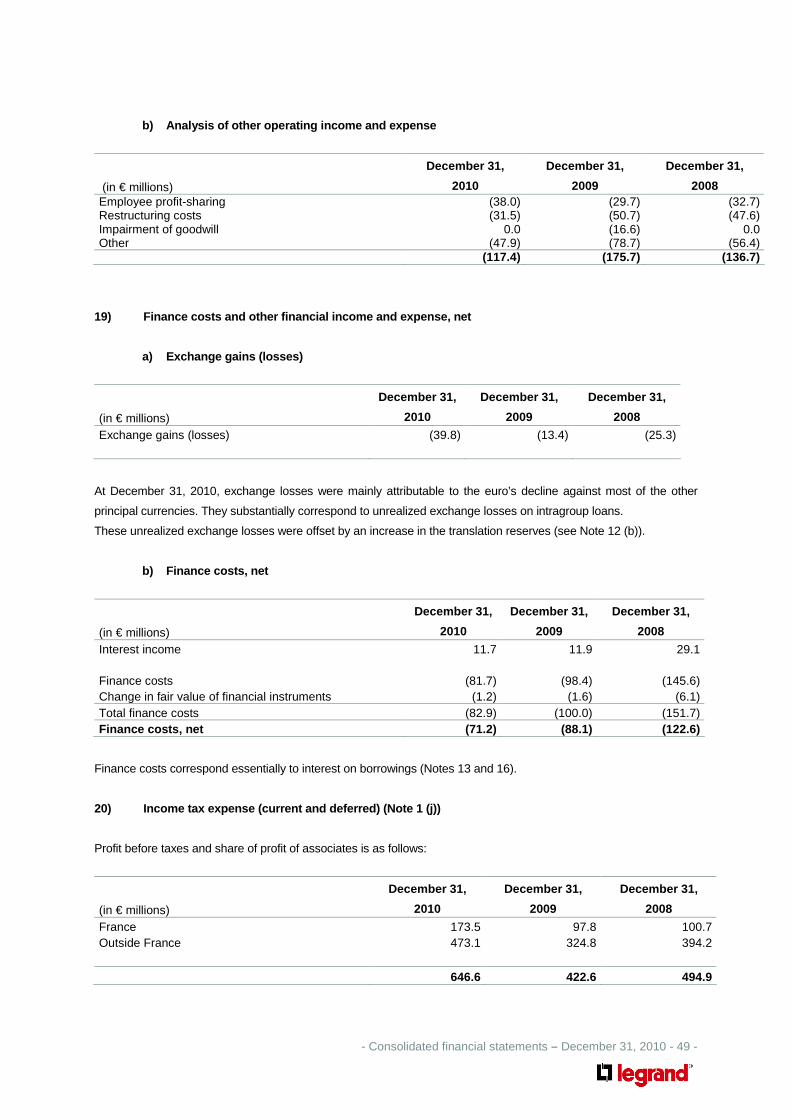
- Consolidated financial statements – December 31, 2010 - 49 -
b) Analysis of other operating income and expense
(in € millions)
December 31,
2010
December 31,
2009
December 31,
2008 Employee profit-sharing (38.0) (29.7) (32.7) Restructuring costs (31.5) (50.7) (47.6) Impairment of goodwill 0.0 (16.6) 0.0 Other (47.9) (78.7) (56.4) (117.4) (175.7) (136.7)
19) Finance costs and other financial income and ex pense, net
a) Exchange gains (losses)
(in € millions)
December 31,
2010
December 31,
2009
December 31,
2008
Exchange gains (losses) (39.8) (13.4) (25.3)
At December 31, 2010, exchange losses were mainly attributable to the euro’s decline against most of the other
principal currencies. They substantially correspond to unrealized exchange losses on intragroup loans.
These unrealized exchange losses were offset by an increase in the translation reserves (see Note 12 (b)).
b) Finance costs, net
(in € millions)
December 31,
2010
December 31,
2009
December 31,
2008
Interest income 11.7 11.9 29.1 Finance costs (81.7) (98.4) (145.6) Change in fair value of financial instruments (1.2) (1.6) (6.1) Total finance costs (82.9) (100.0) (151.7) Finance costs, net (71.2) (88.1) (122.6)
Finance costs correspond essentially to interest on borrowings (Notes 13 and 16).
20) Income tax expense (current and deferred) (Note 1 (j))
Profit before taxes and share of profit of associates is as follows:
(in € millions)
December 31,
2010
December 31,
2009
December 31,
2008
France 173.5 97.8 100.7 Outside France 473.1 324.8 394.2 646.6 422.6 494.9

- Consolidated financial statements – December 31, 2010 - 50 -
Income tax expense consists of the following:
(in € millions)
December 31,
2010
December 31,
2009
December 31,
2008
Current taxes: France (77.2) (41.6) (38.3) Outside France (150.5) (123.1) (136.5) (227.7) (164.7) (174.8) Deferred taxes: France 4.1 24.2 16.4 Outside France (3.5) 9.2 15.0 0.6 33.4 31.4 Total income tax expense: France (73.1) (17.4) (21.9) Outside France (154.0) (113.9) (121.5) (227.1) (131.3) (143.4)
The reconciliation of total income tax expense for the period to income tax calculated at the standard tax rate in
France is as follows:
(Tax rate)
December 31,
2010
December 31,
2009
December 31,
2008 Standard French income tax rate 34.43% 34.43% 34.43% Increases (reductions): - Effect of foreign income tax rates (4.16%) (3.82%) (3.83%) - Non-taxable items 1.77% 1.45% 1.09% - Income taxable at specific rates 1.10% 1.25% 1.20% - Other 1.60% (1.24%) (3.86%) 34.74% 32.07% 29.03% Impact on deferred taxes of: - Changes in tax rates 0.20% 0.05% 0.01% - Recognition or non-recognition of deferred tax assets 0.18% (1.05%) (0.07%) Effective tax rate 35.12% 31.07% 28.97%
In accordance with the recommendation of the French National Accounting Board (Conseil National de la
Comptabilité - CNC), the Group has elected to recognize France’s CVAE tax on the value added by the business
under “Income tax expense” in the statement of income as from January 1, 2010.
In 2010, the CVAE tax and the deferred tax impact of electing to recognize the CVAE tax in income tax expense
were recorded under “Other” in an amount of €10.2 million. Excluding this amount, the effective tax rate would have
been 33.54%.

- Consolidated financial statements – December 31, 2010 - 51 -
Deferred taxes recorded in the balance sheet result from temporary differences between the carrying amount of
assets and liabilities and their tax base and can be analyzed as follows:
(in € millions)
December 31,
2010
December 31,
2009
December 31,
2008 Deferred taxes recorded by French companies (330.5) (336.6) (360.3) Deferred taxes recorded by foreign companies (212.9) (206.3) (202.2) (543.4) (542.9) (562.5) Origin of deferred taxes: - Depreciation of fixed assets (84.4) (71.4) (79.6) - Tax loss carryforwards 1.5 7.7 5.3 - Statutory profit-sharing 4.0 4.8 4.9 - Pensions and other post-employment benefits 21.1 16.7 21.0 - Developed technology (3.9) (9.6) (19.3) - Trademarks (535.0) (534.2) (531.8) - Impairment losses on inventories and receivables 30.0 27.2 22.1 - Fair value adjustments to derivative instruments (4.7) (5.0) (5.3) - Translation adjustments 0.1 2.1 0.1 - Other provisions 65.6 52.9 47.5 - Margin on inventories 16.2 13.2 16.4 - Other (53.9) (47.3) (43.8) (543.4) (542.9) (562.5) - Of which deferred tax assets 90.1 82.1 76.4 - Of which deferred tax liabilities (633.5) (625.0) (638.9)
Short and long-term deferred taxes can be analyzed as follows:
(in € millions)
December 31,
2010
December 31,
2009
December 31,
2008 Deferred taxes – short term 78.6 73.0 62.5 Deferred taxes – long term (622.0) (615.9) (625.0) (543.4) (542.9) (562.5)
Tax losses carried forward broke down as follows:
(in € millions)
December 31,
2010
December 31,
2009
December 31,
2008 Net recognized operating losses carried forward 5.8 29.0 21.5 Recognized deferred tax assets 1.5 7.7 5.3 Net unrecognized operating losses carried forward 94.0 85.0 95.1 Unrecognized deferred tax assets 26.8 24.0 27.7 Total net operating losses carried forward 99.8 114.0 116.6
The recognized deferred tax assets are expected to be utilized no later than five years from the period-end.
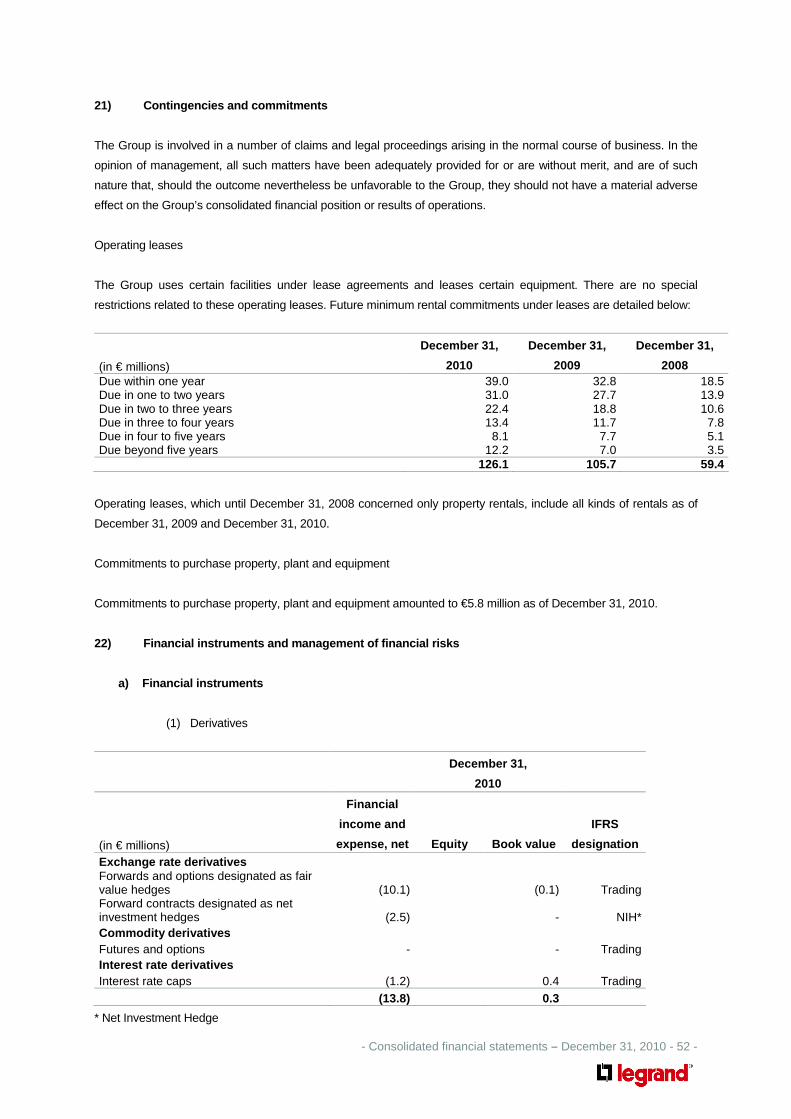
- Consolidated financial statements – December 31, 2010 - 52 -
21) Contingencies and commitments
The Group is involved in a number of claims and legal proceedings arising in the normal course of business. In the
opinion of management, all such matters have been adequately provided for or are without merit, and are of such
nature that, should the outcome nevertheless be unfavorable to the Group, they should not have a material adverse
effect on the Group’s consolidated financial position or results of operations.
Operating leases
The Group uses certain facilities under lease agreements and leases certain equipment. There are no special
restrictions related to these operating leases. Future minimum rental commitments under leases are detailed below:
(in € millions)
December 31,
2010
December 31,
2009
December 31,
2008 Due within one year 39.0 32.8 18.5 Due in one to two years 31.0 27.7 13.9 Due in two to three years 22.4 18.8 10.6 Due in three to four years 13.4 11.7 7.8 Due in four to five years 8.1 7.7 5.1 Due beyond five years 12.2 7.0 3.5 126.1 105.7 59.4
Operating leases, which until December 31, 2008 concerned only property rentals, include all kinds of rentals as of
December 31, 2009 and December 31, 2010.
Commitments to purchase property, plant and equipment
Commitments to purchase property, plant and equipment amounted to €5.8 million as of December 31, 2010.
22) Financial instruments and management of financi al risks
a) Financial instruments
(1) Derivatives
December 31,
2010
(in € millions)
Financial
income and
expense, net Equity Book value
IFRS
designation
Exchange rate derivatives Forwards and options designated as fair value hedges (10.1) (0.1) Trading Forward contracts designated as net investment hedges (2.5) - NIH* Commodity derivatives Futures and options - - Trading Interest rate derivatives Interest rate caps (1.2) 0.4 Trading
(13.8) 0.3
* Net Investment Hedge

- Consolidated financial statements – December 31, 2010 - 53 -
All financial instruments are classified in Level 2 of the fair value hierarchy described in Note 1 l) (a).
(2) Impact of financial instruments
December 31,
2010
Impact on equity
(in € millions)
Impact on financial
income and
expense, net Fair value
Translation
adjustment Other Trade receivables - Trade payables - Borrowings (65.0) (21.6) Derivatives (13.8) -
(78.8) (21.6)
Debentures denominated in US dollars (“Yankee bonds”) are designated as hedges of the foreign currency risk
associated with the net investment in the United States (see discussion of net investment hedges in Note 1 (l)).
(3) Breakdown of balance sheet items by type of financial instrument
December 31,
2010
December
31,
2009
Type of financial instrument
(in € millions)
Carrying
amount
Fair
value
Instruments
designated at fair
value through profit
or loss
Receivables,
payables and
borrowings at
amortized cost Derivatives
Carrying
amount ASSETS
Current assets
Trade receivables 496.4 496.4 496.4 501.1 Other current financial assets 0.6 0.6 0.6 0.6 Total current assets 497.0 497.0 496.4 0.6 501.7 EQUITY AND LIABILITIES Current liabilities Short-term borrowings 216.8 216.8 216.8 445.5 Trade payables 432.0 432.0 432.0 357.7 Other current financial liabilities 0.3 0.3 0.3 0.3
Total current liabilities 649.1 649.1 648.8 0.3 803.5 Non-current liabilities Long-term borrowings 1,213.0 1,217.7 1,213.0 1,067.8
Total non-current liabilities 1,213.0 1,217.7 1,213.0 1,067.8

- Consolidated financial statements – December 31, 2010 - 54 -
b) Management of financial risks
The Group’s cash management strategy is based on overall financial risk management principles and involves taking
specific measures to manage the risks associated with interest rates, exchange rates, commodity prices and the
investment of available cash. The Group does not conduct any trading in financial instruments, in line with its policy
of not carrying out any speculative transactions. All transactions involving derivative financial instruments are
conducted with the sole purpose of managing interest rate, exchange rate and commodity risks and as such are
limited in duration and value.
This strategy is centralized at Group level. Its implementation is deployed by the Financing and Treasury Department
who recommends appropriate measures and implements them after they have been validated by the Corporate
Finance Department and Group senior management. A detailed reporting system has been set up to permit
permanent close tracking of the Group's positions and effective oversight of the management of the financial risks
described in this note.
Current financial assets and liabilities are measured based on observable market data and are as follows:
(in € millions)
December 31,
2010
December 31,
2009
December 31,
2008 Other current financial assets 0.6 0.6 5.0 Swaps 0.0 0.0 0.0 Financial derivatives with a positive fair value 0.6 0.6 5.0 Other current financial liabilities 0.3 0.3 0.0 Swaps 0.0 0.0 0.0 Financial derivatives with a negative fair value 0.3 0.3 0.0
(1) Interest rate risk
As part of an interest rate risk management policy aimed principally at managing the risk of a rate increase, the
Group has structured its debt into a combination of fixed and variable rate financing.
As of December 31, 2010 the breakdown of debt (excluding debt issuance costs) between fixed and variable rate is
as follows:
(in € millions)
December 31,
2010
Fixed rates 638.6 Variable rates 794.2

- Consolidated financial statements – December 31, 2010 - 55 -
The following table analyzes variable rate financial assets and liabilities based on the frequency of rate
adjustments.
(in € millions)
Overnight and
short-term
Medium-term
(1 to 5 years)
Long-term (more
than 5 years)
Gross debt (excluding debt issuance costs) 794.2 - - Cash and marketable securities (232.3) - - Net debt 561.9 - - Hedges 700.0 - - Position after hedging (138.1) - -
Interest rate risk arises mainly from variable-rate financial assets and liabilities and is managed primarily through
the use of hedging instruments.
Based on average debt in 2010 and the hedging instruments described below, the Group estimates that a 100-
basis point increase in interest rates on variable-rate debt should not result in a decrease in annual profit before
taxes of more than €6.1 million (2009: €4.9 million; 2008: €11.0 million).
Caps
Variable-rate debt is hedged by interest-rate instruments with maturities of no more than three years. These
contracts are mainly caps, in line with the Group’s policy of setting an upper limit on interest rates while retaining the
opportunity to benefit from more favorable rate changes.
The portfolio of caps on euro-denominated debt breaks down as follows:
December 31,
2010
Period covered
Notional amount
(in € millions) Benchmark rate
Average guaranteed rate including
premium January 2011 – March 2011 700.0 3-month Euribor 3.24% April 2011 – March 2012 550.0 3-month Euribor 3.75% April 2012 – March 2013 350.0 3-month Euribor 3.57%
The caps do not fulfill the criteria for the application of hedge accounting under IAS 39 and have therefore been
measured at fair value and recognized in ‘Other current financial assets’, in an amount of €0.4 million as of
December 31, 2010 (December 31, 2009: €0.6 million; December 31, 2008: €1.0 million). The effect of changes in
fair value on consolidated profit was a €1.2 million loss in 2010 (2009: €1.6 million loss; 2008: €6.4 million loss),
recognized in ‘Finance costs and other financial income and expense, net’ (Note 19 (b)).
Interest rate swaps on the 8½% debentures (Yankee b onds) (Note 13)
The Group also entered into an interest rate swap with selected major financial institutions to hedge interest rate
risks on the 8½% debentures. The fair value of this swap was determined at each balance sheet date, based on
rates implied in the yield curve at the reporting date; these implied rates could change, with an impact on cash flows.

- Consolidated financial statements – December 31, 2010 - 56 -
The swap expired at the end of February 2008, in line with the April 2003 novation agreement under which the
Group sold the tranche corresponding to the contract's 2008-2025 maturities. When the swap expired, refinancing of
€86.0 million was arranged, corresponding to the Group's liability under the currency swap component.
Since February 2008, when the swap expired, the Group has once again been paying a fixed rate of 8½%.
Further interest rate swaps may be set up in the future, based on changes in market conditions.
(2) Currency risk
The Group operates in international markets and is therefore exposed to risks through its use of several different
currencies.
The table below presents financial assets (cash and marketable securities) and financial liabilities (short-term and
long-term borrowings) by currency as of December 31, 2010:
(in € millions)
Financial assets
Cash and marketable
securities
Financial liabilities
(before debt issuance
costs)
Euro 51.3 923.9
US dollar 70.3 354.5
Other currencies 110.7 154.4
232.3 1,432.8
Natural hedges are set up by matching allocation of net debt and operating profit in each of the Group’s operating
currencies.
If required, when acquisition of an asset is financed using a currency other than the functional currency of the
country, the Group may enter into forward-contracts to hedge its exchange rate risk. As of December 31, 2010 the
Group has set up forward contracts in Brazilian real and Australian dollar which have a net fair value of €0.1 million.
The table below presents the breakdown of net sales and operating expenses by currency as of December 31, 2010:
(in € millions)
Net sales
Operating expenses
(excluding purchase
accounting adjustments
relating to the
acquisition)
Euro 2,029.6 52.2% 1,552.9 50.0%
US dollar 571.7 14.7% 485.0 15.6%
Other currencies 1,289.2 33.1% 1,068.5 34.4%
3,890.5 100% 3,106.4 100%
Natural hedges are set up by matching costs and operating income in each of the Group’s operating currencies.

- Consolidated financial statements – December 31, 2010 - 57 -
Residual amounts are hedged by options to limit the Group’s exposure to fluctuations in the main currencies
concerned. These hedges are for periods of less than 18 months. They do not fulfill the criteria for the application of
hedge accounting under IAS 39 and have therefore been measured at fair value and recognized in ‘Other current
financial assets’, or at a value of zero as of December 31, 2010 (December 31, 2009: €0.0 million; December 31,
2008: €4.0 million). Changes in these hedges’ fair value are recognized in ‘Exchange gains (losses)’ (Note 19 (a)). It
did not have any impact in 2010 (2009: €0.0 million; 2008: €5.4 million gain).
The Group estimates that, all other things being equal, a 10% increase in the exchange rate of the euro against all
other currencies applied to 2010 figures would have resulted in a decrease in net revenue of approximately €169.2
million and a decrease in operating profit of approximately €27.2 million.
In the same way, such increase applied to 2009 and 2008 figures would have resulted in a decrease in net revenue
of approximately €142.0 million in 2009 and €163.0 million in 2008 and a decrease in operating profit of
approximately €19.0 million respectively in 2009 and €20.0 million in 2008.
(3) Commodity risk
The Group is exposed to commodity risk arising from changes in the price of raw materials.
Raw materials purchases amounted to around €410.0 million in 2010 (2009: €351.0 million; 2008: €483.0 million).
A 10% increase in the price of all the raw materials used by the Group would theoretically feed through to around a
€41.0 million increase in annual purchasing costs. The Group believes that it could, circumstances permitting; raise
the prices of its products in the short term to offset the overall adverse impact of any such increases.
Additionally, the Group can set up specific derivative financial instruments (options) for limited amounts and periods
to hedge part of the risk of an unfavorable change in copper and certain other raw material prices.
The Group entered into such hedging contracts during the period that expired in December 2010.
(4) Credit risk
Credit risk covers both:
- Risks related to outstanding customer receivables.
- Counterparty risks with financial institutions.
As explained in note 7, a substantial portion of Group revenue is generated with two major distributors. Other
revenue is essentially derived from distributors of electrical products but sales are diversified due to the large number
of customers and their geographic dispersion. The Group actively manages its credit risk by establishing regularly
reviewed individual credit limits for each customer, constantly monitoring collection of its outstanding receivables and
systematically chasing up past due receivables. In addition, the situation is reviewed regularly with the Corporate
Finance Department.
Financial instruments that may potentially expose the Group to counterparty risk are principally cash equivalents,
short-term investments and hedging instruments. These assets are placed with leading financial institutions
approved by the Group, which constantly monitors the amount of credit exposure with any one financial institution.

- Consolidated financial statements – December 31, 2010 - 58 -
(5) Liquidity risk
The Group considers that managing liquidity risk depends primarily on having access to diversified sources of
financing as to their origin and maturity. This approach represents the basis of the Group’s financing policy.
The total amount of net debt (€1,197.5 million as of December 31, 2010) is fully financed by financing facilities
expiring at the earliest in 2013 (including undrawn lines of credit) and at the latest in 2025.
Under the provisions of the 2006 Credit Facility described in Note 13 (a) and the loan agreement for the bank loan
described in Note 13 (c), consolidated adjusted net debt/adjusted maintainable EBITDA (net debt and maintainable
EBITDA adjusted as defined in the loan agreements) must be less than or equal to 3.50 at the end of every six-
month period. This ratio is tracked monthly; as of December 31, 2010 it stood at 1.21.
Finally, the Group's debt ratings are as of December 31, 2010:
Rating agency Long term debt Outlook
S&P BBB Positive credit watch
23) Information relating to corporate officers
a) Short-term benefits
(in € millions)
December 31,
2010
December 31,
2009
December 31,
2008
Advances and loans to corporate officers 0.0 0.0 0.0 Compensation paid to corporate officers* 2.2 1.8 2.3
* Compensation paid during the base year to executive officers and members of the Board of Directors who hold
operating responsibilities within the Group.
Compensation paid includes all variable compensation payable at the beginning of the year in relation to the
achievement of targets for the previous year.

- Consolidated financial statements – December 31, 2010 - 59 -
b) Remuneration and benefits due on termination of corporate office’s position
Employment
contract
Supplementary
pension
entitlement (1)
Indemnities or
benefits due or
which may
become due as a
result of
termination or
change of
office (3)
Indemnities
relating to non-
competition
clause (2) Corporate officer Yes No Yes No Yes No Yes No Gilles Schnepp
Chairman and CEO
Commencement : 05/22/2008
Expiration : 12/31/2013 x x x x
Olivier Bazil
Vice-Chairman and COO
Commencement : 05/22/2008
Expiration : 12/31/2013 x x x x
(1) In 2001, the Legrand Group entered into an agreement with an insurance company for the provision of services
relating to pensions, retirement and services of a related nature to the members of the Group Executive Committee
benefiting from the French pension system for salaried workers. At December 31, 2010, the Group’s commitment in
connection with this agreement amounted to approximately €20.6 million, of which approximately €11.7 million was
financed, while the remaining €8.9 million is accrued in the accounts. In addition, a provision for €5.2 million was
recognized for the additional 30% tax on benefits exceeding eight times the ceiling used for the calculation of Social
Security contributions. The Executive Committee has eight members, including the two corporate officers.
Supplementary pension entitlements are calculated to set total pensions, including these supplementary entitlements
and all other amounts received after retirement, at the equivalent of 50% of the average of the two highest amounts
of compensation received by the beneficiaries in their last three years with the Group. To benefit from the
supplementary pension, employees must have been with the Group for at least ten years and have reached the legal
retirement age. In the event of the beneficiary’s death, the Group will pay the surviving spouse 60% of the
supplementary pension.
In the case of Mr. Gilles Schnepp and Mr. Olivier Bazil, their potential entitlements at their retirement represent 1% of
the remuneration (fixed salary and bonuses) per year of presence within the Group.
(2) Mr. Gilles Schnepp is subject, in connection with his status as a corporate officer and at the sole initiative of the
Group, to a duty not to compete for a period of two years. In consideration of this, should the Group decide to impose
the obligation, Mr. Gilles Schnepp would receive a monthly indemnity equal to 50% of his average monthly
compensation, including salary and bonuses, in his last 12 months with the Group. Mr. Olivier Bazil is subject to the
restrictions of the standard non-competition clause provided for in the collective labor agreement for French metal
industries (‘Convention Collective de la Métallurgie’). The decision to implement this clause is at the sole initiative of
the Group. Should the Group so decide, this would entail the payment to Mr. Olivier Bazil of an indemnity equal to
50% of his reference compensation (fixed salary and bonuses) over a period of at most two years.

- Consolidated financial statements – December 31, 2010 - 60 -
(3) The collective labor agreement for French metal industries (‘Convention Collective de la Métallurgie’) and
company-level agreements applying within the Group also provide for the payment to all Group employees of an
indemnity on retirement proportional to the length of their employment with the Group. Theses provisions would
apply to Mr. Olivier Bazil if applicable conditions were satisfied on his retirement. As an example, an executive level
employee (cadre) with 30 to 39 years of seniority would receive a retirement indemnity equal to five month’s salary.
c) End of contract indemnities
Except amounts due as retirement indemnities or because of the non-compete covenant as mentioned above, the
executive officers do not benefit from any other commitment linked to salary, indemnities or benefits due or likely to
be due because of termination of their employment contract (contrat de travail), modifications to them or subsequent
to them.
d) Share-based payment
Under the 2010 share grant and stock option plans, corporate officers were granted 62,163 shares and 217,646
options.
Under the 2009 share grant and stock option plans, corporate officers were granted 23,491 shares and 93,964
options.
Under the 2008 share grant and stock option plans, corporate officers were granted 47,077 shares and 141,231
options.

- Consolidated financial statements – December 31, 2010 - 61 -
24) Information by geographical segment (Note 1 (r) )
Legrand is the global specialist in electrical end digital building infrastructures. The following information by
geographical segment corresponds to the Group’s consolidated reporting system.
Geographical segments Items not 12 months ended December 31, 2010 Europe USA/ Rest of allocated to Total (in € millions) France Italy Others Canada the world segments
Total revenue 2,270.4 825.7 983.4 627.6 1,107.9 5,815.0 Less intra-group transfers (1,227.3) (203.1) (246.2) (55.9) (192.0) (1,924.5) Revenue 1,043.1 622.6 737.2 571.7 915.9 3,890.5 Cost of sales (345.4) (245.8) (441.7) (281.3) (483.5) (1,797.7) Administrative and selling expenses, R&D costs (401.0) (177.2) (188.9) (210.7) (240.0) (1,217.8) Other operating income (expense) (40.9) (7.0) (21.6) (10.6) (37.3) (117.4) Operating profit 255.8 192.6 85.0 69.1 155.1 757.6 - of which Legrand post-acquisition expenses (11.5) (4.8) (1.7) (7.7) (0.8) (26.5) Adjusted operating profit 267.3 197.4 86.7 76.8 155.9 784.1 - of which depreciation expense (42.6) (26.8) (18.4) (11.1) (20.3) (119.2) - of which amortization expense (2.5) (5.8) (2.3) (3.4) (6.7) (20.7) - of which amortization of development costs (18.2) (4.3) (0.2) (2.2) (0.2) (25.1) - of which restructuring costs (6.6) (1.3) (15.7) 0.1 (8.0) (31.5) Exchange gains (losses) (39.8) (39.8) Finance costs and other financial income and expense (71.2) (71,2) Income tax expense (227.1) (227.1) Minority interest and share of (loss)/profit of associates 1.2 1.2 Net cash provided by operating activities 749.4 749.4 Net proceeds from sales of fixed and financial assets 8.9 8.9 Capital expenditure (20.8) (22.8) (9.8) (6.3) (22.8) (82.5) Capitalized development costs (20.0) (7.0) (0.1) (2.2) (1.0) (30.3) Free cash flow* 645.5 645.5 Total assets 6,064.7 6,064.7 Segment liabilities 352.1 181.3 120.4 116.0 219.2 989.0
* Free cash flow is defined as the sum of net cash provided by operating activities and net proceeds from sales of
fixed and financial assets minus capital expenditure and capitalized development costs.

- Consolidated financial statements – December 31, 2010 - 62 -
Geographical segments Items not 12 months ended December 31, 2009 Europe USA/ Rest of allocated to Total (in € millions) France Italy Others Canada the world segments
Total revenue 2,179.6 778.9 873.8 575.0 869.2 5,276.5 Less intra-group transfers (1,160.9) (163.8) (201.3) (55.4) (117.6) (1,699.0) Revenue 1,018.7 615.1 672.5 519.6 751.6 3,577.5 Cost of sales (363.4) (267.8) (405.3) (259.1) (405.0) (1,700.6) Administrative and selling expenses, R&D costs (418.5) (180.0) (183.4) (198.1) (197.1) (1,177.1) Other operating income (expense) (62.3) (11.3) (35.8) (13.9) (52.4) (175.7) Operating profit 174.5 156.0 48.0 48.5 97.1 524.1 - of which Legrand post-acquisition expenses (17.7) (8.0) (2.6) (8.5) (1.3) (38.1) - of which goodwill impairment (16.6) (16.6) Adjusted operating profit 192.2 164.0 50.6 57.0 115.0 578.8 - of which depreciation expense (46.7) (28.4) (17.6) (12.0) (20.8) (125.5) - of which amortization expense (2.7) (6.7) (2.4) (3.5) (4.9) (20.2) - of which amortization of development costs (15.3) (3.3) 0.0 (1.9) 0.0 (20.5) - of which restructuring costs (18.0) 1.1 (23.0) 0.5 (11.3) (50.7) Exchange gains (losses) (13.4) (13.4) Finance costs and other financial income and expense (88.1) (88.1) Income tax expense (131.3) (131.3) Minority interest and share of (loss)/profit of associates 1.5 1.5 Net cash provided by operating activities 726.3 726.3 Net proceeds from sales of fixed and financial assets 43.8 43.8 Capital expenditure (26.4) (24.3) (12.1) (5.7) (15.8) (84.3) Capitalized development costs (22.1) (6.1) (0.2) (2.3) (0.6) (31.3) Free cash flow* 654.5 654.5 Total assets 5,614.4 5,614.4 Segment liabilities 339.4 173.4 102.1 97.2 161.2 873.3
* Free cash flow is defined as the sum of net cash provided by operating activities and net proceeds from sales of
fixed and financial assets minus capital expenditure and capitalized development costs.
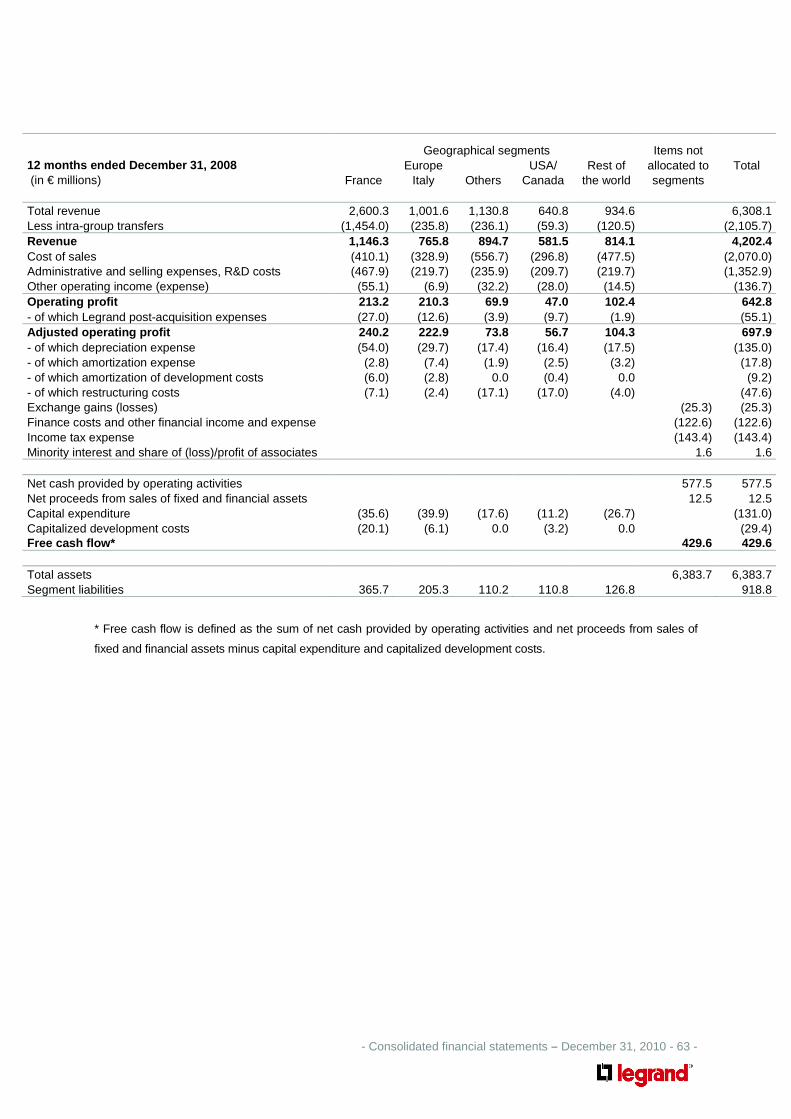
- Consolidated financial statements – December 31, 2010 - 63 -
Geographical segments Items not 12 months ended December 31, 2008 Europe USA/ Rest of allocated to Total (in € millions) France Italy Others Canada the world segments
Total revenue 2,600.3 1,001.6 1,130.8 640.8 934.6 6,308.1 Less intra-group transfers (1,454.0) (235.8) (236.1) (59.3) (120.5) (2,105.7) Revenue 1,146.3 765.8 894.7 581.5 814.1 4,202.4 Cost of sales (410.1) (328.9) (556.7) (296.8) (477.5) (2,070.0) Administrative and selling expenses, R&D costs (467.9) (219.7) (235.9) (209.7) (219.7) (1,352.9) Other operating income (expense) (55.1) (6.9) (32.2) (28.0) (14.5) (136.7) Operating profit 213.2 210.3 69.9 47.0 102.4 642.8 - of which Legrand post-acquisition expenses (27.0) (12.6) (3.9) (9.7) (1.9) (55.1) Adjusted operating profit 240.2 222.9 73.8 56.7 104.3 697.9 - of which depreciation expense (54.0) (29.7) (17.4) (16.4) (17.5) (135.0) - of which amortization expense (2.8) (7.4) (1.9) (2.5) (3.2) (17.8) - of which amortization of development costs (6.0) (2.8) 0.0 (0.4) 0.0 (9.2) - of which restructuring costs (7.1) (2.4) (17.1) (17.0) (4.0) (47.6) Exchange gains (losses) (25.3) (25.3) Finance costs and other financial income and expense (122.6) (122.6) Income tax expense (143.4) (143.4) Minority interest and share of (loss)/profit of associates 1.6 1.6 Net cash provided by operating activities 577.5 577.5 Net proceeds from sales of fixed and financial assets 12.5 12.5 Capital expenditure (35.6) (39.9) (17.6) (11.2) (26.7) (131.0) Capitalized development costs (20.1) (6.1) 0.0 (3.2) 0.0 (29.4) Free cash flow* 429.6 429.6 Total assets 6,383.7 6,383.7 Segment liabilities 365.7 205.3 110.2 110.8 126.8 918.8
* Free cash flow is defined as the sum of net cash provided by operating activities and net proceeds from sales of
fixed and financial assets minus capital expenditure and capitalized development costs.
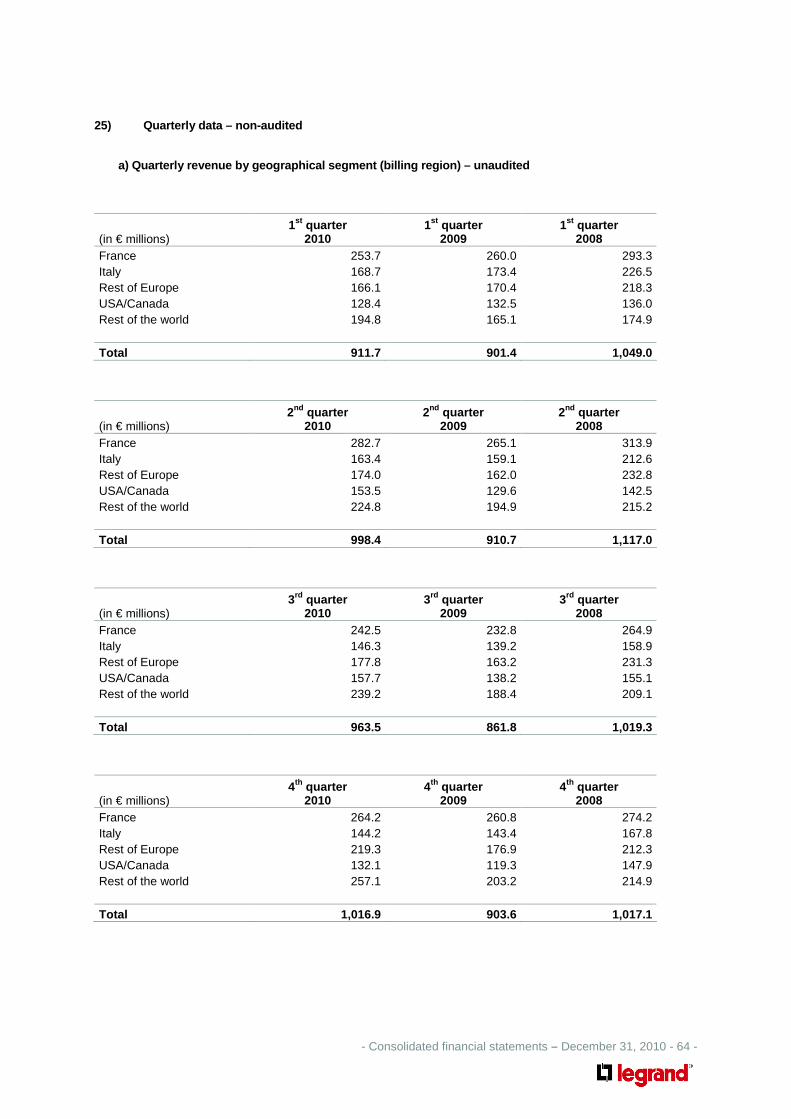
- Consolidated financial statements – December 31, 2010 - 64 -
25) Quarterly data – non-audited
a) Quarterly revenue by geographical segment (billi ng region) – unaudited
(in € millions)
1st quarter 2010
1st quarter 2009
1st quarter 2008
France 253.7 260.0 293.3 Italy 168.7 173.4 226.5 Rest of Europe 166.1 170.4 218.3 USA/Canada 128.4 132.5 136.0 Rest of the world 194.8 165.1 174.9 Total 911.7 901.4 1,049.0
(in € millions)
2nd quarter 2010
2nd quarter 2009
2nd quarter 2008
France 282.7 265.1 313.9 Italy 163.4 159.1 212.6 Rest of Europe 174.0 162.0 232.8 USA/Canada 153.5 129.6 142.5 Rest of the world 224.8 194.9 215.2 Total 998.4 910.7 1,117.0
(in € millions)
3rd quarter 2010
3rd quarter 2009
3rd quarter 2008
France 242.5 232.8 264.9 Italy 146.3 139.2 158.9 Rest of Europe 177.8 163.2 231.3 USA/Canada 157.7 138.2 155.1 Rest of the world 239.2 188.4 209.1 Total 963.5 861.8 1,019.3
(in € millions)
4th quarter 2010
4th quarter 2009
4th quarter 2008
France 264.2 260.8 274.2 Italy 144.2 143.4 167.8 Rest of Europe 219.3 176.9 212.3 USA/Canada 132.1 119.3 147.9 Rest of the world 257.1 203.2 214.9 Total 1,016.9 903.6 1,017.1

- Consolidated financial statements – December 31, 2010 - 65 -
b) Quarterly income statements – unaudited
(in € millions) 1st quarter
2010 1st quarter
2009 1st quarter
2008 Revenue 911.7 901.4 1,049.0 Operating expenses Cost of sales (411.0) (433.9) (507.6) Administrative and selling expenses (248.2) (262.0) (288.0) Research and development costs (46.3) (48.2) (54.8) Other operating income (expense) (25.7) (31.8) (23.6) Operating profit 180.5 125.5 175.0 Finance costs (18.0) (34.3) (37.5) Financial income 2.5 4.1 8.3 Exchange gains (losses) (25.4) (11.4) 25.5 Finance costs and other financial income and expense, net (40.9) (41.6) (3.7) Share of profit of associates 0.0 0.0 0.6 Profit before tax 139.6 83.9 171.9 Income tax expense (48.7) (27.2) (57.8) Profit for the period 90.9 56.7 114.1 Attributable to: - Equity holders of Legrand 90.3 56.5 113.8 - Minority interests 0.6 0.2 0.3
(in € millions) 2nd quarter
2010 2nd quarter
2009 2nd quarter
2008 Revenue 998.4 910.7 1,117.0 Operating expenses Cost of sales (446.3) (438.6) (540.6) Administrative and selling expenses (263.0) (243.0) (298.5) Research and development costs (47.6) (44.7) (54.4) Other operating income (expense) (35.2) (67.9) (34.9) Operating profit 206.3 116.5 188.6 Finance costs (20.9) (24.9) (31.2) Financial income 3.5 2.9 3.3 Exchange gains (losses) (27.1) (1.5) 7.0 Finance costs and other financial income and expense, net (44.5) (23.5) (20.9) Share of profit of associates 0.0 0.0 (0.6) Profit before tax 161.8 93.0 167.1 Income tax expense (59.7) (41.2) (47.2) Profit for the period 102.1 51.8 119.9 Attributable to: - Equity holders of Legrand 102.3 51.4 119.3 - Minority interests (0.2) 0.4 0.6

- Consolidated financial statements – December 31, 2010 - 66 -
(in € millions) 3rd quarter
2010 3rd quarter
2009 3rd quarter
2008 Revenue 963.5 861.8 1,019.3 Operating expenses Cost of sales (446.8) (408.0) (499.9) Administrative and selling expenses (250.3) (228.7) (274.9) Research and development costs (44.8) (42.2) (49.8) Other operating income (expense) (25.0) (35.0) (28.7) Operating profit 196.6 147.9 166.0 Finance costs (21.4) (22.7) (36.6) Financial income 2.7 2.2 5.0 Exchange gains (losses) 19.3 4.3 (50.7) Finance costs and other financial income and expense, net 0.6 (16.2) (82.3) Profit before tax 197.2 131.7 83.7 Income tax expense (70.1) (39.9) (23.8) Profit for the period 127.1 91.8 59.9 Attributable to: - Legrand 126.6 91.3 59.4 - Minority interests 0.5 0.5 0.5
(in € millions) 4th quarter
2010 4th quarter
2009 4th quarter
2008 Revenue 1,016.9 903.6 1,017.1 Operating expenses Cost of sales (493.6) (420.1) (521.9) Administrative and selling expenses (270.7) (253.9) (283.2) Research and development costs (46.9) (54.4) (49.3) Other operating income (expense) (31.5) (41.0) (49.5) Operating profit 174.2 134.2 113.2 Finance costs (22.6) (18.1) (46.4) Financial income 3.0 2.7 12.5 Exchange gains (losses) (6.6) (4.8) (7.1) Finance costs and other financial income and expense, net (26.2) (20.2) (41.0) Profit before tax 148.0 114.0 72.2 Income tax expense (48.6) (23.0) (14.6) Profit for the period 99.4 91.0 57.6 Attributable to: - Legrand 99.1 90.6 57.4 - Minority interests 0.3 0.4 0.2
26) Subsequent events
In January 2011, the Group announces the acquisition of Electrorack, specialized in Voice-Data-Image (VDI)
cabinets for data centers in the United States. Based in Anaheim, California, Electrorack employs more than 90
people.

- Consolidated financial statements – December 31, 2010 - 67 -