Informatica Economică vol. 15, no. 1/2011 31 - ASE …revistaie.ase.ro/content/57/03 -...
17
Informatica Economică vol. 15, no. 1/2011 31 A Genetic Programming Approach to Geometrical Digital Content Modeling in Web Oriented Applications Dragos PALAGHITA Academy of Economic Studies, Bucharest, Romania [email protected] The paper presents the advantages of using genetic techniques in web oriented problems. The specific area of genetic programming applications that paper approaches is content modeling. The analyzed digital content is formed through the accumulation of targeted geometrical structured entities that have specific characteristics and behavior. The accumulated digital content is analyzed and specific features are extracted in order to develop an analysis system through the use of genetic programming. An experiment is presented which evolves a model based on specific features of each geometrical structured entity in the digital content base. The results show promising expectations with a low error rate which provides fair approximations related to analyzed geometrical structured entities. Keywords: Genetic Algorithm, Genetic Programming, Fitness, Geometrical Structured Entities, Analysis Genetic optimization problems in web oriented applications Web oriented applications in the knowledge society according to [1] are meant to provide useful solutions for users’ problems being able to handle multiple requests and deliver timely results. Using genetic algorithms or genetic programming for finding the best solution for a problem is proving to be worthwhile. The main areas that genetic algorithms and genetic programming are applied which have a direct beneficial effect on users are: - public transportation solutions in order to determine the optimal route to take between two given points using public transportation means according to [2]; this solution provides useful information to users who want to find the best route to take given they have time constraints on departure, arrival and time spent on route; other restrictions that apply are number of line switches or type of transportation desired; the type of transportation will bring up cost issues that also represent a restriction for the algorithm if the user requires it; - production allocation problems which are defined by an optimal allocation of production output to consumers with restrictions on transportation cost, taxes paid per transported unit, demand for the specific product in the markets; the work in [3] proposes an optimized genetic algorithm with a customized mutation and crossover algorithms which provide superior results compared to other studies to that date; - developing product variants for customer requirements by employing the use of genetic programming and genetic algorithms to provide customizability options for the product platform used [4]; this kind of approach leads to restrictions regarding the number of customizable parameters, cost of customizing the parameters, time required to alter the products, product shape, size and weight of the products; the approach presented by [4] demonstrates an adaptive genetic algorithm which uses customized mutation and crossover operations that lead to a reduced error compared to the proven optimal solutions in the test set; the study presented in [6] where the target of the genetic model is to improve long term profit by designing the resource portfolio in such a way that 1
Transcript of Informatica Economică vol. 15, no. 1/2011 31 - ASE …revistaie.ase.ro/content/57/03 -...
Informatica Economică vol. 15, no. 1/2011 31
A Genetic Programming Approach to Geometrical Digital Content Modeling in Web Oriented Applications
Dragos PALAGHITA
Academy of Economic Studies, Bucharest, Romania [email protected]
The paper presents the advantages of using genetic techniques in web oriented problems. The specific area of genetic programming applications that paper approaches is content modeling. The analyzed digital content is formed through the accumulation of targeted geometrical structured entities that have specific characteristics and behavior. The accumulated digital content is analyzed and specific features are extracted in order to develop an analysis system through the use of genetic programming. An experiment is presented which evolves a model based on specific features of each geometrical structured entity in the digital content base. The results show promising expectations with a low error rate which provides fair approximations related to analyzed geometrical structured entities. Keywords: Genetic Algorithm, Genetic Programming, Fitness, Geometrical Structured Entities, Analysis
Genetic optimization problems in web oriented applications
Web oriented applications in the knowledge society according to [1] are meant to provide useful solutions for users’ problems being able to handle multiple requests and deliver timely results. Using genetic algorithms or genetic programming for finding the best solution for a problem is proving to be worthwhile. The main areas that genetic algorithms and genetic programming are applied which have a direct beneficial effect on users are: - public transportation solutions in order
to determine the optimal route to take between two given points using public transportation means according to [2]; this solution provides useful information to users who want to find the best route to take given they have time constraints on departure, arrival and time spent on route; other restrictions that apply are number of line switches or type of transportation desired; the type of transportation will bring up cost issues that also represent a restriction for the algorithm if the user requires it;
- production allocation problems which are defined by an optimal allocation of
production output to consumers with restrictions on transportation cost, taxes paid per transported unit, demand for the specific product in the markets; the work in [3] proposes an optimized genetic algorithm with a customized mutation and crossover algorithms which provide superior results compared to other studies to that date;
- developing product variants for customer requirements by employing the use of genetic programming and genetic algorithms to provide customizability options for the product platform used [4]; this kind of approach leads to restrictions regarding the number of customizable parameters, cost of customizing the parameters, time required to alter the products, product shape, size and weight of the products; the approach presented by [4] demonstrates an adaptive genetic algorithm which uses customized mutation and crossover operations that lead to a reduced error compared to the proven optimal solutions in the test set; the study presented in [6] where the target of the genetic model is to improve long term profit by designing the resource portfolio in such a way that
1

32 Informatica Economică vol. 15, no. 1/2011
it provides the best choice with respect to customer demand; another aspect of the model presented in [6] is allocating the developed resource portfolio in each production time segment such that for the entire production stage which uses the resource portfolio the revenue is maximized;
- vehicle routing with time windows which focuses on determining the least costly routes starting from a central point to a set of geographically distributed locations; this kind of problem raises restrictions regarding minimal transportation cost, routing scheduling, minimal traveling distance, optimal load and time window determination; the approach in [5] proposes an approach developed using a genetic model using parameters related to service time for vehicles, waiting times, maximum route time allowed, departure time from central depot; the constraints are focused on vehicle capacity, time window constraints, customer serving, route completion; the objectives of the algorithm proposed by [5] are distance minimization and vehicle number minimization which leads to cost minimization; the proposed solution by [5] is promising with respect to time and error; the genetic algorithm presented in [7] for train sequencing provides an unique case study on the Korean railway train route optimization; the objective of the study presented by [7] is to find the a set of train routes that cover all trains for a specified timetable, the parameters used rely on the first departure and last arrival station associated to each train, departure, arrival and maintenance times for each train, number of kilometers for each train, minimum connection times between each two trains in the train set and maximum number of trains that can be assigned to a given route; the objective function in [7] minimizes the number of kilometers for each route for all trains involved in the timetable; the
researchers identified several restrictions in [7] as unique assignment, conserve a steady flow for each route and enforce a minimum and maximum length for each route;
- stock trading optimization models using genetic network programming as presented by the study in [8]; the objective of the genetic model presented in [8] is to provide suitable information for traders using technical analysis for stock price prediction based on past stock prices; the study in [8] relies on a learning phase to provide predictions for upcoming events and an evolution phase which changes graph structures to produce new individual stock price models;
- model refinement methods using genetic algorithms are described in [17] and show good results in model optimization; the presented approach aims at lowering the complexity of models with a minimum impact on results; the technique presented by [17] accomplishes low error levels for multiple model refinements.
The main advantages of using genetic algorithms and genetic programming in web oriented applications are: - accurate information with a low error
rate for a range of variations belonging to the same problem;
- solving difficult problems which are not solvable otherwise; this approach applies to time consuming solutions which require a large population and complex fitness functions to operate correctly;
- analyzing problems with different restrictions and objectives according to user needs and providing accurate results accordingly;
- obtaining viable results for problems even though the provided data set of acceptable solutions is smaller than that required for operating a neural network.
The main disadvantage of using genetic algorithms is the high resource consumption that is needed for running the

Informatica Economică vol. 15, no. 1/2011 33
genetic algorithm. The requirements rise along with the complexity of the problem. This fact though is reduced by the low price of computing resources which enables running a genetic algorithm in a reasonable time frame in order to obtain low error results. By using efficient genetic techniques to improve public transportation, vehicle routing, product variants, resource portfolios or stock market prediction web oriented applications can provide accurate information to users based on tested algorithms. There are other applications that can benefit from genetic improvements like the multi cash desk solution presented by [12] or in the entity parsing algorithm described by [13]. Genetic algorithms are used successfully on very large data sets in order to extract a relevant model without adding a significant error rate and can be applicable based on the theoretical notions presented in [15]. Another application of genetic algorithms is in minimizing security vulnerabilities alongside algorithms like the ones presented by [14]. Applying genetic algorithms to a set of user problems is a step towards better and accurate governmental information systems and private information sources. 2 Data modeling for genetic analysis
In order to elaborate a digital content modeling algorithm using genetic programming the digital content base must be developed based on the requirements of the study. The digital content base is a structured homogeneous collection of digital entities for which the data collection process is achieved by means of: - surveys which are comprised of a strict
number of questions with a finite list of answers which is predefined by the survey authors; the entities which are obtained from the survey are structured and are identical through their: o numerical content through common
characteristics that describe the entity using identical intervals for numeric representation; each
numeric characteristic belonging to the entity must be of the same type for all entities in the digital content base;
o string content by using the same string format for all entity characteristics in the digital content base; this is achieved through identical format survey answer options and applying the same procedure on survey retrieval and processing;
o number of characteristics belonging to each entity which must be the same for all collected entities for the digital content base to maintain its maximum homogeneity level;
o number of characteristics types belonging to each entity must match for all the entities in the digital content base in order to maintain a unitary structure across all entities;
- observation of events in a controlled environment; the result of this type of data collection process are notes which follow the timeline of the supervised experiment; the notes are later used for explaining the produced phenomena; in order to maintain uniformity the observations must: o take place at specified time intervals
in order to provide a continuous stream of information for the process evolution and maintain it throughout the duration of the undertaken experiment;
o have a strict format which is necessary for automatic analysis of the collected data and assures conformity with future studies for comparison;
- interview which is a proficient tool for understanding an unknown environment and its influence factors; interviews are important when facing a multitude of factors that need to be analyzed and correlated with real life events in the specific environment; for the data of an interview to be recorded properly the following are necessary:

34 Informatica Economică vol. 15, no. 1/2011
o planning the interview questions beforehand in order to ensure continuity and logic to the process of obtaining the information;
o the questions must be simple and easily to understand by the respondent such that the answerers are clear and proper to the scope of the process to avoid misunderstandings in the process of taking the interview;
o the interview questions must be relevant and in the scope of the data collection process to avoid introducing bias in the collected data and maintain a high degree of quality of the collected data;
o the obtained answers must be correlated with the other obtained interviews in order to create a good image of the analyzed subject and provide easily analyzable data after ending the interviews;
- automatic data collection through real time analysis which is completed by processing digital entities and extracting a number of specific characteristics according to the entities’ nature; the automatic data collection process focuses on obtaining a homogeneous and structured data set; this is achieved through maintaining concordance between entities through: o standardizing data collection by
employing and maintaining the same method of extracting the raw information from the entity data; this is achieved by using the same processing algorithm, the same database type, the same database interface and identical process steps throughout the data collection process;
o processing semantically similar entities which hold similar meaning in terms of data for the processing algorithm which must translate the human readable form of the entity in a computer readable form suitable for advanced processing and storing;
o processing syntactically similar entities which use the same internal rules for data representation in order to ensure a homogeneous transition from human interpretable form to the computer interpretable one;
o transforming entities to the standard syntax format before processing through specifically designed algorithms that take as input the original entity and output its identical semantic counterpart in the standard syntax accepted by the processing algorithm;
- semi-automatic where the data is collected by means of an experiment which is developed in order to observe behavioral traits of an algorithm or process; the experiment relies on automatic data collected from the algorithm or process but also on surveys, interviews or observation.
To obtain the data used for geometrical digital content modeling ten surveys were elaborated each having three geometrical digital representations pairs and a scoring scale of 1 through 10 where 1 represents totally identical geometrical representations and 10 represents totally different ones. One key interest point in the survey was the factor that influenced the respondent’s choice when comparing the geometrical structured entities. The surveys were taken by a total number of 103 different respondents from the Bucharest Academy of Economic Studies and associated entities over a time period of 45 days. Each respondent was asked to mark the difference of three pairs of geometrical entities on the given scale and state the most important influence factor that affected the comparison of the three presented pairs. The answers were collected automatically and stored in an online database until the end of the answering period. A pair of two geometrical entities used in the survey for comparison by respondents is presented in Fig. 1.
Informatica Economică vol. 15, no. 1/2011 35
Fig. 1. Geometrical entities
In order to capture more aspects of the geometrical entities’ orthogonality and ensure diversity: - the same entity was rotated by 90
degrees several times in order to observe the respondents reaction when comparing the original geometrical entity with its rotated counterpart;
- the same entity was filled with the same color but on a different background in order to determine the respondents’ reaction to chromatic changes in the background;
- in order see how entity color affects respondents the same entity was set on identically colored background but filled with a different color;
- the compared geometrical entities were set in the same background but with different shape diversity in order to observe the respondents reaction towards the shape’s environment.
By using the described techniques a homogeneous set of geometrical structured entities was developed. The developed set
only contains geometrical shapes due to the following considerations: - geometrical shapes are easily analyzed
by individuals because of their familiarity and this helps remove some subjectivity from shape analysis;
- simplicity of the generated geometrical structured entities given by a simple uniform background with several variations and a predefined set of shapes of different colors and sizes;
- low error in automated analysis of the geometrical structured entities which is validated easily due to shape simplicity; this would have been harder to achieve by directly using complex shape structures for the digital entities provided for analysis in the surveys.
The influence factors in geometrical entities visual analysis that were considered are shape, shape position, shape color and background color. The results of this question are presented in Fig. 2 showing the repartition of the influence factors in geometrical entities comparison across all ten surveys for the 103 respondents.

36 Informatica Economică vol. 15, no. 1/2011
Fig. 2. Geometrical entities comparison influence factors
According to the results almost half of the respondents reacted to the shape form presented by the geometrical entity, its chromatic characteristics and its position. The most non-influential factor was found to be the background color.
Fig. 3 presents the respondent repartition for all ten surveys a maximum of 12 different respondents was recorded for Survey 1 and a minimum of 9 different respondents for Survey 3, 5, 9 and 10.
Fig. 3. Respondent repartition
Fig. 4 presents the response repartition over 45 days for all surveys while they were opened for the respondents to access.
Fig. 4. Weekly respondent count
48%
27%
4%
21%
Influence Factors
Shape
Shape colour
Background colour
Shape position
05
1015
Respondents
Respondents
0
10
20
30
Week 1
Week 2
Week 3
Week 4
Week 5
Week 6
Week 7
Respondents
Respondents

Informatica Economică vol. 15, no. 1/2011 37
Response correlation was related to the type of shape presented in the geometrical entity, its color ant position in the geometrical
entities’ frame. The geometrical entities presented in Fig. 5 were displayed for comparison.
Fig. 5. Image comparison groups
All surveys contained a similar pattern with alternating shape types, background variation and different geometrical composition of the structured entity.
By analyzing Image A and Image B the responders gave the orthogonality marks presented by the bar chart in Fig. 6.
Fig. 6. Results obtained from the comparison between Image A and Image B
The results show that one out of seventeen respondents considered that Image B which
is Image A rotated 90 degrees is totally different from its non rotated counterpart.
0
1
2
3
1 2 3 4 5 6 7 8 9 10
Grades Image A / Image B
Grades
No. Respones
38 Informatica Economică vol. 15, no. 1/2011
Most of the respondents gave marks of four and six to the comparison showing that the images are partially similar and the difference to a full similarity measure is owed to the rotation imprinted on Image B.
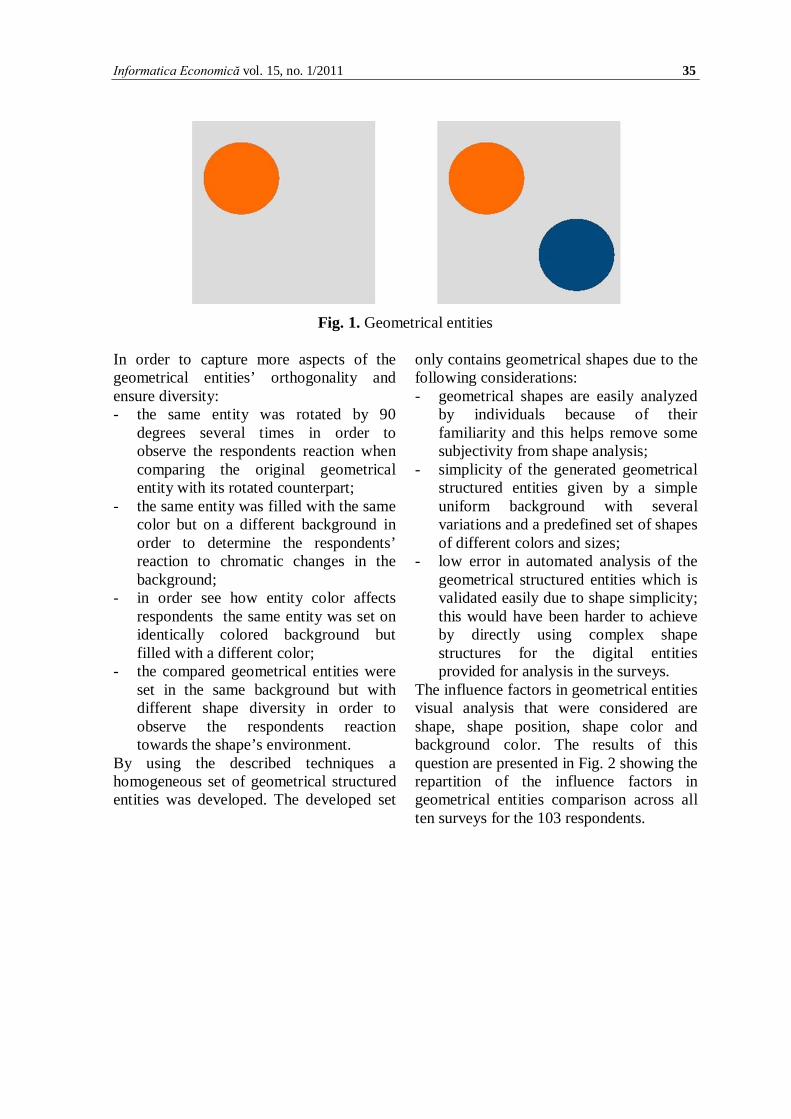
The responders gave the orthogonality marks after comparing Image C with image D as presented in the bar chart from Fig. 7.
Fig. 7. Results obtained from the comparison between Image and Image D
After analyzing the results from the comparison of image C and Image D the background difference influenced only one respondent to mark the images as totally similar and one to mark them totally different. The most number of votes were aimed towards the set of marks {6,7,9}.
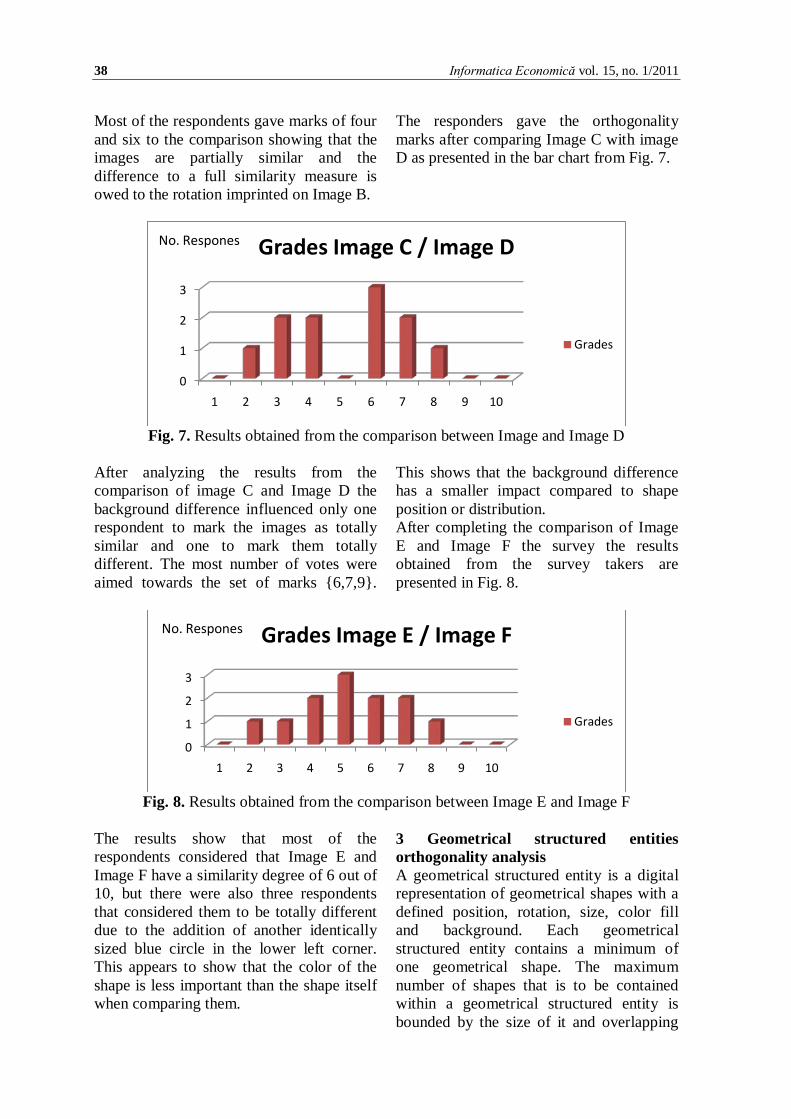
This shows that the background difference has a smaller impact compared to shape position or distribution. After completing the comparison of Image E and Image F the survey the results obtained from the survey takers are presented in Fig. 8.
Fig. 8. Results obtained from the comparison between Image E and Image F
The results show that most of the respondents considered that Image E and Image F have a similarity degree of 6 out of 10, but there were also three respondents that considered them to be totally different due to the addition of another identically sized blue circle in the lower left corner. This appears to show that the color of the shape is less important than the shape itself when comparing them.
3 Geometrical structured entities orthogonality analysis A geometrical structured entity is a digital representation of geometrical shapes with a defined position, rotation, size, color fill and background. Each geometrical structured entity contains a minimum of one geometrical shape. The maximum number of shapes that is to be contained within a geometrical structured entity is bounded by the size of it and overlapping
0
1
2
3
1 2 3 4 5 6 7 8 9 10
Grades Image C / Image D
Grades
No. Respones
0
1
2
3
1 2 3 4 5 6 7 8 9 10
Grades Image E / Image F
Grades
No. Respones

Informatica Economică vol. 15, no. 1/2011 39
that affects the clearness of the entity. A geometrical structured entity is described by the following characteristics: - size in terms of content and resolution
being defined by the space needed to store it on a computer hard drive and influenced by the image definition and detail;
- size in terms of height and width given by the actual sizing on the image which corresponds to the size of the pixel matrix representing it;
- chromatic definition considering the number of colors used to describe the colors of the shapes and background of the image;
- chromatic system used to represent colors in the image which is subject to the image editor or device used to create it; images are represented in RGB, YCbCr and HSV formats;
- shape specification which corresponds to the number of shapes, their position within the image and their form;
- internal representation is detailed by the format employed by the tool or device used to create the image.
According to the above a geometrical structured entity GA= {SZH, SZM, CD, CS, SS, IR} is defined by its hard disk size SZH, its pixel matrix size SZM, its chromatic distribution CD, its chromatic system CS and its shape specification SS. Considering two geometrical structured entities GA1= {SZH1, SZM1, CD1, CS1, SS1, IR1 } and GA2={SZH2, SZM2, CD2, CS2, SS2, IR2}. In order for the comparison to be as accurate as possible and ensure that no loss of information exists the following must be true: - SZM1 and SZM2 must be identical to
prevent rescaling operations on the images which lead to detail an information loss on the called image; depending on the scaling direction the resulting image can sustain visible quality loss which distorts the comparison process due to its low data content considering its size;
- CD1 and CD2 must be the same in order to ensure that no transformation is needed on the two images which will lead to possible distortions in the converted image;
- IR1 and IR2 must be the same in order not to apply conversion algorithms to bring the two geometrical structured entities to the same format for their internal representation which leads to possible data loss due to the conversion procedure.
The geometrical structured entity comparison is meant to reveal different characteristic of two entities. The procedure described in [9] implies the following steps on determining the orthogonality of two geometrical structured entities GEalfa and GEbeta: - the determination of the pixel matrices
belonging to the GEalfa and GEbeta which are reduced to the dimensions of: o a 4x4 pixel matrix,
GMalfa4x4,associated to the GEalfa geometrical structured entity and the 4x4 pixel matrix GMbeta4x4 associated with the GEbeta geometrical structured entity, each matrix contains 4 lines and 4 columns of pixels;
o an 8x8 pixel matrix, GMalfa8x8, associated to the GEalfa geometrical structured entity and the 8x8 pixel matrix GMbeta8x8 associated with the GEbeta geometrical structured entity, each matrix contains 8 lines and 8 columns of pixels;
o a 16x16 pixel matrix, GMalfa16x16, associated to the GEalfa geometrical structured entity and the 16x16 pixel matrix GMbeta16x16 associated with the GEbeta geometrical structured entity, each matrix contains 16 lines and 16 columns of pixels;
- two sets of matrices are created GETalfa= {GMalfa4x4, GMalfa8x8, GMalfa16x16} and GETbeta = {GMbeta4x4, GMbeta8x8, GMbeta16x16};
40 Informatica Economică vol. 15, no. 1/2011
- the comparison of the two sets is made using the weighted orthogonality
ORTOST(GETalfa, GETbeta) indicator defined as:
3*256)164*816*4(),( NDNDNDGETGETORTOST betaalfa
++=
where: ND4 – the number of differences between the GEalfa4x4 matrix and the GEbeta4x4 matrix, ND4 is bounded in the [0, 16] interval; ND8 – the number of differences between the GEalfa8x8 matrix and the GEbeta8x8 matrix, ND8 is bounded in the [0, 64] interval;
ND16 – the number of differences between the GEalfa6x16 matrix and the GEbeta16x16, matrix, ND16 is bounded in the [0, 256] interval;
However for the current application the following modifications have been made to the orthogonality metric described by [9] such that it will better fit the purpose of automatic modeling considering that GEalfa and GEbeta have the same size:
∑=
++= 3
1
33221
*
)***(),( 1
iii
betaalfa
ks
kNDskNDskNDsGEGEORTOSTA
where:
)7(2)(
ialfa
i
GESs −=
2
ii sk =
This measure focuses on the differences in appearance of the geometrical structured entities considering variations in color over the surface of the pixel map belonging to each entity. Another method used is the SURF algorithm developed by [10] which provides an accurate result on the transition of shapes in the geometrical structured entities and is invariant to certain degree to scaling and rotation making it the best candidate for determining region orthogonality between two entities. The distances between the obtained descriptors from the SURF algorithm are analyzed using an approximate nearest neighbor algorithm defined by [16] which provides as output the similar key points between the two entities. This algorithm determines similar regions in the two images GEalfa and GEbeta. In order to capture chromatic differences the histograms are computed for both geometric structured entities and their distance is computed using the
Bhattacharyya distance which is described in [11]. This measure determines the degree of overlapping between two given populations in this case histograms belonging to the analyzed geometrical entities. The used methods provide detailed metrics for each geometrical structured entity according to the influence factors discovered by the respondents. 4 Digital content base orthogonality genetic modeling The genetic programming algorithm is developed based on a number of 300 generations with an initial population of 100, an 80% crossover rate, a 20% mutation rate and uses elitism for preserving the best individuals of each generation. The input of the genetic algorithm used is defined by the orthogonality results obtained from the surveys’ used to determine the orthogonality of image pairs according to the opinion of the respondents. The algorithm uses three parameters a, b and c
Informatica Economică vol. 15, no. 1/2011 41
and constant belonging to the interval [-2, 2] as outputs. In order to maintain the validity of the results the final parameters a, b and c are included in the interval [0, 1]. The output parameters are defined as: - the a parameter corresponds to the
adapted difference function defined by the ORTOSTA indicator;
- the b parameter corresponds to the distance computed between the two
geometrical structured entities using the algorithm described by [16];
- the c parameter represents the Bhattacharyya histogram distance computed according to [11].
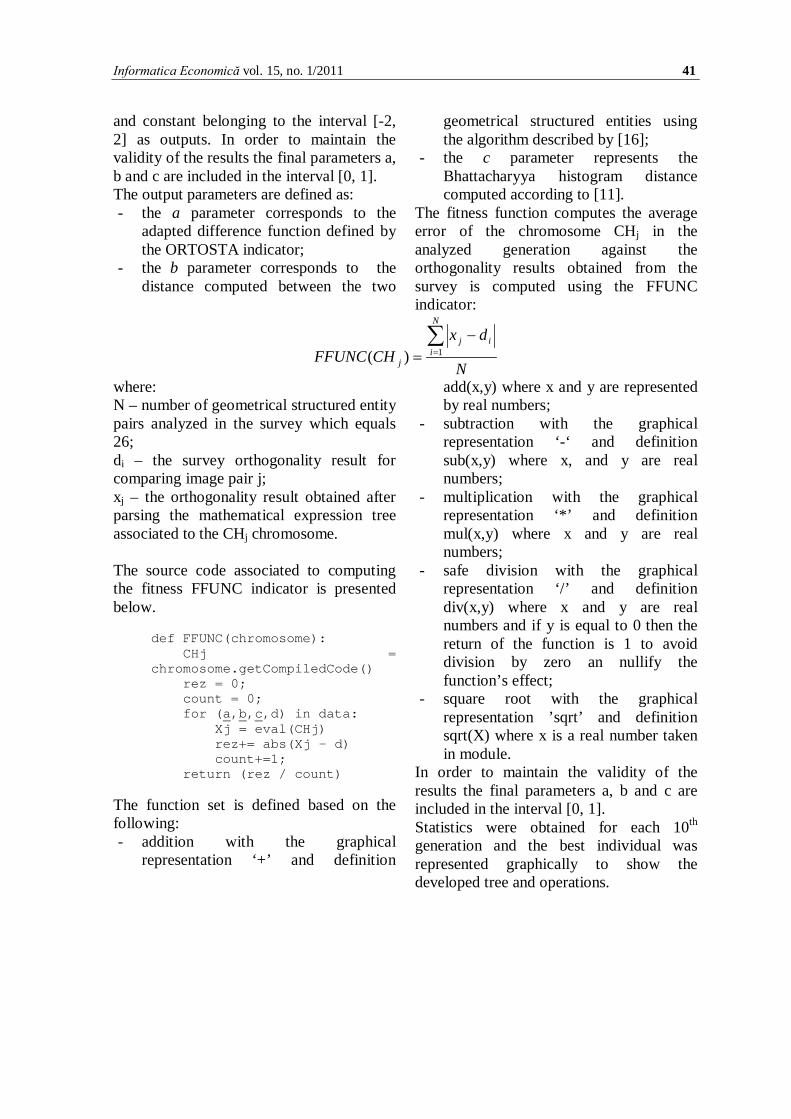
The fitness function computes the average error of the chromosome CHj in the analyzed generation against the orthogonality results obtained from the survey is computed using the FFUNC indicator:
N
dxCHFFUNC
N
iij
j
∑=
−= 1)(
where: N – number of geometrical structured entity pairs analyzed in the survey which equals 26; di – the survey orthogonality result for comparing image pair j; xj – the orthogonality result obtained after parsing the mathematical expression tree associated to the CHj chromosome. The source code associated to computing the fitness FFUNC indicator is presented below.
def FFUNC(chromosome): CHj = chromosome.getCompiledCode() rez = 0; count = 0; for (a,b,c,d) in data: Xj = eval(CHj) rez+= abs(Xj - d) count+=1; return (rez / count)
The function set is defined based on the following: - addition with the graphical
representation ‘+’ and definition
add(x,y) where x and y are represented by real numbers;
- subtraction with the graphical representation ‘-‘ and definition sub(x,y) where x, and y are real numbers;
- multiplication with the graphical representation ‘*’ and definition mul(x,y) where x and y are real numbers;
- safe division with the graphical representation ‘/’ and definition div(x,y) where x and y are real numbers and if y is equal to 0 then the return of the function is 1 to avoid division by zero an nullify the function’s effect;
- square root with the graphical representation ’sqrt’ and definition sqrt(X) where x is a real number taken in module.
In order to maintain the validity of the results the final parameters a, b and c are included in the interval [0, 1]. Statistics were obtained for each 10th generation and the best individual was represented graphically to show the developed tree and operations.

42 Informatica Economică vol. 15, no. 1/2011
Fig. 9. Fittest individual evolution
The minimum error graph is presented in Fig. 10 showing the evolution of the minimum fitness values associated with the best individuals over the 300 generation
showing values every 10th generation. Fig. 11 presents the average error values associated to each 10th generation out of 300.
Fig. 10. Minimum error across generations
The pattern seem in Fig. 10 shows a descending trend for the minimum fitness
given by the mean square error measured against the results obtained in the survey.
0
0.05
0.1
0.15
0.2
0.25
0.3
1 3 5 7 9 11 13 15 17 19 21 23 25 27 29 31
Minimum Error
Minimum Fitness

Informatica Economică vol. 15, no. 1/2011 43
Fig. 11. Average error across generations
The average fitness displays a random behavior this is strongly connected to the mutations and crossovers recorded from generation to generation by the genetic algorithm [18]. Table 1 presents the survey results and the results of the genetic programming algorithm’s best individual after 300 generations.
Fig. 12 presents the best individual recorded by the genetic algorithm which is equivalent to the coefficient GB defined below with a, b and c taking the survey values for ORTOST, the number of approximate nearest neighbors of the SURF descriptors and the Bhattacharyya histogram distance.
)(90230084334710.09535542561.1567473355712.0 aSQRTbcc
aSQRTGB
−−−−=
The GB coefficient is bounded in the [0, 1] interval due to restrictions embedded in the fitness function which will eliminate individuals that provide results out of this given interval. The GB coefficient is defined by the operations comprised in the
function set associated with the genetic programming algorithm, the number of random constants used, the a, b and c parameters given as final variables and the results obtained in the survey which are used to define the fitness function.
0
100
200
300
400
500
600
1 3 5 7 9 11 13 15 17 19 21 23 25 27 29 31
Average Error
Average Fitness

44 Informatica Economică vol. 15, no. 1/2011
Fig. 12. Best individual
The GB coefficient is applied to the data from the survey and the values for the
column GP result are determined in Table 1.
Table 1 Genetic programming algorithm results
a b c Survey Result GP
result 0,27 1,00 0,01 0,5 0,560093 0,88 1,00 0,94 0,487 0,563297 0,13 0,20 0,27 0,51 0,76671 0,09 1,60 0,22 0,473 0,571142 0,94 0,88 0,96 0,417 0,572209 1,00 1,15 0,95 0,5945 0,548837 0,54 1,95 0,01 0,411 0,505841 0,57 1,59 0,27 0,578 0,56832 0,41 0,61 0,44 0,611 0,663302 0,07 0,90 0,09 0,78 0,660824 0,14 0,90 0,27 0,8 0,644297 0,14 0,90 0,34 0,79 0,636631 0,09 1,60 0,30 0,344 0,564515 0,20 0,71 0,28 0,7 0,671151 0,59 1,90 0,04 0,475 0,54463 0,13 0,92 0,27 0,533 0,642508 0,26 0,18 0,39 0,6585 0,745561 0,28 0,76 0,44 0,7 0,65545 0,23 0,90 0,40 0,76 0,628446 0,94 0,44 0,96 0,736 0,619241

Informatica Economică vol. 15, no. 1/2011 45
0,88 0,24 0,94 0,555 0,646114 0,50 0,71 0,28 0,678 0,67115 0,41 0,22 0,49 0,833 0,718438 1,00 0,70 1,00 0,74 0,585742 1,00 0,35 0,95 0,844 0,630319 0,88 0,20 0,94 0,689 0,651557
Fig. 13 presents the evolution of the survey results compared with the results outputted by the genetic programming algorithm. The
results are encouraging showing an acceptable error rate compared to the base line extracted from the survey.
Fig. 13. Correlation between the survey results and the genetic programming model
Applying a genetic programming algorithm to determine an optimized model for the survey data provides good results and shows that using a larger number of generations and an efficient fitness function leaves room for further improvement depending on the available time and computing resources to complete the algorithm. 5 Conclusions Using genetic optimization for answering user demands leads to the development of more precise and result driven web oriented applications. These applications enabled by genetic techniques provide results for complex problems that have a complex and difficult solution otherwise. Genetic programming algorithms provide ways for model definition that prove to have a low error degree considering a fluctuating result set. The developed models are adaptable to new situations or changes in the data set. The advantages of using them are given by very high flexibility, an acceptable error rate, low
complexity and a low time to deliver the actual model that can be applied directly to the test data set. The genetic model developed for analyzing the orthogonality level of geometrical structured entities provides promising results based on the survey results provided by the 103 respondents. Future research includes the addition of geometrical entity segmentation and shape count in the geometrical entities such that the comparison will also rely on color sections and object count in each entity to provide better results. Acknowledgements This article is a result of the project „Doctoral Program and PhD Students in the education research and innovation triangle”. This project is co funded by European Social Fund through The Sectorial Operational Program for Human Resources Development 2007-2013, coordinated by The Bucharest Academy of Economic Studies.
0
0.2
0.4
0.6
0.8
1
1 3 5 7 9 11 13 15 17 19 21 23 25
Survey Result
GP result
46 Informatica Economică vol. 15, no. 1/2011
References [1] I. Botha, A. Velicanu and S. Olaru, “E-
learning strategies in the context of knowledge society”, Conferinţa internaţională Managementul cunoaşterii: proiecte, sisteme, tehnologii, Bucharest, November, 2009, pp. 39-42
[2] L.A. Cotfas, “A Genetic Algorithm and GIS based solution for public transport networks”, The Proceedings of the Ninth International Conference on Informatics in Economy, 2009, pp. 466-471
[3] C. Ying-Hua and Hou Young-Chang, “Dynamic programming decision path encoding of genetic algorithms for production allocation problems”, Computers & Industrial Engineering, Vol. 54, Issue 1, February 2008, pp. 53-65.
[4] L. Li, G.Q. Huang and S.T. Newman, “Interweaving genetic programming and genetic algorithm for structural and parametric optimization in adaptive platform product customization”, Robotics and Computer-Integrated Manufacturing, vol. 23, Issue 6, 16th International Conference on Flexible Automation and Intelligent Manufacturing, December 2007, pp. 650-658.
[5] K. Ghoseiri and S.F. Ghannadpour, “Multi-objective vehicle routing problem with time windows using goal programming and genetic algorithm”, Applied Soft Computing, Vol. 10, Issue 4, Optimization Methods & Applications in Decision-Making Processes, September 2010, pp. 1096-1107.
[6] S.M. Wang, J.C. Chen and K.-J. Wang, “Resource portfolio planning of make-to-stock products using a constraint programming-based genetic algorithm”, Omega, Vol. 35, Issue 2, April 2007, pp. 237-246.
[7] J. Chung, S.-M. Oh and I.-C. Choi, “A hybrid genetic algorithm for train sequencing in the Korean railway”,
Omega, Vol. 37, Issue 3, June 2009, pp. 555-565.
[8] Y. Chen, S. Mabu, K. Shimada and K. Hirasawa, “A genetic network programming with learning approach for enhanced stock trading model”, Expert Systems with Applications, Vol. 36, Issue 10, December 2009, pp. 12537-12546.
[9] D. Palaghita, “Open source procedures for image orthogonality analysis”, Open Source Journal, Vol. 2, No. 2, 2010, pp 82-105.
[10] H. Bay, A. Ess, T. Tuytelaars and L. Van Gool "SURF: Speeded Up Robust Features", Computer Vision and Image Understanding (CVIU), Vol. 110, No. 3, pp. 346--359, 2008
[11] http://en.wikipedia.org/wiki/Bhattacharyya_distance
[12] C. Ciurea and P. Pocatilu, “Collaborative Multicash Servicedesk - An Intelligent Collaborative Banking System”, Proceedings of The Second Romanian Workshop on Mobile Business (RWMB 2010), Cluj-Napoca, Romania, 10-11 September 2010.
[13] S. Vinturis and D. Milodin, “Comparative study of the entities parsers”, Open Source Science Journal, Vol. 1, No. 1, 2009, pp. 58-76.
[14] I. Ivan, D. Palaghita, S. Vinturis and M. Doinea, “Vulnerability minimization model in web distributed applications”, Proceedings of the 3rd International Conference on Security for Information Technology and Communications, 18-19 November, 2010, Bucharest, ASE Publishing House, 2010, pp. 39-48.
[15] I. Ivan, C. Ciurea, S. Pavel, “Very Large Data Volumes Analysis of Collaborative Systems with Finite Number of States”, Journal of Applied Quantitative Methods, vol. 5, No. 1, 2010, pp. 14 - 28, ISSN 1842-4562.
[16] M. Muja, D.G. Lowe, "Fast Approximate Nearest Neighbors with Automatic Algorithm Configuration", Proceedings of the International

Informatica Economică vol. 15, no. 1/2011 47
Conference on Computer Vision Theory and Applications, pp. 331-340, 2009
[17] A. Visoiu, “Structure Refinement for Vulnerability Estimation Models using Genetic Algorithm Based Model
Generators”, Informatica Economica Journal, Vol. 13, No. 1, INFOREC Publishing House, 2009.
[18] B. Vintila, “Risk management in the development process of citizen oriented applications”, paper to be published.
Dragos PALAGHITA graduated from the Academy of Economic Studies of Bucharest, Cybernetics Statistics and Economic Informatics faculty, Economic Informatics section in 2008. He is programming in C++ and C# and his main areas of interest are Informatics Security, Software Quality Management, large data set analysis and graphical representation enhancements. Currently he is undergoing PhD studies at the Academy of Economic Studies of Bucharest, Cybernetics Statistics and Economic
Informatics.