Influenza: Virus and Disease, Epidemics and Pandemics (Steinhoff)
93
Copyright 2007, The Johns Hopkins University and Mark Steinhoff. All rights reserved. Use of these materials permitted only in accordance with license rights granted. Materials provided “AS IS”; no representations or warranties provided. User assumes all responsibility for use, and all liability related thereto, and must independently review all materials for accuracy and efficacy. May contain materials owned by others. User is responsible for obtaining permissions for use from third parties as needed. This work is licensed under a Creative Commons Attribution-NonCommercial-ShareAlike License . Your use of this material constitutes acceptance of that license and the conditions of use of materials on this site.
Transcript of Influenza: Virus and Disease, Epidemics and Pandemics (Steinhoff)

Copyright 2007, The Johns Hopkins University and Mark Steinhoff. All rights reserved. Use of these materials permitted only in accordance with license rights granted. Materials provided “AS IS”; no representations or warranties provided. User assumes all responsibility for use, and all liability related thereto, and must independently review all materials for accuracy and efficacy. May contain materials owned by others. User is responsible for obtaining permissions for use from third parties as needed.
This work is licensed under a Creative Commons Attribution-NonCommercial-ShareAlike License. Your use of this material constitutes acceptance of that license and the conditions of use of materials on this site.
Influenza: Virus and Disease, Epidemics and Pandemics
Mark Steinhoff, MD, ABJohns Hopkins University
3
Mark Steinhoff, MD, AB
Studying the burden of disease due to vaccine-preventable infections in India, Sri Lanka, Bangladesh, and NepalDeveloping diagnostic tests to better determine the etiology of pneumonia and meningitis infectionsAssessing the strategy of immunizing mothers to prevent disease in their infantsEvaluating the best use of limited oxygen supplies in therapy of pneumonia
4
Outline
What is influenza disease?What is the epidemiology of the virus?What is the biology of influenza virus?Current use of vaccines and antiviral drugsPlanning for the pandemic
5
Influenza A Virus
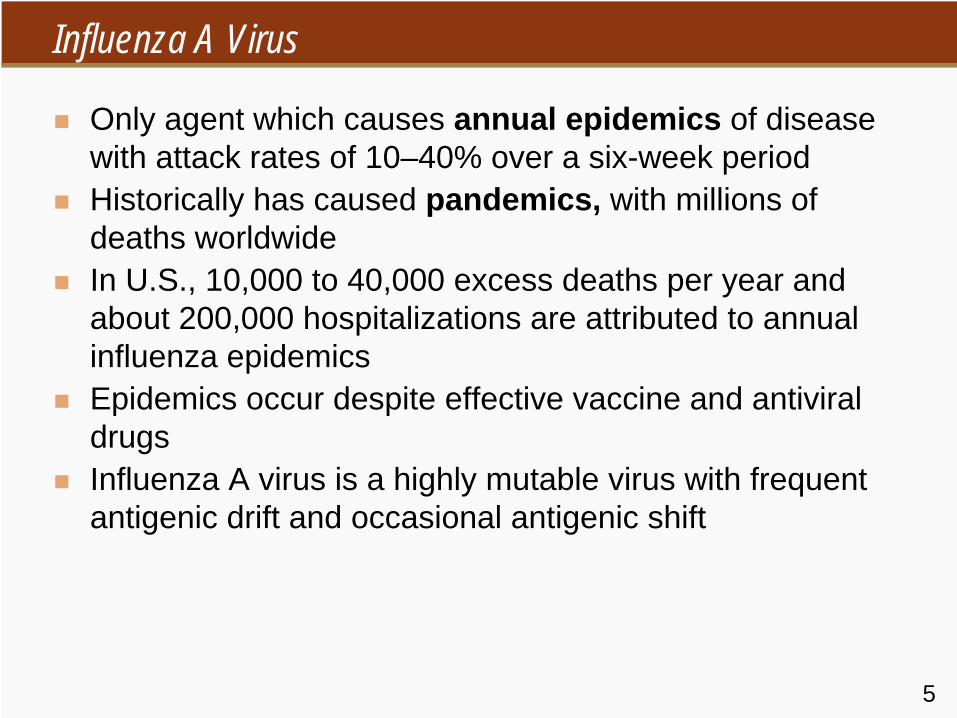
Only agent which causes annual epidemics of disease with attack rates of 10–40% over a six-week periodHistorically has caused pandemics, with millions of deaths worldwideIn U.S., 10,000 to 40,000 excess deaths per year and about 200,000 hospitalizations are attributed to annual influenza epidemicsEpidemics occur despite effective vaccine and antiviral drugsInfluenza A virus is a highly mutable virus with frequent antigenic drift and occasional antigenic shift

Section A
Epidemiology
7
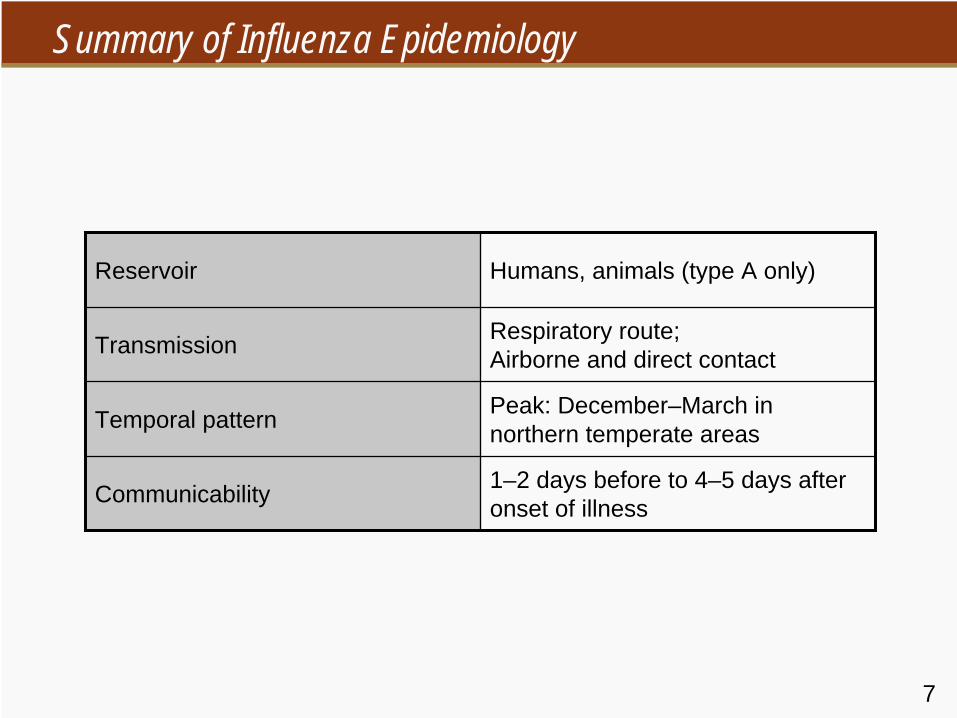
Summary of Influenza Epidemiology
Reservoir Humans, animals (type A only)
Transmission Respiratory route; Airborne and direct contact
Temporal pattern Peak: December–March in northern temperate areas
Communicability 1–2 days before to 4–5 days after onset of illness
8
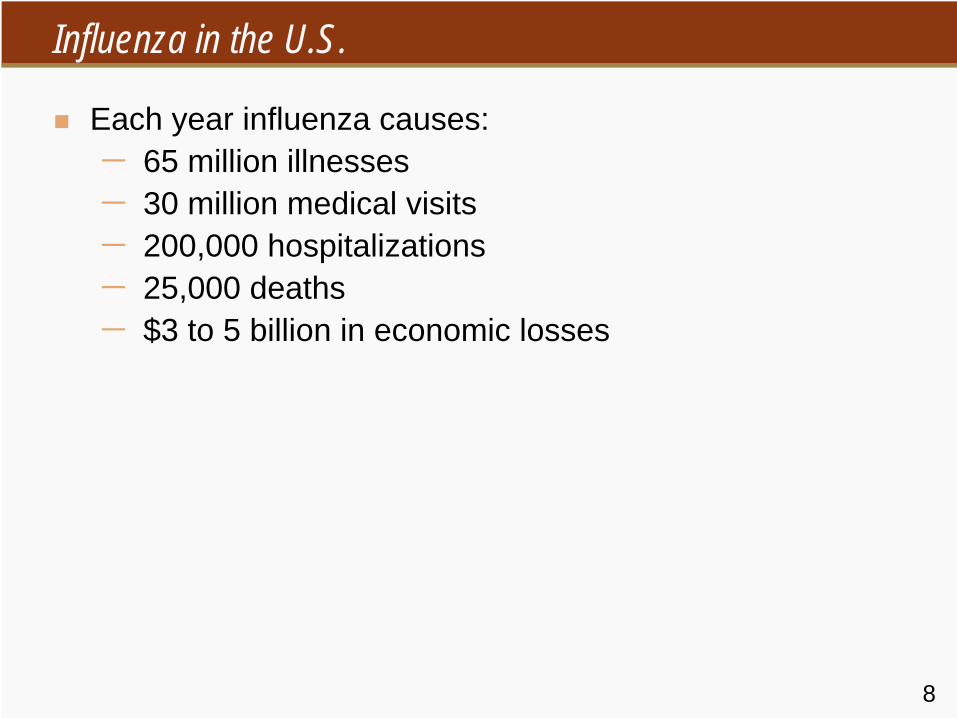
Influenza in the U.S.
Each year influenza causes:−
65 million illnesses
−
30 million medical visits−
200,000 hospitalizations
−
25,000 deaths−
$3 to 5 billion in economic losses

9
Influenza Diagnosis
Clinical and epidemiological characteristics (increase of febrile respiratory illness)Lab isolation of influenza virus from clinical specimen (e.g., nasopharynx, throat, sputum) by cell cultureDirect antigen testing for type A virusSignificant rise in influenza IgG by serologic assay (e.g., complement fixation, HAI)
10
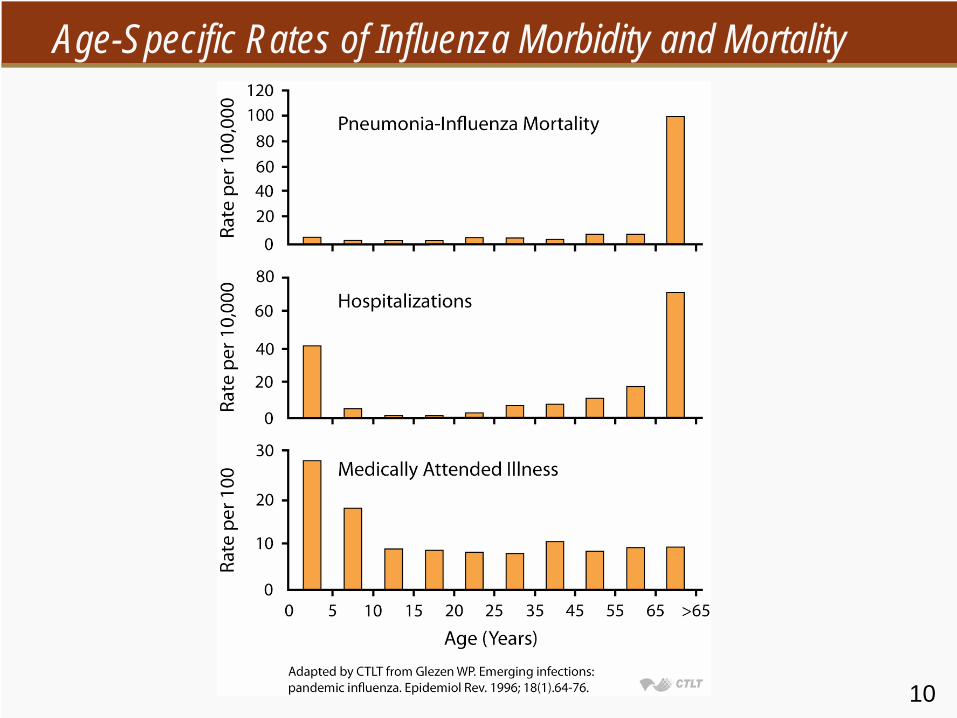
Age-Specific Rates of Influenza Morbidity and Mortality
11Source: Reprinted from Centers For Disease Control and Prevention
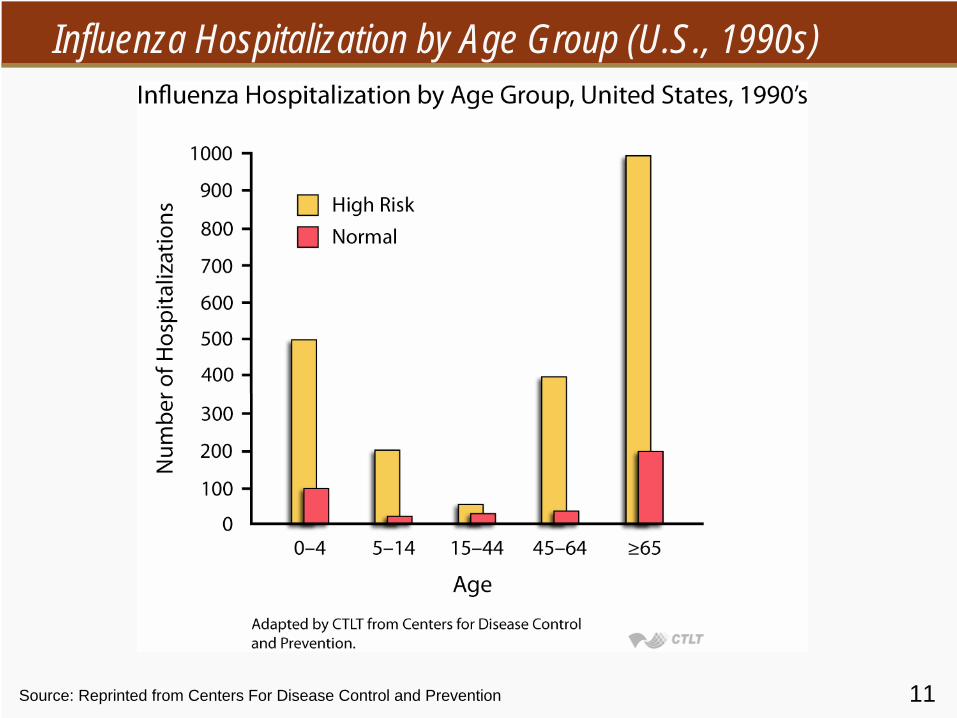
Influenza Hospitalization by Age Group (U.S., 1990s)
12Source: Couch et al. (1986). J Infect Dis, 153,
431.
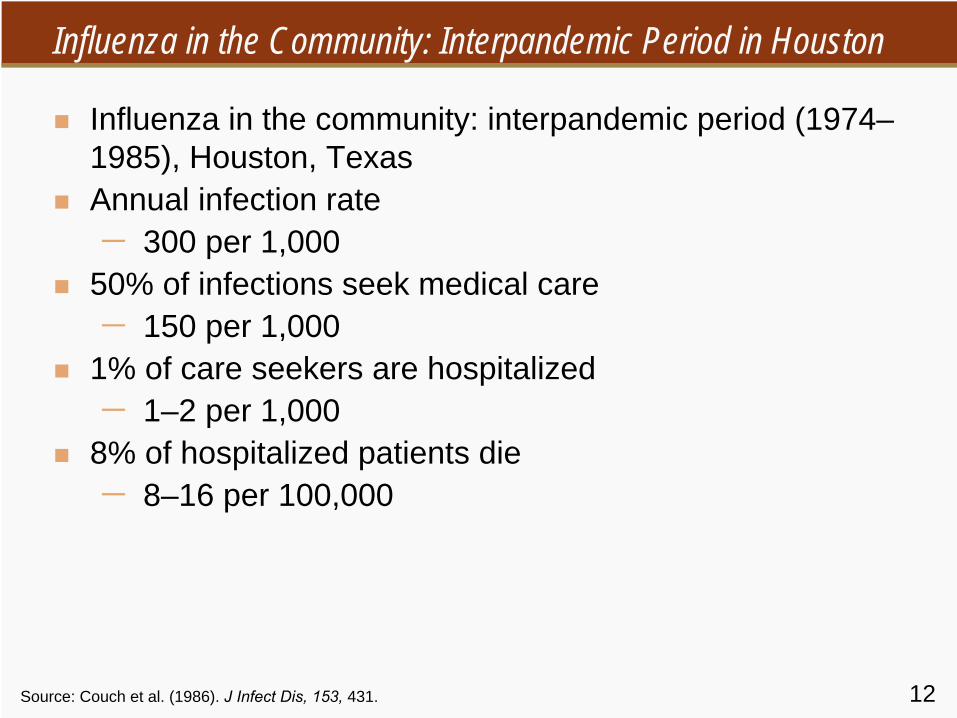
Influenza in the Community: Interpandemic Period in Houston
Influenza in the community: interpandemic period (1974–1985), Houston, TexasAnnual infection rate−
300 per 1,000
50% of infections seek medical care−
150 per 1,000
1% of care seekers are hospitalized−
1–2 per 1,000
8% of hospitalized patients die−
8–16 per 100,000
13
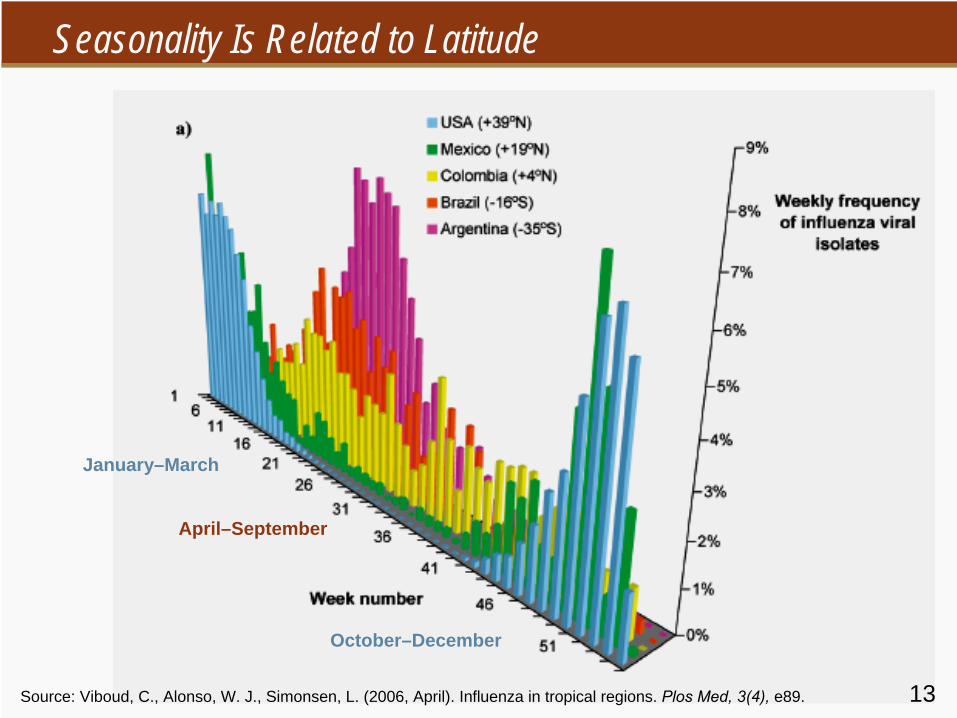
Seasonality Is Related to Latitude
Source: Viboud, C., Alonso, W. J., Simonsen, L. (2006, April). Influenza in tropical regions. Plos
Med, 3(4),
e89. 13
January–March
October–December
April–September

14
Pie Graphs Showing Seasonal Incidence and Latitude
January
July
December
USA39°N
Mexico19°N
Colombia4°N
Brazil16°S
Argentina35°S
Source: Viboud, C., Alonso, W. J., Simonsen, L. (2006, April). Influenza in tropical regions. Plos
Med, 3(4),
e89.
15
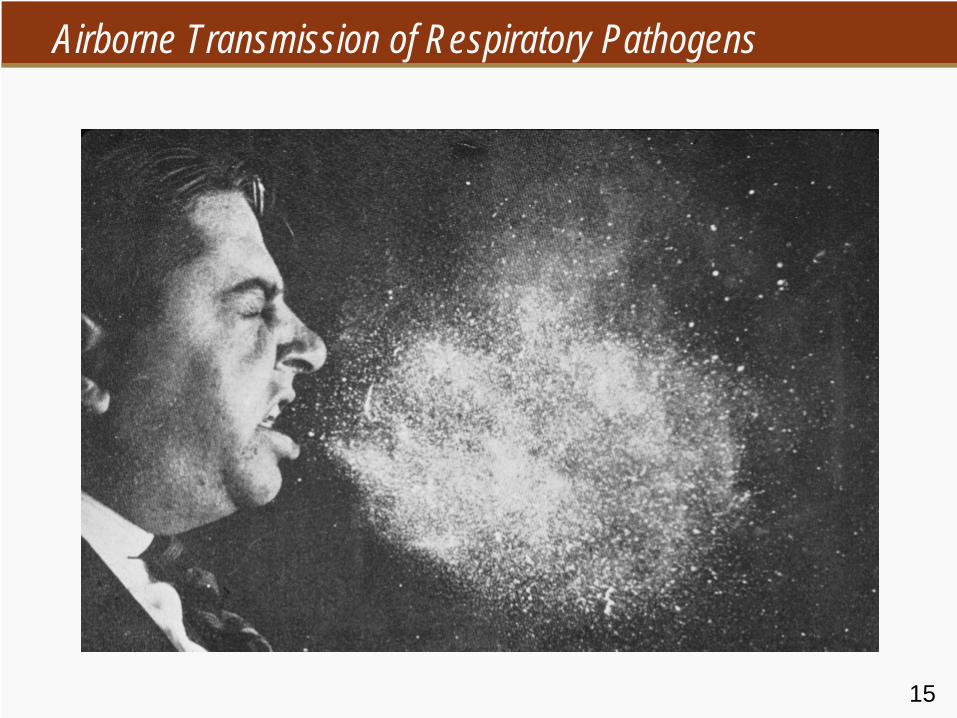
Airborne Transmission of Respiratory Pathogens
Source: CDCSource: CDC
16
Variable Bacteria Mycobacterium tuberculosis Influenzavirus Rhinovirus,
RSV* Other viruses
Type or location of contact
Casual social contact School, workplace Bar, social club Travel tour Dormitory Home
Low Moderate
HighModerate Moderate
High
Low Moderate
High Moderate
High High
Moderate High High High High High
Low Low Low Low
Moderate Moderate
Moderate Low Low Low
Moderate High
Special conditions Loss of air circulation Moderate High High None Low
Risk of contagion
* RSV denotes respiratory syncytial virus
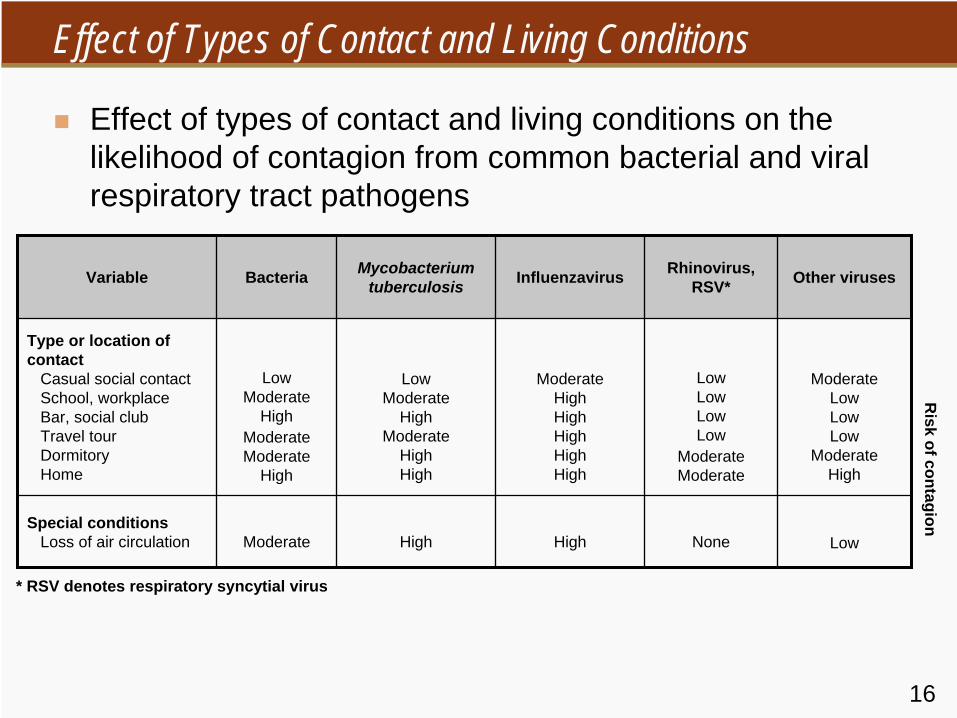
Effect of Types of Contact and Living Conditions
Effect of types of contact and living conditions on the likelihood of contagion from common bacterial and viral respiratory tract pathogens
17
The Virus
The Virus
18
Influenza Virus Nomenclature
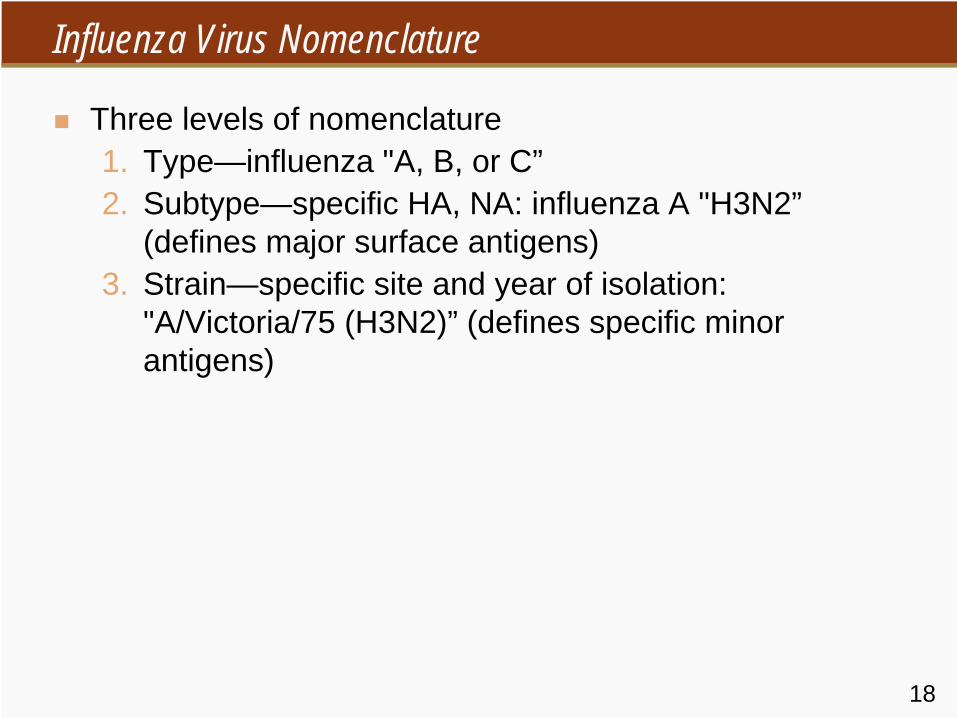
Three levels of nomenclature1. Type—influenza "A, B, or C”2. Subtype—specific HA, NA: influenza A "H3N2”
(defines major surface antigens)3. Strain—specific site and year of isolation:
"A/Victoria/75 (H3N2)” (defines specific minor antigens)
19
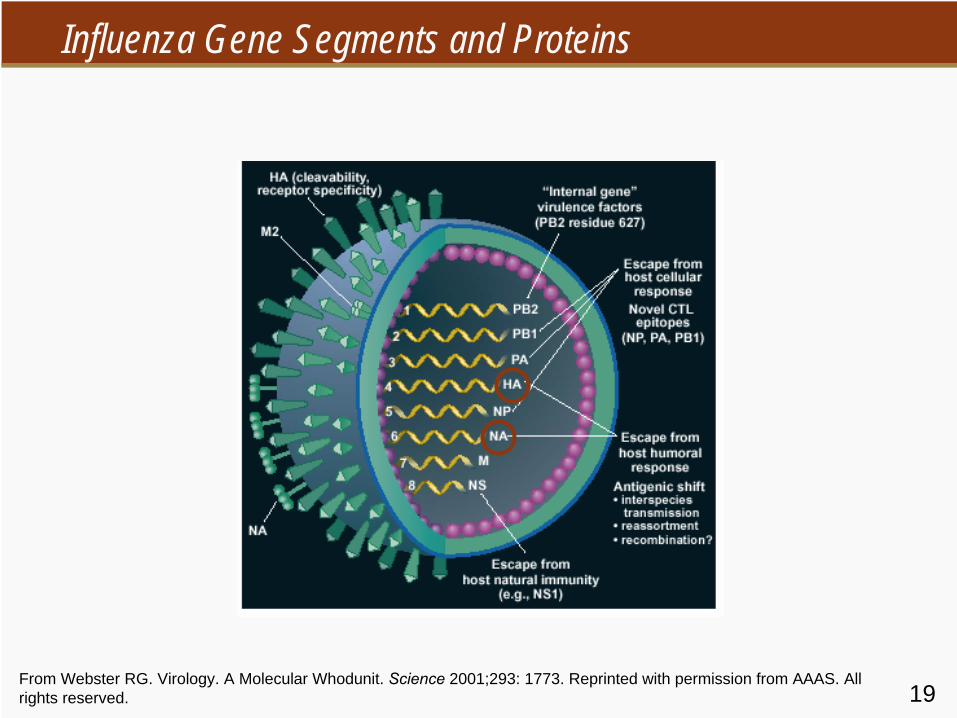
Influenza Gene Segments and Proteins
From Webster RG. Virology. A Molecular Whodunit. Science 2001;293: 1773. Reprinted with permission from AAAS. All rights reserved.
20
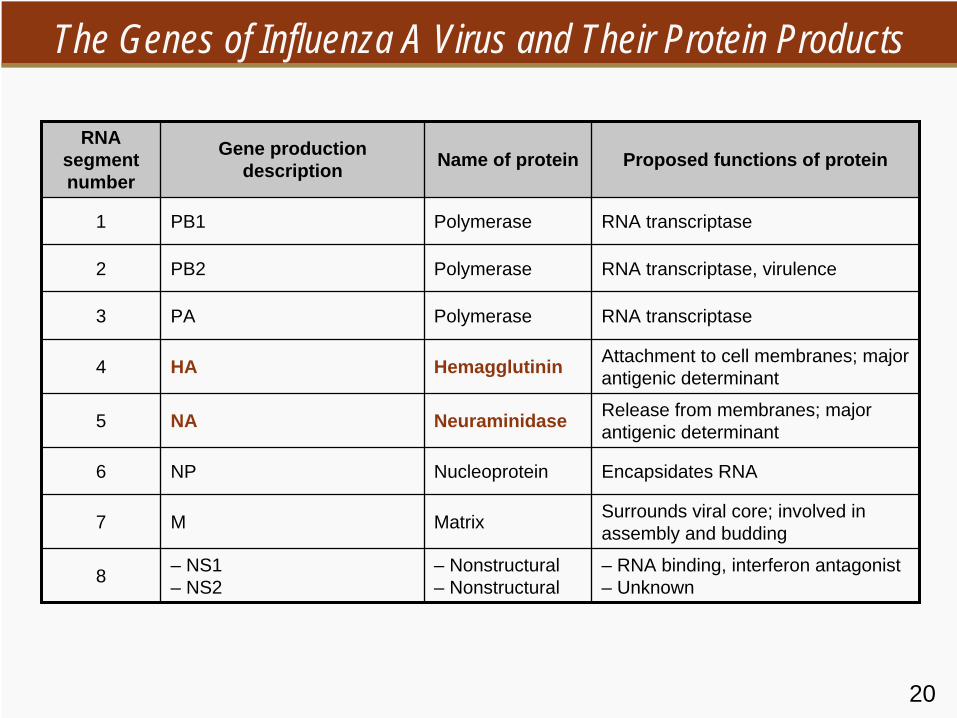
The Genes of Influenza A Virus and Their Protein Products
RNA segment number
Gene production description Name of protein Proposed functions of protein
1 PB1 Polymerase RNA transcriptase
2 PB2 Polymerase RNA transcriptase, virulence
3 PA Polymerase RNA transcriptase
4 HA Hemagglutinin Attachment to cell membranes; major antigenic determinant
5 NA Neuraminidase Release from membranes; major antigenic determinant
6 NP Nucleoprotein Encapsidates RNA
7 M Matrix Surrounds viral core; involved in assembly and budding
8 – NS1 – NS2
– Nonstructural – Nonstructural
– RNA binding, interferon antagonist – Unknown
21
Hemagglutinin and Neuraminidases Subtypes in Nature
The 15 HA and 9 NA subtypes are widely distributed in nature, though they clearly favor GI tract of aquatic birds.
It is thought that feral and domestic fowl are the natural host, with stable adaptation, little disease.
21
22
Viral Mutability: I
RNA genome viruses have high rate of spontaneous mutation: 10-3 to 10-6/incorporated nucleotide (DNA viruses 10-8 to 10-11)About 1 base substitution in HA gene per viral generation, which generates an “exploration” of all variations of amino acid sequence (sim to HIV)High rate of replication with low fidelity will generate many new amino acid substitutions in surface glycoproteins, leading to new "drift" variants
23
Antigenic Variation in Influenza Virus: I
I. Antigenic drift: frequent minor antigenic changea) Point mutation (in HA: 1% change per year 1968–
1979)b) Short insertion/deletions in surface protein genesc) Changes in non-surface proteins may influence
replication, transmission, or tissue tropism
24Source: Hay AJ, Gregory V, Douglas AR, Lin YP. The evolution of human influenza viruses. Phil Trans R Soc Lond B 2001;356:1861-70.
WHO-Recommended Changes in Vaccine Composition
A(H3N2)
A(H1N1)
B
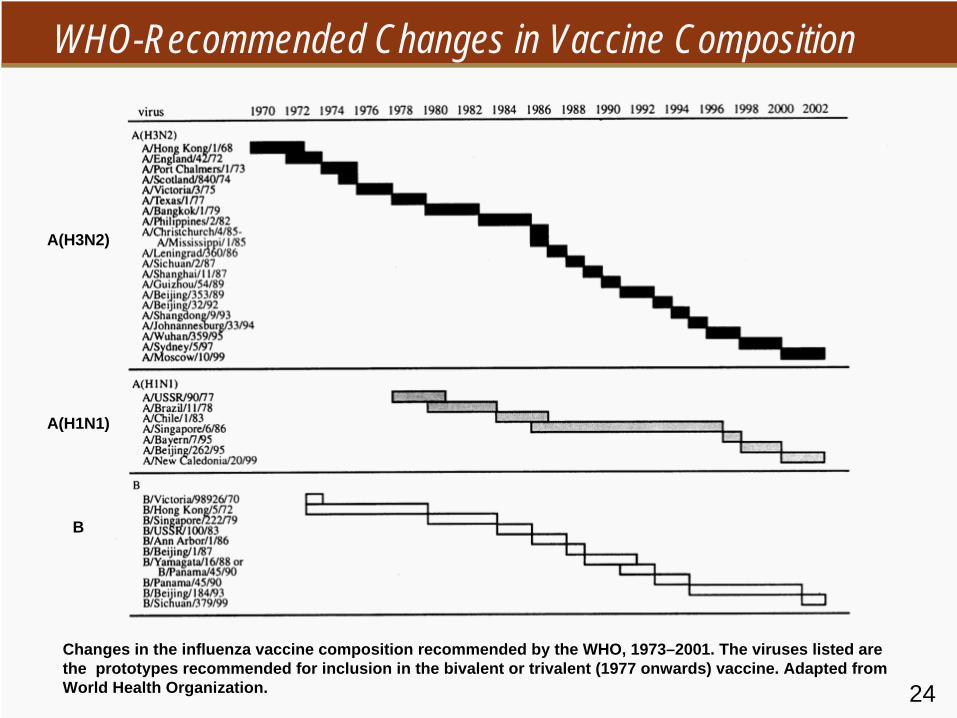
Changes in the influenza vaccine composition recommended by the WHO, 1973–2001. The viruses listed are the prototypes recommended for inclusion in the bivalent or trivalent (1977 onwards) vaccine. Adapted from World Health Organization.
25
Viral Mutability: II
Viruses with segmented genomes generate new variants by reassortment to produce hybridsCo-infection of mammalian cell with 2 different 8-segmented genomes can generate 254 different variants (= viral sex)Variant which can replicate well in humans, and has novel surface determinants which evade existing antibodies, could be a new "shift" pandemic variant
26
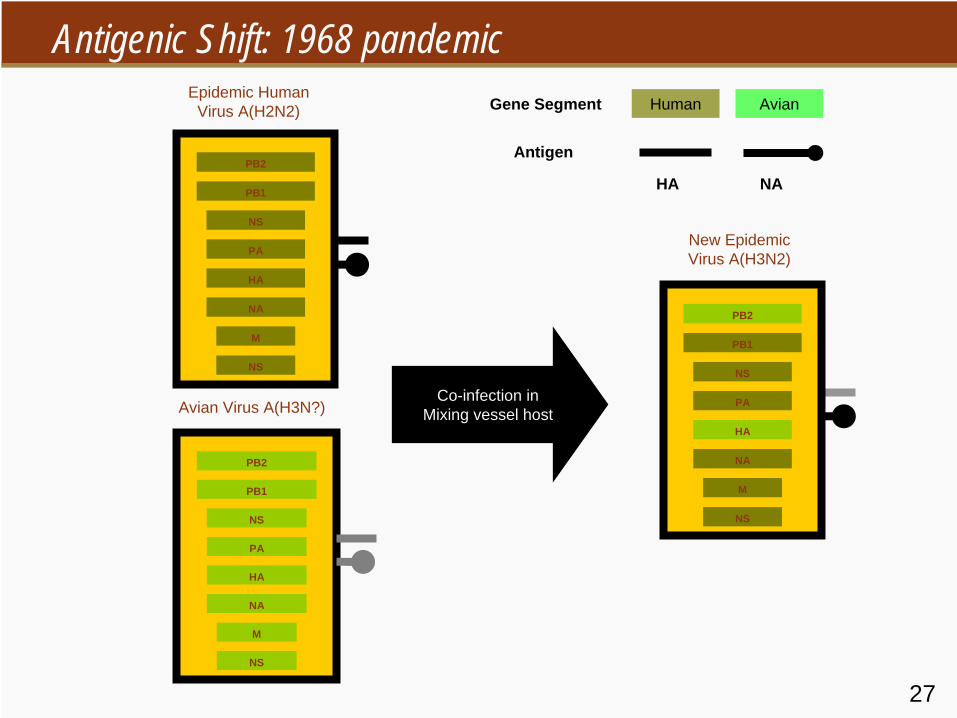
Antigenic Variation in Influenza Virus: II
II. Antigenic shift: major change; pandemica) Direct infection by animal virusb) New genes from animal viruses: avian strains to
humans, pig as intermediate “mixing vessel”c) Recycling of viral strains: ? release from lab
27
Antigenic Shift: 1968 pandemic
PB2
PB1
NS
PA
HA
NA
M
NS
Epidemic Human Virus A(H2N2)
PB2
PB1
NS
PA
HA
NA
M
NS
Avian Virus A(H3N?)
PB2
PB1
NS
PA
HA
NA
M
NS
New Epidemic Virus A(H3N2)
Human AvianGene Segment
Antigen
HA NA
Co-infection inMixing vessel host
28
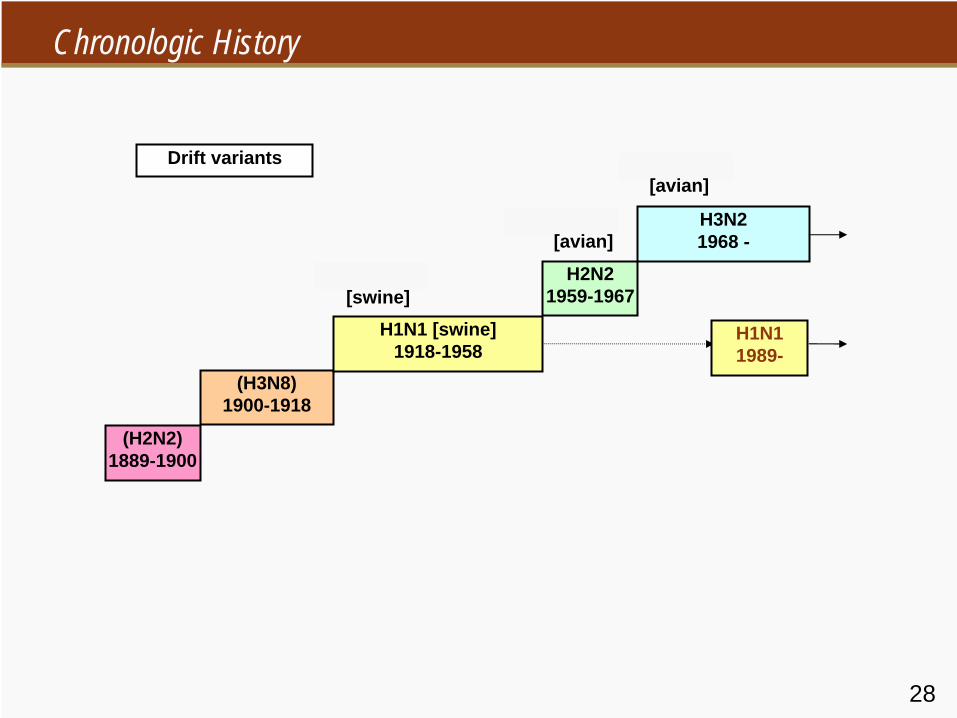
Chronologic History
(H3N8)1900-1918
(H2N2)1889-1900
H1N1 [swine]1918-1958
H3N21968 -
H2N21959-1967
H1N11989-
Drift variants
[swine]
[avian]
[avian]
29
History of Current Strains
All human influenza pandemics since 1930 have originated in China.
In 1957, Asian/57 (H2N2) acquired 3 genes by reassortment from Eurasian avian viruses and kept 5 gene segments from circulating human strains.
In 1968, Hong Kong/68 (H3N2) acquired 2 genes by reassortment from Eurasian avian viruses and kept 6 gene segments from circulating human strains.
30
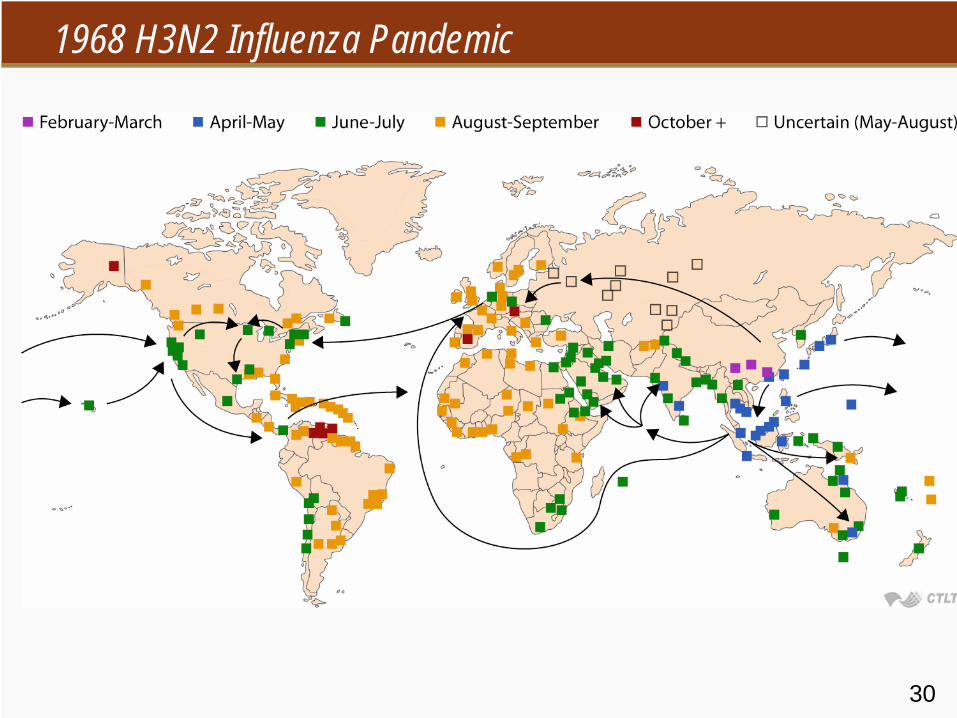
1968 H3N2 Influenza Pandemic

Section B
Policy: Vaccines and Drugs
32
Problems in Control of Influenza: I
Despite relatively effective vaccine and antiviral therapy, influenza epidemics occur annuallySurface antigens, intrinsic virulence, transmissibility all vary independently and unpredictablyCeaseless random antigenic variation mandates new vaccine production and delivery every yearPandemic will occur, sooner or later
33
Problems in Control of Influenza: II
Policy options: individual protection of high-risk subjects vs. reduction of transmission in populationInterruption of transmission requires major effort−
Close all schools, colleges, daycare, work places (effect of bad weather)
−
Vaccinate >80% of population (1976 swine flu program: 45 million doses)
Use of vaccine in low-risk healthy individuals
34
Antiviral Therapy
M2 inhibitors (amantadine, rimantidine)−
Only flu A, rapid resistance develops
−
For >I year oldNA inhibitors (oseltamvir, zanamvir)−
Both flu A, and B (H5N1 not clear)
−
Effective in treatment and prophylaxis (82% reduction in family contacts)
−
For >1 year (Tamiflu, since Dec 22, 2005)
35
Risk Factors for Severe Influenza
Chronic pulmonary or cardiac diseaseImmunosuppression, HIVSickle cell anemia, hemoglobinopathyAspirin therapy: rheumatoid arthritis, Kawasaki diseaseDiabetes, renal and metabolic diseasePregnancy ( if >14 weeks during flu season)Age greater than 65 years, [now 50 years]
36
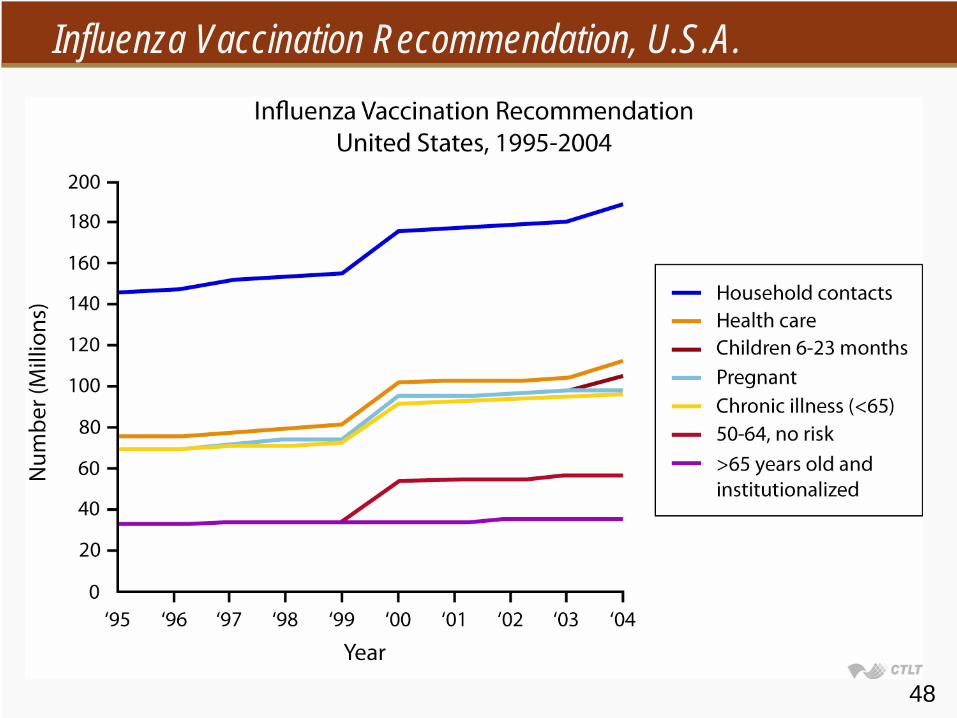
Influenza Vaccine Recommendations
Influenza vaccine recommendations for healthy persons without high risk−
Health care providers, including home heath care
−
Employees of long-term care facilities−
Household members of high-risk persons
−
Persons aged 50 to 64 years
37
Influenza Virus and Pregnancy
Excess mortality in pregnant women noted in 1918 Spanish flu pandemicRecent U.S. data shows 4.7 relative risk for hospital-ization of third trimester women vs. post-partum control womenHospitalization rate = 250 per 100,000 pregnant women (equal to rate in cardiac or pulmonary high-risk women)Hence, inactivated influenza vaccine recommended for second, third trimester (1,000 doses will prevent 1–2 hospitalizations)
38
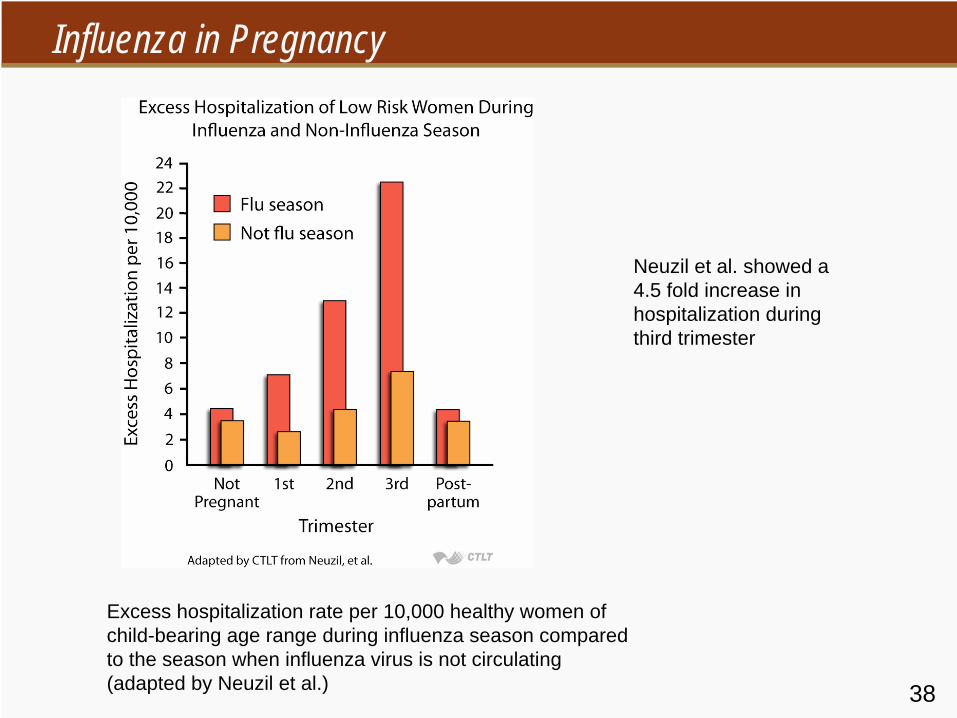
Neuzil et al. showed a 4.5 fold increase in hospitalization during third trimester
Influenza in Pregnancy
Excess hospitalization rate per 10,000 healthy women of child-bearing age range during influenza season compared to the season when influenza virus is not circulating (adapted by Neuzil et al.)
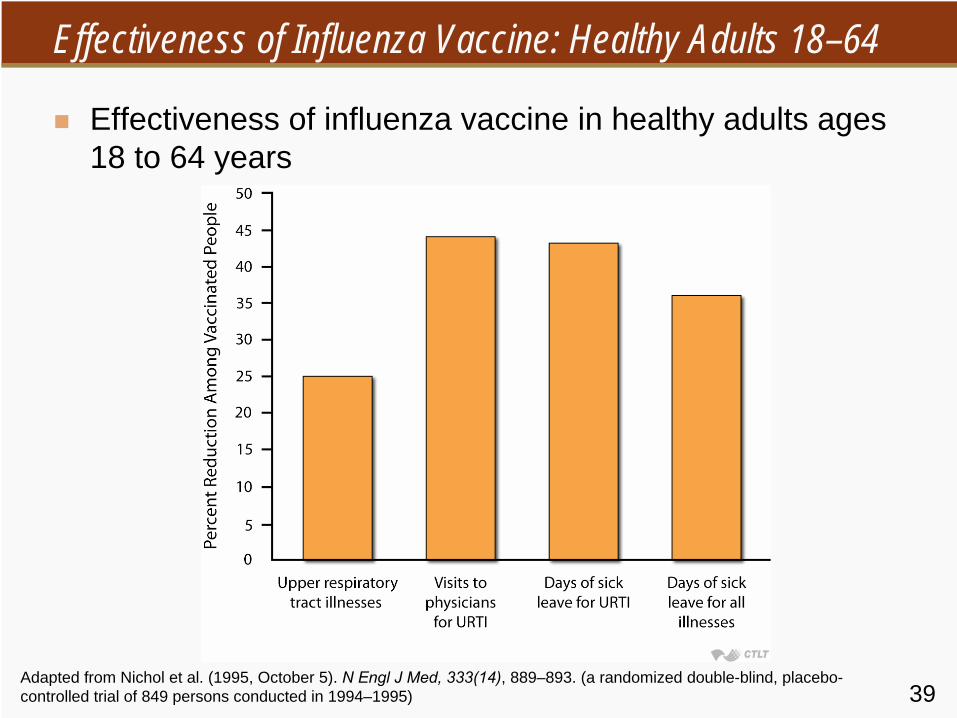
39Adapted from Nichol et al. (1995, October 5). N Engl
J Med, 333(14), 889–893. (a randomized double-blind, placebo- controlled trial of 849 persons conducted in 1994–1995)
Effectiveness of Influenza Vaccine: Healthy Adults 18–64
Effectiveness of influenza vaccine in healthy adults ages 18 to 64 years
40Source: Wilds, Steinhoff, et al. (1999). JAMA, 281,
908.
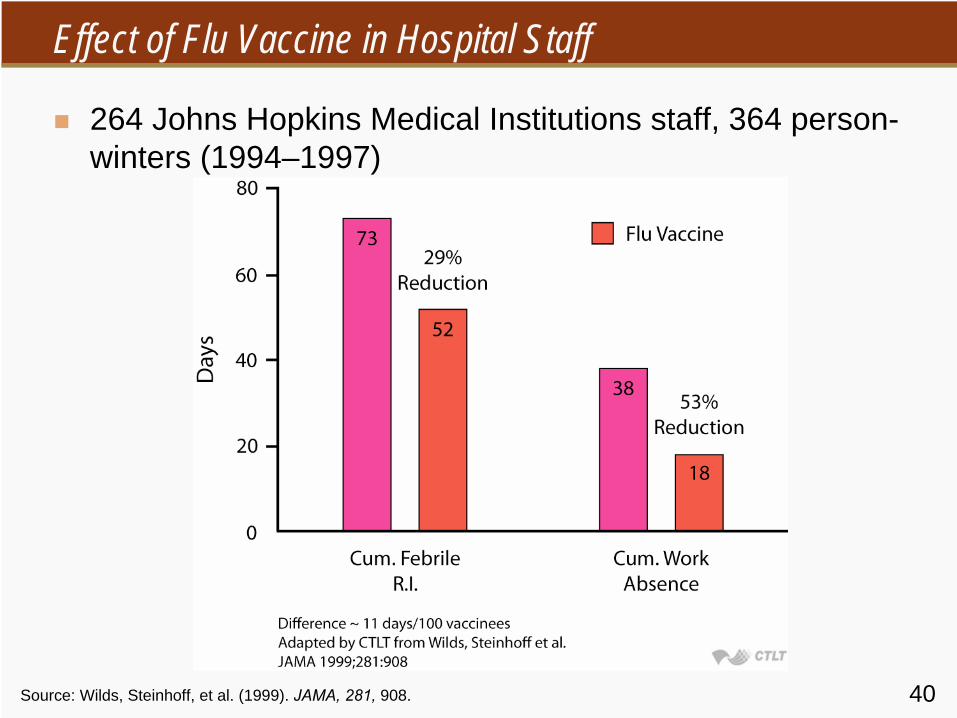
Effect of Flu Vaccine in Hospital Staff
264 Johns Hopkins Medical Institutions staff, 364 person-winters (1994–1997)
41
New Vaccination Paradigm
High rates of flu illness in infants and young childrenChildren are important disseminators of influenza in communityImmunization of healthy young children is a new policyNasal vaccine may be the tool needed for implementation
42
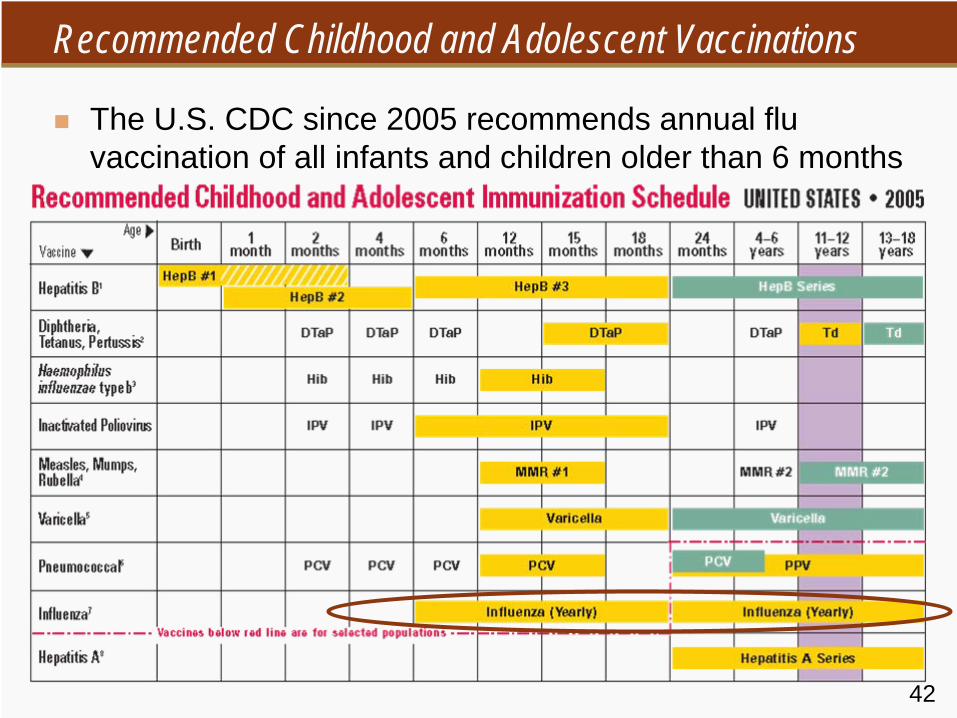
Recommended Childhood and Adolescent Vaccinations
The U.S. CDC since 2005 recommends annual flu vaccination of all infants and children older than 6 months
43Source: Belshe. (1993). N Engl
J Med, 378,
1405.
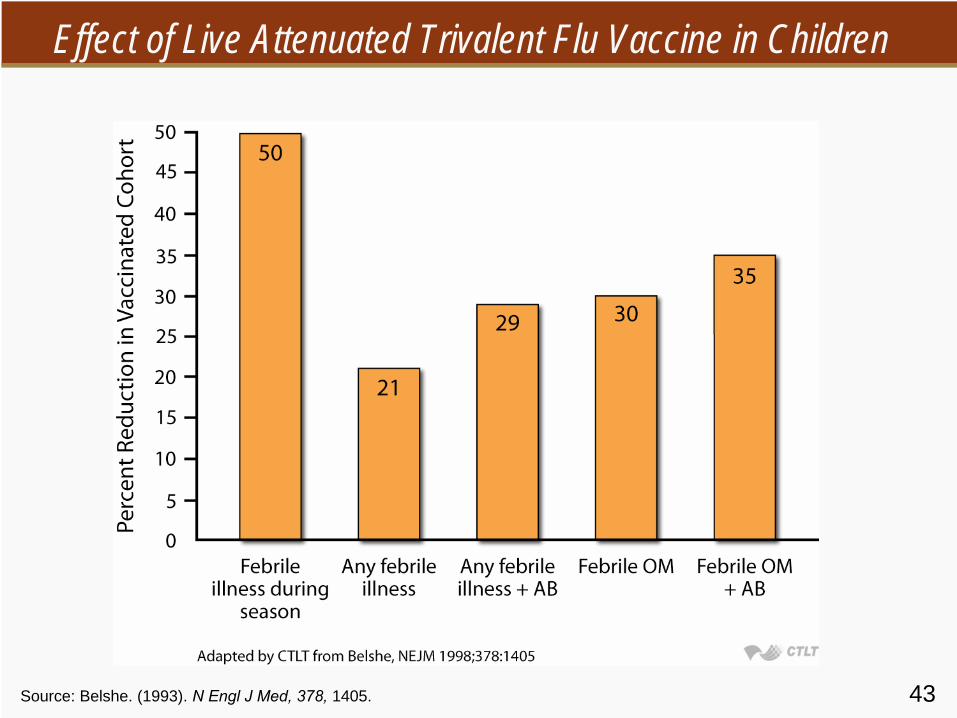
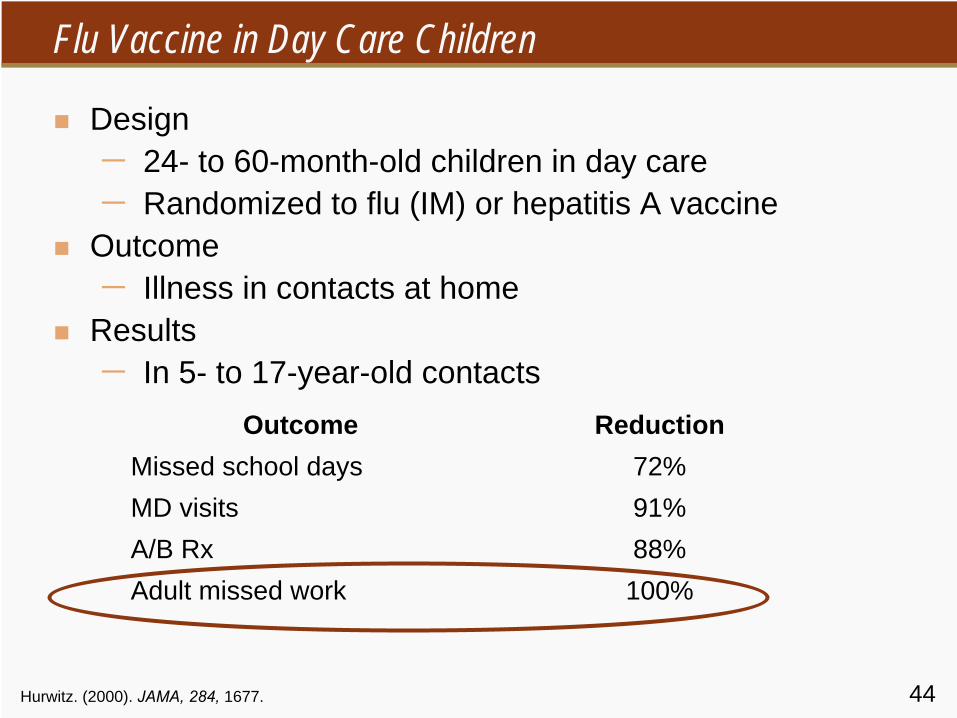
Effect of Live Attenuated Trivalent Flu Vaccine in Children
44Hurwitz. (2000). JAMA, 284,
1677.
Flu Vaccine in Day Care Children
Design−
24- to 60-month-old children in day care
−
Randomized to flu (IM) or hepatitis A vaccineOutcome−
Illness in contacts at home
Results−
In 5- to 17-year-old contacts
Outcome ReductionMissed school days 72%MD visits 91%A/B Rx 88%Adult missed work 100%
45
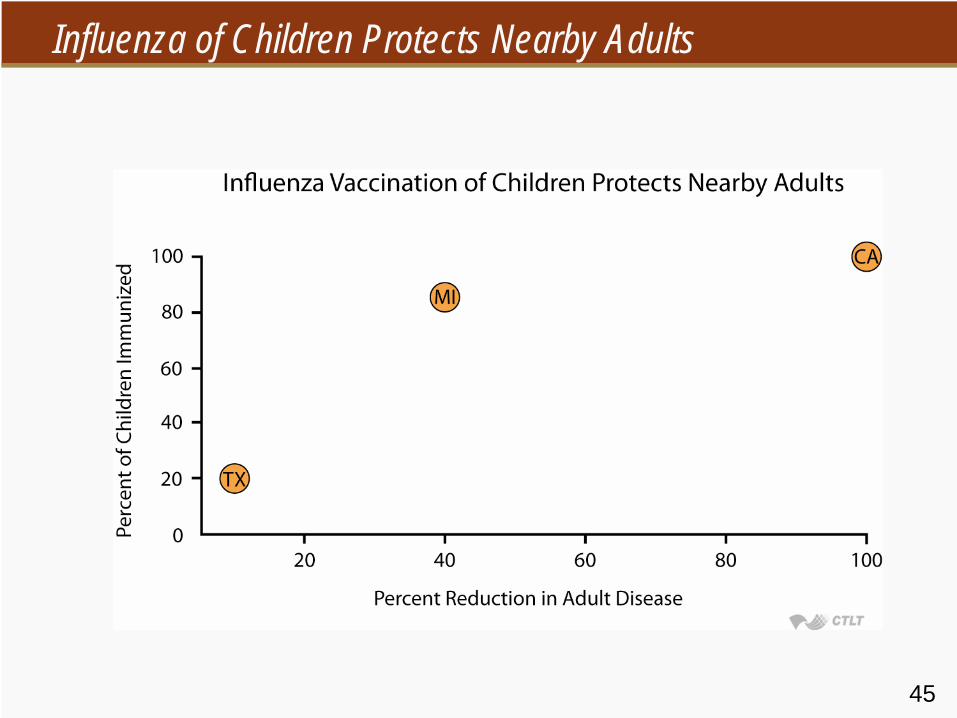
Influenza of Children Protects Nearby Adults
Section C
Vaccine Production and Surveillance
47
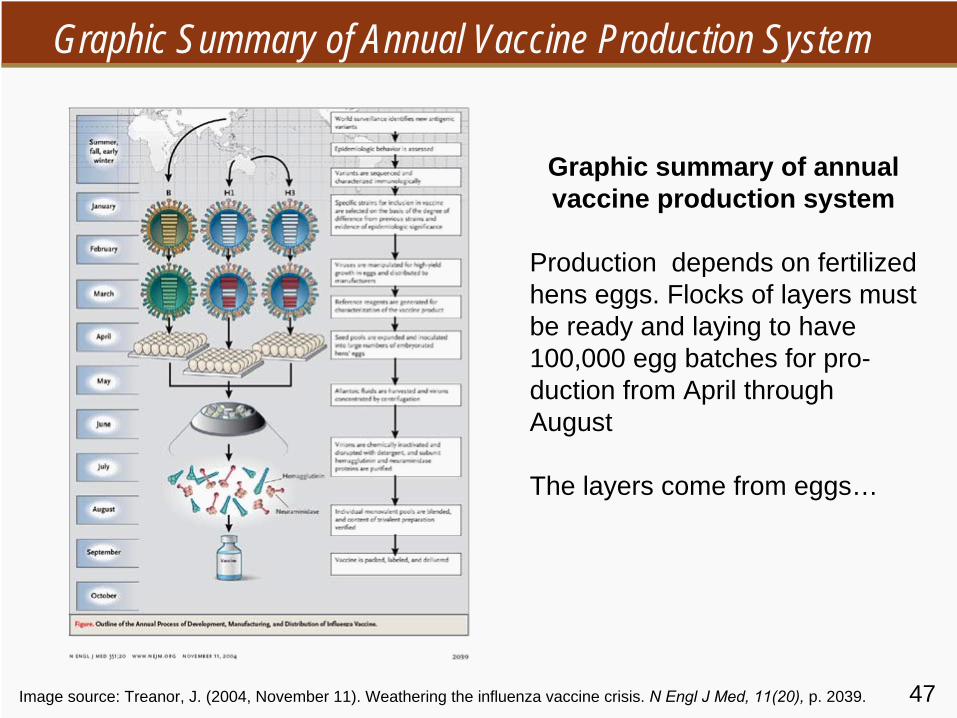
Graphic Summary of Annual Vaccine Production System
Graphic summary of annual vaccine production system
Production depends on fertilized hens eggs. Flocks of layers must be ready and laying to have 100,000 egg batches for pro- duction from April through August
The layers come from eggs…
Image source: Treanor, J. (2004, November 11). Weathering the influenza vaccine crisis. N Engl
J Med, 11(20),
p. 2039.
48
Influenza Vaccination Recommendation, U.S.A.
49
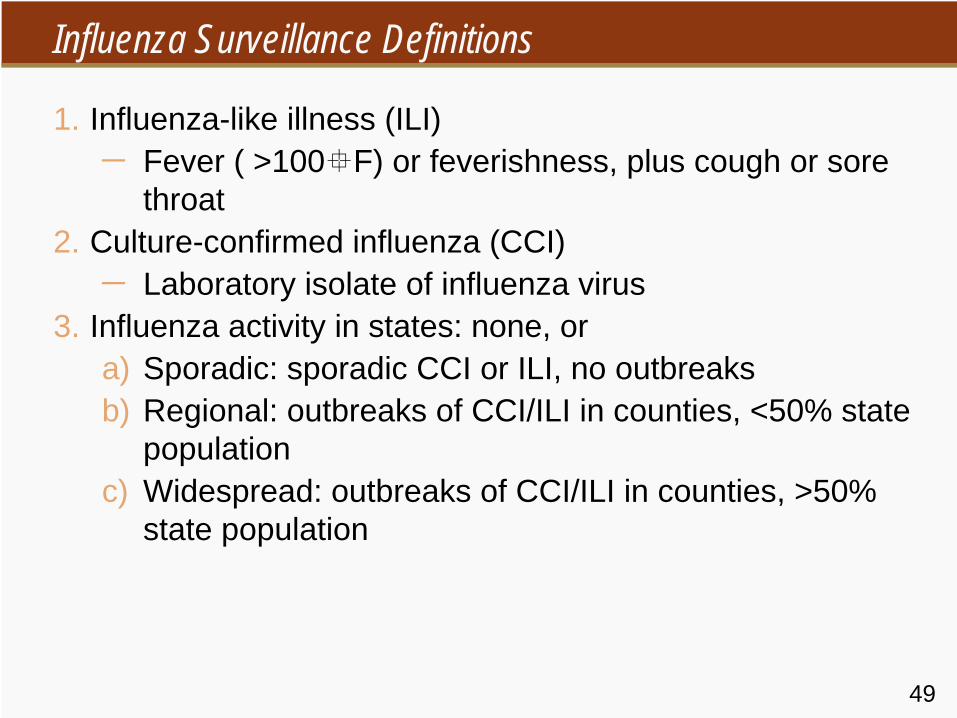
Influenza Surveillance Definitions
1. Influenza-like illness (ILI)−
Fever ( >100 F) or feverishness, plus cough or sore throat
2. Culture-confirmed influenza (CCI)−
Laboratory isolate of influenza virus
3. Influenza activity in states: none, ora) Sporadic: sporadic CCI or ILI, no outbreaksb) Regional: outbreaks of CCI/ILI in counties, <50% state
populationc) Widespread: outbreaks of CCI/ILI in counties, >50%
state population
50
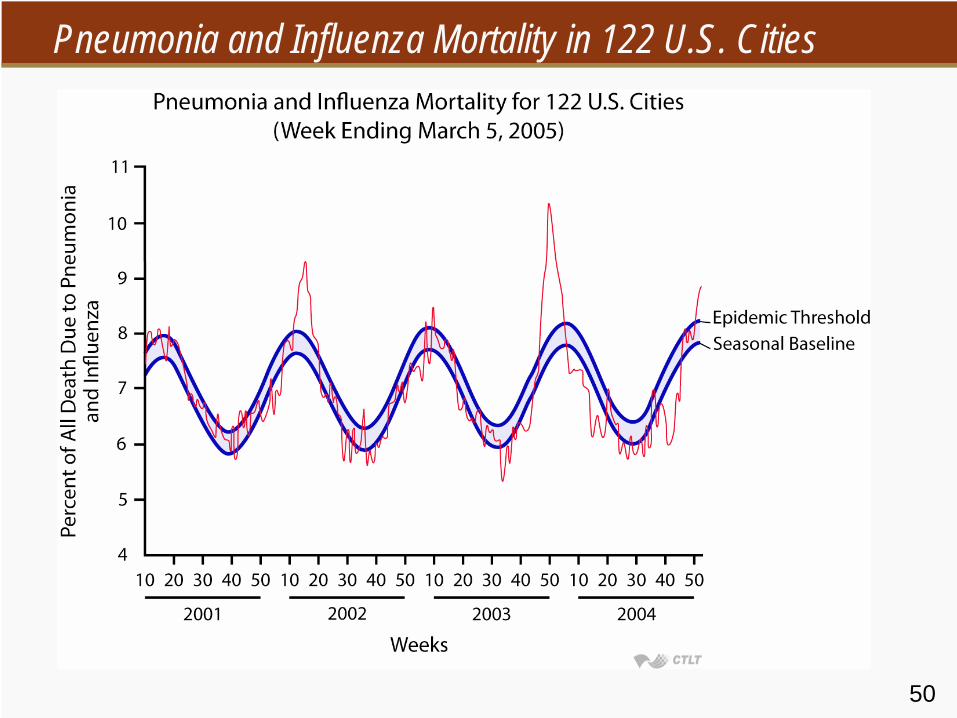
Pneumonia and Influenza Mortality in 122 U.S. Cities
51
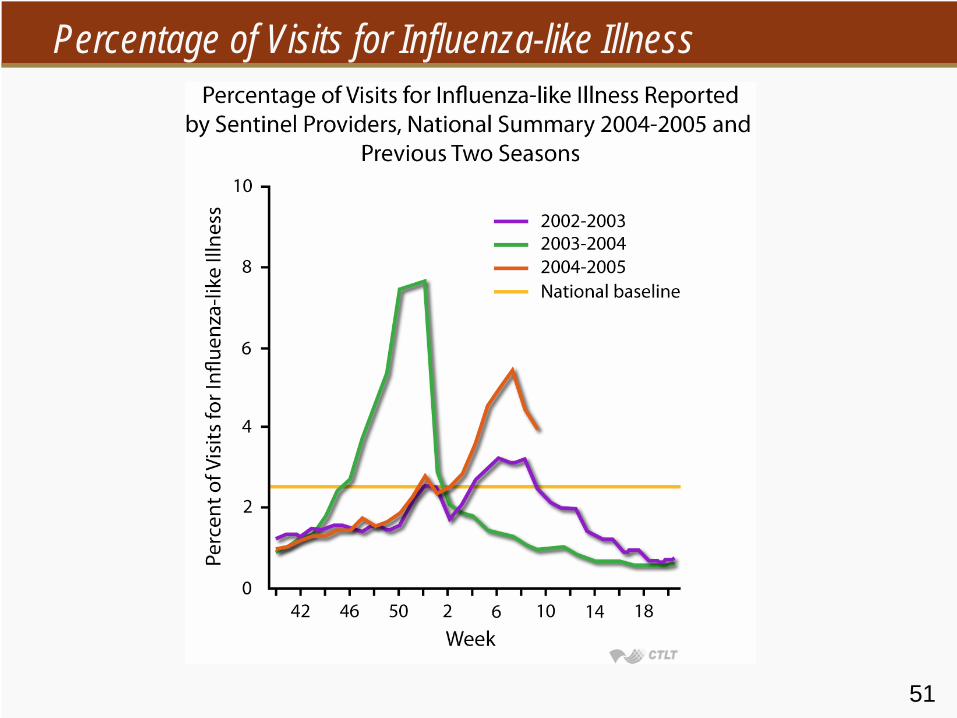
Percentage of Visits for Influenza-like Illness
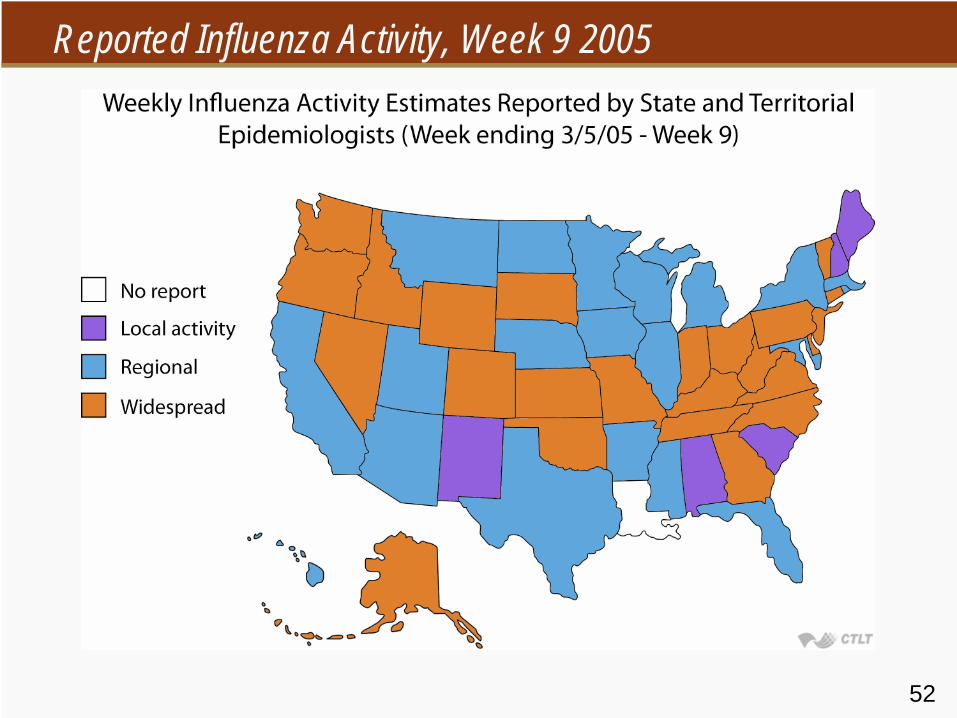
52
Reported Influenza Activity, Week 9 2005

Section D
Pandemic
54
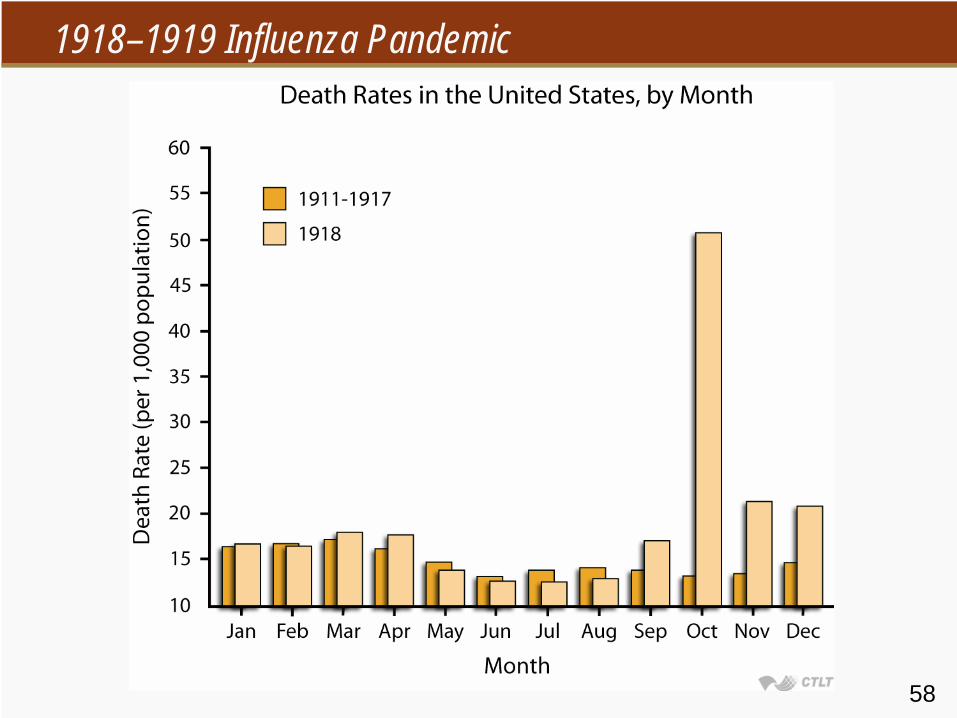
1918–1919 Influenza Pandemic
Called “Spanish flu”Caused at least 20 million deaths worldwide in one yearAssociated with end of WW I−
Caused 43,000 U.S. military deaths, compared to 54,000 battle deaths
In the U.S. 550,000 (about 1 in 200) died in winter 1918–1919−
About 2% of all Native Americans died
Case fatality was up to 50% in even young patientsMostly ignored by historians
55
1918–1919 Influenza Pandemic
In the U.S. 550,000 (about 1 in 200) died in winter 1918–1919−
About 2% of all Native Americans died
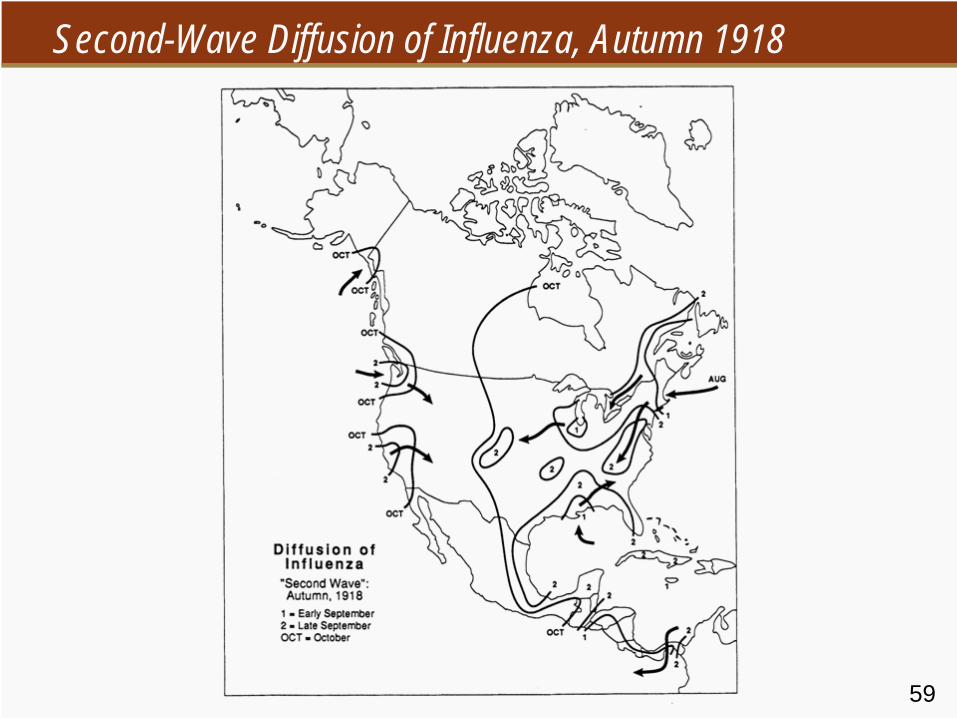
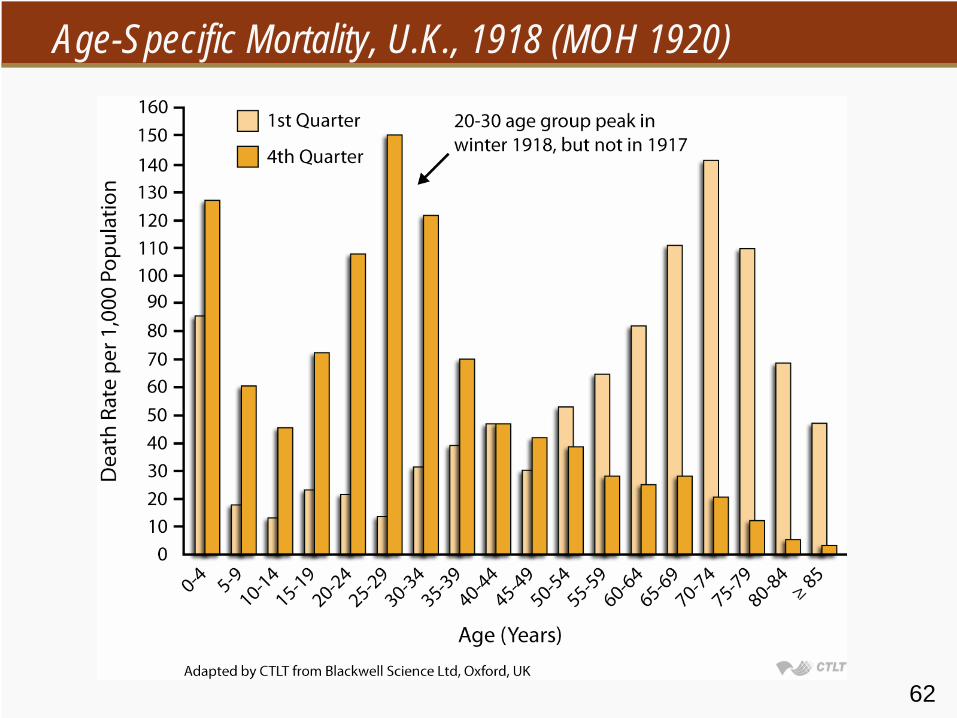
Case fatality was up to 50% in young adults, death within 24–48 hours with “heliotrope cyanosis”Unusual mortality in 20 to 40 age group and pregnant womenMajor crisis in September–October 1918: shortage of coffins, hospital staff were ill or dying, public admin flailingand failing
56
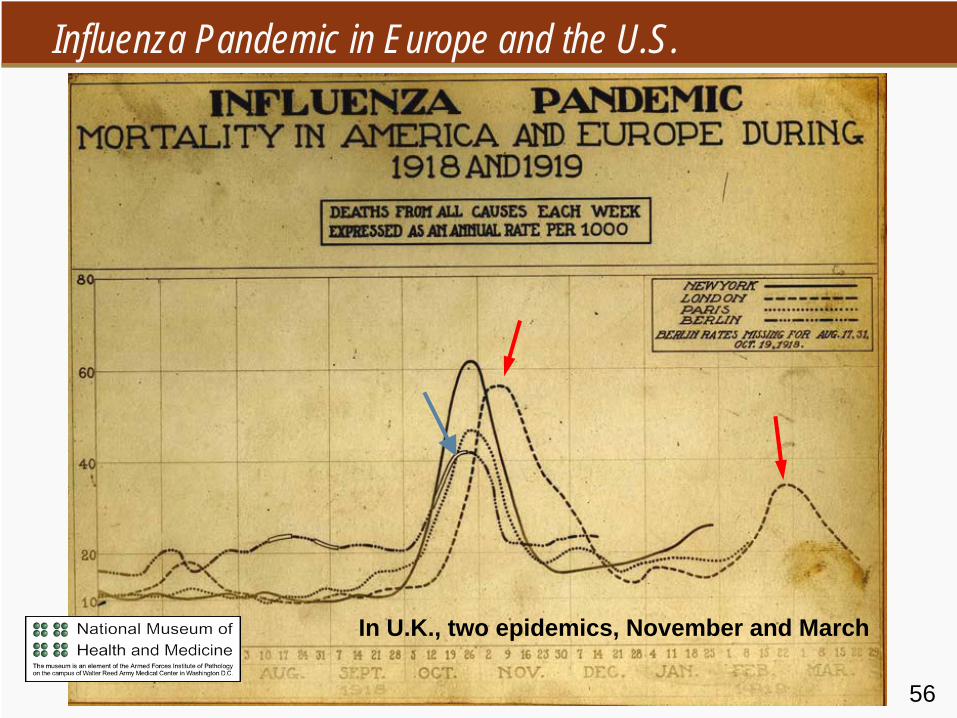
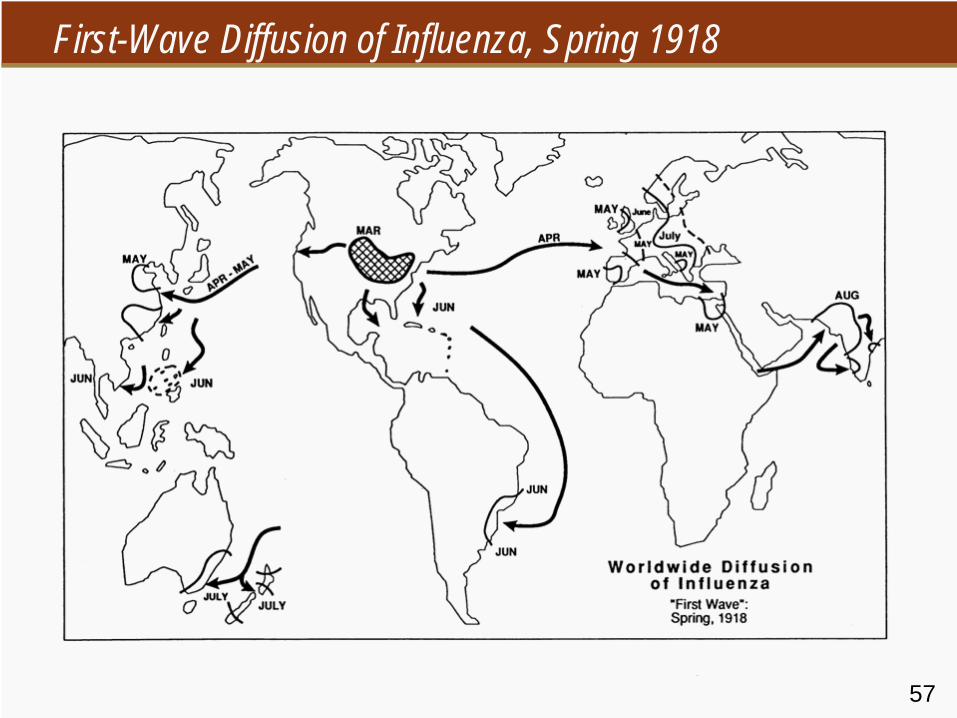
In U.K., two epidemics, November and March
Influenza Pandemic in Europe and the U.S.
57
First-Wave Diffusion of Influenza, Spring 1918
58
1918–1919 Influenza Pandemic
59
Second-Wave Diffusion of Influenza, Autumn 1918
60
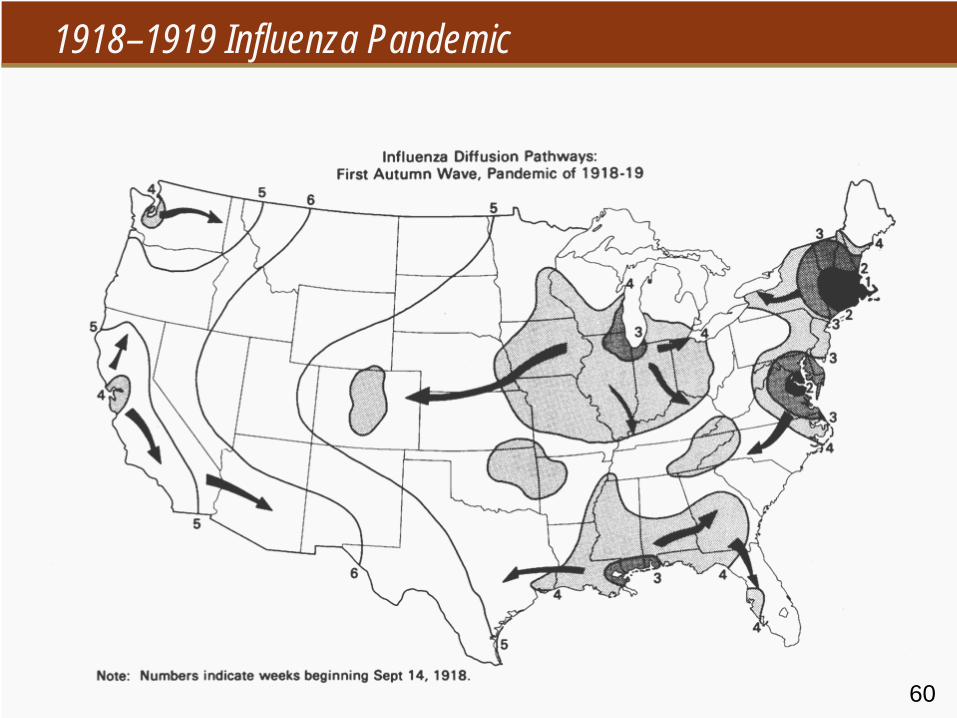
1918–1919 Influenza Pandemic
61
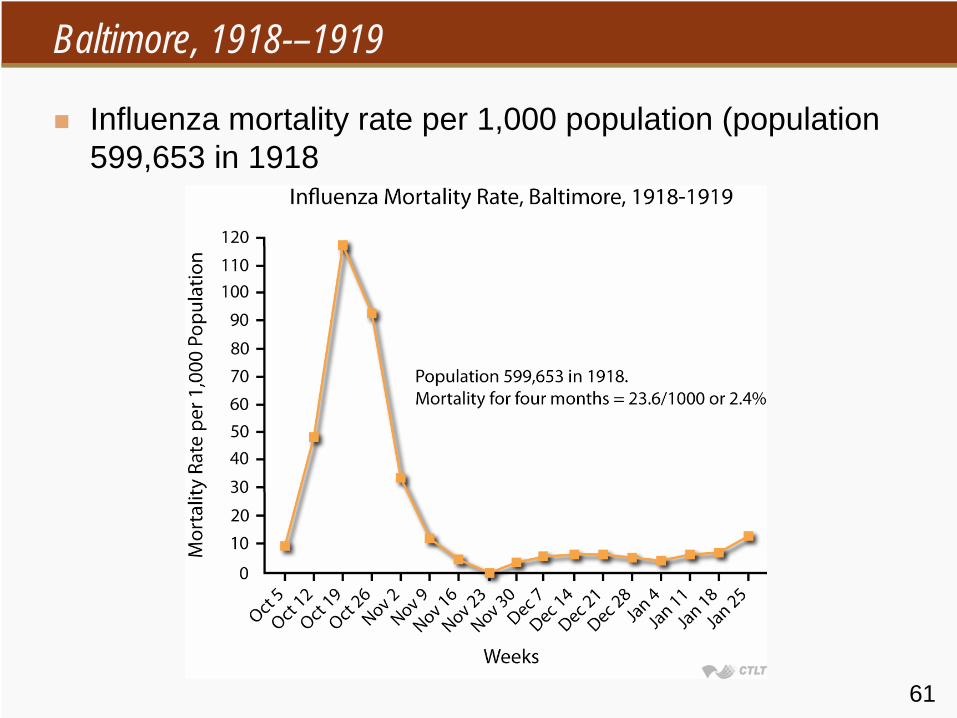
Baltimore, 1918-–1919
Influenza mortality rate per 1,000 population (population 599,653 in 1918
62
Age-Specific Mortality, U.K., 1918 (MOH 1920)
63
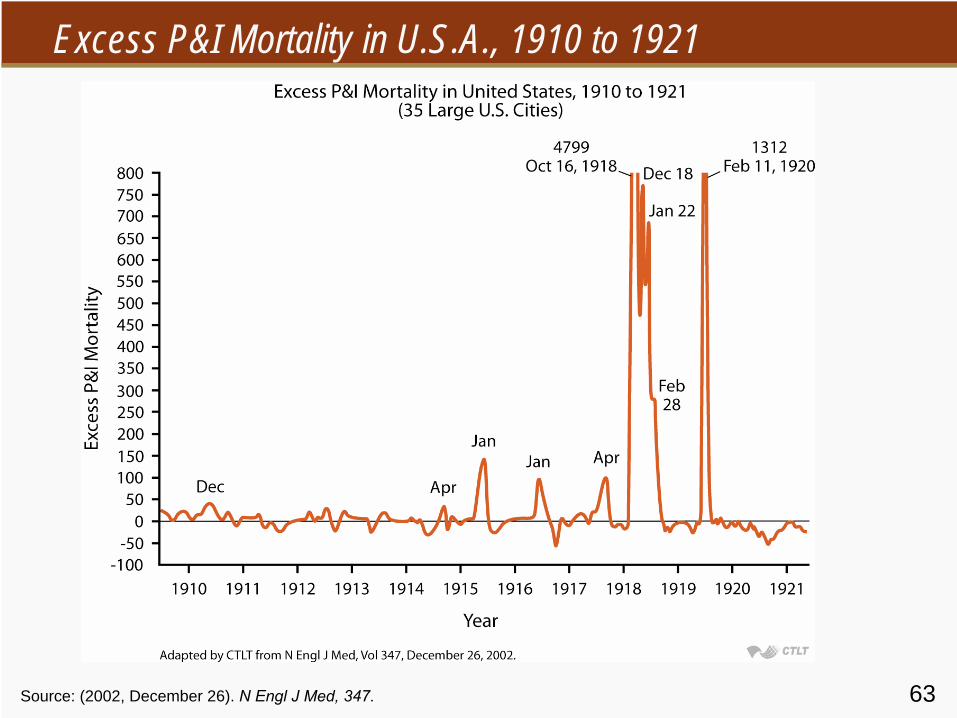
Excess P&I Mortality in U.S.A., 1910 to 1921
Source: (2002, December 26). N Engl
J Med, 347.
64
Burying Influenza Victims
Source: Barry J. The Great Influenza: the epic story of the deadliest plague in history.New York: Viking Penguin, 2004.
In Philadelphia the number of dead quickly overwhelmed the city’s ability to handle bodies. It was forced to bury people, without coffins, in mass graves and soon began using steam shovels to dig the graves.
65
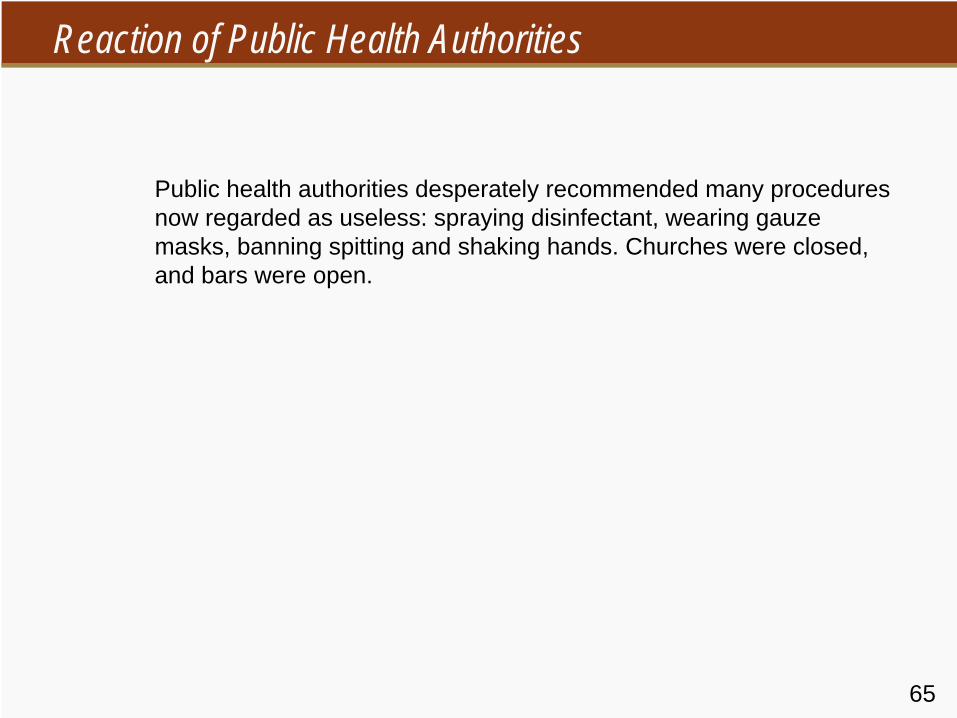
Reaction of Public Health Authorities
Public health authorities desperately recommended many procedures now regarded as useless: spraying disinfectant, wearing gauze masks, banning spitting and shaking hands. Churches were closed, and bars were open.
66
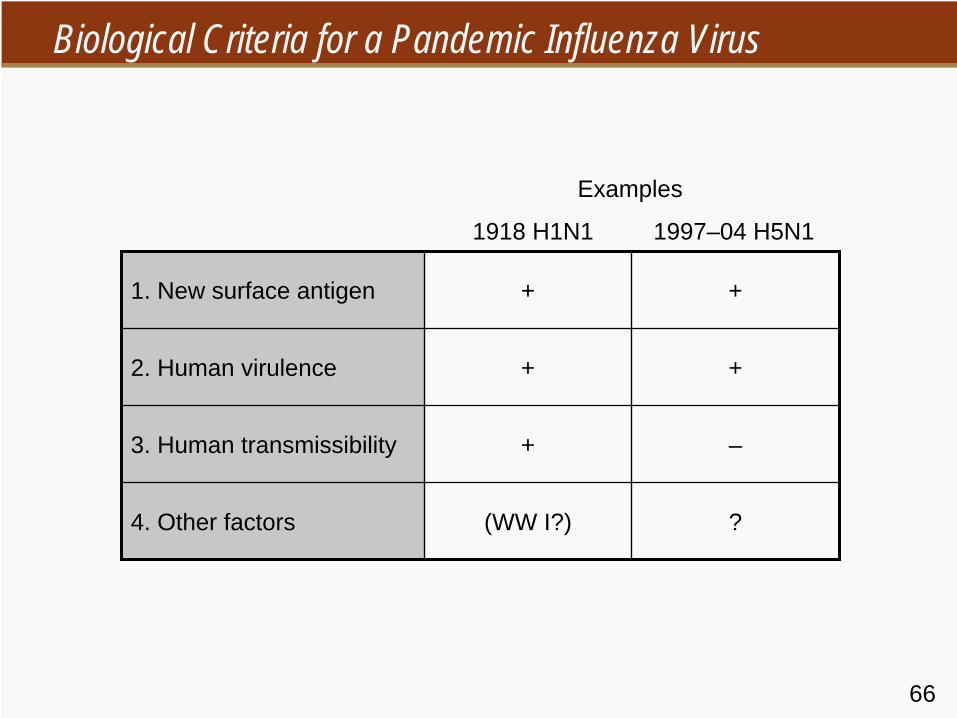
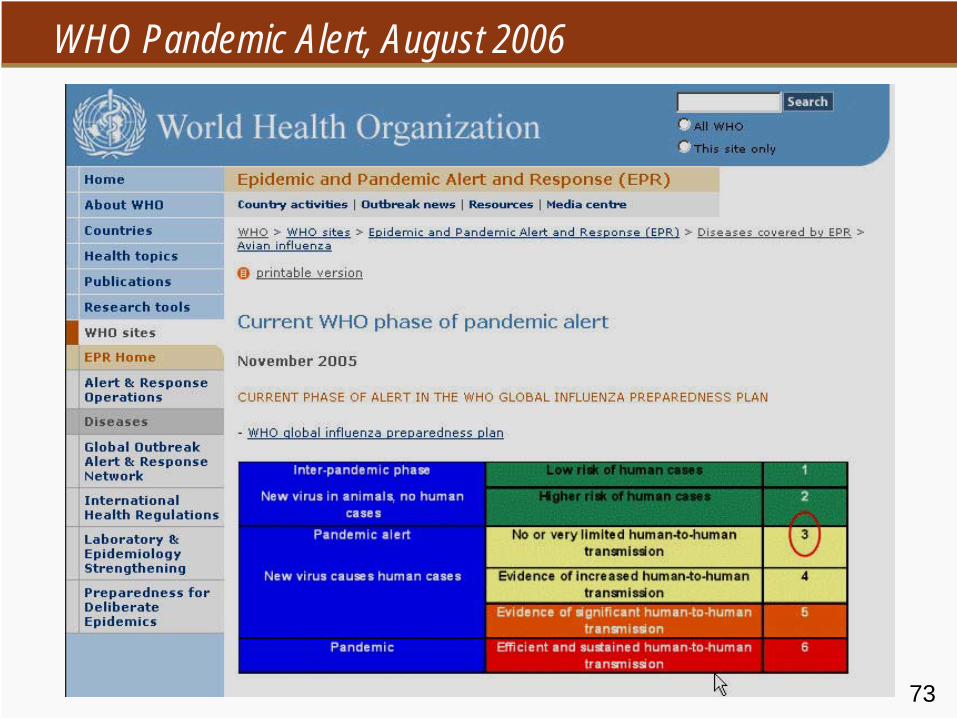
Biological Criteria for a Pandemic Influenza Virus
1. New surface antigen + +
2. Human virulence + +
3. Human transmissibility + –
4. Other factors (WW I?) ?
1918 H1N1 1997–04 H5N1
Examples
67
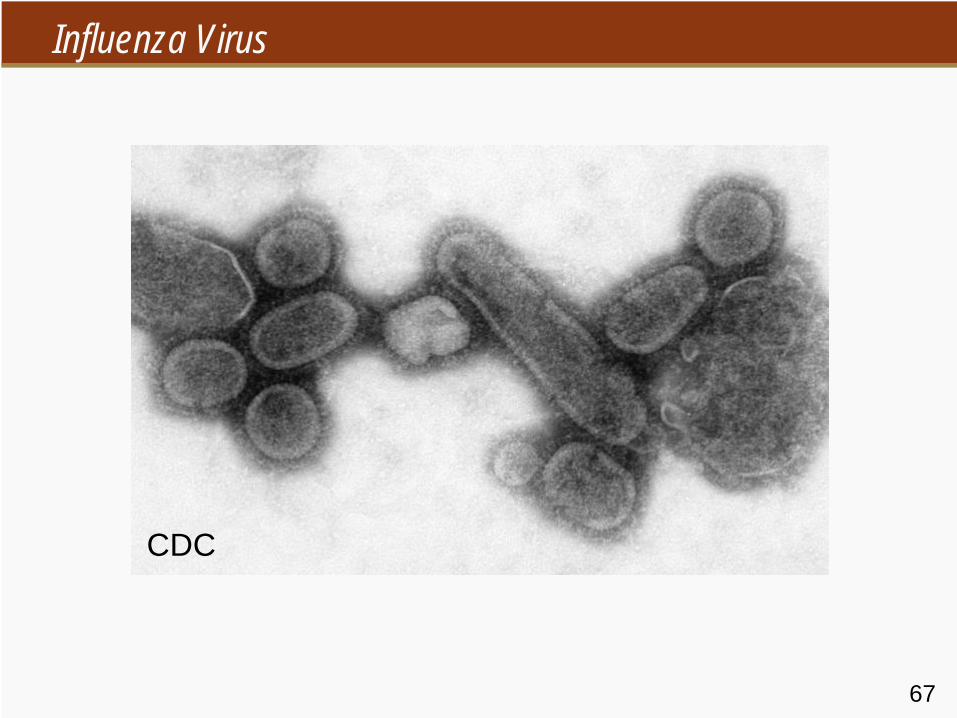
Influenza Virus
CDC
68
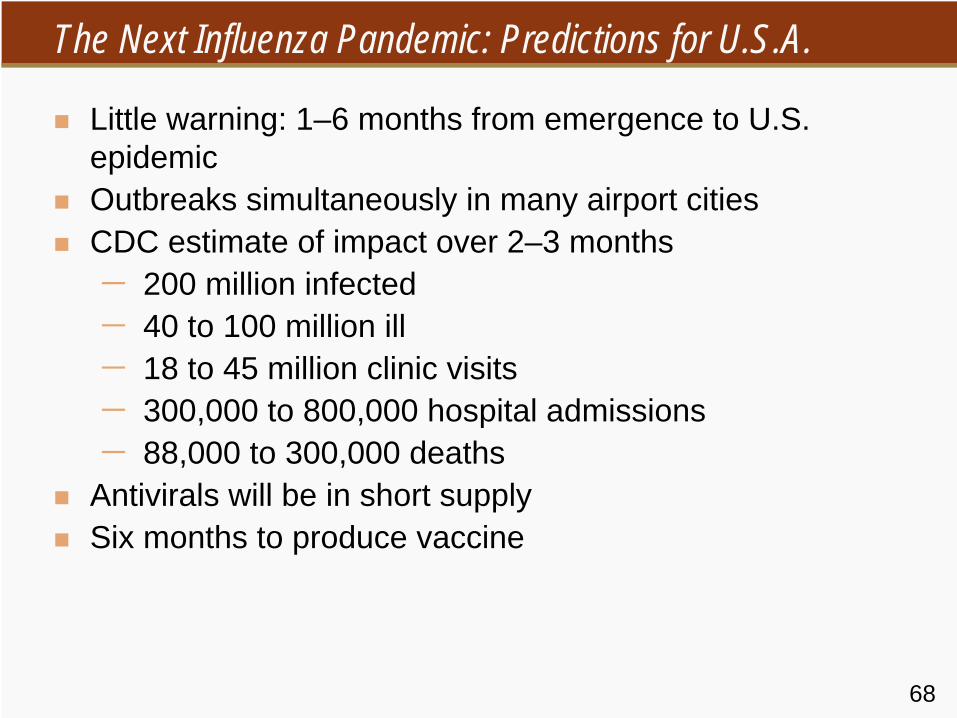
The Next Influenza Pandemic: Predictions for U.S.A.
Little warning: 1–6 months from emergence to U.S. epidemicOutbreaks simultaneously in many airport citiesCDC estimate of impact over 2–3 months−
200 million infected
−
40 to 100 million ill−
18 to 45 million clinic visits
−
300,000 to 800,000 hospital admissions−
88,000 to 300,000 deaths
Antivirals will be in short supplySix months to produce vaccine
69
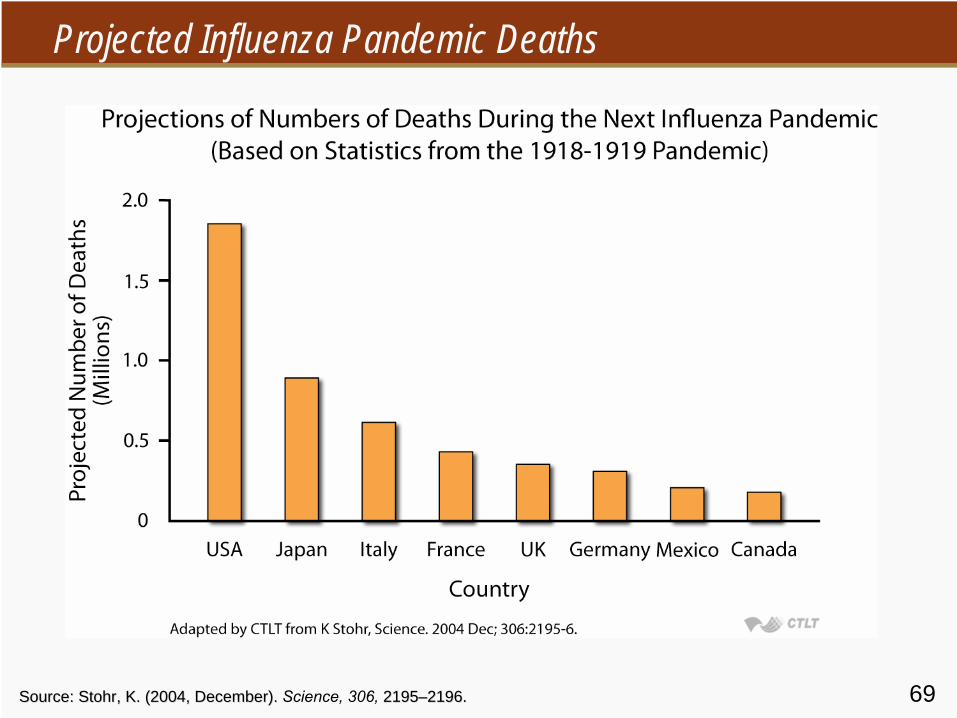
Projected Influenza Pandemic Deaths
Source: Source: StohrStohr, K. (2004, December). , K. (2004, December). Science, 306,
21952195––2196.2196.
70
The Next Influenza Pandemic: Current Plans
Worldwide surveillance, with rapid identification of new viruses (in place)Plan for rapid vaccine productionStockpile antivirals, especially for military, emergency, and medical staff
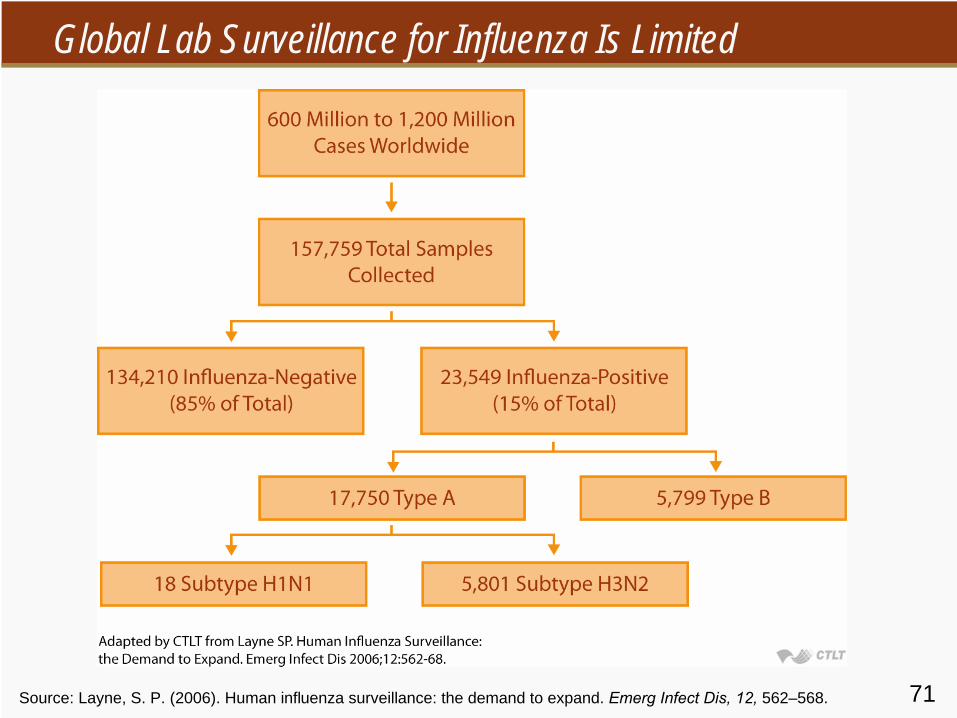
71Source: Layne, S. P. (2006). Human influenza surveillance: the demand to expand. Emerg
Infect Dis, 12,
562–568.
Global Lab Surveillance for Influenza Is Limited
72
Pandemic Policy Problems
Not enough vaccineNot enough antivirals (oseltamvir)Classical epidemic control−
Physical restriction of people
Isolation of the sickQuarantine of the exposedBan all public gatherings: work, school, shopping malls, theaters, churches, and yes, bars and clubs
73
WHO Pandemic Alert, August 2006
74
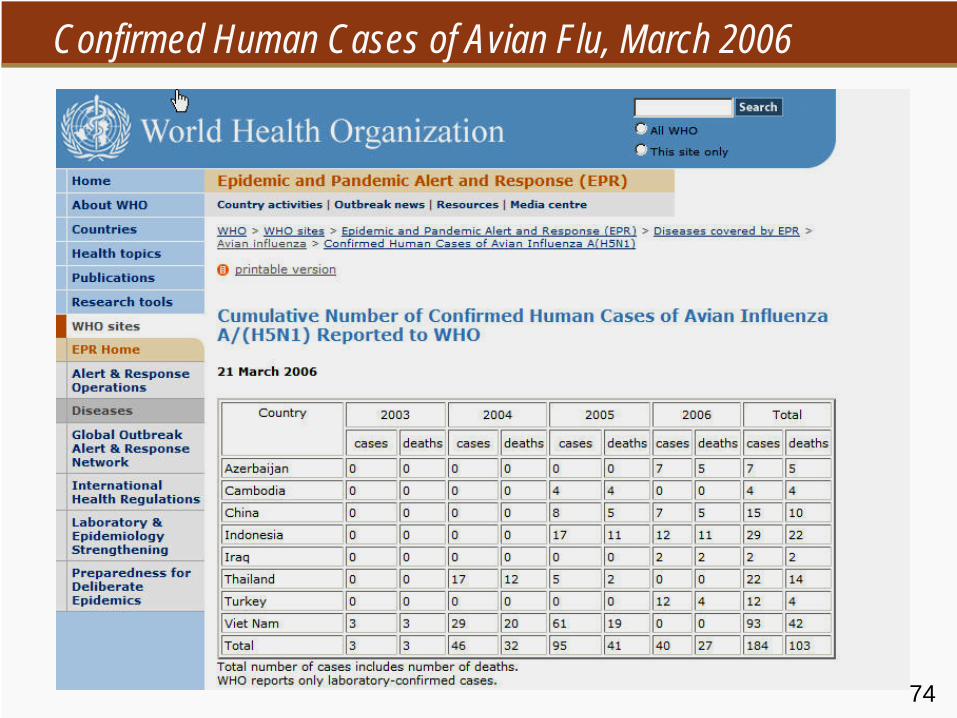
Confirmed Human Cases of Avian Flu, March 2006

75
WHO Data: Age Group by Outcome and Country
76
Vaccine for H5N1 Influenza
Vaccine difficult to grow in routine egg system, since pathogenic to chickens and chick embryosPreliminary Phase I trials at Johns Hopkins and elsewhere have shown safety and immunogenicity, though doses for immunization are much higher than for previous vaccines
77
Nine Countries Produce Flu Vaccine in 2005
AustraliaCanadaFranceGermanyItalyJapanNetherlandsUnited KingdomUnited States
78
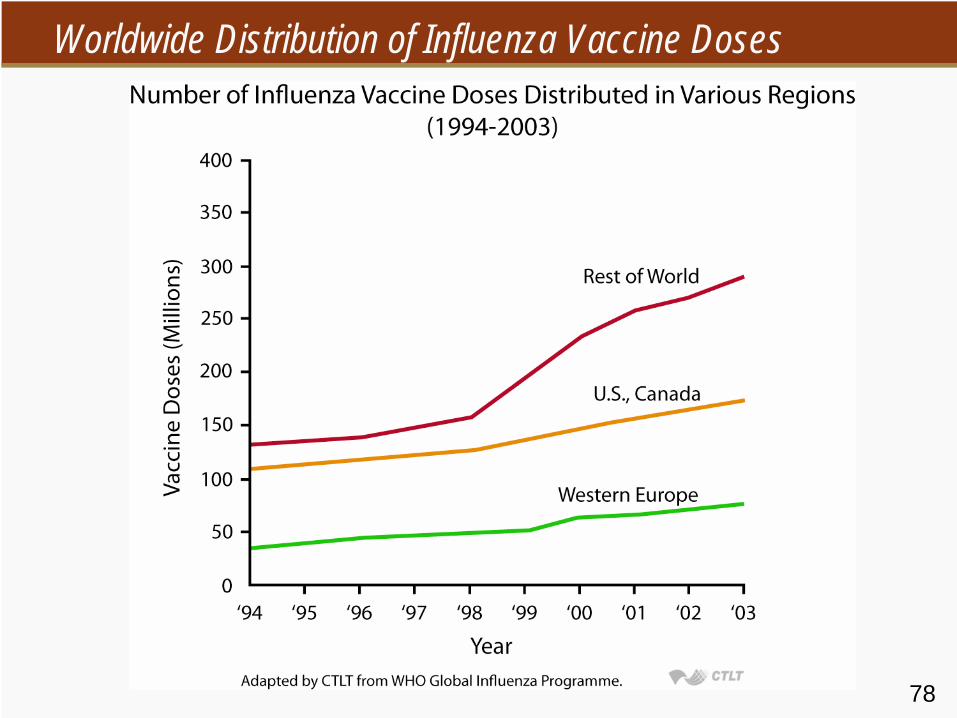
Worldwide Distribution of Influenza Vaccine Doses
79
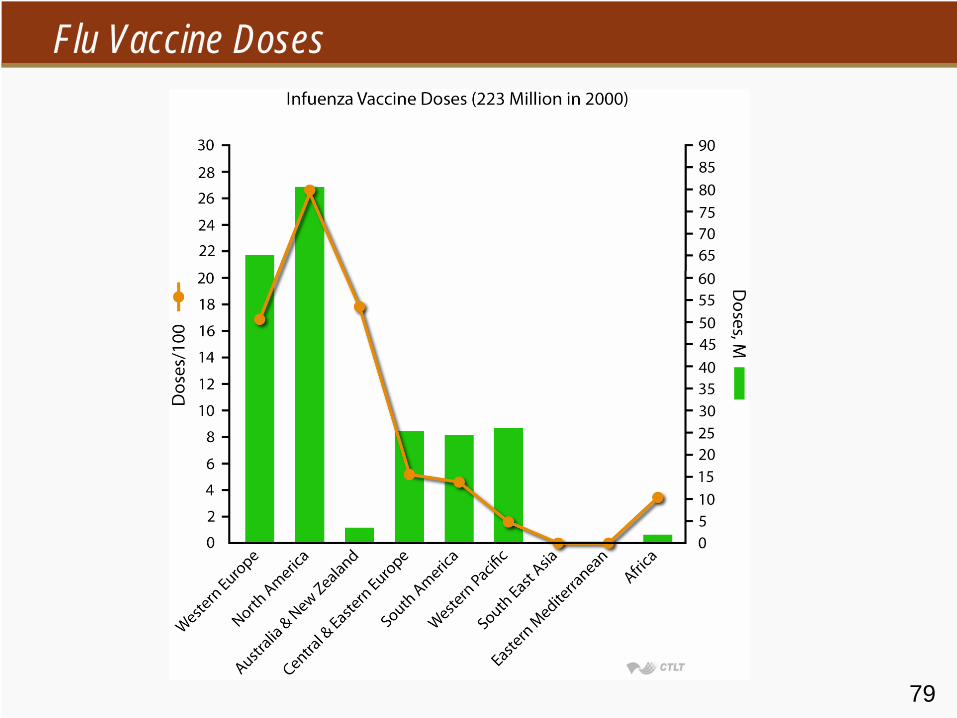
Flu Vaccine Doses
80
Benefit of Pandemic Influenza Planning and Fears
“Silver lining” factor−
Improved surveillance
−
Planning for vaccine strategies, vaccine supply−
Attention of media, governments, markets
−
May break the vicious cycle of neglect, followed by no effort or investment
Concluding Remarks: Infectiousness
William Moss, MD, MPHJohns Hopkins University
82
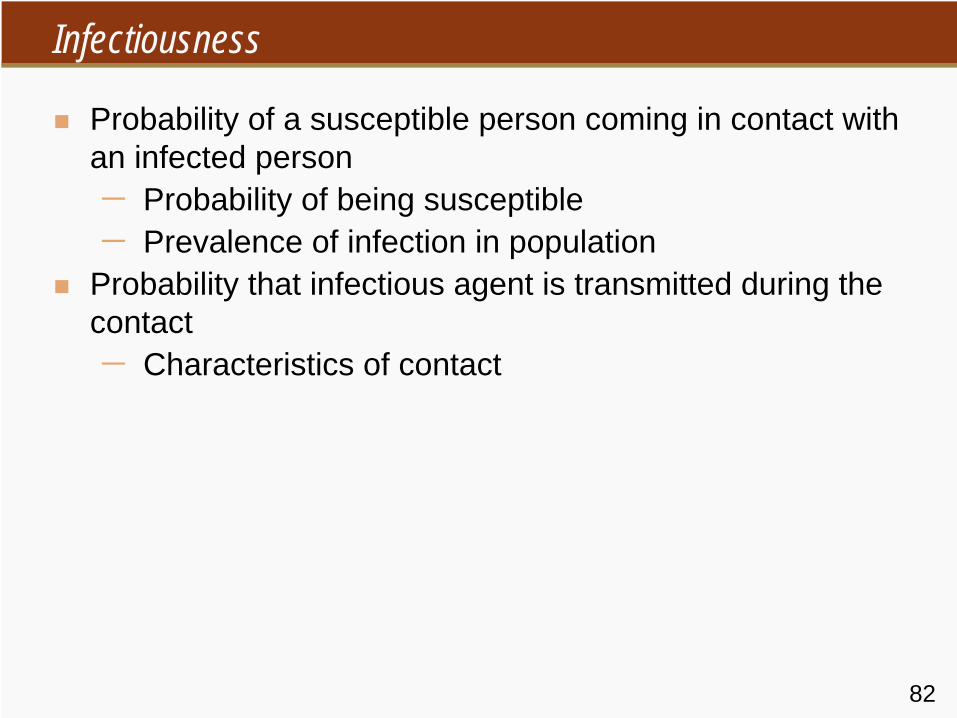
Infectiousness
Probability of a susceptible person coming in contact with an infected person−
Probability of being susceptible
−
Prevalence of infection in populationProbability that infectious agent is transmitted during the contact−
Characteristics of contact
83
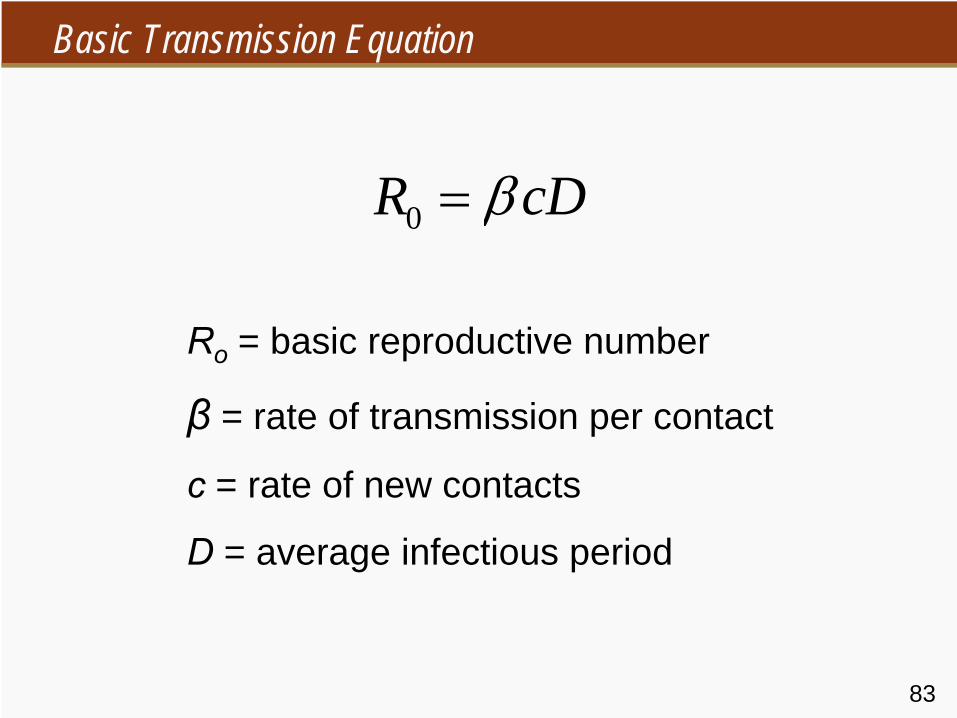
0R cDβ=
Ro
= basic reproductive number
β
= rate of transmission per contact
c
= rate of new contacts
D
= average infectious period
Basic Transmission Equation
84
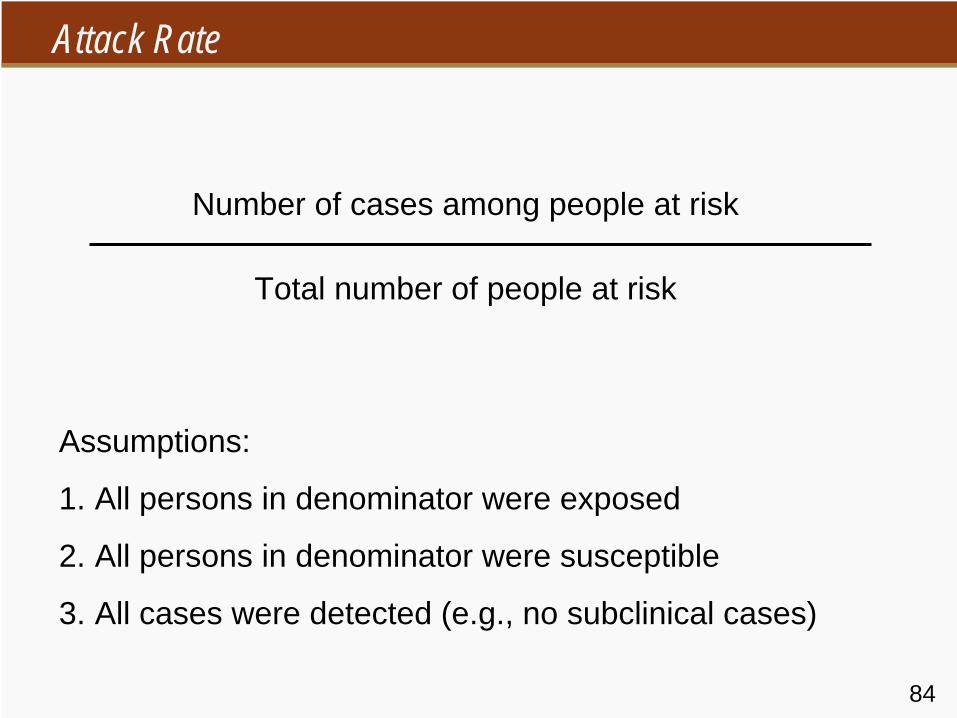
Number of cases among people at risk
Total number of people at risk
Assumptions:
1. All persons in denominator were exposed
2. All persons in denominator were susceptible
3. All cases were detected (e.g., no subclinical cases)
Attack Rate
85
–– R. E. Hope Simpson. (1952, September 20).R. E. Hope Simpson. (1952, September 20). Lancet, 2(12),, 2(12), 549549––554.554.
Infectiousness of communicable diseases in the household (measles, chickenpox, and mumps)
Infectiousness in the Household
86
Hope Simpson I
“Infectiousness, the ability of a disease to spread in a community, is a measurable characteristic and should be susceptible of being expressed precisely.”
87
Hope Simpson II
“It is insufficient to recognize that measles is more infectious than mumps. How much more infectious? Does infectiousness vary from time to time, and from place to place? What other attributes are quantitatively associated with its degree of infectiousness?”
88
Hope Simpson III
Study of household chains of transmission of measles, mumps, and chicken pox−
Gloucestershire, England
−
1947 to 1951−
Active household case surveillance after identification of index case
−
Identified susceptible siblings through parental report
89
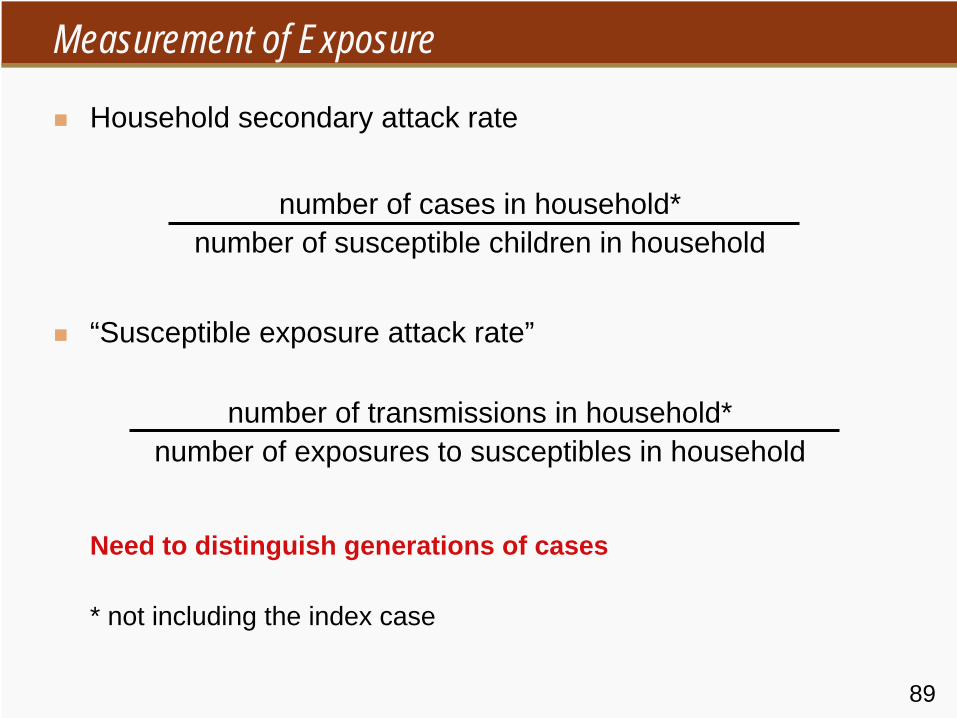
Measurement of Exposure
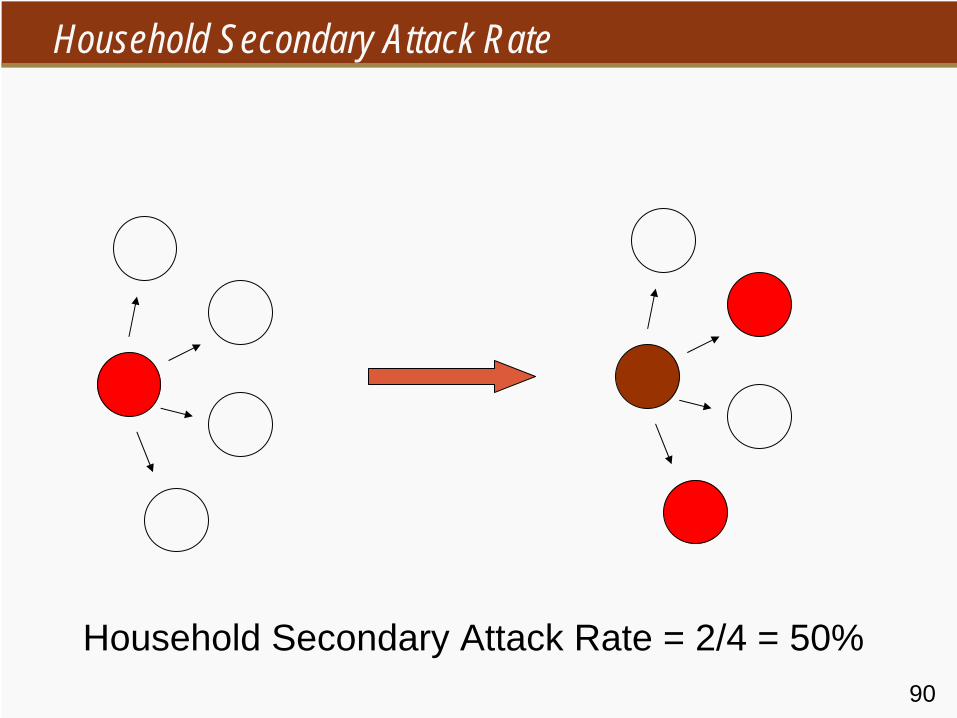
Household secondary attack rate
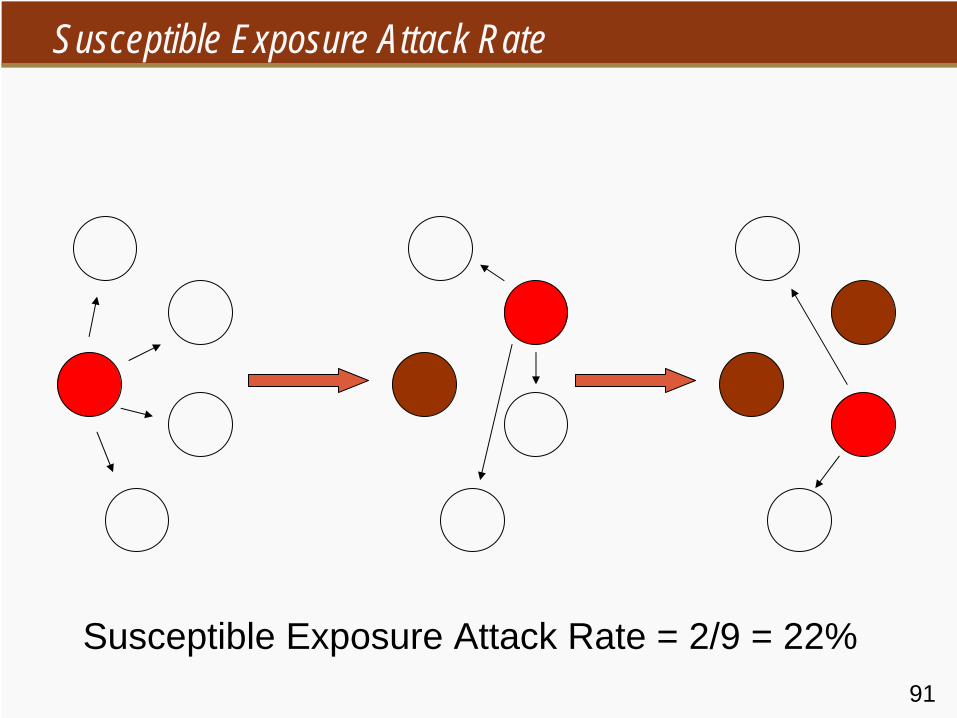
“Susceptible exposure attack rate”
Need to distinguish generations of cases
* not including the index case
number of cases in household*number of susceptible children in household
number of transmissions in household*number of exposures to susceptibles in household
90
Household Secondary Attack Rate = 2/4 = 50%
Household Secondary Attack Rate
91
Susceptible Exposure Attack Rate = 2/9 = 22%
Susceptible Exposure Attack Rate
92
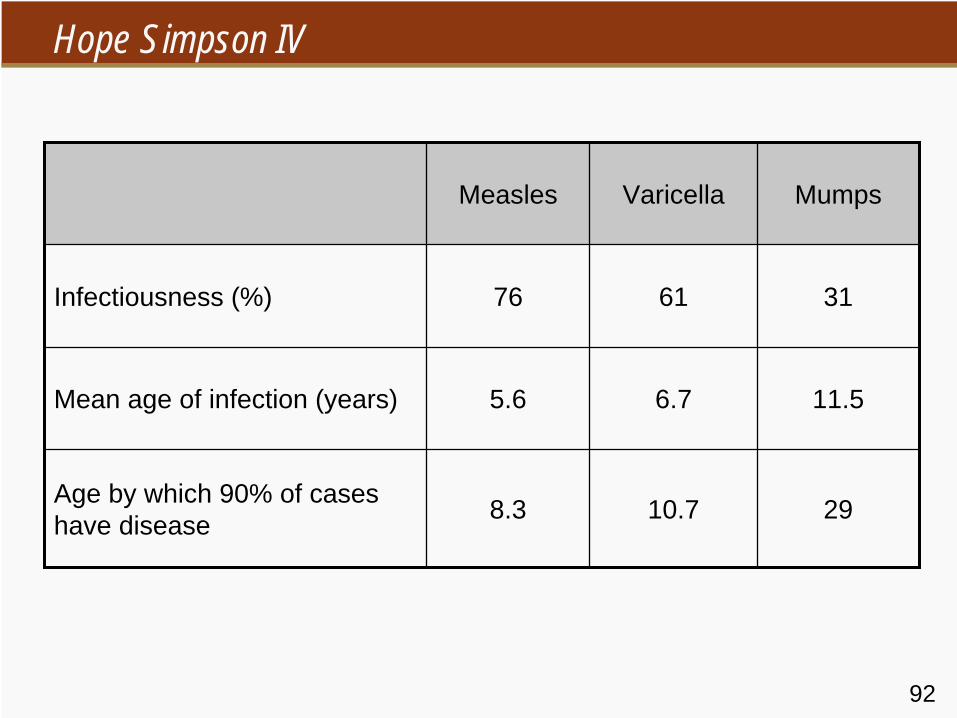
Measles Varicella Mumps
Infectiousness (%) 76 61 31
Mean age of infection (years) 5.6 6.7 11.5
Age by which 90% of cases have disease 8.3 10.7 29
Hope Simpson IV
93
Hope Simpson V
First quantitative estimate of infectiousnessMeasles most infectiousAs infectiousness increases, the average age of infection decreasesLittle seasonal variation in infectiousness