Irony, Types & Examples. Three Types of Irony Verbal Irony Situational Irony Dramatic Irony.
Influencing the Bureaucracy: The Irony of Congressional Oversight
Joshua D. Clinton
David E. Lewis Jen Selin
Abstract
Does the President or Congress have more influence over policy making by the bureaucracy? Despite a wealth of theoretical guidance, progress on this important question has proven elusive due to competing theoretical predictions and severe difficulties in measuring agency influence and oversight. We use a survey of 2,400 federal executives to assess political influence, congressional oversight and the policy preferences of agencies, committees, and the president on a comparable scale. Analyzing variation in political influence across and within agencies reveals that Congress is less influential relative to the White House when more committees are involved. While increasing the number of involved committees may maximize the electoral benefits for members, it may also undercut the ability of Congress as an institution to collectively respond to the actions of the presidency or the bureaucracy.
Working Paper: 5-2012 Research Concentration: Executive Politics and Regulatory Policymaking

1
The Final Report of the National Commission on Terrorist Attacks Upon the United States
urged that “Congress should create a single, principal point of oversight and review for homeland
security… [We] believe that Congress does have the obligation to choose one in the House and
one in the Senate, and that this committee should be a permanent standing committee with a
nonpartisan staff” (pg. 421). Despite this recommendation, Congress created a situation where
108 committees and subcommittees oversee the Department of Homeland Security.1 Many
believe that this amount of oversight has prevented Congress from being able to effectively
monitor or control the department. Testifying before Congress after the attacks at Fort Hood,
9/11 Commission Chairman Thomas Kean and Vice Chairman Lee Hamilton argued that
“enduring fractured and overlapping committee jurisdictions on both sides of the Hill have left
Congressional oversight in a unsatisfactory state” (Kaniewski, 2010). Mann and Ornstein (2006)
similarly refer to the lack of oversight as “crushing,” and the New York Times opines that the
oversight is “a comedy that invites a fresh national tragedy…”2 Critics lodge these charges
despite—or perhaps because—so many committees and subcommittees exercise jurisdiction over
the department. This example underscores the importance of how the internal organization of
Congress might affect whether Congress or the president exercises more influence over agency
policymaking.
The question of political control over the bureaucracy has a lengthy history because of the
administrative state’s critical role in policy making (e.g., de Tocqueville 1835; Weber 1946;
Wilson 1887; Wilson 1989). If unelected administrators make policy, they should arguably do so
at the behest of democratically elected officials such as Congress or the president. Difficulties
emerge because both Congress and the president have a constitutional claim over the actions of
1 See, “Who Oversees Homeland Security? Um, Who Doesn’t?” National Public Radio, July 10, 2010
(http://www.npr.org/templates/story/story.php?storyId=128642876, accessed January 31, 2011). 2 See, for example, “Wayward Eye on the Homeland.” New York Times, December 20, 2008, A26.
2
the bureaucracy and the two branches often compete for control. This situation begs the question:
to whom are bureaucracies more responsive? Further, how does the internal organization of
Congress shape political responsiveness? There is no shortage of predictions about the possible
effects of increased committee involvement. Scholars have argued that more committees with
overlapping jurisdictions and interests in agency policy may increase (e.g., Bendor 1985;
Aberbach 1990; King 1997; O’Connell 2006) or decrease (e.g., Dodd and Schott 1979; Miller and
Hammond 1990; Hammond and Knott 1996, 1999; Gailmard 2009) the relative influence of
Congress over the bureaucracy.
Unfortunately, difficulties in measuring key relationships detailed in the wide ranging
theoretical predictions have limited scientific progress. In particular, how can we measure the
elusive concept of influence? We advance the literature in important ways by using a survey of
2,400 federal executives responsible for implementing agency policy in 128 different agencies
and bureaus that was conducted during the 110th
Congress (2007-2009). Scholars have certainly
conducted important surveys of federal executives in the past (e.g., Aberbach and Rockman 2000;
Golden 2000; Maranto 1993a,b; 2005; Maranto and Hult 2004; Meier and Nigro 1976), but they
have not focused on the question of relative congressional and presidential influence over the
bureaucracy and they have typically focused on a limited number of agencies or executives.
Between and within agencies, we explore whether the institutional structure of Congress
and a system of bureaucratic oversight that relies on multiple committees with overlapping
jurisdiction tends to increase or decrease the ability of Congress to control the bureaucracy when
faced with a president from the opposing party. We find that when more committees are involved
in monitoring and potentially directing agency policymaking, Congress is less influential than the
president for determining agency policy. Increasing the number of involved committees may

3
maximize the electoral benefits for members and provide a platform for making public
proclamations on issues of importance (Mayhew 1974, Fiorina 1977), but it appears that an
increase in the number of committees also undercuts the ability of Congress to respond
collectively to the actions of the presidency or the bureaucracy. While our interest lies in the
necessary first step of characterizing the apparent empirical regularity rather than trying to test the
multiple of theories relating to conditions under which Congress may influence agency policy, the
provocative results suggest that an institutional arrangement that may be electorally beneficial for
individual members may not be optimal for Congress as a whole (Mayhew 1974).
The paper proceeds as follows. Section 1 reviews the possible relationships between
committee involvement and relative congressional influence over agency policy. Section 2
discusses the critical measurement issues and how our survey and new measures address existing
concerns. Section 3 uses variation between agencies to demonstrate that as the number of
committees actively overseeing an agency in the 110th
Congress increases, federal executives
report committees to be less influential relative to the president. Section 4 uses variation within
the programs administered by agencies to show that a weaker relationship also exists for
administration of policy within an agency. Section 5 locates the agencies relative to the
committees exercising active oversight to look for further support for why the relationships
estimated in Sections 3 and 4 may exist and whether the relationships stem from increasing the
number of actors involved or increasing the preference divergence between key actors. Section 6
concludes.
1. The Nature of Congressional and Presidential Influence
It is well established that members of Congress seek to structure the organization of
Congress so that they are able to provide input on issues of potential reelection importance (e.g.,
4
Fenno 1973; Mayhew 1974; Fiorina 1977; Shepsle 1978; Dodd and Schott 1979; Hall 1996;
Evans 2005). The desire for members to be involved in important policy debates contributes to
ambiguous and overlapping committee jurisdictions, resulting in multiple committees being
potentially interested in the same actions of the bureaucracy (cf., Dodd and Schott 1979;
Baumgartner and Jones 1993; Talbert, Jones, and Baumgartner 1995; King 1997; Evans 1999).
There are at least four committees overseeing every agency – an authorizing and an
appropriations committee from each chamber – and the number appears to be increasing
(Baumgartner, Jones and MacLeod 2000). For some agencies and programs the number is much
larger (e.g., the Department of Homeland Security).
We seek to characterize how the structure of congressional oversight conducted via a
committee system with overlapping jurisdictions and the redundancy created by bicameralism
affects the ability of Congress to influence agency policy-making relative to the much more
centralized institution of the presidency. To be clear, both institutions can, and do, affect agency
policymaking and our investigation should not be construed to imply that either institution is
impotent or that the mechanisms of influence that others have found are unimportant. We focus
on characterizing the relative influence across agencies because we are interested in the effects on
agency policymaking that occur in a political system where the chief executive and legislature
may disagree about the direction and magnitude of policy change. The amount of influence
wielded by one branch tells us little about the overall extent to which Congress and president are
able to influence agency policy; more informative is the net effect on agency behavior of the
interactions of the two branches.
While committees can enhance congressional capabilities because of the resulting division
of labor, lowered transaction costs, and the incentives for specialization (cf., Deering and Smith

5
1997), the effects of the committee system on the ability of Congress to influence agency
policymaking relative to a unitary chief executive is less settled. Some speculate that increasing
the number of involved committees may increase congressional influence over agency policy if
committees focus on different types of oversight, examine distinct aspects of agency performance,
maintain committee-specific information networks, or are able to coordinate their efforts (see
Aberbach 1990). The redundancy resulting from two standing committee systems may allow
duplicate committees to discover more effective ways of doing things or to observe agency
malfeasance missed by other committees (see Bendor 1985; King 1997; O’Connell 2006).
Combined with members’ electoral incentives, the ability of committees to act unilaterally
through the use of advice and consent, investigatory, and appropriations powers may also increase
congressional influence (e.g., Fiorina 1977, Arnold 1980, Banks and Weingast 1992; Adler 2002).
If multiple committees act unilaterally, the number and magnitude of congressional demands may
overwhelm the ability of the agency (or the president) to resist congressional influence.
In contrast, others argue that increasing the number of committees may decrease
congressional influence relative to the chief executive due to the increased transaction costs
resulting from the time and resources needed to influence agency behavior through practices such
as information gathering and dissemination, coalition building, and vote-buying (Dodd and Schott
1979; Miller and Hammond 1990; Hammond and Knott 1996; Gailmard 2009). When presidents
act unilaterally to influence agency policy through appointments, budget proposals, regulation, or
other actions, Congress often must coordinate a collective response. There are likely to be many
acceptable courses of legislative action – e.g., a new piece of legislation, an appropriations rider,
or a threat to retaliate against the executive by another mean such as holding up one of the
president’s priorities – and it takes time, effort, and resources to coordinate and pursue a response
6
(Cohen, Cuellar, and Weingast 2006). Agreeing upon and implementing a legislative response
becomes more costly as the number of involved committees increases not only because of the
relatively mundane (but time-consuming) tasks such as setting up meetings, circulating
legislation, holding hearings, and finding time on the legislative calendar (Ogul and Rockman
1990), but also because some committees may exert something like veto authority over legislative
activity in particular policy areas (e.g., Hammond and Knott 1996; Miller and Hammond 1990;
Moe 1984, 1987).
If congressional actors disagree on what they want an agency to do, influencing agency
policy may be especially difficult (e.g., Dahl and Lindblom 1953; Woolley 1993; Bawn 1995;
Balla 2000; Hall and Miler 2008). Insofar as increasing the number of involved committees also
increases the chances of disagreement within Congress, the cacophony of congressional interests
may be disadvantaged in affecting agency policy relative to a president who can speak with a
single voice (e.g., Ferejohn and Shipan 1990; Steunenberg 1992; Wood and Waterman 1993;
King 1997; Whitford 2005). As Congress tries to reconcile differences between chambers and
committees, the president may have an opportunity to exert influence (Moe 1984, 1985, 1987).
Moreover, agencies that disagree with one chamber or committee may be able to protect
themselves by aligning with those sharing the agencies’ preferences (Wilson 1989; Hammond and
Knott 1996).
Even if committees can agree to a course of action, they may not have enough incentive to
respond. Committees have scarce resources in time, effort, and staff to commit to influencing
agency policymaking, and committees may be motivated to let others bear the costs of initiating a
collective response. Because the incentive to free-ride likely increases as the number of
committees increases (Laffont and Tirole 1993; Gailmard 2009), this may affect the ability of
7
Congress to compete with the president in influencing agency policy. Alternatively, perhaps
committees can rely on interest groups with aligned preferences to exert influence when the
committees do not (or cannot).
A third perspective on the question of whether increased committee involvement affects
congressional influence over agency policy relative to the president is that there is no relationship
because the majority party is able to coordinate congressional responses. The difficulties that
Congress may face when trying to influence agency policy relative to the president are obviously
not unique to agency oversight. Many argue that political parties are an important part of
congressional decision-making precisely because they help overcome similar problems in
lawmaking (cf. Aldrich 1995). The Speaker of the House, for example, can determine the primary
jurisdiction for new legislation and set deadlines for the delivery of legislation involving multiple
committees (Evans 2005).
Similarly, it is possible that the resources of the majority party can safeguard
congressional interests and prevent a multitude of involved committees from undermining
congressional influence relative to the president. While parties can certainly wield influence over
agency policy making through the committee system itself, the question is whether there is
evidence of party influence occurring independently of the committee system. Put differently, do
actions taken by political parties outside of the committee system mitigate the difficulties that
may result from having multiple committees involved in the oversight of agencies and programs?
In short, there is an abundance of conflicting predictions regarding how increasing the
number of involved committees may affect the ability of Congress to influence agency policy and
a robust literature theorizes about the possible mechanisms through which congressional
committees may exert influence. We focus on characterizing the empirical relationship and
8
whether a greater number of committees appears to lead to more influence (perhaps because of
the ability of committees to act unilaterally), less influence (perhaps because of increased
transaction costs or more actors with an implicit veto), or whether there is no effect on
congressional influence (perhaps because of the ability of political parties to coordinate
congressional activity).
2. Measuring the Relationship
Despite well-formulated theories of congressional and presidential influence over the
bureaucracy, assessing the relationship empirically has proven to be exceptionally difficult.
Consider, for example, the empirical regularity that characterizes the starting point for modern
research on political oversight of the bureaucracy – the relatively low level of observable behavior
related to legislative oversight (e.g., Ogul 1976; Dodd and Schott 1979; Mann and Ornstein
2006). Some scholars interpret the infrequent activity as evidence that the nature of legislative
decision making, the close connection between bureaucrats and powerful constituencies, and the
information asymmetry between Congress and the bureaucracy inhibits oversight and fosters
agency independence (Dodd and Schott 1979; Freeman 1958; Lowi 1979; Rourke 1972; see,
however, Aberbach 1990). Others, however, argue that the lack of hearings or investigations does
not necessarily imply bureaucratic independence if Congress has created an effective system of
rewards and sanctions to prevent errant agency behavior (Weingast and Moran 1983; McCubbins
and Schwartz 1984; McCubbins, Noll, and Weingast 1987, 1989). In other words, it is unclear
what the presence or absence of observable congressional oversight reveals about congressional
influence over the bureaucracy.
The indeterminacy between observable oversight activities and influence over agency
policy has led scholars to look beyond congressional activity to characterize congressional
9
influence (e.g., Miller 2005). Examining whether changes in agency outputs correlate with
changes in congressional preferences (e.g., Weingast and Moran 1983; Weingast 1984) is
revealing, but it requires comparing the preferences of the bureaucracies and relevant political
actors and it is limited to only those agencies with comparable and measurable outputs (e.g.
Scholz and Wood 1998; Snyder and Weingast 2000; Bertelli and Grose 2009). Moreover, such
research is limited in its ability explore how the committee system affects congressional influence
(e.g., Calvert, McCubbins, and Weingast 1989; Wood and Anderson 1993; Whitford 2005;
MacDonald 2007).
Three measurement problems severely affect the ability to measure the relative influence
of Congress and the presidency over agency policy making. First, observable congressional
activity may occur most when Congress has failed to effectively direct agency policy (Aberbach
1990; McCubbins and Schwartz 1984). If so, interpreting the effect of observable congressional
oversight activity is difficult because it indicates a congressional response to the lack of influence.
Second, it is difficult to identify which congressional committees are relevant for agency and
program oversight due to expanding, ambiguous, and overlapping committee jurisdictions
(Aberbach 1990; Dodd and Schott 1979; King 1997). Finally, even if the list of committees is
known, it is difficult to compare the policy preferences of the agency, president, and relevant
committees in the House and Senate.
It is important to emphasize that the difficulty of measuring oversight and influence is not
restricted to academics. Congress itself has also struggled to identify jurisdictional overlaps
among committees. During the 103rd
Congress, for example, the Joint Committee on the
10
Organization of Congress analyzed committee jurisdiction over executive branch agencies.3
Acknowledging the difficulty of identifying the totality of interaction between committees and
agencies, the committee carried out three separate analyses of jurisdiction - a telephone survey of
senior, career employees in the agencies’ legislative offices; an examination of the hearing
appearances of executive branch witnesses; and a review of patterns of multiple referrals in the
House and Senate (S. Prt 103-55). The fact that Congress itself lacks a clear idea of which
committees oversee which agencies not only highlights the difficulty of measuring oversight, but
it is also provocatively suggests a preliminary conclusion – if Congress itself does not even know
which of its own committees are responsible for overseeing the various executive agencies, it may
have difficulty influencing agency policy.
We address these measurement challenges using a survey of federal agency administrators
and program managers designed to measure congressional and presidential influence over agency
policy making during 2007-2008. It is worth emphasizing that in measuring oversight and
influence we use one of the methods that Congress itself used to measure its oversight of the
bureaucracy. Even if our survey based measure is imperfect, those imperfections likely also affect
the understanding that Congress has about its relationship with executive agencies.
We survey nearly 2,400 appointed and career federal executives from across the federal
bureaucracy to get their opinions and perspectives on political influence in their respective
agencies and bureaus.4 Because we attempt to survey every agency administrator or program
3 U.S. Congress. Joint Committee on the Organization of Congress. 1993. Background Materials: Supplemental
Information Provided to Members of the Joint Committee on the Organization of Congress. 103rd
Congress, 1st
Session. S. Prt. 103-55. 4 See Clinton et al. (2012) for details. Briefly, the survey was sent to 7,448 federal administrators and program
managers. The number of respondents is large (2,398), but the response rate was noticeably higher among career
professionals than appointees. Clinton et al. (2012) have responses from 259 political appointees, compared to 2,021
career professionals. Of the appointees, 102 were Senate-confirmed appointees. Of the approximately 550 policy-
relevant Senate-confirmed appointees, this amounts to a 19% response rate. There were 131 appointed members of
the Senior Executive Service who responded out of approximately 700 total (19%), but not all of the 700 appointees

11
manager, we can examine the relative amount of congressional and presidential influence over
agency policy making across the entire federal bureaucracy in the 110th
Congress (2007-2009).
Executives from 128 different agencies and bureaus responded, and the average agency contains
14 respondents (the overall response rate was 33%). (Appendix B provides a more complete
description of the survey.)
While important surveys of federal executives have been conducted previously (e.g.,
Aberbach and Rockman 2000; Golden 2000; Maranto 1993a,b, 2005; Maranto and Hult 2004;
Meier and Nigro 1976), they are of limited use for determining congressional and presidential
influence over agency policy. Not only do existing surveys interview fewer executives – the
largest prior single survey contained 612 respondents – from fewer agencies (prior surveys
included a maximum of 15 agencies), but the surveys also failed to ask the executives about
oversight and influence. The survey closest to our own is Golden’s (2000) survey focusing on the
president's ability to direct policy within four agencies, but the survey is limited for our purposes
because it doesn’t consider the possible influence of Congress.5
Determining how congressional and presidential influence over bureaucratic policymaking
correlates with the number of committees overseeing an agency requires measuring both the
relative influence of the elected branches and the number of involved committees. Using the
opinions and perceptions of administrators and program managers provides two important
advantages. First, because the individuals surveyed are the individuals responsible for
in the SES were administrators or program managers. The overall response rate was 33% and an evaluation of public
voter registration information revealed that the sample is representative of the population of federal executives with
regard to partisanship. 5 The other surveys focus on the dynamics between careerists and political appointees (Maranto 1993a, b, 2005;
Maranto and Hult 2004), representative democracy (Meier and Nigro 1976), and the alleged quiet and noisy crises in
the civil service (Aberbach and Rockman 2000). Aberbach and Rockman use interviews conducted in 1970 (126
executives), 1986-87 (199 executives), and 1991-92 (151 executives) for a total of 476 executives, and Maranto and
Hult 2004 and Maranto 2005 uses a combination of 2 surveys (one from 1987, one from 1993) for a total of a little
over 1,100 respondents.
12
implementing agency policy, their perceptions are especially meaningful. If executives perceive
political influence, it is likely that those perceptions affect how executives conduct themselves
when working in the agency. Executives who believe that Congress is more influential, for
example, likely take actions on the job that reflect and validate this belief.
Second, by relying on the perceptions of those responsible for implementing agency
policy, we can measure influence and interactions that are not observable or easily interpretable
by those outside of the agency. For example, a difficulty in using observed behavior is that it
cannot account for influence that results from anticipatory preemption; congressional committees
may influence agency policy without taking an observable action if agencies react to the
expectation of negative consequences that would result if the agency offended Congress
(Weingast and Moran 1983; McCubbins and Schwartz 1984; McCubbins, Noll, and Weingast
1987, 1989). In contrast, the opinions and perceptions of federal executives presumably reflect
such influence.
Despite these reasons for preferring our measure to existing measures, no measure is
perfect. One concern with a survey based measure is that individuals may use the scales
differently because of how they interpret the meaning of the response categories. By examining
the difference in perceived influences, however, we can eliminate any idiosyncratic respondent-
specific effects (e.g., if some respondents choose higher or lower values than others).
A more troubling concern with using survey responses to measure influence is that the
circumstances of the survey (e.g., a Democratic Congress grappling with a Republican president
in his second term) or personal biases of respondents may affect the meaning of the reported
measures. If, for example, executives are more likely to perceive the actions of those with which
they disagree, this would obviously affect the meaning of the survey responses. To minimize this
13
possibility, we use additional information about the respondents and the agencies in which they
work to control for potential sources of bias when conducting the analysis. Controlling for the
ideology and partisanship of the executive, for example, allows us to focus on characterizing the
variation in the perceived relative influence that is unrelated to variation in personal
characteristics or agency features.6 A fourth, and related, concern is that the set of executives
who choose to respond are non-representative; perhaps those who are the most willing to respond
to a survey on the “future of government service” are the happiest (or most despondent) given the
political circumstances. Comparing the partisanship of respondents to non-respondents using
voter registration data where available, however, reveals no discernible differences (see Appendix
B for details).
To measure influence over agency policy making we simply ask career executives and
program managers: “In general, how much influence do the following groups have over policy
decisions in your agency?” We ask about “Democrats in Congress” (the majority party in the
House and Senate in 2007-2009), “Congressional committees,” the “White House,” and “Interest
Groups.” To facilitate comparing relative influence, respondents assess the influence of each
using a grid that lists all of the groups being rated. The format of the question not only primes
each executive to think about the relative influence of the various political actors, but it also
eliminates the possibility of forgetting earlier responses. The perceived influence of each group
over the policy decisions in the executive’s agency ranges from 4 (“A great deal”) to 0 (“None”).
Because the amount of influence wielded by one branch in isolation tells us little about the extent
to which Congress and president influence agency policy in a political system where the chief
6 Similarly, if appointees are selected because they share the president’s preferences, we might worry that using self-
reported measures of influence ignore the influence occurring because of staffing decisions instead of explicit
directives. We therefore also use characteristics of the respondent and agency that are correlated with possible
selection-based influence (e.g., excluding the opinions of political appointees because they would be most likely to
underreport the influence of the appointing president due to selection issues).
14
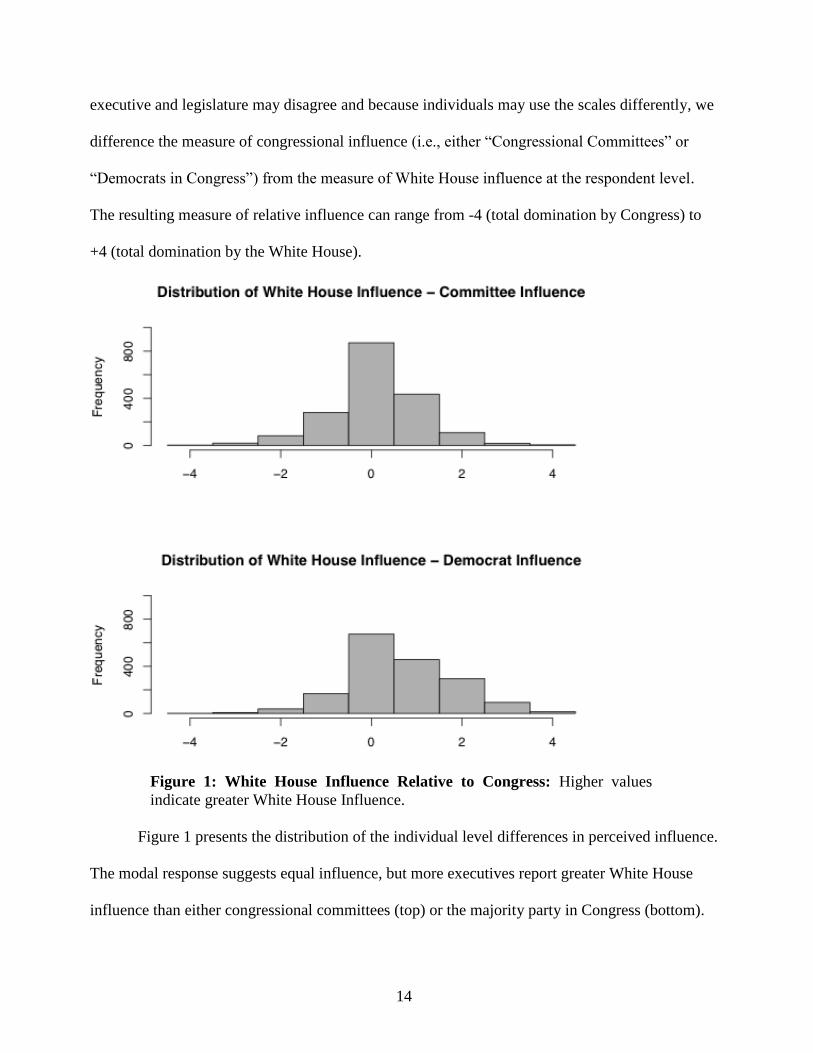
executive and legislature may disagree and because individuals may use the scales differently, we
difference the measure of congressional influence (i.e., either “Congressional Committees” or
“Democrats in Congress”) from the measure of White House influence at the respondent level.
The resulting measure of relative influence can range from -4 (total domination by Congress) to
+4 (total domination by the White House).
Figure 1: White House Influence Relative to Congress: Higher values
indicate greater White House Influence.
Figure 1 presents the distribution of the individual level differences in perceived influence.
The modal response suggests equal influence, but more executives report greater White House
influence than either congressional committees (top) or the majority party in Congress (bottom).
15
The results suggest that, to the extent that parties matter for influencing agency policy, they
largely do so through the committee system.
The second measurement task involves determining the number of congressional
committees overseeing agency policymaking. Because committee involvement can take many
forms – not all of which are readily observable (e.g., unpublished hearings, personal
communications) – we again rely on the bureaucrats’ self-reports. Using the perception of those
executives responsible for implementing agency policy allows us to capture the myriad of ways in
which committees might interact with the agency both formally and informally. To do so, we ask:
“How many congressional committees would you estimate exercise active oversight of your
agency? (0; 1-2; 3-4; 5-6; 7-8; 9+).” The modal response was “3-4” committees. (For context, in
the House at the time, there were 21 standing committees, 4 joint committees and a special
committee.)
Because every executive belongs to a cabinet department, administration, bureau, or
commission, we aggregate the individual measures to characterize the average perception in an
agency or bureau. Respondents working in a large, distinct bureau (e.g., FBI, Census) are
identified with that bureau, but executives working in smaller offices or divisions (e.g. Office of
the Secretary, Inspector General) in larger departments are identified with their larger department
or agency. The average response in an agency reveals reassuring variation that can range from 0
(“0 committees”) to 6 (9+ committees”). The Department of Homeland Security (4.70) and the
Environmental Protection Agency (4.13) have among the highest levels of perceived committee
oversight, while the Veterans Benefits Administration (2.64) and the Bureau of Labor Statistics
(2.4) have among the smallest.
16
The fact that the average response for the Department of Homeland Security indicates that
7-8 committees exercise active oversight may appear puzzling given that 108 committees and
subcommittees had jurisdiction over the agency. However, recall that the question only asks about
committees, not subcommittees, and the measure is the average of the number of committees
involved. Moreover, because we know only the number and not the identity of the involved
committees (but see the analysis of section 5), if individuals working in an agency interact with
different committees, this average will underreport the number of unique committees involved
(i.e., two executives may each mention “3-4” but the committees being referred to may be disjoint
sets).
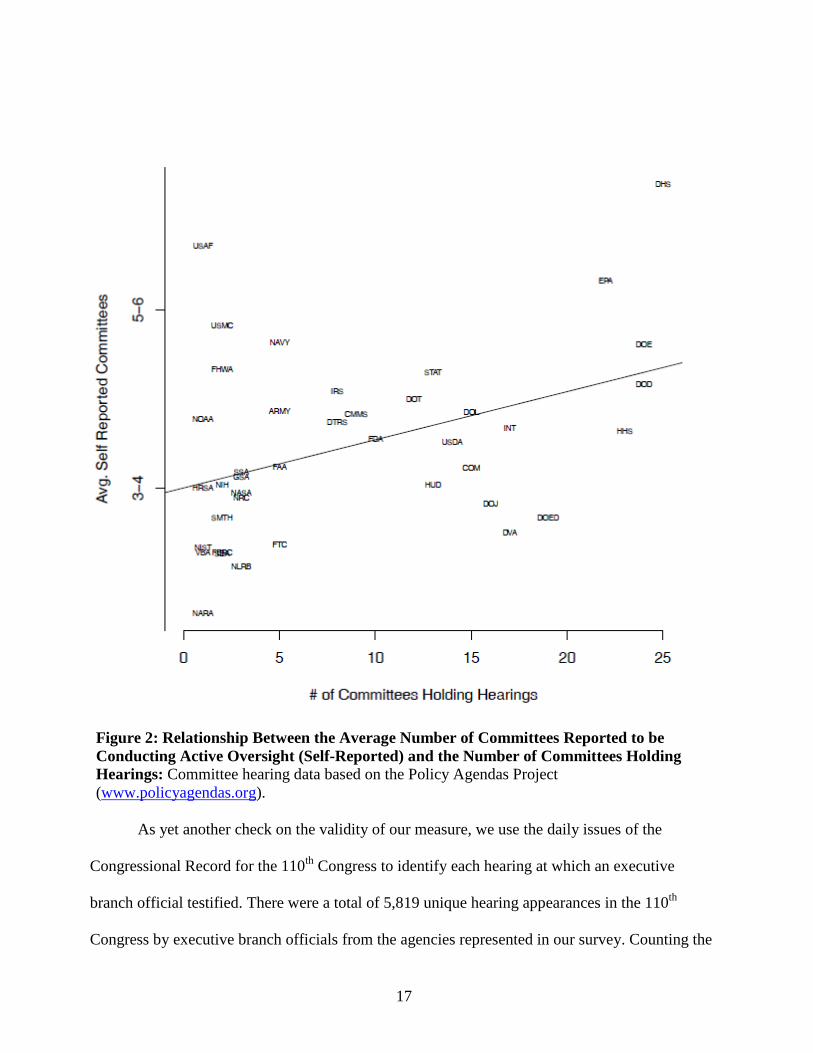
Comparing our measure of congressional oversight based on the average agency response
to other publicly available measures of congressional oversight reveals a reassuringly positive
relationship. There is a modest (.39) correlation between the agency average and the number of
unique committees holding a published hearing related to agency policy in the prior year
according to the Policy Agendas dataset (Figure 2). (Using the number of hearings reveals a
similar pattern.) Moreover, the Department of Homeland Security (DHS) has the highest average
response as well as the highest number of unique committees holding hearings, and agencies such
as the Bureau of Labor Statistics (BLS), the National Archives and Record Administration
(NARA) have the least amount of oversight according to either measure.
17
Figure 2: Relationship Between the Average Number of Committees Reported to be
Conducting Active Oversight (Self-Reported) and the Number of Committees Holding
Hearings: Committee hearing data based on the Policy Agendas Project
(www.policyagendas.org).
As yet another check on the validity of our measure, we use the daily issues of the
Congressional Record for the 110th
Congress to identify each hearing at which an executive
branch official testified. There were a total of 5,819 unique hearing appearances in the 110th
Congress by executive branch officials from the agencies represented in our survey. Counting the

18
number of committees and subcommittees that heard testimony for each agency reveals a
correlation of .47 between this measure of committee oversight and our agency survey average.
DHS again stands out as having one of the highest numbers of unique committees (26 committees
and 60 subcommittees heard testimony from DHS officials).
To begin the analysis, we examine the simple bivariate relationship between the number
of involved committees and increased presidential influence. Figure 3 graphs the relationship
between the number of committees overseeing the respondent’s agency and the respondent’s
evaluation of the relative influence of the White House vis-à-vis Congress and the Democratic
Party. Two patterns are evident. First, respondents always perceive congressional committees to
be more influential than majority party Democrats in Congress – suggesting that any party
influence largely occurs through the committee system. Second, the relative influence of the
White House increases in a nearly linear fashion as the number of committees exercising active
oversight increases.
The relationship evident in Figure 3 also suggests that executives do not simply equate
oversight and influence. If so, we would expect bureaucrats to report that congressional influence
increases with the number of committees exercising active oversight. Because we observe the
opposite relationship, even if bureaucrats mistakenly equate oversight and influence, this only
increases the disparity in influence we document.7
7 Aggregating the measures by agency (using the perceptions of executives within an agency or bureau) reveals a
similar relationship – the correlation between the number of involved committees and increased presidential influence
relative to congressional committees and the Democratic Party is 0.32 and 0.29 respectively.

19
Figure 3: Relationship between Relative White House Influence and Number
of Committees Exercising Active Oversight: Differences and 95% confidence
intervals relative to congressional committees (open) and Democrats in Congress
(solid) are plotted.
3. Estimating the Relative Influence of the President and Congress over Agency Policy
The correlations reported in the prior section suggest that Congress is less influential than
the president over agency policy when more committees are involved, but there are obviously
many possible rival explanations and confounding characteristics that need to be explored before
we can characterize the relationship with any confidence. We first explore how the relationship
varies across agencies before turning to exploring the variation evident in the individual-level
experiences of career executives. (Section A3 shows that the relationship is also unchanged if we
use interest group influence as a proxy for congressional influence as might be expected if
Congress relies on interest groups to influence agency policy; Section A4 in the Appendix
20
replicates the analysis that follows to show that examining the influence of the majority party in
Congress does not affect the results.)
Several alternative explanations may explain why increased committee involvement
results in less congressional influence relative to the president. One possibility is that the number
of tasks an agency performs may produce the noted correlation; agencies handling many tasks
across multiple issues may both be more likely to cross the jurisdictions of multiple committees
and be harder for Congress to control because of the agency’s specialized information and
expertise. If so, a negative relationship between the number of involved committees and relative
congressional influence would occur because of the number of tasks rather than the number of
involved committees. We use multiple measures to control for this possibility, but the results that
follow use the number of distinct Policy Areas in which the agency is involved according to
budgetary documents.8
A second alternative explanation for the relationship between the number of committees
and relative presidential influence is due to the salience of an agency’s work to the president’s
agenda. If the president prioritizes some agencies and programs over others and those agencies
consequently report higher levels of presidential influence because of the increased presidential
attention, the observed relationship would be spurious if the importance of the agency for the
president’s agenda correlates with the number of committees involved (perhaps because members
of Congress want to appear responsive on the same issues). To measure which agencies are
important for achieving the policy goals of President Bush during the 110th
Congress, we create
8 As part of budget preparations during the Bush Administration, the Office of Management and Budget spearheaded
efforts to evaluate all federal programs. As part of this process, they categorized federal programs into 17 policy areas
(programs could have more than one category). For each agency we counted the number of different policy areas
covered by the agency’s programs. Auxiliary analyses reveal that our conclusions are robust to using a host of
alternative measures of agency tasks, including the number of distinct bureaus within an agency and the proportion of
an agency’s programs that are in one policy area. The relationship between the number of policy areas in which an
agency is involved and the number of committees perceived to be actively overseeing the agency is very weak
(correlation of 0.17).
21
an indicator variable (Bush Agenda?) using the 2007 State of the Union Speech and a 2006
evaluation of his agenda by the New York Times (Fishel 1985) and we to identify the agencies that
implemented policies important to President Bush.
We also control for several characteristics that may affect respondents’ perceptions of
influence and oversight. It may be that the ideology of the executive or agency biases perceptions
of influence. Liberal executives, or members of more liberal agencies, may be more sensitive to
attempted influence by the Republican president than the Democratic Congress because of their
ideological disposition. If so, the disparity in influence may be illusory. We therefore control for
the ideology of the agency (Agency Preferences) using experts’ assessments (Clinton and Lewis
2008) to account for the possibility that an agency’s ideology either affects the actual
receptiveness of the agency to congressional or presidential influence or else ideology influences
the perceptions of executives and program managers.
To account for possible variation in the amount of political influence across different types
of agencies we include indicators for agencies that are or are located within independent
commissions (Independent Commission?) and cabinet departments (Cabinet Department?).
Because the proximity of career executives to Washington, DC may affect how responsive the
executives perceive congressional and presidential influence, we also control for the percentage of
respondents in the agency who are located in a field office outside of Washington, DC (% Field
Office). Finally, because presidents may exercise influence through the appointment process and
appointees therefore may be less likely to perceive presidential influence, we also control for the
percentage of respondents who are political appointees (% Political Appointee).

22
White House
Influence
Relative to
Congressional
Committees
White House
Influence
Relative to
Congressional
Committees
White House
Influence
Relative to
Democratic
Party
White House
Influence
Relative to
Democratic
Party
All
Executives
Careerists
Only
All
Executives
Careerists
Only
(Model 1) (Model 2) (Model 3) (Model 4)
Constant
(Std. Err)
-.39
(.36)
-.43
(.33)
.11
(.35)
.26
(.36)
Avg. # of Oversight
Committees
.22*
(.11)
.25*
(.10)
.22*
(.10)
.20*
(.09)
# Policy Areas for Agency .01
(.01)
.01
(.01)
.02
(.02)
.02
(.02)
Bush Agenda? -.05
(.09)
-.01
(.10)
-.07
(.10)
-.08
(.11)
Agency Ideal Point -.14*
(.04)
-.15*
(.04)
-.11*
(.05)
-.10*
(.05)
Independent Commission? -.78*
(.16)
-.99*
(.21)
-.72*
(.18)
-.98*
(.24)
Cabinet Department? -.12
(.13)
-.19
(.12)
-.04
(.15)
-.14
(.16)
% Political Appointees .12
(.37)
-.06
(.34)
% Employed in Field
Office
-.28*
(.15)
-.23
(.16)
-.56*
(.20)
-.55*
(.22)
R2 .39 .43 .39 .39
N 95 95 95 95
Table 1: Agency Level Regression Results for the Effect of Multiple Committee Oversight
on Influence. * denotes two-tailed significance at .10 or better.
Using the agency level variation, Table 1 reveals that the more congressional committees
involved in overseeing an agency or bureau, the more influential the president is relative to
Congress even controlling for possible rival and confounding effects. Model 1 suggests that
increasing the average number of committees overseeing an agency from “1 to 2” to “3 to 4,” for
example, increases the president’s relative policy influence by 0.22, which is nearly 1/3 of a
standard deviation. The difference in relative presidential influence for an agency with no
committee oversight compared to an agency with “9+” committees is nearly two standard
23
deviations. That is, we go from a world where, for example, a respondent suggests the two
branches both exert “A good bit” of influence to one where the respondent reports that the
President still exerts “A good bit” of influence but the Congress exerts only “some” influence.
Excluding the opinions of political appointees does not change the results (Model 2).9
Model 3 reveals that party institutions do not exercise much influence independent of the
influence wielded by congressional committees. The fact that President Bush’s influence relative
to the Democratic Party controlling the House and Senate remains strongly correlated with the
number of committees involved in the oversight of the agency suggests that parties do not solve
the problems that result from the involvement of multiple congressional committees.10
If parties
mitigated the problems that may result from the presence of multiple involved committees as
noted in section 1, the number of committees overseeing an agency should be unrelated to the
influence of the president relative to that of the majority party. Table 1 reveals no evidence of
this; the relationship evident in Model 1 persists in Model 3 and the substantive magnitudes are
nearly identical.
The other included covariates have reasonable effects. Agency salience and work
complexity do not affect the relative influence of presidents, but other factors do. As more of an
agency is located in field offices, the relative influence of the president decreases – presumably
because of the local influence wielded by the members of Congress in whose district the offices
are located. Similarly, independent commissions report far more influence by Congress. Finally,
the negative correlation between agency ideology and relative presidential influence suggests that
respondents in the most liberal agencies report the most presidential influence relative to
9 Replicating the results using only the opinions of appointees is impossible because of the small number of
appointees in each agency and confidentiality agreements. 10
We do not deny that the parties may play an important role in ability of congressional committees to exercise
influence; our point is simply that there is no evidence that parties are able to overcome the difficulties that may
result from having multiple committees involved in agency policymaking and oversight.

24
Congress. We cannot determine whether this is because presidents target such agencies for action
or because such executives are most likely to perceive presidential influence, but the critical point
to note is that our identification of the relationship between the number of committees involved in
oversight and policy influence controls for either possibility.
3.1 A Response rather than a cause?
Given the documented relationship between increased committee oversight and decreased
congressional influence relative to the president, one might question whether the existence of
multiple committee overseers is a cause of congressional weakness or a response to previous
presidential influence? Put differently, if the negative relationship we document is due to
Congress reacting to prior presidential action in an agency and if more committee involvement
leads to more congressional influence relative to the president, our interpretation is backwards.
Because the House and Senate rules that define committee jurisdictions effectively fix the
scope of committee oversight in the short term, there is a good reason to believe that the
proliferation of committees is the cause of the lack of congressional control rather than a
response. Committee jurisdictions certainly change over time as committees redefine their
jurisdictions to oversee particularly salient issues (Baumgartner, Jones, and MacLeod 2000; King
1997), but there is no evidence that the 110th
Congress changed congressional jurisdictions in
response to presidential influence over agency policy.
To further explore the possibility of reverse causality, we examine whether the perceived
number of committees that exercise active oversight varies with past presidential interest and
influence in the agency. To do so, we estimate the number of committees conducting active
oversight controlling for whether the respondent approves of recent changes in the agency (Agree
with Changes?), whether political appointees have recently been “burrowing” into the career civil

25
servant positions in the agency (thereby presumably increasing presidential influence (Aware of
Burrowing?)), whether the number of appointees in the agency is increasing (Number of Political
Appointees Increasing?), whether the executives report that the president is increasingly involved
in agency activity (White House Involvement Increasing?), and whether the agency is responsible
for policy priority of President Bush (Bush Agenda?). If the number of committees exercising
oversight is a consequence rather than a cause of increasing presidential control, we should expect
at least some of these covariates to be positively related to the number of committees involved.
Coefficient
Constant
(Clustered Std. Err.)
3.27*
(.21)
Agree with Changes? -.04
(.03)
Aware of Burrowing? -.08
(.07)
Number of Political Appointees Increasing? .02
(.02)
White House Involvement Increasing? -.05
(.04)
# Agency Policy Issue Areas .03*
(.01)
Bush Agenda? .33*
(.12)
N 1486
R2 .05
Table 2: Predicting the Number of Committees Exercising Active Oversight: * denotes two-
tailed significance at .10 or better.
Table 2 reveals no reason to reject our interpretation of the relationship evident in Table 1.
Most notably, committees are not more involved in those agencies where White House influence
is increasing, there are fewer committees involved in agencies where more burrowing by political
appointees is occurring, and there is less committee oversight of agencies where changes objected
to by the executive are taking place. While there is a positive correlation between the number of
committees involved in oversight and whether the agency is responsible for the policy priorities
26
of President Bush, recall that we explicitly control for this relationship in earlier specifications.
Not only do the variables in Table 2 account for very little of the variation in the number of
committees exercising active oversight, but there is little evidence that increasing White House
influence leads to increased levels of active committee oversight.
4. Program Manager and Executive Level Analysis
Agencies and bureaus are responsible for managing many different types of programs and
policies, but the analysis of section 3 cannot account for variation in the amount of oversight and
influence that may exist within an agency. Does the relationship between the increased relative
presidential influence over agency policy and committee involvement persist when looking at the
variation across the programs implemented within an agency? For example, federal executives
that work in more political portions of the Defense Department such as the Joint Chiefs of Staff,
Missile Defense Agency, or Comptroller likely have different experiences than those who work in
less visible parts such as the Defense Logistics Agency or Networks and Information Integration.
In fact, executives in the first group report an average of 7 to 8 committees compared to 3 to 4
committees for executives working in the second group. Exploring such variation in the opinions
of the executives and program managers within an agency provides additional information about
the nature of the relationship between the number of involved committees and congressional
influence.11
Because executives and program managers all work for a larger agency or bureau, running
a regression on the pooled responses is inadvisable because of likely unaccounted for agency-
level effects (that are therefore clearly not independent across respondents). For motivation,
consider the simple univariate regression of executive i’s opinions about the perceived relative
11
We interpret the variation in the responses of executives and program managers as reflecting the variation in their
experiences when working to implement the various programs and policies of the agency.

27
influence of the president in agency j (Yij) and the number of committees perceived to be
exercising oversight in agency j (Xij) given by: . In addition to the
typical idiosyncratic errors uij, there are also likely omitted effects correlated within an agency
(denoted by uj) because multiple executives and program managers belong to the same agency.
There are several ways to account for common unobserved factors. Agency fixed effects
permit the unknown agency level effects uj to be correlated with the included covariates Xij and
estimates separate agency-level intercepts. A random effects model assumes that the agency level
errors uj are uncorrelated with the included covariates, but allows the error variance to differ
across agencies. A “mixed” effects model (sometimes called a multilevel model or a hierarchical
model) specifies covariates for the variation in uj (i.e., there is a regression for the respondent
level characteristics and a regression for the agency level characteristics).12
We estimate the relationship within an agency controlling for several characteristics of the
surveyed executives using these three specifications (as well as a pooled OLS and a Bayesian
multilevel model). We control for the executives’ ideal point on salient political issues to control
for the possibility that individual policy preferences affect the level of perceived presidential
influence (Clinton et al. 2012). To control for possible systematic differences in either actual or
perceived influence we also control for whether the respondent is a political appointee (Appointee
Indicator), works in a field office rather than in Washington, DC (Employed in Field Office?), the
number of years the respondent has been employed in the federal bureaucracy (Years Employed in
12
It is well known that both fixed effects and random effects are consistent estimators of if uj and Xij are
uncorrelated, but the random effect estimator will be a more efficient estimator because it is estimating fewer
parameters by not estimating the agency-level fixed effects. If the agency level error components uj are correlated
with the included covariates, however, the only consistent estimator is the fixed effects estimator. A Hausman test
uses this relationship to determine the correct specification by determining whether the coefficients for the fixed
effect and random effect models sufficiently differ. Comparing the difference in coefficient estimates for fixed and
random effects models using a Hausman test yields a test statistic of 6.09. This is not distinguishable from zero, given
a chi-squared value of 6 degrees of freedom. Nonetheless, we report estimates from both models.

28
Agency), and the respondent’s pay grade (Executive Pay Grade).13
The critical variable for the
analysis, however, is the number of committees exercising active oversight according to the
respondent (# Oversight Committees). Table 3 reports the relationship evident in executives’
opinions using several specifications.14
White House Influence
Relative to Congressional
Committees
OLS Fixed Effects
by Agency
Random
Effects by
Agency
Mixed Effect
Model by
Agency
(Model 5) (Model 6) (Model 7) (Model 8)
Constant
(Std. Err)
-.0002
(.13)
-.14
(.11)
-.20
(.13)
-.05
(.11)
# Oversight Committees .08*
(.03)
.07*
(.03)
.07*
(.02)
.07*
(.02)
# Policy Areas for Agency .02
(.01)
Bush Agenda? .04
(.07)
Agency Ideal Point -.12*
(.03)
Independent Commission? -.91*
(.16)
Cabinet Department? -.22*
(.11)
Bureaucrats’ Ideal Point -.08*
(.04)
-.07*
(.04)
-.07*
(.03)
-.07*
(.03)
Appointee Indicator -.05
(.10)
-.01
(.09)
-.02
(.09)
-.04
(.09)
Employed in Field Office? -.02
(.06)
.07
(.08)
.07
(.07)
-.02
(.07)
Years Employed in Agency -.002
(.002)
-.001
(.002)
-.001
(.002)
-.002
(.002)
Executive Pay Grade -.002
(.01)
.008
(.01)
.01
(.01)
.0001
(.01)
R2 .09 .13
N 1509 1670 1670 1521
13
This would occur if, for example, liberal executives were either more likely to be targeted for presidential activity
or else more likely to perceive attempted influence by the president, or if lower level executives (either in terms of
pay or time-served) or executives in field offices perceived interactions differently than others. 14
We probe the robustness of the results by including fixed effects by agency, by pay grade (to account for
differences in opinions based on the location of the respondent in the agency hierarchy), and by allowing a non-linear
relationship between the number of committees involved and congressional influence. None of these change the
substantive conclusion.

29
Table 3: Executive Level Regression Results for the Effect of Multiple Committee Oversight
on White House Influence. * denotes two-tailed significance at .10 or better. Standard errors are
clustered by agency in Models 5 and 6.
As Table 3 reveals, regardless whether we model the data using a fixed effect, random
effect, or multilevel model, the substantive relationship between committee involvement and
congressional influence is identical. (The appendix reveals that a Bayesian multilevel model with
intercepts and that are allowed to vary based on agency characteristics reveals the near-identical
posterior estimated coefficient of .075 (with a 95% highest posterior density region of [.03,.12])
for the relationship between the number of involved committees and presidential influence.)
Similar to the agency-level relationship examined in section 3, Table 3 reveals that as the
number of committees exercising active oversight increases, so does the influence of the president
relative to Congress. Increasing the number of committees from “1-2” to “3-4,” for example, is
correlated with an increase of relative presidential influence between 0.07 and 0.09. In terms of
the substantive impact, this change is about one-tenth of a standard deviation. The most extreme
case of moving from no committees exercising active oversight to “9+” committees results in a
net change of roughly one-half a standard deviation change in relative influence (.45).
While the relationship between the amount of committee involvement and increased
presidential influence relative to the committees appears in the variation that occurs between
agencies and within agencies, the substantive magnitudes of the within-agency effects of Table 2
are considerably smaller than the magnitude of the between agency effects reported in Table 1. As
we would expect, the relationship is stronger across agencies than within agencies.15
In both
cases, however, the greater the number of committees that are involved in the oversight of the
15
Tangential to the primary relationship of interest, conservative executives and executives working in conservative
agencies are less likely to report increased presidential influence relative to congressional committees. While it is
unclear whether this is because they are less sensitive to presidential influence or because their presence in the agency
lessens the need for White House direction influence, the important point is that we control for either possibility.
30
agency (or program within the agency), the more influential the president is for agency policy
making relative to the congressional committees.
5. Examining Reasons for the Relationship
Sections 3 and 4 document a strong correlation between the number of involved
congressional committees and relative presidential influence among and within agencies in the
110th
Congress. The analyses do not, however, reveal which of the many possible reasons
sketched in section 1 are most likely responsible for the estimated relationship. One possibility is
that as the number of committees involved in overseeing an agency increases, there are more
likely to be policy disagreements among the involved committees. Alternatively, and regardless
of the whether the committees’ preferences diverge, the relationship may be due to collective
action problems and increased transaction costs; more committee involvement may result in less
influence even if the involved committees prefer the same policy outcome.
Disentangling these two possible explanations is difficult, if not impossible, given the data
required. Such an analysis requires not only identifying which committees exercise active
oversight, but it also requires locating the policy preferences of the committees relative to one
another and relative to the agencies themselves in order to measure preference divergence.
Finally, even if it is possible to overcome these measurement difficulties, it is possible that the
data is ultimately uninformative as to which aspect is most responsible for the relationship evident
in sections 3 and 4 because the explanations are obviously not mutually exclusive – Congress may
confront preference divergence among these actors and increased transaction costs stemming
from an increase in the number of key actors.
Even if it is impossible to determine which explanation is most likely responsible for the
relationships estimated in the prior sections, exploring the relationship between agencies and

31
committees in more detail is useful because it reveals whether the configuration of preferences
and the number of involved committees in the 110th
Congress is consistent with the relative lack
of congressional influence we find. Finding multiple committees on either side of every agency’s
ideal point would provide evidence consistent with the apparent lack of congressional influence
relative to the actions of a unilateral executive.
Our survey of executives and program managers provides some ability to measure the
required concepts. To identify the identity of the committees involved in the oversight of an
agency, we use the responses of career executives to two open-ended questions that asked for the
name of the committee in the House and the Senate whose jurisdiction overlaps most with the
work of the respondent’s agency or program. We measure committee involvement using every
committee mentioned in either the House or the Senate.16
The number of unique committees
named by career executives within an agency varies from 3 (NLRB) to 21 (USDA). We could use
the open-ended responses of 30 agencies due to confidentiality agreements, and respondents in
these agencies named 11 different committees on average.17
Not surprisingly, the Appropriations
Committee was most frequently mentioned committee in each chamber– it constituted 22% of the
mentions in the House (408/1866) and 20% of the mentions in the Senate (361/1847).
Using this list of named committees for each agency, we then identify the ideal point for
the median member in each committee for each agency based on the roll calls from the 110th
Congress using the estimator of Clinton, Jackman, and Rivers (2004). Using the executives’ ideal
points based on the 14 issues that were voted upon in the 109th
Congress (Clinton et. al. 2012), we
16
Some respondents provided more than one committee (some named up to 5). In those cases, we used all of the
named committees. One limitation is that the question of which committee has a jurisdiction which overlaps most is
not necessarily equivalent to the question we analyze in section three regarding how many committees are actively
involved. 17
As per the confidentiality requirements of the survey, users can only identify agencies and bureaus with more than
10 respondents.
32
can place agency preferences in the same space as elected officials.18
To try to measure an
agency’s preference, we use the average ideal point of the careerists in the agency.19
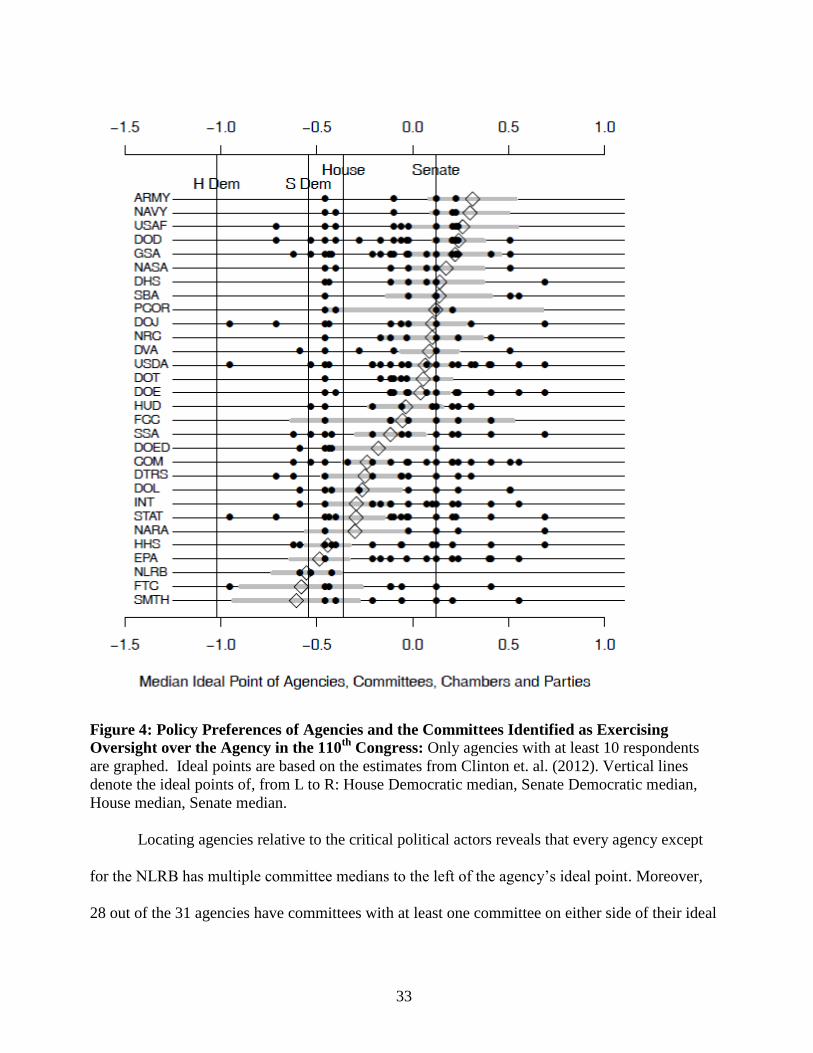
Figure 4 graphs the preference configuration for the 31 agencies and bureaus with more
than 10 respondents. The figure plots: the preferences of the average careerist in an agency, the
median committee member for every named committee, the president, and the median members
of the chambers and majority parties. The preference configuration relevant for each agency is
plotted with agencies arranged from the most liberal (bottom) to the most conservative (top). The
open diamond denoted the mean location of careerists for the labeled agency and its 95% credible
interval. The ideal points of the median members belonging to those committees mentioned by
executives in the agency are plotted using solid circles, and the number of circles reflects the
number of named committees relevant for each agency. The labeled vertical lines denote the
location of median House and Senate Democrats as well as the House and Senate medians.
President Bush’s ideal point is omitted because it is more conservative than any of the agencies
and committee medians (his ideal point is 1.25).20
18
One complication is that the issues were considered in the 109th
Congress, but the questions about oversight
involve the 110th
Congress. To use the estimates from the 109th
Congress to generate estimates for the 110th
Congress
we jointly analyze the voting behavior of the 109th
and 110th
Congress holding the ideal points of members serving in
both Congresses constant to fix the scale of the recovered ideal points. We then regress the agency comparable ideal
points of Clinton et al (2012) on these ideal points for those members who serve in the 109th
Congress. The resulting
relationship is used to generate an agency comparable ideal point for members newly elected in the 110th
Congress. 19
An alternative means of measuring agency ideal points would be to use some weighted average of careerist and
appointee ideal points (Clinton et al. 2012). Since appointees are a mechanism through which presidents (and
Congress) influence agency policy, measures of agency ideal points themselves reflect political influence. We use
only careerist ideal points to measure agency ideal points to estimate agency preferences leaving aside the
consequences of including appointees. 20
Figure A3 in the appendix presents the full distribution of congressional ideal points.
33
Figure 4: Policy Preferences of Agencies and the Committees Identified as Exercising
Oversight over the Agency in the 110th
Congress: Only agencies with at least 10 respondents
are graphed. Ideal points are based on the estimates from Clinton et. al. (2012). Vertical lines
denote the ideal points of, from L to R: House Democratic median, Senate Democratic median,
House median, Senate median.
Locating agencies relative to the critical political actors reveals that every agency except
for the NLRB has multiple committee medians to the left of the agency’s ideal point. Moreover,
28 out of the 31 agencies have committees with at least one committee on either side of their ideal

34
point), and 25 agencies and bureaus have at least 2 committee medians on either side. For these
agencies in the 110th
Congress, there is therefore almost always at least one committee (and often
at least one chamber) that would oppose an attempt by Congress to move agency policy in either
ideological direction. Given this arrangement, if the president sought to influence agency policy
by moving it to the right through appointments, regulatory review, or some form of unilateral
executive action, Congress would be divided about whether or not to respond (depending on the
magnitude of the shift urged by the president).
Given the configuration of preferences in Figure 5, we can clearly see why the empirical
results of section 3 and 4 obtain and why Congress may have difficulty in responding to
presidential influence. However, it is extremely difficult to disentangle the relationship further
and determine whether the effects of sections 3 and 4 are primarily due to preference divergence
among the committees overseeing the agency or transaction costs and coordination problems
because of the number of committees involved in oversight. Although necessarily speculative
because the observations identifying the effect are rather weak (i.e., both effects are present in
almost all of the observations) and the magnitude of the observed preference divergence is
relatively modest given that the Democrats controlled both chambers in the 110th
Congress,
regressions controlling for the number of committees involved and the dispersion in the
committee preferences using several measures (e.g., the range, the standard deviation) cannot
reject the null that the ideological dispersion of the committee medians has no influence on the
relative influence of Congress. The number of involved committees continues to have a strong
positive correlation with increased presidential influence over agency policy making in these
regressions.
35
The ability to locate agencies vis-à-vis relevant political actors in the 110th
Congress
because of our survey of federal executives reveals confirmatory evidence that the number and
preferences of the committees involved likely make it difficult for Congress to respond to
presidential attempts to influence agency policy. Given the variation in the data, however, it is
unclear whether the increased influence of the president relative to congressional committees that
we document in sections 3 and 4 is primarily due to divergent preferences among the involved
committees or the difficulties associated with having many committees involved.
6. Conclusion and Implications
Modern governance is largely bureaucratic governance because legislatures and
executives delegate significant policymaking authority to unelected administrators. There are
many reasons for this deference, but understanding the nature of bureaucratic policymaking in the
modern state requires an awareness of the relative ability of Congress and the president to
influence the policy and programs of the bureaucracy. The answer to the question “who controls
the policy making in the bureaucracy” has broad implications for governance and democratic
accountability.
Despite the importance of the question, it is one that has proven to be notoriously difficult
to answer. Existing hypotheses point in all directions and empirical work has been hampered by
the lack of compelling data that allows us to sort out these wide ranging predictions. Our survey
of career executives in the federal bureaucracy provides an opportunity to break this logjam.
Focusing on the variation among and within agencies in the 110th
Congress (2007-2009), we offer
some important conclusions about the relative ability of Congress and the president to influence
agency policymaking. Specifically, we demonstrate a strong relationship between the number of
committees involved in oversight and the lack of congressional influence relative to the White

36
House. This relationship is evident both among agencies and the bureaus within agencies. Based
on the perceptions and opinions of those individuals most responsible for implementing agency
policy, the more congressional committees involved in the oversight of an agency, the weaker
Congress is relative to the president. This suggests that the more Congress cares about an issue –
at least as reflected in the structure of its committee system – the less influence Congress may
have over the direction of agency policy making. A troubling tension may therefore exist between
the institutions that maximize members’ electoral benefits and constituency responsiveness and
those that maximize congressional influence over policy outcomes.
To be clear, our results do not suggest that Congress is ineffectual in influencing agency
policy. Nor does it call into question prior findings that electorally minded members of Congress
are able to influence the spending decisions of agencies. Instead, our results relate to the net effect
of the interplay of presidential and congressional influence over the totality of agency
policymaking (consisting of both the provision of private goods affecting particular localities and
public goods concerning matters of general policy), and even if the committee system is optimally
designed to allow members of Congress to respond to the demands of their constituents and claim
credit for the goings-on of the federal bureaucracy, this does not necessarily translate into an
ability (or willingness) to influence overall agency policy.
Interpreting our results alongside the existing literature suggests that increasing the
number of committees with access to an agency may both simultaneously increase the ability of
members to secure electorally valuable private goods for their constituents, but also undermine
the ability of Congress as an institution to respond collectively to the actions of the presidency or
the bureaucracy. For example, the 108 committees and subcommittees overseeing the Department
of Homeland Security may provide members with access to DHS resources but also affect the
37
ability of Congress to compete with presidential influence over the general direction of agency
policy. Members overly focused on securing district resources such as homeland security grants,
visas for constituents, and disaster relief from the Department may be unwilling or unable to
focus on the larger policy goals. The ability and incentive of members of Congress to secure
private goods for their district does not imply that a similar ability and incentive exists when
dealing with the provision of public goods and the more diffuse policy goals.
Congress is not unaware of the predicament it confronts when trying to oversee and
influence the executive branch. The Joint Committee on the Organization of Congress in the 103rd
Congress (1993-1994), for example, weighed several different options of jurisdictional reform to
eliminate policy overlaps, including a proposal to correspond committee jurisdiction with
executive branch structure. While acknowledging that such a committee system could improve
the relationship between Congress and the bureaucracy and might help facilitate more
comprehensive oversight of the executive branch, the Joint Committee ultimately decided against
a reorganization and it reached the curious conclusion that “the Executive Branch is not optimally
organized, making executive reorganization a desirable precursor to this arrangement” (S. Prt.
103-55, pg 793). As was the case when the Department of Homeland Security was established,
despite recognizing the potential difficulties for effective congressional oversight and influence
(and, having to survey career executives to try to figure out which of its committees was
interacting with the various executive agencies!), Congress intentionally decided against
reorganizing the nature of congressional oversight.
Given the role played by the unelected bureaucracy in implementing policy, examining the
ability of the elected branches to influence agency behavior is critically important. We find that
the structure of the committee system leads to potential problems for congressional influence
38
relative to the unitary executive. Combined with the fact that members have little incentive to
change a system that works for them (Adler 2002), the prospects for congressional control over
the direction of agency policy seems remote in some areas. To the extent that the bureaucracy is
responsive to elected officials when implementing policy, the structure and incentives present
suggest a strong bias in favor of the president relative to Congress.

39
References
Aberbach, Joel D. 1990. Keeping a Watchful Eye. Washington, DC: Brookings.
Aberbach, Joel D., and Bert A. Rockman. 2000. In the Web of Politics. Washington, DC:
Brookings.
Adler, E. Scott. 2002. Why Congressional Reforms Fail: Reelection and the House Committee
System. Chicago, IL: University of Chicago Press.
Aldrich, John H. 1995. Why Parties? Chicago, IL: University of Chicago Press.
Arnold, R. Douglas. 1980. Congress and the Bureaucracy: A Theory of Influence. New Haven,
CT: Yale University Press.
Balla, Steven J. 2000. “Legislative Organization and Congressional Review of Agency
Regulations.” Journal of Law, Economics, and Organization 16(2):424-448.
Background Materials: Supplemental Information Provided to Members of the Joint Committee
on the Organization of Congress. Joint Committee on the Organization of Congress; 103rd
Congress, 1st Session. S. Prt. 103-55
Banks, Jeffrey S. and Barry R. Weingast. 1992. “The Political Control of Bureaucracies under
Asymmetric Information.” American Journal of Political Science 36(2):509-524.
Baumgartner, Frank R. and Bryan D. Jones. 1993. Agendas and Instability in American Politics.
Chicago, IL: University of Chicago Press.
Baumgartner, Frank R., Bryan D. Jones, and Michael C. MacLeod. 2000. “The Evolution of
Legislative Jurisdictions.” The Journal of Politics 62(2):321-349.
Bawn, Kathleen. 1995. “Political Control Versus Expertise: Congressional Choices about
Administrative Procedures.” The American Political Science Review 89(1):62-73.
40
Bendor, Jonathan B. 1985. Parallel Systems: Redundancy in Government. Berkeley, CA:
University of California Press.
Bertelli, Anthony M. and Christian R. Grose. 2009. “Secretaries of Pork? Executive Ideology,
Multiple Bureaucratic Principals, and Distributive Public Policy.” Journal of Politics
71(3):926-945.
Calvert, Randall L., Mathew McCubbins, and Barry R. Weingast. 1989. “A Theory of Political
Control and Agency Discretion.” American Journal of Political Science 33(3):588-611.
Clinton, Joshua D., Anthony Bertelli, Christian Grose, David E. Lewis and David C. Nixon. 2012.
“Separated Powers in the United States: The Ideology of Agencies, Presidents and
Congress.” American Journal of Political Science 56(2): 341-354.
Clinton, Joshua D., Simon Jackman, and Douglas Rivers. 2004. “The Statistical
Analysis of Roll Call Data.” American Political Science Review 98:355–70.
Clinton, Joshua D. and David E. Lewis. 2008. “Expert Opinion, Agency Characteristics, and
Agency Preferences.” Political Analysis 16(1):3-20.
Cohen, Dara Kay, Mariano-Florentino Cuellar, and Barry R. Weingast. 2006. “Crisis
Bureaucracy: Homeland Security and the Political Design of Legal Mandates.” Stanford
Law Review 59(3):673-759.
Dahl, Robert A. and Charles E. Lindblom. 1953. Politics, Economics, and Welfare. New York,
NY: Harper and Brothers.
Deering, Christopher J. and Steven S. Smith. 1997. Committees in Congress. Washington, DC:
CQ Press.
Dodd, Lawrence C. and Richard L. Schott. 1979. Congress and the Administrative State. New
York, NY: Wiley.
41
Evans, C. Lawrence. 1999. “Legislative Structure: Rules, Precedents, and Jurisdictions.”
Legislative Studies Quarterly 24(4):605-642.
_____. 2005. “Politics of Congressional Reform.” In The Legislative Branch, eds. Paul J. Quirk
and Sarah A. Binder. New York, NY: Oxford University Press.
Fenno, Richard F. 1973. Congressmen in Committees. Boston, MA: Little, Brown, and Co.
Ferejohn, John, and Charles Shipan. 1990. “Congressional Influence on Bureaucracy.” Journal
of Law, Economics, and Organization 6:1-20.
Fiorina, Morris P. 1977. Congress: Keystone of the Washington Establishment. New Haven,
CT: Yale University Press.
Fishel, Jeff. 1985. Presidents and Promises. Washington, DC: CQ Press.
Freeman, J. Leiper. 1958. “The Bureaucracy and Pressure Politics.” In Francis E. Rourke, ed.,
Bureaucratic Power In National Politics. Boston, MA: Little, Brown, & Co.
Gailmard, Sean. 2009. “Multiple Principals and Oversight of Bureaucratic Policy-Making.”
Journal of Theoretical Politics 21(2):161-186.
Golden, Marissa Martino. 2000. What Motivates Bureaucrats? New York: Columbia University
Press.
Hall, Richard L. 1996. Participation in Congress. New Haven, CT: Yale University Press.
Hall, Richard L., and Kristina C. Miler. 2008. “What Happens After the Alarm? Interest Group
Subsidies to Legislative Overseers.” Journal of Politics 70(4):990-1005.
Hammond, Thomas H., and Jack H. Knott. 1996. “Who Controls the Bureaucracy? Presidential
Power, Congressional Dominance, Legal Constraints, and Bureaucratic Autonomy in a
Model of Multi-Institutional Policy-Making.” Journal of Law, Economics, and
Organization 12(1):119-166.
42
_____. 1999. “Political Institutions, Public Management, and Policy Choice.” Journal of Public
Administration Research and Theory 9:1 (January): 33-85.
Kaniewski, Daniel J. 2010. “Congress Should Consider Its Own Failures in Attempted Bombing.”
Roll Call, February 19, 2010 (http://www.rollcall.com/news/43351-1.html, accessed
December 29, 2010).
King, David C. 1997. Turf Wars: How Congressional Committees Claim Jurisdiction. Chicago,
IL: University of Chicago Press.
Laffont, Jean-Jacques and Jean Tirole. 1993. A Theory of Incentives in Procurement and
Regulation. Cambridge, MA: The MIT Press.
Lowi, Theodore J. 1979. The End of Liberalism: The Second Republic of the United States. New
York: W.W. Norton and Company.
MacDonald, Jason A. 2007. “Agency Design and Postlegislative Influence over the
Bureaucracy.” Political Research Quarterly 60(4):683-695.
Mann, Thomas, and Norman Ornstein. 2006. “When Congress Checks Out.” Foreign Affairs,
November/December.
Maranto, Robert. 1993a. “Still Clashing after All These Years: Ideological Conflict in the Reagan
Executive.” American Journal of Political Science 37(3):681-98.
___. 1993b. Politics and Bureaucracy in the Modern Presidency. Westport, CT: Greenwood.
___. 2005. Beyond a Government of Strangers. Lanham, MD: Lexington.
Maranto, Robert, and Karen M. Hult. 2004. "Right Turn? Political Ideology in the Higher Civil
Service, 1987-1994." American Review of Public Administration 34:199-222.
Mayhew, David. 1974. Congress: The Electoral Connection. New Haven, CT: Yale University
Press.
43
McCubbins, Mathew D., Roger G. Noll, and Barry R. Weingast. 1987. “Administrative
Procedures as Instruments of Political Control.” Journal of Law, Economics, and
Organization 3(2):243-277.
_____. 1989. “Structure and Process, Politics and Policy: Administrative Arrangements and the
Political Control of Agencies.” Virginia Law Review 75:431-482.
McCubbins, Matthew D. and Thomas Schwartz. 1984. “Congressional Oversight Overlooked:
Police Patrol Versus Fire Alarm.” American Journal of Political Science 28(1):165-177.
Meier, Kenneth John, and Lloyd G. Nigro. 1976. “Representative Bureaucracy and Policy
Preferences: A Study in the Attitudes of Federal Executives.” Public Administration
Review 36(4):458-69.
Miller, Gary J. 2005. “The Political Evolution of Principal-Agent Models.” Annual Review of
Political Science 8:203-225.
Miller, Gary J., and Thomas H. Hammond. 1990. “Committees and the Core of the Constitution.”
Public Choice 66(2):101-16.
Moe, Terry M. 1984. “The New Economics of Organization.” American Journal of Political
Science 28(4):739-777.
_____1985. “Control and Feedback in Economic Regulation: The Case of the NLRB.” The
American Political Science Review 79(4):1094-1116.
_____1987. “An Assessment of the Positive Theory of ‘Congressional Dominance.’” Legislative
Studies Quarterly 12(4):475-520.
National Commission on Terrorist Attacks Upon the United States. 2004. The 9/11 Commission
Report. Washington, DC: Government Printing Office.

44
O’Connell, Anne Joseph. 2006. “The Architecture of Smart Intelligence: Structuring and
Overseeing Agencies in the Post-9/11 World.” California Law Review 94:1655-1744.
Ogul, Morris S. 1976. Congress Oversees the Bureaucracy. Pittsburgh, PA: Pittsburgh
University Press.
Ogul, Morris S. and Bert A. Rockman. 1990. “Overseeing Oversight: New Departures and Old
Problems.” Legislative Studies Quarterly 15(1):5-24.
Rourke, Francis E. 1972. “Variations in Agency Power.” In Francis E. Rourke, ed., Bureaucratic
Power In National Politics. Boston, MA: Little, Brown, & Co.
Scholz, John T. and B. Dan Wood. 1998. “Controlling the IRS: Principals, Principles, and Public
Administration.” American Journal of Political Science 42(1):141-162.
Shepsle, Kenneth A. 1978. The Giant Jigsaw Puzzle: Democratic Committee Assignments in the
Modern House. Chicago, IL: University of Chicago Press.
Snyder, Susan K. and Barry R. Weingast. 2000. “The American System of Shared Powers: The
President, Congress, and the NLRB.” Journal of Law, Economics, and Organization
16(2):269-305.
Steunenberg, Bernard. 1992. “Congress, the Bureaucracy, and Regulatory Policy-making.”
Journal of Law, Economics, and Organization 8(3):673-694.
Talbert, Jeffery C., Bryan D. Jones, and Frank R. Baumgartner. 1995. “Nonlegislative Hearings
and Policy Change in Congress.” American Journal of Political Science 39(2):383-405.
de Tocqueville, Alexis. 1835. Democracy in America. New York, NY: Literary Classics of the
United States.
45
U.S. Congress. Joint Committee on the Organization of Congress. 1993. Background Materials:
Supplemental Information Provided to Members of the Joint Committee on the
Organization of Congress. 103rd
Congress, 1st Session. S. Prt. 103-55.
Weber, Max. 1946. “Bureaucracy.” In Max Weber: Essays in Sociology. H.H. Gerth and C.W.
Mills, eds. New York, NY: Oxford University Press.
Weingast, Barry R. 1984. “The Congressional-Bureaucratic System: A Principal Agent
Perspective (With Applications to the SEC).” Public Choice 44:147-191.
Weingast, Barry R. and Mark J. Moran. 1983. “Bureaucratic Discretion or Congressional
Control? Regulatory Policymaking by the Federal Trade Commission.” Journal of
Political Economy 91(5):765-800.
Whitford, Andrew B. 2005. “The Pursuit of Political Control by Multiple Principals.” Journal
of Politics 67(1):29-49.
Wilson, James Q. 1989. Bureaucracy: What Government Agencies Do and Why They Do It.
New York, NY: Basic Books.
Wilson ,Woodrow. 1887. “The Study of Administration.” Political Science Quarterly 2(2):197-
222.
Wood, B. Dan and James E. Anderson. 1993. “The Politics of U.S. Antitrust Regulation.”
American Journal of Political Science 37(1):1-39.
Wood, B. Dan and Richard Waterman. 1993. “The Dynamics of Political-Bureaucratic
Adaptation.” American Journal of Political Science 37(2):497-528.
Woolley, John T. 1993. “Conflict among Regulators and the Hypothesis of Congressional
Dominance.” The Journal of Politics 55(1):92-114.
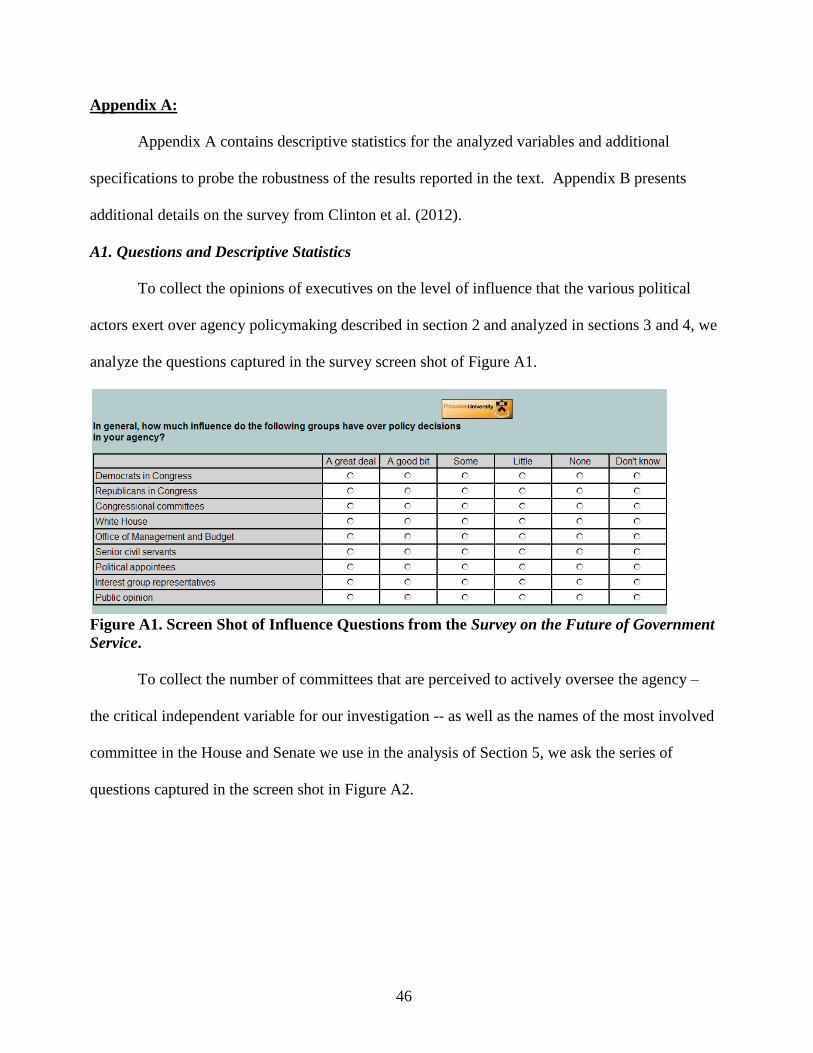
46
Appendix A:
Appendix A contains descriptive statistics for the analyzed variables and additional
specifications to probe the robustness of the results reported in the text. Appendix B presents
additional details on the survey from Clinton et al. (2012).
A1. Questions and Descriptive Statistics
To collect the opinions of executives on the level of influence that the various political
actors exert over agency policymaking described in section 2 and analyzed in sections 3 and 4, we
analyze the questions captured in the survey screen shot of Figure A1.
Figure A1. Screen Shot of Influence Questions from the Survey on the Future of Government
Service.
To collect the number of committees that are perceived to actively oversee the agency –
the critical independent variable for our investigation -- as well as the names of the most involved
committee in the House and Senate we use in the analysis of Section 5, we ask the series of
questions captured in the screen shot in Figure A2.
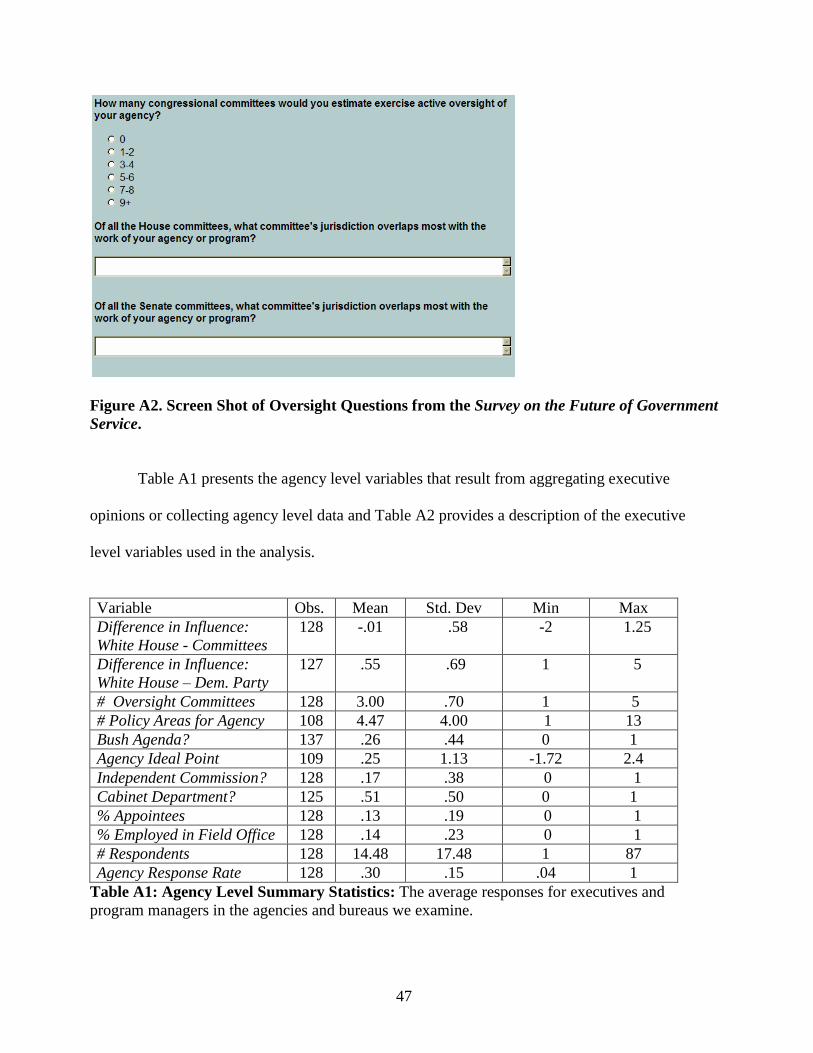
47
Figure A2. Screen Shot of Oversight Questions from the Survey on the Future of Government
Service.
Table A1 presents the agency level variables that result from aggregating executive
opinions or collecting agency level data and Table A2 provides a description of the executive
level variables used in the analysis.
Variable Obs. Mean Std. Dev Min Max
Difference in Influence:
White House - Committees
128 -.01 .58 -2 1.25
Difference in Influence:
White House – Dem. Party
127 .55 .69 1 5
# Oversight Committees 128 3.00 .70 1 5
# Policy Areas for Agency 108 4.47 4.00 1 13
Bush Agenda? 137 .26 .44 0 1
Agency Ideal Point 109 .25 1.13 -1.72 2.4
Independent Commission? 128 .17 .38 0 1
Cabinet Department? 125 .51 .50 0 1
% Appointees 128 .13 .19 0 1
% Employed in Field Office 128 .14 .23 0 1
# Respondents 128 14.48 17.48 1 87
Agency Response Rate 128 .30 .15 .04 1
Table A1: Agency Level Summary Statistics: The average responses for executives and
program managers in the agencies and bureaus we examine.

48
Variable Obs. Mean Std. Dev. Min Max
Difference in Influence:
White House - Committees
1816 .12 1.01 -4 4
Difference in Influence:
White House – Dem. Party
1743 .64 1.17 -4 4
# Oversight Committees 1798 3.21 1.10 1 6
# Policy Areas for Agency 1674 6.20 4.36 1 13
Bush Agenda 1816 .39 .49 0 1
Agency Ideal Point 1729 .18 1.07 -1.72 2.4
Independent Commission? 1816 .09 .28 0 1
Cabinet Department? 1791 .68 .47 0 1
Bureaucrats’ Ideal Point 1765 -.04 .82 -1.51 1.79
Appointee Indicator 1810 .11 .32 0 1
Employed in Field Office? 1809 .19 .39 0 1
Years Employed in Agency 1801 18.68 11.71 0 50
Executive Pay Grade 1744 5.23 2.45 1 11
Table A2: Executive Level Summary Statistics: The distribution of individual
responses. These are aggregated to produce the means reported in Table A1.
A2. Robustness Results: Table 1 in the Text
Table A3 replicates the results of Table 1 in the text using the number of committees that
held hearings involving the agency during the 110th
Congress instead of the respondents’
perceptions of the average number of committees with oversight jurisdiction. The results are in
the same direction, but the effect is extremely imprecise. For the reasons we provide in the text,
we believe that our measure is superior as it is not entirely clear what the number of committees
holding hearings means in terms of the level of active oversight.
White House
Influence
Relative to
Congressional
Committees
White House
Influence
Relative to
Congressional
Committees
White House
Influence
Relative to
Democratic
Party
White House
Influence
Relative to
Democratic
Party
All
Executives
Careerists
Only
All
Executives
Careerists
Only
(Model 1) (Model 2) (Model 3) (Model 4)
Constant
(Std. Err)
.37*
(.15)
.37*
(.16)
.90*
(.14)
.92*
(.15)
# of Committees .009 .009 .006 .004
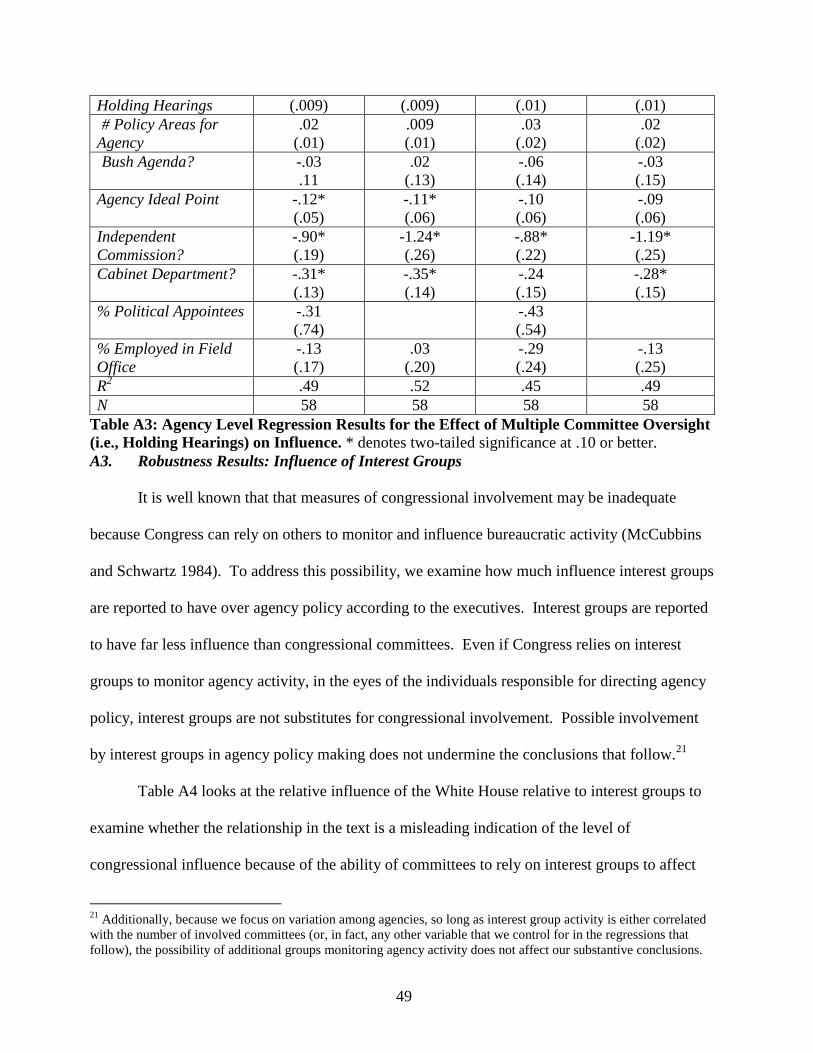
49
Holding Hearings (.009) (.009) (.01) (.01)
# Policy Areas for
Agency
.02
(.01)
.009
(.01)
.03
(.02)
.02
(.02)
Bush Agenda? -.03
.11
.02
(.13)
-.06
(.14)
-.03
(.15)
Agency Ideal Point -.12*
(.05)
-.11*
(.06)
-.10
(.06)
-.09
(.06)
Independent
Commission?
-.90*
(.19)
-1.24*
(.26)
-.88*
(.22)
-1.19*
(.25)
Cabinet Department? -.31*
(.13)
-.35*
(.14)
-.24
(.15)
-.28*
(.15)
% Political Appointees -.31
(.74)
-.43
(.54)
% Employed in Field
Office
-.13
(.17)
.03
(.20)
-.29
(.24)
-.13
(.25)
R2 .49 .52 .45 .49
N 58 58 58 58
Table A3: Agency Level Regression Results for the Effect of Multiple Committee Oversight
(i.e., Holding Hearings) on Influence. * denotes two-tailed significance at .10 or better.
A3. Robustness Results: Influence of Interest Groups
It is well known that that measures of congressional involvement may be inadequate
because Congress can rely on others to monitor and influence bureaucratic activity (McCubbins
and Schwartz 1984). To address this possibility, we examine how much influence interest groups
are reported to have over agency policy according to the executives. Interest groups are reported
to have far less influence than congressional committees. Even if Congress relies on interest
groups to monitor agency activity, in the eyes of the individuals responsible for directing agency
policy, interest groups are not substitutes for congressional involvement. Possible involvement
by interest groups in agency policy making does not undermine the conclusions that follow.21
Table A4 looks at the relative influence of the White House relative to interest groups to
examine whether the relationship in the text is a misleading indication of the level of
congressional influence because of the ability of committees to rely on interest groups to affect
21
Additionally, because we focus on variation among agencies, so long as interest group activity is either correlated
with the number of involved committees (or, in fact, any other variable that we control for in the regressions that
follow), the possibility of additional groups monitoring agency activity does not affect our substantive conclusions.

50
agency policy. The results in Table A4 are qualitatively identical to the results in Table 1 – more
committee involvement leads to more presidential influence relative to interest group influence.
The fact that the relationship is unchanged suggests that interest groups are not substitutes for
congressional committees.
White House Influence
Relative to Int. Groups
White House Influence
Relative to Int. Groups
All Executives Careerists Only
(Model 5) (Model 6)
Constant
(Std. Err)
-.66
(.48)
-1.01
(.68)
Average # of
Oversight
Committees
.57*
(.16)
.57*
(.19)
# Policy Areas
for Agency
-.004
(.02)
.005
(.02)
Bush Agenda? .03
(.13)
-.10
(.23)
Agency Ideal
Point
-.01
(.06)
-.38*
(.09)
Independent
Commission?
-.98*
(.21)
-.47
(.44)
Cabinet
Department?
-.27*
(.15)
.02
(.26)
% Political
Appointees
.41
(.44)
% Employed in
Field Office
-.48*
(.20)
.05
(.41)
R2 .52 .24
N 95 95
Table A4: Agency Level Regression Results for the Effect of Multiple
Committee Oversight on Presidential influence relative to Interest
Groups: * denotes two-tailed significance at .10 or better.
A4. Robustness Results: Influence of Democratic Party
Table A5 replicates the results of Table 3 in the text for the influence of the president
relative to the Democratic Party. As was the case in Table 3, the results are not affected by
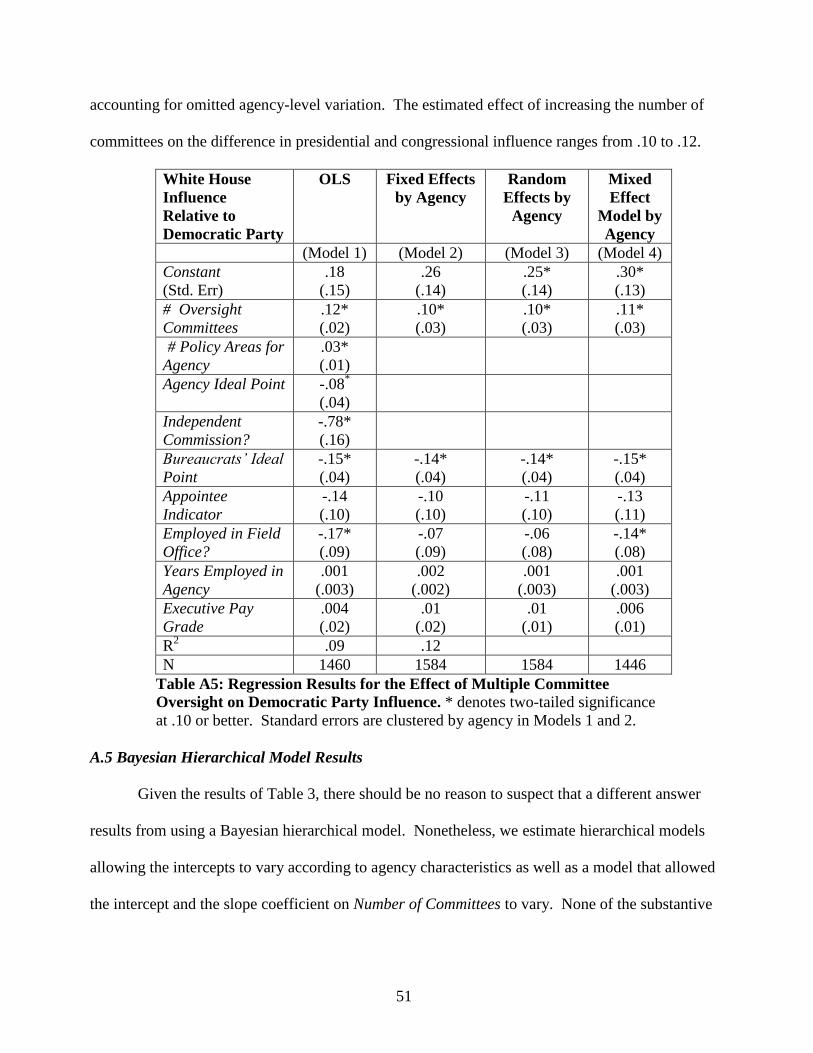
51
accounting for omitted agency-level variation. The estimated effect of increasing the number of
committees on the difference in presidential and congressional influence ranges from .10 to .12.
White House
Influence
Relative to
Democratic Party
OLS Fixed Effects
by Agency
Random
Effects by
Agency
Mixed
Effect
Model by
Agency
(Model 1) (Model 2) (Model 3) (Model 4)
Constant
(Std. Err)
.18
(.15)
.26
(.14)
.25*
(.14)
.30*
(.13)
# Oversight
Committees
.12*
(.02)
.10*
(.03)
.10*
(.03)
.11*
(.03)
# Policy Areas for
Agency
.03*
(.01)
Agency Ideal Point -.08*
(.04)
Independent
Commission?
-.78*
(.16)
Bureaucrats’ Ideal
Point
-.15*
(.04)
-.14*
(.04)
-.14*
(.04)
-.15*
(.04)
Appointee
Indicator
-.14
(.10)
-.10
(.10)
-.11
(.10)
-.13
(.11)
Employed in Field
Office?
-.17*
(.09)
-.07
(.09)
-.06
(.08)
-.14*
(.08)
Years Employed in
Agency
.001
(.003)
.002
(.002)
.001
(.003)
.001
(.003)
Executive Pay
Grade
.004
(.02)
.01
(.02)
.01
(.01)
.006
(.01)
R2 .09 .12
N 1460 1584 1584 1446
Table A5: Regression Results for the Effect of Multiple Committee
Oversight on Democratic Party Influence. * denotes two-tailed significance
at .10 or better. Standard errors are clustered by agency in Models 1 and 2.
A.5 Bayesian Hierarchical Model Results
Given the results of Table 3, there should be no reason to suspect that a different answer
results from using a Bayesian hierarchical model. Nonetheless, we estimate hierarchical models
allowing the intercepts to vary according to agency characteristics as well as a model that allowed
the intercept and the slope coefficient on Number of Committees to vary. None of the substantive
52
results are sensitive to this specification choice – presidential influence relative to Congress
increases as the number of involved committees increases.
For executive i, serving in agency j, we estimate their opinion on the influence of the
president relative to Congress controlling for aspects at the individual and agency level that may
either affect the actual amount of relative influence or affect the individual’s perception of the
relative influence.
yi = a[ j ] + b[ j ] ´ Num.Commi + X[i,]q +e i
where X[i,] is a row vector of individual level characteristics that may affect the actual or
perceived amount of relative influence over that aspect of agency j in which individual i works
and is the column vector of individual level coefficients.
To allow for the average amount of relative influence to vary across agencies, we estimate
a separate intercept for each agency ([j]). We can also allow for the relationship between the
number of committees involved in the oversight of any agency and the relative amount of
presidential influence to vary across agencies by estimating separate intercepts for each agency
([j]).
Because we can hypothesize about the agency level characteristics that may explain
variation in the relative influence of the president, we model the agency level intercepts using
agency level data. More precisely, = Z+ where Z is a matrix of agency level covariates, is
the column vector of agency level coefficients. The individual and agency level covariates
are as described in the text. We assume diffuse, mean-zero, priors for the coefficient vectors
and and we assume that the varying intercepts are drawn from a common distribution:
[j] ~N(,).

53
The JAGS code for estimating a model with varying intercepts with individual and
agency covariates, as well as the choice of priors is as follows:
model{
for(i in 1:N){
y[i] ~ dnorm(y.hat[i], tau.y)
y.hat[i]<-a[agency[i]] + b*numcom[i] + inprod(b.0[],x.0[i,])
}
tau.y <- pow(sigma.y, -2)
sigma.y ~ dunif(0,100)
b ~ dnorm(0,.0001)
for(j in 1:J){
a[j] ~ dnorm(a.hat[j],Tau.A)
a.hat[j] <- inprod(g.a[],U[j,])
}
for(k in 1:K.0){
b.0[k] ~ dnorm(0,.0001)
}
for(k in 1:(G.0)){
g.a[k] ~ dnorm(0,.0001)
}
Tau.A <- pow(sigma.a,-2)
sigma.a ~ dunif(0,100)
}
A.6: Distribution of Congressional Ideal Points
Figure A3 plots the distribution of ideal points of all members of Congress using the ideal
point estimates that are used in Section 5. The fact that the Senate median in the Democratically-
controlled Senate is positive is entirely an artifact of the mean 0, variance 1 normalization
assumption after including the “votes” of the career executives (who are more likely to be liberal
than conservative and who are more numerous than members of Congress).
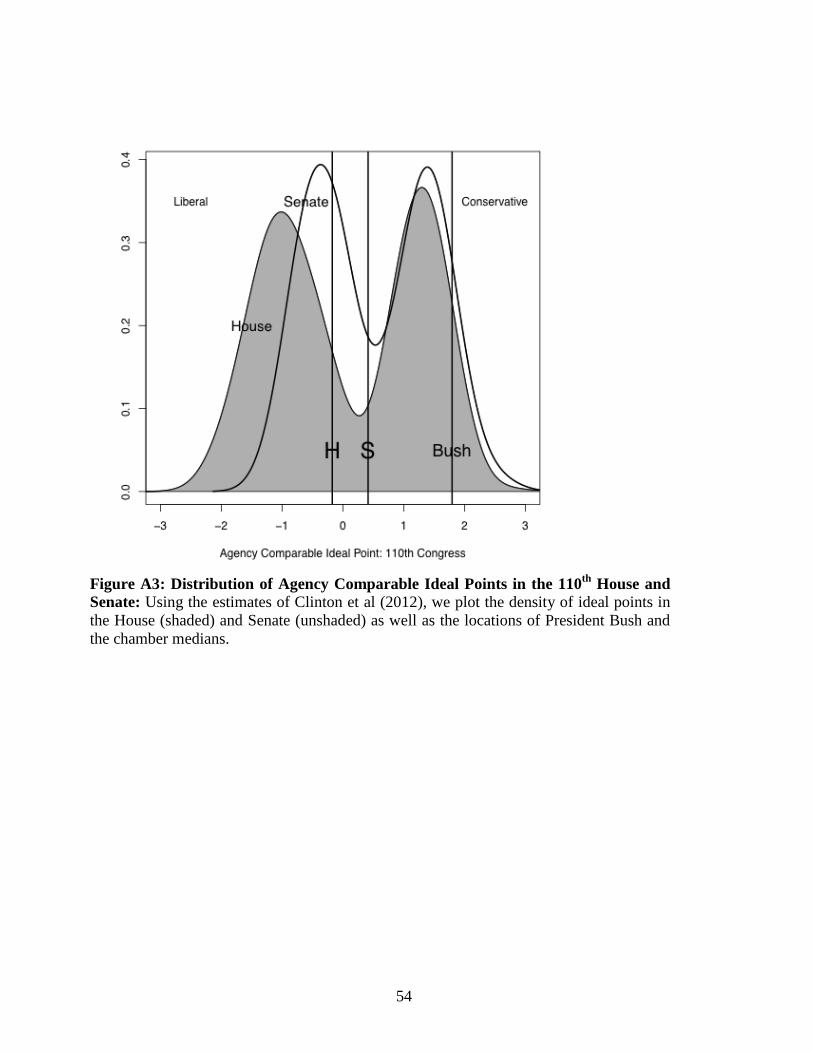
54
Figure A3: Distribution of Agency Comparable Ideal Points in the 110
th House and
Senate: Using the estimates of Clinton et al (2012), we plot the density of ideal points in
the House (shaded) and Senate (unshaded) as well as the locations of President Bush and
the chamber medians.
55
Appendix B: Details of the Survey on the Future of Government Service
The principal investigators of the survey obtained the contact information for all federal
agency administrators and program managers from Leadership Directories, Inc., the firm that
publishes the Federal Yellow Book. Of the 7,448 names provided, 297 turned out to be incorrect;
they either were no longer in their position or their contact information was incorrect. The survey
was web-based and conducted by the Princeton Survey Research Center (PSRC). Each potential
respondent was sent a letter on Princeton University letterhead inviting them to participate and
giving them options about how to do so. Those for whom PSRC had email addresses (77%) were
told that they would be getting an email of the survey one week after the initial letter. They were
also told they could go to a website and login immediately with information included in the
invitation letter. All respondents for whom PSRC had an email received an initial letter, an email
invitation, up to three follow up email reminders, and a telephone call. The response rate from this
group was 35%.
Those for whom PSRC did not have email addresses were asked to provide an email or go
to the website directly and use the login and password provided. PSRC then scheduled a series of
follow up emails, letters, and ultimately, telephone calls. Those respondents whose email PSRC
did not have received an initial letter, a follow up letter, a telephone call, and a final reminder
letter. The response rate for this group was 20%.
The overall response rate, once persons incorrectly included were excluded, is 34%
(2,398/7,151). Of the 2,398 respondents, 2,069 completed the full survey. Agency-by-agency, the
lowest responders were the Executive Office of the President (11%), the United States Post Office
(15%), and the Department of the Treasury (20%). The highest responders were the Nuclear
Regulatory Commission (56%), the Federal Trade Commission (63%), and the National Archives
56
and Records Administration (71%). Agencies closer to the president have lower response rates on
average than other agencies.
The response rate was noticeably higher among career professionals than appointees. The
survey produced responses from 259 political appointees, compared to 2,021 career professionals.
Of the appointees, 102 are Senate-confirmed appointees. Of the approximately 550 policy-
relevant Senate-confirmed appointees, this amounts to a 19% response rate. There are 131
appointed members of the Senior Executive Service (SES) who responded out of approximately
700 total (19%), but not all of the 700 appointees in the SES are administrators or program
managers. This suggests that the response rate from appointees in the SES is higher.
In the sample, PhDs and men were also more likely to respond to the survey. The original
list also included 461 potential respondents from the National Science Foundation (NSF) because
the firm incorrectly labeled NSF program officers as managers or executives. If NSF employees
are removed the response rate is 33% (2,250/6,690).
Nonresponse weights based on available covariates such as gender, agency, and whether
the appointee was a career civil servant or a political appointee were constructed and applied to
the data when constructing the agency means, but no appreciable differences emerged from so
doing.