Influence of the Surface Roughness of Aggregates on the ...
38
1 Influence of the Surface Roughness of Aggregates on the Adhesion Quality of Asphalt-Aggregate Systems By María José Aroca Moscote Presented to the Department of Civil and Environmental Engineering Universidad de los Andes For the Degree of Master of Science Under Supervision of Professor Silvia Caro Bogotá, Colombia December 2019
Transcript of Influence of the Surface Roughness of Aggregates on the ...
1
Influence of the Surface Roughness of Aggregates on the Adhesion
Quality of Asphalt-Aggregate Systems
By
María José Aroca Moscote
Presented to the Department of Civil and Environmental Engineering
Universidad de los Andes
For the Degree of Master of Science
Under Supervision of Professor Silvia Caro
Bogotá, Colombia
December 2019

2
TABLE OF CONTENTS
LIST OF FIGURES ................................................................................................................................. 3
LIST OF TABLES ................................................................................................................................... 4
1 Introduction ..................................................................................................................................... 5
2 Research objectives .......................................................................................................................... 8
3 Materials .......................................................................................................................................... 9
3.1 Asphalt binder .......................................................................................................................... 9
3.2 Aggregates ............................................................................................................................... 9
3.2.1 Marble ............................................................................................................................ 10
3.2.2 Quartzite ......................................................................................................................... 10
3.2.3 Serpentinite..................................................................................................................... 10
4 Experimental methodology ............................................................................................................. 11
4.1 Experimental set-up ................................................................................................................ 11
4.1.1 Rock sample preparation ................................................................................................. 11
4.1.2 Determination of the roughness parameters of the rock samples ...................................... 13
4.1.3 Modified micrometer for the fabrication of the testing specimens .................................... 14
4.1.4 Aggregates-Asphalt-Stub (AAS) system preparation ....................................................... 15
4.2 Testing procedure ................................................................................................................... 15
5 Results and analysis ....................................................................................................................... 17
5.1 Roughness Profiles ................................................................................................................. 17
5.1.1 Sandblasting texturing method ........................................................................................ 17
5.1.2 Texture by means of the scalpel method .......................................................................... 19
5.2 Roughness parameters ............................................................................................................ 20
5.2.1 Sandblasting texturing method ........................................................................................ 20
5.2.2 Texture by means of the scalpel method .......................................................................... 23
5.3 Mechanical performance of AAS systems ............................................................................... 25
5.3.1 Sandblasting texturing method ........................................................................................ 25
5.3.2 Texture by means of the scalpel method .......................................................................... 28
5.3.3 Types of failure ............................................................................................................... 32
5.4 Comparison of results among rocks and texturing methods ..................................................... 33
6 Conclusions ................................................................................................................................... 35
7 References ..................................................................................................................................... 37

3
LIST OF FIGURES
Figure 1. Serpentinite rocks and Marble rocks .......................................................................................... 9 Figure 2. Quartzite rock. .......................................................................................................................... 9 Figure 3. Experimental Set Up. .............................................................................................................. 11 Figure 4. Samples of quartzite textured through Sandblasting method. ................................................... 12 Figure 5. Samples of marble texturized through sandblasting method. .................................................... 12 Figure 6. Samples of serpentinite texturized by means of the scalpel method. ......................................... 13 Figure 7. Samples of marble texturized by means of the scalpel method. ................................................ 13 Figure 8. The roughness profile with its Mean Line, Arithmetical mean roughness Ra and Root mean-square
average Rq (Mahr Production Metrology, 2019). .................................................................................... 14 Figure 9. The roughness profile with its Maximum Roughness Depth Rmax (Mahr Production Metrology,
2019). .................................................................................................................................................... 14 Figure 10. Modified micrometer for AAS sample preparation Cala et al. (2019). ................................... 14 Figure 11. AAS system, all dimensions shown are in mm Cala et al. (2019). .......................................... 15 Figure 12. Experimental testing procedure setup Cala et al. (2019). ........................................................ 16 Figure 13. Low roughness profile from a sample texturized through the sandblasting method. ................ 18 Figure 14. Medium roughness profile from a sample texturized through the sandblasting method. .......... 18 Figure 15. High roughness profile from a sample texturized thorough the sandblasting method. ............. 18 Figure 16. Low roughness profile from a sample texturized by means of the scalpel method. ................. 19 Figure 17. Medium roughness profile from a sample texturized by means of the scalpel method. ........... 19 Figure 18. High roughness profile from a sample texturized by means of the scalpel method. ................. 20 Figure 19. Relationship between the Sandblasting pressure and the roughness parameter Ra. ................. 21 Figure 20. Relationship between the line angles and the roughness parameter Ra. .................................. 23 Figure 21. Load[N] vs. Displacement [mm] curves of quartzite samples textured through sandblasting
method. ................................................................................................................................................. 26 Figure 22. Load[N] vs. Displacement [mm] curves of marble samples textured through sandblasting method.
.............................................................................................................................................................. 27
Figure 23. Ra [μm] vs. 𝐹𝑚𝑎𝑥 [N] of quartzite and marble samples textured through sandblasting method.
.............................................................................................................................................................. 27
Figure 24. Area of contact [𝑚𝑚2] vs. 𝐹𝑚𝑎𝑥[𝑁] of the quartzite and marble samples texturized through
sandblasting method. ............................................................................................................................. 28 Figure 25. The Area of contact [𝑚𝑚2] vs. 𝑊𝑓[𝐽] of the quartzite and marble samples texturized through
sandblasting method. ............................................................................................................................. 28 Figure 26. Load[N] vs. Displacement [mm] curves of serpentinite samples textured by means of the scalpel
method. ................................................................................................................................................. 29 Figure 27. Load[N] vs. Displacement [mm] curves of marble samples textured by means of the scalpel
method. ................................................................................................................................................. 30 Figure 28. Ra [μm] vs. (𝐹𝑚𝑎𝑥)[N]] curves of serpentinite and marble samples textured by means of the
scalpel method. ...................................................................................................................................... 31 Figure 29. The Area of contact [𝑚𝑚2] vs. 𝐹𝑚𝑎𝑥[𝑁] graph of the serpentinite and marble samples
texturized by means of the scalpel method. ............................................................................................ 31 Figure 30. The Area of contact [𝑚𝑚2] vs. 𝑊𝑓[𝐽] graph of the serpentinite and marble samples texturized
by means of the scalpel method. ............................................................................................................. 32 Figure 31. Quartzite 80Qtz4 sample with a cohesive failure in the interface. ........................................... 32 Figure 32. Quartzite 60Mrb2 sample with a cohesive failure and substrate failure in the interface. .......... 33

4
LIST OF TABLES
Table 1. Roughness parameters of the aggregates texturized through sandblasting (STD stands for standard
deviation) .............................................................................................................................................. 21 Table 2. Roughness parameters of the aggregates texturized by means of the scalpel method (STD. ....... 23 Table 3. The maximum load at failure and the work fracture results of samples of quartzite and marble
texturized through sandblasting. ............................................................................................................. 26 Table 4. The maximum load at failure and the work fracture results of samples of serpentinite and marble
texturized by means of the scalpel method. ............................................................................................ 29

5
1 Introduction
Asphalt concrete has been widely used for roadway pavements due to its ability to provide structural
capacity and smooth surface. The rapid growth of traffic flow, the combined effect of environmental
conditions and the increase of the global temperature has led to premature damage of asphalt pavements
in their early life. Rutting, cracks, potholes and other road distresses seriously affect the pavement
performance conditions, and compromise driving safety (Cui, Xiao, Yan, Li, & Wu, 2018).
Asphalt concrete is composed mainly of two materials: aggregates, which form the skeleton of the
structure, and asphalt binder, which is the primary binding material. There are three main factors
affecting the durability of asphalt concrete related to the adhesion quality of the asphalt-aggregate
system, which include: 1) cohesion loss within asphalt, 2) strength reduction of aggregate particles, and
3) breakdown of adhesive bonding between aggregate and asphalt (Xu & Wang, 2016). Thus, to ensure
good durability of the asphalt concrete it is important to guarantee good adhesion quality between the
asphalt binder and the mineral aggregates. Hence, an understanding of the adhesion mechanisms
between the aggregate and bitumen is required to enhance the durability of road surfaces, and also the
optimum selection of the asphalt component materials to be used in a particular road infrastructure
project (Cui, Blackman, Kinloch, & Taylor, 2014) in order to have a better adhesion quality. In general,
the adhesion quality between the bitumen and the aggregates depends on several factors, including the
surface physical characteristics of the aggregates, their surface chemical constituents, and certain active
functional groups of asphalt constituents (Kuang, et al., 2019).
Aggregate particles are used in various layers of the pavement structure, either in granular conditions
for base and subbase layers (i.e., unbonded layers) or in a bonded condition as part of the asphalt mixture
for base and surface courses. Aggregates represent more than 90% of the pavement structure. Therefore,
the performance of the asphalt concrete is directly affected by aggregate characteristics, particularly
aggregate gradation, shape, angularity, and surface texture (Chen, Li, Wang, Wu, & Huang, 2015). It
has long been recognized that the surface texture of a particle of aggregate might be an important
property in determining the adhesion of binders to its surface. The degree of adhesion might, in turn, be
expected to influence the properties of the mix (Wright, 1995). In conclusion, the surface texture of the
aggregates has an important role in the adhesion quality between the mineral aggregates and the asphalt
binders, and therefore in the asphalt pavement performance and durability.
Previous works recognize the importance of the morphological characteristics of aggregates, including
their surface texture, in the adhesion quality between the binder and the aggregate and the relationship
between these characteristics and the performance of flexible pavements such as Cui et al. (2018), Hu
and Qian (2018), Kuang et al. (2017),and Singh et al. (2012) . In particular, these works have performed
methods to analyze the physical characteristics of the aggregates, such as geometry, porosity, shape
factors, angularity and surface texture, and the general mechanical performance of the asphalt mixture.
However, none of them has analyzed the roughness as the main physical parameter of the surface of the
aggregate and its relationship to the adhesion quality between the aggregate and the asphalt binder.
Cui et al. (2018) studied the effect of different morphological variables on the adhesion of aggregates
and the mechanical properties of asphalt mixtures, specifically they concluded that there are close linear
relationships between angularity or sphericity of aggregates and the asphalt-aggregate adhesive quality.
The higher the angularity, the rougher the texture, and the smaller the sphericity, the greater the asphalt
6
coverage ratio is, which indicates better adhesion quality (Cui, Xiao, Yan, Li, & Wu, 2018).
Nevertheless, the study does not make a direct relationship between aggregates surface roughness and
the adhesion quality between the aggregate-asphalt binder system.
Similarly, Hu and Qian (2018) determined the influence of aggregates features on the adhesive failure
of the interface. Results from this study showed that the aggregate polarity, surface roughness and
texture of aggregates affect the interfacial transition zone between aggregates and asphalt mastic (Hu &
Qian, 2018).
The work conducted by Kuang et al. (2017) constitutes the closest approach for the evaluation of
aggregates surface roughness and its relationship with the adhesion quality between the aggregate and
the asphalt binder. This work evaluated the interfacial adhesion behavior between asphalt with
limestone and granite through surface microtopography comparison However, the study did not quantify
the roughness or the adhesion, and their conclusions were based on a visual comparison of the surface
through digital imaging technique and scanning electron microscope to characterize the interfacial
morphology of aggregates with asphalt binder.
Furthermore, Singh et al. (2012) developed a model that utilizes aggregate shape parameters as
angularity, texture, and form to estimate the dynamic modulus of asphalt mixes. The dynamic modulus
of asphalt mixes is considered an important parameter in the prediction of the performance of flexible
pavements (Ceylan, Gopalakrishnan, & Kim, 2009). Results from this study showed that the dynamic
modulus of the mix increases with an increase in the angularity and texture of aggregates, and that the
inclusion of shape parameters can enhance the prediction capability of the model developed that was
employed.
In addition, to obtain a measure of the adhesive bond strength in asphalt mixtures a couple of methods
have been used to compare the relationship between aggregate mineralogy and the adhesion quality with
the asphalt binder. In the first place, Canestrari et al. (2011) used the Pneumatic Adhesion Tensile
Testing Instrument (PATTI) to measure the adhesive and cohesive properties of asphalt-aggregate
combinations. In this test, a small asphalt layer is placed between a rock sample and a metallic pullout
stub. Subsequently, a pulling force is exerted using a pneumatic system until failure occurs when
adhesive failure is reached. Later, Moares et al. (2011) modified the PATTI test to the Bitumen Bond
Strength (BBS) test to quantitatively evaluate the adhesive bond between the asphalt and the aggregate
in a simple, quick and repeatable form for evaluating adhesion properties of asphalt-aggregate systems.
The BBS test places an 800 𝜇𝑚 asphalt layer between a rock sample and a metallic pullout stub and
tensile stress is applied until failure is reached. This test configuration, with minor modifications, has
been used in several studies (e.g. Yee et al. (2019), Mohammed et al. (2018), Zhang (2017)). More
recently, Cala et al. (2017) presented a new method for testing the adhesion strength based on the
mentioned test methods. The new method procedure allows a film thickness of 150 𝜇𝑚 and a test speed
of 10 mm/s.
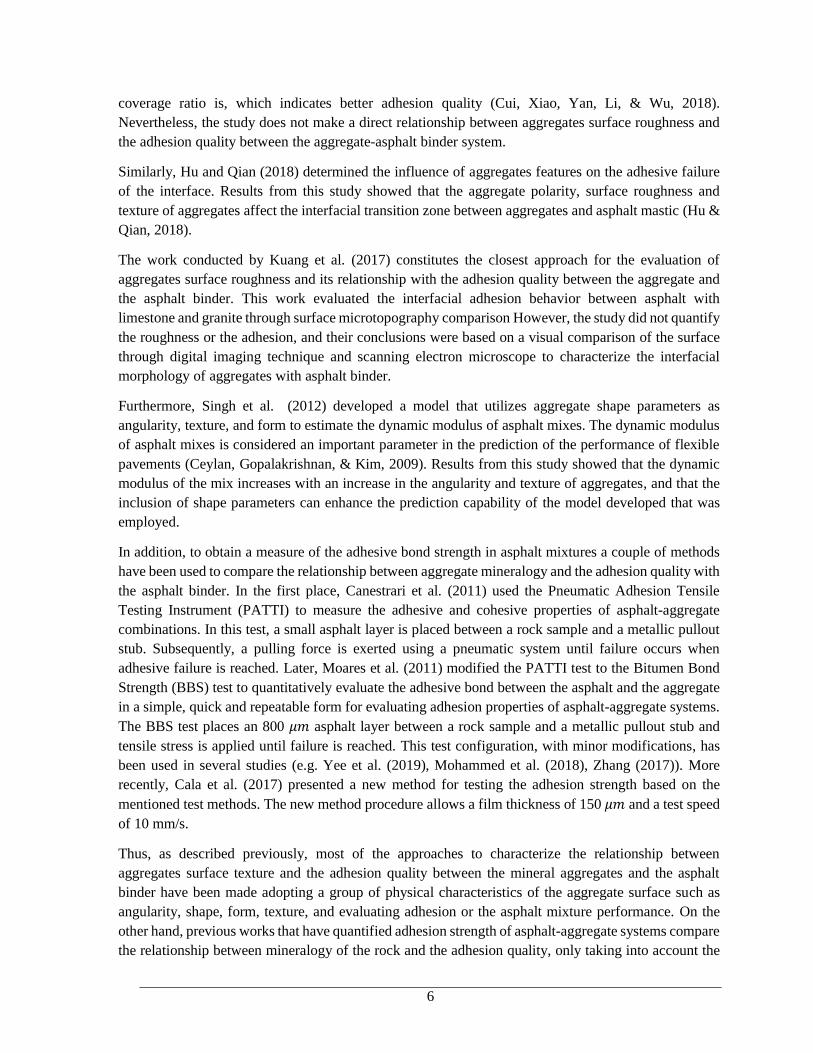
Thus, as described previously, most of the approaches to characterize the relationship between
aggregates surface texture and the adhesion quality between the mineral aggregates and the asphalt
binder have been made adopting a group of physical characteristics of the aggregate surface such as
angularity, shape, form, texture, and evaluating adhesion or the asphalt mixture performance. On the
other hand, previous works that have quantified adhesion strength of asphalt-aggregate systems compare
the relationship between mineralogy of the rock and the adhesion quality, only taking into account the
7
chemical characteristics. Therefore, more efforts are needed to evaluate the influence of aggregate
surface texture parameter, using roughness, as a unique physical parameter of the aggregate surface and
the adhesion quality between the aggregate and the asphalt binder.
Within this context, this work attempts to develop an experimental approach based on the Bitumen Bond
Strength Test (BBS) and the method proposed by Cala et al. (2019) to evaluate the adhesion strength of
asphalt-aggregate systems. The methodology consists in using a modified micrometer to prepare a thin
film of asphalt of 20 𝜇𝑚 between a metallic stub and a cylindrical rock core with controlled geometry.
Then, the samples are left to dry for a duration of at least 24 hours and placed in a hydraulic press under
a displacement-controlled test velocity of 10mm/min until they fail. The procedure is conducted using
three different types of aggregates that were rigorously texturized, in order to represent a wide range of
surface roughness. The results of this study offer new and valuable information about the influence of
the aggregate surface roughness in the adhesive properties of asphalt-aggregate systems that can be used
to improve the selection of materials to produce asphalt mixes with better adhesion quality.

8
2 Research objectives
The principal goal of this research is to determine the influence of the aggregate surface roughness of
aggregates with three different lithologies in the adhesive properties of asphalt-aggregate systems. The
specific objectives of this research are as follows:
1. Determine the relationship between the surface roughness of different types of aggregates and the
adhesion quality of the asphalt-aggregate system.
2. Determine the type of failure, adhesive or cohesive failure, between the asphalt-aggregate system.
9
3 Materials
3.1 Asphalt binder
All the adhesion testing samples were prepared using an unmodified asphalt binder obtained from
the Barrancabermeja refinery, in Colombia with a penetration grade of 60/70 (1/10mm). This
asphalt is the most commonly used in road construction projects in Colombia.
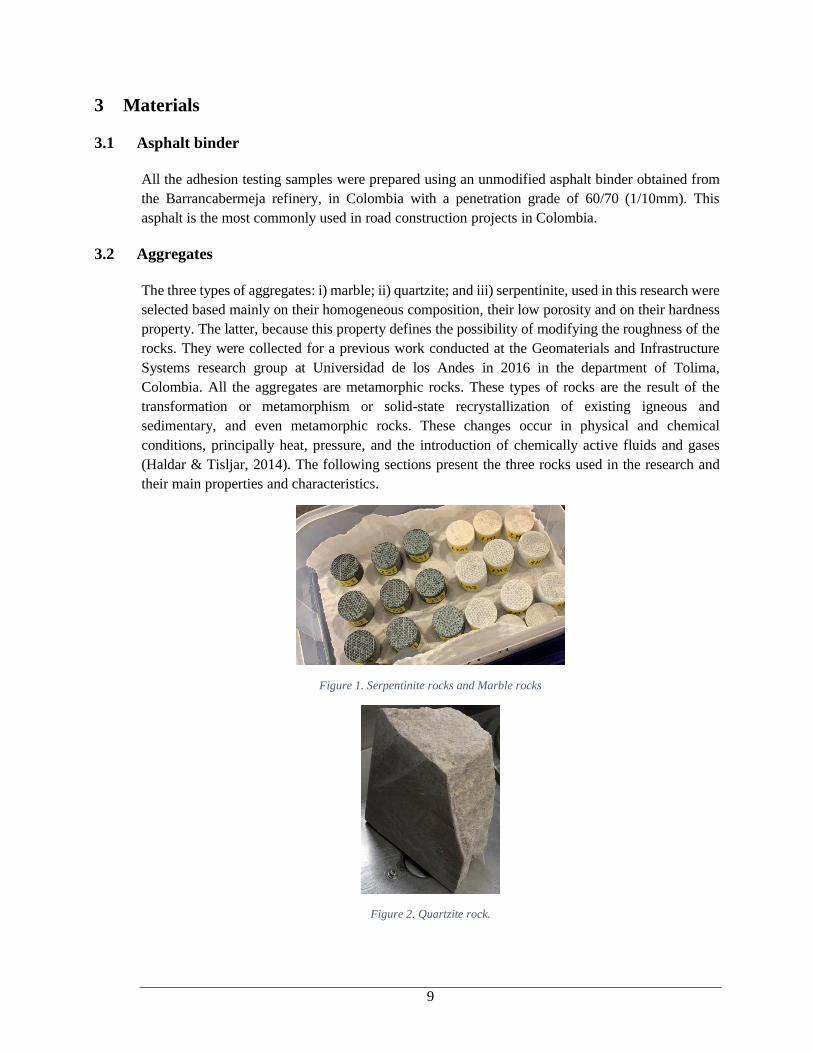
3.2 Aggregates
The three types of aggregates: i) marble; ii) quartzite; and iii) serpentinite, used in this research were
selected based mainly on their homogeneous composition, their low porosity and on their hardness
property. The latter, because this property defines the possibility of modifying the roughness of the
rocks. They were collected for a previous work conducted at the Geomaterials and Infrastructure
Systems research group at Universidad de los Andes in 2016 in the department of Tolima,
Colombia. All the aggregates are metamorphic rocks. These types of rocks are the result of the
transformation or metamorphism or solid-state recrystallization of existing igneous and
sedimentary, and even metamorphic rocks. These changes occur in physical and chemical
conditions, principally heat, pressure, and the introduction of chemically active fluids and gases
(Haldar & Tisljar, 2014). The following sections present the three rocks used in the research and
their main properties and characteristics.
Figure 1. Serpentinite rocks and Marble rocks
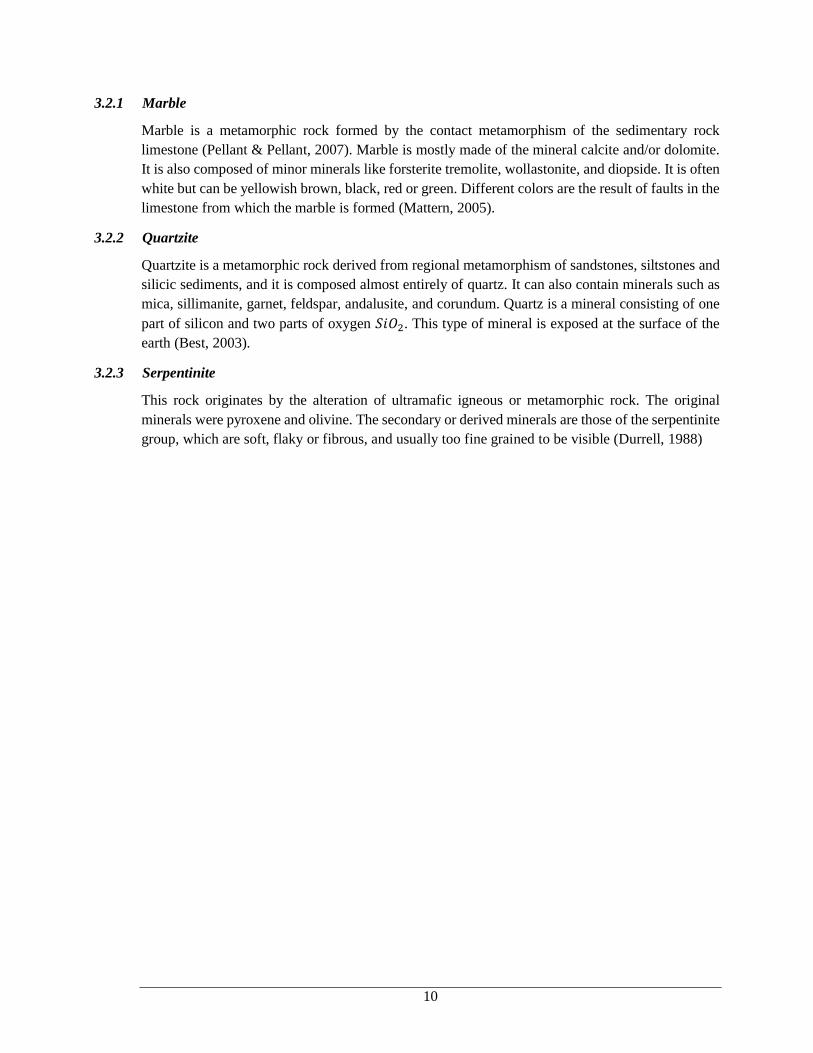
Figure 2. Quartzite rock.
10
3.2.1 Marble
Marble is a metamorphic rock formed by the contact metamorphism of the sedimentary rock
limestone (Pellant & Pellant, 2007). Marble is mostly made of the mineral calcite and/or dolomite.
It is also composed of minor minerals like forsterite tremolite, wollastonite, and diopside. It is often
white but can be yellowish brown, black, red or green. Different colors are the result of faults in the
limestone from which the marble is formed (Mattern, 2005).
3.2.2 Quartzite
Quartzite is a metamorphic rock derived from regional metamorphism of sandstones, siltstones and
silicic sediments, and it is composed almost entirely of quartz. It can also contain minerals such as
mica, sillimanite, garnet, feldspar, andalusite, and corundum. Quartz is a mineral consisting of one
part of silicon and two parts of oxygen 𝑆𝑖𝑂2. This type of mineral is exposed at the surface of the
earth (Best, 2003).
3.2.3 Serpentinite
This rock originates by the alteration of ultramafic igneous or metamorphic rock. The original
minerals were pyroxene and olivine. The secondary or derived minerals are those of the serpentinite
group, which are soft, flaky or fibrous, and usually too fine grained to be visible (Durrell, 1988)

11
4 Experimental methodology
4.1 Experimental set-up
The experimental set up consisted of preparing cylindrical asphalt-aggregate-metallic stub (AAS)
testing samples, with asphalt films of 20 𝜇m thick, using a modified micrometer (Mitutoyo Ref: 293-
253-10) based on the experimental methodology developed by Cala et al. (2019). The AAS system was
kept at dry conditions and then the systems were failed under tensile stresses using a hydraulic press
(ELE Ref: Tritest 50kN) at a 10mm/min loading condition. The results of the test are the force
displacement curve, from where the maximum load at failure and the work of fracture (i.e., area under
the curve, Wf) can be obtained.
Figure 3. Experimental Set Up.
4.1.1 Rock sample preparation
Two different methods were used to generate different roughness levels in the aggregate samples.
The first methods consisted in using a sandblasting texturing technique, while the second consisted
in manually generating different textures using a scalpel. Both methods are explained next.
4.1.1.1 Sandblasting texturing method
This method consists on the following four main steps:
1. 25 mm (1 inch) rock slices are obtained in the laboratory from rocks collected from the field.
2. Both faces of the rock slices are texturized with a sandblasting machine using three different
pressures: 40 psi, 60 psi, and 80 psi.
3. The rock slices are cut to obtain cylindrical specimens with 25 mm of height.
4. The face of the cylindrical specimen that is not texturized is cut using a high precision cutting
and grinding machine (Struers Ref: Accutom-100). This ensures that the faces of the cores are
completely parallel (± 1 𝜇m tolerance).
The types of rocks texturized through this method were the Quartzite and the Marble rocks. The
result of the rock sample preparation through sandblasting for the quartzite lithology can be
observed in Figure 1, and the marble lithology can be observed in Figure 2. In the hardness scale
the Quartzite lithology is classified as one of the rocks with highest hardness, while the Marble
lithology is classified as one of the rocks with the lowest hardness. In order to obtain a wide range
of roughness, this process was applied to a hard rock, Quartzite, and a soft rock, Marble.

12
Alternatively, the Serpentinite is a rock with a low hardness, this means that this rock can be easily
scratched such as the Marble. Therefore, the Serpentinite and the Marble lithology were texturized
through the second method which is explained below.
Figure 4. Samples of quartzite textured through Sandblasting method.
Figure 5. Samples of marble texturized through sandblasting method.
4.1.1.2 Texture by means of the scalpel method
This method consists on following four main steps:
1. 25 mm (1 inch) rock slices are obtained in the laboratory from rocks collected from the field.
2. The rock slices are cut to obtain cylindrical specimens with 25 mm of height.
3. The faces of the cylindrical specimens are cut in a high precision cutting and grinding machine
(Struers Ref: Accutom-100). This ensures that the faces of the cores are completely parallel (±
1 𝜇m tolerance).
4. One face of the cylindrical specimens is texturized with a scalpel making a line every 2
millimeters and in the following directions: at 30°, at 45°, and at 60°.
It is worth mentioning that a second texturizing method was selected besides the sandblasting
because the sandblasting method is a very abrasive method that has as result a very high roughness
in the face of the cylindrical specimens that had as consequence a loss of control over the thickness
of the asphalt layer applied to the sample surface. Therefore, a second texturizing method less
abrasive was applied in two types of rocks that can be easily scratched, Marble and Serpentinite.

13
The result of the rock sample preparation by means of the scalpel method for the Serpentinite
lithology can be observed in Figure 3, and the Marble lithology can be observed in Figure 4.
Figure 6. Samples of serpentinite texturized by means of the scalpel method.
Figure 7. Samples of marble texturized by means of the scalpel method.
4.1.2 Determination of the roughness parameters of the rock samples
The roughness parameters of the texturized face of the rock samples were obtained using a portable
surface roughness tester (Mitutoyo Ref: Surftest SJ-210). A stylus detector goes over the rock
sample texturized face, and the results of the test are the surface roughness measurements through
surface profiles, filters, and roughness parameters. The roughness parameters were measured three
times per sample to obtain a representative roughness parameter of the surface.
1. 𝑹𝒑𝒓𝒐𝒇𝒊𝒍𝒆 – roughness profile: is the profile resulting from electronic high pass filtering of the
primary profile with a cut-off wavelength 𝜆𝑐 , as observed in Figure 5.
2. 𝑹𝒂- arithmetical mean roughness value: The arithmetical mean of the absolute values profile
deviations (𝒁𝒊) from the mean line of the roughness profile, as observed in Figure 6. Ra is used
to detect general variations in overall profile height.
3. 𝑹𝒒- also known as RMS, is the root mean-square average of the departures of the roughness
profile from the mean line. Rq has statistical significance because it represents the standard
deviation of the profile height.
4. 𝑹𝒎𝒂𝒙- maximum roughness depth: The vertical distance between the highest peak and the
lowest valley along the assessment length of the profile.

14
Figure 8. The roughness profile with its Mean Line, Arithmetical mean roughness Ra and Root mean-square average Rq
(Mahr Production Metrology, 2019).
Figure 9. The roughness profile with its Maximum Roughness Depth Rmax (Mahr Production Metrology, 2019).
4.1.3 Modified micrometer for the fabrication of the testing specimens
The micrometer used in the experimental procedure to prepare the testing samples was a modified
micrometer previously used by Cala et al. (2017) to ensure a homogenous 20 𝜇m thick asphalt film
in the AAS systems. In this micrometer, a metallic stub with a diameter of 25 mm is placed at one
end, and a rock sample of the same diameter at the other end, as observed in Figure 8.
Figure 10. Modified micrometer for AAS sample preparation Cala et al. (2019).

15
4.1.4 Aggregates-Asphalt-Stub (AAS) system preparation
The preparation of the AAS is made using the cylindrical rock specimens and the modified
micrometer following the same procedure presented by Cala et al. (2019):
1. “Metallic stubs are cleaned to remove possible residues or dust.
2. The rock sample and the metallic stub are introduced into an oven a 150°C for at least
30 minutes.
3. Simultaneously with step 2, 1.50 g of asphalt binder are introduced into the oven for 15
minutes (i.e. 15 minutes after the metallic stub is introduced in the oven in Step 2).
4. The metallic stub and rock sample are placed on the micrometer, as shown in figure 8.
5. The micrometer is zeroed at the point in which the metallic stub touches the rock
sample.
6. The asphalt binder is placed on top of the rock sample.
7. The metallic stub is lowered until the micrometer´s dial reaches 20 𝜇m.
8. The AAS system is left cooling down for at least 45 minutes. After this period, the AA
system can be dismounted from the micrometer. ”
The Aggregates-Asphalt-Stub (AAS) system can be observed in Figure 9.
Figure 11. AAS system, all dimensions shown are in mm Cala et al. (2019).
4.2 Testing procedure
The testing procedure was based on the method developed by Cala et al. (2018). It consists of
applying tensile forces on the AAS systems under a control displacement condition of 10 mm/min
until failure. According to Cala et al. (2019) this displacement condition was selected as it was the
fastest loading condition provided by the hydraulic equipment used for the experiment. Also, this
speed contributes to a minimal deformation of the asphalt binder which reduced the possibility of
only cohesive failures due to the viscoelastic properties of asphalt materials.
To perform the pull-off test on the AAS system, a couple of modifications were required on the
hydraulic press (Figure 10). During the test, loading data was captured using an Omega LC201-300
load cell. The initial results from the test are Force [N] vs. Time [s] data; these data are collected
every 0.1s. As explained previously, the results of the test are the maximum load at failure, 𝐹𝑚𝑎𝑥,
and the work of fracture, 𝑊𝑓.

16
Figure 12. Experimental testing procedure setup Cala et al. (2019).

17
5 Results and analysis
The samples that were texturized with the sandblasting method were labelled considering three
characteristics: i) Texture pressure (40 psi, 60 psi, 80 psi); ii) Rock lithology, Qtz (Quartzite), Mrb
(Marble) and iii) the replicate number. For instance, the sample 40Qtz1 corresponds to the first replicate
of a quartzite sample which texture was generated using a sandblasting pressure of 40 psi. If only one
number is shown, for instance 40Qtz, it refers to the average obtained for all replicates of that rock. The
samples that were texturized with the scalpel method were labelled considering three characteristics: i)
Angle between the lines (1 for 120°, 2 for 45°, 3 for 30°); ii) Rock lithology, STP (Serpentinite), Mrb
(Marble), Spt (Serpentinite); and iii) the replicate number. For instance, the sample 1Spt1 corresponds
to the first replicate of a serpentinite sample that has texture pressure made of lines every 120°. If only
one number is shown, for instance, 1Spt, it refers to the average obtained for all replicates of that rock.
The measurements were taken three times per sample in three different directions to have a
representative roughness of all the sample surface.
5.1 Roughness Profiles
For all the samples, three measurements of the roughness profile were obtained to calculate the
roughness parameters of the surface of the rock. The roughness profiles were classified in three
types according to the 𝑅𝑎 values obtained: Low roughness, that are the profiles with a 𝑅𝑎 value
between 0 𝜇𝑚 and 9 𝜇𝑚; Medium roughness, that are the profiles with a 𝑅𝑎 value between 9 𝜇𝑚
and 12 𝜇𝑚; and High roughness, that are the profiles with a 𝑅𝑎 value greater than 13 𝜇𝑚. As an
example, the profiles for three types of roughness: low, medium y high roughness are shown in
Figures 11-16 for the two types of texturization methods.
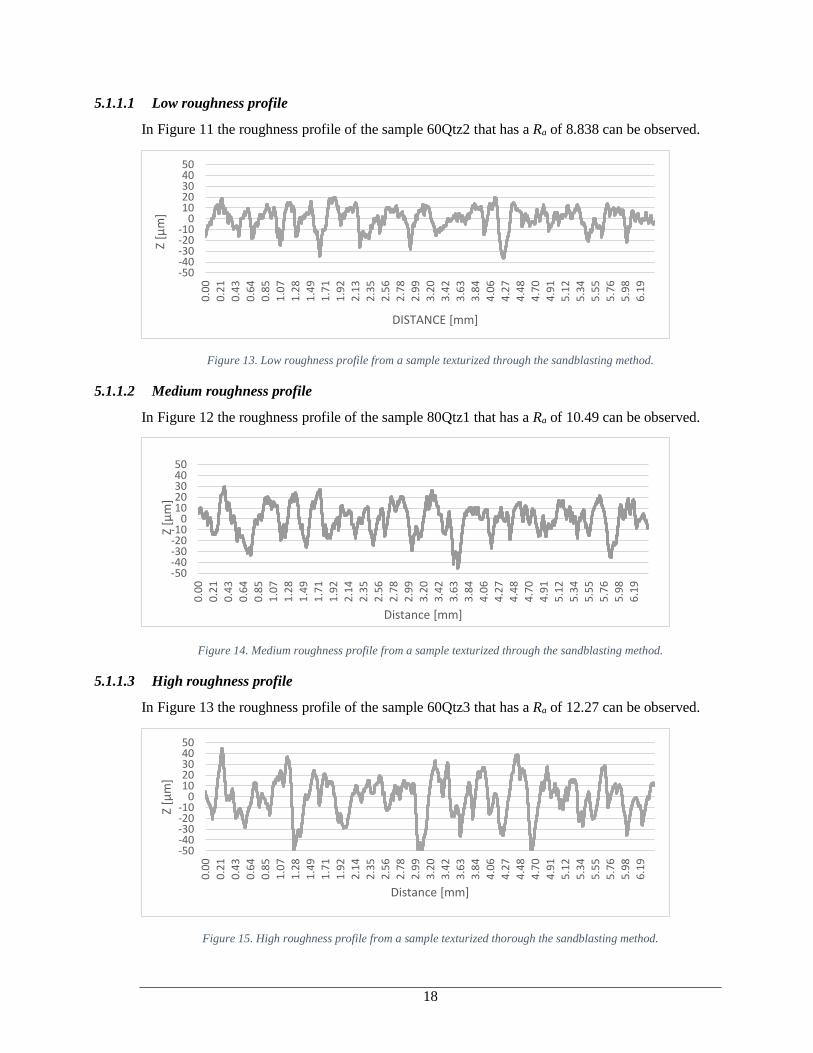
5.1.1 Sandblasting texturing method
The shape of the profiles obtained through this method were sharp, sudden and abrupt. They did not
present a homogeneous or harmonic shape. The profiles presented high peaks and deep troughs
combined with low peaks and troughs in a random form. The peaks of the profiles with low
roughness reached values of 20 𝜇𝑚 and the troughs of -40 𝜇𝑚. The value of the highest peak and
lowest trough of medium roughness profiles were 30 𝜇𝑚 and -50 𝜇𝑚 respectively. Finally, the peaks
for profiles with high roughness reached values of 45 𝜇𝑚 and the troughs reached values of -55 𝜇𝑚.
Therefore, the roughness obtained on the rock surface through this method is a complex shape made
of a series of variable peaks and troughs with varying heights, depths, and spacings, and it did not
provide a uniform texture on the rock surface. The principal reason of these results is that the
sandblasting is a method in which an abrasive material is propelled against the rock surface under
high pressure, this process breaks the rock giving the surface a high and variable roughness
depending on the type of rock texturized and its properties.
18
5.1.1.1 Low roughness profile
In Figure 11 the roughness profile of the sample 60Qtz2 that has a Ra of 8.838 can be observed.
Figure 13. Low roughness profile from a sample texturized through the sandblasting method.
5.1.1.2 Medium roughness profile
In Figure 12 the roughness profile of the sample 80Qtz1 that has a Ra of 10.49 can be observed.
Figure 14. Medium roughness profile from a sample texturized through the sandblasting method.
5.1.1.3 High roughness profile
In Figure 13 the roughness profile of the sample 60Qtz3 that has a Ra of 12.27 can be observed.
Figure 15. High roughness profile from a sample texturized thorough the sandblasting method.
-50-40-30-20-10
01020304050
0.0
0
0.2
1
0.4
3
0.6
4
0.8
5
1.0
7
1.2
8
1.4
9
1.7
1
1.9
2
2.1
3
2.3
5
2.5
62
.78
2.9
9
3.2
0
3.4
2
3.6
3
3.8
4
4.0
6
4.2
7
4.4
8
4.7
04
.91
5.1
2
5.3
4
5.5
5
5.7
6
5.9
8
6.1
9
Z [μ
m]
DISTANCE [mm]
-50-40-30-20-10
01020304050
0.0
0
0.2
1
0.4
3
0.6
4
0.8
51
.07
1.2
8
1.4
9
1.7
1
1.9
2
2.1
4
2.3
5
2.5
6
2.7
8
2.9
9
3.2
03
.42
3.6
3
3.8
4
4.0
6
4.2
7
4.4
84
.70
4.9
1
5.1
2
5.3
4
5.5
55
.76
5.9
8
6.1
9
Z [μ
m]
Distance [mm]
-50-40-30-20-10
01020304050
0.0
0
0.2
1
0.4
3
0.6
4
0.8
5
1.0
7
1.2
8
1.4
9
1.7
1
1.9
2
2.1
4
2.3
5
2.5
6
2.7
8
2.9
9
3.2
0
3.4
2
3.6
3
3.8
4
4.0
6
4.2
7
4.4
8
4.7
0
4.9
1
5.1
2
5.3
4
5.5
5
5.7
6
5.9
8
6.1
9
Z [μ
m]
Distance [mm]
19
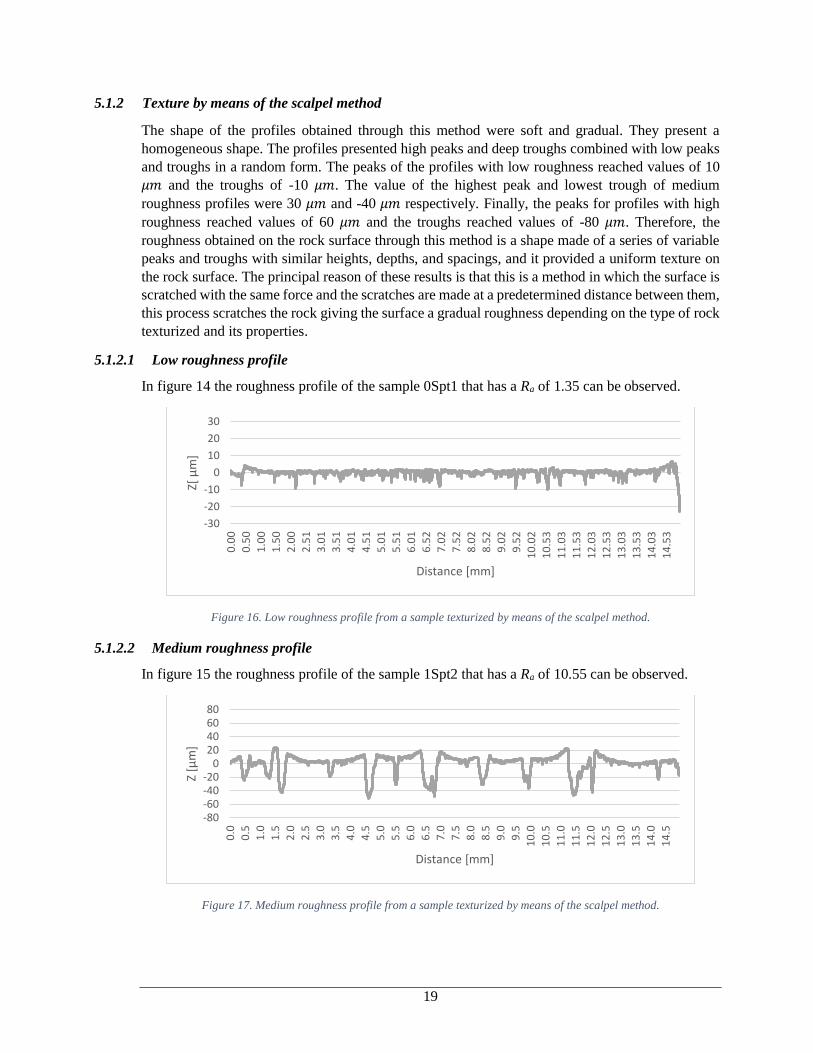
5.1.2 Texture by means of the scalpel method
The shape of the profiles obtained through this method were soft and gradual. They present a
homogeneous shape. The profiles presented high peaks and deep troughs combined with low peaks
and troughs in a random form. The peaks of the profiles with low roughness reached values of 10
𝜇𝑚 and the troughs of -10 𝜇𝑚. The value of the highest peak and lowest trough of medium
roughness profiles were 30 𝜇𝑚 and -40 𝜇𝑚 respectively. Finally, the peaks for profiles with high
roughness reached values of 60 𝜇𝑚 and the troughs reached values of -80 𝜇𝑚. Therefore, the
roughness obtained on the rock surface through this method is a shape made of a series of variable
peaks and troughs with similar heights, depths, and spacings, and it provided a uniform texture on
the rock surface. The principal reason of these results is that this is a method in which the surface is
scratched with the same force and the scratches are made at a predetermined distance between them,
this process scratches the rock giving the surface a gradual roughness depending on the type of rock
texturized and its properties.
5.1.2.1 Low roughness profile
In figure 14 the roughness profile of the sample 0Spt1 that has a Ra of 1.35 can be observed.
Figure 16. Low roughness profile from a sample texturized by means of the scalpel method.
5.1.2.2 Medium roughness profile
In figure 15 the roughness profile of the sample 1Spt2 that has a Ra of 10.55 can be observed.
Figure 17. Medium roughness profile from a sample texturized by means of the scalpel method.
-30
-20
-10
0
10
20
30
0.0
0
0.5
0
1.0
0
1.5
0
2.0
0
2.5
1
3.0
1
3.5
1
4.0
1
4.5
1
5.0
1
5.5
1
6.0
1
6.5
2
7.0
2
7.5
2
8.0
2
8.5
2
9.0
2
9.5
2
10
.02
10
.53
11
.03
11
.53
12
.03
12
.53
13
.03
13
.53
14
.03
14
.53
Z[ μ
m]
Distance [mm]
-80-60-40-20
020406080
0.0
0.5
1.0
1.5
2.0
2.5
3.0
3.5
4.0
4.5
5.0
5.5
6.0
6.5
7.0
7.5
8.0
8.5
9.0
9.5
10
.0
10
.5
11
.0
11
.5
12
.0
12
.5
13
.0
13
.5
14
.0
14
.5
Z [μ
m]
Distance [mm]

20
5.1.2.3 High roughness profile
In figure 16 the roughness profile of the sample 3Spt2 that has a Ra of 19.32 can be observed.
Figure 18. High roughness profile from a sample texturized by means of the scalpel method.
5.2 Roughness parameters
The only parameter that is universally standardized and is specified and measured far more
frequently than any other is the arithmetic average roughness height, or Roughness Average, Ra.
Therefore, this parameter was selected in this work for the analysis. However, other complementary
parameters (Rq, Rz and Rmax) were also computed as a reference. Additionally, the mean, the standard
deviation, and the Coefficient of Variation COV, were calculated to analyze the measurements
obtained. The COV is a measure of the dispersion of data points around the mean, the higher the
coefficient of variation, the greater the lever of dispersion around the mean. The results showed
high variability in all the surface roughness measurements.
5.2.1 Sandblasting texturing method
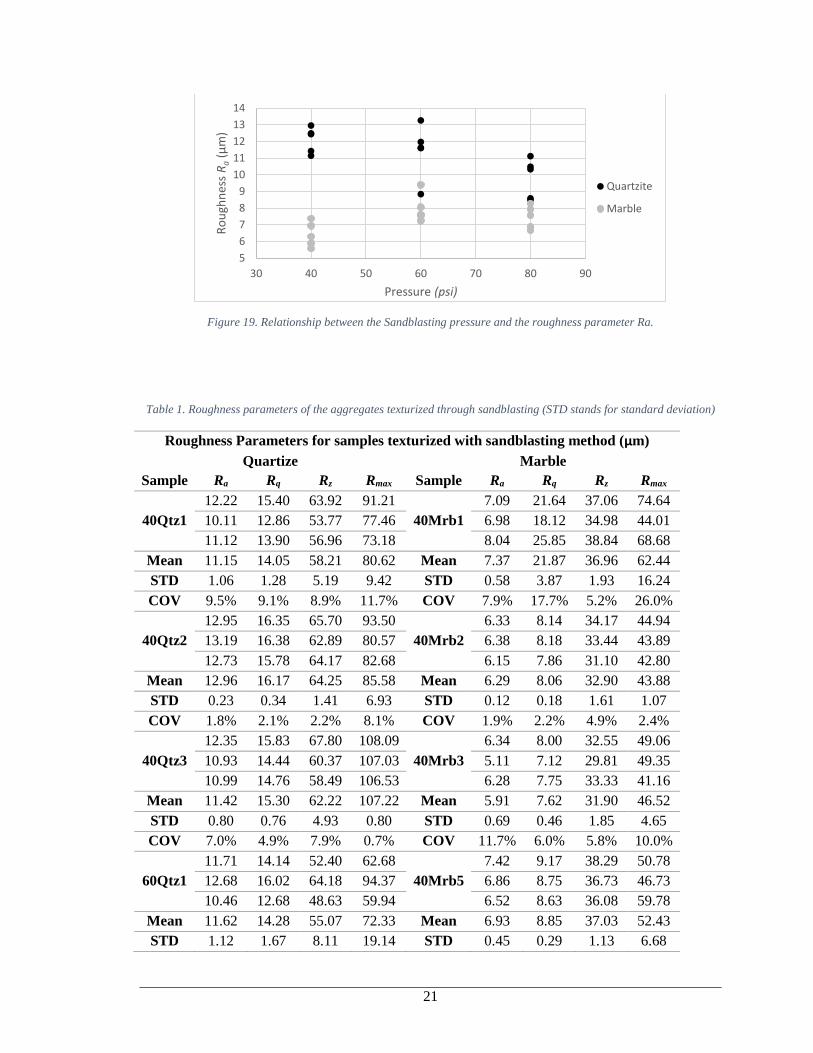
With this method, it was expected that as the sandblasting pressure increased, the roughness
parameters (i.e., Rq, Rz and Rmax) of the rocks would also increase. Nevertheless, the sandblasting
pressure and the roughness parameter 𝑅𝑎 did not show any clear relationship; that is, the surface
roughness parameters of the aggregates obtained through the different applied pressures are random
(Figure 16). The highest value of 𝑅𝑎 obtained through this method was 13.27 𝜇𝑚, and the lowest
value of 𝑅𝑎 was 5.91 𝜇𝑚. The range of values of 𝑅𝑎 obtained through this method was 7.36 𝜇𝑚.
The most representative roughness parameters are presented in Table 1.
-80-60-40-20
020406080
0.0
0.5
1.0
1.5
2.0
2.5
3.0
3.5
4.0
4.5
5.0
5.5
6.0
6.5
7.0
7.5
8.0
8.5
9.0
9.5
10
.0
10
.5
11
.0
11
.5
12
.0
12
.5
13
.0
13
.5
14
.0
14
.5
Z [μ
m]
Distance [mm]
21
Figure 19. Relationship between the Sandblasting pressure and the roughness parameter Ra.
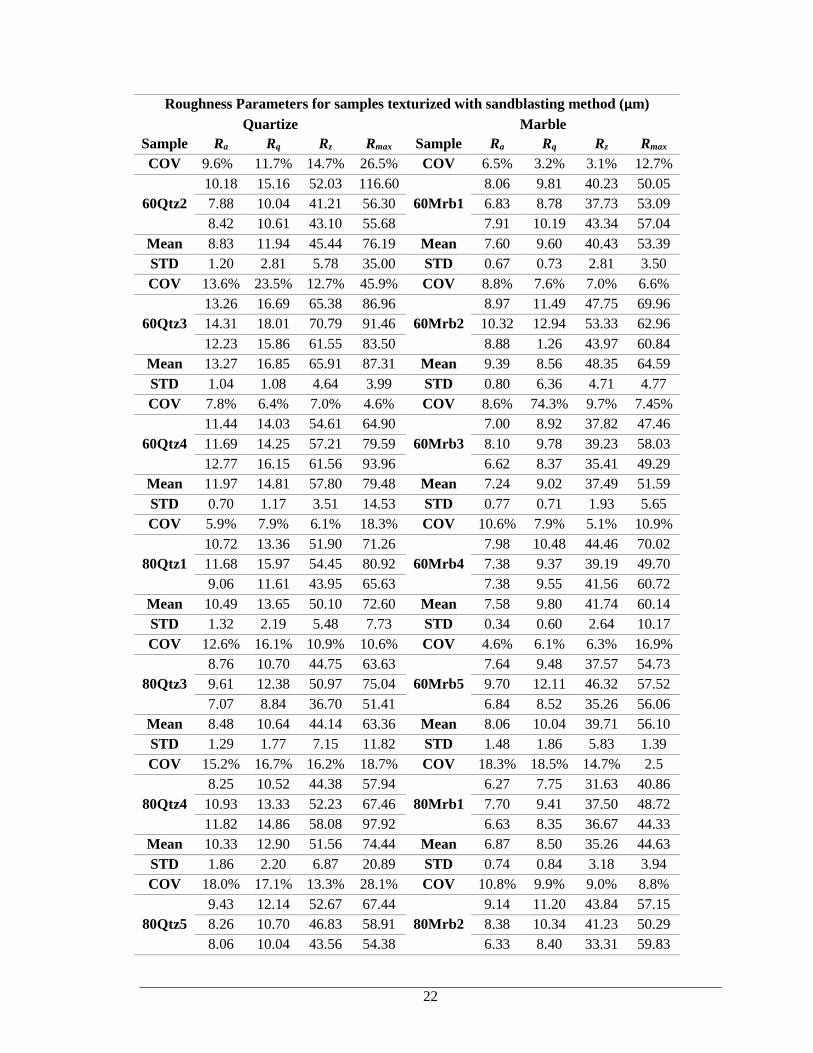
Table 1. Roughness parameters of the aggregates texturized through sandblasting (STD stands for standard deviation)
Roughness Parameters for samples texturized with sandblasting method (μm)
Quartize Marble
Sample Ra Rq Rz Rmax Sample Ra Rq Rz Rmax
40Qtz1
12.22 15.40 63.92 91.21
40Mrb1
7.09 21.64 37.06 74.64
10.11 12.86 53.77 77.46 6.98 18.12 34.98 44.01
11.12 13.90 56.96 73.18 8.04 25.85 38.84 68.68
Mean 11.15 14.05 58.21 80.62 Mean 7.37 21.87 36.96 62.44
STD 1.06 1.28 5.19 9.42 STD 0.58 3.87 1.93 16.24
COV 9.5% 9.1% 8.9% 11.7% COV 7.9% 17.7% 5.2% 26.0%
40Qtz2
12.95 16.35 65.70 93.50
40Mrb2
6.33 8.14 34.17 44.94
13.19 16.38 62.89 80.57 6.38 8.18 33.44 43.89
12.73 15.78 64.17 82.68 6.15 7.86 31.10 42.80
Mean 12.96 16.17 64.25 85.58 Mean 6.29 8.06 32.90 43.88
STD 0.23 0.34 1.41 6.93 STD 0.12 0.18 1.61 1.07
COV 1.8% 2.1% 2.2% 8.1% COV 1.9% 2.2% 4.9% 2.4%
40Qtz3
12.35 15.83 67.80 108.09
40Mrb3
6.34 8.00 32.55 49.06
10.93 14.44 60.37 107.03 5.11 7.12 29.81 49.35
10.99 14.76 58.49 106.53 6.28 7.75 33.33 41.16
Mean 11.42 15.30 62.22 107.22 Mean 5.91 7.62 31.90 46.52
STD 0.80 0.76 4.93 0.80 STD 0.69 0.46 1.85 4.65
COV 7.0% 4.9% 7.9% 0.7% COV 11.7% 6.0% 5.8% 10.0%
60Qtz1
11.71 14.14 52.40 62.68
40Mrb5
7.42 9.17 38.29 50.78
12.68 16.02 64.18 94.37 6.86 8.75 36.73 46.73
10.46 12.68 48.63 59.94 6.52 8.63 36.08 59.78
Mean 11.62 14.28 55.07 72.33 Mean 6.93 8.85 37.03 52.43
STD 1.12 1.67 8.11 19.14 STD 0.45 0.29 1.13 6.68
5
6
7
8
9
10
11
12
13
14
30 40 50 60 70 80 90
Ro
ugh
nes
s Ra
(μm
)
Pressure (psi)
Quartzite
Marble
22
Roughness Parameters for samples texturized with sandblasting method (μm)
Quartize Marble
Sample Ra Rq Rz Rmax Sample Ra Rq Rz Rmax
COV 9.6% 11.7% 14.7% 26.5% COV 6.5% 3.2% 3.1% 12.7%
60Qtz2
10.18 15.16 52.03 116.60
60Mrb1
8.06 9.81 40.23 50.05
7.88 10.04 41.21 56.30 6.83 8.78 37.73 53.09
8.42 10.61 43.10 55.68 7.91 10.19 43.34 57.04
Mean 8.83 11.94 45.44 76.19 Mean 7.60 9.60 40.43 53.39
STD 1.20 2.81 5.78 35.00 STD 0.67 0.73 2.81 3.50
COV 13.6% 23.5% 12.7% 45.9% COV 8.8% 7.6% 7.0% 6.6%
60Qtz3
13.26 16.69 65.38 86.96
60Mrb2
8.97 11.49 47.75 69.96
14.31 18.01 70.79 91.46 10.32 12.94 53.33 62.96
12.23 15.86 61.55 83.50 8.88 1.26 43.97 60.84
Mean 13.27 16.85 65.91 87.31 Mean 9.39 8.56 48.35 64.59
STD 1.04 1.08 4.64 3.99 STD 0.80 6.36 4.71 4.77
COV 7.8% 6.4% 7.0% 4.6% COV 8.6% 74.3% 9.7% 7.45%
60Qtz4
11.44 14.03 54.61 64.90
60Mrb3
7.00 8.92 37.82 47.46
11.69 14.25 57.21 79.59 8.10 9.78 39.23 58.03
12.77 16.15 61.56 93.96 6.62 8.37 35.41 49.29
Mean 11.97 14.81 57.80 79.48 Mean 7.24 9.02 37.49 51.59
STD 0.70 1.17 3.51 14.53 STD 0.77 0.71 1.93 5.65
COV 5.9% 7.9% 6.1% 18.3% COV 10.6% 7.9% 5.1% 10.9%
80Qtz1
10.72 13.36 51.90 71.26
60Mrb4
7.98 10.48 44.46 70.02
11.68 15.97 54.45 80.92 7.38 9.37 39.19 49.70
9.06 11.61 43.95 65.63 7.38 9.55 41.56 60.72
Mean 10.49 13.65 50.10 72.60 Mean 7.58 9.80 41.74 60.14
STD 1.32 2.19 5.48 7.73 STD 0.34 0.60 2.64 10.17
COV 12.6% 16.1% 10.9% 10.6% COV 4.6% 6.1% 6.3% 16.9%
80Qtz3
8.76 10.70 44.75 63.63
60Mrb5
7.64 9.48 37.57 54.73
9.61 12.38 50.97 75.04 9.70 12.11 46.32 57.52
7.07 8.84 36.70 51.41 6.84 8.52 35.26 56.06
Mean 8.48 10.64 44.14 63.36 Mean 8.06 10.04 39.71 56.10
STD 1.29 1.77 7.15 11.82 STD 1.48 1.86 5.83 1.39
COV 15.2% 16.7% 16.2% 18.7% COV 18.3% 18.5% 14.7% 2.5
80Qtz4
8.25 10.52 44.38 57.94
80Mrb1
6.27 7.75 31.63 40.86
10.93 13.33 52.23 67.46 7.70 9.41 37.50 48.72
11.82 14.86 58.08 97.92 6.63 8.35 36.67 44.33
Mean 10.33 12.90 51.56 74.44 Mean 6.87 8.50 35.26 44.63
STD 1.86 2.20 6.87 20.89 STD 0.74 0.84 3.18 3.94
COV 18.0% 17.1% 13.3% 28.1% COV 10.8% 9.9% 9.0% 8.8%
80Qtz5
9.43 12.14 52.67 67.44
80Mrb2
9.14 11.20 43.84 57.15
8.26 10.70 46.83 58.91 8.38 10.34 41.23 50.29
8.06 10.04 43.56 54.38 6.33 8.40 33.31 59.83
23
Roughness Parameters for samples texturized with sandblasting method (μm)
Quartize Marble
Sample Ra Rq Rz Rmax Sample Ra Rq Rz Rmax
Mean 8.59 10.96 47.68 60.24 Mean 7.95 9.98 39.46 55.76
STD 0.74 1.08 4.62 6.63 STD 1.45 1.44 5.48 4.92
COV 8.6% 9.8% 9.7% 11.0% COV 18.3% 14.4% 13.9% 8.8%
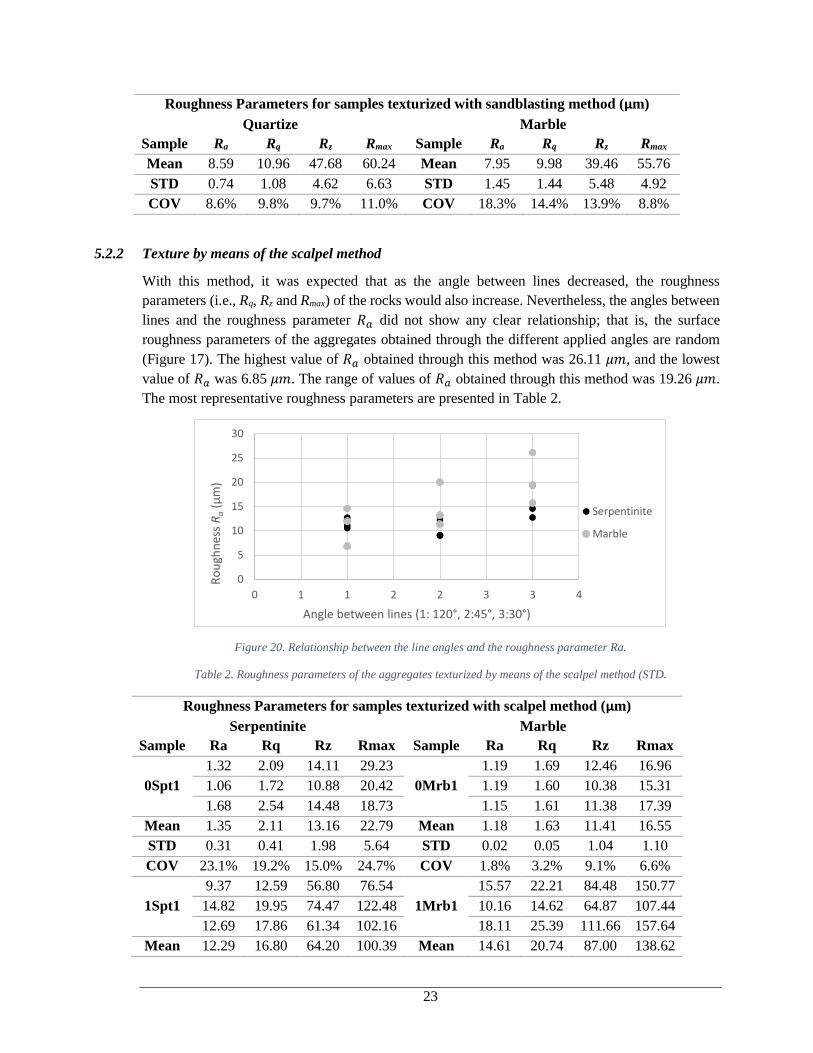
5.2.2 Texture by means of the scalpel method
With this method, it was expected that as the angle between lines decreased, the roughness
parameters (i.e., Rq, Rz and Rmax) of the rocks would also increase. Nevertheless, the angles between
lines and the roughness parameter 𝑅𝑎 did not show any clear relationship; that is, the surface
roughness parameters of the aggregates obtained through the different applied angles are random
(Figure 17). The highest value of 𝑅𝑎 obtained through this method was 26.11 𝜇𝑚, and the lowest
value of 𝑅𝑎 was 6.85 𝜇𝑚. The range of values of 𝑅𝑎 obtained through this method was 19.26 𝜇𝑚.
The most representative roughness parameters are presented in Table 2.
Figure 20. Relationship between the line angles and the roughness parameter Ra.
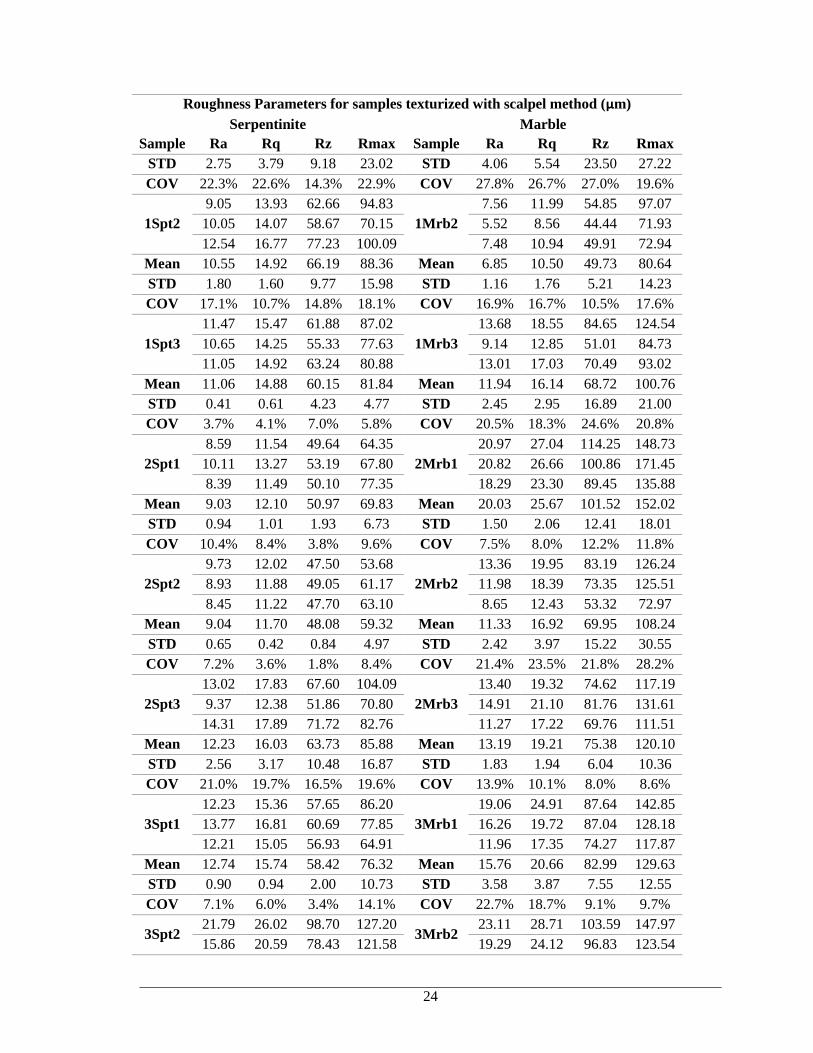
Table 2. Roughness parameters of the aggregates texturized by means of the scalpel method (STD.
Roughness Parameters for samples texturized with scalpel method (μm)
Serpentinite Marble
Sample Ra Rq Rz Rmax Sample Ra Rq Rz Rmax
0Spt1
1.32 2.09 14.11 29.23
0Mrb1
1.19 1.69 12.46 16.96
1.06 1.72 10.88 20.42 1.19 1.60 10.38 15.31
1.68 2.54 14.48 18.73 1.15 1.61 11.38 17.39
Mean 1.35 2.11 13.16 22.79 Mean 1.18 1.63 11.41 16.55
STD 0.31 0.41 1.98 5.64 STD 0.02 0.05 1.04 1.10
COV 23.1% 19.2% 15.0% 24.7% COV 1.8% 3.2% 9.1% 6.6%
1Spt1
9.37 12.59 56.80 76.54
1Mrb1
15.57 22.21 84.48 150.77
14.82 19.95 74.47 122.48 10.16 14.62 64.87 107.44
12.69 17.86 61.34 102.16 18.11 25.39 111.66 157.64
Mean 12.29 16.80 64.20 100.39 Mean 14.61 20.74 87.00 138.62
0
5
10
15
20
25
30
0 1 1 2 2 3 3 4
Ro
ugh
nes
s Ra
(μm
)
Angle between lines (1: 120°, 2:45°, 3:30°)
Serpentinite
Marble
24
Roughness Parameters for samples texturized with scalpel method (μm)
Serpentinite Marble
Sample Ra Rq Rz Rmax Sample Ra Rq Rz Rmax
STD 2.75 3.79 9.18 23.02 STD 4.06 5.54 23.50 27.22
COV 22.3% 22.6% 14.3% 22.9% COV 27.8% 26.7% 27.0% 19.6%
1Spt2
9.05 13.93 62.66 94.83
1Mrb2
7.56 11.99 54.85 97.07
10.05 14.07 58.67 70.15 5.52 8.56 44.44 71.93
12.54 16.77 77.23 100.09 7.48 10.94 49.91 72.94
Mean 10.55 14.92 66.19 88.36 Mean 6.85 10.50 49.73 80.64
STD 1.80 1.60 9.77 15.98 STD 1.16 1.76 5.21 14.23
COV 17.1% 10.7% 14.8% 18.1% COV 16.9% 16.7% 10.5% 17.6%
1Spt3
11.47 15.47 61.88 87.02
1Mrb3
13.68 18.55 84.65 124.54
10.65 14.25 55.33 77.63 9.14 12.85 51.01 84.73
11.05 14.92 63.24 80.88 13.01 17.03 70.49 93.02
Mean 11.06 14.88 60.15 81.84 Mean 11.94 16.14 68.72 100.76
STD 0.41 0.61 4.23 4.77 STD 2.45 2.95 16.89 21.00
COV 3.7% 4.1% 7.0% 5.8% COV 20.5% 18.3% 24.6% 20.8%
2Spt1
8.59 11.54 49.64 64.35
2Mrb1
20.97 27.04 114.25 148.73
10.11 13.27 53.19 67.80 20.82 26.66 100.86 171.45
8.39 11.49 50.10 77.35 18.29 23.30 89.45 135.88
Mean 9.03 12.10 50.97 69.83 Mean 20.03 25.67 101.52 152.02
STD 0.94 1.01 1.93 6.73 STD 1.50 2.06 12.41 18.01
COV 10.4% 8.4% 3.8% 9.6% COV 7.5% 8.0% 12.2% 11.8%
2Spt2
9.73 12.02 47.50 53.68
2Mrb2
13.36 19.95 83.19 126.24
8.93 11.88 49.05 61.17 11.98 18.39 73.35 125.51
8.45 11.22 47.70 63.10 8.65 12.43 53.32 72.97
Mean 9.04 11.70 48.08 59.32 Mean 11.33 16.92 69.95 108.24
STD 0.65 0.42 0.84 4.97 STD 2.42 3.97 15.22 30.55
COV 7.2% 3.6% 1.8% 8.4% COV 21.4% 23.5% 21.8% 28.2%
2Spt3
13.02 17.83 67.60 104.09
2Mrb3
13.40 19.32 74.62 117.19
9.37 12.38 51.86 70.80 14.91 21.10 81.76 131.61
14.31 17.89 71.72 82.76 11.27 17.22 69.76 111.51
Mean 12.23 16.03 63.73 85.88 Mean 13.19 19.21 75.38 120.10
STD 2.56 3.17 10.48 16.87 STD 1.83 1.94 6.04 10.36
COV 21.0% 19.7% 16.5% 19.6% COV 13.9% 10.1% 8.0% 8.6%
3Spt1
12.23 15.36 57.65 86.20
3Mrb1
19.06 24.91 87.64 142.85
13.77 16.81 60.69 77.85 16.26 19.72 87.04 128.18
12.21 15.05 56.93 64.91 11.96 17.35 74.27 117.87
Mean 12.74 15.74 58.42 76.32 Mean 15.76 20.66 82.99 129.63
STD 0.90 0.94 2.00 10.73 STD 3.58 3.87 7.55 12.55
COV 7.1% 6.0% 3.4% 14.1% COV 22.7% 18.7% 9.1% 9.7%
3Spt2 21.79 26.02 98.70 127.20
3Mrb2 23.11 28.71 103.59 147.97
15.86 20.59 78.43 121.58 19.29 24.12 96.83 123.54

25
Roughness Parameters for samples texturized with scalpel method (μm)
Serpentinite Marble
Sample Ra Rq Rz Rmax Sample Ra Rq Rz Rmax
20.32 24.00 88.12 115.23 15.89 21.20 80.61 140.96
Mean 19.32 23.54 88.42 121.34 Mean 19.43 24.68 93.68 137.49
STD 3.09 2.74 10.14 5.99 STD 3.61 3.79 11.81 12.58
COV 16.0% 11.7% 11.5% 4.9% COV 18.6% 15.3% 12.6% 9.1%
3Spt3
16.33 20.60 83.93 101.25
80Mrb1
27.68 34.68 124.40 181.89
14.76 18.22 73.71 102.99 28.26 34.17 129.94 160.46
12.64 16.73 75.61 100.47 22.39 30.41 112.21 163.71
Mean 14.57 18.52 77.75 101.57 Mean 26.11 33.09 122.18 168.69
STD 1.85 1.95 5.44 1.29 STD 3.24 2.33 9.07 11.55
COV 12.7% 10.5% 7.0% 1.3% COV 12.4% 7.0% 7.4% 6.8%
5.3 Mechanical performance of AAS systems
As explained before, the mechanical test results obtained from the mechanical pull-off test are the
Load [N] vs. Time [s] curve, and the maximum load at failure (𝐹𝑚𝑎𝑥)[𝑁]. These results can be
translated to Load [N] vs. Displacement [mm] curves, since the test velocity was set to be 10 mm/min
(0.166 mm/s). From the Load [N] vs Displacement [mm] curve of all the experiments the maximum
load at failure (𝐹𝑚𝑎𝑥[𝑁]) and the work of fracture (𝑊𝑓[𝐽]) were computed. In order to correlate the
mechanical results with the roughness properties of the rocks, the relationship between the aggregates
surface roughness and the maximum load at failure was explored, which can be plotted in Ra [𝜇𝑚]
vs. (𝐹𝑚𝑎𝑥)[𝑁] graphs. Besides, since the roughness profiles of the samples surface were measured,
the actual contact area of the surface 𝐴𝐶[𝑚𝑚2]) was calculated as 𝐴 = 𝜋𝑟2 in which the radius of
the sample surface was estimated as the total length of the roughness profile, and this allows to assess
the relationship between the aggregate surface that was in contact with the asphalt binder, and the
maximum load at failure, presented in a curve of the Area of contact 𝐴𝐶[𝑚𝑚2]) [𝑚𝑚2] vs. 𝐹𝑚𝑎𝑥[𝑁].
Additionally, the information from the mechanical test can be translated to Area of contact [𝑚𝑚2]
vs. 𝑊𝑓[𝐽], so a relationship between the aggregate surface contact of the specimen with the asphalt
binder and the work of fracture can be obtained. Finally, the mean, the standard deviation, and the
Coefficient of Variation COV, were calculated to analyze the results obtained
5.3.1 Sandblasting texturing method
The results of 𝐹𝑚𝑎𝑥, 𝑊𝑓 and 𝐴𝐶 of the aggregate surface with the asphalt binder for the samples of
quartzite and marble texturized through sandblasting are presented in Table 3. In addition, the
mechanical performance of a quartzite and a marble sample without any texture in the surface was
presented in order to have control samples. The mechanical results of these samples were obtained
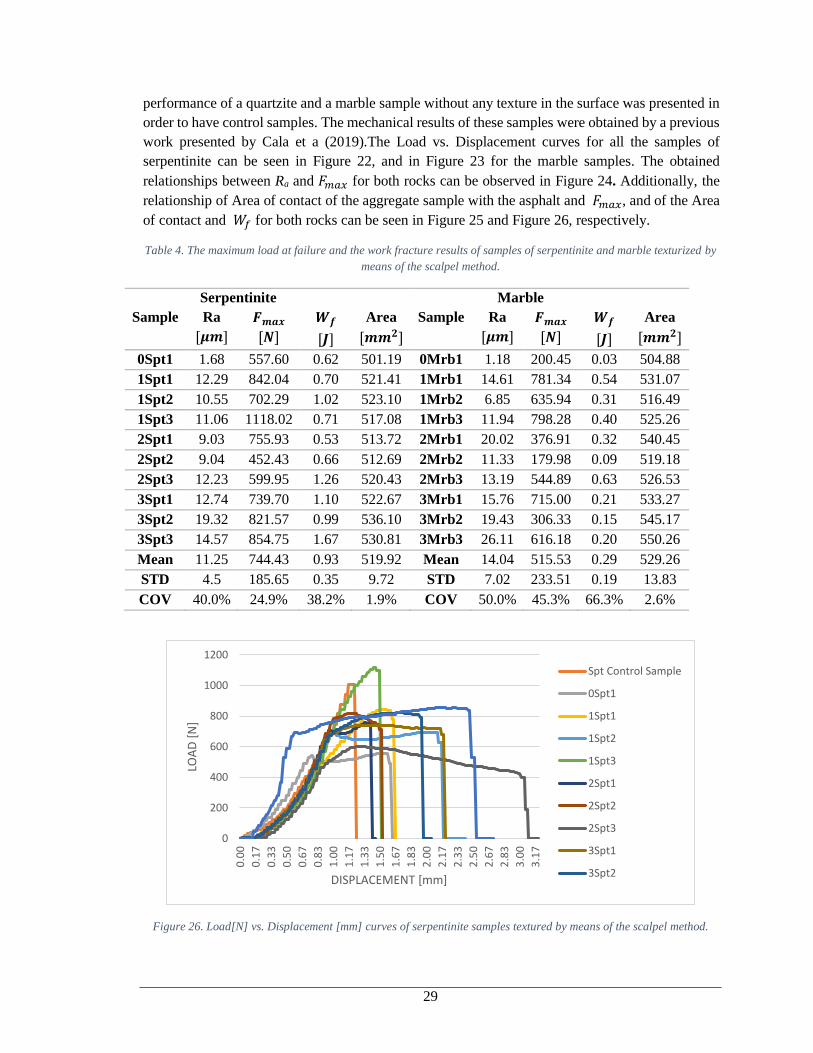
by a previous work presented by Cala et a (2019). The Load vs. Displacement curves for all the
samples of Quartize can be seen in Figure 17, while the test results for all the samples of Marble
can be seen in Figure 18. The Ra vs. 𝐹𝑚𝑎𝑥 of the quartzite and marble can be observed in Figure 19.
Additionally, the 𝐴𝐶 vs. 𝐹𝑚𝑎𝑥 of the quartzite and marble can be seen in Figure 20. Finally, 𝐴𝐶, c,
vs. 𝑊𝑓 of the quartzite and marble samples can be seen in Figure 21.

26
Table 3. The maximum load at failure and the work fracture results of samples of quartzite and marble texturized
through sandblasting.
Quartzite Marble
Sample Ra
[𝝁𝒎]
𝑭𝒎𝒂𝒙
[𝑵]
𝑾𝒇
[𝑱]
Area
[𝒎𝒎𝟐] Sample
Ra
[𝝁𝒎]
𝑭𝒎𝒂𝒙
[𝑵]
𝑾𝒇
[𝑱]
Area
[𝒎𝒎𝟐]
40Qtz1 11.15 271.39 0.08 602.82 40Mrb1 7.37 413.61 0.03 560.79
40Qtz2 12.96 559.01 0.17 603.56 40Mrb2 6.29 397.38 0.23 549.90
40Qtz3 11.42 643.71 0.21 604.23 40Mrb3 5.91 573.13 0.46 546.59
60Qtz1 11.62 1136.37 0.38 581.97 40Mrb5 6.94 752.40 0.30 561.66
60Qtz2 8.84 155.99 0.07 576.60 60Mrb1 7.60 583.01 0.21 555.75
60Qtz3 13.27 1087.69 0.44 601.60 60Mrb2 9.39 507.48 0.18 569.85
60Qtz4 11.97 789.81 0.28 597.95 60Mrb3 7.24 707.94 0.27 556.18
80Qtz1 10.49 30.35 0.01 583.34 60Mrb4 7.58 162.34 0.08 571.52
80Qtz3 8.48 337.46 0.29 574.41 60Mrb5 8.06 479.25 0.25 558.57
80Qtz4 10.33 41.64 0.02 583.17 80Mrb1 6.87 577.36 0.52 557.64
80Qtz5 8.59 85.40 0.07 579.00 80Mrb2 7.95 618.30 0.37 557.00
Mean 10.83 467.17 0.18 589.88 Mean 7.38 524.75 0.26 558.68
STD 1.66 405.73 0.15 12.03 STD 0.94 162.76 0.15 7.38
COV 15.4% 86.9% 80.7% 2.0% COV 12.7% 31.0% 55.7% 1.3%
Figure 21. Load[N] vs. Displacement [mm] curves of quartzite samples textured through sandblasting method.
0
200
400
600
800
1000
1200
1400
1600
0.0
0
0.0
8
0.1
7
0.2
5
0.3
3
0.4
2
0.5
0
0.5
8
0.6
7
0.7
5
0.8
3
0.9
2
1.0
0
1.0
8
1.1
7
1.2
5
1.3
3
1.4
2
LOA
D [
N]
DISPLACEMENT [mm]
Qtz Control Sample
40Qtz1
40Qtz2
40Qtz3
60Qtz1
60Qtz2
60Qtz3
60Qtz4
80Qtz1
80Qtz3

27
Figure 22. Load[N] vs. Displacement [mm] curves of marble samples textured through sandblasting method.
From Figure 17 and Figure 18, it can be seen that there are three types of Load vs. Displacement
curves. The first type of curve has an increment of load with a constant slope and when it reaches
the maximum load at failure the slope and load falls immediately (e.g., 60 Qtz1 curve). The second
type of curve has an increment of load with a constant slope and when the maximum load at failure
is reached, the load maintains constant for a certain period after the slope and load falls immediately
(e.g., 80Mrb1 curve). Finally, the third type of curve exhibits an increment of load with a constant
slope, and when it reaches the maximum load at failure it presents a decrease of load with a constant
slope, until it reaches a load of 0 N (e.g., 40Mrb2 curve). The average maximum load at failure for
the quartzite samples is 467 N, while the average maximum load at failure for the marble samples
524 N, this value is very similar for both types of rocks with a difference of 12.32% between them.
It is difficult to know at this time what is the cause in the differences in this mechanical behavior
among samples. It is speculated that the lack of control over the thickness of the asphalt film
between samples and the different values of Ra among them could partially explain this behavior
since a higher thickness of the asphalt film tend to promote cohesive failure, lower values of the
maximum load at failure (𝐹𝑚𝑎𝑥) and different mechanical performance in the test.
Figure 23. Ra [μm] vs. 𝐹𝑚𝑎𝑥 [N] of quartzite and marble samples textured through sandblasting method.
0
200
400
600
800
1000
1200
0.0
0
0.0
8
0.1
7
0.2
5
0.3
3
0.4
2
0.5
0
0.5
8
0.6
7
0.7
5
0.8
3
0.9
2
1.0
0
1.0
8
1.1
7
1.2
5
1.3
3
1.4
2
1.5
0
1.5
8
LOA
D [
N]
DISPLACEMENT [mm]
Mrb Control Sample
40Mrb1
40Mrb2
40Mrb3
40Mrb5
60Mrb1
60Mrb2
60Mrb3
60Mrb4
60Mrb5
R² = 0.5427
R² = 0.0013
0
200
400
600
800
1000
1200
7 8 9 10 11 12 13 14
F ma
x[N]
Ra [μm]
Quartzite
Marble
Poly. (Quartzite)
Poly. (Marble)

28
From Figure 19, it can be observed that in the group of samples that were texturized by means of
the sandblasting method there is no clear relationship between Ra and 𝐹𝑚𝑎𝑥 . Nevertheless, if the
quartzite samples are analyzed individually, a positive relationship between these two variables can
be observed. As Ra increases, 𝐹𝑚𝑎𝑥 increases. If the marble samples are analyzed separately, there
is not a clear relationship between both parameters.
Figure 24. Area of contact [𝑚𝑚2] vs. 𝐹𝑚𝑎𝑥[𝑁] of the quartzite and marble samples texturized through sandblasting
method.
From Figure 20, it can be observed that in the group of samples that were texturized by means of
the sandblasting method there is no clear relationship between the contact area of the aggregate with
the asphalt binder and the maximum load at failure 𝐹𝑚𝑎𝑥 for the quartzite or marble samples.
Figure 25. The Area of contact [𝑚𝑚2] vs. 𝑊𝑓[𝐽] of the quartzite and marble samples texturized through sandblasting
method.
Similarly, from Figure 21, it can be observed that in the group of samples that were texturized by
means of the sandblasting method there is not a clear relationship between the contact area of the
aggregate with the asphalt binder and the work of fracture 𝑊𝑓 obtained from the mechanical
adhesion test.
5.3.2 Texture by means of the scalpel method
Similar to the previous section, Table 4 presents the results of 𝐹𝑚𝑎𝑥, 𝑊𝑓 and the Area of contact of
the aggregate surface with the asphalt binder for the serpentinite and marble samples that were
texturized by means of the scalpel method are presented in Table 4. In addition, the mechanical
0
200
400
600
800
1000
1200
570 580 590 600 610
F m
ax [N]
AC [mm2]
Quartzite
Marble
0.00
0.10
0.20
0.30
0.40
0.50
0.60
570 580 590 600 610
Wf[J]
AC [mm2]
Quartzite
Marble
29
performance of a quartzite and a marble sample without any texture in the surface was presented in
order to have control samples. The mechanical results of these samples were obtained by a previous
work presented by Cala et a (2019).The Load vs. Displacement curves for all the samples of
serpentinite can be seen in Figure 22, and in Figure 23 for the marble samples. The obtained
relationships between Ra and 𝐹𝑚𝑎𝑥 for both rocks can be observed in Figure 24. Additionally, the
relationship of Area of contact of the aggregate sample with the asphalt and 𝐹𝑚𝑎𝑥, and of the Area
of contact and 𝑊𝑓 for both rocks can be seen in Figure 25 and Figure 26, respectively.
Table 4. The maximum load at failure and the work fracture results of samples of serpentinite and marble texturized by
means of the scalpel method.
Serpentinite
Marble
Sample Ra
[𝝁𝒎]
𝑭𝒎𝒂𝒙
[𝑵]
𝑾𝒇
[𝑱]
Area
[𝒎𝒎𝟐]
Sample Ra
[𝝁𝒎]
𝑭𝒎𝒂𝒙
[𝑵]
𝑾𝒇
[𝑱]
Area
[𝒎𝒎𝟐]
0Spt1 1.68 557.60 0.62 501.19 0Mrb1 1.18 200.45 0.03 504.88
1Spt1 12.29 842.04 0.70 521.41 1Mrb1 14.61 781.34 0.54 531.07
1Spt2 10.55 702.29 1.02 523.10 1Mrb2 6.85 635.94 0.31 516.49
1Spt3 11.06 1118.02 0.71 517.08 1Mrb3 11.94 798.28 0.40 525.26
2Spt1 9.03 755.93 0.53 513.72 2Mrb1 20.02 376.91 0.32 540.45
2Spt2 9.04 452.43 0.66 512.69 2Mrb2 11.33 179.98 0.09 519.18
2Spt3 12.23 599.95 1.26 520.43 2Mrb3 13.19 544.89 0.63 526.53
3Spt1 12.74 739.70 1.10 522.67 3Mrb1 15.76 715.00 0.21 533.27
3Spt2 19.32 821.57 0.99 536.10 3Mrb2 19.43 306.33 0.15 545.17
3Spt3 14.57 854.75 1.67 530.81 3Mrb3 26.11 616.18 0.20 550.26
Mean 11.25 744.43 0.93 519.92 Mean 14.04 515.53 0.29 529.26
STD 4.5 185.65 0.35 9.72 STD 7.02 233.51 0.19 13.83
COV 40.0% 24.9% 38.2% 1.9% COV 50.0% 45.3% 66.3% 2.6%
Figure 26. Load[N] vs. Displacement [mm] curves of serpentinite samples textured by means of the scalpel method.
0
200
400
600
800
1000
1200
0.0
0
0.1
7
0.3
3
0.5
0
0.6
7
0.8
3
1.0
0
1.1
7
1.3
3
1.5
0
1.6
7
1.8
3
2.0
0
2.1
7
2.3
3
2.5
0
2.6
7
2.8
3
3.0
0
3.1
7
LOA
D [
N]
DISPLACEMENT [mm]
Spt Control Sample
0Spt1
1Spt1
1Spt2
1Spt3
2Spt1
2Spt2
2Spt3
3Spt1
3Spt2

30
Figure 27. Load[N] vs. Displacement [mm] curves of marble samples textured by means of the scalpel method.
For this method, Figure 22 and Figure 23 show that there are two types of Load vs. Displacement
curves. The first type of curve exhibits an increment of load with a constant slope and in the
maximum load at failure the slope and load fall immediately (e.g., 1Spt3 curve). The second type
of curve exhibits an increment of load with a constant slope and in the maximum load at failure the
load maintains constant for a certain period and finally at failure the slope and load fall immediately
(e.g., 1Mrb1 curve). As it happened in the previous graphs (Figure 18 and Figure 19), it is difficult
to know at this time what is the cause in the differences in this mechanical behavior among samples.
It is speculated that the lack of control over the thickness of the asphalt film between samples and
the different values of Ra among them could partially explain this behavior since a higher thickness
of the asphalt film tend to promote cohesive failure, lower values of the maximum load at failure
(𝐹𝑚𝑎𝑥) and different mechanical performance in the test.
The average maximum load at failure for the serpentinite samples is 745 N, while the average
maximum load at failure for the marble samples 515 N, this value is considerably different for both
types of rocks with a difference of 44% between them. Nevertheless, the result of the average
maximum load at failure of the samples of marble texturized through sandblasting is very similar to
the value of the average maximum load at failure of the samples of this same type of rock texturized
by means of the scalpel method, with a difference of only 1.76% between their values. The behavior
of the of Load vs. Displacement curves of both samples of marble also had similar behavior
independently of the method used to texturize the samples (i.e., difference in the average maximum
load at marble of 1.76% between the two texturing methods).
0
200
400
600
800
1000
1200
0.0
00
.10
0.2
00
.30
0.4
00
.50
0.6
00
.70
0.8
00
.90
1.0
01
.10
1.2
01
.30
1.4
01
.50
1.6
01
.70
1.8
01
.90
LOA
D [
N]
DISPLACEMENT [mm]
Mrb Control Sample
0Mrb1
1Mrb1
1Mrb2
1Mrb3
2Mrb1
2Mrb2
2Mrb3
3Mrb1
3Mrb2

31
Figure 28. Ra [μm] vs. (𝐹𝑚𝑎𝑥)[N]] curves of serpentinite and marble samples textured by means of the scalpel method.
From Figure 24, it can be observed that the of serpentinite and marble samples texturized by means
of the scalpel method does not present a clear relationship between Ra and 𝐹𝑚𝑎𝑥. However, if the
serpentinite samples are analyzed individually, a small tendency of a direct relationship between Ra
and 𝐹𝑚𝑎𝑥 (i.e., increase of the Ra value as the 𝐹𝑚𝑎𝑥 increases) can be seen. Similarly, if the marble
samples are analyzed individually, the same slight increasing relationship between Ra and 𝐹𝑚𝑎𝑥 can
be observed. Nevertheless, this trend is not strong enough to obtain conclusions about a relationship
between these two variables.
Figure 29. The Area of contact [𝑚𝑚2] vs. 𝐹𝑚𝑎𝑥[𝑁] graph of the serpentinite and marble samples texturized by means
of the scalpel method.
Similar to the sandblasting method, Figure 25 shows that the results for the samples texturized using
the scalpel method do not present a relationship between the contact area of the aggregate with the
binder and 𝐹𝑚𝑎𝑥, although the data suggests a weak positive tendency between the contact area of
the aggregate and 𝐹𝑚𝑎𝑥 for both aggregates.
R² = 0.2312
R² = 0.4287
0
200
400
600
800
1000
1200
0 5 10 15 20 25
Fmax
[N]
Ra [μm]
Serpentinite
Marble
Expon.(Serpentinite)Poly. (Marble)
0
200
400
600
800
1000
1200
500 505 510 515 520 525 530 535 540
Fmax[N]
AC [mm2]
Serpentinite
Marble

32
Figure 30. The Area of contact [𝑚𝑚2] vs. 𝑊𝑓[𝐽] graph of the serpentinite and marble samples texturized by means of
the scalpel method.
Finally, Figure 26 shows that the samples texturized by means of the scalpel method present a weak
positive relationship between the contact area of aggregate with the asphalt binder and 𝑊𝑓 for the
serpentinite samples. On the contrary, no clear relationship was observed between these parameters
for the marble samples.
5.3.3 Types of failure
The testing procedure consisted of applying tensile forces on the AAS systems under a control
displacement condition of 10mm/min until reaching the failure of the system. This failure could be
adhesive, cohesive or substrate failure. Adhesive failure occurs when there is a debonding at the
asphalt-aggregate interface, while the cohesive failure occurs on the asphalt film itself. Finally,
substrate failure occurs when the substrate, in this ca se, the rock sample, fails prior to bond failure.
All the lithologies presented cohesive failure (i.e., the failure occurred within the asphalt binder),
as shown in Figure 27. Nevertheless, some of the lithologies texturized through the sandblasting
method presented a cohesive failure in combination with a substrate failure. It means that most of
the failure was cohesive but, in some areas, there was a substrate failure in which parts of the rock
remained attached to the metallic stub, as shown in Figure 28. Some explanations for this behavior
are explored in the following section.
Figure 31. Quartzite 80Qtz4 sample with a cohesive failure in the interface.
0.00
0.50
1.00
1.50
2.00
500 505 510 515 520 525 530 535 540
Wf[J]
AC [mm2]
Serpentinite
Marble
33
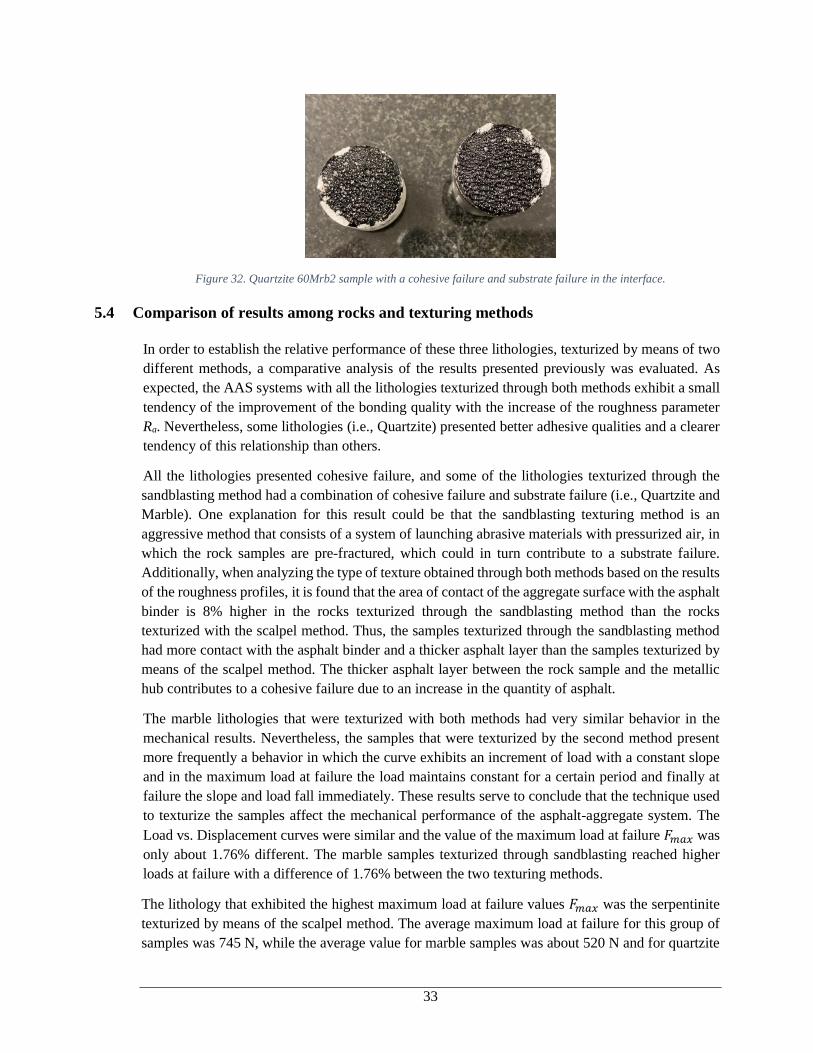
Figure 32. Quartzite 60Mrb2 sample with a cohesive failure and substrate failure in the interface.
5.4 Comparison of results among rocks and texturing methods
In order to establish the relative performance of these three lithologies, texturized by means of two
different methods, a comparative analysis of the results presented previously was evaluated. As
expected, the AAS systems with all the lithologies texturized through both methods exhibit a small
tendency of the improvement of the bonding quality with the increase of the roughness parameter
Ra. Nevertheless, some lithologies (i.e., Quartzite) presented better adhesive qualities and a clearer
tendency of this relationship than others.
All the lithologies presented cohesive failure, and some of the lithologies texturized through the
sandblasting method had a combination of cohesive failure and substrate failure (i.e., Quartzite and
Marble). One explanation for this result could be that the sandblasting texturing method is an
aggressive method that consists of a system of launching abrasive materials with pressurized air, in
which the rock samples are pre-fractured, which could in turn contribute to a substrate failure.
Additionally, when analyzing the type of texture obtained through both methods based on the results
of the roughness profiles, it is found that the area of contact of the aggregate surface with the asphalt
binder is 8% higher in the rocks texturized through the sandblasting method than the rocks
texturized with the scalpel method. Thus, the samples texturized through the sandblasting method
had more contact with the asphalt binder and a thicker asphalt layer than the samples texturized by
means of the scalpel method. The thicker asphalt layer between the rock sample and the metallic
hub contributes to a cohesive failure due to an increase in the quantity of asphalt.
The marble lithologies that were texturized with both methods had very similar behavior in the
mechanical results. Nevertheless, the samples that were texturized by the second method present
more frequently a behavior in which the curve exhibits an increment of load with a constant slope
and in the maximum load at failure the load maintains constant for a certain period and finally at
failure the slope and load fall immediately. These results serve to conclude that the technique used
to texturize the samples affect the mechanical performance of the asphalt-aggregate system. The
Load vs. Displacement curves were similar and the value of the maximum load at failure 𝐹𝑚𝑎𝑥 was
only about 1.76% different. The marble samples texturized through sandblasting reached higher
loads at failure with a difference of 1.76% between the two texturing methods.
The lithology that exhibited the highest maximum load at failure values 𝐹𝑚𝑎𝑥 was the serpentinite
texturized by means of the scalpel method. The average maximum load at failure for this group of
samples was 745 N, while the average value for marble samples was about 520 N and for quartzite

34
samples was 467 N. In general, both samples, serpentinite and marble texturized by means of the
scalpel method had higher values of maximum load at failure 𝐹𝑚𝑎𝑥 than the samples of quartzite
and marble texturized through sandblasting method. The reason why the lithologies texturized by
means of the scalpel method reached higher values of 𝐹𝑚𝑎𝑥 than those texturized through the
sandblasting method is attributed to the pre-fractured condition of the sample with the sandblasting
method, and the increase in the asphalt layer in the AAS system. A thinner asphalt layer between
the rock sample and the metallic hub contributes to a higher maximum load at failure. As this layer
of asphalt in the system increases, the maximum load at failure decreases.
The lithologies texturized by means of the scalpel method showed a direct relationship between the
area of contact of the aggregate surface with the asphalt and 𝐹𝑚𝑎𝑥, as expected. A bigger contact
area of the aggregate surface with the asphalt binder has an improvement in the adhesion quality.
Also, the serpentinite samples of this group showed a relationship between the aggregate contact
area and 𝑊𝑓, as expected. Nevertheless, some lithologies did not present a relationship between the
area of contact and 𝐹𝑚𝑎𝑥, and in the contact area with 𝑊𝑓.
The group of samples texturized by the sandblasting method had a COV of the Ra value of 14.02%
while the group of samples texturized by the scalpel method had a COV of the Ra value of 45%.
Similarly, the COV of the contact area AC of the samples texturized by the first method, 1.68%, is
smaller than the COV of the contact area AC of the samples texturized by the second method, 2.24%.
This means that the first technique of texture provides a more homogeneous and less variable texture
between the samples.
From the results presented in Figure 20, it can be observed that at low roughness levels (Ra between
8 𝜇𝑚 and 11 𝜇𝑚) marble samples had higher values of maximum load at failure 𝐹𝑚𝑎𝑥 than the
samples of quartzite, both texturized through the sandblasting method. Nevertheless, at higher levels
of roughness, quartzite samples had higher values of maximum load that the samples of quartzite.
These results imply that at low roughness levels the behavior of the system is strongly influenced
by the chemistry of the rock and conversely, at high roughness levels, what dominates the response
to adhesion is not the lithology chemistry but the rock surface roughness. Nonetheless, this behavior
is not evident in the results for the samples of serpentinite and marble texturized by means of the
scalpel method presented in Figure 25, in which the serpentinite lithology had higher values of
maximum load at failure 𝐹𝑚𝑎𝑥 at low and high roughness levels.
The control lithologies of quartzite, marble and serpentinite were samples that did not go through a
texturization process and the faces were polished. These samples exhibited a value of the maximum
load at failure 𝐹𝑚𝑎𝑥 of 1372.11 N, 1053.08 N and 1006.5 N respectively. These values are 65.96%,
50.6% and 25.98% higher from the values of maximum load at failure 𝐹𝑚𝑎𝑥 obtained for the
samples that were texturized by means of both methods. One possible reason for this result is that
in the lithologies that were not texturized (i.e., no roughness) it was possible to guarantee an asphalt
film of 0.20 𝜇𝑚 while in the samples that were texturized by means of both methodologies, a higher
thickness of the asphalt film was achieved (i.e., 35 𝜇𝑚) due to the valleys and peaks formed during
the texturization process. In this regard, a thicker asphalt film promotes a cohesive failure and a
failure at lower loads.
35
6 Conclusions
This work included a characterization of three different lithologies: i) Quartzite, ii) Marble, and iii)
Serpentinite, that were texturized using two different methods: i) Sandblasting and ii) Scalpel, in
order to evaluate the relationship between the aggregate surface roughness and the adhesion quality
of asphalt-aggregate systems. It was demonstrated that some rocks (i.e., Quartzite) with higher
roughness tend to have an increment in the adhesion quality of the asphalt-aggregate systems, as
concluded from the 𝐹𝑚𝑎𝑥, 𝑊𝑓, and Area of contact of the aggregate surface with the asphalt binder
obtained from the mechanical test and the analysis of the results. The main conclusions of this work
are as follows:
• Quartzite rocks with higher roughness in the aggregate surface have better adhesion quality
of the asphalt-aggregate system due to an increase in the contact area between the aggregate
surface and the asphalt binder contributing to better adhesion between them.
• Serpentinite and Marble samples do not present a clear relationship between the surface
roughness and the adhesion quality of the asphalt-aggregate system. Therefore, the surface
roughness of these aggregates does not have an influence on the adhesion quality of the
asphalt-aggregate system.
• Serpentinite rocks are more sensitive to the texturization process than the quartzite and
marble, having higher magnitudes in the roughness parameters than the other lithologies
and higher maximum load at failure values, supporting the conclusion that higher roughness
values contribute to better adhesion quality in the asphalt-aggregate system.
• The failure type presented in all the AAS systems was a cohesive failure.
• In some lithologies (i.e., 40Qtz1, 40Qtz3, 60Qtz1, 60Qtz4, 80Qtz1, 60Mrb3, 60Mrb2,
60Mrb4, 40Mrb3, 60Mrb1, 80Mrb1, 80Mrb2, 80Mrb5, 60Mrb5) texturized through the
sandblasting method, a substrate failure occurred which is attributed to the abrasive process.
• The similarity in the mechanical results for the marble lithology samples, texturized by both
methods, shows that the adhesion quality is more dependent on the lithology than on the
methods used to produce the texture.
• Depending on the roughness range, it was found that the rock chemistry had a stronger
influence on the mechanical response of asphalt-aggregate systems than the rock roughness.
Specifically, for samples prepared by the sandblasting method with Ra values below 12 𝜇𝑚,
quartzite samples had higher maximum load at failure values compared to marble samples.
In the case of samples prepared by means of the scalpel method, the serpentinite presented
better mechanical response in terms of maximum load at failure values for all the roughness
values, compared to those obtained for marble.
• It is necessary to find new and better texturizing methods in which a better control of the
asphalt film can be made in order to obtain a more homogeneous roughness on the whole
lithology surface.
• It is necessary to conduct more tests in a bigger number of samples and a larger number of
lithologies in order to obtain more clear results and make stronger conclusions about the
relationship between the aggregate surface roughness and the adhesion quality in the
asphalt-aggregate system.

36
• Finally, it would be important to assess in future studies if the rugosity plays a relevant role
in the durability of the aggregate-asphalt system under moisture conditions (i.e., conduct
the mechanical tests after subjecting the AAS samples to different moisture conditioning
processes).

37
7 References
Best, M. G. (2003). Composition and Classification of Magmatic Rocks. In M. G. Best, Igneous and
Metamorphic Petrology (pp. 1-16). Blackwell Science Ltd.
Cala, A. F., & Caro, S. (2017). Influence of the Mineralogy in the Adhesion Quality between Asphalt
Binders and Mineral Aggregates. Universidad de los Andes.
Cala, A., Caro, S., Lleras-Jacobsen, M., & Rojas-Agramonte, Y. (2019). Impact of the chemical composition
of aggregates on the adhesion quality and durability of asphalt-aggregate systems. Construction and
Building Materials, 661-672.
Canestrari, F., Cardone, F., Graziani, A., Santagata, F. A., & Bahia, H. U. (2011). Adhesive and Cohesive
Properties of AsphaltAggregate Systems Subjected to Moisture Damage. Road Materials and
Pavement Design, 11-32.
Ceylan, H., Gopalakrishnan, K., & Kim, S. (2009). Looking to the future: The next-generation hot mix.
International Journal of Pavement Engineering, 341-352.
Chen, J., Li, H., Wang, L., Wu, J., & Huang, X. (2015). Micromechanical characteristics of aggregate
particles in asphalt. Construction and Building Materials, 80-85.
Cui, P., Xiao, Y., Yan, B., Li, M., & Wu, S. (2018). Morphological characteristics of aggregates and their
influence on the. Construction and Building Materials, 303-312.
Cui, S., Blackman, B. R., Kinloch, A. J., & Taylor, A. C. (2014).
Durabilityofasphaltmixtures:Effectofaggregatetype. International Journal of Adhesion &
Adhesives, 100-111.
Durrell, C. (1988). Geologic History of the Feather River Country, California. In C. Durrell, About
serpentinite and related rocks (pp. 99-100). University of California Press.
Haldar, S., & Tisljar, J. (2014). Metamorphic Rocks. In S. Haldar, & J. Tisljar, Introduction to Mineralogy
and Petrology (pp. 213-232). Elsevier Inc.
Hu, J., & Qian, Z. (2018). The prediction of adhesive failure between aggregates and asphalt. Construction
and Building Materials, 22-31.
Kuang, D., Wang, X., Jiao, Y., Zhang, B., Liu, Y., & Chen, H. (2019). Influence of angularity and roughness
of coarse aggregates on asphalt. Construction and Building Materials, 681-686.
Kuang, D., Zhang, B., Jiao, Y., Fang, J., Chen, H., & Wang, L. (2017). Impact of particle morphology on
aggregate-asphalt interface behavior. Construction and Building Materials, 142-149.
Mahr Production Metrology. (2019, December 10). Retrieved from Mahr Corporation Web site:
https://www.mahr.com/mahr-parameter/html/english/englishIndex.html
Mattern, J. (2005). Metamorphic Rocks and the Rock Cycle. The Rosen Publishing Group Inc.
Mitutoyo America Corportation. (2016, December). Mitutoyo America Corporation. Retrieved from
Product Literature: https://www.mitutoyo.com

38
Mohammed, M., Parry, T., Thom, N., & Grenfell, J. (2018). Investigation into the bond strength of bitumen-
fibre mastic. Construction and building materials.
Moraes, R., Velasquez, R., & Bahia, H. (2011). Measuring the effect of moisture on asphalt-aggregate bond
with the bitumen bond strength test. Transportation Research Record, 70-81.
Pellant, C., & Pellant, H. (2007). Marble and othe methamorphic rocks. Gareth Stevens Publishing.
Singh, D., Zaman, M., & Commuri, S. (2012). Inclusion of aggregate angularity, texture, and form in
estimating dynamic modulus of asphalt mixes. Road Materials and Pavement Design, 327-344.
Wright, P. (1995). A method of measuring the surface texture of aggregate. Magazine of Concrete Research,
151-160.
Xu, G., & Wang, H. (2016). Study of cohesion and adhesion properties of asphalt concrete with.
Computational Materials Science, 161-169.
Yee, S. T., Hamzah, M. O., & Van den bergh, W. (2019). Evaluation of moisture susceptibility of asphalt-
aggregate constituents subjected to direct tensile test using imaging technique. Construction and
Building Materials.
Zhang, J., Airey, G. D., Grenfell, J., & Yao, Z. (2017). Laboratory evaluation of Rediset modified bitumen
based on rheology and adhesion properties. Construction and building materials.