Influence of the Origin of Polyamide 12 Powder on the ...
15
applied sciences Article Influence of the Origin of Polyamide 12 Powder on the Laser Sintering Process and Laser Sintered Parts Manfred Schmid 1, *, Rob Kleijnen 1 , Marc Vetterli 1 and Konrad Wegener 2 1 Inspire, Innovation Center for Additive Manufacturing (icams), Lerchenfeldstrasse 3, St. Gallen 9014, Switzerland; [email protected] (R.K.); [email protected] (M.V.) 2 Department of Mechanical and Process Engineering, Swiss Institute of Technology (ETHZ), Tannenstrasse 3, Zürich 8093, Switzerland; [email protected] * Correspondence: [email protected]; Tel.: +41-071-274-7316 Academic Editor: Peter Van Puyvelde Received: 3 April 2017; Accepted: 25 April 2017; Published: 30 April 2017 Abstract: Different features of polymer powders influence the process of laser sintering (LS) and the properties of LS-parts to a great extent. This study investigates important aspects of the “powder/process/part”-property relationships by comparing two polyamide 12 (PA12) powders commercially available for LS, with pronounced powder characteristic differences (Duraform ® PA and Orgasol ® Invent Smooth). Due to the fact that the primary influence factor on polymer behaviour, the chemical structure of the polymer chain, is identical in this case, the impacts resulting from powder distribution, particle shape, thermal behaviour, and crystalline and molecular structure, can be studied in detail. It was shown that although both systems are PA12, completely different processing conditions must be applied to accomplish high-resolution parts. The reason for this was discovered by the different thermal behaviour based on the powder production and the resulting crystalline structure. Moreover, the parts built from Orgasol ® Invent Smooth unveil mechanical properties with pronounced anisotropy, caused from the high melt viscosity and termination of polymer chains. Further differences are seen in relation to the powder characteristics and other significant correlations could be revealed. For example, the study demonstrated how the particle morphology and shape impact the surface roughness of the parts. Keywords: laser sintering (LS); polyamide 12; LS-process; LS-part properties 1. Introduction The laser sintering (LS) of polymer powders is a primary shaping process by definition. A solid body is created out of an unstructured and formless powder bed by the energy input (laser radiation). This means that besides the shape, the properties of the part will also be created during the build process to a great extent. The characteristic of the used powder has an especially large influence on the part properties, as was recently summarized by Sutton et al. [1]. Furthermore, almost all of the material and production parameters influence the final properties of the LS parts. The interference of different build-parameters, but also their difficult and precise control, has far-reaching consequences for the fabricated parts. For LS parts, an exact prediction of the properties is thus difficult [2]. Moreover, the highly complex LS parts are influenced by their three-dimensional orientation in the building chamber of the LS-equipment. In the scientific literature, numerous investigations are described regarding correlations of single build parameters and their combinations on part properties. The following list assembles some important works in this area: • Influence of the energy density (Andrew number (A n )) [3,4]; • Influence of molecular properties of the polymer on the micro-structure of the parts [5]; Appl. Sci. 2017, 7, 462; doi:10.3390/app7050462 www.mdpi.com/journal/applsci
Transcript of Influence of the Origin of Polyamide 12 Powder on the ...

applied sciences
Article
Influence of the Origin of Polyamide 12 Powder onthe Laser Sintering Process and Laser Sintered Parts
Manfred Schmid 1,*, Rob Kleijnen 1, Marc Vetterli 1 and Konrad Wegener 2
1 Inspire, Innovation Center for Additive Manufacturing (icams), Lerchenfeldstrasse 3, St. Gallen 9014,Switzerland; [email protected] (R.K.); [email protected] (M.V.)
2 Department of Mechanical and Process Engineering, Swiss Institute of Technology (ETHZ), Tannenstrasse 3,Zürich 8093, Switzerland; [email protected]
* Correspondence: [email protected]; Tel.: +41-071-274-7316
Academic Editor: Peter Van PuyveldeReceived: 3 April 2017; Accepted: 25 April 2017; Published: 30 April 2017
Abstract: Different features of polymer powders influence the process of laser sintering (LS) andthe properties of LS-parts to a great extent. This study investigates important aspects of the“powder/process/part”-property relationships by comparing two polyamide 12 (PA12) powderscommercially available for LS, with pronounced powder characteristic differences (Duraform® PAand Orgasol® Invent Smooth). Due to the fact that the primary influence factor on polymer behaviour,the chemical structure of the polymer chain, is identical in this case, the impacts resulting frompowder distribution, particle shape, thermal behaviour, and crystalline and molecular structure,can be studied in detail. It was shown that although both systems are PA12, completely differentprocessing conditions must be applied to accomplish high-resolution parts. The reason for this wasdiscovered by the different thermal behaviour based on the powder production and the resultingcrystalline structure. Moreover, the parts built from Orgasol® Invent Smooth unveil mechanicalproperties with pronounced anisotropy, caused from the high melt viscosity and termination ofpolymer chains. Further differences are seen in relation to the powder characteristics and othersignificant correlations could be revealed. For example, the study demonstrated how the particlemorphology and shape impact the surface roughness of the parts.
Keywords: laser sintering (LS); polyamide 12; LS-process; LS-part properties
1. Introduction
The laser sintering (LS) of polymer powders is a primary shaping process by definition. A solidbody is created out of an unstructured and formless powder bed by the energy input (laser radiation).This means that besides the shape, the properties of the part will also be created during the buildprocess to a great extent. The characteristic of the used powder has an especially large influence onthe part properties, as was recently summarized by Sutton et al. [1]. Furthermore, almost all of thematerial and production parameters influence the final properties of the LS parts. The interference ofdifferent build-parameters, but also their difficult and precise control, has far-reaching consequencesfor the fabricated parts. For LS parts, an exact prediction of the properties is thus difficult [2].Moreover, the highly complex LS parts are influenced by their three-dimensional orientation inthe building chamber of the LS-equipment. In the scientific literature, numerous investigations aredescribed regarding correlations of single build parameters and their combinations on part properties.The following list assembles some important works in this area:
• Influence of the energy density (Andrew number (An)) [3,4];• Influence of molecular properties of the polymer on the micro-structure of the parts [5];
Appl. Sci. 2017, 7, 462; doi:10.3390/app7050462 www.mdpi.com/journal/applsci

Appl. Sci. 2017, 7, 462 2 of 15
• Energy density (An) and part orientation in a build envelope [6];• Incomplete coalescence of polymer melt and resulting process problems [7];• Influence of powder refreshment and build temperature at a constant energy density (An) [8];• Influence of Energy density (An) in combination with powder layer thickness [9];• Influence of Energy density (An) in combination with powder shape [10];• Variations of temperature in a build envelope and part cylinder [11].
It can be recognized from this shortened list with selected non-linear correlations how critical thecontrol of the LS-process can be regarding predictable LS-part properties. In a larger screening work byWegner et al. [12], the laser power, laser speed, scan spacing, powder bed temperature, layer thickness,and orientation of the parts in the build chamber were investigated, and it could be revealed that scanspacing, in combination with layer thickness, are the most significant in terms of the part density andmechanical properties, if the other parameters are constant.
What is noticeable is that in almost all of the studies mentioned above, the examination isdedicated to only one LS-material. A comparison of the processing behavior and the part properties onat least two materials, as in this study, is rarely done [10,13]. This is surprising, as from a commercialpoint of view, LS materials have been available for a long time from different sources. Both the companyEvonik (Marl, Germany) and the company Arkema (Colombes, France) supply the polyamide 12 (PA12)polymer powders processed in LS. Evonik powders are distributed through the machine suppliersEOS (Krailling, Germany) and 3D-Systems (Rock Hill, SC, USA) under the trade names PA 2200 (EOS)and Duraform® PA (3D-Systems), and are therefore widely dispersed and dominate the LS market.Arkema directly supplies the LS-powder under the trade name Orgasol® Invent Smooth to the market,independently of the major machine manufacturers.
Due to the fact that all three materials are identical regarding their primary chemical structure,as they are all polyamide 12, the comparison of these materials and the resulting parts can beconcentrated on secondary factors, like powder shape, particle size distribution, thermal behavior,and microstructural and morphological differences. It is well known in the community of LS-users(service bureaus) that the powders from the different sources behave differently in the LS-process andcreate different part characteristics. A refined investigation on the influence of powder origin on thelaser sintering process and laser-sintered parts is hence obvious.
2. Materials and Methods
Two polyamide 12 (PA12) powders mainly used in industrial LS-applications were selected forthis study (As mentioned, there is a third main LS-powder on the market from the company EOS(Krailling, Germany), named PA 2200. This material is based on Vestosint powder, and behaves in asimilar way to Duraform® PA. For this reason, it is not included in the present study):
• Duraform® PA (abbreviated: DF-PA); Company 3D-Systems, Rock Hill, SC, USA;
(DF-PA is based on Vestosint® powder from the company Evonik, Marl, Germany)• Orgasol® Invent Smooth (abbreviated: Orgasol-IS); Company Arkema, Colombes, France.
It is important to realize that powders from the “Orgasol®-family” [14] and “Vestosint®-family” [15]have been used as PA12 powders in different coating technologies and other applications in hugequantities for decades. Both materials are fine-tuned by the suppliers for their use in LS to a certainextent [16,17]; however, the basic powder production includes the same principle process for theLS-powders:
• Vestosint® powders are generated by precipitation [18].• Orgasol® powders are produced from direct polymerization [19].
The different production techniques have drastic consequences for the morphology of the particles,as can be revealed with microscopy analysis. Figure 1 depicts the differences by means of Scanning

Appl. Sci. 2017, 7, 462 3 of 15
Electron Microscopy (SEM) pictures. The differences in the shape and surface structure of singleparticles can be clearly recognized. Whilst DF-PA exhibits a shape similar to potatoes (Figure 1, left),Orgasol® particles are much more spherical (Figure 1), with a smooth and slightly wavy surfacestructure (like cauliflower). Comparing both SEM pictures also gives the impression that the particlesize distribution is much narrower in the case of Orgasol®-IS, which could be acknowledged duringthe investigation (see Section 3.1).
Appl. Sci. 2017, 7, 462 3 of 15
particle size distribution is much narrower in the case of Orgasol®‐IS, which could be acknowledged
during the investigation (see Section 3.1).
Figure 1. Different morphology of the particles caused by the production process.
For this study, both materials were processed on a commercial laser sintering machine
manufactured by DTM (DTM was purchased in 2001 by 3D‐Systems and no longer exists). The exact
machine type used was a DTM 2500plus HiQ, retro‐fitted with a digital scan‐head and a six‐zone
multi‐ heating system for improved thermal stability. The machine is under active maintenance,
used in industrial part production, and the parts present the highest possible quality to date. For the
investigation, two processing parameters were set to fixed values:
Scan speed: 10 m/s;
Layer thickness: 0.1 mm.
Other process settings like the part bed temperature (°C), laser power (W), and scan spacing
(mm) were adjusted and optimized so that a (self‐designed) process‐control‐part could be produced
with maximum resolution details. This means, for the benchmark part depicted in Figure 2, that all
dimensions after build are correct; all slits are open; all walls are built and stand upright without
breaking (even the thinnest); the corners are edged and not rounded; the space between the walls is
open; and no, or at least as few as possible, undesired (partially) melted powder sticks in‐between
(for further details, see Figure 2). The evaluation of such a benchmark structure cannot be explained
in detail here, but these parts have been successfully used in our production facility to monitor
machine and process stability for years as a periodical control instrument. In this way, the
experience of the LS‐machine operators results in great confidence in the results, even if the
qualification is partly based on empirical facts.
A main purpose of this work is to identify the processing parameters for high‐resolution parts
for each material as a reference, as these targets are the most relevant for industrial applications.
During the procedure, test specimens for mechanical examinations were built with the identified
machine settings. It is important to recall that the mechanical properties of LS‐parts can be
influenced by LS‐processing parameters to a great extent, as laser sintering is a primary shaping
process. Increasing the energy supply supports the fusion of particles and leads to higher
mechanical properties, as has often been described in the literature, e. g., Starr et al. worked in this
field [9]. So, in principle, one could complete a study on the optimized mechanical properties;
however, the best parameters for high mechanical properties would not generate high‐resolution
parts. Due to an excessive energy input and other processing problems like thermal bleeding,
incorrect part dimensions, etc., the parts produced would not be delivered to customers because of
their poor resolution.
Figure 1. Different morphology of the particles caused by the production process.
For this study, both materials were processed on a commercial laser sintering machinemanufactured by DTM (DTM was purchased in 2001 by 3D-Systems and no longer exists). The exactmachine type used was a DTM 2500plus HiQ, retro-fitted with a digital scan-head and a six-zonemulti- heating system for improved thermal stability. The machine is under active maintenance,used in industrial part production, and the parts present the highest possible quality to date. For theinvestigation, two processing parameters were set to fixed values:
• Scan speed: 10 m/s;• Layer thickness: 0.1 mm.
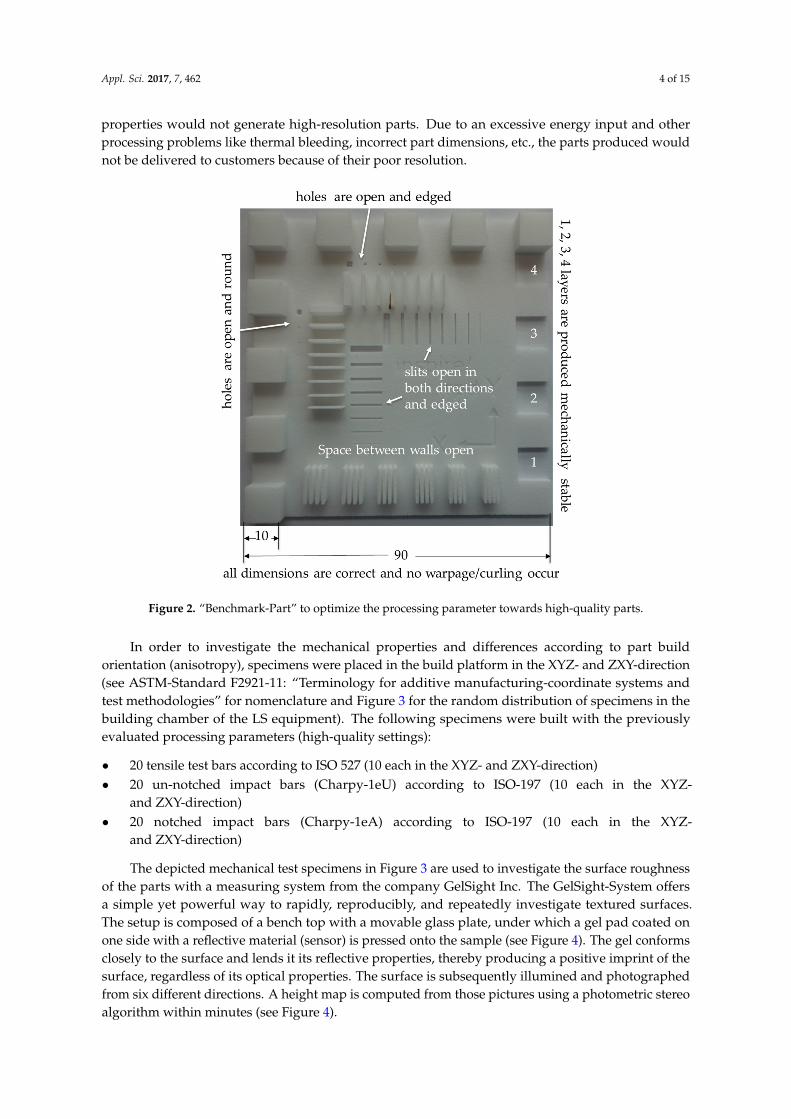
Other process settings like the part bed temperature (◦C), laser power (W), and scan spacing(mm) were adjusted and optimized so that a (self-designed) process-control-part could be producedwith maximum resolution details. This means, for the benchmark part depicted in Figure 2, that alldimensions after build are correct; all slits are open; all walls are built and stand upright withoutbreaking (even the thinnest); the corners are edged and not rounded; the space between the walls isopen; and no, or at least as few as possible, undesired (partially) melted powder sticks in-between(for further details, see Figure 2). The evaluation of such a benchmark structure cannot be explained indetail here, but these parts have been successfully used in our production facility to monitor machineand process stability for years as a periodical control instrument. In this way, the experience of theLS-machine operators results in great confidence in the results, even if the qualification is partly basedon empirical facts.
A main purpose of this work is to identify the processing parameters for high-resolution parts foreach material as a reference, as these targets are the most relevant for industrial applications. During theprocedure, test specimens for mechanical examinations were built with the identified machine settings.It is important to recall that the mechanical properties of LS-parts can be influenced by LS-processingparameters to a great extent, as laser sintering is a primary shaping process. Increasing the energysupply supports the fusion of particles and leads to higher mechanical properties, as has often beendescribed in the literature, e. g., Starr et al. worked in this field [9]. So, in principle, one could completea study on the optimized mechanical properties; however, the best parameters for high mechanical
Appl. Sci. 2017, 7, 462 4 of 15
properties would not generate high-resolution parts. Due to an excessive energy input and otherprocessing problems like thermal bleeding, incorrect part dimensions, etc., the parts produced wouldnot be delivered to customers because of their poor resolution.Appl. Sci. 2017, 7, 462 4 of 15
Figure 2. “Benchmark‐Part” to optimize the processing parameter towards high‐quality parts.
In order to investigate the mechanical properties and differences according to part build
orientation (anisotropy), specimens were placed in the build platform in the XYZ‐ and
ZXY‐direction (see ASTM‐Standard F2921‐11: “Terminology for additive manufacturing‐coordinate
systems and test methodologies” for nomenclature and Figure 3 for the random distribution of
specimens in the building chamber of the LS equipment). The following specimens were built with
the previously evaluated processing parameters (high‐quality settings):
20 tensile test bars according to ISO 527 (10 each in the XYZ‐ and ZXY‐direction)
20 un‐notched impact bars (Charpy‐1eU) according to ISO‐197 (10 each in the XYZ‐ and
ZXY‐direction)
20 notched impact bars (Charpy‐1eA) according to ISO‐197 (10 each in the XYZ‐ and
ZXY‐direction)
The depicted mechanical test specimens in Figure 3 are used to investigate the surface
roughness of the parts with a measuring system from the company GelSight Inc. The
GelSight‐System offers a simple yet powerful way to rapidly, reproducibly, and repeatedly
investigate textured surfaces. The setup is composed of a bench top with a movable glass plate,
under which a gel pad coated on one side with a reflective material (sensor) is pressed onto the
sample (see Figure 4). The gel conforms closely to the surface and lends it its reflective properties,
thereby producing a positive imprint of the surface, regardless of its optical properties. The surface
is subsequently illumined and photographed from six different directions. A height map is
computed from those pictures using a photometric stereo algorithm within minutes (see Figure 4).
Figure 2. “Benchmark-Part” to optimize the processing parameter towards high-quality parts.
In order to investigate the mechanical properties and differences according to part buildorientation (anisotropy), specimens were placed in the build platform in the XYZ- and ZXY-direction(see ASTM-Standard F2921-11: “Terminology for additive manufacturing-coordinate systems andtest methodologies” for nomenclature and Figure 3 for the random distribution of specimens in thebuilding chamber of the LS equipment). The following specimens were built with the previouslyevaluated processing parameters (high-quality settings):
• 20 tensile test bars according to ISO 527 (10 each in the XYZ- and ZXY-direction)• 20 un-notched impact bars (Charpy-1eU) according to ISO-197 (10 each in the XYZ-
and ZXY-direction)• 20 notched impact bars (Charpy-1eA) according to ISO-197 (10 each in the XYZ-
and ZXY-direction)
The depicted mechanical test specimens in Figure 3 are used to investigate the surface roughnessof the parts with a measuring system from the company GelSight Inc. The GelSight-System offersa simple yet powerful way to rapidly, reproducibly, and repeatedly investigate textured surfaces.The setup is composed of a bench top with a movable glass plate, under which a gel pad coated onone side with a reflective material (sensor) is pressed onto the sample (see Figure 4). The gel conformsclosely to the surface and lends it its reflective properties, thereby producing a positive imprint of thesurface, regardless of its optical properties. The surface is subsequently illumined and photographedfrom six different directions. A height map is computed from those pictures using a photometric stereoalgorithm within minutes (see Figure 4).

Appl. Sci. 2017, 7, 462 5 of 15Appl. Sci. 2017, 7, 462 5 of 15
Figure 3. Randomly distributed specimens as built for both investigated powders.
Figure 4. GelSight measurements with greyscale pictures and a calculated surface height map.
Other methods used in this investigation are:
Thermal analysis (DSC) was performed on a DSC 25 (TA Instrument, New Castle, DE, USA)
with a constant heating and cooling rate of 10 °C/min under a nitrogen atmosphere.
The particle size distribution was measured on a LS230 particle analyzer (Beckman Coulter,
Brea, CA, USA). The powder particles were dispersed and suspended in ethanol during the
measurements.
Figure 3. Randomly distributed specimens as built for both investigated powders.
Appl. Sci. 2017, 7, 462 5 of 15
Figure 3. Randomly distributed specimens as built for both investigated powders.
Figure 4. GelSight measurements with greyscale pictures and a calculated surface height map.
Other methods used in this investigation are:
Thermal analysis (DSC) was performed on a DSC 25 (TA Instrument, New Castle, DE, USA)
with a constant heating and cooling rate of 10 °C/min under a nitrogen atmosphere.
The particle size distribution was measured on a LS230 particle analyzer (Beckman Coulter,
Brea, CA, USA). The powder particles were dispersed and suspended in ethanol during the
measurements.
Figure 4. GelSight measurements with greyscale pictures and a calculated surface height map.
Other methods used in this investigation are:
• Thermal analysis (DSC) was performed on a DSC 25 (TA Instrument, New Castle, DE, USA) witha constant heating and cooling rate of 10 ◦C/min under a nitrogen atmosphere.
• The particle size distribution was measured on a LS230 particle analyzer (Beckman Coulter,Brea, CA, USA). The powder particles were dispersed and suspended in ethanol duringthe measurements.

Appl. Sci. 2017, 7, 462 6 of 15
• X-ray diffraction patterns were recorded on a Bruker Nanostar U diffractometer (Bruker AXS,Karlsruhe, Germany) with Cu Ka radiation (λ = 1.5419 Å) and a VÅNTEC-2000 MikroGap areadetection system. The powder samples were prepared between two Kapton® films. The recordedWAXD patterns were analyzed with the evaluation software BRUKER DIFFRAC.EVA (version 4.1.,Bruker AXS, Karlsruhe, Germany).
• Mechanical Properties were measured with a standard tensile testing machine (Zwick GmbH&Co.KG, Ulm, Germany) regarding ISO 527-1 under controlled environmental conditions (23 ◦C/50 r.h);samples were used without any special pre-conditioning (dry conditions).
• Melt Volume Rate (MVR) was determined with a polymer tester Type D 4004 (Dynisco, Franklin,MA, USA) with the following measuring conditions: - temperature 235 ◦C, - load 5 kg.
3. Results
3.1. Processing Parameters
The elaborated processing parameters for the production of quality-optimized parts from DF-PAand Orgasol-IS are summarized in Figure 5. The processing parameters were assessed by an inspectionof the benchmark parts (see Figure 2) produced and optimized over different iterations. Figure 5 alsodepicts the benchmark parts produced from both polymers with the given settings, to demonstratetheir high resolution regarding the adequate details (explanation see Figure 2, too).
Appl. Sci. 2017, 7, 462 6 of 15
X‐ray diffraction patterns were recorded on a Bruker Nanostar U diffractometer (Bruker AXS,
Karlsruhe, Germany) with Cu Ka radiation (λ = 1.5419 Å) and a VÅNTEC‐2000 MikroGap area
detection system. The powder samples were prepared between two Kapton® films. The
recorded WAXD patterns were analyzed with the evaluation software BRUKER DIFFRAC.EVA
(version 4.1., Bruker AXS, Karlsruhe, Germany).
Mechanical Properties were measured with a standard tensile testing machine (Zwick
GmbH&Co. KG, Ulm, Germany) regarding ISO 527‐1 under controlled environmental
conditions (23 °C/50 r.h); samples were used without any special pre‐conditioning (dry
conditions).
Melt Volume Rate (MVR) was determined with a polymer tester Type D 4004 (Dynisco,
Franklin, MA, USA) with the following measuring conditions: ‐ temperature 235 °C, ‐ load 5 kg.
3. Results
3.1. Processing Parameters
The elaborated processing parameters for the production of quality‐optimized parts from
DF‐PA and Orgasol‐IS are summarized in Figure 5. The processing parameters were assessed by an
inspection of the benchmark parts (see Figure 2) produced and optimized over different iterations.
Figure 5 also depicts the benchmark parts produced from both polymers with the given settings, to
demonstrate their high resolution regarding the adequate details (explanation see Figure 2, too).
Figure 5. Comparison of processing parameters for the production of parts.
In the LS‐process, the energy input regarding the area is defined with the so‐called Andrew
number (An) given in Formula (1) [20].
Andrew number (An) (J/mm2) = laser power (W)/(hatch distance (mm) × scan speed (mm/s)) (1)
It can be clearly recognized from the numbers in Figure 5 that the total energy input for both
materials is distinctly different. An for Orgasol‐IS is two times higher than for DF‐PA. This is
achieved by the lower hatch distance and higher laser power of Orgasol‐IS. The energy input
difference can be explained by the drastically lower part bed temperature for Orgasol‐IS during
Figure 5. Comparison of processing parameters for the production of parts.
In the LS-process, the energy input regarding the area is defined with the so-called Andrewnumber (An) given in Formula (1) [20].
Andrew number (An) (J/mm2) = laser power (W)/(hatch distance (mm) × scan speed (mm/s)) (1)
It can be clearly recognized from the numbers in Figure 5 that the total energy input for bothmaterials is distinctly different. An for Orgasol-IS is two times higher than for DF-PA. This is achievedby the lower hatch distance and higher laser power of Orgasol-IS. The energy input difference can be
Appl. Sci. 2017, 7, 462 7 of 15
explained by the drastically lower part bed temperature for Orgasol-IS during sintering, which was164 ◦C compared to 175 ◦C for DF-PA. The lower the surface temperature of the powder in the partbed, the more energy must by supplied by the laser to melt the polymer. However, the question ofwhere the differences in the part bed temperature arise remains. This is quite unanticipated, as bothmaterials are PA12 and the equilibrium melting point (Tm) for PA12 is 178◦C [21]. So, for DF-PA andOrgasol-IS, an almost similar processing temperature during LS-processing should be expected.
3.2. Thermal Analysis (DSC)
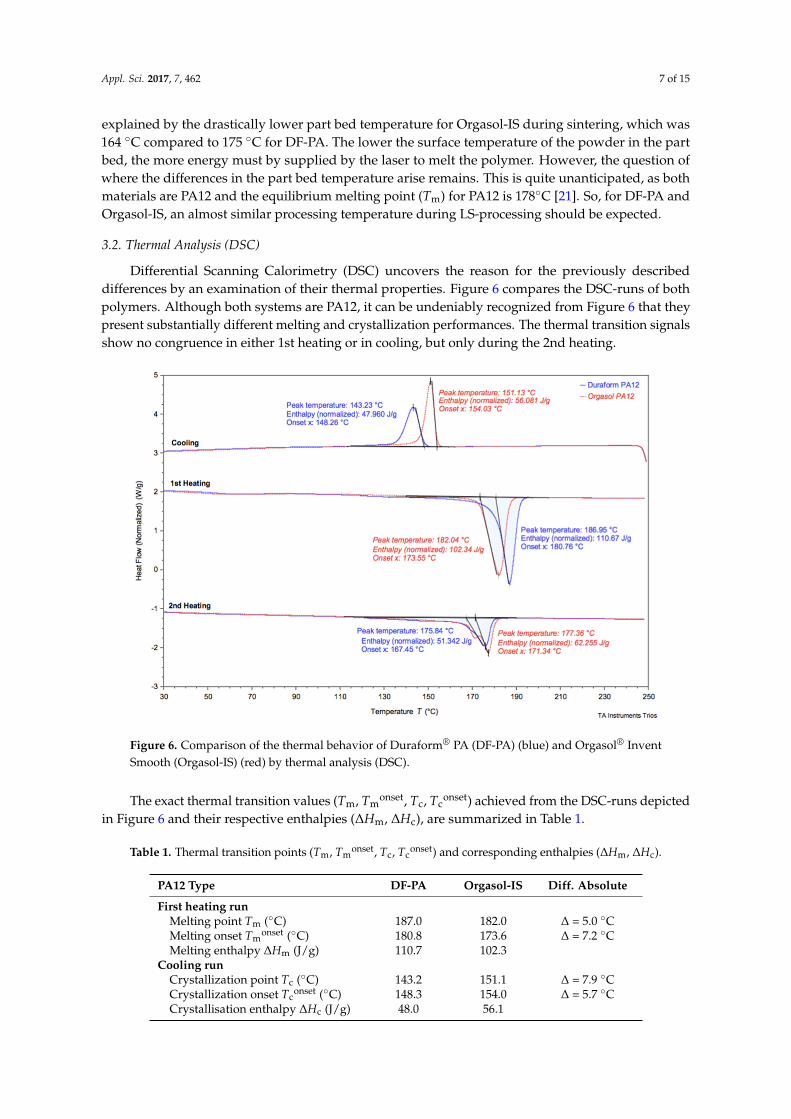
Differential Scanning Calorimetry (DSC) uncovers the reason for the previously describeddifferences by an examination of their thermal properties. Figure 6 compares the DSC-runs of bothpolymers. Although both systems are PA12, it can be undeniably recognized from Figure 6 that theypresent substantially different melting and crystallization performances. The thermal transition signalsshow no congruence in either 1st heating or in cooling, but only during the 2nd heating.
Appl. Sci. 2017, 7, 462 7 of 15
sintering, which was 164 °C compared to 175 °C for DF‐PA. The lower the surface temperature of the
powder in the part bed, the more energy must by supplied by the laser to melt the polymer.
However, the question of where the differences in the part bed temperature arise remains. This is
quite unanticipated, as both materials are PA12 and the equilibrium melting point (Tm) for PA12 is
178°C [21]. So, for DF‐PA and Orgasol‐IS, an almost similar processing temperature during
LS‐processing should be expected.
3.2. Thermal Analysis (DSC)
Differential Scanning Calorimetry (DSC) uncovers the reason for the previously described
differences by an examination of their thermal properties. Figure 6 compares the DSC‐runs of both
polymers. Although both systems are PA12, it can be undeniably recognized from Figure 6 that they
present substantially different melting and crystallization performances. The thermal transition
signals show no congruence in either 1st heating or in cooling, but only during the 2nd heating.
Figure 6. Comparison of the thermal behavior of Duraform® PA (DF‐PA) (blue) and Orgasol® Invent
Smooth (Orgasol‐IS) (red) by thermal analysis (DSC).
The exact thermal transition values (Tm, Tmonset, Tc, Tconset) achieved from the DSC‐runs depicted
in Figure 6 and their respective enthalpies (ΔHm, ΔHc), are summarized in Table 1.
Table 1. Thermal transition points (Tm, Tmonset, Tc, Tconset) and corresponding enthalpies (ΔHm, ΔHc).
PA12 Type DF‐PA Orgasol‐IS Diff. Absolute
First heating run
Melting point Tm (°C) 187.0 182.0 Δ = 5.0 °C
Melting onset Tmonset (°C) 180.8 173.6 Δ = 7.2 °C
Melting enthalpy ΔHm (J/g) 110.7 102.3
Cooling run
Crystallization point Tc (°C) 143.2 151.1 Δ = 7.9 °C
Crystallization onset Tconset 148.3 154.0 Δ = 5.7 °C
Figure 6. Comparison of the thermal behavior of Duraform® PA (DF-PA) (blue) and Orgasol® InventSmooth (Orgasol-IS) (red) by thermal analysis (DSC).
The exact thermal transition values (Tm, Tmonset, Tc, Tc
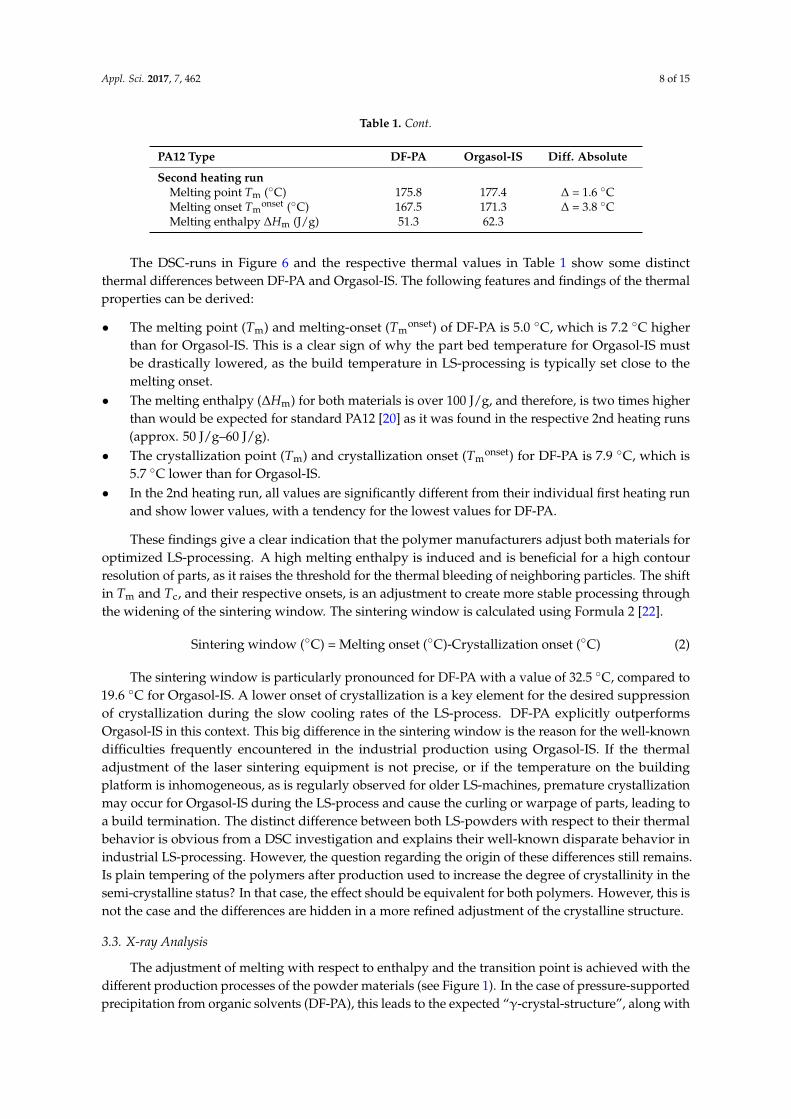
onset) achieved from the DSC-runs depictedin Figure 6 and their respective enthalpies (∆Hm, ∆Hc), are summarized in Table 1.
Table 1. Thermal transition points (Tm, Tmonset, Tc, Tc
onset) and corresponding enthalpies (∆Hm, ∆Hc).
PA12 Type DF-PA Orgasol-IS Diff. Absolute
First heating runMelting point Tm (◦C) 187.0 182.0 ∆ = 5.0 ◦CMelting onset Tm
onset (◦C) 180.8 173.6 ∆ = 7.2 ◦CMelting enthalpy ∆Hm (J/g) 110.7 102.3
Cooling runCrystallization point Tc (◦C) 143.2 151.1 ∆ = 7.9 ◦CCrystallization onset Tc
onset (◦C) 148.3 154.0 ∆ = 5.7 ◦CCrystallisation enthalpy ∆Hc (J/g) 48.0 56.1
Appl. Sci. 2017, 7, 462 8 of 15
Table 1. Cont.
PA12 Type DF-PA Orgasol-IS Diff. Absolute
Second heating runMelting point Tm (◦C) 175.8 177.4 ∆ = 1.6 ◦CMelting onset Tm
onset (◦C) 167.5 171.3 ∆ = 3.8 ◦CMelting enthalpy ∆Hm (J/g) 51.3 62.3
The DSC-runs in Figure 6 and the respective thermal values in Table 1 show some distinctthermal differences between DF-PA and Orgasol-IS. The following features and findings of the thermalproperties can be derived:
• The melting point (Tm) and melting-onset (Tmonset) of DF-PA is 5.0 ◦C, which is 7.2 ◦C higher
than for Orgasol-IS. This is a clear sign of why the part bed temperature for Orgasol-IS mustbe drastically lowered, as the build temperature in LS-processing is typically set close to themelting onset.
• The melting enthalpy (∆Hm) for both materials is over 100 J/g, and therefore, is two times higherthan would be expected for standard PA12 [20] as it was found in the respective 2nd heating runs(approx. 50 J/g–60 J/g).
• The crystallization point (Tm) and crystallization onset (Tmonset) for DF-PA is 7.9 ◦C, which is
5.7 ◦C lower than for Orgasol-IS.• In the 2nd heating run, all values are significantly different from their individual first heating run
and show lower values, with a tendency for the lowest values for DF-PA.
These findings give a clear indication that the polymer manufacturers adjust both materials foroptimized LS-processing. A high melting enthalpy is induced and is beneficial for a high contourresolution of parts, as it raises the threshold for the thermal bleeding of neighboring particles. The shiftin Tm and Tc, and their respective onsets, is an adjustment to create more stable processing throughthe widening of the sintering window. The sintering window is calculated using Formula 2 [22].
Sintering window (◦C) = Melting onset (◦C)-Crystallization onset (◦C) (2)
The sintering window is particularly pronounced for DF-PA with a value of 32.5 ◦C, compared to19.6 ◦C for Orgasol-IS. A lower onset of crystallization is a key element for the desired suppressionof crystallization during the slow cooling rates of the LS-process. DF-PA explicitly outperformsOrgasol-IS in this context. This big difference in the sintering window is the reason for the well-knowndifficulties frequently encountered in the industrial production using Orgasol-IS. If the thermaladjustment of the laser sintering equipment is not precise, or if the temperature on the buildingplatform is inhomogeneous, as is regularly observed for older LS-machines, premature crystallizationmay occur for Orgasol-IS during the LS-process and cause the curling or warpage of parts, leading toa build termination. The distinct difference between both LS-powders with respect to their thermalbehavior is obvious from a DSC investigation and explains their well-known disparate behavior inindustrial LS-processing. However, the question regarding the origin of these differences still remains.Is plain tempering of the polymers after production used to increase the degree of crystallinity in thesemi-crystalline status? In that case, the effect should be equivalent for both polymers. However, this isnot the case and the differences are hidden in a more refined adjustment of the crystalline structure.
3.3. X-ray Analysis
The adjustment of melting with respect to enthalpy and the transition point is achieved with thedifferent production processes of the powder materials (see Figure 1). In the case of pressure-supportedprecipitation from organic solvents (DF-PA), this leads to the expected “γ-crystal-structure”, along with

Appl. Sci. 2017, 7, 462 9 of 15
a “α-crystal-structure” [23]. This is unusual for thermally treated PA12; however, this combination ofcrystalline structures has a great influence on the thermal behavior of the powder.
Figure 7 depicts the Wide-Angle X-Ray Scattering-analysis (WAXD) of both powders in a virginstate. The differences are obvious at a distribution angle (2Θ) between 20◦ and 25◦, as seen in Figure 7.The signal for DF-PA is much broader and pronounced compared to Orgasol–IS. Due to the formationof the α-crystalline-structure during the precipitation of DF-PA, the area for the XRD-signal is muchwider and indicates a higher crystallinity [24].
Appl. Sci. 2017, 7, 462 9 of 15
PA12; however, this combination of crystalline structures has a great influence on the thermal
behavior of the powder.
Figure 7 depicts the Wide‐Angle X‐Ray Scattering‐analysis (WAXD) of both powders in a virgin
state. The differences are obvious at a distribution angle (2Θ) between 20° and 25°, as seen in Figure
7. The signal for DF‐PA is much broader and pronounced compared to Orgasol–IS. Due to the
formation of the α‐crystalline‐structure during the precipitation of DF‐PA, the area for the
XRD‐signal is much wider and indicates a higher crystallinity [24].
Figure 7. X‐ray diffraction (XRD) patterns of Orgasol‐IS and DF‐PA.
The distinct melting behaviors can be related to different crystalline structures, since an
additional tempering step is carried out to obtain higher values for crystallization enthalpy (ΔHm)
compared to “Standard‐PA12” (see Table 1). Furthermore, the melting point of a polymer depends
on the thickness of the crystalline lamellae (lc), as described by the Gibbs‐Thomson‐Equation [25].
The more monomeric units that are present between the lamellae of a single crystal, the higher the
lateral spread and the intrinsic energy become, resulting in a higher melting point. The precipitation
process of DF‐PA may also induce larger lamella structures with higher melting points. In general,
the different production processes for both PA12 LS‐polymers largely influence their thermal
behaviors. The precipitation process for DF‐PA obviously offers more possibilities to influence its
crystalline structure, in a positive sense regarding LS‐processing, by the formation of an additional
α‐phase and the increase of the lamellae dimensions.
3.4. Powder Size Distribution
Besides the thermal and crystalline differences described so far, both materials also present a
different powder size distribution. This can be observed in Figure 1. A refined analysis of these
differences can be found in Figure 8. A comparison of the scattering for both powders is presented
regarding their respective volume distributions, achieved with laser diffraction measurements. The
visual impression of Figure 1 is confirmed. Orgasol‐IS has smaller particles and a narrower
distribution than DF‐PA, as confirmed by the numbers issued from the laser diffraction test
presented in Figure 8.
The smaller particle size distribution of Orgasol‐IS, in combination with the visually identified
higher sphericity of the particles (Figure 1), should lead to a higher packing density of the powder
Figure 7. X-ray diffraction (XRD) patterns of Orgasol-IS and DF-PA.
The distinct melting behaviors can be related to different crystalline structures, since an additionaltempering step is carried out to obtain higher values for crystallization enthalpy (∆Hm) compared to“Standard-PA12” (see Table 1). Furthermore, the melting point of a polymer depends on the thicknessof the crystalline lamellae (lc), as described by the Gibbs-Thomson-Equation [25]. The more monomericunits that are present between the lamellae of a single crystal, the higher the lateral spread and theintrinsic energy become, resulting in a higher melting point. The precipitation process of DF-PA mayalso induce larger lamella structures with higher melting points. In general, the different productionprocesses for both PA12 LS-polymers largely influence their thermal behaviors. The precipitationprocess for DF-PA obviously offers more possibilities to influence its crystalline structure, in a positivesense regarding LS-processing, by the formation of an additional α-phase and the increase of thelamellae dimensions.
3.4. Powder Size Distribution
Besides the thermal and crystalline differences described so far, both materials also present adifferent powder size distribution. This can be observed in Figure 1. A refined analysis of thesedifferences can be found in Figure 8. A comparison of the scattering for both powders is presentedregarding their respective volume distributions, achieved with laser diffraction measurements.The visual impression of Figure 1 is confirmed. Orgasol-IS has smaller particles and a narrowerdistribution than DF-PA, as confirmed by the numbers issued from the laser diffraction test presentedin Figure 8.
The smaller particle size distribution of Orgasol-IS, in combination with the visually identifiedhigher sphericity of the particles (Figure 1), should lead to a higher packing density of the powder

Appl. Sci. 2017, 7, 462 10 of 15
(the investigations on the exact sphericity are to be published elsewhere soon). This is the case andcan be found in the material specification data sheets of the powder producers. For Orgasol-IS, a bulkpacked density of 0.55 g/cm3 regarding ISO 1068-1975 is given, while DF-PA shows a bulk packeddensity of 0.53 g/cm3 (own measurement). This is an additional effect, explaining a higher An inthe processing of Orgasol-IS (see Figure 5). A higher powder packing density should lead, as afirst consequence, to LS-parts with a higher part density, and this, in turn, would lead to improvedmechanical properties.
Appl. Sci. 2017, 7, 462 10 of 15
(the investigations on the exact sphericity are to be published elsewhere soon). This is the case and
can be found in the material specification data sheets of the powder producers. For Orgasol‐IS, a
bulk packed density of 0.55 g/cm3 regarding ISO 1068‐1975 is given, while DF‐PA shows a bulk
packed density of 0.53 g/cm3 (own measurement). This is an additional effect, explaining a higher An
in the processing of Orgasol‐IS (see Figure 5). A higher powder packing density should lead, as a
first consequence, to LS‐parts with a higher part density, and this, in turn, would lead to improved
mechanical properties.
Figure 8. Comparison of volume distribution of DF‐PA and Orgasol‐IS by laser diffraction.
3.5. Mechanical Properties and Anisotropy
The mechanical properties summarized in Table 2 were achieved by the investigation of parts
described in Section 2. All parts were produced and randomly distributed in the LS build chamber of
the said DTM machine per Figure 3, with the build parameters given in Figure 5. In order to have a
better overview of the data for the present study (the data rows are named “present work” in Table
2), the results are compared with data from the powder producers presented in their respective
“Material Data Sheet (MDS)”.
Table 2. Results of the tensile and impact tests for Duraform® PA (DF‐PA) and Orgasol® Invent
Smooth (Orgasol‐IS) in different orientations and compared with data from the Material Data Sheet
(MDS) * of powder suppliers.
Value Unit Duraform® PA Orgasol® Invent Smooth
MDS * Present Work MDS * Present Work
build direction XYZ XYZ ZXY XYZ XYZ ZXY
Young’s modulus MPa 1586 1675 ± 41 1610 ± 61 1800 1700 ± 25 1580 ± 21
ISO‐527‐1
Tensile strength MPa 43 47.6 ± 1.5 40.6 ± 3.4 45 51.7 ± 0.7 29.3 ± 3.6
ISO‐527‐1
Elongation at break % 14 6.6 ± 0.7 3.7 ± 0.6 20 12.0 ± 0.4 1.9 ± 0.3
ISO‐527‐1
Charpy un‐notched kJ/m2 ‐ 32.3 ± 2.6 10.2 ± 2.0 34 34.6 ± 2.0 2.8 ± 0.7
ISO 197 1eU
Charpy notched kJ/m2 ‐ 2.0 ± 0.5 2.1 ± 0.1 ‐ 2.6 ± 0.5 1.3 ± 0.2
ISO 197 1eA
* MDS = material data sheets of powder producers.
Figure 8. Comparison of volume distribution of DF-PA and Orgasol-IS by laser diffraction.
3.5. Mechanical Properties and Anisotropy
The mechanical properties summarized in Table 2 were achieved by the investigation of partsdescribed in Section 2. All parts were produced and randomly distributed in the LS build chamberof the said DTM machine per Figure 3, with the build parameters given in Figure 5. In order tohave a better overview of the data for the present study (the data rows are named “present work” inTable 2), the results are compared with data from the powder producers presented in their respective“Material Data Sheet (MDS)”.
Table 2. Results of the tensile and impact tests for Duraform®PA (DF-PA) and Orgasol®Invent Smooth(Orgasol-IS) in different orientations and compared with data from the Material Data Sheet (MDS) * ofpowder suppliers.
Value UnitDuraform® PA Orgasol® Invent Smooth
MDS * Present Work MDS * Present Work
build direction XYZ XYZ ZXY XYZ XYZ ZXY
Young’s modulusMPa 1586 1675 ± 41 1610 ± 61 1800 1700 ± 25 1580 ± 21ISO-527-1
Tensile strengthMPa 43 47.6 ± 1.5 40.6 ± 3.4 45 51.7 ± 0.7 29.3 ± 3.6ISO-527-1
Elongation at break% 14 6.6 ± 0.7 3.7 ± 0.6 20 12.0 ± 0.4 1.9 ± 0.3ISO-527-1
Charpy un-notchedkJ/m2 - 32.3 ± 2.6 10.2 ± 2.0 34 34.6 ± 2.0 2.8 ± 0.7ISO 197 1eU
Charpy notchedkJ/m2 - 2.0 ± 0.5 2.1 ± 0.1 - 2.6 ± 0.5 1.3 ± 0.2ISO 197 1eA
* MDS = material data sheets of powder producers.

Appl. Sci. 2017, 7, 462 11 of 15
The following comments and conclusions can be derived from Table 2:
• The XYZ-orientation of the values of this work match relatively well with the MDS values forYoung’s modulus and tensile strength. This can be expected, as these values are material inherentto a great extent.
• For Elongation at the break in the XYZ-direction, only about half of the published value wasachieved. This could be due to applying high-resolution build parameters for this study.Published mechanical data will be achieved most likely with property optimized build settings.
• For the Charpy measurements, there is only one MDS value published: 34 kJ/m2 for un-notchedOrgasol-IS. As this value is consistent with this study’s measured value, it is assumed that allCharpy data for the XYZ-direction also lie in the expected range.
So, for the XYZ-direction, all measured values are truthful compared to MDS-data. In orderto reveal the anisotropy of the parts, an analysis for the XYZ- and ZXY-direction data leads to thefollowing statements:
• For tensile strength, DF-PA remains at nearly the same level, while Orgasol-IS drops to almosthalf the value.
• For Elongation at the break, the drop for DF-PA is about 50%, whilst Orgasol-IS loses 85% of theinitial magnitude.
• Finally, in the case of the Charpy tests (un-notched and notched) for Orgasol-IS, the loss of stabilityin the ZXY-direction is drastic in comparison to DF-PA.
In summary, this means that Orgasol–IS is much more affected by anisotropic mechanicalproperties than DF-PA.
As LS is a layer-by-layer technology, the weak point in the microstructure of the parts is theboundary between the layers. Based on the mechanical test results, this means that layer adhesion forOrgasol-IS is largely reduced. A sufficient isotropy during the sintering process can be achieved bya good interconnection of the polymer melt at the layer interface, through sufficient polymer chainentanglement. These diffusion-driven effects are correlated with the polymer melt viscosity.
3.6. Melt Viscosity and Chain Termination
In a first and very simple approach, the melt viscosity of polymers can be determined byMVR (Melt-Volume-Rate) measurements. If Orgasol-IS and DF-PA are measured in a virgin state,the following values are obtained: MVR (DF-PA): approx. 60 g/cm3 and MVR (Orgasol-IS): approx.15 g/cm3 (measurements are performed with: 235 ◦C/5 kg). This large difference in viscosity is a clearindication that polymer interdiffusion for Orgasol-IS is reduced, as a lower MVR-value means a higherviscosity. A restrained mixing of molten polymer, and consequently, limited chain entanglement at thelayer boundaries of the LS-parts, would be the likely consequence.
However, there exists a second effect on a molecular level influencing the inter-layer bonding forthese polymers. The synthesis of PA12 is technically accomplished by the ring opening polyadditionof lauryl lactam. The principle of the sequence of the reaction is presented in Figure 9 (deprived ofstoichiometric correctness). This figure schematically depicts what can be controlled regarding theend-groups during the course of polyaddition.

Appl. Sci. 2017, 7, 462 12 of 15Appl. Sci. 2017, 7, 462 12 of 15
Figure 9. Polyaddition of lauryl lactam with or without end‐group regulation.
If the end‐groups are chemically terminated, a polymer with a defined chain length is achieved,
resulting in a fixed melt viscosity. On the contrary, if the end‐groups are unregulated, it results in a
still reactive polymer with chains that can be extended under suitable conditions like those
encountered in LS, by the reaction of remaining end groups (post‐condensation). For LS‐polymers,
this means that if end‐groups are still active, they can strongly support the process of layer adhesion
by post‐condensation in the interdiffusion zone of evolving LS‐parts. A better layer‐adhesion and
reduced anisotropy of LS‐parts is the result.
A melt viscosity check (MVR) helps to verify the presence of an active chain end polymer. If
DF‐PA powder is extracted from the LS‐process and subjected to MVR‐measurement after a few
process loops, the MVR of DF‐PA is drastically reduced to values lower than 20 g/cm3. At the same
time, MVR‐values of Orgasol‐IS remain almost unchanged after several loops. In conclusion, the
enhanced isotropy of the DF‐PA parts can be explained by two effects:
DF‐PA starts in a low viscous status, with a high flowability of melt that leads to a good
interdiffusion in the boundary‐zone of progressing LS‐parts.
In the zone of interdiffusion, post‐condensation takes place and gives the parts additional
stability in the overlapping zone by covalent bonding.
3.7. Surface Roughness
Considering the pronounced difference in the particle shape in Figure 1, it can be expected that
the more homogeneous morphology of Orgasol‐IS particles and their narrower size distribution
(Figure 8) result in a much smoother surface of LS‐parts. This corresponds to the long‐lasting rumor
in the LS‐community that Orgasol‐IS parts exhibit better, more precise, and smoother surfaces.
To confirm or disprove this idea, the surface roughness of respective parts (tensile bars) was
investigated with GelSight. The orientation of the surface in the LS‐process is taken into account:
“up‐face”, “down‐face”, or the vertical walls due to the layer‐wise building process and their
orientation in the building envelope. Figure 10 depicts the received height maps of the different
samples and the respective values for the area roughness parameter Sq (root mean square height
roughness) and Sa (average height roughness) evaluated over the complete 3D surface, respectively.
The field of view of the area measured is 5 mm × 7.5 mm.
Figure 9. Polyaddition of lauryl lactam with or without end-group regulation.
If the end-groups are chemically terminated, a polymer with a defined chain length is achieved,resulting in a fixed melt viscosity. On the contrary, if the end-groups are unregulated, it resultsin a still reactive polymer with chains that can be extended under suitable conditions like thoseencountered in LS, by the reaction of remaining end groups (post-condensation). For LS-polymers,this means that if end-groups are still active, they can strongly support the process of layer adhesionby post-condensation in the interdiffusion zone of evolving LS-parts. A better layer-adhesion andreduced anisotropy of LS-parts is the result.
A melt viscosity check (MVR) helps to verify the presence of an active chain end polymer. If DF-PApowder is extracted from the LS-process and subjected to MVR-measurement after a few processloops, the MVR of DF-PA is drastically reduced to values lower than 20 g/cm3. At the same time,MVR-values of Orgasol-IS remain almost unchanged after several loops. In conclusion, the enhancedisotropy of the DF-PA parts can be explained by two effects:
• DF-PA starts in a low viscous status, with a high flowability of melt that leads to a goodinterdiffusion in the boundary-zone of progressing LS-parts.
• In the zone of interdiffusion, post-condensation takes place and gives the parts additional stabilityin the overlapping zone by covalent bonding.
3.7. Surface Roughness
Considering the pronounced difference in the particle shape in Figure 1, it can be expected that themore homogeneous morphology of Orgasol-IS particles and their narrower size distribution (Figure 8)result in a much smoother surface of LS-parts. This corresponds to the long-lasting rumor in theLS-community that Orgasol-IS parts exhibit better, more precise, and smoother surfaces.
To confirm or disprove this idea, the surface roughness of respective parts (tensile bars) wasinvestigated with GelSight. The orientation of the surface in the LS-process is taken into account:“up-face”, “down-face”, or the vertical walls due to the layer-wise building process and their orientationin the building envelope. Figure 10 depicts the received height maps of the different samples and therespective values for the area roughness parameter Sq (root mean square height roughness) and Sa(average height roughness) evaluated over the complete 3D surface, respectively. The field of view ofthe area measured is 5 mm × 7.5 mm.

Appl. Sci. 2017, 7, 462 13 of 15Appl. Sci. 2017, 7, 462 13 of 15
Figure 10. Comparison of surfaces from different part orientations of DF‐PA and Orgasol‐IS.
With the presented surface measurements, it can be shown that for the two surface roughness
parameters, Sa and Sq, and for all investigated part directions, the values are better, i.e. lower for
Orgasol‐IS compared to DF‐PA. Especially the bottom surface (corresponding to the first sintered
layer of a part) seems to be significantly improved for Orgasol‐IS. The surfaces are typically
investigated through hand rubbing to get an impression of the part’s haptic. So, the analytical
investigations with GelSight confirm the subjective rating that Orgasol‐IS‐parts exhibit smoother
surfaces and connect it, for the first time, with the reproducible analytical data and measurements
required to further optimize surface analyses for LS‐parts.
4. Discussion
Table 3 summarizes the considered features for both investigated polymers DF‐PA and
Orgasol‐IS in some key words and depicts several prominent findings in this connection. In general,
the manufacturers of PA12 improve their polymers for their use in LS regarding several properties.
However, the companies Evonik and Arkema have different strategies to adjust their materials
marketed as Duraform® PA and Orgasol® Invent Smooth for the laser sintering process. Principally
due to the different production technologies, they supply materials with different particle size
distributions and particle shapes, which have severe influences on the processing, packing density,
and surface roughness of the parts. The thermal situation is controlled through the different
production processes. The melting and crystallization of both materials is adjusted for a good and
stable behavior during LS‐processing. However, the precipitation process offers better possibilities
to fine‐tune the crystalline structure of the polymer and DF‐PA presents a much larger sintering
window, resulting in a better and more forgiving processing behavior.
The biggest advantage of DF‐PA can be identified in the improved homogenous mechanical
properties of the LS‐parts in all directions. The anisotropy for Orgasol‐IS is pronounced and LS‐part
producers (service bureaus) must be aware of this fact. However, the regulated viscosity of
Orgasol‐IS leads to reduced powder “aging” (post‐condensation), which is beneficial from an
economical point of view because the refresh rate is about 10% (statement of producer), and is thus
much lower than for DF‐PA (refresh rate from 30% to 50%). Moreover, Orgasol‐IS typically supplies
parts with smoother surfaces, with a higher detailing grade due to the more homogenous particles.
Figure 10. Comparison of surfaces from different part orientations of DF-PA and Orgasol-IS.
With the presented surface measurements, it can be shown that for the two surface roughnessparameters, Sa and Sq, and for all investigated part directions, the values are better, i.e. lower forOrgasol-IS compared to DF-PA. Especially the bottom surface (corresponding to the first sintered layerof a part) seems to be significantly improved for Orgasol-IS. The surfaces are typically investigatedthrough hand rubbing to get an impression of the part’s haptic. So, the analytical investigations withGelSight confirm the subjective rating that Orgasol-IS-parts exhibit smoother surfaces and connect it,for the first time, with the reproducible analytical data and measurements required to further optimizesurface analyses for LS-parts.
4. Discussion
Table 3 summarizes the considered features for both investigated polymers DF-PA andOrgasol-IS in some key words and depicts several prominent findings in this connection. In general,the manufacturers of PA12 improve their polymers for their use in LS regarding several properties.However, the companies Evonik and Arkema have different strategies to adjust their materialsmarketed as Duraform® PA and Orgasol® Invent Smooth for the laser sintering process. Principally dueto the different production technologies, they supply materials with different particle size distributionsand particle shapes, which have severe influences on the processing, packing density, and surfaceroughness of the parts. The thermal situation is controlled through the different production processes.The melting and crystallization of both materials is adjusted for a good and stable behavior duringLS-processing. However, the precipitation process offers better possibilities to fine-tune the crystallinestructure of the polymer and DF-PA presents a much larger sintering window, resulting in a better andmore forgiving processing behavior.
The biggest advantage of DF-PA can be identified in the improved homogenous mechanicalproperties of the LS-parts in all directions. The anisotropy for Orgasol-IS is pronounced and LS-partproducers (service bureaus) must be aware of this fact. However, the regulated viscosity of Orgasol-ISleads to reduced powder “aging” (post-condensation), which is beneficial from an economical point ofview because the refresh rate is about 10% (statement of producer), and is thus much lower than forDF-PA (refresh rate from 30% to 50%). Moreover, Orgasol-IS typically supplies parts with smoothersurfaces, with a higher detailing grade due to the more homogenous particles.

Appl. Sci. 2017, 7, 462 14 of 15
Table 3. Summary of the main features of laser sintering (LS)-powders and characteristic influences onparts and processing.
Feature Duraform® PA Orgasol® Invent Smooth
production precipitation direct polymerisation
particle shape “potato”→ compromise regarding flowability
Spherical→more detailed parts→ better part surfaces
thermal situationlarge sintering window→ easier processingCrystal-size and structure!
needs homogeneous and stablethermal conditions during processing
powder distribution Broad→medium powder flowability
Narrow→ high powder flowability→ better powder packing density
chain termination
open chains→ easy flowing melt→ enhanced properties due to“post-condensation”
Blocked→ less powder “ageing”(economic)
mechanical properties increased homogeneity in all directions pronounced drop in z-direction(anisotropy)
5. Conclusions
Regarding the production of LS-parts, adopters of this technology can work with two principalsolutions for PA 12 standard material. The first is the precipitated “Vestosint”, and the second is thedirectly polymerized “Orgasol” powder. The choice will generate differences and has consequencesfor the LS-process and LS-parts. Users with a higher demand for better surfaces gain benefits fromusing Orgasol-IS; however, this concurrently means that they must have a more precise control of thethermal situation in their machine because of the reduced sintering window. Due to the controlledviscosity of Orgasol-IS, a further advantage of this material can be realized from a commercial point ofview, as the production powder can be set to a much lower refreshing rate.
If the enhanced mechanical properties in all spatial directions are the prominent issue for thedesired LS-parts, the producer should use DF-PA. The easier processing of this powder is due to thesignificantly larger sintering window, forgiving more mistakes during processing, and accepts higherthermal instabilities in (older) LS-equipment.
Acknowledgments: The authors are grateful to Michael Schneider from irpd AG for producing the partsin an industrial environment and supplying all his technical know-how in producing high-quality LS-parts.Other thanks go to Leonardo Scardigno who performed some of the presented measurements. Finally, a bigthanks goes to Felix Reifler from Empa for performing the X-ray analysis.
Author Contributions: Manfred Schmid initiated the investigation, planned and conducted the trials, and wrotethe paper. Rob Kleijnen measured and deduced the thermal investigations and the particle size distribution,and performed the mechanical measurements. Marc Vetterli performed the surface roughness measurements ofLS-parts and interpreted the respective results. Konrad Wegener is supervisor of the group, initiated the idea ofmaterial comparison in this way, and gave valuable input on all steps of the study progress.
Conflicts of Interest: The authors declare no conflict of interest. Inspire icams is an independent research institutein Switzerland with no subjection to any of the mentioned commercial products or companies.
References
1. Sutton, A.; Kriewall, C.; Leu, M.; Newkirk, J. Powder characterisation techniques and effects of powdercharacteristics on part properties in powder-bed fusion processes. Virtual Phys. Prototyp. 2017, 12, 3–29.[CrossRef]
2. Monzón, M.; Hernández, P.; Benítez, A.; Marrero, M.; Fernández, A. Predictability of Plastic Parts BehaviourMade from Rapid Manufacturing. Tsinghua Sci. Technol. 2009, 14, 100–107. [CrossRef]
Appl. Sci. 2017, 7, 462 15 of 15
3. Gibson, I.; Shi, D. Material properties and fabrication parameters in selective laser sintering process.Rapid Prototyp. J. 1997, 3, 129–136. [CrossRef]
4. Williams, J.D.; Deckard, C.R. Advances in modelling the effects of selected parameters on the SLS process.Rapid Prototyp. J. 1998, 4, 90–100. [CrossRef]
5. Zarringhalam, H.; Hopkinson, N.; Kamperman, N.; de Vlieger, J. Effects of processing on microstructure andproperties of SLS Nylon 12. Mat. Sci. Eng. A 2006, 435–436, 172–180. [CrossRef]
6. Caulfield, B.; McHugh, P.E.; Lohfeld, S. Dependence of mechanical properties of polyamide components onbuild parameters in the SLS process. J. Mat. Proc. Tech. 2007, 182, 477–488. [CrossRef]
7. Majewski, C.; Zarringhalam, H.; Hopkinson, N. Effect of the degree of particle melt on mechanical propertiesin selective laser-sintered Nylon-12 parts. Proc. Inst. Mech. Eng. Part B J. Eng. Manuf. 2008, 222, 1055–1064.[CrossRef]
8. Jain, P.K.; Pandey, P.M.; Rao, P.V.M. Experimental Investigations for Improving Part Strength in SelectiveLaser Sintering. Virtual Phys. Prototyp. 2008, 3, 177–188. [CrossRef]
9. Starr, T.L.; Gornet, T.J.; Usher, J.S. The effect of process conditions on mechanical properties of laser-sinterednylon. Rapid Prototyp. J. 2011, 17, 418–423. [CrossRef]
10. Dupin, S.; Lame, O.; Barres, C.; Charmeau, J.-Y. Microstructural origin of physical and mechanical propertiesof polyamide 12 processed by laser sintering. Eur. Polym. J. 2012, 48, 1611–1618. [CrossRef]
11. Bourell, D.L.; Watt, T.J.; Lee, D.K.; Fulcher, B. Performance limitations in polymer laser sintering.Phys. Procedia 2014, 56, 147–156. [CrossRef]
12. Wegner, A.; Witt, G. Correlation of process parameters and part properties in laser sintering using responsesurface modeling. Phys. Procedia 2012, 39, 480–490. [CrossRef]
13. Wegner, A.; Witt, G. Machine-Related Dependence of Optimal Process Parameter Settings during LaserSintering of Different Thermoplastics. In Proceedings of the RapidTech, Erfurt, Germany, 14–16 June 2016;pp. 90–94.
14. Orgasol® Powders–Ultra-Fine Polyamide Powders. Available online: http://www.orgasolpowders.com(accessed on 2 April 2017).
15. Vestosint® Polyamide 12 Powders for Perfection. Available online: http://www.vestosint.com (accessed on2 April 2017).
16. Scholten, H.; Christoph, W. Use of Nylon-12 for Selctive Laser Sintering. U.S. Patent 6,245,281 B1,12 June 2001.
17. Loyen, K.; Senff, H.; Pauly, F.-X. Verfahren zur Herstellung von Hochschmelzenden Polyamid 12 Pulvern,Arkema (F). Patent EP 1,571,173 B1, 28 February 2005.
18. Mayer, K.-R.; Hornung, K.-H.; Feldmann, R.; Smigerski, H.-J. Verfahren zur Herstellung von PulverförmigenBeschichtungsmitteln auf der Basis von Polyamiden mit Mindestens 10 Aliphatisch GebundenenKohlenstoffatomen pro Carbonamidgrupps. Patent DE 29,06,647, 17 April 1980.
19. Gaboriau, Ch.; Senff, H. Method for Preparing Polyamide Powder by Anionic Polymerisation.Patent WO002008087335A2, 24 July 2008.
20. Nelson, J.C. Selective Laser Sintering: A Definition of the Process and an Empirical Sintering Model.Ph.D. Dissertation, University of Texas, Austin, TX, USA, 1993.
21. Brandrup, J.; Immergut, E.H.; Grulke, E.A. (Eds.) Polymer Handbook, 4th ed.; John Wiley & Sons: Hoboken,NJ, USA, 1999.
22. Kruth, J.-P.; Levy, G.; Klocke, F.; Childs, T.H.C. Consolidation phenomena in laser and powder-bed basedlayered manufacturing. CIRP Ann. Manuf. Technol. 2007, 56, 730–759. [CrossRef]
23. Ishikawa, T.; Nagai, S.; Kasai, N. Effect of casting conditions on Polymorphism of Nylon-12. J. Polym. Sci.Polym. Phys. Ed. 1980, 18, 291–299. [CrossRef]
24. Plummer, C.; Zanetto, J.-E.; Bourban, P.-E.; Manson, J.-A.E. The crystallisation kinetics of polyamide-12.Colloid Polym. Sci. 2001, 279, 312–322. [CrossRef]
25. Lippits, D.R.; Rastogi, S.; Höhne, G.W.H. Melting kinetics in polymers. Phys. Rev. Lett. 2006, 218303, 96.[CrossRef] [PubMed]
© 2017 by the authors. Licensee MDPI, Basel, Switzerland. This article is an open accessarticle distributed under the terms and conditions of the Creative Commons Attribution(CC BY) license (http://creativecommons.org/licenses/by/4.0/).