INFLUENCE OF THE INCOME FACTOR IN THE MUNICIPAL SOLID ...
15
INFLUENCE OF THE INCOME FACTOR IN THE MUNICIPAL SOLID WASTE SELECTIVE COLLECTION Gallardo, A.; Carlos, M.; Colomer F.J.; Gómez-Parra A., Edo-Alcón N. Antonio Gallardo: Ph. D. Professor. Dept. Mechanical Engineering and Construction. Jaume I University, Av. de VicentSosBaynat s/n. 12071 Castelló de la Plana, Spain. E- mail [email protected] Mar Carlos (Corresponding Author): Ph. D. Professor. Dept. Mechanical Engineering and Construction. Jaume I University, Av. de VicentSosBaynat s/n. 12071 Castelló de la Plana, Spain. E-mail [email protected]. Tel. +34 964728114. Francisco J. Colomer: Ph. D.. Professor. Dept. Mechanical Engineering and Construction. Jaume I University, Av. de VicentSosBaynat s/n. 12071 Castelló de la Plana, Spain. E-mail [email protected] Ana M. Gómez-Parra: Ph. D. Researcher. Dept. Mechanical Engineering and Construction. Jaume I University, Av. de VicentSosBaynat s/n. 12071 Castelló de la Plana, Spain. E-mail [email protected] Natalia Edo-Alcon: Researcher. Dept. Mechanical Engineering and Construction. Jaume I University, Av. de Vicent Sos Baynat s/n. 12071 Castelló de la Plana, Spain. E-mail [email protected].. Abstract There are several factors, such as physical, geographical, socio-cultural, economic and political factors, which have an influence in the selective collection of the municipal solid waste (MSW). To define a selective collection system of MSW the waste generation pattern of the town should be firstly determined. In this way, the before mentioned factors need to be analysed in depth. This paper tries to analyse specifically the economic income level in order to determine actions to improve the waste management plan of a town. This research work includes three stages. In the first stage, waste samples of the light-packaging containers were collected in two zones of the town with different economic characteristics. The samples were collected in different seasons during one year to detect possible variations in the composition of the waste. In the second stage, the samples were characterized at the laboratory to define the composition and quality of the waste. It was firstly separated into four fractions: metals, plastic, brik and inappropriate. The inappropriate fraction was in its turn separated into cardboard, rubber and leather, inert waste, organic matter, paper, hazardous waste, clothes and shoes, glass and others. The plastic fraction was also separated into five type of plastics and the metal fraction into three. Finally, in the third stage, the data have been analyzed and conclusions have been extracted. One of the main results is that the zone with a higher income collects selectively more quantity of paper and cardboard and light- packaging with the same logistic and information conditions. Another conclusion was that the quality of the waste collected in these zones was similar. The methodology exposed in this work can be extrapolated to other towns with similar characteristics. Otherwise, it will be useful when implementing a system to collect the waste selectively and especially to develop actions to achieve a good participation of everybody in the waste collection system. Key words: Income, waste, selective collection, characterization, quality.
Transcript of INFLUENCE OF THE INCOME FACTOR IN THE MUNICIPAL SOLID ...

INFLUENCE OF THE INCOME FACTOR IN THE MUNICIPAL SOLID
WASTE SELECTIVE COLLECTION Gallardo, A.; Carlos, M.; Colomer F.J.; Gómez-Parra A., Edo-Alcón N.
Antonio Gallardo: Ph. D. Professor. Dept. Mechanical Engineering and Construction.
Jaume I University, Av. de VicentSosBaynat s/n. 12071 Castelló de la Plana, Spain. E-
mail [email protected]
Mar Carlos (Corresponding Author): Ph. D. Professor. Dept. Mechanical Engineering
and Construction. Jaume I University, Av. de VicentSosBaynat s/n. 12071 Castelló de
la Plana, Spain. E-mail [email protected]. Tel. +34 964728114.
Francisco J. Colomer: Ph. D.. Professor. Dept. Mechanical Engineering and
Construction. Jaume I University, Av. de VicentSosBaynat s/n. 12071 Castelló de la
Plana, Spain. E-mail [email protected]
Ana M. Gómez-Parra: Ph. D. Researcher. Dept. Mechanical Engineering and
Construction. Jaume I University, Av. de VicentSosBaynat s/n. 12071 Castelló de la
Plana, Spain. E-mail [email protected]
Natalia Edo-Alcon: Researcher. Dept. Mechanical Engineering and Construction. Jaume
I University, Av. de Vicent Sos Baynat s/n. 12071 Castelló de la Plana, Spain. E-mail
Abstract
There are several factors, such as physical, geographical, socio-cultural, economic and
political factors, which have an influence in the selective collection of the municipal
solid waste (MSW). To define a selective collection system of MSW the waste
generation pattern of the town should be firstly determined. In this way, the before
mentioned factors need to be analysed in depth. This paper tries to analyse specifically
the economic income level in order to determine actions to improve the waste
management plan of a town. This research work includes three stages. In the first stage,
waste samples of the light-packaging containers were collected in two zones of the town
with different economic characteristics. The samples were collected in different seasons
during one year to detect possible variations in the composition of the waste. In the
second stage, the samples were characterized at the laboratory to define the composition
and quality of the waste. It was firstly separated into four fractions: metals, plastic, brik
and inappropriate. The inappropriate fraction was in its turn separated into cardboard,
rubber and leather, inert waste, organic matter, paper, hazardous waste, clothes and
shoes, glass and others. The plastic fraction was also separated into five type of plastics
and the metal fraction into three. Finally, in the third stage, the data have been analyzed
and conclusions have been extracted. One of the main results is that the zone with a
higher income collects selectively more quantity of paper and cardboard and light-
packaging with the same logistic and information conditions. Another conclusion was
that the quality of the waste collected in these zones was similar. The methodology
exposed in this work can be extrapolated to other towns with similar characteristics.
Otherwise, it will be useful when implementing a system to collect the waste selectively
and especially to develop actions to achieve a good participation of everybody in the
waste collection system.
Key words: Income, waste, selective collection, characterization, quality.
1. INTRODUCTION
In the last years, the world economic growth has originated an excessive increase of the
municipal solid waste (MSW) generation. The population growth, especially in urban
areas, the progressive products obsolescence and the generalized use of packaging are
some of the factors that make waste management improvement more necessary than
ever. Therefore, citizens as well as politicians are becoming aware of this waste
generation growth and as a result their efforts to improve waste management have
increased (Castagna et al., 2013; Sakai et al., 2011). Identifying and characterising the
factors that determine why a local authority opts for a particular way of managing its
waste collection service is an important issue, warranting research interest in the field of
MSW management (Plata-Díaz et al., 2014). In some cases, legislation encourages to
take measures to carry out the options that deliver the best overall environmental
outcome. In this sense, European strategies in waste management are related to plans to
reduce waste generation, source separation, valorisation and waste final disposal. The
European Waste Directive (2008) establishes a waste hierarchy which states a priority
order in waste prevention and management legislation and policy. The first step of this
hierarchy focuses on prevention, followed by re-use, recycling, recovery and the final
waste disposal. In order to achieve satisfactory results in recovering materials from the
MSW, selective collection systems have been implemented. Depending on the country,
the fractions to be collected can vary and the selective collection systems are organized
in different ways. A careful evaluation of the planning and the implementation of the
selective collection programs, contributes to decision-making, to the adoption of
corrective actions, to the confirmation of program performance and to strengthening the
ties with the target population (Bringhenti, 2011). But the level of recovery of the
different waste fractions depends on several factors. Waste management planning
requires reliable data concerning waste generation, influencing factors on waste
generation and forecasts of waste quantities based on facts. But first of all, the waste
generation pattern of the town should be determined. There are several factors, such as
physical, geographical, socio-cultural, economic and political factors, which have an
influence in the composition and generation of MSW. To manage MSW adequately in a
specific geographic area it is essential to know these variables as precisely as possible
(Gallardo et al. 2014). Purcell and Magette (2009) hypothesized socio-economic
variables, housing types, and the sizes and main activities of commercial establishments
as the key determinants contributing to the spatial variability of biodegradable
municipal waste generation. Suthar and Singh (2015) estimated the quantity and quality
of household waste in terms of socio-economic groups and family size in the Dehradun
city, India.Lebersorger and Beigl (2011) identified and quantified differences of the
MSW collection of several towns based on data from waste management and on socio-
economic indicators. The resulting regression model included municipal tax revenue per
capita, household size and the percentage of buildings with solid fuel heating systems.
Owusu et al. (2013) examined the willingness of urban households in Ghana to accept
economic incentives to participate in solid waste source separation; Low income
households were less inclined to accept cash incentives than middle or high income
households indicating that other factors than purely costs for waste management are
important for households to participate in source-separation of waste. Kesser et al.
(2012) took into account spatial dependency in determination of the significant socio-
economic and climatic factors that may be of importance for the MSW generation rates
in different provinces of Turkey. Thanh et al. (2010) evaluated the quantity and
composition of household solid waste to identify opportunities for waste recycling in

Can Tho city, the capital city of the Mekong Delta region in southern Vietnam. The
authors also analysed the relations between some socioeconomic factors and household
solid waste generation rates by physical categories and subcategories. Gómez et al.
(2009) analysed and compared the findings of the study of the characterization and the
generation of solid waste from households at three different socio-economic levels in a
Mexican city over three periods (April and August, 2006 and January, 2007). Akinci et
al. (2012) investigated the major components and characteristics of the domestic solid
wastes as a function of economic conditions for a study area, in order to define the
recycling resources and biomass recovery options, as well as to discuss the possible
waste management methods for these regions. These authors also considered seasonal
variations as the quality of recyclable and residual MSW is, among other factors,
strongly influenced by the seasonal variation in MSW composition. However, a
relatively marginal amount of published data on seasonal MSW composition doesn’t
provide sufficient information on this phenomenon. Denafas et al. (2014) provided
results from municipal waste composition research campaigns in four cities of Eastern
European countries. Mateu-Sbert et al. (2013) estimated the impact of the tourist
population on MSW, both total and separately collected, for the period 1998-2010, for
the Mediterranean island of Menorca (Spain) using regressions models.
The success of the waste recovery is also related to the stakeholder’s implication.
Therefore, some authors have studied the citizen’s behaviour in the selective collection
process. Swami et al. (2011) analyzed the frameworks of waste management behaviour
by examining personality, individual differences, and socio-demographic antecedents of
self-reported waste recycling, reuse, and reduction behaviours in Britain. Lee and Paik
(2011) examined the impacts of several factors on recycling and waste management
behaviors, attitudes for recycling and waste management, and the respondents’
demographic variables. Finally, it is important to highlight that relatively few studies
have been performed to characterize MSW at household level. This is due in part to the
difficulties involved with collecting the data and selecting an appropriate statistical
sample size. Edjabou et al. (2015) introduced a waste sampling and sorting
methodology for efficient and statistically robust characterization of solid waste. All
this work is also needed to determine the cost of the collection service studied by
authors like D’onza et al. (2016). The aim of the present work is to gather information
about the influence of the economic income level in the selective collection systems in
order to establish the adequate preventive measures. To achieve this aim two
neighbourhoods of the same town with a clear difference in their income level have
been identified. In each zone, the selective collection of the light packaging fraction and
the paper and cardboard fraction have been monitored during one year. It consisted of
determining the collection rate and the quality of the light-packaging and the paper and
cardboard containers. In the case of the light-packaging collection, the possible
variation between the period spring-summer and autumn-winter has been also
determined.
2. MATERIALS AND METHODS
The methodology followed in this research work has several steps which are shown in
figure 1. This methodology is also explained step by step.

Figure 1. Steps of the methodological work
2.1. Analysis of the situation
The selected area is Castellón, a Spanish middle-sized town which has a population of
156,221 inhabitants. In this town, MSW is separated into four fractions:
paper/cardboard, glass, light-packaging (plastics, metals and brik) and mixed waste. The
mixed waste is picked up from kerbside containers of 1,100 L, whereas the
paper/cardboard, glass and light-packaging are collected in 3,200 L containers from
drop-off points that have a radius of action of 100 m to 150 m (Gallardo et al., 2011).
The radius of action (figure 2) is defined as the greatest distance from the disposal point
in a straight line. In every drop-off point there are usually three containers: one for the
paper and cardboard, one for light-packaging and one for glass. Nowadays, Castellón
has 238 containers to collect paper/cardboard, 245 containers to collect light-packaging
and 220 containers to collect glass. Other types of specific waste are also collected in
this town such as batteries, fluorescent tubes, clothes, medicines, used cooking oil and
bulky waste. These types of waste are collected at kerbside, at a specific establishment
or at a local waste facility for recycling.
2.2. Selection of the study areas
Taking into account the citizen’s income, a town can be divided into subareas. To
analyse MSW generation, several authors (Bandara et al., 2007) use four income levels:
high income, medium-high income, medium income and low income. Other authors,
such as Gómez et al. (2009), compare waste generation in households at three socio-
economic levels (lowest level: 1-2 times the minimum wage; medium level: 2-5
minimum wage; highest level: more than 5 minimum wage). According to Emery et al.
(2003), different socio-economic statuses in the form of different types of dwellings
have an influence on the final quantities and composition of waste disposal, which are
in some cases quite substantial. Castellon cannot be divided into subareas from the
citizens’ income point of view because there is no available information. Hence, to
divide it into areas of different purchasing power another strategy was carried out. The
town was divided depending on the urban characteristics of the zone as other authors
like Emery et al. (2003) proposed. According to the data provided by the Town Council,
ANALYSIS of the
SITUATION
SELECTION of the
AREAS
DETERMINATION of the
COLLECTION RATE
DETERMINATION of
the WASTE QUALITY
DATA ANALYSIS AND CONCLUSIONS
SAMPLING PROCESS
Castellón is divided into 178 land value zones that have been evaluated taking into
account their location, accessibility, housing development, urban services quality, and
the real estate market dynamics. As a result, each area of the town has its own land
economic value (€ m2). Therefore, to carry on this research work the town was divided
into two areas depending on the land economic value. The first zone was considered a
medium-high income zone (HZ) with land values between 500 and 900 €·m2 and the
second zone, was the low-medium income zone (LZ), with land values between 150 and
500 €·m2.
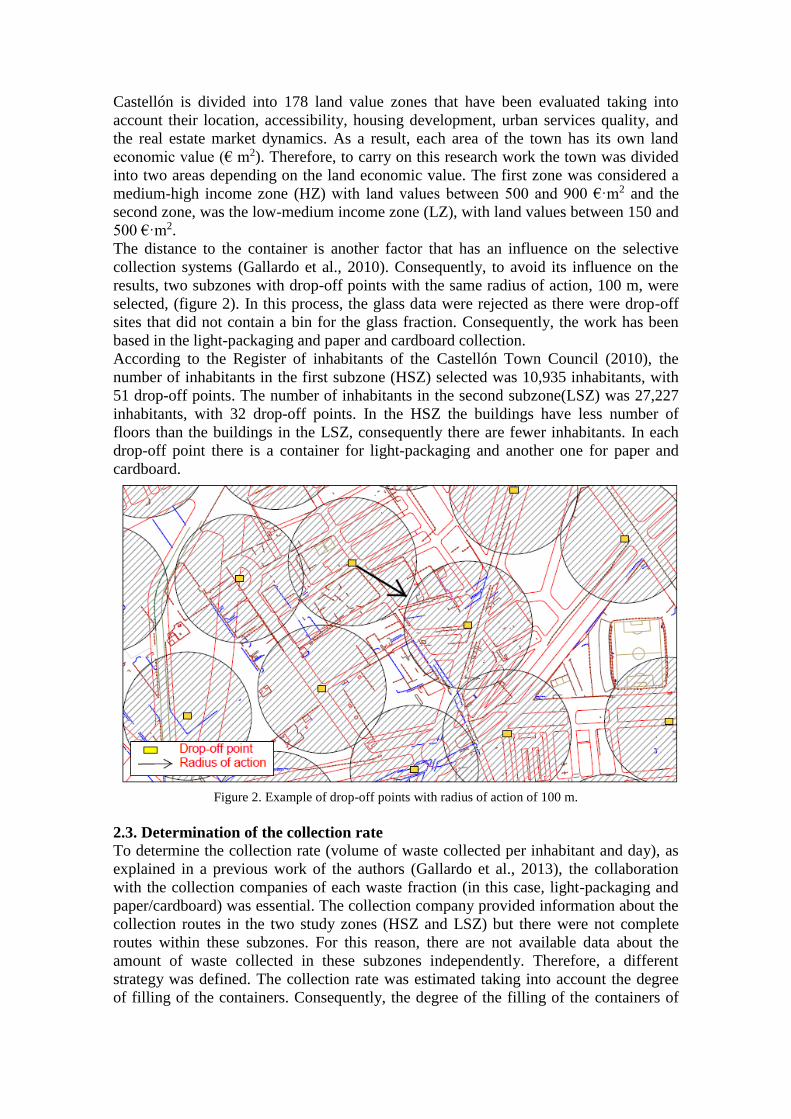
The distance to the container is another factor that has an influence on the selective
collection systems (Gallardo et al., 2010). Consequently, to avoid its influence on the
results, two subzones with drop-off points with the same radius of action, 100 m, were
selected, (figure 2). In this process, the glass data were rejected as there were drop-off
sites that did not contain a bin for the glass fraction. Consequently, the work has been
based in the light-packaging and paper and cardboard collection.
According to the Register of inhabitants of the Castellón Town Council (2010), the
number of inhabitants in the first subzone (HSZ) selected was 10,935 inhabitants, with
51 drop-off points. The number of inhabitants in the second subzone(LSZ) was 27,227
inhabitants, with 32 drop-off points. In the HSZ the buildings have less number of
floors than the buildings in the LSZ, consequently there are fewer inhabitants. In each
drop-off point there is a container for light-packaging and another one for paper and
cardboard.
Figure 2. Example of drop-off points with radius of action of 100 m.
2.3. Determination of the collection rate
To determine the collection rate (volume of waste collected per inhabitant and day), as
explained in a previous work of the authors (Gallardo et al., 2013), the collaboration
with the collection companies of each waste fraction (in this case, light-packaging and
paper/cardboard) was essential. The collection company provided information about the
collection routes in the two study zones (HSZ and LSZ) but there were not complete
routes within these subzones. For this reason, there are not available data about the
amount of waste collected in these subzones independently. Therefore, a different
strategy was defined. The collection rate was estimated taking into account the degree
of filling of the containers. Consequently, the degree of the filling of the containers of

light-packaging and paper/cardboard fractions was checked. As the collection routes
and timetables were known, a route was designed and the degree of the filling of each
container was registered manually on field sheets before being emptied.
To define the number of months to get the samples, the following equation proposed by
Barlett el al. (2011) was used: 2
0
Xe
tSn (1)
Where:
n0 is the sample size (number of months).
t is the confidence level that is determined by α. The confidence level used is 95%
(α=0.05), and therefore t=1.96.
X is the average number of containers filled every month in each drop-off point.
S is the standard deviation.
e is the tolerable level of error of the average. It is an estimated value and in this case it
has been considered as 10%.
If the sample size n0 is greater than 5% of the population size, the size sample corrected
equation (Eq. 2) (Barlett et al., 2011) should be used:
N
n
nn
0
0
1
(2)
Where N is the population size (12 months of the year) and n is the new sample size.
The sample size was determined from the light-packaging selective collection as there
were previous data of the average value and the standard deviation of the filling of the
containers. These data were obtained from a pilot experience light-packaging selective
collection carried out by the same research group. From this experience, the resulting
values of the variables in equation 1 were S= 0.13 and X =2.32. Therefore, using
equation 1, n0=1. As n0 is greater than 5% of 12 months, equation 2 should be also used.
The final result is n=1, so it was necessary to collect samples during one month from the
light-packaging containers as well as from the paper/cardboard container.
As the frequency of the waste selective collection in this town is twice a week, data
were taken during four consecutive weeks in October. During this period all the
containers in the two selected zones were checked one by one. The degree of filling was
registered as ¼, ½, ¾ or full. Finally, the number of containers completely full for each
waste fraction (paper/cardboard and light-packaging) and for each zone (HSZ and LSZ)
was calculated.
2.4. Determination of the quality of the waste
The second part of the research work consisted of determining the quality of the waste
collected selectively in both zones. The quality is defined by the percentage of
appropriate materials that appear in the container. When the quantity of this type of
materials increases, the quality in the container also increases. Attending to the
processing enterprises data, the amount of inappropriate material in the paper/cardboard
containers is very low (between 1-3%) (Gallardo et al. 2010). In this sense, no
significant differences are expected in both zones and for this reason, this fraction was
not taken into account. The study of the waste composition was then focused on the
light-packaging fraction, which is more likely to contain a greater percentage of

inappropriate materials due to the heterogeneity of the materials collected and to the
lack of information of the population about the type of waste that should be dropped in
this container (Gallardo et al., 2010).Therefore, two sampling campaigns were carried
out during one year, the first one in April and the second one in October, with the aim
of analysing the possible differences between seasons of spring-summer (quite similar)
and autumn-winter (quite similar). Equations 1 and 2 were also used to determine the
amount of sample needed. In the first place, the minimum number of points to be
sampled to estimate the composition of the light-packaging stream is calculated. The
previous data of the average value and the standard deviation of the light-packaging
fraction in the container in Castellón have been extracted from the data published by
Ecoembes (www.ecoembes.es). Using equation 1 and the following values: t = 1.96, e =
0.05, S = 5.99 and X = 87.57 (percentage of light-packaging in the container) the
results show that no= 7. In the HSZ where N=51 bins, no is greater than 5% of N,
consequently equation 2 must be used. The final result is n=6. Therefore, samples must
be taken at least in 6 points. For the LSZ, the result is n=6 (N=32).Subsequently, the
composition was determined. Two samples were taken in one week in each zone, in
April. In the HSZ, the samples were taken on Tuesday and Thursday morning, taking 18
kg and 22 kg. The samples were homogeneously taken from 7 containers. In the LSZ,
the process was similar; the samples were taken the same days in the afternoon. The
samples weights were 19 kg and 25 kg. In October, the same procedure was carried out.
In the HSZ 29 kg and 32 kg were taken and in the LSZ 19 kg and 27 kg were sampled.
The samples were taken, as in the previous campaign, homogeneously from 6
containers.
All these samples were characterized at the laboratory. In the first place, the samples
were characterized in metals, plastic and brik and inappropriate materials, as shown in
figure 3. After this first characterization, the inappropriate material was also
characterized. This fraction was separated into several materials such as, cardboard,
rubber and leather, inert waste, organic matter, paper, hazardous waste, clothes and
shoes, glass and others, see figures 5 and 6. Finally, a third characterization was done to
analyse the composition of the plastic and the metal fractions of the light-packaging
containers as figures 7 to 10 show.
3. Results and discussion
3.1 Collection rate
Once the collecting data process is finished, these data were analysed and processed. To
determine the Daily Collection Rate (DCR), in volume (L), per inhabitant, the following
data for every zone (HSZ and LSZ) were needed:
The number of containers and their capacity.
The number of inhabitants in each zone.
The sample period (4 weeks).
The DCR results are presents in table 1. In this table it is important to highlight that in
HSZ (medium-high income level) the collection rate are lower than in LSZ (low-
medium income level). Therefore, attending to the results it can be said that in the low-
medium income zone the collection rate is quite lower than in the medium-high income
zone. Regarding the paper/cardboard container collection, in HSZ the rate is 6.4
L·inhab-1·d-1whereas in LSZ it is 1.8 L·inhab-1·d-1. Attending to the light-packaging

collection, the results are quite similar, in HSZ the collection rate is 7.1 L·inhab-1·d-1and
in LSZ it is 2.2 L·(inhab·d)-1.It is remarkable that inside one zone both wastes present
collection rates (in volume) so similar. Taking into account the data of the waste density
in the container provided by the Spanish Ministry of Agriculture, Food and
Environment (MAGRAGA, 2015), the DCR (kg·inhab-1·d-1) can be calculated (Table 1).
In this case, the density of paper/cardboard in the container is 50 kg·m-3 and the density
of light-packaging is 25 kg·m-3.
Table 1. Daily Collection Rate (L·inhab-1·d-1)
Paper/cardboard Light-packaging
kg inhab-1·d-1 L inhab-1·d-1 kg inhab-1·d-1 L inhab-1·d-1
HSZ 0.32 6.4 0.18 7.1
LSZ 0.09 1.8 0.06 2.2
Consequently, to increase the collection levels in the LZ, a public awareness campaign
should be proposed in it.
3.2 Quality of the light-packaging container
After characterizing the samples taken in the light-packaging containers, results about
the waste composition in these containers were extracted. Figure 3 shows the results
(average and standard deviation) of the waste composition in the HSZ (medium-high
income level) in both periods, spring-summer and autumn-winter, whereas figure 4
shows the results for LSZ (low-medium income level).
Figure 3. Waste composition (average and standard deviation) in light-packaging containers in HSZ,
spring-summer (left) and autumn-winter (right).
Figure 4. Waste composition (average and standard deviation) in light-packaging containers in LSZ,
spring-summer (left) and autumn-winter (right).
Attending to the results in figure 3, the plastic is the biggest fraction in containers in
HSZ during the period spring-summer with 54% (s=3.0), followed by inappropriate,
brik and metal fractions. In the period autumn-winter, plastic fraction is still the biggest
0
10
20
30
40
50
60
Metals Plastic Brik Inappropriate
%
0
10
20
30
40
50
60
Metals Plastic Brik Inappropriate
%
0
10
20
30
40
50
60
Metals Plastic Brik Inappropriate
%
0
10
20
30
40
50
60
Metals Plastic Brik Inappropriate
%
fraction with a value of 53.6% (s=1.7) followed by the inappropriate fraction. However,
metal fraction is the third and brik is the smallest fraction. One of the reasons of this
change is that in spring-summer people drink more beverages such as juices or wine
(most of them with brik packaging). Regarding the inappropriate fraction, it can be said
that there is a similar percentage between both periods of time, 16.7% (s=1.1) in spring-
summer and 16% (s=7.4) in autumn-winter.
Results in figure 4 show that composition in containers in LSZ follows the same trend
that in the HSZ. It must be highlighted that the inappropriate fraction decreases slightly
in the second period of the year, from 17% (s=6.5) in spring-summer to 11.6 (s=2.1) in
autumn-winter.
If the waste quality in container of both zones is compared, it can be said that there is a
similar percentage of inappropriate material in spring-summer, they only differ in one
percentage point. Furthermore, in autumn-winter, in the HSZ, inappropriate fraction
represents 16% and in the LSZ 11.6% but attending to the standard deviation values, it
can’t be said that they are different. Finally, one of the main conclusions from the
results is that the quality in the light-packaging container in both zones is similar. It is
also similar in the studied seasons. Citizens who collaborate in the waste selective
collection in both zones (HSZ and LSZ) have the same level of knowledge about the
correct way to drop the waste in the street containers.
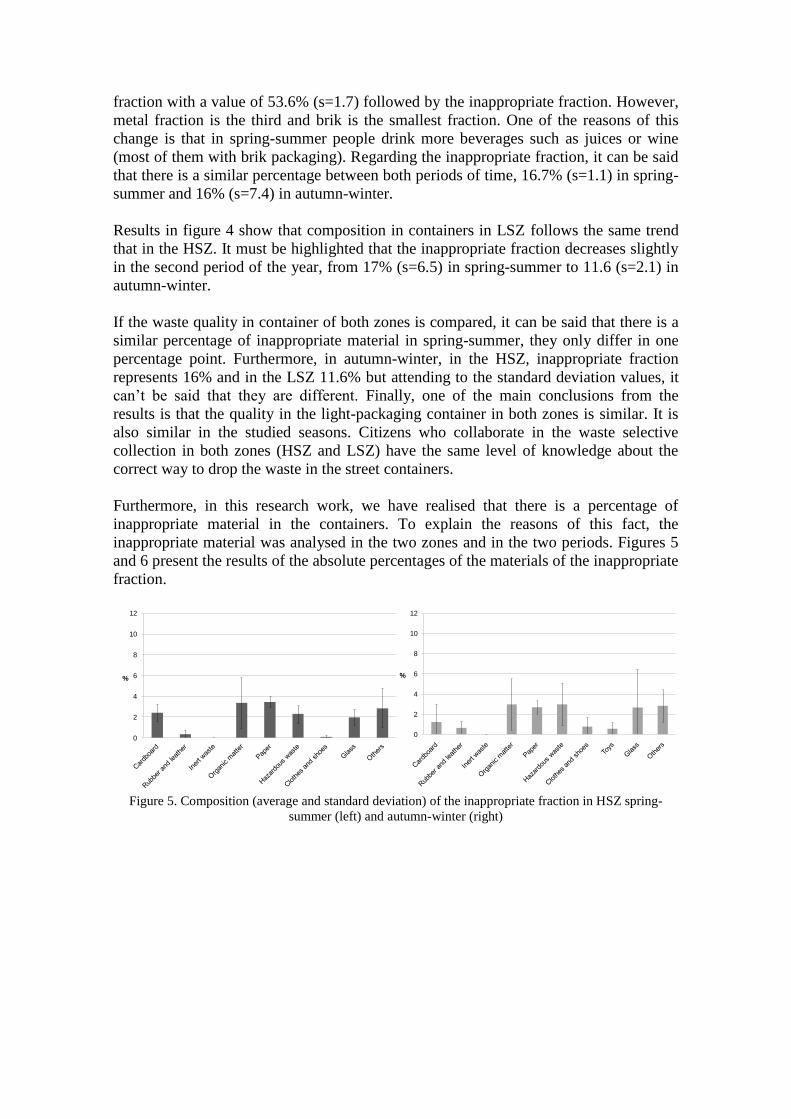
Furthermore, in this research work, we have realised that there is a percentage of
inappropriate material in the containers. To explain the reasons of this fact, the
inappropriate material was analysed in the two zones and in the two periods. Figures 5
and 6 present the results of the absolute percentages of the materials of the inappropriate
fraction.
Figure 5. Composition (average and standard deviation) of the inappropriate fraction in HSZ spring-
summer (left) and autumn-winter (right)
0
2
4
6
8
10
12
%
0
2
4
6
8
10
12
%

Figure 6. Composition (average and standard deviation) of the inappropriate fraction in LSZ spring-
summer (left) and autumn-winter (right)
In all the cases, paper, cardboard and glass fractions are between 0.3 and 5.1%. It could
be due to paper/cardboard and glass containers were completely full. For this reason,
citizens decided to place these types of waste in a wrong place, the light-packaging
container. Another possible reason could be that citizens didn’t know to place the waste
correctly.
Organic matter also appears in a great percentage (between 2 and 5%). This fraction
appears in some packaging. The increase of the organic matter in spring-summer could
be due to a greater consumption of fresh food in this period.
In the LSZ, in autumn-winter, the percentage of inappropriate material decreases
surprisingly. This is mainly due to the presence of organic matter, although clothes and
shoes fractions increase.
In general, in both zones the annual quality in the light-packaging container is very
high, 83.6 % in the HSZ and 85.6 % in the LSZ, if it is compared to the average values
of the Spanish cities which is around 76% (Gallardo et al., 2010). This fact means that
the citizens in both zones know which type of waste should be dropped in the light-
packaging container, although it can be improved.
In all the cases, the plastic fraction represents the biggest percentage of recovery. This
fraction has also been characterized to define the type of plastics that compose it. The
following types of plastics were separated in the characterization: High Density
Polyethylene (HDPE), Low Density Polyethylene (LDPE), Polyethylene Terephthalate
(PET), Polypropylene (PP), Polystyrene (PS) and others (mixture of plastics). The
results of these new characterizations are presented in figures 6 and 7. A conclusion that
can be extracted is that plastic packaging made only by one material is the most
common. It could be due to two reasons, in the first place, this kind of plastic packaging
is easily identified by the people and in the second place it is the most used. Finally, it
can be highlighted the absence of PVC. From this fact it could be deduced that this type
of plastic would not be present in the reject fraction generated. Consequently, it would
be very useful to be turned into solid recovered fuel as it has a low content in chlorine
(Gallardo et al., 2014).
Regarding to the seasonal variation, in the two zones the percentage of PET (packages
of soft drinks and water) is more important in spring-summer than in autumn-winter
which is quite logic as in autumn-winter the weather is not so hot in this region.
Altogether, it can be said that the relative composition of plastics and their temporal
variation is similar in both zones.
0
2
4
6
8
10
12
%
0
2
4
6
8
10
12
%

Figure 7. Composition of the plastic fraction in light-packaging containers in HSZ, spring-summer (left)
and autumn-winter (right).
Figure 8. Composition of the plastic fraction in light-packaging containers in LSZ, spring-summer (left)
and autumn-winter (right).
Moreover, the metal fraction was also characterized. In this case, three types of
materials were separated: ferrous materials, non-ferrous materials and aluminium foil.
Figure 9 and Figure 10 show the results of the metals characterization.
HDPE
19%
LDPE
20%
PET
23%
PP
12%
PS
24%
OTHER PLASTICS
2%
HDPE
21%
LDPE
19%
PET
34%
PP
11%
PS
6%
OTHER
PLASTICS9%
HDPE
25%
LDPE
24%PET
26%
PP
8%
PS
14%
OTHER PLASTICS
3%
HDPE
21%
LDPE
22%
PET
38%
PP
5%
PS
10%
OTHER PLASTICS
4%

Figure 9. Composition of the metal fraction in light-packaging containers in HSZ, spring-summer (left)
and autumn-winter (right).
Figure 10. Composition of the metal fraction in light-packaging containers in LSZ, spring-summer (left)
and autumn-winter (right).
The predominant fraction is the ferrous fraction formed by the packaging of beverages
and preserved food (tomato, prepared food, seafood, etc.) as in Spain the canning
industry is very important and its products are highly consumed. In this case, there is
not a clear variation depending on the seasons or the zones.
CONCLUSIONS
One factor that has an effect in the MSW selective collection is the citizen’s income.
Therefore, it is important to take it into account to design a selective collection plan.
FERROUS83%
NON FERROUS13%
ALUMINIUM FOIL4%
FERROUS
80%
NON FERROUS
18%
ALUMINIUM FOIL
2%
FERROUS
80%
NON FERROUS
17%
ALUMINIUM FOIL
3%
FERROUS
75%
NON FERROUS
22%
ALUMINIUM FOIL
3%

To determine how this factor affects the amount of waste selectively collected as well as
its quality, an experiment has been designed and it has been implemented in two zones
of Castellón de la Plana, covering 38,162 citizens. The quality of the waste collected has
been analysed during two periods (spring-summer and autumn-winter. The
determination of the DCR in two zones with different income has resulted that the zone
with a higher income collects selectively more quantity of paper and cardboard and
light-packaging with the same logistic and information conditions. This is not a serious
fact as it can be corrected with a campaign of environmental awareness to increase the
collection rate.
Attending to the quality in the light-packaging containers, in both zones it is similar (it
varies between 83.6 % and 85.6 %). This fact allows to assure that people who
participate in the selective collection in both zones has the same level of knowledge
about how to do it. Moreover, in the case of the light-packaging, the percentage is even
higher than the Spanish average that is 76%.
Finally, the methodology and the conclusions extracted from this study can be
extrapolated to other towns with similar characteristics. The results will be useful when
implementing a system of selective collection of MSW and especially to develop
actions to the society in order to achieve a participation of everybody in the waste
collection system.
REFERENCES
Akinci G., Guven E.D., Gok G. 2012. Evaluation of waste management options and
resource conservation potentials according to the waste characteristics and household
income: A case study in Aegean Region, Turkey. Resour. Conserv. Recycl. 58, 114-
124.
Bandara, N. J., Hettiaratchi, J. P., Wirasinghe, S. C., Pilapiiya, S. 2007. Relation of
waste generation and composition to socio-economic factors: a case study. Environ.
Monitor. Assess. 135 (1-3), 31-39.
Bartlett J. E., Kotrlik J. W. y Higgins C. C. 2001. Organizational research: Determining
appropriate sample size in survey researches. Inform. Technol. Learn. Perform. J. 19
(1), 43-50.
Bringhenti J.R., Zandonade E., Günther W.M.R. 2011. Selection and validation of
indicators for programs selective collection evaluation with social inclusion. Resour.
Conserv. Recycl. 55 (11), 876-884.
Castagna, A., Casagranda, M., Zeni, A., Girelli, E., Rada, E.C., Ragazzi, M., Apostol,
T. 2013. 3R'S from citizens point of view and their proposal from a case-study. UPB
Sci. Bul., series D, 75(4), 253-264.
Castellón Town Council. 2010. Register of Inhabitants.
Denafas G., Ruzgas T., Martuzevičius D., Shmarin S., Hoffmann M., Mykhaylenko V.,
Ogorodnik S., Romanov M., Neguliaeva E., Chusov A., Turkadze T., Bochoidze I.,
Ludwig C. 2014. Seasonal variation of municipal solid waste generation and
composition in four East European cities. Resour. Conserv.Recycl. 89, 22-30.
Directive 2008/98/EC of the European Parliament and of the Council 19 November
2008 on waste and repealing certain Directives.
D'Onza G., Greco G., Allegrini M. 2016. Full cost accounting in the analysis of
separated waste collection efficiency: A methodological proposal. Journal of
Environmental Manag.167, 59-65.
Ecoembes (www.ecoembes.es) 2012.
Edjabou M.E., Jensen M.B., Götze R., Pivnenko K., Petersen C., Scheutz Ch., Thomas
Astrup F. Municipal solid waste composition: Sampling methodology, statistical
analyses, and case study evaluation. Waste Manag. 36 (2015), 12–23.
Emery, A.D., Griffiths, A.J., Williams, P.K. 2003. An in depth study of the effects of
socio-economic conditions on household waste recycling practice. Waste Manage. Res.
21, 180-190.
Gallardo, A. 2000. Thesis Ph. Metodología para el diseño de redes de recogida selectiva
de RSU utilizando sistemas de información geográfica. Creación de una base de datos
applicable a España. Universidad Politécnica de Valencia.
Gallardo A., Bovea M.D., Colomer F.J., Prades M., Carlos M. 2010. Comparison of
different collection systems for sorted household waste in Spain. Waste Management
30, 2430–2439.
Gallardo A., Gómez A., Bovea M.D., Colomer F.J., Carlos M. 2013. Influencia del
nivel de ingresos económicos en la recogida selectiva de residuos urbanos. Rev. Int.
Contam. Ambie. 29, 19-24.
Gallardo A., Carlos M., Peris M., Colomer F.J. 2014. Methodology to design a
municipal solid waste generation and composition map: A case study. Waste Manag.
34, 1920–1931.
Gallardo A., Carlos M., Bovea M.D., Peris M., Colomer F.J., Albarrán F. 2014.
Analysis of refus-derived fuel from the municipal solid waste reject fraction and its
compliance with quality standards. J. Clean. Prod. 83, 118 – 125.
Gómez G., Meneses M., Ballinas L., Castells F. 2009. Seasonal characterization of
municipal solid waste (MSW) in the city of Chihuahua, Mexico. Waste Manag. 29 (7),
2018-2024
IVE, 2012. Ficha municipal de Castellón de la Plana. Actualización 2012. Institut
Valencià d’Estadística.
Keser S., Duzgun S., Aksoy A. 2012. Application of spatial and non-spatial data
analysis in determination of the factors that impact municipal solid waste generation
rates in Turkey. Waste Manag. 32 (3), 359-371.

Lebersorger S., Beigl P. 2011. Municipal solid waste generation in municipalities:
Quantifying impacts of household structure, commercial waste and domestic fuel. 2011.
Waste Manag. 31 (9–10), 1907-1915.
Lee S., Paik H.S. 2011. Korean household waste management and recycling behaviour.
Build. Environ. 46 (5), 1159-1166.
Zhen-shan Li., Hui-zhen Fu, Xiao-yan Qu. 2011. Estimating municipal solid waste
generation by different activities and various resident groups: A case study of Beijing.
Sci. Total Environ. 409 (20), 4406-4414.
MAGRAMA 2015 http://www.magrama.gob.es/es/calidad-y-evaluacion-ambiental/
(10/09/2015)
Mateu-Sbert J., Ricci-Cabello I., Villalonga-Olives E. 2013. The impact of tourism on
municipal solid waste generation: The case of Menorca Island (Spain). Waste Manag.
33 (12), 2589-2593.
Owusu V., Adjei-Addo E., Sundberg C. 2013. Do economic incentives affect attitudes
to solid waste source separation? Evidence from Ghana. Resour. Conserv. Recycl. 78,
115–123.
Plata-Díaz A.M., Zafra-Gómez J.L., Pérez-López G., López-Hernández A.M. 2014.
Alternative management structures for municipal waste collection services: The
influence of economic and political factors. Waste Manag. 34, 1967–1976.
Purcell M., Magette W.L. 2009. Prediction of household and commercial BMW
generation according to socio-economic and other factors for the Dublin region. Waste
Manag. 29 (4), 1237-1250.
Sakai, S., Yoshida, H., Hirai, Y., Asari, M., Takigami, H., Takahashi, S., Tomoda, K.,
Peeler, M.V., Wejchert, J., Schmid-Unterseh, T., Douvan, R., Hathaway, R., Hylander,
L.D., Fischer, C., Oh, G.J., Li, J.H., 2011. International comparative study of 3R and
waste management policy developments. J. Mate. Cycles Waste Manage. 13, 86-102.
Suthar S., Singh P. Household solid waste generation and composition in different
family size and socio-economic groups: A case study. 2015. Sustain. Cities Soc. 14, 56–
63.
Swami V., Chamorro-Premuzic T., Snelgar R., Furnham A. 2011.Personality, individual
differences, and demographic antecedents of self-reported household waste
management behaviours. J. Environ. Psychol. 31 (1), 21-26.
Thanh N.P., Matsui Y., Fujiwara T. 2010. Household solid waste generation and
characteristic in a Mekong Delta city, Vietnam. J. Environ. Manag. 91 (11), 2307-2321.