Influence of Size and Shape Properties of Railroad Ballast ...
11
94 Transportation Research Record: Journal of the Transportation Research Board, No. 2448, Transportation Research Board of the National Academies, Washington, D.C., 2014, pp. 94–104. DOI: 10.3141/2448-12 Railroad ballast is uniformly graded coarse aggregate placed between and immediately underneath the ties to provide drainage and structural support for the loading applied by trains. In the United States, several ballast gradation recommendations are suggested by the American Rail- way Engineering and Maintenance-of-Way Association (AREMA). Most of these recommended uniform gradations have somewhat wide ranges at their control sieves; this range often creates significantly different grain-size distributions within the same gradation band. In this analysis, AREMA No. 24 gradation was studied for controlled changes in grain- size distributions within its band. Gradations were created by using three control sieves within the AREMA No. 24 gradation band. In addition, to emphasize the significance of particle shape, three sets of particles having high-, medium-, and low-angularity indexes quantified by image analysis were also considered in the packing simulations carried out with an image-aided ballast aggregate assembly modeling approach with the discrete element method (DEM). The significance of passing each con- trol sieve as well as the importance of particle angularity on number of contacts, coordination number (average number of contacts that one particle makes with its neighbors), and porosity was analyzed by using analyses of variance and regression in the DEM packing simulations. The results indicated that increasing the number of particles between ballast nominal maximum sieve size and its half size would increase the number of particle contacts created in the granular assembly. When the imaging-based angularity indexes of the aggregate particles increased, the number of contacts also increased to give a higher coordination num- ber. The ballast DEM simulations proved to be a powerful tool to study and optimize ballast gradations. Conventional ballasted railroad track consists of rails, fastening components, ties, ballast layer, and subgrade. In railroad track ter- minology, ties and track components above the ties are identified as superstructure. Layers below the ties are referred to as substruc- ture. The ballast layer is constructed with uniformly graded coarse aggregates. The main functions of the ballast layer are distribution of train loads from superstructure to subgrade and provision of the required drainage for the track. The particle size distribution must be uniformly graded in order to have the higher void content that would eventually supply the necessary drainage function. Highly angular crushed aggregates are also desirable because of the superb interlock they provide. The aggregate interlock is very important because it offers lateral strength and the ability to cope with heavy train loads transmitted from the superstructure (1). The coefficient of uniformity is the ratio of sieve sizes that are 60% and 10% by weight of particles passing during sieve analysis. Indraratna et al. state that the shear strength of ballast can be increased by moving to a slightly well-graded particle size distribution with a coefficient of uniformity between 2.3 and 2.6 (2). They claim that this grada- tion type would have more resistance to shear and still provide a sufficient amount of drainage. Particle packing and morphological properties of spherical parti- cles have been well investigated. Gu and Yang studied the effects of granular assembly packing on the shear modulus of granular materi- als by establishing the number of particle contacts and the coordi- nation number, which is defined as the average number of contacts that one particle makes with its neighbors (3). They modeled two- dimensional disks 2 mm in diameter with size discrepancies ranging from 0% to 1% and concluded that as gradation became less uniform by the increase in size discrepancies, the shear modulus of the granu- lar assembly decreased. Gu and Yang also stated that the changes in gradation because of the size discrepancies did not change the void ratio but significantly affected the shear modulus; this finding indicates the importance of the number of contacts created in the granular assembly (3). Moreover, they highlighted that increases in confining pressure increased the coordination number and number of contacts, which caused an increase in the elastic modulus. Ueda et al. studied packing effects by using nine different gra- dations, all with an average particle size D 50 of 10 mm (4). It was found that for both well-compacted and loose granular assemblies, the coordination number decreased as the deviation from the uni- formity in gradation increased. However, as the deviation increased, the void ratio generally decreased for loose granular assemblies and increased for well-compacted samples. Jia et al. also investigated the effect of gradation on three-dimensional sphere packing by analyz- ing the coordination number and porosity (5). The three types of grain size distributions studied—mono size, bimodal, and Gaussian— indicated that as a smaller particle fraction of the bimodal distribution and particle size deviation in the Gaussian distribution increased, the coordination number increased and the porosity decreased. Al-Raoush captured the images of sand particles by using x-ray microtomography and modeled their grain size behavior by using spherical particle simulations (6). Al-Raoush concluded that the microscopic contact and interaction behavior of sand particles and those simulated by spherical models were significantly different, possibly causing major discrepancies in the macroscopic behavior of granular materials. Azéma et al. also compared the packing of Influence of Size and Shape Properties of Railroad Ballast on Aggregate Packing Statistical Analysis Huseyin Boler, Yu Qian, and Erol Tutumluer Department of Civil and Environmental Engineering, University of Illinois at Urbana–Champaign, 205 North Mathews, Urbana, IL 61801. Corresponding author: E. Tutumluer, [email protected].
Transcript of Influence of Size and Shape Properties of Railroad Ballast ...
94
Transportation Research Record: Journal of the Transportation Research Board, No. 2448, Transportation Research Board of the National Academies, Washington, D.C., 2014, pp. 94–104.DOI: 10.3141/2448-12
Railroad ballast is uniformly graded coarse aggregate placed between and immediately underneath the ties to provide drainage and structural support for the loading applied by trains. In the United States, several ballast gradation recommendations are suggested by the American Rail-way Engineering and Maintenance-of-Way Association (AREMA). Most of these recommended uniform gradations have somewhat wide ranges at their control sieves; this range often creates significantly different grain-size distributions within the same gradation band. In this analysis, AREMA No. 24 gradation was studied for controlled changes in grain-size distributions within its band. Gradations were created by using three control sieves within the AREMA No. 24 gradation band. In addition, to emphasize the significance of particle shape, three sets of particles having high-, medium-, and low-angularity indexes quantified by image analysis were also considered in the packing simulations carried out with an image-aided ballast aggregate assembly modeling approach with the discrete element method (DEM). The significance of passing each con-trol sieve as well as the importance of particle angularity on number of contacts, coordination number (average number of contacts that one particle makes with its neighbors), and porosity was analyzed by using analyses of variance and regression in the DEM packing simulations. The results indicated that increasing the number of particles between ballast nominal maximum sieve size and its half size would increase the number of particle contacts created in the granular assembly. When the imaging-based angularity indexes of the aggregate particles increased, the number of contacts also increased to give a higher coordination num-ber. The ballast DEM simulations proved to be a powerful tool to study and optimize ballast gradations.
Conventional ballasted railroad track consists of rails, fastening components, ties, ballast layer, and subgrade. In railroad track ter-minology, ties and track components above the ties are identified as superstructure. Layers below the ties are referred to as substruc-ture. The ballast layer is constructed with uniformly graded coarse aggregates. The main functions of the ballast layer are distribution of train loads from superstructure to subgrade and provision of the required drainage for the track. The particle size distribution must be uniformly graded in order to have the higher void content that would eventually supply the necessary drainage function. Highly
angular crushed aggregates are also desirable because of the superb interlock they provide. The aggregate interlock is very important because it offers lateral strength and the ability to cope with heavy train loads transmitted from the superstructure (1). The coefficient of uniformity is the ratio of sieve sizes that are 60% and 10% by weight of particles passing during sieve analysis. Indraratna et al. state that the shear strength of ballast can be increased by moving to a slightly well-graded particle size distribution with a coefficient of uniformity between 2.3 and 2.6 (2). They claim that this grada-tion type would have more resistance to shear and still provide a sufficient amount of drainage.
Particle packing and morphological properties of spherical parti-cles have been well investigated. Gu and Yang studied the effects of granular assembly packing on the shear modulus of granular materi-als by establishing the number of particle contacts and the coordi-nation number, which is defined as the average number of contacts that one particle makes with its neighbors (3). They modeled two-dimensional disks 2 mm in diameter with size discrepancies ranging from 0% to 1% and concluded that as gradation became less uniform by the increase in size discrepancies, the shear modulus of the granu-lar assembly decreased. Gu and Yang also stated that the changes in gradation because of the size discrepancies did not change the void ratio but significantly affected the shear modulus; this finding indicates the importance of the number of contacts created in the granular assembly (3). Moreover, they highlighted that increases in confining pressure increased the coordination number and number of contacts, which caused an increase in the elastic modulus.
Ueda et al. studied packing effects by using nine different gra-dations, all with an average particle size D50 of 10 mm (4). It was found that for both well-compacted and loose granular assemblies, the coordination number decreased as the deviation from the uni-formity in gradation increased. However, as the deviation increased, the void ratio generally decreased for loose granular assemblies and increased for well-compacted samples. Jia et al. also investigated the effect of gradation on three-dimensional sphere packing by analyz-ing the coordination number and porosity (5). The three types of grain size distributions studied—mono size, bimodal, and Gaussian— indicated that as a smaller particle fraction of the bimodal distribution and particle size deviation in the Gaussian distribution increased, the coordination number increased and the porosity decreased.
Al-Raoush captured the images of sand particles by using x-ray microtomography and modeled their grain size behavior by using spherical particle simulations (6). Al-Raoush concluded that the microscopic contact and interaction behavior of sand particles and those simulated by spherical models were significantly different, possibly causing major discrepancies in the macroscopic behavior of granular materials. Azéma et al. also compared the packing of
Influence of Size and Shape Properties of Railroad Ballast on Aggregate PackingStatistical Analysis
Huseyin Boler, Yu Qian, and Erol Tutumluer
Department of Civil and Environmental Engineering, University of Illinois at Urbana–Champaign, 205 North Mathews, Urbana, IL 61801. Corresponding author: E. Tutumluer, [email protected].
Boler, Qian, and Tutumluer 95
three-dimensional spherical particles with three-dimensional poly-hedral particles sharing the same gradation properties (7). Angu-lar polyhedral particle shapes were created more realistically for crushed aggregate simulations based on the railroad ballast par-ticle shape libraries of the French National Railways. The results revealed that polyhedral particles obtained higher coordination numbers and shear strength. Moreover, they compacted more under repeated loads.
Shear strength, modulus, and permanent deformation characteris-tics of crushed, angular aggregate over uncrushed rounded gravels have been well contrasted. Rao et al. conducted triaxial rapid shear tests on samples of rounded gravel, 100% crushed aggregates, and their 50–50 blend (8). As expected, crushed aggregates resulted in higher friction angles than the 50–50 blend and the rounded gravel specimens. With an aggregate image analysis approach, Pan et al. quantified surface texture and angularity indexes of different coarse aggregate materials and successfully correlated the increases in resil-ient moduli of the tested samples with the higher average particle angularity and surface texture properties (9). With the same imag-ing approach, Tutumluer and Pan further investigated the effects of aggregate angularity and surface texture properties on the shear strength and permanent deformation behavior of granular materials by blending crushed aggregates with uncrushed gravel in differ-ent percentages and conducting triaxial rapid shear and permanent deformation tests (10). Interestingly, as the percentage of crushed particles increased (i.e., higher angularity and rougher texture) con-sistently, the tests produced higher shear strength and lower permanent deformation trends.
Huang (11) and Tutumluer et al. (12) compared the permanent deformation behavior of different American Railway Engineering and Maintenance-of-Way Association (AREMA) ballast gradations by using an image-aided modeling approach utilizing the discrete element method (DEM). They found that the AREMA No. 24 grada-tion in general performed better than other AREMA-specified grada-tions for minimizing ballast settlement in full-scale half-track DEM simulations with repeated loading of a single tie. In order to inves-tigate the effects of imaging-based particle shape properties such as shear strength, lateral resistance, and permanent deformation on the mechanical behavior of the ballast granular assembly, Huang used particles with both high- and low-angularity indexes in the DEM simulations (11). As the angularity of the ballast particles increased, both shear strength and lateral resistance increased.
Although Huang concluded that a mid-range AREMA No. 24 gradation and high-angularity particles improved the ballast layer’s mechanical behavior, his research did not investigate the differences in AREMA No. 24 gradations within the allowed band and the effects of aggregate shape properties on particle packing and therefore opti-mized ballast gradations (11). Findings are presented here from an ongoing ballast DEM modeling research effort at the University of Illinois on statistical analyses of railroad ballast aggregate packing influenced by changes in gradation and particle shape properties. Through the use of coordination number and number of contacts cre-ated in DEM simulations, the AREMA No. 24 gradation is targeted for detailed investigation.
Objective And ScOpe
The main objective of this study is to quantify how even small changes in ballast aggregate gradations and particle shape proper-ties, such as number of crushed faces or angularity, would influence the particle packing of the ballast granular assembly. The method-
ology involves the use of aggregate image-aided ballast particle generation and establishment of a cubical domain to create ballast packing model simulations based on the DEM. To achieve the main objective, the primary focus was on several ballast gradations that fall within the AREMA No. 24 gradation band and three-dimensional polyhedral discrete ballast particles with low-, medium-, and high-angularity categories quantified by image analysis. The DEM simu-lation results are statistically analyzed with the help of important packing properties (i.e., ballast assembly void space, number of par-ticle contacts, and coordination number) to investigate the effects of (a) different gradations systematically varied through the use of the AREMA No. 24 gradation control sieves and (b) the low-, medium-, and high-particle angularity classes.
MethOdOlOgy
University of illinois Aggregate image Analyzer
The flatness and elongation ratio is the ratio of an aggregate particle’s maximum to minimum dimensions. Angularity is the count of sharp corners and fractured or crushed sides. Standard methods to capture these properties such as ASTM D4791 for the flatness and elongation ratio and ASTM D5821 for angularity are not only time consuming but also subjective. To overcome these issues, the approach taken was to develop the University of Illinois aggregate image analyzer to quantify the flatness and elongation ratio, angularity index, and sur-face texture index, which are now recognized as extensively studied and validated indexes to represent the aggregate shape properties and their linkage to aggregate field performance (8, 13, 14).
blOKS3d deM code
BLOKS3D is a DEM program that is capable of modeling three-dimensional polyhedral particles as granular assemblies (11, 15–20). Ghaboussi and Barbosa established the fundamental principles and developed the original code for the BLOKS3D program (18). Nezami (16) and Zhao (17) later modified this program significantly and established new contact detection algorithms, which consider-ably improved the speed of the DEM simulations. These contact detection algorithms were called the fast common plane (19) and the shortest-link (20) methods. Moreover, Huang developed a method to create particle shape libraries for the BLOKS3D program by using aggregate particle images with their morphological properties, flatness and elongation ratio, angularity index, and surface texture index quantified by using the University of Illinois aggregate image analyzer (11). These particle libraries can be combined in DEM sim-ulations to achieve target average angularity index and flatness and elongation ratio morphological properties within a granular ballast assembly.
deM Simulation Studied
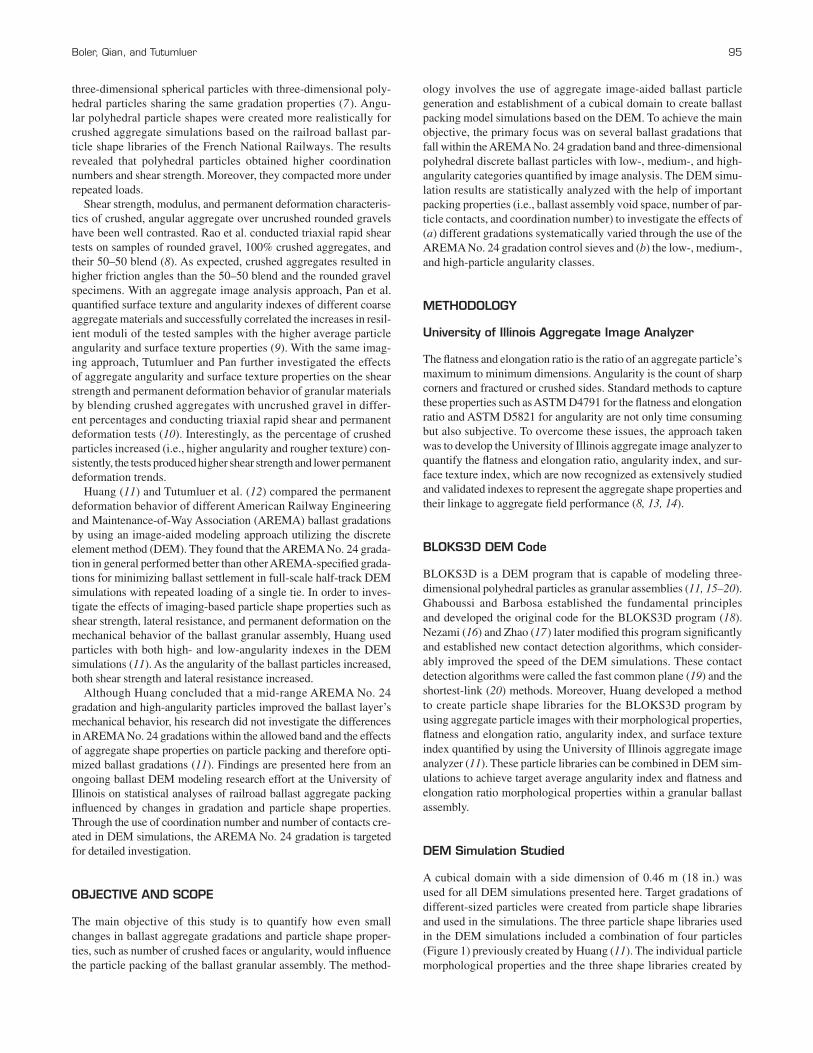
A cubical domain with a side dimension of 0.46 m (18 in.) was used for all DEM simulations presented here. Target gradations of different-sized particles were created from particle shape libraries and used in the simulations. The three particle shape libraries used in the DEM simulations included a combination of four particles (Figure 1) previously created by Huang (11). The individual particle morphological properties and the three shape libraries created by
96 Transportation Research Record 2448
using these particles are presented in Table 1. Each particle defined in the libraries had an equal chance of being picked up by the simu-lation program. Each library also contained cube-shaped particles limited to around 2.5% of all the particles in the simulation. The DEM simulation steps are as follows:
• Create approximately 1,500 particles for the intended target gradation and particle shape properties,• Drop particles to the simulation ground in the cubical domain,• Delete all particles above an achieved height of 0.6 m (23.6 in.),• Place a square 0.46-m compaction plate on top of the particles
dropped,• Apply 344.7 kPa (50 psi) normal pressure for compaction
simulation (application time is approximately 6.74 s),• Delete all particles above 0.5 m (19.6 in.) and continue the
compaction simulation (application time is approximately 0.67 s),
the compaction effort brings the total aggregate particle height to around 0.46 m, and• Report the simulation count of number of contacts created
between particles.
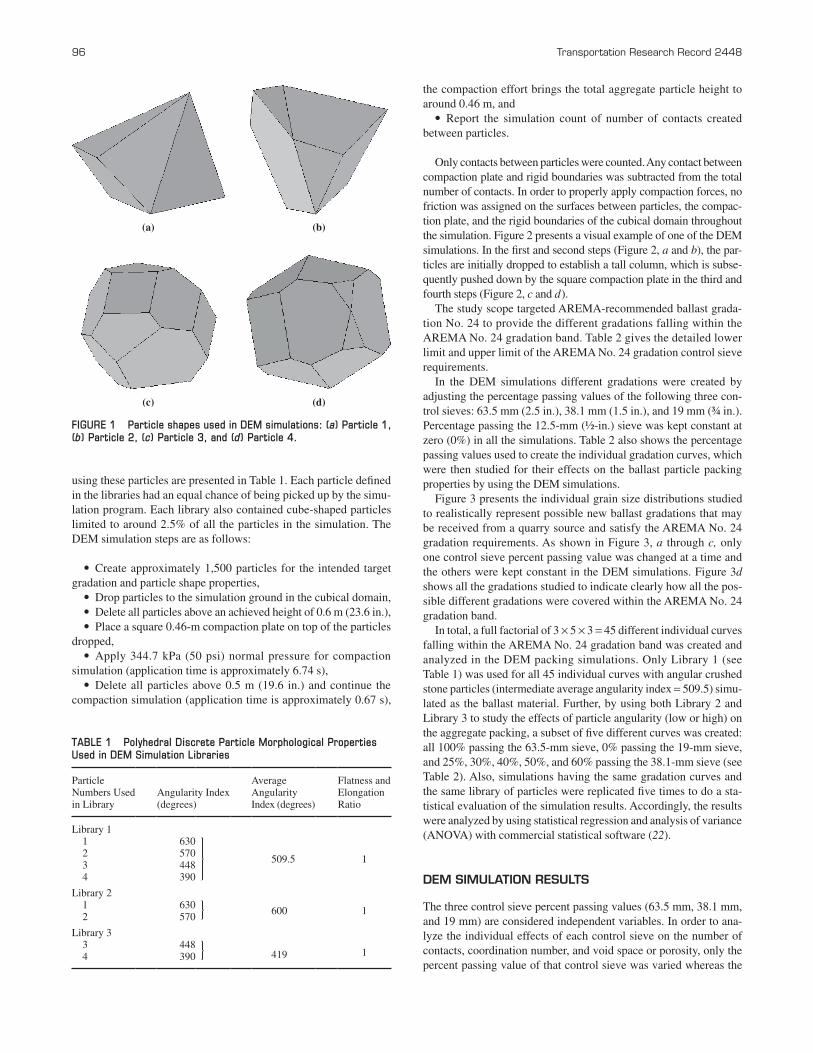
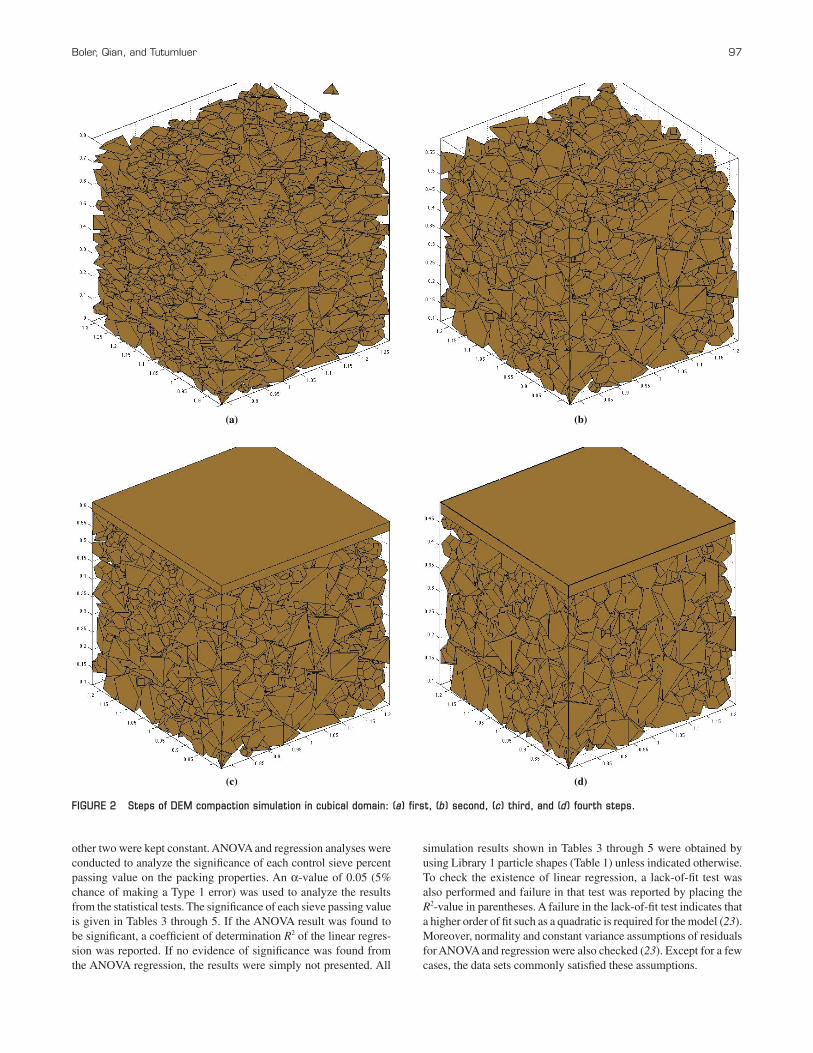
Only contacts between particles were counted. Any contact between compaction plate and rigid boundaries was subtracted from the total number of contacts. In order to properly apply compaction forces, no friction was assigned on the surfaces between particles, the compac-tion plate, and the rigid boundaries of the cubical domain throughout the simulation. Figure 2 presents a visual example of one of the DEM simulations. In the first and second steps (Figure 2, a and b), the par-ticles are initially dropped to establish a tall column, which is subse-quently pushed down by the square compaction plate in the third and fourth steps (Figure 2, c and d).
The study scope targeted AREMA-recommended ballast grada-tion No. 24 to provide the different gradations falling within the AREMA No. 24 gradation band. Table 2 gives the detailed lower limit and upper limit of the AREMA No. 24 gradation control sieve requirements.
In the DEM simulations different gradations were created by adjusting the percentage passing values of the following three con-trol sieves: 63.5 mm (2.5 in.), 38.1 mm (1.5 in.), and 19 mm (¾ in.). Percentage passing the 12.5-mm (½-in.) sieve was kept constant at zero (0%) in all the simulations. Table 2 also shows the percentage passing values used to create the individual gradation curves, which were then studied for their effects on the ballast particle packing properties by using the DEM simulations.
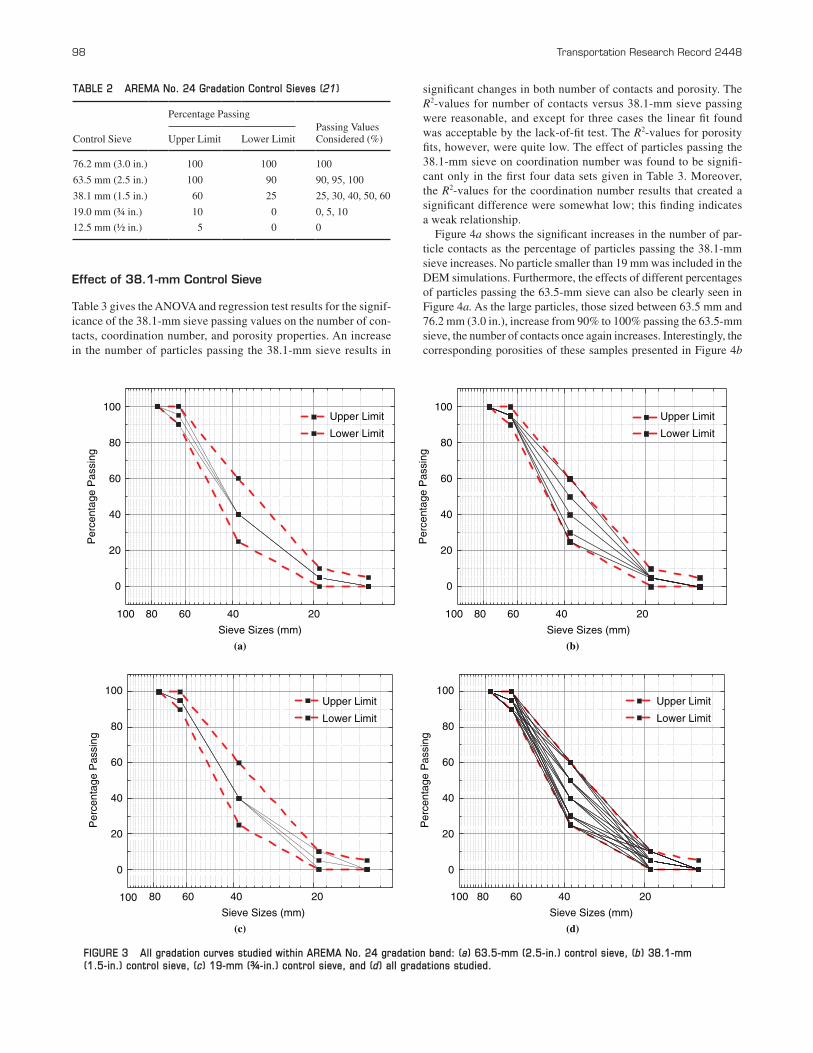
Figure 3 presents the individual grain size distributions studied to realistically represent possible new ballast gradations that may be received from a quarry source and satisfy the AREMA No. 24 gradation requirements. As shown in Figure 3, a through c, only one control sieve percent passing value was changed at a time and the others were kept constant in the DEM simulations. Figure 3d shows all the gradations studied to indicate clearly how all the pos-sible different gradations were covered within the AREMA No. 24 gradation band.
In total, a full factorial of 3 × 5 × 3 = 45 different individual curves falling within the AREMA No. 24 gradation band was created and analyzed in the DEM packing simulations. Only Library 1 (see Table 1) was used for all 45 individual curves with angular crushed stone particles (intermediate average angularity index = 509.5) simu-lated as the ballast material. Further, by using both Library 2 and Library 3 to study the effects of particle angularity (low or high) on the aggregate packing, a subset of five different curves was created: all 100% passing the 63.5-mm sieve, 0% passing the 19-mm sieve, and 25%, 30%, 40%, 50%, and 60% passing the 38.1-mm sieve (see Table 2). Also, simulations having the same gradation curves and the same library of particles were replicated five times to do a sta-tistical evaluation of the simulation results. Accordingly, the results were analyzed by using statistical regression and analysis of variance (ANOVA) with commercial statistical software (22).
deM SiMUlAtiOn ReSUltS
The three control sieve percent passing values (63.5 mm, 38.1 mm, and 19 mm) are considered independent variables. In order to ana-lyze the individual effects of each control sieve on the number of contacts, coordination number, and void space or porosity, only the percent passing value of that control sieve was varied whereas the
TABLE 1 Polyhedral Discrete Particle Morphological Properties Used in DEM Simulation Libraries
Particle Numbers Used in Library
Angularity Index (degrees)
Average Angularity Index (degrees)
Flatness and Elongation Ratio
Library 1 1 630
2 570509.5 1
3 448 4 390
Library 2 1 630
600 1 2 570
Library 3 3 448
419 1 4 390
(a) (b)
(c) (d)
FIGURE 1 Particle shapes used in DEM simulations: (a) Particle 1, (b) Particle 2, (c) Particle 3, and (d) Particle 4.
Boler, Qian, and Tutumluer 97
other two were kept constant. ANOVA and regression analyses were conducted to analyze the significance of each control sieve percent passing value on the packing properties. An α-value of 0.05 (5% chance of making a Type 1 error) was used to analyze the results from the statistical tests. The significance of each sieve passing value is given in Tables 3 through 5. If the ANOVA result was found to be significant, a coefficient of determination R2 of the linear regres-sion was reported. If no evidence of significance was found from the ANOVA regression, the results were simply not presented. All
simulation results shown in Tables 3 through 5 were obtained by using Library 1 particle shapes (Table 1) unless indicated otherwise. To check the existence of linear regression, a lack-of-fit test was also performed and failure in that test was reported by placing the R2-value in parentheses. A failure in the lack-of-fit test indicates that a higher order of fit such as a quadratic is required for the model (23). Moreover, normality and constant variance assumptions of residuals for ANOVA and regression were also checked (23). Except for a few cases, the data sets commonly satisfied these assumptions.
(a) (b)
(c) (d)
FIGURE 2 Steps of DEM compaction simulation in cubical domain: (a) first, (b) second, (c) third, and (d) fourth steps.
98 Transportation Research Record 2448
effect of 38.1-mm control Sieve
Table 3 gives the ANOVA and regression test results for the signif-icance of the 38.1-mm sieve passing values on the number of con-tacts, coordination number, and porosity properties. An increase in the number of particles passing the 38.1-mm sieve results in
significant changes in both number of contacts and porosity. The R2-values for number of contacts versus 38.1-mm sieve passing were reasonable, and except for three cases the linear fit found was acceptable by the lack-of-fit test. The R2-values for porosity fits, however, were quite low. The effect of particles passing the 38.1-mm sieve on coordination number was found to be signifi-cant only in the first four data sets given in Table 3. Moreover, the R2-values for the coordination number results that created a significant difference were somewhat low; this finding indicates a weak relationship.
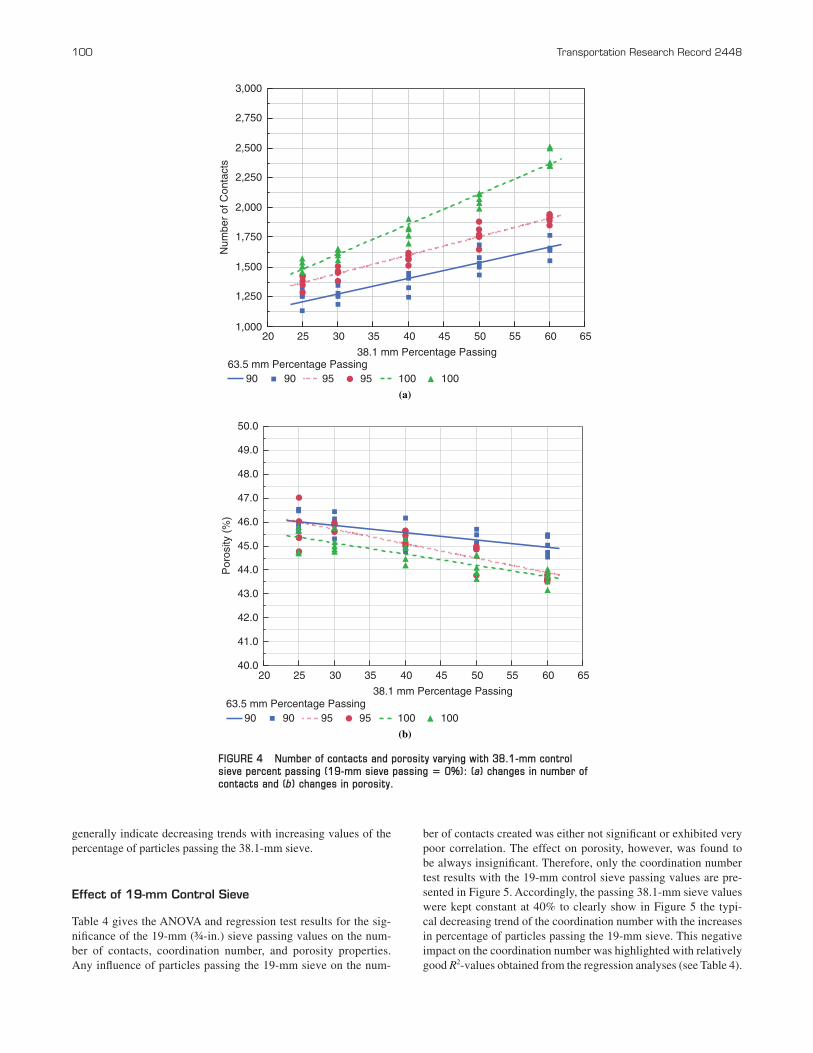
Figure 4a shows the significant increases in the number of par-ticle contacts as the percentage of particles passing the 38.1-mm sieve increases. No particle smaller than 19 mm was included in the DEM simulations. Furthermore, the effects of different percentages of particles passing the 63.5-mm sieve can also be clearly seen in Figure 4a. As the large particles, those sized between 63.5 mm and 76.2 mm (3.0 in.), increase from 90% to 100% passing the 63.5-mm sieve, the number of contacts once again increases. Interestingly, the corresponding porosities of these samples presented in Figure 4b
TABLE 2 AREMA No. 24 Gradation Control Sieves (21)
Percentage PassingPassing Values Considered (%)Control Sieve Upper Limit Lower Limit
76.2 mm (3.0 in.) 100 100 100
63.5 mm (2.5 in.) 100 90 90, 95, 100
38.1 mm (1.5 in.) 60 25 25, 30, 40, 50, 60
19.0 mm (¾ in.) 10 0 0, 5, 10
12.5 mm (½ in.) 5 0 0
100Upper Limit
Lower Limit80
60
40
Per
cent
age
Pas
sing
Sieve Sizes (mm)
20
0
100 80 60 40 20
Upper Limit
Lower Limit
100
80
60
40
Per
cent
age
Pas
sing
20
0
Sieve Sizes (mm)
100 80 60 40 20
Upper Limit
Lower Limit
100
80
60
40
Per
cent
age
Pas
sing
20
0
Sieve Sizes (mm)
100 80 60 40 20
Upper Limit
Lower Limit
100
80
60
40
Per
cent
age
Pas
sing
20
0
Sieve Sizes (mm)
100 80 60 40 20
(a) (b)
(c) (d)
FIGURE 3 All gradation curves studied within AREMA No. 24 gradation band: (a) 63.5-mm (2.5-in.) control sieve, (b) 38.1-mm (1.5-in.) control sieve, (c) 19-mm (¾-in.) control sieve, and (d) all gradations studied.
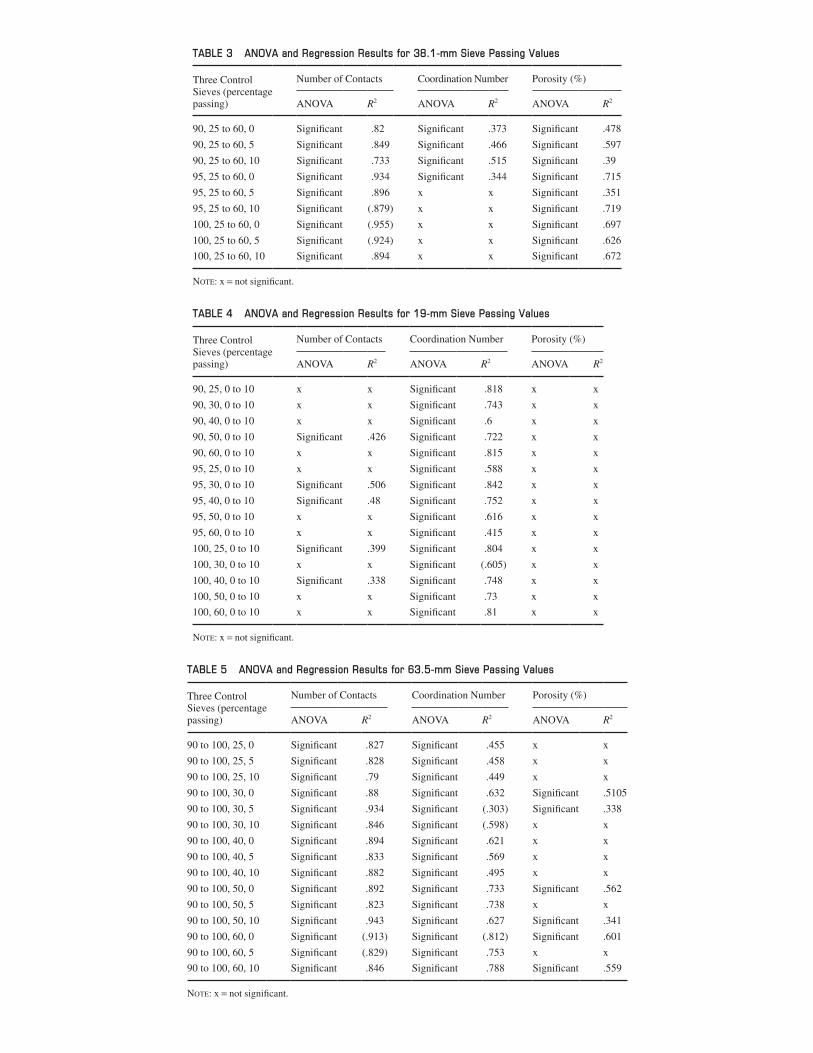
TABLE 3 ANOVA and Regression Results for 38.1-mm Sieve Passing Values
Three ControlSieves (percentage passing)
Number of Contacts Coordination Number Porosity (%)
ANOVA R2 ANOVA R2 ANOVA R2
90, 25 to 60, 0 Significant .82 Significant .373 Significant .478
90, 25 to 60, 5 Significant .849 Significant .466 Significant .597
90, 25 to 60, 10 Significant .733 Significant .515 Significant .39
95, 25 to 60, 0 Significant .934 Significant .344 Significant .715
95, 25 to 60, 5 Significant .896 x x Significant .351
95, 25 to 60, 10 Significant (.879) x x Significant .719
100, 25 to 60, 0 Significant (.955) x x Significant .697
100, 25 to 60, 5 Significant (.924) x x Significant .626
100, 25 to 60, 10 Significant .894 x x Significant .672
Note: x = not significant.
TABLE 4 ANOVA and Regression Results for 19-mm Sieve Passing Values
Three ControlSieves (percentage passing)
Number of Contacts Coordination Number Porosity (%)
ANOVA R2 ANOVA R2 ANOVA R2
90, 25, 0 to 10 x x Significant .818 x x
90, 30, 0 to 10 x x Significant .743 x x
90, 40, 0 to 10 x x Significant .6 x x
90, 50, 0 to 10 Significant .426 Significant .722 x x
90, 60, 0 to 10 x x Significant .815 x x
95, 25, 0 to 10 x x Significant .588 x x
95, 30, 0 to 10 Significant .506 Significant .842 x x
95, 40, 0 to 10 Significant .48 Significant .752 x x
95, 50, 0 to 10 x x Significant .616 x x
95, 60, 0 to 10 x x Significant .415 x x
100, 25, 0 to 10 Significant .399 Significant .804 x x
100, 30, 0 to 10 x x Significant (.605) x x
100, 40, 0 to 10 Significant .338 Significant .748 x x
100, 50, 0 to 10 x x Significant .73 x x
100, 60, 0 to 10 x x Significant .81 x x
Note: x = not significant.
TABLE 5 ANOVA and Regression Results for 63.5-mm Sieve Passing Values
Three ControlSieves (percentage passing)
Number of Contacts Coordination Number Porosity (%)
ANOVA R2 ANOVA R2 ANOVA R2
90 to 100, 25, 0 Significant .827 Significant .455 x x
90 to 100, 25, 5 Significant .828 Significant .458 x x
90 to 100, 25, 10 Significant .79 Significant .449 x x
90 to 100, 30, 0 Significant .88 Significant .632 Significant .5105
90 to 100, 30, 5 Significant .934 Significant (.303) Significant .338
90 to 100, 30, 10 Significant .846 Significant (.598) x x
90 to 100, 40, 0 Significant .894 Significant .621 x x
90 to 100, 40, 5 Significant .833 Significant .569 x x
90 to 100, 40, 10 Significant .882 Significant .495 x x
90 to 100, 50, 0 Significant .892 Significant .733 Significant .562
90 to 100, 50, 5 Significant .823 Significant .738 x x
90 to 100, 50, 10 Significant .943 Significant .627 Significant .341
90 to 100, 60, 0 Significant (.913) Significant (.812) Significant .601
90 to 100, 60, 5 Significant (.829) Significant .753 x x
90 to 100, 60, 10 Significant .846 Significant .788 Significant .559
Note: x = not significant.
100 Transportation Research Record 2448
generally indicate decreasing trends with increasing values of the percentage of particles passing the 38.1-mm sieve.
effect of 19-mm control Sieve
Table 4 gives the ANOVA and regression test results for the sig-nificance of the 19-mm (¾-in.) sieve passing values on the num-ber of contacts, coordination number, and porosity properties. Any influence of particles passing the 19-mm sieve on the num-
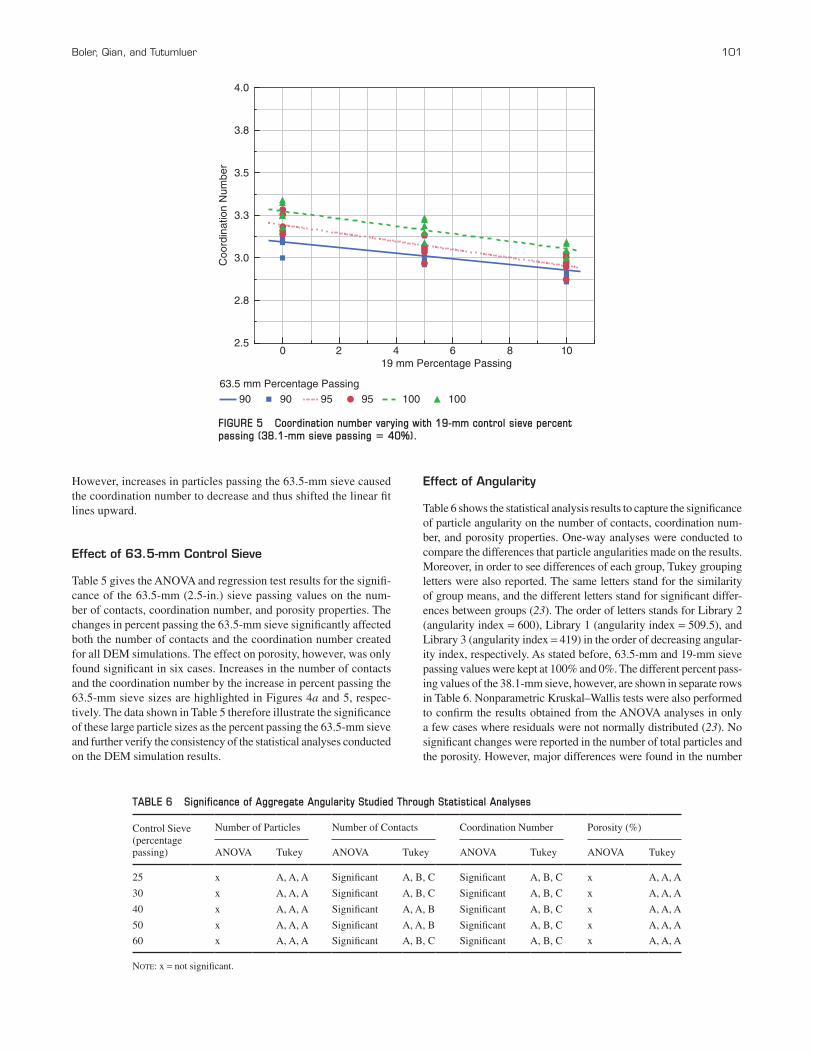
ber of contacts created was either not significant or exhibited very poor correlation. The effect on porosity, however, was found to be always insignificant. Therefore, only the coordination number test results with the 19-mm control sieve passing values are pre-sented in Figure 5. Accordingly, the passing 38.1-mm sieve values were kept constant at 40% to clearly show in Figure 5 the typi-cal decreasing trend of the coordination number with the increases in percentage of particles passing the 19-mm sieve. This negative impact on the coordination number was highlighted with relatively good R2-values obtained from the regression analyses (see Table 4).
FIGURE 4 Number of contacts and porosity varying with 38.1-mm control sieve percent passing (19-mm sieve passing 5 0%): (a) changes in number of contacts and (b) changes in porosity.
Num
ber
of C
onta
cts
1,000
1,250
1,500
1,750
2,000
2,250
2,500
2,750
3,000
20 25 30 35 40 45 50 55 60 65
38.1 mm Percentage Passing63.5 mm Percentage Passing
90 95 10090 95 100
Por
osity
(%
)
40.0
41.0
42.0
43.0
44.0
45.0
46.0
47.0
48.0
49.0
50.0
20 25 30 35 40 45 50 55 60 65
38.1 mm Percentage Passing63.5 mm Percentage Passing
90 95 10090 95 100
(a)
(b)
Boler, Qian, and Tutumluer 101
However, increases in particles passing the 63.5-mm sieve caused the coordination number to decrease and thus shifted the linear fit lines upward.
effect of 63.5-mm control Sieve
Table 5 gives the ANOVA and regression test results for the signifi-cance of the 63.5-mm (2.5-in.) sieve passing values on the num-ber of contacts, coordination number, and porosity properties. The changes in percent passing the 63.5-mm sieve significantly affected both the number of contacts and the coordination number created for all DEM simulations. The effect on porosity, however, was only found significant in six cases. Increases in the number of contacts and the coordination number by the increase in percent passing the 63.5-mm sieve sizes are highlighted in Figures 4a and 5, respec-tively. The data shown in Table 5 therefore illustrate the significance of these large particle sizes as the percent passing the 63.5-mm sieve and further verify the consistency of the statistical analyses conducted on the DEM simulation results.
effect of Angularity
Table 6 shows the statistical analysis results to capture the significance of particle angularity on the number of contacts, coordination num-ber, and porosity properties. One-way analyses were conducted to compare the differences that particle angularities made on the results. Moreover, in order to see differences of each group, Tukey grouping letters were also reported. The same letters stand for the similarity of group means, and the different letters stand for significant differ-ences between groups (23). The order of letters stands for Library 2 (angularity index = 600), Library 1 (angularity index = 509.5), and Library 3 (angularity index = 419) in the order of decreasing angular-ity index, respectively. As stated before, 63.5-mm and 19-mm sieve passing values were kept at 100% and 0%. The different percent pass-ing values of the 38.1-mm sieve, however, are shown in separate rows in Table 6. Nonparametric Kruskal–Wallis tests were also performed to confirm the results obtained from the ANOVA analyses in only a few cases where residuals were not normally distributed (23). No significant changes were reported in the number of total particles and the porosity. However, major differences were found in the number
Coo
rdin
atio
n N
umbe
r
2.5
2.8
3.0
3.3
3.5
3.8
4.0
0 2 4 6 8 1019 mm Percentage Passing
63.5 mm Percentage Passing90 95 10090 95 100
FIGURE 5 Coordination number varying with 19-mm control sieve percent passing (38.1-mm sieve passing 5 40%).
TABLE 6 Significance of Aggregate Angularity Studied Through Statistical Analyses
Control Sieve (percentage passing)
Number of Particles Number of Contacts Coordination Number Porosity (%)
ANOVA Tukey ANOVA Tukey ANOVA Tukey ANOVA Tukey
25 x A, A, A Significant A, B, C Significant A, B, C x A, A, A
30 x A, A, A Significant A, B, C Significant A, B, C x A, A, A
40 x A, A, A Significant A, A, B Significant A, B, C x A, A, A
50 x A, A, A Significant A, A, B Significant A, B, C x A, A, A
60 x A, A, A Significant A, B, C Significant A, B, C x A, A, A
Note: x = not significant.
102 Transportation Research Record 2448
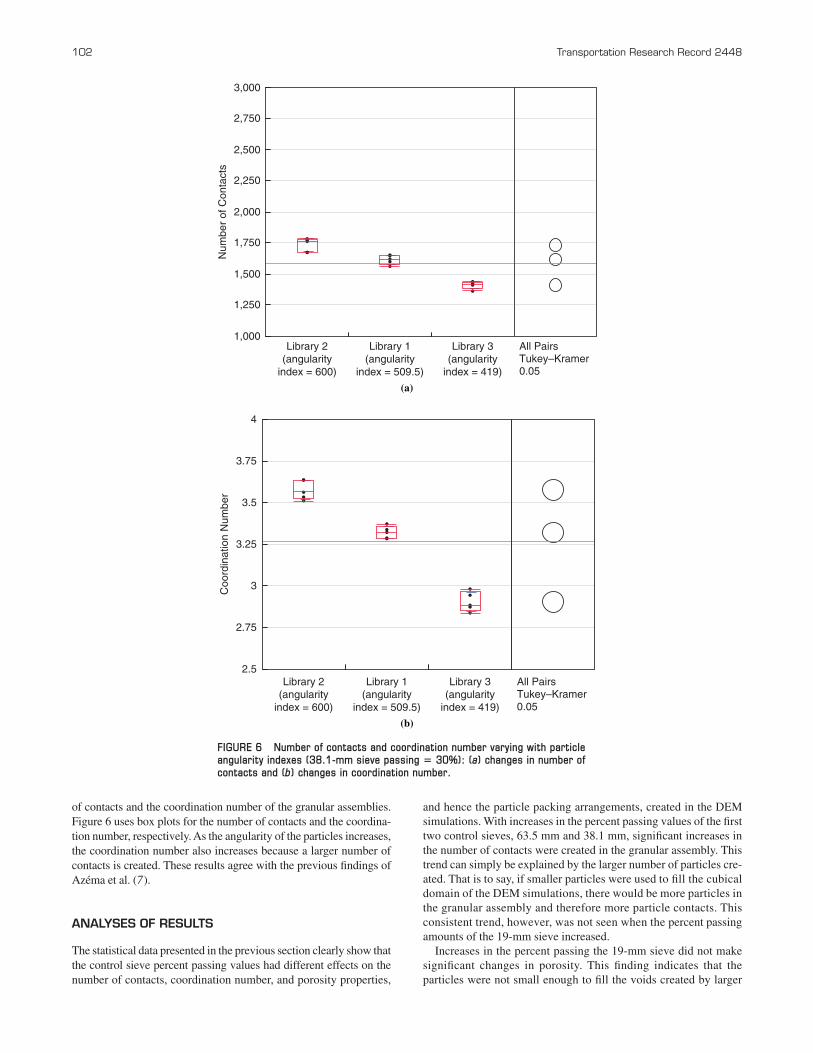
of contacts and the coordination number of the granular assemblies. Figure 6 uses box plots for the number of contacts and the coordina-tion number, respectively. As the angularity of the particles increases, the coordination number also increases because a larger number of contacts is created. These results agree with the previous findings of Azéma et al. (7).
AnAlySeS Of ReSUltS
The statistical data presented in the previous section clearly show that the control sieve percent passing values had different effects on the number of contacts, coordination number, and porosity properties,
and hence the particle packing arrangements, created in the DEM simulations. With increases in the percent passing values of the first two control sieves, 63.5 mm and 38.1 mm, significant increases in the number of contacts were created in the granular assembly. This trend can simply be explained by the larger number of particles cre-ated. That is to say, if smaller particles were used to fill the cubical domain of the DEM simulations, there would be more particles in the granular assembly and therefore more particle contacts. This consistent trend, however, was not seen when the percent passing amounts of the 19-mm sieve increased.
Increases in the percent passing the 19-mm sieve did not make significant changes in porosity. This finding indicates that the particles were not small enough to fill the voids created by larger
FIGURE 6 Number of contacts and coordination number varying with particle angularity indexes (38.1-mm sieve passing 5 30%): (a) changes in number of contacts and (b) changes in coordination number.
1,000
1,250
1,500
1,750
2,000
2,250
2,500
2,750
3,000
Num
ber
of C
onta
cts
Library 2(angularity
index = 600)
Library 1(angularity
index = 509.5)
Library 3(angularity
index = 419)
All PairsTukey–Kramer0.05
2.5
2.75
3
3.25
3.5
3.75
4
Coo
rdin
atio
n N
umbe
r
Library 2(angularity
index = 600)
Library 1(angularity
index = 509.5)
Library 3(angularity
index = 419)
All PairsTukey–Kramer0.05
(a)
(b)
Boler, Qian, and Tutumluer 103
particles. Vavrik et al. defined these particles as interceptors, the particles between half sieve and primary control sieve (24). The pri-mary control sieve was described as the sieve size in which smaller particles filled the voids created by larger particles. The half sieve was defined as the half size of the nominal maximum particle size, which was the first sieve above the sieve that retained more than 10% of the particles. In the AREMA No. 24 gradation, the nomi-nal maximum particle size is 63.5 mm; the half sieve is the sieve smaller than 31.5 mm (1¼ in.), which is 19 mm; and the primary control sieve is the 12.7-mm (½-in.) sieve size. Those particles smaller than the 19-mm sieve size were considered as interceptors in the DEM simulations. Increases of these interceptors simply cre-ated a disruption in the large particle skeleton when these large par-ticles were separated. The coordination number decreased with the increase in interceptors; this change verified such a disruption in the large particle skeleton. However, both the coordination number and the number of contacts increased with the increasing percent passing amounts of the first control sieve. These findings clearly demonstrate the importance of increasing particles between nomi-nal maximum particle size and half sieve while limiting particles over the nominal maximum particle size and particles between the half sieve and the primary control sieve.
As stated earlier, one of the crucial functions of railroad ballast is its drainage ability. In order to provide proper drainage, larger air void contents or porosities need to be maintained in the ballast layer. Increases in the percentages passing the 63.5-mm and 38.1-mm sieves were highlighted from the DEM simulations to have statisti-cally significant effects on porosity. However, the sample porosi-ties created were usually over 40% for typical new, clean ballast gradations simulated in this study. Any increase in smaller particles considered in the simulation cases would not affect drainage of the ballast layer significantly.
As expected, changes in particle angularity, quantified by low, intermediate, and high values of imaging-based angularity index, did not affect the number of particles created in the DEM simula-tions. However, they significantly increased the coordination num-ber eventually reflected in the number of contacts created. These findings clearly show the importance of aggregate angularity in affecting the particle packing and hence influencing the mechani-cal behavior of the ballast layer. The use of 100% crushed angular particles over the rounded ones has been well investigated in the laboratory to improve shear strength, resilient modulus, and perma-nent deformation characteristics of granular materials. More angular aggregates provide higher shear strength properties and increased resistance to settlement by their superior interlock and frictional properties (8–11). The results of the DEM simulations further veri-fied the mechanism of this superior interlock by angular particles through their higher coordination numbers and greater number of particle contacts. A higher number of contacts would provide better load distribution through increased density and particle packing and therefore lower wheel load stresses and particle-to-particle contact stress concentrations under wheel loading to eventually reduce bal-last degradation and breakdown. The ballast DEM simulations have proved to be a powerful tool to study and optimize ballast gradations.
SUMMARy And cOnclUSiOnS
A numerical investigation is presented of the effects of different bal-last aggregate gradations, all falling within the AREMA No. 24 gra-dation band, as well as changes in particle angularities (i.e., rounded, subangular versus angular), on granular assembly packing orders.
The methodology involved the use of aggregate image-aided ballast particle shape generation and establishment of a cubical domain to create ballast packing model DEM simulations. The DEM simula-tion results were statistically analyzed (the same gradation curves and the same library of particles were replicated five times) with the help of important packing properties: ballast assembly void space, number of particle contacts, and coordination number (the aver-age number of contacts that one particle makes with its neighbors). Important findings are summarized as follows:
• Of the three control sieves varied within the AREMA No. 24 gradation band for generating gradation curves with slightly dif-ferent percentage passing values, only the 63.5-mm and 38.1-mm sieves but not the 19-mm sieve caused significant increases in the number of particle contacts created in the DEM packing simula-tions. To increase the number of contacts, and therefore the coor-dination number, in a new ballast layer, the number of aggregate particles with sizes between the nominal maximum sieve and its half-size sieve should be increased.• Increases in the percentage passing the 19-mm sieve did not
make significant changes in porosity. This finding indicates that the particles were not small enough to fill the voids created by larger particles.• For the same gradations, high-angularity particles resulted in
larger coordination numbers and thus created a greater number of contacts. This finding is in line with their expected superior shear strength and permanent deformation characteristics over those of rounded particles.• Finally, the ballast DEM simulations have proved to be a
powerful tool to study and optimize ballast gradations.
AcKnOwledgMentS
This research effort was partially supported by the Transportation Technology Center, Inc., through its strategic research initiative on track substructure cofunded by the Association of American Railroads and FRA. The support and the advice from Dingqing Li and David Davis, with the Transportation Technology Center, Inc., are greatly appreciated.
RefeRenceS
1. Selig, E. T., and J. M. Waters. Track Geotechnology and Substructure Management. Thomas Telford, London, 1994.
2. Indraratna, B., W. Salim, and C. Rujikiatkamjorn. Advanced Rail Geotechnology: Ballasted Track. CRC Press/Balkema, London, 2011.
3. Gu, X. Q., and J. Yang. A Discrete Element Analysis of Elastic Prop-erties of Granular Materials. Granular Matter, Vol. 15, No. 2, 2013, pp. 139–147.
4. Ueda, T., T. Matsushima, and Y. Yamada. Micro Structures of Granular Materials with Various Grain Size Distributions. Powder Technology, Vol. 217, 2012, pp. 533–539.
5. Jia, T., Y. Zhang, and J. K. Chen. Simulation of Granular Packing of Particles with Different Size Distributions. Computational Materials Science, Vol. 51, No. 1, pp. 172–180.
6. Al-Raoush, R. Microstructure Characterization of Granular Materials. Physica A: Statistical Mechanics and Its Applications, Vol. 377, No. 2, 2007, pp. 545–558.
7. Azéma, E., F. Radjai, and G. Saussine. Quasistatic Rheology, Force Transmission, and Fabric Properties of a Packing of Irregular Polyhedral Particles. Mechanics of Materials, Vol. 41, No. 6, 2009, pp. 729–741.
8. Rao, C., E. Tutumluer, and I. T. Kim. Quantification of Coarse Aggregate Angularity Based on Image Analysis. In Transportation Research Record: Journal of the Transportation Research Board, No. 1787, Transportation
104 Transportation Research Record 2448
Research Board of the National Academies, Washington, D.C., 2002, pp. 117–124.
9. Pan, T., E. Tutumluer, and J. Anochie-Boateng. Aggregate Morphology Affecting Resilient Behavior of Unbound Granular Materials. In Trans-portation Research Record: Journal of the Transportation Research Board, No. 1952, Transportation Research Board of the National Acad-emies, Washington, D.C., 2006, pp. 12–20.
10. Tutumluer, E., and T. Pan. Aggregate Morphology Affecting Strength and Permanent Deformation Behavior of Unbound Granular Materi-als. Journal of Materials in Civil Engineering, Vol. 20, No. 9, 2008, pp. 617–627.
11. Huang, H. Discrete Element Modeling of Railroad Ballast Using Imag-ing Based Aggregate Morphology Characterization. PhD dissertation. University of Illinois, Urbana, 2010.
12. Tutumluer, E., H. Huang, Y. M. A. Hashash, and J. Ghaboussi. AREMA Gradations Affecting Ballast Performance Using Discrete Element Modeling (DEM) Approach. Presented at Annual Conference of the American Railway Engineering and Maintenance-of-Way Association, Chicago, Ill., Sept. 20–23, 2009.
13. Rao, C., and E. Tutumluer. Determination of Volume of Aggregates: New Image Analysis Approach. In Transportation Research Record: Journal of the Transportation Research Board, No. 1721, TRB, National Research Council, Washington, D.C., 2000, pp. 73–80.
14. Rao, C., E. Tutumluer, and J. A. Stefanski. Coarse Aggregate Shape and Size Properties Using a New Image Analyzer. Journal of Testing and Evaluation, Vol. 29, No. 5, 2001, pp. 461–471.
15. Barbosa-Carillo, R. E. Discrete Element Models for Granular Materials and Rock Masses. PhD thesis. University of Illinois at Urbana–Champaign, 1990.
16. Nezami, E. G. Three-Dimensional Discrete Element Simulation of Granular Materials Using Polyhedral Particles. PhD thesis. University of Illinois at Urbana–Champaign, 2007.
17. Zhao, D. Three-Dimensional Discrete Element Simulation for Granu-lar Materials. PhD thesis. University of Illinois at Urbana–Champaign, 2006.
18. Ghaboussi, J., and R. Barbosa. Three-Dimensional Discrete Element Method for Granular Materials. International Journal for Numerical and Analytical Methods in Geomechanics, Vol. 14, No. 7, 1990, pp. 451–472.
19. Nezami, E. G., Y. M. A. Hashash, D. Zhao, and J. Ghaboussi. A Fast Con-tact Detection Algorithm for 3-D Discrete Element Method. Computers and Geotechnics, Vol. 31, No. 7, 2004, pp. 575–587.
20. Nezami, E. G., Y. M. A. Hashash, D. Zhao, and J. Ghaboussi. Shortest Link Method for Contact Detection in Discrete Element Method. Inter-national Journal for Numerical and Analytical Methods in Geomechanics, Vol. 30, No. 8, 2006, pp. 783–801.
21. Manual for Railway Engineering. American Railway Engineering and Maintenance-of-Way Association, Lanham, Md., 2011.
22. JMP. SAS Institute, Cary, N.C. http://www.jmp.com. Accessed July 13, 2013.
23. Ott, R. L., and M. Longnecker. An Introduction to Statistical Methods and Data Analysis, 6th ed. Brooks/Cole Cengage Learning, Canada, 2010.
24. Vavrik, W. R., W. J. Pine, and S. H. Carpenter. Aggregate Blending for Asphalt Mix Design: Bailey Method. In Transportation Research Record: Journal of the Transportation Research Board, No. 1789, Transportation Research Board of the National Academies, Washington, D.C., 2002, pp. 146–153.
The opinions expressed in this paper are solely those of the authors and do not represent the opinions of the funding agencies.
The Railroad Track Structure System Design Committee peer-reviewed this paper.