Influence of running-in on gear efficiency751491/... · 2014-10-01 · Abstract The general trend...
72
Influence of running-in on gear efficiency Sören Sjöberg Doctoral thesis Department of Machine Design Royal Institute of Technology SE-100 44 Stockholm TRITA – MMK 2014:09 ISSN 1400-1179 ISRN/KTH/MMK/R-14/09-SE ISBN 978-91-7595-258-1
Transcript of Influence of running-in on gear efficiency751491/... · 2014-10-01 · Abstract The general trend...

Influence of running-in on gear efficiency
Sören Sjöberg
Doctoral thesis Department of Machine Design
Royal Institute of Technology SE-100 44 Stockholm
TRITA – MMK 2014:09 ISSN 1400-1179
ISRN/KTH/MMK/R-14/09-SE ISBN 978-91-7595-258-1

TRITA – MMK 2014:09
ISSN 1400-1179
ISRN/KTH/MMK/R-14/09-SE ISBN 978-91-7595-258-1
Influence of running-in on gear efficiency
Sören Sjöberg
Doctoral thesis
This academic thesis, with the approval of Kungliga Tekniska Högskolan, will be
presented for public review in fulfilment of the requirements for a Doctor of Engineering
in Machine Design. Public review: Kungliga Tekniska Högskolan, Room B242,
Brinellvägen 83, Stockholm, on Oct 24, 2014, at 10:00.

Abstract
The general trend in gear industry is an increased focus on gear transmission efficiency.
This thesis focuses on the understanding of how different gear manufacturing methods –
particularly the contribution of the running-in process – affect the surface characteristics
and friction response, with the purpose of increasing gearbox efficiency. The thesis
consists of a summary and five appended papers.
The research hypothesis in paper A and paper B was that the dry elastic contact area ratio
is a descriptive parameter for the contact condition. Paper A deals with the influence of
manufacturing method on the initial contact conditions. The emphasis in paper B is the
changes that occur during running-in and correlating these changes to design
requirements. Paper C examines the influence of manganese phosphate coating and
lubricants, with respect to friction and the risk of scuffing at the initial contact. Paper D
examines the effect of running-in load on the friction response for different surfaces. In
paper E, the question of whether the load during running-in influences the gear mesh
efficiency is further expounded.
The main conclusions of this thesis are that the running-in influences the gear mesh
efficiency; a high running-in load enhances the gear mesh efficiency. The difference in
mesh efficiency is in the range of one tenth of a per cent. Thus, the influence of running-
in cannot be neglected because it is in the same order of magnitude as reported for other
gear efficiency enhancements. Furthermore, the dry elastic contact area ratio presents a
descriptive measure of how surface topography influences the contact, at both a global
(form deviation) and local (roughness) level. The surface topography caused by the
manufacturing method has a significant influence on the contact area ratio. Shaving was
found to have the highest contact area ratio, and would therefore be the best choice if
deviations from case hardening could be minimised. It was also confirmed that surfaces
coated with manganese phosphate raise the limiting load for scuffing failure up to 13
times compared to the uncoated ground equivalent.
Keywords: gears, gear manufacturing, running-in, efficiency, friction, surface
topography


Sammanfattning
Fordonsindustrin har idag en ökad medvetenhet om produkters miljöbelastning. Ett
bidrag till minskad miljöbelastning kan erhållas genom att öka växellådors verkningsgrad.
Denna avhandling handlar om att förstå hur olika tillverkningsmetoder påverkar
friktionen i kuggkontakten och hur kuggytornas egenskaper bidrar till lastbärande
förmåga. Eftersom inkörning används med stor variation var det av särskilt intresse att
utreda hur olika inkörningsmetoder påverkar kuggväxelns verkningsgrad.
En forskningshypotes som använts i denna avhandling är att kontaktareaförhållandet
beskriver kontaktens lastbärande förmåga. Med kontaktareaförhållande avses
förhållandet i kontaktarea mellan den verkliga ytan och den nominellt släta kontaktytan
för en osmord elastisk kontakt. I artikel A utreds hur tillverkningsmetoden påverkar
kontaktareaförhållandet då ytorna är nytillverkade, det vill säga innan de är satta i drift.
Artikel B utreder hur inkörning påverkar kontaktareaförhållandet.
I artikel C studeras hur manganfosfatbelagda kuggytor och olika smörjoljor påverkar
motståndet mot skärning samt friktion vid den initiala kontakten. I artikel D undersöks
hur yta, last och glidförhållande påverkar friktionen under och efter inkörning, och i
artikel E undersöks lastens inverkan vid inkörning med avseende på friktionsförlust i en
kuggkontakt.
Den huvudsakliga slutsatsen är att inkörning påverkar kuggväxelns verkningsgrad;
inkörning med en hög last medför högre verkningsgrad i kuggkontakten jämfört med en
låg inkörningslast. Skillnaden i kuggingreppets verkningsgrad, med avseende på olika
inkörningsschema, påvisades vara något mindre än 0,1 %. Denna procentuella skillnad är
av ungefär samma storleksordning som visats för andra metoder för öka kuggkontaktens
verkningsgrad. Det elastiska kontaktförhållandet mellan den verkliga kontaktarean och
den nominellt släta lastupptagningsförmågan visades vara ett mått på hur yttopografin
påverkar kontakten både globalt (formavvikelser) och den lokal ytfinheten. Signifikant
skillnad i kontaktareaförhållande påvisades mellan de olika yttopografier som genererats
av de olika tillverkningsmetoderna, varför dessa olika tillverkningsmetoder bedömdes ha
olika förmåga till att bära last. Mjukskavda kuggytor hade det högsta
kontaktareaförhållandet av jämförda kuggtillverkningsmetoder, vilket medför att mjuk-
skavning är ett bra val om kvalitetsavvikelser härrörande från sätthärdnings-processen
kan undvikas. Manganfosfaterade kuggytor uppvisade ett motstånd mot skärning som är
upp till 13 gånger större än kuggytor som inte belagts med manganfosfat.
Nyckelord: kuggväxel, kuggtillverkning, inkörning, verkningsgrad, yttopografi


Preface
The research presented in this thesis was performed at Volvo Powertrain Sweden, AB
Sandvik Coromant and at the Department of Machine Design, KTH. The work was
carried out between August 2007 and July 2014. The author would like to take the
opportunity to thank Volvo Powertrain Sweden, Sandvik Coromant and VINNOVA for
funding this research project.
I would like to send some special thanks to the founders of this particular project, and to
the steering committee: Ulf Olofsson and Stefan Björklund for excellent co-authoring
and academic supervision; Karl-Gustav Lurén as the mentor and the expert on gear
manufacturing; Sören Andersson, for the motivation and confidence coaching; Lars
Bråthe, for providing excellent support, and for being the guru in the field of gear
transmissions; Jack Samuelsson for giving balanced guidance during the steering
committee meetings; Mats Åkerblom for our interesting discussions on gears; Sören
Lantz for hiring me at Volvo, which actually started this journey and Willy Åström for
facilitating a continuation of this work.
Anna Eriksson, Alexander Drott, Jerry Wilhelmsson, Lennart Brusved, Lennart
Johansson, Mats Ahlskog, Mattias Åkerlund, Pertti Nikka, Rickard Magnusson, Ulf
Winberg thank you for answering all my questions on gears. I would also like to thank
Anders, Björn, Jens, Kenneth, Petter, Rasmus, Saeed, and Yi for the good spirit at the
KTH-office. The graduate student “clan” in KUGG — Ellen Bergseth, Mats Bagge, Julia
Lundberg Gerth and Mathias Werner —you all made it! It is a joy for me to see the gear
research nicely continued by three more PhD students at the department. Good luck to
you: Martin, Mario and Xin Min!
All my co-authors: Ulf Olofsson, Stefan Björklund, Jon Sundh, Martin Andersson, Mario
Sosa and Ellen Bergseth all deserve some extra recognition because you all contribute by
different viewpoints and experiences, which enlarge the research and life in general. A
journey like this cannot be fulfilled without help and support from all colleagues, present
and former, and friends of course – Thank You All!
Finally, many thanks to my closest family; Cousin Stefan, my sister Christina (including
her entire family…), my parents Daga and Staffan, my daughters Emelie and Julie, and
last but not least my “Swedish wife” Linda, I love you.
Valbo, September 2014
Sören Sjöberg


List of appended papers
This thesis consists of a summary and the following five appended papers:
Paper A
Bergseth, E., Sjöberg, S. and Björklund, S., “Influence of real surface topography on the
contact area ratio in differently manufactured spur gears”, Tribology International, 56
(2012), pp. 72-80.
Paper B
Sjöberg S., Björklund S., and Olofsson U., “The influence of manufacturing method on
the running-in of gears”, Journal of Engineering Tribology, 2011, vol. 225 (10), pp. 999-
1012.
Paper C
Sjöberg S., Sundh J. and Olofsson, U., “Scuffing resistance of gear surfaces: influence of
manganese phosphate and lubricants”.
Submitted to Wear
This paper is an extended version of Sjöberg S. and Sundh J., “Scuffing resistance of gear
surfaces – Influence of manganese phosphate and lubricants”, Conference Proceedings
of 2nd European Conference on Tribology (ECOTRIB 2009), 7-10 June 2009, Pisa, Italy.
Paper D
Sjöberg S., Andersson M., and Olofsson U, “Analysis of running-in using Stribeck
curves, with application to gear mesh”.
Submitted to Tribology International
Paper E
Sjöberg S., Sosa M, Andersson M., and Olofsson U., “A study of the running-in and
efficiency of ground gears”.
Submitted to Tribology International


Additional papers not included in the thesis
Sosa, M.J., Andersson, M., Sjöberg, S., Olofsson, U., “Effect of Assembly Errors in back-
to-back Gear Efficiency Testing”, Proceedings of the International Conference on Gears,
26-28 August, 2014, Lyon, France.
Andersson, S., Sellgren, U., Sundh, J., Sjöberg, S., “Plastic deformation of real contact
surfaces”, Proceedings of the 14th Symposium on Tribology – NordTrib 2010.


Division of work between authors
The work presented in this thesis was initiated by Professor Sören Andersson, Lars
Bråthe, PhD, and Sören Lantz, MSc. It was performed under the academic supervision of
Professor Ulf Olofsson and Stefan Björklund, PhD, and under the industry supervision
of Lars Bråthe, PhD, and Karl-Gustav Lurén, MSc.
Paper A
The experimental work was divided equally between Bergseth and Sjöberg. Björklund
performed the calculations. All authors were equally involved in the writing and editing
of the text.
Paper B
The experimental work and the main part of the calculations were performed by Sjöberg.
Björklund provided the simulation program and performed some calculations. All three
authors were equally involved in the discussion of the results. Sjöberg wrote the main
part and Björklund and Olofsson contributed and assisted.
Paper C
The main part of the experimental work was performed by Sjöberg. Sjöberg planned and
performed the main work including writing the greater part of the paper. The seizure
lathe test rig runs were led by Sundh, who also contributed to the writing by discussing
the results and conclusions. Olofsson assisted and contributed both in writing and
discussion of results, especially the part using stationary pin-on disc.
Paper D
The planning and specimen preparation was performed by Sjöberg and the experiments
were performed by Andersson. All the authors took part in the analysis and discussion of
the results. Sjöberg and Andersson wrote the major part of the paper. Olofsson
contributed and assisted in all parts of the paper.
Paper E
Sjöberg planned the experiment. Sosa and Andersson performed the major part of the
experimental work and facilitated the presentation of the results, while Sjöberg assisted
and contributed to some extent. Sjöberg, Sosa and Andersson were equally involved in
result analysis and in writing the paper. Olofsson contributed and assisted in all parts.


Contents
1 Introduction ........................................................................................................................... 1
2 Gear Manufacturing .............................................................................................................. 5
3 Gear Metrology ................................................................................................................... 13
4 Running-in............................................................................................................................ 18
5 Gear Efficiency .................................................................................................................... 22
6 Experimental and Calculation Methods .......................................................................... 24
7 Summary of Appended Papers ......................................................................................... 36
8 Discussion ............................................................................................................................ 43
9 Conclusions .......................................................................................................................... 50
10 Future Work......................................................................................................................... 51
11 References ............................................................................................................................ 52
Appended papers
A. Influence of real surface topography on the contact area ratio in differently
manufactured spur gears
B. The influence of manufacturing method on the running-in of gears
C. Scuffing Resistance of gear surfaces: influence of manganese phosphate and
lubricants
D. Analysis of running-in using Stribeck curves, with application to gear mesh
E. A study of the running-in and efficiency of ground gears


1
1 Introduction
Gears and gear transmissions are used to change a machine’s motion characteristics,
whether it is a change in the type of motion – from rotary to linear, linear to rotary, linear
rotary motion to non-linear rotary motion – or simply a change in the torque and velocity
output of a revolving shaft (rotary to rotary). The gear transmission is an old invention
that has evolved through centuries, in terms of gear teeth and the complexity of
transmission. The cylindrical involute is the predominant gear geometry in speed-shifting
gear transmissions for commercial vehicles. The involute gear tooth is shaped as a part of
a spiral, which evolves from the so-called base circle (Figure 1). The main reasons for the
dominance of this geometry are its high efficiency and imperviousness to variations in
centre distance between the meshing gears.
Figure 1. The involute spiral evolves from the base circle, which can be understood as the motion a string end performs when rolled off a cylinder, shown on left-hand side. The right-hand side shows a cut away segment of a cylindrical involute gear. The pitch circle is defined as the diameter where the tooth thickness has the same circular measure as the void between the two adjacent gear flanks.
Today, gear efficiency in a gear contact can be over 99% [1]. Even so, the automotive
industry is striving to lower environmental impacts, which has led to scrutinising every
component in a commercial vehicle. A modern gearbox (Figure 2) has several speeds,
which are built up by a number of gear wheel combinations. All the gear wheels are not
transmitting load at the same time. Some gears are loaded while others are simultaneously
free rolling. The gear box’s efficiency depends on the sum of all efficiency losses
resulting from loaded and unloaded gear contacts, the seals, the lubricant and the
bearings. If these losses can be reduced, the fuel consumption of the vehicle will decrease
to the same extent.

2
Figure 2. Automated mechanical gearbox "I-shift", Volvo Powertrain©.
The typical gear geometry in an automotive gear box is the cylindrical involute gear. This
type of gear can be manufactured by a number of methods, such as hobbing, shaping,
shaving, honing and grinding, to name the most common. They all have different
characteristics in terms of gear quality, productivity and cost of production. Gear
efficiency is the result of the contacting surfaces’ motion, surface characteristics and use
of lubrication. This field, the science of friction, wear and lubrication, is commonly
known as tribology. Gearbox efficiency (or rather efficiency losses) can be divided into
two sub-classes, namely speed-dependent losses and load-dependent losses [2]. Speed-
dependent losses are those affected by the speed of rotation and the viscosity of the
lubricant, such as losses due to the resistance created by the shearing and accelerating of
the oil when the gear wheel dips into the lubricant. This type of loss occurs owing to the
action of the lubricant being scooped up by the gear tooth; lubricant adheres to the side
of the gear wheel (churning), the lubricant is squeezed between the mating gear tooth and
the opposite gear tooth gap. The losses due to turbulent flow of lubricant/air mixture
(windage) and the friction between seals at the shaft/housing interface. Load-dependent
losses are the friction loss between the mating gear flanks and at the rolling bearings. If
one were to reduce the viscosity of the lubricant (either by raising the temperature or a
reducing the bulk viscosity) the speed-dependent losses will decrease. The load-
dependent losses do not necessarily decrease, and will likely increase due to the changed
contact situation at the gear flank interface. Xu et al. provides a general summary of gear
efficiency research up to 2007 [3].

3
1.1 Gear research network
The work presented in this thesis was initially a part of the Swedish research programmes
KUGG, and the subsequent Sustainable Gear Transmission Realization funded by
Vinnova and participating corporations, such as Volvo, Scania, Sandvik Coromant,
Swepart Transmission and Albin Components, to name a few. The basic idea of the
research network was to have each sub-project contribute to a technological gear area
that is important for ensuring future gear production in Sweden. The intention was that
the results from the various areas would be larger than that of the individual
contributions, the holistic view. Four more PhD students were involved in the project:
Julia Lundberg Gerth at Tribomaterials Group, Uppsala Universitet; Mathias Werner at
Production Engineering, KTH; Mats Bagge, at Scania and Production Engineering,
KTH; and Ellen Berghseth at Machine Design, KTH. Lundberg Gerth focused her
research on gear-cutting tool performance [4]. Werner focused his research on the gear-
cutting process [5]. Bagge focused his research on the process planning of precision parts
[6], [7]. Bergseth focused her research on the tribological design of gear contacts [8]. In
addition, research activities were performed on gear material in the Vinnova-funded
OPTIMA research programme, by two doctoral students, namely Karin Björkeborn at
the Department of Materials and Manufacturing Technology, Chalmers University of
Technology, and Matilda Tehler at Material Science and Engineering, KTH. Björkeborn
focused her research on the machinability of case-hardened steel [9] and Tehler focused
her research on the phase transformations and thermal expansion of gear materials
during heat treatment [10].

4
1.2 Objective
To further enhance gearbox efficiency, the link between the functional properties of a
gear surface and surface design tools must be strengthened; the development of
manufacturing methods must be improved and higher use made of the gear flank
interface. Knowledge of gear surface characteristics in terms of low friction and increased
resistance to gear failure must be further developed, and at the same time, an emphasis
must be put on production economy.
The objective of this thesis is to enhance the understanding of how different gear
manufacturing methods – particularly the contribution of the running-in process – affect
friction response and surface characteristics, in order to increase gearbox efficiency.
1.3 Research outline
The objective of this thesis is the surface topography aspect of gear efficiency. As
characterised by surface topography parameters, a virgin surface has different properties
in comparison to a surface that has been in operation. Therefore this thesis starts by
investigating the properties of virgin surfaces when manufactured by different gear
manufacturing methods. How can one characterise and compare different manufacturing methods?
(Q1) The same surfaces were then compared after running-in. Does running-in change the
load carrying capacity? (Q2) The Stribeck curve depicts the friction response under the
influence of lubricant viscosity, speed and load. The transitions between lubrication
regimes are governed by the surface roughness, speed, viscosity and load, where the
lambda ratio is used to differentiate the different regimes. The surface topography is
thereby linked to the Stribeck curve. Manganese phosphate is often used as a surface
coating on gears, but it makes the initial surfaces rougher and the coating process creates
pits in the metal surface that might promote crack initiation. What purpose does manganese
serve as a gear flank coating? (Q3) Does it retain lubricant and thereby serve as a lambda ratio enhancer
and/or does it promote running-in? (Q4) Different manufacturing methods create different
surface topography (or even surface integrity) and the manufacturing methods have
different abilities to withstand load. Does this mean that running-in affects the gear efficiency?
(Q5) One starting point for answering this question was to investigate how the load is
applied during running-in and its effect on the friction response.
This thesis is delimited to the gear teeth contact interface, in other words, the tribology
of the contact as characterised by its manufacturing method, lubricant viscosity and load.
The thesis does not include gear tooth design, dynamics or lubricant additive function.
The work presented in this thesis is performed mainly by experimental research.

5
2 Gear Manufacturing
2.1 Gear production process
Process planning, an important part of all manufacturing activity, is done to ensure
quality and a productive process. Gear manufacturing is no exception. Since gear
manufacturing is complex and the product and production processes continually develop
over time, there is need for a structured way of utilising knowledge transferred from
earlier products and experienced process-planning engineers. Bagge proposed a
methodology for process planning of gear transmission parts [6], [7]. He concluded that
it is important to examine the documentation related to the finished product and to
follow the process back to the original blank material, always focusing on the functional
surfaces and their accompanying reference datum. Bagge also pointed out the necessity
of having a structured methodology for documenting each process plan (including the
background for decisions and current delimitations), in order to enable knowledge
transfer for future investment decisions and process planning. A schematic view of the
process planning flow is shown opposite the product progression through the
manufacturing sequences in Figure 3.
Figure 3.The mindset of process planning, beginning with the finished product versus the product’s actual manufacturing sequence [7].
Final
machining operation
Ma
nu
factu
rin
g s
eq
ue
nce
Pro
cess p
lan
nin
g flo
w
First machining
operation

6
Even when well-performing process planning is applied with respect to functional
surfaces and datum, gear manufacturing methods do not entirely determine the gear’s
quality class. This also depends on gear design, the material, and heat treatment
properties. As such, it is hard to place a specific manufacturing method into a specific
gear accuracy class. However, with regard to case-hardened gears for heavy duty
commercial vehicles, a rough classification can be made, ordered by increasing gear
accuracy: hobbing, green-shaving, gear honing and gear grinding, although the different
methods overlap each other in terms of gear accuracy class. A choice of typical
manufacturing sequences for gear wheels is presented as a flowchart in Figure 4.
Figure 4. A schematic flowchart of the gear manufacturing process. The left side represents gear manufacturing where no work is done on the gear tooth after heat treatment. The right side represents gear manufacturing when the gear tooth is finished after heat treatment.
2.2 Materials and heat treatment
Gears for heavy duty commercial vehicles are mainly manufactured using case-hardened
steel. This means that the core of the gear is tough and the surface is hard. Case-
hardening is used because the surface must be able to withstand high contact pressures
during the rolling and sliding motion through the gear mesh, and the core must be tough
enough to withstand the stresses imposed by tooth bending. Typical heavy duty gear
steel, for example, grade 16CrMn5, has a ferrite-pearlitic structure, which is normally heat
treated after forging to enhance its machinability. In the hardened state, the phase
composes of tempered martensite with a fraction of retained austenite. The hardening
process used is often gas carburizing. Gear material research focuses on enhancements of

7
both material properties [11] and heat treatment processes [2], [9] and [10]. Temmel [11]
found that the fatigue limit in short-transverse direction could be increased from 50% to
92% of that in the longitudinal direction (with respect to deformation direction) by
reducing manganese sulphides and, even more powerfully, by calcium-treating the
sulphides. Hence, a quasi-isotropic material could be created. The change in manganese
sulphide content showed no reduction in machinability at high cutting speeds, although
change at low cutting speeds must be investigated further. Björkeborn [9] found that the
pearlite nodular size had greater influence on the tool wear and chip breakability than the
pearlite morphology, and that increased nodular size enhanced machinability but also
increased tool wear. To date, Tehler [10] has shown correlating results on simulated and
experimentally determined dilatometer tests, which stand as a base platform for further
development of a material model for volume changes during phase transformation in the
heat treatment of gear wheels. More information on metallography and microstructures
of case-hardened steel can be found in the ASM Handbook, Vol. 9 [12].
2.3 Gear tooth generation by hobbing
Hobbing is a milling process performed using a worm-shaped milling cutter. The
intermittent milling process generates the gear tooth through a combination of tangential
rolling motion and axial and radial feed motion (Figure 5, left). Nowadays, the synchronic
motion between the hob and the gear blank is controlled by electrical drives, although
this is performed by gear trains on older machines. The hob has the geometry of a worm
wheel with axially oriented gashes, which forms the hob teeth. One row of hob teeth can
be seen as a gear rack, which generates the involute shape through the tangential rollover
(Figure 5, upper right).

8
Axial feed
Gear blank
rotation
Hob rotation Gear blank
Radial feed
Hob
Figure 5. The motions of a hob creating the gear (left), the generating motion of a gear rack creating the involute gear teeth (upper right) and the resulting gear surface. Note the scalloped surface texture (lower right).
Hobbing generates a scallop-patterned gear flank (Figure 5, lower right). The structure of
these scallops (height, width and depth) depends on the feed motions of the gear hob
and its design. Normally, hobbing is a roughing operation focused on productivity,
although it can sometimes be used as the final tooth forming operation. Other feed and
speed settings are used when hobbing is the final gear tooth operation and the shape of
hob teeth might also be slightly different. More information on the hobbing process can
be found in Pfauter-Wälzfräsen [13], Dudley’s Gear Handbook [14] and the Gear Design,
Manufacture and Inspection Manual [15].
2.4 Gear tooth refinement by green-shaving
Green-shaving refers to a shaving operation undertaken when the material is in a soft
condition (cf. a green-body in the powder metal process). The main reasons for using
green-shaving after hobbing is to remove the waviness that results from the hobbing
process, to compensate (in advance) for the distortion that follows heat treatment, to
generate crowning and tip/root modification, and to improve the surface finish. Shaving
is a cutting process using a tool similar in shape to the gear itself, but with gashes (or
serrations) on the shaving tooth. These serrations or gashes form the cutting edge and
chip pocket. In order to facilitate the cutting motion, the workpiece (gear) and shaving
gear cutter have crossed axes, normally at an angle of 10–15. The combination of the
rotating motion and the crossed axes forms a sliding motion of the tool over the gear

9
surface (see Figure 6). The chips formed are needle-shaped, due to the short axial travel
for each cutting edge mesh cycle. There are four major shaving methods that differ in the
way the shaving cutter travels over the workpiece (i.e. the gear): 1) plunge shaving, 2)
diagonal shaving, 3) parallel shaving, and 4) underpass shaving. The surface topography
(lay and structure) is shown in Figure 6. Recent machine tool developments (such as
spherical shaving and power shaving) incorporate more advanced tool travel and/or
driven workpieces to create a more accurate gear and generate higher productivity. More
information on the shaving process can be found in Gear Shaving [16] and Dudley’s Gear
Handbook [14].
Shaving cutter
Work piece/gear
Figure 6. Green-shaving: tool and workpiece (left), chip formation (upper right), and cutting velocities and surface texture of the shaving process (lower right). Pictures, left and upper right, are from Gleason [17].
2.5 Gear tooth refinement by gear honing
The purpose of gear honing is to correct distortions resulting from hardening and to
further enhance gear quality. More specifically, gear honing is used to reduce the tooth-
to-tooth and run-out deviation, enhance the involute shape, generate crowning and
tip/root modification, and improve the surface finish. Compared to green-shaving, the
corrections made with gear honing generate a higher gear quality. This also holds for the
grinding process (as it is performed in a hardened state). The denomination needs to be
distinguished in the methods of gear honing, because there are major differences in gear
tooth quality. Generally, “Fässler-Honing” refers to an older method, where only the tool

10
is controlled and driven, and the workpiece motion is a result of the cutting action
induced by the gear-shaped tool. In the newer power-honing and “spheric-honing”
methods both the workpiece and the tools are controlled by electric drives during the
honing process. This makes it possible to better adjust the gear tooth shape and tooth-to-
tooth deviations than the older method did; it mainly enhances the surface quality.
Honing is an abrasive process, using a tool made of vitrified bonded gear. The shape of
the tool is almost like an internal gear for the external toothed workpiece (gear), and vice
versa for the internal toothed workpiece (gear). Honing is often referred to as a cold
abrasive process, since the heat generated is low due to the relatively low surface speed of
the tool. In order to facilitate the cutting motion, the workpiece (gear) and the honing
tool have crossed axes of 7–25. The inclination angle increases, as the tool is worn and
redressed. The combination of the rotating motion and the crossed axes forms a sliding
motion of the tool over the gear surface (see Figure 7). More information on the honing
process can be found in Dudley’s Gear Handbook [14], Gear Design, Manufacture and Inspection
Manual [15] and in information from machine tool manufacturers such as Gleason-Hurth
[17], Fässler [18] and Präwema [19].
Figure 7. Gear honing, tool and gear (left) [17] and main motions during honing, and resulting surface roughness lay (right).
2.6 Gear tooth refinement by gear grinding
Grinding is an abrasive cutting method, and different from honing with respect to
cutting speeds and temperatures generated. Hard particles (abrasives) cut into the case-
hardened steel surface. The two types of gear grinding: profile grinding and generating
grinding, are based on different principles. These two methods have sub-methods that
are different in terms of shaping motion and/or tool profile. Profile grinding is

11
performed one tooth gap at a time by a single tooth-shaped grinding wheel, whereas each
gear flank (or the two adjacent gear flanks) is ground individually. In generating grinding,
the tool (abrasive) performs a motion similar to the one in the hobbing process. Basically
two kinds of abrasives are used in tools for gear grinding, namely vitrified bonded
abrasive (aluminium oxide) and cubic boron nitride on a steel base. The grain size, shape,
concentration, and bonding matrix are made in a vast variety of combinations and are
selected on the basis of the material hardness of the workpiece to be ground,
productivity, and the surface roughness to be achieved.
Figure 8. Principle motions and stock removal during generating grinding (left), and profile grinding (right). Left figure from [20] and right figure modified by author.
The typical ground surface has a surface texture (or lay) that is almost perpendicular to
the involute profile (Figure 9). Surface roughness is determined by a combination of the
tool composition (grit size and mixture of bonding agent) and the speed of grinding
motion (cutting speed and travelling motion feed). Each specific grinding operation is an
optimisation process involving productivity (and risk of grinding burn) versus the
product specification in terms of shape and surface quality. Karpuschewski et al. provide
a useful summary of the factors influencing this optimisation process [21]. More
information on the gear grinding process can be found in Dudley’ Gear Handbook [14] and
Gear Design: Manufacturing and Inspection Manual [15].
Figure 9. A typical surface pattern of a ground gear flank.

12
2.7 Manganese phosphate coating
Phosphate coatings are used for several applications: as an under layer for paint finishes
(its most common application), as corrosion protection [22], and as an anti-friction
coating on steel parts subjected to sliding [23]. In gear applications, phosphate coating’s
uses are twofold: as corrosion protection and as anti-friction coating. Manganese
phosphate also serves as an oil-retaining coating, facilitating low friction motion and
eliminating wear of the underlying metal [23]. In gear application, the manganese
phosphate coating rapidly wears at the area of gear tooth contact. Hence, the most
common hypothesis is that it serves as catalyst of a mild running-in process. Hiwart et al.
[23] investigated how different annealing processes affected scuffing onset or scuffing
load and found that these properties could be optimised by annealing, although these
processes generated cracks through the crystals. They concluded that these cracks were
not detrimental, but rather served as a lubricant trap.
The main process for applying the coating is to use hot dilute phosphoric acid, preceded
by an accelerating stage. In the last decade or so, the cold dilute phosphoric acid process
has also been introduced into industrial processes. The typical manganese phosphate
surface is crystalline, where the thickness of the coating and the size and density of the
crystals are formed based on the chemical reactions.
More information on different phosphate coatings and their processes can be found in,
for example, Phosphating and Metal Pre-treatment [24], The Phosphating of Metals [25], and
Principles of Metal Surface Treatment and Protection [22].
2.8 Gear flank surface refinement by superfinishing
The commonly accepted name “superfinishing” is a generic term for a few similar
methods of polishing/burnishing surfaces by removing the high asperities leaving the
valleys intact. This creates a mirror-like surface hence the term superfinishing. Isotropic
superfinishing, as described by Metal Improvement Company [26], is a microhoning
method that uses non-abrasive finishing stones and oxalic acids to remove surface
asperities.

13
3 Gear Metrology
The design parameters and denomination of gears are set by gear standards. Which
standards are used depends on geographical location, corporate association, industry
segment and tradition. The most common organisations working with gears are ISO
(World), ANSI/AGMA (North America), DIN (Germany) and JASO/JGMA (Japan).
There is also a wide range of both national and corporate standards. Most standards are
similar but differ in some parameters and/or denominations. As such, it is important to
be certain which standard is used. Otherwise it is easy to interpret gear inspection sheets
incorrectly. Fortunately, standards are becoming increasingly identical, and the
abovementioned risk is decreasing.
A gear’s macrogeometry consists of the design parameters defining the shape of the gear,
such as base diameter, module, pressure angle, and number of teeth. The microgeometry
is the design parameters related to a small but (most of the time) intentional modification
on the tooth shape, such as involute/lead crowning and tip/root relief. With these
parameters come tolerances or measures of deviation from the perfect shape.
In general, gear metrology refers to the inspection of gears in relation to macro- and
microgeometry and surface metrology refers to surface topography inspection. In this
thesis, gear metrology includes both specific gear-related inspection and surface
topography inspection. In a collective view on dimensioning and surface measurement,
one might say that the gear inspection ranges from shape to waviness, and surface
measurement ranges from form to roughness, with an extended focus on waviness and
roughness. There is no distinct border between waviness and roughness [27] since this
border depends on the objective function (e.g. contact pressure or noise emission) and
the surface characteristics resulting from the manufacturing process (see Chapter 3.2).
3.1 Gear inspection
The geometric shape of each gear tooth and its position relative to the gear centre and
the adjacent teeth are inspected at each step of the manufacturing process by a gear
inspection machine. The parameters inspected relate to the shape of the teeth (e.g.
involute form deviation, lead deviation, and lead crowning) and tooth position
parameters (e.g. radial run-out and transverse pitch error). All standards have similar
denomination and evaluation methods, but there are differences that must be observed
when studying a gear inspection sheet. The denominations used in this thesis are those
used by Volvo Group (standard 5082,81) [29].
Traditionally, gear measurements were performed using mechanical measuring devices
and master gears. Now, the gear industry uses computers and microcontrollers, including
computer-controlled measuring devices such as the gear measurement instrument (GMI)
and the coordinate measurement machine (CMM). Most of the instruments are tactile
but some are instruments optical. These technological developments, the increasingly
14
global gear industry and the continually increasing accuracy requirements place new
demands on the gear measuring instrument, such as having a standard norm for the
traceability of accuracy and the filtering of measured data. An example of preparatory
work for the standard norm was a round-robin trial performed at four national institutes
for gear measurement, which examined the involute and helix measurements of a 200
mm diameter helix master and a 200 mm diameter profile master. The results showed
that every institute in the trial performed within the specified uncertainty of their
respective parameter [30]. In 2003, Goch [31] provided a useful state-of-the-art review of
GMIs, measuring methods, and on-going work with standards.
Commercial gear design software such as Calyx [32] and Load Distribution Program [33]
are becoming more advanced in terms of capturing phenomena at a higher level of
complexity. This also increases the demands on gear metrology and enables the
characterisation of the deviations from the calculated design and not just the parameters
as decided in gear standards. As this knowledge increases, the control of production must
develop at the same pace.
Further reading on gear inspection, denomination and quality classes can be found in the
following standards: Volvo Group standard 5082,81, ANSI/AGMA 2015-1-A01, ISO
1328-1, -2, ISO/TR 10064-1, -2, -3, -4, -5 and DIN 3960 to DIN 3963.
3.2 Surface topography
Surface topography is the geometrical shape of the surface and generally it can range
across all amplitudes and spatial scales. The landscape of the Earth can be seen as surface
topography, as can surfaces only nanometres in size. It all depends on the scale one is
interested in examining (cf. the topography of the Earth to the topography of a ball
bearing ball; both share the basic premise in terms of form, waviness and roughness, but
at totally different magnifications). In a machine element context, form is the basic shape
of the object (e.g. cylindrical). Waviness is the deviation from the form that normally
originates from the manufacturing process because of typical turning patterns, and it
originates from the dynamic instability of the machine tool. Surface roughness is the
short wave deviations from the perfectly smooth surface created by dynamics in the chip
generation process. In gear metrology, form and waviness are traditionally measured
using the GMI, and surface roughness is measured using surface roughness measurement
equipment. As there is no distinct border between waviness and surface roughness, as
discussed by Whitehouse [27], it is a challenge to characterise the surface roughness on a
gear flank because the properties of the surface differ depending on position on flank
and manufacturing methods. When discussing two-dimensional (2D) surface roughness,
Whitehouse provided a recommendation on how to treat surface roughness and which
wavelength cut-off should be used to distinguish waviness from roughness. This
recommendation is based on the magnitude of the respective parameter value, not typical
manufacturing features with respect to wavelengths and the lay of typical machine
process surface. As a rule, 2D surface measurements should be measured perpendicular
to the characteristic texture direction. This means that isotropic surfaces only need one

15
measurement direction, whereas anisotropic surfaces need measurements in the
characteristic anisotropic lay directions. Another challenge when performing surface
roughness measurements includes obtaining a filter that captures the different form and
waviness features but does not distort the roughness information.
Figure 10. Two different type of reference line fitting (left), and the principle of waviness and roughness division (right) [27].
Gear surfaces are anisotropic by nature (see chapter 2), which means that great care must
be taken when measuring and evaluating results. In published literature on gear surfaces,
there are as many variations in the selection of cut-off filters, measurement positions and
roughness parameters as there are published articles.
Surface roughness parameters are divided into spatial, amplitude, and hybrid
(combination of spatial and amplitude) parameters. The amplitude parameters are divided
into averaging parameters and extreme value parameters. The most common (and
industry-accepted) parameters are: the arithmetical mean deviation of the profile (Ra), the
extreme value parameters of ten-point height (Rz), maximum height of the profile (Rt),
and maximum profile peak height (Rp). Many other parameters spring from the
roughness amplitude, but they are not as common in industry as those mentioned above.
Examples of parameters, common in research publications, include the root-mean-square
roughness (Rq) and the measures of the distribution density of profile deviations, such as
skewness (Rsk) and kurtosis (Rku) (see Figure 11).

16
Figure 11. Typical shape of surfaces as characterised by skewness and kurtosis (left), and typical values for different manufacturing methods (right) [27]. EDM is short for electro-discharge machining.
Abbot and Firestone were the first to use the so-called bearing area curve, which is the
cumulative amplitude distribution. The material ratio (Rmr) is calculated as the
percentage of peaks above a specified section line. Another set of parameters based on
amplitude distribution is the Rk-family (see Figure 12).
Figure 12. Parameters of the amplitude distribution family Rk [27].
Spatial parameters have not been as widely accepted as amplitude parameters. Examples
of spatial parameters are mean spacing of profile irregularities (RSm) and high spot count
(RHsc).
Other ways of extracting the spatial characteristics of a surface (such as wavelengths and
texture directionality) include using autocorrelation length (ACL) and power spectrum
density (PSD). The latter are not widely used in surface roughness measurements, likely
because of the rather advanced mathematical treatment and computer capacity needed to
calculate them [27].

17
The use of three-dimensional (3D) surface topography measurements has increased
because instruments are evolving quickly thanks to faster and cheaper computers; this
allowing for 3D surface topography that captures functional properties better than a two-
dimensional projection. The evolution of the 2D surface roughness measuring technique
created a “parameter rash”. To prevent this scenario from recurring for 3D surface
roughness, a project was started to develop suitable parameters and to set a common
standard [34]. Today a new standard series of geometrical product specifications (GPS) --
Surface texture: areal (ISO 25178) is being released. The first parts of the standard (part
6, -601, -602, -702) were released in 2010 and the standard is currently being released in
full. More information on surface topography can be found in, for example, Whitehouse
[27], Volvo Group Standard 5068,032 [28], ISO 4287:1997 and the ISO 25178-series.
Table 1 Primary set of 3D surface roughness parameters, according to Whitehouse [27].
Amplitude parameters
Sq Root-mean square deviation of the surface (µm)
Sz Ten-point height of the surface (µm)
Ssk Skewness of the surface
Sku Kurtosis of the surface
Spatial parameters
Sds Density of summits of the surface (mm2)
Sdr Texture aspect ratio of the surface
Sal Fastest decay autocorrelation length (mm)
Std Texture direction of the surface (°)
Hybrid parameters
S Root-mean square slope of the surface (µm/µm)
Sdr Arithmetic mean summit curvature (µm-1)
Ssc Developed surface area ratio (%)
Functional parameters characterising bearing and oil retention properties
Sbi Surface bearing index
Sci Core oil retention index
Svi Valley oil retention index
Sm Material volume (µm3/mm2)
Sc Core valley volume (µm3/mm2)
Sv Deep valley volume (µm3/mm2)

18
4 Running-in
4.1 Introduction to running-in
Running-in is the initial wear and plastic deformation of surfaces in contact, that occurs
for a short time starting with the virgin state of the contacting surfaces as delivered from
the manufacturing process. The running-in period is defined either as the period of time
until a steady-state phase of mild wear is reached or until a frictional steady-state phase is
reached [35]. The transition to mild wear does not necessarily occur at the same time as
the transition to a friction steady state. Blau [35] identified eight different frictional
running-in behavioural curves when extracting data from research (Figure 13). The
different curve shapes indicate there is a great variation because of different
contributions of physical phenomena such as oxidation, plastic deformation, and abrasive
wear debris transfer. The reactions taking place – and thereby describing a specific
running-in curve – are governed by the environment, type of motion, speed, load, and
surface topography. According to Jacobson, surfaces in contact experience new running-
in as soon as a different running condition occurs [36]. This means that if one is to
perform a controlled running-in, the scheme must be designed according to the expected
running conditions, which in the case of heavy duty gears means a broad variety of loads,
speeds, and environmental factors.
Figure 13. Common shapes of friction vs. time curves for sliding metal couples [35].

19
Depending on the initial wear, plastic deformation of surface asperities, and the resulting
stress state [37], changes in microgeometry might have a significant impact on service
life. Roy Chowdhury et al. [38] found that load influences surface smoothening more
than speed does (Figure 14). They also monitored the progression of surface roughness
alteration by plotting a number of surface roughness parameters showing the parameter
change between different sliding distances (Figure 15). Further, if a smoothening of
surfaces takes place, it will affect the lubricating characteristics as the ratio between film
thickness and surface roughness changes, which in turn affects friction. During running-
in in boundary lubrication situations (such as with gears), friction will decrease, and the
transition in the regimes will take place at a lower speed and/or higher load [37]. Few
research studies have been found on the fundamental properties of running-in, which
Blau [39] confirmed. In determining the bearing area, Abbot and Firestone were the first
to address the fundamentals of running-in, according to Blau.
Figure 14. Sequential profiles for different running-in conditions of hardened and tempered steel discs: 1) low load/low speed (LL-LS), 2) high load/low speed (HL-LS), 3) low load/high speed (LL-HS), and 4) high load/high speed (HL-HS) [38]. Each curve represents the surface roughness at a specific sliding distance and each subfigure represents the surface evolution for a specific load and speed combination.

20
Figure 15. Changes of surface roughness parameters during running-in [38].The upper left figure presents the change of the centre line average parameter at increasing sliding distance, the upper right figure presents the asperity height level to the bearing area, the lower left presents a histogram for the normalised peak function at different sliding distances, the lower middle presents a histogram for number of peaks at different sliding distances and the lower right figure presents the evolution of asperity average width and total number of peaks to the sliding distance.
4.2 Running-in of gears
The running-in of gears is most often mentioned as a starting procedure for experiments
on gear efficiency or gear failure mechanisms, although seemingly without any further
attention being given to the mechanisms taking part in the actual running-in. As an
example of the diversity of this research, in studies on gear efficiency Petry-Johnson et al.
[1] used 360,000 revolutions at 60% of maximum load (gear ratio 1:1) when running-in
ground and superfinished gears, whereas Yoshizaki et al. [40] used 22,500 revolutions per
load stage for 11 load stages (9% to 100% of maximum load). Andersson [41] showed
that hobbed gears and green-shaved gears have a short running-in cycle (for his
experimental setting of 300,000 revolutions) and that surface roughness was not
significantly changed. Andersson also presented a partial elastohydrodynamic theory on
the running-in properties of gear surfaces, which was correlated to his experiments. This
method includes the calculation of the coefficient of friction based on a friction model
from Kingsbury, a mixed model on lubrication properties (Newtonian, non-Newtonian),
which depended on the position at the gear and pinion interface, and surface roughness
distribution model that arose from Greenwood and Williamson, as well as Whitehouse

21
and Archard’s theories on the asperity distribution. The method also related the sliding
distance for respective gear flanks by the so-called single point observation technique. A
continuation of this work was undertaken by Flodin [42], who simulated mild wear in
spur and helical gears. Flodin tested different wear models, incorporating both
temperature and oxidative and adhesive models, but found that the linear model
produced the most reliable results in terms of correlation to real wear experiments (see
Figure 16).
Figure 16. Simulated wear of a pinion, each line represent every 10th of wear cycles ranging from 10 to 150 cycles [42].
22
5 Gear Efficiency
5.1 General
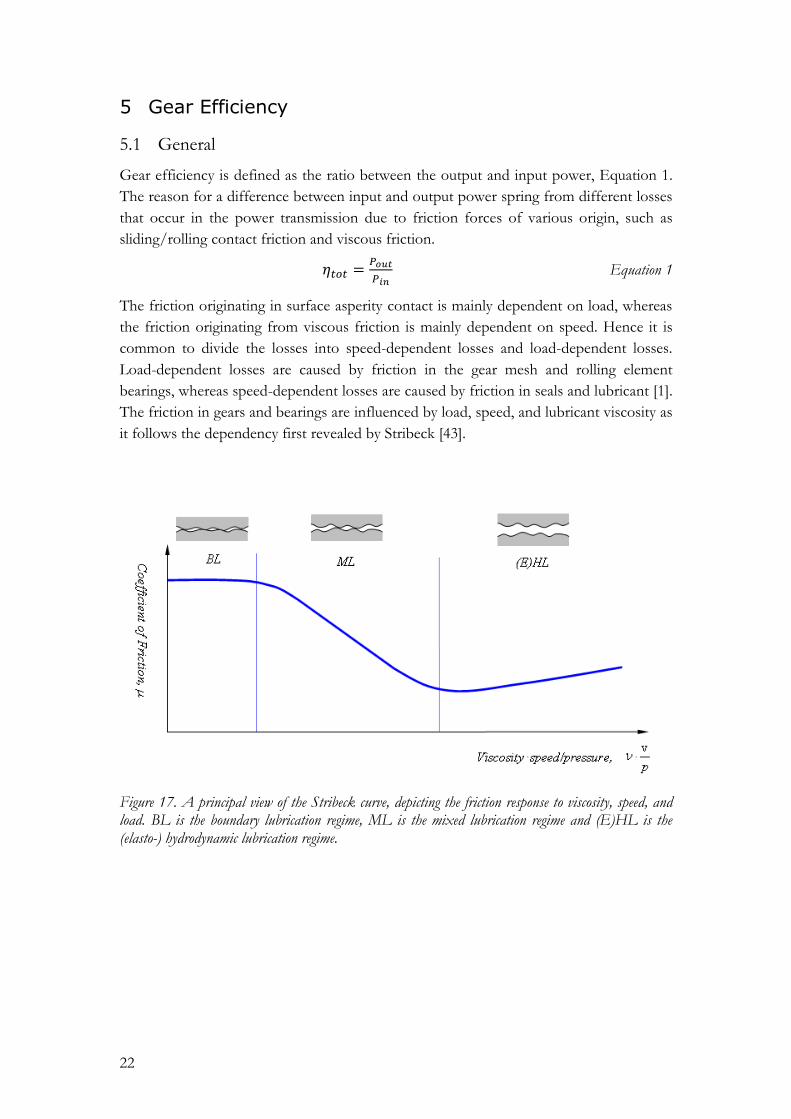
Gear efficiency is defined as the ratio between the output and input power, Equation 1.
The reason for a difference between input and output power spring from different losses
that occur in the power transmission due to friction forces of various origin, such as
sliding/rolling contact friction and viscous friction.
Equation 1
The friction originating in surface asperity contact is mainly dependent on load, whereas
the friction originating from viscous friction is mainly dependent on speed. Hence it is
common to divide the losses into speed-dependent losses and load-dependent losses.
Load-dependent losses are caused by friction in the gear mesh and rolling element
bearings, whereas speed-dependent losses are caused by friction in seals and lubricant [1].
The friction in gears and bearings are influenced by load, speed, and lubricant viscosity as
it follows the dependency first revealed by Stribeck [43].
Figure 17. A principal view of the Stribeck curve, depicting the friction response to viscosity, speed, and load. BL is the boundary lubrication regime, ML is the mixed lubrication regime and (E)HL is the (elasto-) hydrodynamic lubrication regime.

23
The speed-dependent friction arises from: 1) viscous shear in the lubricant as the
lubricant adheres to the moving parts in the gearbox and is stirred (churning), 2)
pumping of the lubricant out of the closing voids in the gear mesh (squeeze), and 3) the
friction between the seal and the shaft. The churning losses are, in addition to speed,
influenced by the lubricant viscosity, fluid flow inertial and gravitational forces, the area,
and the immersion depth in sump lubricated gearboxes. The total power loss as
calculated according Michaelis et al [44] is shown in Equation 2.
Equation 2
5.2 Lubrication
The fundamental task for a lubricant is to counteract wear and minimise friction. This
can be achieved by separating the contacting surfaces by a pressurised oil film, chemical
reactions between additives, and the surfaces creating an easily sheared interface
compound and/or by the lubricant carrying contaminant debris and heat out of the
contact. The lubricant itself has basic physical properties such as viscosity, but density
and dependence on pressure and temperature is also of significant importance. These
properties can either be identified by experiments or calculations. There are different
types of lubricants for gear transmissions: mineral oil, synthetic oil (e.g. polyalphaolefins
and glycols) and environmentally adapted lubricants (esters, etc.). Apart from the basic
properties of the base oil, the characteristics of the lubricants are often enhanced by
additives, such as viscosity improvers, extreme pressure additives, anti-wear additives,
and foam inhibitors.

24
6 Experimental and Calculation Methods
This chapter presents the methods and equipment used in this thesis’s five appended
papers (Appendices A-E).
6.1 Assessment of 3D surface topography and 2D surface roughness parameters
The information on surfaces was gathered by 3D surface topography measurements
and/or 2D surface roughness profiles. The measurements had two purposes: 1) to check
the quality of the manufacturing and 2) to investigate new ways to characterise functional
properties of the gear mesh. The gear flanks of the planet gears used in paper A and
paper B were measured to gather information on 2D-surface roughness and on the
complete 3D surface topography. The 2D surface roughness parameters were used to
correlate test specimens to the real gear surfaces and for quality assurance. The 3D
measurements were used in the contact area calculation in paper A and paper B, whereas
in paper D, the 3D measurements could only be used for a qualitative estimation of the
wear. In paper E, the gear flanks were measured in situ to extract the 2D surface
roughness profile. The surface roughness parameters were the average surface roughness
(Ra), ten-point height (Rz), maximum profile peak height (Rt), and material ratio (Rmr).
In some cases, other parameters were used: asperity slope (Rdq), skewness (Rsk), kurtosis
(Rku), mean spacing of profile irregularities (RSm), and the Abbot and Firestone
parameter Rpk. The sampling length and the upper cut-off was set to 0.8 mm, since this
corresponds to both the recommendations made with respect to absolute values of
asperity amplitude [27] and the Hertzian contact width. The evaluation length was five
times the cut-off wavelength plus the stylus acceleration and retardation length. As a rule,
one should measure the surface roughness perpendicular to the surface structure, which
was done on the specimens for the scuffing tribotest, although it was not done on the
real gear flanks. The reason for this is twofold: the different gear manufacturing methods
generate surface patterns and roughness values that vary over the gear flank (see figures
5–7, 9) and the valid Volvo standard for gear flank surface roughness prescribes that
measurements be made in the profile direction and in gear the width direction. The most
appropriate procedure for 2D surface roughness measurement on gear flanks has not yet
been decided. This problem might be minimised by using 3D surface roughness
parameters ([27], [34]).
The 2D surface roughness was measured with Somicronic Surfascan surface roughness
equipment, a Taylor Hobson Form Talysurf Series 50 mm Intra 2, or a Taylor Hobson
Form Talysurf PGI800. These tactile instruments all use the same type of stylus, namely
a standard conisphere (90-cone with a 2 µm spherical tip radius). All instruments were
calibrated and traceable to national standards.
A Taylor Hobson Form Talysurf PGI800 was used for the 3D surface topography
measurements on gear specimens. This is a stylus-type surface profiler with a gauge
resolution of 0.4 nm, a column resolution of 1.25 µm, and a transverse resolution of 1

25
µm. It is possible to obtain high-density data spacing (0.125 µm) in the stylus drag
direction. The advantage of using a stylus-type profiler in gear flank surface topography
measurement is that it covers a large area with small losses in resolution, and there is
almost no problem with curvature. Drawbacks, on the other hand, are that one must
make room for the stylus in the gear dedendum, the stylus cannot travel over steep edges,
and the process is time consuming. When measuring surface topography on a gear flank,
there are some obstacles to be passed, and a compromise is often necessary. The planet
gears were cut into two sections using a Discotom abrasive cut-off machine and placed
into a simple fixture (Figure 18). The main part of the tested specimens (planet gears)
was measured with the high-density data spacing in the gear width direction (range 0.6–8
µm) and lower-density data spacing in profile direction(20–50 µm).
Figure 18. Three-dimensional surface topography measurement set-up; the cut gear segment rests in its fixture and the stylus is visible at the upper right corner.
An Alicona Infinite Focus G4 was used for 3D measurement of the mini traction disc
specimen. Infinite Focus is a non-tactile form- and roughness instrument that uses the
focus-variation technique, which is included in the international standard series ISO
25178. Since no trustworthy results of either surface texture areal parameter or worn
volume could be extracted from the wear traces, the resulting surface topography was

26
only used for qualitative judgement of the different load, slide-to-roll ratios, and surface
effects on the friction response (paper D).
The Form Talysurf Intra 2 was used for in situ measurement of gear profile surface
roughness in the FZG back-to-back test rig. The measurement equipment was mounted
on a special fixture made for high accuracy of repositioning. For a more detailed
description of the equipment and procedure, see Sosa et al [45].
6.2 Running-in gears for use in numerical contact modelling
The first of two types of real gears used in the research for this thesis were planet wheels
in a planetary gear box. The second type of real gears was a modified FZG-type C-pt
gear (see 6.8). The planet gears were used in the investigation of the influence of
manufacturing method on the running-in of gears (paper B). The running-in was
performed in a test bench. The test bench components had the following set-up: an
electric drive providing the input torque and speed; a 6-speed gearbox for shifting torque
and speed; a planetary gear box (the test gear box) connected the output shaft of the
preceding gear box to the sun gear and the torque output on the planet gear carrier; and
finally an electric drive, which provided the necessary brake moment. The test set-up,
including load stages and time, was set according to an existing running-in schedule for a
forced endurance test. The lubricant was Volvo transmission lubricant 97307. The
system was flushed with fresh oil and filtered between every set-up. Fresh lubricant was
provided at every test run, and pre-heated for one hour before the start of the test and
held at a temperature of 80° C during the test, using a circulating system (pump, heater,
cooler and filter). The lubricant was fed into the gear contact by dip lubrication.
6.3 Numerical contact modelling: the contact area calculation procedure
In order to link functional properties of different manufacturing methods to surface
design requirements, as set on drawings, a numerical contact model was employed.
The basic premises of the contact model are that the material is purely elastic, there is no
traction (i.e. the effect of friction in the contact can be neglected), and the interacting
bodies are modelled as infinite elastic half-spaces. The contact is modelled as dry (i.e.
without lubricating film). The simulation procedure is divided into three stages: 1)
creating the theoretical involute gear flank according to the gear design data; 2) reading
the measured gear surface data and orienting it onto the theoretical involute gear tooth
profile through a manual matrix operation (rotation and translation) using the edges of
the surface as references; and 3) performing a contact calculation at a selected gear roll
angle. This latter step was repeated an appropriate number of times, with the number
being decided on the basis of how many different roll angles were considered sufficient
for one mesh cycle for the single tooth contact and the available computer power.

27
The model of calculation for rough surfaces has been developed by Björklund and
Andersson [48] and was used in this thesis work. A brief outline of the method is given
below.
The contact area is divided into n rectangular cells, each subjected to a uniform unknown
pressure (p). Knowing the gap (h) between the cells before deformation and the applied
normal displacement (z), the solution is obtained from an equation system, which in
matrix form becomes:
hp zC Equation 3
where C is the influence coefficient matrix. Component Cij relates the deformation at cell
i due to a unit pressure in cell j. The sizes and shapes of the real contact areas are not
known in advance. The initial estimate must contain the true contact region, and an
appropriate estimate is obtained by calculating the imaginary contact area that would
result if the surfaces were allowed to penetrate each other without any interaction. In the
course of solving Equation 3, the pressures at cells outside the true contact region
become negative. These cells are then removed and the equation system is solved
iteratively until all pressures are positive. The program can be run using either
deformation or force control. In the latter case the required load is found by iteration.
The assumptions, restrictions and sources of error are discussed below. The geometrical
resolution depends on cell size, which is limited by computing power (i.e. how many
equations can be solved). This means that a small contact – such as FZG test gears – can
be modelled at high resolution, whereas large contacts – such as gears for heavy duty
commercial vehicles – are modelled at lower resolution. In the contact program used for
this work, the maximum number of pressure cells was limited to about 16,000, resulting
in a cell size of 50x50 µm. The cell size provides an indication of the smallest roughness
wavelength accounted for in the contact area calculation. During running, these gears
operate under lubricated condition and therefore are partly carried by a pressurised film
of oil, whereas the model contact is dry. Since the elastohydrodynamic film for heavily
loaded non-conformal contacts is very thin, the difference in pressure distribution
between dry and lubricated contacts is small. Rough surfaces produce extremely high
pressures and subsequently plastic yielding at some spots. If these high pressures are
restricted to a small part of the area, the impact on the total contact area is small. To
ensure that these high pressures did not significantly affect the calculation, the number of
cells with a pressure of 4.0 GPa or more was checked during the calculation. The limit
for acceptance was set to 10% of cells with pressures over 4.0 GPa. Finally, the model
assumes deformations such as infinite half-spaces, which means that the contact area
must be small compared to the size of the bodies. On a local scale, the half-space
assumption is justified by the height-to-width ratio of the surface asperities being low.

28
On the global scale, it is justified by the fact that the influence is the same for the
different manufacturing methods. However, the deflection of the gear teeth is larger at
the edges than in the middle of the contact, which results in an overestimation of the
contact pressures at the edges.
Note: Throughout this thesis the calculated contact area is always referring to the dry
elastic contact, even though it is sometimes mentioned without the dry and elastic
denotation (i.e. the contact area ratio is the same as the dry elastic contact area ratio).
6.4 Transient pin-on-disc
To study the influence of manganese phosphate and lubricant on resistance against
scuffing, a transient pin-on-disc methodology was used. The equipment, a seizure lathe
test rig (SLTR), as well as the methodology, were developed by Andersson and Salas-
Russo [49], and further developed by Dizdar [50] and Sundh and Olofsson [51]. The
equipment is a lathe that has been equipped with a servo-hydraulic controlled actuator
(hydraulic cylinder) mounted on the top slider. The control tower (INSTRON 8500)
originates from a fatigue and tensile testing machine. The forces are monitored in normal
and tangential directions using strain gauges.
Figure 19. Overview of test equipment (Seizure Lathe Test Rig); the accompanying computer is not shown.
The test procedure and set-up are similar to a “pin-on-disc” tribotest. The main
difference was that the present test was performed during less than one revolution of the
test disc. The load cycle was programmed as a single, linearly increasing, load ramp
followed by retraction (unloading). This means that the disc has a unique load at every
point on the contact trace, and the disc surface is in its virgin state at every instantaneous
contact. Lubricant is supplied to the contact region by means of a syringe, which is
sufficient for producing fully lubricated contact. It was important, however, to observe
the amount of lubricant throw-off at higher speeds (due to the centrifugal forces).
Evaluation of each test was performed by studying the force readings (and as a result, the
coefficient of friction), and by optical inspection under a light optical microscope (LOM)

29
and a scanning electron microscope (SEM), together with surface topography
measurements on the contact trace and the pin end. The contact trace on the disc is
correlated to the normal load, and the coefficient of friction curve by means of a
protractor. The accuracy is within 5 on the protractor reading. The resulting accuracy on
the correlation to normal force depends on the specific revolution and load rate at each
setting. The slower it is, the greater the accuracy. The reading error was estimated to be
approximately 30N.
Figure 20. Test specimens mounted in test rig (left), and an illustration of the method used to supply lubricant.
Some sources of error and variation are discussed below. In testing where lubricant is
involved, throw-off occurs from the disc due to centrifugal forces. The amount of
throw-off depends on the rotating speed and the wetting properties of lubricant and test
specimen. At a low rotational speed this is not a great issue, but at higher rotating speed
this was judged to influence the results in a significant manner. It was observed that the
manganese phosphate-coated test specimens did not throw off as much lubricant as the
ground specimens. To minimise this effect, the contact interface was fully flooded using
the syringe at the period of contact.
This methodology is mainly for evaluating material, lubricant, surface topography and
only at pure sliding, but since these are the major factors for scuffing failure, the
methodology was appropriate. The simplifications made (geometry and type of motion)
compared to a gear contact affect the temperature distribution and heat flow, since the
gear tooth has an intermittent engagement, and in this test methodology only the disc
had a single point contact and the pin had continuous engagement. Simplifications like
this are not uncommon in tribotesting although its effect on test results must be carefully
considered before any conclusions are drawn.

30
6.5 Stationary pin-on-disc
To study the running-in appearance and initial wear progression of a manganese
phosphate-coated surface contact pair, a pin-on-disc machine was used. These
experiments were a continuation of the transient pin-on-disc trials described in 6.4. Both
the disc and the pin specimens were from the same batch as for the transient pin-on-disc
tests. The tests were preceded by a pre-test to evaluate machine settings such as lubricant
flow, influence of axial run-out on friction signal, and permitted load for continuous
operation. Each specimen was run by repeated running-in tracks beside each other to
create a total wear track width of approximately 5 mm. The track width was a
prerequisite for the GDOES probe, which was later used to analyse the chemical content
of the contact interface surface (described in 6.6 and 7.3). The lubricant was supplied to
the contact by means of a pneumatically actuated syringe controlled by a PLC). To fully
flood the contact (with lubricant), the amount and interval were set to 0.2 ml/min
(actuation of 0.5 s at 1.6 bar air pressure during a period time of 2.5 s). The limit of axial
run-out was set to 20 µm.
Figure 21. Stationary pin-on-disc during set-up including dial test indicator used for axial run-out measurement and adjustment. In the picture the pneumatically controlled lubricant syringe, and the manganese-phosphate-coated test disc and test pin are visible Foto: Nils Didner.
The advantage of using a pin-on-disc is that one can isolate pure sliding and study its
influence on friction. Another advantage is that the test specimens are of simple
geometry, leading to low manufacturing cost.
Compared to a gear contact, the stationary pin-on-disc has a constant contact which
might lead to a temperature rise in the test specimen. This will likely cause an increased
surface reactivity and sensitivity to scuffing of the surfaces. Another drawback is that the
geometry is a point contact that has different lubricant behaviour with respect to fluid
flow in the contact.

31
6.6 Glow discharge optical emission spectrometry
GDOES was used to analyse chemical composition at the ground/ground interface and
the manganese phosphate/manganese phosphate interface tested in paper C. The
GDOES was used to investigate whether the properties of a worn manganese-
phosphate-coated specimen differed from the unworn specimens as well as to detect
whether tribolayers formed from the lubricant additives and the ground specimens.
The sample to be analysed is placed in a chamber filled with an inert gas, usually argon. A
voltage of 500–1000 V is applied between the sample (cathode) and a hollow anode
creating argon plasma. This ionized plasma sputters the sample surface where the surface
atoms are ejected into the plasma and the atoms are excited by various collisions, wherein
these emit a photon when de-excite to fundamental state. The emitted light shines
through the hollow anode, where an optical emission spectrometer analyses the
characteristic wavelength of respective element.
More information on GDOES can be found, for example, in Glow Discharge Optical
Emission Spectroscopy: A Practical Guide [52].
6.7 Mini traction machine (MTM)
In paper D, a tribological model of the gear contact was set up, using a mini traction
machine (MTM), to elucidate the run in load and slide-to-roll ratio effect on the friction
response. The load and speeds were chosen to mimic the gear mesh friction. Since the
common curvature and slide-to-roll ratio of the pinion and gear constantly change during
the mesh cycle, two operating points were selected. These two were the point of single
mesh (point B on the line of action) and an arbitrary point close to the pitch point
corresponding to the FZG-type C geometry. At the pitch point, pure rolling exists and a
very small amount of wear is expected. Thus, a 10% slide-to-roll ratio was chosen, which
corresponds to a distance of 0.8 mm from pitch point. The MTM consisted of a test disc
and a test barrel (a cylinder with an edge radius), a lubricant reservoir, a lubricant heater,
and a cooling circuit. The edge radius of the barrel was brought in contact with the disc,
creating an elliptic contact spot, which was supposed to imitate a gear contact of a lead
crowned involute gear. The elliptic contact formed by the two counter bodies was
submerged in a fully synthetic (polyalphaolefin) transmission lubricant at 90 °C. Because
the two specimens are mounted on separately driven shafts, the slide-to-roll ratio can be
controlled. The lever holding the barrel also provides the normal force. The friction force
is measured by a force transducer.

32
Figure 22. The barrel and disc specimen were submerged in lubricant of the mini traction machine.
Some of the differences between a gear contact and the tribological model need to be
mentioned. The contact in the configuration was elliptic, similar to a lead crowned
involute spur gear contact. The direction of the semi-axes is shifted ninety degrees to the
lead crowned gear; the ellipse semi-major axis is in the sliding direction, and the semi-
minor axis is perpendicular to the sliding direction. This configuration also results in
different sliding speed on the inner contact radius compared to the outer radius of
contact. Hence, the speed difference will be less if the radial difference is small.
6.8 Running-in and efficiency tests in the FZG test rig
A FZG test rig was used for component tests in an effort to clarify the running-in
influence on gear efficiency. This kind of gear test rig has a power circulating, back-to-
back, configuration (Figure 23). This means that two identical gear boxes (#1 and #3) are
connected forming a closed loop: the pinions of respective gear box are connected to
each other via a shaft and the gears are connected to each other in the same way. The
pinion shaft is split in two where a load clutch (#2) is mounted. The desired gear mesh
load value (power-circulating torque) is accomplished by preventing one of the pinion
shafts from rotating, by securing one half of the load clutch to the frame via a securing
pin, and twisting the other pinion shaft by means of a lever arm and dead weights. The
load clutch bolts are tightened, and the weights, the lever and the locking pin are
removed. A torque meter mounted on the pinion shaft to facilitate monitoring and
logging of inside loop torque. From the slave gearbox (#3 in Figure 23) a shaft connects
to the driving motor (#5). Between the gearbox and the electric motor a torque meter
(#4) is situated and is connected via flexible couplings to minimise effect of
misalignment and run-out.

33
Figure 23. A top view of the FZG gear test rig. The two gear boxes (#1 and #3) and connecting shafts, with the load clutch on the pinion shaft (#2). The torque loss sensor (#4) and electric motor (#5). Figure: M Sosa.
The FZG test rig is equipped with a lubricant cooling circuit and a heater to control the
lubricant temperature (±3 °C). The test rig is controlled by a Siemens S7 control. The
electric motor is a three-phase servo-controlled induction motor, capable of controlling
the speed within 2 rpm as experienced through the trials performed. The torque meter
situated on the power supply shaft is a dual-range Kistler 4503-model torque sensor, with
increased accuracy. The torque sensor can measure torques up to 200 Nm and speeds up
to 8000 rpm, with sensitivity of 0.05 % /10 °C and with a measurement uncertainty of ±
0.08 Nm over the full scale output, including hysteresis.
During the running-in tests, the loss torque was sampled at 144 Hz, and during the
efficiency test the sampling rate was 1 Hz. A study was performed to evaluate the effect
of assembly errors on efficiency measurements [53]. A summary of the sensor
uncertainty and data acquisition resolution is shown in Table 2.
Table 2 Uncertainty and resolution of FZG test rig (from [53]). TGB denominates test gear box and SGB denominates slave gear box.
Parameter Unit Testing
range
DAQ
resolution
Sensor measurement uncertainty
Temperature TGB °C 30-120 0.024 0.03–0.15
Temperature SGB °C 30-120 0.024 0.03-0.15
Inside power loop
torque
Nm 0-302 0.049 0.030
Outside power loop
torque Nm 0-20 0.012 0.080
1
2
5
4
3

34
Some of the advantages of using a FZG test rig (or other back-to-back test rig) are
highlighted here. The FZG test rig is one of the most common test rigs for gears, which
facilitates comparison of research work performed by different researchers. The gear
geometry is standardized for different types of tests, for example, type A intended for
scuffing tests and type C for pitting- and efficiency tests. As the transmission power is
circulating inside the closed loop, the driving power is the losses occurring at that specific
load. This means that the difference between input and output power is measured
directly, which reduces the measurement uncertainty. Note that the driving (motor)
power corresponds to the power loss of two gearboxes.
The drawbacks are that the rig design was initially intended for lubricant testing and so
the easiness and accuracy of gear change has not been prioritized. For maintenance and
for gear replacement in lubricant testing there is a standardized procedure for checking
and controlling the effect of gear assembly and status of the rig. This is done in order to
secure the test equipment repeatability and reproducibility. Unfortunately, this procedure
could not be followed during tests of the gear flank properties because the control and
check procedure would have interfered with the gear surfaces to be tested. When
performing tests related to the gear geometry and gear tooth surface, new sets of gear
pairs are used, which means more assembly and disassembly of larger parts of the test rig
than during lubricant testing. A difference from pitting- and scuffing tests is that both
gear boxes are used as test gear boxes in efficiency tests (sum of losses, see comment
above) and a torque meter is added between the motor and gearbox.
6.9 Power loss and efficiency extraction from FZG test rig measurements
The input power from the motor represents the total power loss of the complete test rig
assembly. In order to discriminate between the complete rig power losses and each
separate loss contribution (from total gearbox efficiency down to mesh efficiency) some
calculations had to be performed. The calculation procedure was the same as in Petry-
Johnson et al [1], except that another bearing loss formula was used in this work. The
total torque loss, Ttotal, was measured by the torque meter between the motor and
gearbox comprising the load-dependent and speed-dependent loss (Equation 4).
Equation 4
In order to discriminate between the load-dependent losses and the speed-dependent
losses, a no-load run was executed before the loaded test runs. The no-load test run was
performed as a start of every sub-trial. The resulting power loss of the no-load test run is
the approximate speed-dependent power loss. Rearranging Equation 4 gives the load-
dependent power loss by subtracting the speed-dependent power loss from the total
power loss (and dividing by two to account for both the gear boxes).
The load-dependent gear mesh friction and bearing friction cannot be separated in the
measured torque loss data. To solve this, a theoretical bearing-friction loss model was
adopted to subtract the bearing loss contribution from the mechanical friction loss. Each

35
gearbox has four identical cylindrical roller bearings. The load-dependent bearing loss of
each bearing was estimated using SKF’s rolling and sliding friction moment formulas
[54].
, Equation 5
where Tbearing denotes the torque loss for each bearing, Mrr denotes the rolling frictional
moment, and Msl denotes the sliding frictional moment. The parameters related to the
bearing are found in the SKF bearing catalogue. Other input parameters needed for the
SKF formula are 1) the lubricant viscosity, 2) lubricant immersion depth, 3) angular
velocity, and 4) axial- and radial load. The gear test rig had a total of eight NJ 406
cylindrical roller bearings, four on the pinion side and four on the wheel side. Similar to
the derivation of load-dependent loss, the mesh loss torque, Tmesh, is derived by
subtracting the sum of bearing torque loss from the load-dependent loss (Equation 6).
The different angular velocities of the pinion and gear were considered according to
Equation 7.
Equation 6
(
) Equation 7
The total efficiency for one gearbox,
(
) Equation 8
where u is the gear ratio and Tpinion is the power circulating load applied by the dead
weight and load lever at the torque clutch (#2 in Figure 23).
The mesh efficiency for one gearbox was calculated according to Equation 9.
(
) Equation 9
where u is the gear ratio and Tmesh is the mesh loss torque for both gearboxes and 0.5 is to
account for one gearbox.
Equation 10 was used to quantify the gain (or loss) due to running-in or change in
temperature.
(
) Equation 10
where Tmesh,1 and Tmesh,2 is the mesh loss for respective test run to be compared.

36
7 Summary of Appended Papers
This thesis consists of a summary and five appended papers (Appendices A-E). Papers A
and B focus on the surface of different manufacturing processes and their ability to be
characterised by a functional property such as load carrying capacity. Paper A is an
investigation of suitability of using the numerical contact model for characterisation of
surface properties. It is also a correlation of 2D surface roughness parameters to the dry
elastic contact area ratio and a comparison with another highly loaded machine element,
namely the rolling bearing. Paper B focuses on the surface changes occurring during
running-in and correlation with design requirements such as gear metrology. Paper C
discusses the influence of the surface coating and the lubricant with respect to friction
and the risk of scuffing at the initial contact. Papers D and E focus on how the running-
in process affects gear efficiency.
7.1 Paper A: Influence of real surface topography on the contact area ratio in differently manufactured spur gears
Paper A addresses the influence of the real surface manufactured by four different gear
manufacturing processes – namely hobbing, green-shaving, gear honing, and generating
grinding – on the dry elastic contact area ratio. The influence of the real surface
topography on the gear performance normally cannot be evaluated by most commercial
gear development tools. Therefore, a contact analysis programme (boundary element
software) was used to calculate the contact area ratio for spur gears produced using four
different manufacturing methods. The contact area ratio is a measure of the ratio of
surface (material) utilisation with reference to a perfectly smooth surface, in other words,
the ratio between real and nominal contact area. The paper includes experimental work
and simulations. The flanks of the gears were measured in 3D and used as input to the
contact area calculations. All test gears were case-hardened; two gears were machined in
the hardened state using honing and grinding, respectively, and two gears were fully
machined in the non-hardened state using either hobbing or hobbing followed by green-
shaving. The measured surfaces were in their as-manufactured state, meaning that they
were virgin surfaces. The elastic material model means that the calculated real contact
area can be seen as a lower value, as plastic deformation increases the contact area. The
model is sufficient if the ratio of cells with contact pressure over the plastic deformation
(4 GPa) is low. The resulting contact area ratios and mean contact pressures is presented
in Table 3. The main findings were that the simulation procedure could be used as a
supplemental tool for the choice of manufacturing method. It should be noted that it
should only be used to compare situations where the same cell size is used. The surface
topography resulting from the manufacturing method used has a big influence on the real
contact area in the early life of the gear.

37
Table 3 Results of the contact calculation for the different manufacturing methods
Real contact
area Ar
[mm2]
Mean contact
pressure
[MPa]
Ratio of cells
with p>4000
MPa [%]
Normal load [N] 2500 11500 2500 11500 2500 11500
Hobbing 0.90 3.8 2800 3000 25 29 Honing 2.1 7.1 1200 1600 0.88 3.2 Green-shaving 2.1 7.1 1200 1600 0.53 2.8 Grinding 1.7 6.0 1500 1900 4.3 10 Smooth (nominal) 3.6 9.6 690 1200 0 0
7.2 Paper B: The influence of manufacturing method on the running-in of gears
Paper B is a continuation of paper A in that the same procedure was used and it
examines the manufacturing method’s influence on the contact area ratio. This paper,
however, focused on the change due to running-in. The hypothesis was that the contact
area ratio is a good figure of merit when it comes to describing how efficiently a surface
supports the load. All test gears were manufactured in case-hardened steel (V-2158-95) to
a surface hardness of HRC 60 and typically 1 mm depth of case. The three
manufacturing methods used were green-shaving, gear honing, and generating grinding.
Gear metrology parameter changes were also compared to the change in contact area
ratio due to the running-in. The main results from this study was that green-shaving
made the largest difference in contact area ratio before and after running-in and that the
contact area ratio after running-in is very high, whereas grinding shows the least change
due to running-in experiences the largest scatter in one mesh cycle and has a relatively
low contact area ratio. Honed gear surfaces showed a moderate change in contact area
ratio, but had the least scatter in contact area ratio of all of the manufacturing methods
compared. Shape parameters in gear metrology did not show any significant change, and
the scatter within each gear was much larger than the change in shape parameters due to
running-in. The main conclusion was that the contact area ratio was a good figure of
merit. It was also concluded that the effects of running-in differ significantly between the
manufacturing methods studied. The shaved gears had the highest contact area ratio after
running-in, and the ground gears had the lowest contact area ratio. The increase in
contact area ratio was about 30% for the shaved gears, 12% for the honed gears and less
than 5% for the ground gears. Extreme value parameters, such as Rp and Rz, showed
relatively good correlation to the contact area ratio. However, no genuine correlation
could be found between contact area ratio and the investigated 2D surface roughness
parameters. It was concluded that traditional gear metrology form parameters do not
serve as a good measure of the changes seen during running-in.

38
Figure 24. The dry elastic contact area for the compared manufacturing methods. The light grey elliptic shaped background corresponds to the smooth surface contact and the black corresponds to the real contact area.
7.3 Paper C: Scuffing resistance of gear surfaces: Influence of manganese phosphate and lubricants
The literature tends to focus on very fine surfaces and low viscosity gear lubricant as a
way of increasing gear efficiency and decreasing churning losses. This change in the
contact situation might lead to an increased risk of scuffing. Paper C addresses the
influence of lubricant, surface and velocity with respect to scuffing load and response to
running-in. Manganese phosphate is a commonly accepted gear surface coating for
improving the life of gears, mainly through better running-in. It might also lower the risk
of scuffing. One possible disadvantage in using manganese phosphate could be that the
coating process uses pickling as a method for the activation of surfaces. Pickling creates
pits in the gear flank, which might have a negative effect on lubricant film formation at
low viscosities as well as on scuffing. A transient pin-on-disc (tribo-model) experiment
was performed with three different gear lubricants, two surfaces types, and two sliding
speeds. All three lubricants were fully synthetic gear lubricants, but with different
viscosity grades or additive formulations. The surfaces compared were ground and
phosphate-coated ground test specimens. The sliding speeds were chosen as one quite
low (0.5 m/s) and one rather high (4 m/s). The load was linearly increased from 0 to
800N and to 4.0 kN for some extra test runs. Since each test run was performed during

39
less than one revolution, the scuffing load could be decided. This also meant that there
was always a fresh surface on one of the contacting bodies (the disc). The main result
was that the phosphated specimens did not suffer any scuffing, even at the high load of
4.0 kN (corresponding to a Hertzian contact pressure of more than 7 GPa). It had a low
coefficient of friction (0.04 and 0.08 at sliding speeds of 4 m/s and 0.5 m/s, respectively).
The non-coated ground specimens experienced scuffing initiation at a low load
(corresponding to a Hertzian mean pressure around 1.9 GPa) and had a higher
coefficient of friction. No significant influence of the different lubricants could be
established. A stationary pin-on-disc running-in trial was added to address the role of
manganese phosphate during running-in. Using the specimen from the same batch as the
former investigation, the effect of running-in was analysed. The result showed that the
manganese-phosphate-coated specimens withstood the load during running-in, although
the general friction level was higher and fluctuated more than the uncoated ground
specimens. The outermost surface was analysed after the running-in using glow discharge
optical emission spectroscopy to distinguish between the differences seen, and to analyse
whether any surface tribolayer had formed during running-in. It was found that the
manganese phosphate compound was still present after running-in, even though it was
not visible. The ground specimen had no detectable tribolayer.
The low friction during sliding seen in the transient test was not repeated in the
stationary test, but a decrease in friction was observed during the repeat trial. It was
suggested that the friction decrease depended on a change of geometry due to wear of
the pin rather than manganese phosphate facilitating lubricant retention.
The main conclusions drawn were that manganese-phosphate-coated specimens
significantly lower the risk of scuffing. The ground specimen had a much lower scuffing
load compared to the manganese-phosphate-coated specimen in both the transient and
stationary trials. Hence, the major function of manganese phosphate coatings on gears is
to facilitate full loading from start of use without the risk of scuffing. Lubricant viscosity
and additives had no significant influence on these results.
7.4 Paper D: Analysis of running-in using Stribeck curves, with application to gear mesh
A frequent supposition made throughout this thesis, and other researchers’ work is that
the superfinished surfaces are better by far than rougher surfaces (shaved, honed and
ground), but the added manufacturing process step increases the production cost.
Therefore, it was interesting to see whether different running-in procedures affected the
friction response and if surfaces of varying surface roughness approach each other in
friction during running-in and operation. Paper D addresses the friction response of
three different surfaces using a factorial design with a combination of load, slide-to-roll
ratio, and surface roughness. Directly after running-in, the specimens underwent a
friction response mapping at different rolling speeds. The experiments were performed
in a mini traction machine (MTM). The load strategies used in the running-in schedule

40
was corresponding to the running-in load of FZG efficiency test [55] and the step-wise
load increase adopted from running-in in paper B, except having a different maximum
load. The steps in the step-wise load schedule had to be adapted to suit the MTM. The
slide-to-roll ratio was selected to correspond to a point near the lowest point of single
mesh tooth contact and an arbitrary point close to the pitch point of the FZG back-to-
back gear test rig (type C gear geometry).
The three surfaces compared were two transverse ground surfaces with different surface
roughness values and a superfinished surface. The surface of the barrel was polished,
equivalent to the superfinished disc specimen. The material in the disc was case-hardened
gear material 16MnCr5 and the material in the barrel was 100Cr6. The lubricant was a
fully synthetic transmission lubricant (PAO), and tests were performed at 90 °C. The
friction behaviour during running-in and the run in surfaces influence effect at different
rolling speeds was logged and analysed. The speed range 3-3160 mm/s was tested.
During the initial part of running-in, both the load and surface roughness influenced the
friction behaviour. At the last part of running-in, only the surface influenced the friction.
During the partial Stribeck test, the friction response was also affected by the different
load and slide-to-roll ratio used during running-in, but even though both the friction
curve shape and the analyses of variance gave a hint of what might govern the friction
response. No convincing conclusions could be drawn from the different running-in
parameters effect on friction response except that the surface finish had great influence
on the friction response. The smooth surface had both lower friction and a steeper slope
of the friction decrease as the speed increased.
Figure 25. The mean friction response during running-in vs. number of contacts (left) and the mean friction response of all the running-in combinations and replicas on the partial Stribeck run (right). The blue represents the rough surface, the red the medium surface, and the black represents the smooth surface. The lighter/dashed lines represent one standard deviation.
The conclusions were that running-in changes the friction response and a high load
results in faster decrease in friction than a step-wise increase in load. The smooth surface
generated a lowest friction response even in the boundary lubrication regime.

41
7.5 Paper E: A study of running-in and efficiency of ground gears
The purpose of paper E was to further clarify the influence of running-in on gear
efficiency, especially of the running-in load. Further, it should clarify and confirm the
indicative trends, the results and conclusions found in paper D, and thereby generalize
from these results.
A FZG back-to-back gear test rig with efficiency test configuration was employed. The
gear geometry used was a modified FZG, type C-pt. The modification was an added tip
relief. The gears were made of case-hardened 16MnCr5-steel ground to meet the
accuracy and surface roughness demands according to FZG gear efficiency test [55].
The test comprised three parts: running-in, efficiency, and surface roughness
measurements. The running-in procedure was adopted from the FZG efficiency test but
half of the tests had the original prescribed load stage 9 (LS 9) and the other half used
load stage 5. These load stages corresponded to pitch point contact pressures of 1.7 GPa
and 0.9 GPa, respectively. The efficiency tests that followed were divided into two
different lubricant temperatures, four loads, and a speed range from 0.5 to 20 m/s (pitch
point velocity). The lowest load stage had no load applied in the power circulation loop
and was performed to separate the speed-dependent losses from the load-dependent
losses. The surface roughness was measured in situ before running-in, after running-in,
and after the efficiency test was completed.
The general result was that the mesh efficiency increased when a high running-in load
was used. The extent to which it affected the mesh efficiency was noted to differ both
because of the load level applied during the efficiency test and the temperature-
dependent lubricant viscosity. The effect of a high running-in load was higher at the
lower lubricant viscosity, but the applied load was also important. The least difference in
mesh efficiency was found when comparing the effect of lubricant viscosity for the high
load run in gears run at high load during the efficiency test. The largest difference in
mesh efficiency was noted when comparing both running-in loads at low lubricant
viscosity. At the low speeds where boundary lubrication, or possibly mixed lubrication, is
supposed to prevail, the scatter of the measurements is larger than at the higher pitch
point velocities. No clear connection between the running-in load and gear mesh
efficiency was detected at low speeds due to the large scatter. The gear mesh efficiency
during running-in was noted to be higher for the running-in using the high load than the
running-in using the low load. On average over the whole range of tested speeds and
load, the high running-in load yielded 0.06 % higher mesh efficiency for the speed range
of 3.2–20 m/s. The scatter was also less for the running-in schedule using high load. The
surface measurement results did not show any significant differences, but the shape of
the asperities was noted to be blunter after running-in. In comparison with the Stribeck
curve it was seen that when viscosity (lubricant temperature), load and speed were
altered, the response on loss torque shifted accordingly to what would be expected.

42
The conclusions were that the load used during running-in has an effect on the gear
mesh efficiency; a high running-in load yielded higher gear mesh efficiency. The influence
of lubricant temperature (i.e. viscosity) on gear efficiency was confirmed, but had less
influence than the load.

43
8 Discussion
The objective of this thesis was to enhance the understanding of how different gear
manufacturing methods – and particularly the contribution of the running-in process –
affect friction response and surface characteristics, with the view of increasing gearbox
efficiency. In the paragraphs below, answers to the questions (Q1-Q5) formulated for the
research are discussed.
8.1 How can one characterise and compare different manufacturing methods? (Q1)
The starting point of this knowledge enhancement process was to investigate methods of
surface topography characterisation and its parameters, and to relate those to the
functional properties (e.g. load carrying capacity). A design engineer wants a method to
evaluate different designs and to link functional requirements to the design specification
as set out in drawings. The production engineer wants flexibility to choose between
manufacturing methods in order to optimise the production flow and minimise
production cost, while fulfilling the demands set out in drawings. Therefore, the
functional requirements of gear surfaces as specified on drawings are vital to both the
design engineer and the production engineer. The conventional design process and
optimisation of gears are principally the same in all business areas, and follow standards
(e.g. ISO 6336) and commercial programs (e.g. Load Distribution Program). The
standards pay little attention to surface roughness, and the effect is resolved using
compensating factors. These surface roughness factors are calculated using values from
run in surfaces, which cannot be obtained before the actual running-in is performed. In
commercial programs there are advanced features for calculating gears with different
microgeometries. These microgeometries can either be design features, such as tip relief
or crowning, or deviations from the manufacturing method, such as bias. Different gear
designs can be evaluated using this methodology, and the best design can be optimised
regarding multi-tooth engagement and its dynamic response. The influence of surface
topography cannot be evaluated. So, how can one characterise and compare different manufacturing
methods? As different manufacturing methods yield different surfaces, a model or
methodology that can distinguish the surfaces as produced by different manufacturing
methods will contribute to our understanding as well as to the optimisation process. A
hypothesis used in this work was that the contact area ratio is a good figure of merit (or a
functional parameter) for how efficiently a surface supports the load (paper A and paper
B). The main advantage in using this methodology is that the complete contact is
calculated using actual curvature, waviness, and surface roughness, leading to a complete
picture at the local contact level. This methodology has, in its current state of
development, the disadvantages that dynamics, multi-tooth engagement, and the
accompanying error and deviations are lost. However, even if such factors have a
significant effect on the contact load, the contact area ratio is still useful for classifying
the surfaces’ ability to carry the load. The contact area ratio methodology can therefore

44
be used as a complement to standards and current commercial gear programs.
Furthermore, if the objective is higher gear efficiency, the influence of the lubricant must
also be incorporated using elastohydrodynamic simulations. Judging from the published
literature, there is focus on these types of simulation, Evans et al. [56], Brandão et al. [57],
[58], Ren et al. [59] and Almqvist [60] to name a few.
Moreover, the surface requirements are traditionally specified on drawings by 2D surface
roughness parameters. The selection of suitable surface roughness parameters – and the
specification to be set on manufacturing documents – is based on experience with earlier
products or product verification testing. In order to link functional requirements (such as
load carrying capacity) to engineering specification, the contact area ratio and traditional
surface roughness parameters were analysed. Surfaces from gears manufactured by
hobbing, green-shaving, honing, and grinding was measured using 2D surface parameters
(paper A and paper B) and correlated to the contact area ratio. It was shown (in paper B)
that the only 2D surface roughness parameters that show reasonably good correlation
with the contact area ratio are the asperity height extreme parameters Rp and Rz, which
are extreme value parameters known to be inefficient due to their instability and
sensitivity [27] [47]. Michalski [65] performed similar work on Fellows-chiselled and
hobbed gear flanks, where contour maps of areal power spectral density and
autocorrelation functions were found helpful in the analysis of surface topography. The
results on autocorrelation lengths in paper A showed that the size of the grid preferable
should have been smaller, around 20 µm instead of 50µm. Since the shaved and honed
surfaces have surface lay with different directions over the gear flank (and are therefore
not suited for fixed measuring angles), 3D surface roughness parameters might have
generated a more stable result. On the other hand, the difficulties experienced when
trying to get a quantifiable measure on the surface alteration during running-in (paper D)
highlighted that even the selection and use of 3D surface parameters are challenging. The
surface change during running-in was also investigated using gear metrology parameters,
for example, involute alignment deviation and lead alignment deviation (paper B). It was
found that the change noticed in gear parameters due to running-in was approximately of
the same size as the accuracy of the GMI. Hence, the surface alteration during running-
in, as characterised by gear metrology parameters, was found not be significant because
of its relation to the gear metrology accuracy. The differences found between each
manufacturing method were expected, because they are normally used for different gear
accuracy grades; grinding and honing produces gears with at least one accuracy grade
higher than those produced by shaving. The change in contact area ratio was not
reflected in gear form parameters, which also supports the suggestion that gear metrology
is not suited for detecting changes affecting contact pressure. As such, there is still a need
for increased knowledge in the practice of surface inspection methods for gear surfaces.

45
8.2 Does running-in change the load carrying capacity? (Q2)
The running-in period is defined either as the period of time until a steady-state phase of
mild wear is reached [46], or until a frictional steady-state phase is reached [35]. The
deformation and wear of surfaces will change the contact situation; hence, steady-state
mild wear will reduce the contact pressure if the surfaces become smoother during
running-in.
Paper A showed that, for virgin surfaces, the dry elastic contact area ratio differed
between the manufacturing methods compared. The results showed that ground gears
had a low contact area ratio. In contrast, the trend is that high-precision gears are
increasingly machine finished, using honing or grinding, after hardening. Finishing after
hardening is used to achieve higher quality grades with respect to, for example, pitch
deviations, profile deviations, and lead deviations. Does running-in change the load carrying
capacity? In paper B it was shown that the running-in increased the dry elastic contact area
ratio for all the surfaces when compared to its as-manufactured (or virgin) surface state.
The ground surface showed significantly smaller contact area ratio than the green-shaved
and honed surfaces. A low contact area ratio implies high surface stresses, leading to an
increased risk of fatigue damage and, consequently, a shortened service life. The irregular
distribution of the real contact area for the ground surface is most likely the result of the
sharp grinding ridges, which are not worn or deformed to the same extent as with green-
shaving or honing during the running-in. Krantz [61] studied the influence of topography
on gear surface fatigue for case-carburized, ground and superfinished gears for
aeronautics applications and observed that the surface topographies of conventionally
ground gears changed substantially during running-in. The superfinishing treatment
removed about 2 to 3 micrometres of material from the ground gear tooth surfaces. This
gear surface was then essentially unchanged during running-in. Krantz’s findings suggest
that the sharp peaks or asperities on the ground surface are removed during running-in,
resulting in a higher contact area ratio. This effect was not noted in the work in this
thesis, but Krantz had a substantially longer running-in period. Höhn et al. [62] tested
different types of rough surfaces in a twin disc test rig to investigate the
elastohydrodynamic parameters of rough contacts. The surface generated by transverse
grinding showed almost no relationship between roughness and film thickness.
Green-shaved and case-hardened gears are seldom used in the manufacture of high-
precision gears today due to the distortion effects they experience during heat treatment,
which results in a coarse grade quality. Joachim and Kurz [63] stated that this
unacceptable quality can only be addressed by re-work (e.g. grinding). In this thesis, the
green-shaved surfaces showed a high contact area ratio, and green-shaving would
therefore be preferred. This might be realised if distortions could be minimised by using
new heat treatment processes, such as vacuum carburizing combined with high pressure
gas quenching [64] and isotropic materials [11].
The honed surfaces showed an evenly distributed real contact area and the contact area
ratio was high, which is interesting since honing has a gear accuracy grade that is close to
that of ground gears. This means that honing may have advantages for both gear grade

46
quality and contact area ratio. Further investigation is needed to explore the
elastohydrodynamic properties with respect to surface lay. The influence of residual
stresses – inherent of manufacturing process – on the load carrying capacity must also be
further explored.
8.3 What purpose does manganese serve as a gear flank coating? (Q3, Q4)
A commonly accepted hypothesis is that manganese phosphate works as a catalyst for a
smooth running-in, and findings by, for example, Kozlowski and Czechovski [66] suggest
that manganese phosphate absorbs lubricant, which then might serve as a lambda ratio
enhancer. The manganese phosphate coating creates a rough virgin surface and the
process of coating creates pits in the metal surface. If the manganese-phosphate-coated
surface does not become smooth during running-in it might lead to lubricant film break-
down. Scuffing is caused by the failure of the elastohydrodynamic film, according to
studies by Evans et al. [56]. When the layer of the manganese phosphate is worn away,
the pits created during the coating are uncovered. These pits might induce cracks that
shorten the life of gears due to fatigue. The tribotests performed with manganese
phosphate specimens was based on the interest in sorting out what purpose manganese serves
as a gear flank coating. Based on the results in paper C, it can be argued that the most likely
purpose for manganese phosphate coating on gear flank is to decrease the risk of
scuffing. The results did show a large difference in scuffing load between uncoated
ground and phosphate-coated ground test specimens. The phosphate-coated specimens
do not experience any scuffing even with a load more than thirteen times larger than the
scuffing initiation load recorded for the ground surfaces. Does manganese phosphate retain
lubricant and thereby serve as a lambda ratio enhancer and/or does it promote running-in? The finding
of Kozlowski and Czechovski [66] that manganese phosphate absorbs lubricant could
not be verified other than that the lubricant throw-off was visually noted to be less for
the manganese-phosphate-coated specimens than for the uncoated ground specimen.
The hypothesis that absorbed oil helps build up low-shear-stress surface layers was not
confirmed. Neither could the results verify that manganese phosphate promotes a
smooth running-in, because the coefficient of friction behaviour was not consistent
between the two tests. The coefficient of friction stayed low for the phosphate-coated
specimen at the transient tests whereas in the stationary pin-on-disc the friction was
higher compared to the ground specimens, although a decrease in friction was noted in
the repeated trials. The results from the GDOES analyses showed that elements of the
manganese phosphate coating were still present, even though the manganese coating
could not be seen. A path for continued research is suggested by the possibility that the
pickling pits created by the manganese phosphate coating process generally serve as crack
initiation points. This, together with the fact that these pickling pits are at least an order
of magnitude larger than the surface roughness, suggests that one might further study the
effects of the manganese phosphate wear process versus the crack initiation hazard.

47
8.4 Does running-in affect the gear efficiency? (Q5)
In paper B it was shown that the contact area ratio was increased by running-in but no
friction forces could be measured. Further, Blau [39] concludes that friction and wear
steady state does not necessarily occur at the same time. In the published experimental
literature on the subject of running-in [1], [40], [55], the running-in schedule varied both
in load levels and duration.
In this thesis, two existing running-in schedules for gear testing were adopted. The first
running-in schedule was originally intended for lifetime testing (paper B). These gears
were run-in at a total of 340,000 flank-to-flank contacts, with a step-wise increase of 40
up to 100% of maximum load. It was observed that the shaved surface has the largest
increase in contact area, indicating that shaving has a short running-in phase. This is in
line with Andersson [41], who showed that a shaved surface needed only 300,000 mesh
cycles to reach the steady state phase. The honed gears show a similar, albeit slightly
lower, contact area ratio, suggesting that this running-in procedure is also suitable in this
case. The second gear running-in schedule was adopted from the FZG efficiency test,
which had only approximately 21,000 contacts on the wheel (on which the surface
roughness was measured). There was little evidence of surface smoothening; only the
standard deviation of the Ra was noted to be smaller after running-in. Even after the
efficiency test, which corresponded to a total of 210,000 contacts (315,000 contacts at
pinion), only small changes could be detected in the shape of surface asperities. The
asperities were observed to be just a bit blunter, but this was hardly detected by the
surface roughness parameters. The ground surface has a typical surface lay with grinding
furrows and ridges. The real contact area is in this case largely decided by the shape of
this lay (size and distribution of furrows and ridges). A ground gear having narrow
tolerance on both surface roughness and gear parameters was expected to be affected the
most during running-in but this was not evident during these trials. The contact area ratio
was found to be low, and it was also found that only the top of the asperities had a
blunter shape. Petry-Johnson et al. [1] used 360,000 revolutions at 60% of maximum load
for the running-in cycles for ground gears and superfinished gears. This, combined with
the difference in running-in, suggests that gears manufactured with different
manufacturing methods demand different running-in schedules.
The rubbing of surfaces creates friction forces and the friction force is proportional to
the normal load. Surfaces will run in again every time a new (higher) load is applied [36]
and the Stribeck curve relates the friction response to the viscosity, speed, and load. It
was shown that all the surfaces compared in paper B had a higher contact area ratio after
running-in, suggesting that the lambda ratio should be increased. Does this mean that
running-in affects the gear efficiency? The friction response during running-in and the result of
the running-in on the friction response during a partial Stribeck run was investigated
using an elliptic contact in a MTM (paper D). This test was performed to clarify the
surface roughness, load, and slide-to-roll ratio influence on running-in and its effect on
gear efficiency. It was confirmed that the surface roughness amplitude had the highest
influence of the friction level during running-in. The difference between the medium and

48
rough surfaces was not large, but noticeable. The two rougher surfaces of the three
surfaces compared represent two common surfaces used in the automotive industry. The
superfinished surface had a roughness of approximately one tenth of the ground
surfaces, which also was shown by the lambda ratio. Contrary to Krantz’s [61] findings,
the surface of the superfinished specimens had become rougher after the test. The
influence of load was shown to be significant at the beginning, whereas the surface
roughness both influenced at the start and end of running-in. The friction running
reached, as all tests showed, steady state friction at the end of the running-in. The fast
friction running-in reported by Bosman and Schipper [67] could not be verified because
the friction curve shape varied until at least 90,000 contacts. The test performed in the
FZG showed that the efficiency was increased during the running-in and that the high
load used during had higher efficiency than the running-in with a lower running-in load.
Another interesting observation is that the tests using a low running-in load had higher
scatter of the friction/torque signal for both the FZG tests and the MTM tests. Different
gear ratio would be expected to show different run in as the different gear flanks would
not meet at every revolution. This is interesting because it is the normal situation and
necessary to include in a running-in methodology trade-off model.
The response of different running-in on the running gear efficiency was shown over a
broad range of rolling speeds and loads. At the low-speed range, both the FZG (paper E)
and the MTM (paper D) tests showed large scatter. In the MTM tests the shape of
friction curve was similar between each factor replicas. So, even though it could not be
concluded with certainty, the tendency is an influence from the running-in schedule on
the friction response over a broad range of conditions. At low-speed range, boundary
lubrication is expected and in these trials it seems as if the randomness in the asperity
contact result in varying friction, and that the tribolayers (including additives in lubricant)
were not able to overcome named variance. At the higher-speed range, the gear mesh
efficiency was higher for the gears run in at higher load (paper E). The overall mean of
gear mesh efficiency was in the order of 0.1 %, which means that the influence of
running-in cannot be neglected when analysing different ways of improving gear
efficiency. There was also a connection between the pay load and gear efficiency. Higher
load resulted in lower gear mesh efficiency. One explanation, with support of Jacobson
[36], is that the larger difference at the high pay load (302 Nm) can arise from the new
running-in which should take place when the payload exceeds the load used at running-
in. Now, both results of the MTM and the FZG tests had quite large scatter compared to
their respective mean. One justification is thinking that the results of this investigation
are accurate is that all mean values for tests using high running-in load consistently
resulted in higher gear mesh efficiency. In practise this will lead to relatively many gears
from a population of gears run in at high load having lower gear efficiency compared to a
number of gears from a population of gears run in at low load. Another uncertainty is the
bearing loss model; it seems as it might overestimate the losses at high speeds when using
the methodology of subtracting the speed-dependent losses from the total losses. One
reason for the suspected overestimate of bearing losses is that the bearing loss model is
dependent on both the viscosity and the speed. When the procedure is followed

49
according to Petry-Johnson [1], the speed-dependent losses in the gear mesh is included
in the load- dependent loss extraction from the total loss. This means that further
investigation is needed to find ways to experimentally separate churning loss (and
windage, squeeze, etc.) from the gear mesh and bearing loss out of the total loss.
Furthermore, since this thesis did not fully cover the aspect of number of contacts and
load levels needed for an optimised running-in of different kind of surfaces, more
investigation is needed before a general recommendation can be made on the running-in
of gears. Such investigation would include different manufacturing methods and an
extended coupling between friction response and long-term performance, such as
scuffing and pitting failures.

50
9 Conclusions
This study focuses on gear surface topography, which has an important role in the
interface of gear flanks, especially in the context of seeking higher gear efficiency. It was
shown that running-in changes both the mesh efficiency and the contact area ratio.
The hypothesis that running-in influences the gear efficiency was confirmed. A high
running-in load generated higher gear mesh efficiency than the step-wise load increase
and the low-load strategies. The influence of running-in cannot be neglected, because the
difference in mesh efficiency was in the same order of magnitude as reported for other
gear efficiency enhancements.
From a surface point of view, the running-in schedules used in this thesis concluded that
300,000 contacts seems sufficient for green-shaved and honed surfaces, but seems too
low for the ground surfaces. No conclusion was made with respect to how many
contacts a running-in schedule should have in order to reach both the friction steady
state as well as the surface roughness steady state for a specific manufacturing method.
Further, it was shown that the contact area ratio presents a descriptive measure of how
surface topography influences the contact, seen at both a global (form deviation) and
local (roughness) level. The contact area ratio works well for both virgin and run-in
surfaces. The results show that the surface topography caused by the manufacturing
method has a significant impact on the contact area ratio. This is an important result,
since neither national standards nor commercially available gear evaluation programs
handle surface topography on the local scale. Shaving was found to give the highest
contact area ratio, and should therefore be the best choice, if deviations from case
hardening could be minimised to a level equal to those resulting from the honing or
grinding process.
No genuine relationship could be found between the contact area ratio and 2D surface
roughness parameters. Only the extreme value roughness parameters Rp and Rz show
reasonably good correlation with the contact area ratio. The gear metrology parameters
are of little use for the evaluation of the initial wear and plastic deformation on the gear
flanks during running-in.
Manganese phosphate ground surfaces raise the limiting load for scuffing failure up to 13
times that of the uncoated ground surface. Thus, the most likely purpose of using
manganese phosphate coating on gears is to prevent scuffing. The running-in behaviour
of the coating layer needs further investigation, since the friction response was not
conclusive in respect to either lubricant retention abilities or friction level.

51
10 Future Work
This thesis provides insights regarding the influence of running-in on gear efficiency,
load carrying capacity, and risk of scuffing. As such, the thesis answers just a few of all
the questions related to gear engineering. Having a background as a design- and
production engineer, the author feels that the main subject of future work is to create an
engineering methodology for selecting a proper running-in schedule of gears. The gear
designer and gear production process engineer need a tool to aid them in the selection of
manufacturing method and optimisation of running-in. In order to create such a
methodology a broader knowledge base is needed. In the closest proximity to this thesis,
a proposal for future work could include:
Characterise more gear surfaces in similar tests as paper E: manganese–
phosphate-coated gears, shot-peened gears, honed gears, shaved gears, and
superfinished gears.
Investigate the number of contacts as a parameter in running-in, both from
surface integrity and friction viewpoint.
Investigate how to evaluate the effect of lubricant during running-in.
Extract and summarize the knowledge and optimisation process of different
running-in schedules with different objectives, such as surface fatigue scuffing
and running-in.
Develop the efficiency measuring method in order to shorten the set-up time and
increase the accuracy.

52
11 References
[1] Petry-Johnson, T.T., Kahraman, A., Anderson, N.E., Chase, D.R., An experimental
investigation of spur gear efficiency, Journal of Mechanical Design, Vol. 130 (2008),
062601.
[2] Martins, R.C., Cardoso, N.F.R., Bock, H., Igartua, A., Seabra, J.H.O., Power loss
performance of high pressure nitrided steel gears. Tribology International (2009),
doi:10.1016/j.triboint.20089.03.006.
[3] Xu, H., Kahraman, A., Anderson, N.E., Maddock, D.G., Prediction of Mechanical
Efficiency of Parallel-Axis Gear Pairs, Journal of Mechanical Design, Volume 129
(2007), 58-68, doi: 10.1115/1.2359478.
[4] Lundberg Gerth, J. 2012. Tribology at the Cutting Edge: A Study of Material
Transfer and Damage Mechanisms in Metal Cutting. Acta Universitatis Upsaliensis.
Faculty of Science and Technology 988. 77 pp. Uppsala. ISBN 978-91-554-8514-6
[5] Werner, M., Theoretical and experimental studies of a single tooth milling process,
KTH Royal Institute of Technology, Doctoral Thesis, TRITA –IIP-12-08, ISSN
1650-1888, Stockholm, 2012.
[6] Bagge, M., Process planning for precision manufacturing, KTH Royal Institute of
Technology, Doctoral Thesis, TRITA –IIP-14-04, ISSN 1650-1888, ISBN 978-91-
7595-172-0, Stockholm, Sweden, 2014.
[7] Bagge, M., An approach for systematic process planning of gear transmission parts,
Royal Institute of Technology, Licentiate Thesis, TRITA –IIP-09-01, ISSN 1650-
1888, ISBN 978-91-7415-222-7, Stockholm, 2009.
[8] Bergseth, E., On tribological design in gear tooth contacts, KTH Royal Institute of
Technology, Doctoral Thesis, TRITA – MMK 2012:18, ISSN 1400-1179,
ISRN/KTH/MMK/R-12/18-SE, ISBN 978-91-7501-493-7, Stockholm, Sweden,
2012.
[9] Björkeborn, K., Effects on Machinability due to Microstructure Variations in Case
Hardening Steel, Licentiate Thesis, Department of Materials and Manufacturing
Technology, Chalmers University of Technology, Göteborg, Sweden, 2008.
[10] Tehler, M., Modeling Phase Transformations and Volume Changes during Cooling
of Case Hardening Steels, KTH Royal Institute of Technology, Licentiate Thesis,
ISBN 978-91-7415-459-7, Stockholm, Sweden, 2009.
[11] Temmel, C., Fatigue Anisotropy in forged Components, Doctoral Thesis;
Department of Materials and Manufacturing Technology, Chalmers University of
Technology, Göteborg, Sweden, 2007.
[12] ASM Handbook Vol. 9, ASM International, December 2004, ISBN 0-87170-706-3.

53
[13] PFAUTER-WÄLZFRÄSEN, Teil 1, ISBN 0-387-07446-5, Springer-Verlag, Berlin
Heidelberg New-York 1976.
[14] Townsend, Dennis P., Dudley’s Gear Handbook – 2nd edition, ISBN 0-07-017903,
McGraw-Hill, United States of America, 1992.
[15] Gear design : manufacturing, and inspection manual / prepared under the auspices
of the SAE Gear and Spline Technical Committee, SAE Gear and Spline Technical
Committee, ISBN 1-56091-006-2, Warrendale, PA : Society of Automotive
Engineers, cop. 1990.
[16] Gianfranco, B., GEAR SHAVING, Samputensili S.P.A., Via Triumvirato 13,
40132-Bologna, Italy. Printed by Jiuge Beijing, China, October 2000.
[17] Gleason Corporation, 1000 University Avenue, P.O. Box 22970, Rochester, NY
14692-2970, U.S.A., www.gleason.com.
[18] Fässler AG, Ringstrasse 20, CH-8600 Dübendorf, Switzerland, www.faessler-ag.ch.
[19] Präwema Antriebstechnik GmbH, Hessenring 4, 37269 Eschwege, Germany,
www.praewema.de.
[20] Laboratory for Machine Tools and Production Engineering, RWTH Aachen
University, Germany, www.wzl.rwth-aachen.de.
[21] Karpuschewski, B., Knoche, H.-J., Hipke, M., Gear finishing by abrasive processes,
CIRP Annals - Manufacturing Technology, Volume 57 (2008), Pages 621–640.
[22] Gabe, D.R., Principles of Metal Surface Treatment and Protection, 2. ed. SI/metric
units, ISBN 0-08-022703-1, Oxford: Pergamon, 1978.
[23] Hiwart, Ph., Hauw, B., Crampon, J., Bricout, J.P., Annealing improvement of
tribological properties of Manganese Phosphate coatings, Wear, Volume 219
(1998), Pages 195-204.
[24] Freeman, D.B., Phosphating and metal pre-treatment – a guide to modern
processes and practice, first edition, ISBN 0-8311-1168-2, Industrial Press Inc.,
1986, New York, USA.
[25] Rausch, W., The phosphating of metals, ISBN 0-904477-11-8, Finishing
Publications Ltd., 1990.
[26] http://www.metalimprovement.co.uk/isotropic-finishing.html#section2, accessed
2014-07-19.
[27] Whitehouse, D.J., Handbook of Surface and Nanometrology, ISBN 0 7503 0583 5,
Institute of Physics Publishing, 2003.
[28] Volvo Group Standard 5068,032, SURFACE ROUGHNESS, Terminology.
[29] Volvo Group Standard 5082,81, GEARS, Deviations and inspection methods for
cylindrical gears with involute gear teeth.

54
[30] Frazer, R.C., Bicker, R., Cox, B., Harary, H., Härtig, F., An international
comparison of involute gear profile and helix measurement, Metrologia, Volume 41
(2004), Pages 12–16.
[31] Goch, G., Gear Metrology, CIRP Annals – Manufacturing Technology, Volume 52,
Issue 2 (2003), Pages 659-695, doi:10.1016/S0007-8506(07)60209-1.
[32] Advanced Numerical Solution LLC (Ansol), http://ansol.us/, accessed 10-04-16.
[33] Ohio State University, LDP Load Distribution Program, Version 3.3.0,
http://www.gearlab.org/, 2009.
[34] Stout K.J., Sullivan, P.J., Dong, W.P., Mainsah, E., Luo, N., Mathia, T., Zahouani,
H., The development of methods for the characterization of roughness in three
dimensions, Publication no. EUR 15178 of the Commission of the European
Communities, ISBN 0 7044 1312 2 (1993).
[35] Blau, P.J., Interpretations of the friction and wear break-in behaviour of metals in
sliding contact, Wear, Volume 71 (1981), Pages 29-43.
[36] Jacobson, B., Thin film lubrication of real surfaces, Tribology International, Volume
33 (2003), Pages 205-210.
[37] van Beek, A., Advanced engineering design, Lifetime performance and reliability,
TU Delft, Delft, 2006.
[38] Roy Chowdhury, S.K., Kaliszer, H., Rowe G.W., An analysis of changes in surface
topography during running-in of plain bearings, Wear, Volume 57 (1979), 331-343.
[39] Blau, P.J., On the nature of running-in, Tribology International, Volume 38 (2005),
Pages 1007-1012.
[40] Yoshizaki, M., Naruse, C, Nemoto, R., Haizuka, S., Study on Frictional Loss of
Spur Gears (Concerning the influence of Tooth Form, Load, Tooth Surface
Roughness, and Lubricating Oil), Tribology Transactions, Volume 34 (1991), Issue 1,
Pages 138-146.
[41] Andersson, S., Partial EHD theory and initial wear of gears, Doctoral Thesis;
Department of Machine Elements, Royal Institute of Technology, Stockholm,
1975.
[42] Flodin, A., Wear of spur and helical gears, Royal Institute of Technology, Doctoral
Thesis, Trita-MMK, 1400-1179; 2000:12, Stockholm, 2000.
[43] Stribeck, R. (1902), Die wesentlichen Eigenschaften der Gleit- und Rollenlager
(Characteristics of Plain and Roller Bearings), Zeit. des VDI 46.
[44] Michaelis, K., Höhn, B.-R., Hinterstoiβer, Influence factors on gearbox power loss,
Industrial Lubrication and Tribology, 63/1 (2011) 46-55, doi:
10.1108/00368791111101830

55
[45] Sosa, M., Björklund, S., Sellgren, U., Olofsson, U., In situ surface characterization
of running-in of involute gears, Proceedings of Nordtrib 2014 - 16th Nordic
Symposium on Tribology, Århus Denmark.
[46] Kumar, R., Kumar, S., Prakash, B., Sethuramiah, A., Assessment of engine liner
wear from bearing area curves, Wear, Volume 239 (2000), Pages 282-286.
[47] Thomas, T.R., Rough surfaces, second edition, Imperial College Press, London,
1999.
[48] Björklund, S., Andersson, S., A numerical method for elastic contacts subjected to
normal and tangential loading, Wear, Volume 179 (1994), Pages 117-122.
[49] Andersson, S., Salas-Russo, E., The influence of surface roughness and oil viscosity
on the transition in mixed lubricated steel contacts, Wear, Volume 174 (1994),
Pages 71-79.
[50] Dizdar, S., Formation and Failure of Chemireacted Boundary Layers in Lubricated
Steel Contacts, Doctoral Thesis, Royal Institute of Technology, Stockholm,
Sweden, 1997.
[51] Sundh, J., Olofsson, U., Seizure mechanisms of wheel/rail contacts under
lubricated conditions using a transient ball-on-disc test method, Tribology
International, Volume 41(2008), Pages 867–874.
[52] Nelis, T., Payling, R., Glow discharge optical emission spectroscopy; A practical
guide, 0-85404-521-X; 1-84755-098-3, Royal Society Of Chemistry, United
Kingdom, 2003
[53] Mario J. Sosa, Martin Andersson, Sören Sjöberg, Ulf Olofsson, Effect of Assembly
Errors in back-to-back Gear Efficiency Testing, Proceeding of the International
Conference on Gears, 26-28 August, 2014, Lyon, France.
[54] SKF, Rolling bearing catalogue pp.97-114 (2012).
[55] FVA Information sheet, Research project no. 345 Efficiency test.
[56] Evans, H.P., Snidle, R.W., Sharif, K.J., Deterministic mixed lubrication modelling
using roughness measurements in gear applications, Tribology International, Volume
42 (2009), Pages 1406–1417.
[57] Brandão, J.A., Seabra, J.H.O., Castro, J., Surface initiated tooth flank damage Part
I: Numerical model, Wear, Volume 268 (2010), Pages 1-12.
[58] Brandão, J.A., Seabra, J.H.O., Castro, J., Surface initiated tooth flank damage Part
II: Prediction of micropitting initiation and mass loss, Wear, Volume 268 (2010),
Pages 13-22.
[59] Ren, N., Zhu, D., Chen, W.W., Liu, Y., Wang, Q.J., A Three-Dimensional
Deterministic Model for Rough Surface Line-Contact EHL Problems. Journal of
Tribology, JANUARY 2009, Volume 131 / 011501.

56
[60] Almqvist, A., On the Effects of Surface Roughness in Lubrication, Doctoral
Thesis, Luleå University of Technology, ISSN: 1402-1544, ISRN: LTU-DT--
06/31--SE, Luleå, 2006.
[61] Krantz, T. L. The Influence of Roughness on Gear Surface Fatigue. NASA/TM
2005-213958, 2005, U.S. Army Research Laboratory, Glenn Research Center,
Cleveland, Ohio.
[62] Höhn, B.-R., Michaelis, K., and Kreil, O., Influence of surface roughness on
pressure distribution and film thickness in EHL-contacts. Tribology International,
Volume 39(2006), Pages 1719-1725.
[63] Joachim, F.J., Kurz, N., The influence of Surface Condition and Lubricant on
Tooth Flank Capacity, Automotive and Industrial Lubrication: 15th International
Colloquium Tribology, 2006. Ostfildern : TAE, Technische Akademie Esslingen.
[64] Löser, K, Ritter, K., Operating experiences with modular vacuum heat treatment
plants in the automotive industry, HEAT PROCESSING, Issue 2, June 2007,
Pages 136-140.
[65] Michalski, J., Surface topography of the cylindrical gear tooth flanks after
machining, International Journal of Advanced Manufacturing Technology, Volume 43
(2009), Pages 513-528.
[66] Kozlowski, A., Czechowski, W., Wear resistance of manganese phosphate coatings,
Electrodeposition and Surface Treatment, Volume 3 (1975), Number 1, Pages 55–63.
[67] Bosman, R. Schipper D.J., Running-in of systems protected by additive-rich oils,
Tribology Letters (2011) 41:263-282.