![Time Resolved Full-Annulus Computations of a Turbine with ... · Time Resolved Full-Annulus Computations of a Turbine with Inhomogeneous Inlet Conditions ... rotor blade EGV [-] exit](https://static.fdocuments.in/doc/165x107/5e8b7fd962436545c1283871/time-resolved-full-annulus-computations-of-a-turbine-with-time-resolved-full-annulus.jpg)
Influence of Rotor Ingestion on Performance of S-shaped Inlet in Distributed Propulsion System
7
Journal Title Volume XX Issue XX, Month Year Journal Website 1 Influence of Rotor Ingestion on Performance of S-shaped Inlet in Distributed Propulsion System School of Energy and Power Engineering, Beijing University of Aeronautics and Astronautics XueYuan Road No.37, HaiDian District, BeiJing, China Abstract The distributed propulsion is a new type of aircraft power system with fuselage/propulsion integration. In order to study the influence of fan ingestion on aerodynamic performance of the S-shaped inlet, a three dimension model with fan ingestion and static pressure outlet, was studied to discuss the influence of fan ingestion on the aerodynamic performance of the inlet. Unsteady simulation method was adopted to get the full flow field of the test models. Results showed that as the mass flow rate decreases, the distortion intensity decreases. Contrast to the case with a static pressure outlet condition, the case with fan ingestion could turn the “swirl vortex” into “bulk vortex” as a result of the difference of pressure in different regions. The response of the fan to the distortion introduced the difference. So the distortion intensity by fan ingestion is bigger than that with a static pressure outlet condition. Keywords Distributed Propulsion; S-shaped inlet; Fan Ingestion; Computational Fluid Dynamics; Aerodynamic Performance Introduction With the development of society, energy shortage and pollution have been the problems the world concerns. Aircrafts contribute to a lot for this by fuel burns, exhaust emissions and noise productions. Traditional propulsion system has been limited in performance improvement such as lift-drag ratio enhancement and fuel consumption reduction. It is urgent to find a new way to meet the increasingly needs of development. As a new aircraft configuration, Blended Wing Body has been introduced. In this concept, highly integrated boundary layer ingesting(BLI), offset or S-shaped inlet have the potential benefits of reducing weight, size, drag by eliminating the boundary layer diverter and shortening the inlet duct. By using S-shaped inlet and boundary layer ingestion, the flow is distortion when it gets the Aerodynamic Interface Plane (hereinafter AIP). Boundary layer near the low surface would be transferred to the central area of the inlet as a result of adverse pressure gradient along radial direction [1-3]. And adverse pressure gradient along the flow direction would cause flow separation close to the low surface. As a result, there will be a “Swirl vortex” on the AIP plane [4-5]. This is a big challenge for the design of the Fan stage. A search of open literatures revealed a lot of simulations and experimental information on BLI S- shaped inlet performance for inlets with large amounts of BLI operating at realistic conditions. Most reported in the literature by either numerical simulation or experimental method, the direct influence of the fan ingestion was not taken into consideration. When numerical simulation method is conducted, static pressure is placed at the outlet location of the test schedules. The response of the rotor to distortion will give different effects from the case with a back pressure condition [6-9]. So there is a need to make a study of the influence of fan ingestion on the performance of S-shaped inlet. The objective of the work is to make a better understand of the interaction of the fan ingestion and S-shaped inlet performance. To achieve this goal, a single transonic fan rotor and S-shaped inlet have been used. Unsteady simulation method is used for the calculation. After analyzing the results
-
Upload
shirley-wang -
Category
Documents
-
view
216 -
download
0
description
http://www.ijep.org/paperInfo.aspx?ID=15394 Distributed propulsion system is a new type of aircraft power system with fuselage/propulsion integration. In order to study the influence of fan ingestion on aerodynamic performance of the S-shape inlet, a 3D model with different outlet condition, fan ingestion and static pressure, was studied to discuss the influence of fan ingestion on the aerodynamic performance of the inlet. Steady and unsteady simulation methods were adopted to get the full flow field of the test models. Results showed that as the mass flow rate decreases, the distortion intensity decreases. Contrast to the case with a static pressure outlet condition, the case with fan ingestion could turn the “swirl vortex” into “bulk vortex” as a result of the difference of pressure in different regions. Along the rotation direction, region enters the distortion of AIP plane has higher pressure than that leaves the distortion area. The different pressure gradients make the vor
Transcript of Influence of Rotor Ingestion on Performance of S-shaped Inlet in Distributed Propulsion System
Journal Title Volume XX Issue XX, Month Year Journal Website
1
Influence of Rotor Ingestion on
Performance of S-shaped Inlet in
Distributed Propulsion System
School of Energy and Power Engineering, Beijing University of Aeronautics and Astronautics
XueYuan Road No.37, HaiDian District, BeiJing, China
Abstract
The distributed propulsion is a new type of aircraft
power system with fuselage/propulsion integration. In
order to study the influence of fan ingestion on
aerodynamic performance of the S-shaped inlet, a three
dimension model with fan ingestion and static pressure
outlet, was studied to discuss the influence of fan
ingestion on the aerodynamic performance of the inlet.
Unsteady simulation method was adopted to get the full
flow field of the test models. Results showed that as the
mass flow rate decreases, the distortion intensity
decreases. Contrast to the case with a static pressure
outlet condition, the case with fan ingestion could turn
the “swirl vortex” into “bulk vortex” as a result of the
difference of pressure in different regions. The response
of the fan to the distortion introduced the difference. So
the distortion intensity by fan ingestion is bigger than
that with a static pressure outlet condition.
Keywords
Distributed Propulsion; S-shaped inlet; Fan Ingestion;
Computational Fluid Dynamics; Aerodynamic Performance
Introduction
With the development of society, energy shortage
and pollution have been the problems the world
concerns. Aircrafts contribute to a lot for this by
fuel burns, exhaust emissions and noise
productions. Traditional propulsion system has
been limited in performance improvement such as
lift-drag ratio enhancement and fuel consumption
reduction. It is urgent to find a new way to meet the
increasingly needs of development. As a new
aircraft configuration, Blended Wing Body has been
introduced. In this concept, highly integrated
boundary layer ingesting(BLI), offset or S-shaped
inlet have the potential benefits of reducing weight,
size, drag by eliminating the boundary layer
diverter and shortening the inlet duct.
By using S-shaped inlet and boundary layer
ingestion, the flow is distortion when it gets the
Aerodynamic Interface Plane (hereinafter AIP).
Boundary layer near the low surface would be
transferred to the central area of the inlet as a result
of adverse pressure gradient along radial direction
[1-3]. And adverse pressure gradient along the flow
direction would cause flow separation close to the
low surface. As a result, there will be a “Swirl
vortex” on the AIP plane [4-5]. This is a big
challenge for the design of the Fan stage.
A search of open literatures revealed a lot of
simulations and experimental information on BLI S-
shaped inlet performance for inlets with large
amounts of BLI operating at realistic conditions.
Most reported in the literature by either numerical
simulation or experimental method, the direct
influence of the fan ingestion was not taken into
consideration. When numerical simulation method
is conducted, static pressure is placed at the outlet
location of the test schedules. The response of the
rotor to distortion will give different effects from
the case with a back pressure condition [6-9]. So
there is a need to make a study of the influence of
fan ingestion on the performance of S-shaped inlet.
The objective of the work is to make a better
understand of the interaction of the fan ingestion
and S-shaped inlet performance. To achieve this
goal, a single transonic fan rotor and S-shaped inlet
have been used. Unsteady simulation method is
used for the calculation. After analyzing the results
Journal Website Journal Title Volume * Issue *, Month Year
of computations, the mechanism of the interaction
can be obtained.
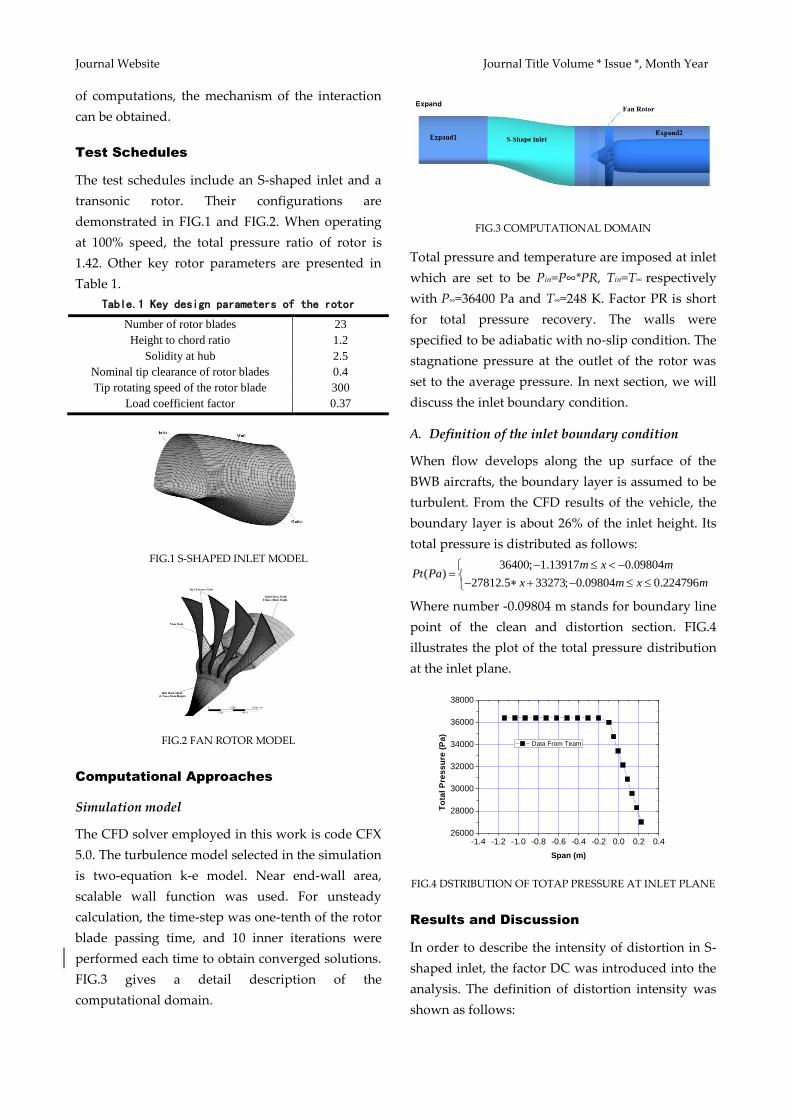
Test Schedules
The test schedules include an S-shaped inlet and a
transonic rotor. Their configurations are
demonstrated in FIG.1 and FIG.2. When operating
at 100% speed, the total pressure ratio of rotor is
1.42. Other key rotor parameters are presented in
Table 1.
Table.1 Key design parameters of the rotor
Number of rotor blades 23
Height to chord ratio 1.2
Solidity at hub 2.5
Nominal tip clearance of rotor blades 0.4
Tip rotating speed of the rotor blade 300
Load coefficient factor 0.37
FIG.1 S-SHAPED INLET MODEL
FIG.2 FAN ROTOR MODEL
Computational Approaches
Simulation model
The CFD solver employed in this work is code CFX
5.0. The turbulence model selected in the simulation
is two-equation k-e model. Near end-wall area,
scalable wall function was used. For unsteady
calculation, the time-step was one-tenth of the rotor
blade passing time, and 10 inner iterations were
performed each time to obtain converged solutions.
FIG.3 gives a detail description of the
computational domain.
FIG.3 COMPUTATIONAL DOMAIN
Total pressure and temperature are imposed at inlet
which are set to be Pin=P∞*PR, Tin=T∞ respectively
with P∞=36400 Pa and T∞=248 K. Factor PR is short
for total pressure recovery. The walls were
specified to be adiabatic with no-slip condition. The
stagnatione pressure at the outlet of the rotor was
set to the average pressure. In next section, we will
discuss the inlet boundary condition.
A. Definition of the inlet boundary condition
When flow develops along the up surface of the
BWB aircrafts, the boundary layer is assumed to be
turbulent. From the CFD results of the vehicle, the
boundary layer is about 26% of the inlet height. Its
total pressure is distributed as follows:
36400; 1.13917 0.09804( )
27812.5 33273; 0.09804 0.224796
m x mPt Pa
x m x m
Where number -0.09804 m stands for boundary line
point of the clean and distortion section. FIG.4
illustrates the plot of the total pressure distribution
at the inlet plane.
-1.4 -1.2 -1.0 -0.8 -0.6 -0.4 -0.2 0.0 0.2 0.426000
28000
30000
32000
34000
36000
38000
To
tal
Pre
ss
ure
(P
a)
Span (m)
Data From Team
FIG.4 DSTRIBUTION OF TOTAP PRESSURE AT INLET PLANE
Results and Discussion
In order to describe the intensity of distortion in S-
shaped inlet, the factor DC was introduced into the
analysis. The definition of distortion intensity was
shown as follows:
Journal Title Volume XX Issue XX, Month Year Journal Website
3
* *
*
360
*
0
*
,
1( ) ( ),
360
1( ) ( )
i
AV D
AV
AV i
D i
P PDc
P
P P d
P P d
Where the PAV* stands for area-average total
pressure of the whole plane while PD* stands for the
area-average total pressure of the distortion section.
In this paper, if the total pressure is below 32000 Pa,
it belongs to distortion section [8].
Overall performance at different mass flow rate
In order to compare the difference of performance
of S-shaped inlet under different outlet condition,
different cases with static pressure and fan
ingestion are calculated by CFX code. In this part of
the paper, Case 1 stands for the case with static
pressure and Case 2 stands for the case with fan
ingestion. Results are listed in FIG.5.
-0.2 0.0 0.2 0.4 0.6 0.8 1.0 1.20.140
0.145
0.150
0.155
0.160
0.165
0.170
0.175
0.180
DC
Axial Position Normal
Case1-156kg/s
Case2-156kg/s
Case1-152kg/s
Case2-152kg/s
Case1-141kg/s
Case2-141kg/s
FIG.5 DC DISTRIBUTION ALONG FLOW DIRECTION AT
DIFFERENT MASS FLOW RATE
It can be seen clearly from the FIG.5, as mass flow
rates decrease, the DC decreases. DC of Case 1 is
lower than that of Case 2 at the same mass flow rate,
indicating that the flow distribution at the outlet
face of S-shaped inlet is serious when a fan rotor is
placed rear of the inlet. Also along the axial
direction of the inlet, the trends of DC factor are not
in linear change. From the curve in the plot, it can
be obtained that the curve is like a parabolic curve
with its opening down. Before 60% axial position,
the DC increases with the increment of axial
distance. After 60% axial position, the DC factor
value decreases contrarily. At the point 60% axial
position, the DC factor achieves the maximum
value. Next section, the difference of flow field will
be discussed under different outlet condition. Two
operating points are selected for analysis: high and
low mass flow rate.
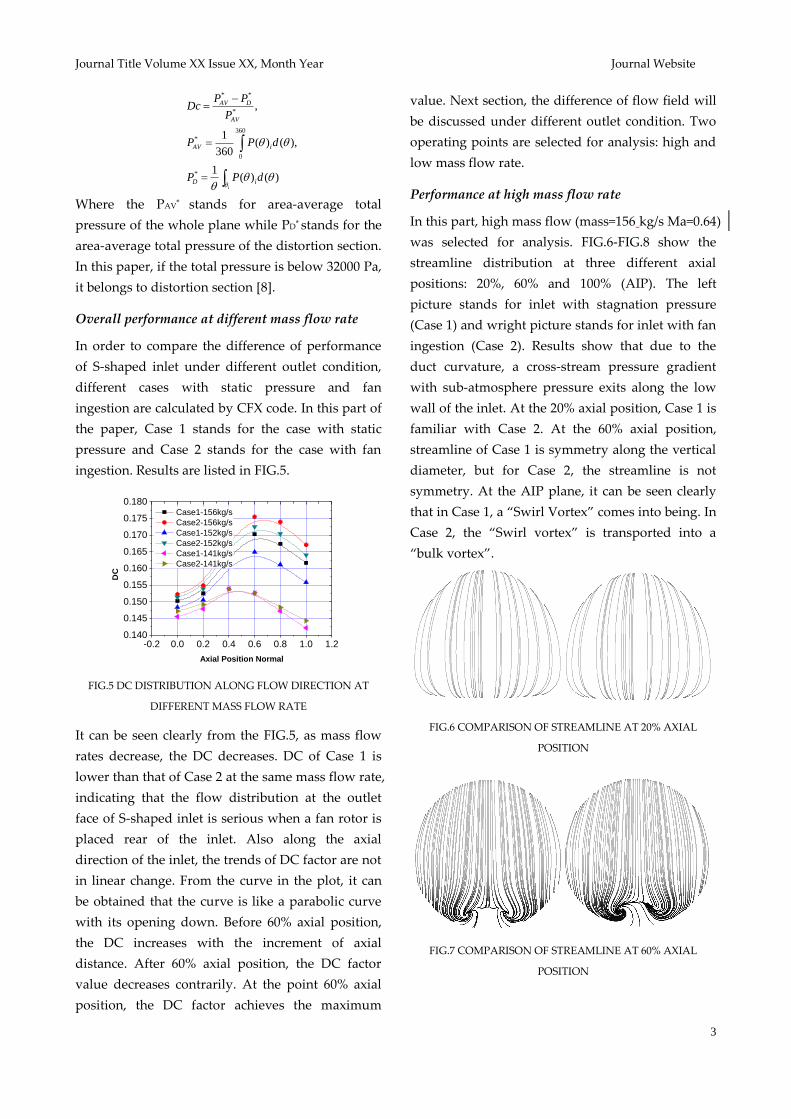
Performance at high mass flow rate
In this part, high mass flow (mass=156 kg/s Ma=0.64)
was selected for analysis. FIG.6-FIG.8 show the
streamline distribution at three different axial
positions: 20%, 60% and 100% (AIP). The left
picture stands for inlet with stagnation pressure
(Case 1) and wright picture stands for inlet with fan
ingestion (Case 2). Results show that due to the
duct curvature, a cross-stream pressure gradient
with sub-atmosphere pressure exits along the low
wall of the inlet. At the 20% axial position, Case 1 is
familiar with Case 2. At the 60% axial position,
streamline of Case 1 is symmetry along the vertical
diameter, but for Case 2, the streamline is not
symmetry. At the AIP plane, it can be seen clearly
that in Case 1, a “Swirl Vortex” comes into being. In
Case 2, the “Swirl vortex” is transported into a
“bulk vortex”.
FIG.6 COMPARISON OF STREAMLINE AT 20% AXIAL
POSITION
FIG.7 COMPARISON OF STREAMLINE AT 60% AXIAL
POSITION
Journal Website Journal Title Volume * Issue *, Month Year
FIG.8 COMPARISON OF STREAMLINE AT AIP
Fig.9 and Fig.10 illustrate the limit streamlines on
the low surface of inlet. Contrast to Case 1, along
the rotating direction, one of the “Swirl Vortex” is
stretched and the other is compressed in Case 2.
The median line is not the symmetry line of the
swirl vortexes any more.
FIG.9 LIMIT STREAMLINE ON LOW SURFACE (CASE 1)
FIG.10 LIMIT STREAMLINE ON LOW SURFACE (CASE 2)
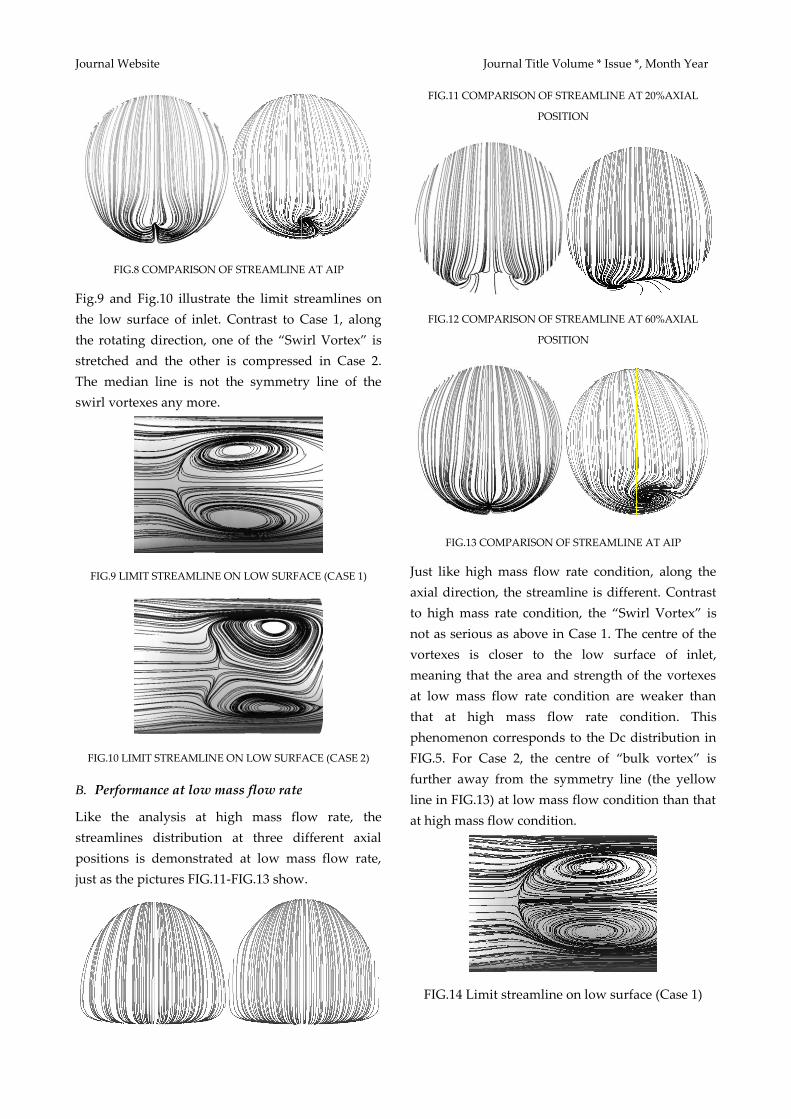
B. Performance at low mass flow rate
Like the analysis at high mass flow rate, the
streamlines distribution at three different axial
positions is demonstrated at low mass flow rate,
just as the pictures FIG.11-FIG.13 show.
FIG.11 COMPARISON OF STREAMLINE AT 20%AXIAL
POSITION
FIG.12 COMPARISON OF STREAMLINE AT 60%AXIAL
POSITION
FIG.13 COMPARISON OF STREAMLINE AT AIP
Just like high mass flow rate condition, along the
axial direction, the streamline is different. Contrast
to high mass rate condition, the “Swirl Vortex” is
not as serious as above in Case 1. The centre of the
vortexes is closer to the low surface of inlet,
meaning that the area and strength of the vortexes
at low mass flow rate condition are weaker than
that at high mass flow rate condition. This
phenomenon corresponds to the Dc distribution in
FIG.5. For Case 2, the centre of “bulk vortex” is
further away from the symmetry line (the yellow
line in FIG.13) at low mass flow condition than that
at high mass flow condition.
FIG.14 Limit streamline on low surface (Case 1)
Journal Title Volume XX Issue XX, Month Year Journal Website
5
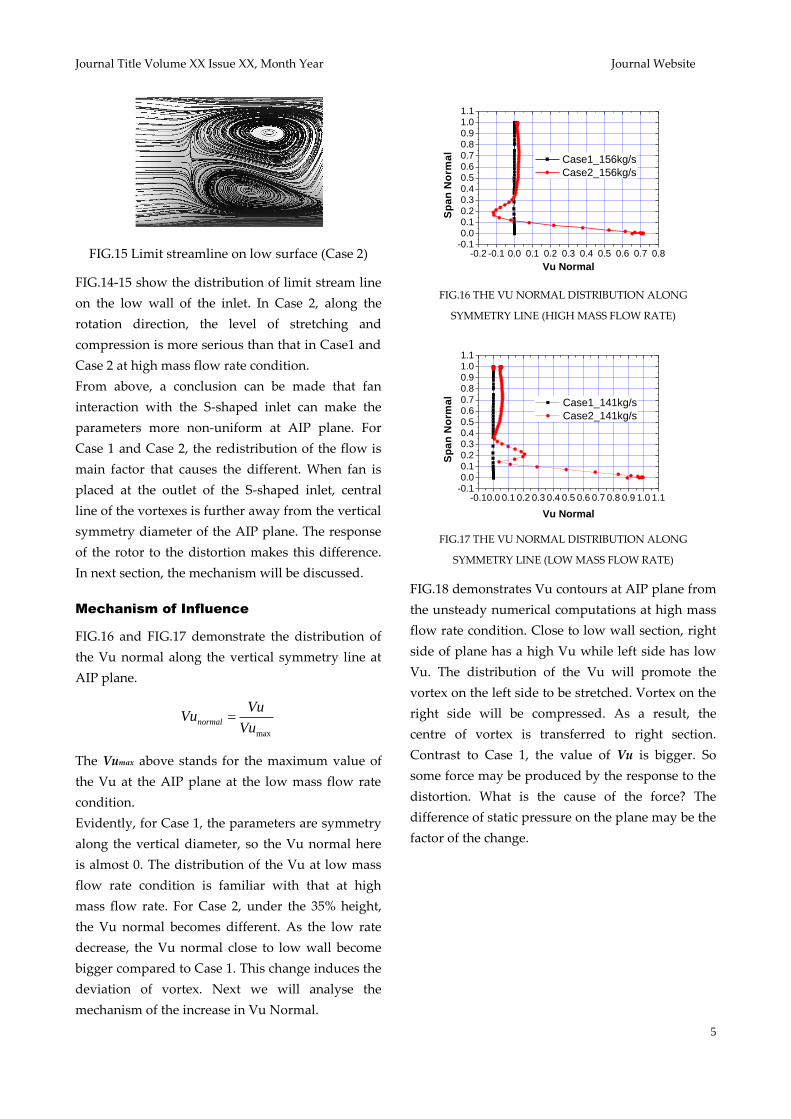
FIG.15 Limit streamline on low surface (Case 2)
FIG.14-15 show the distribution of limit stream line
on the low wall of the inlet. In Case 2, along the
rotation direction, the level of stretching and
compression is more serious than that in Case1 and
Case 2 at high mass flow rate condition.
From above, a conclusion can be made that fan
interaction with the S-shaped inlet can make the
parameters more non-uniform at AIP plane. For
Case 1 and Case 2, the redistribution of the flow is
main factor that causes the different. When fan is
placed at the outlet of the S-shaped inlet, central
line of the vortexes is further away from the vertical
symmetry diameter of the AIP plane. The response
of the rotor to the distortion makes this difference.
In next section, the mechanism will be discussed.
Mechanism of Influence
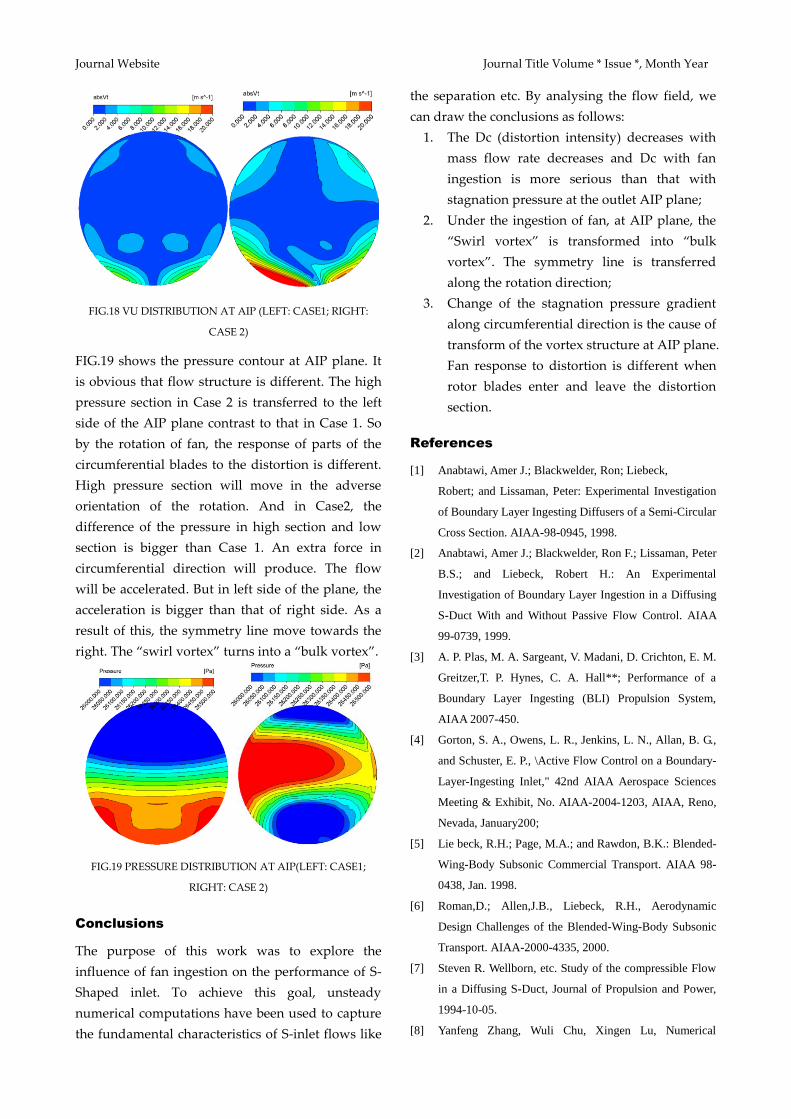
FIG.16 and FIG.17 demonstrate the distribution of
the Vu normal along the vertical symmetry line at
AIP plane.
max
normal
VuVu
Vu
The Vumax above stands for the maximum value of
the Vu at the AIP plane at the low mass flow rate
condition.
Evidently, for Case 1, the parameters are symmetry
along the vertical diameter, so the Vu normal here
is almost 0. The distribution of the Vu at low mass
flow rate condition is familiar with that at high
mass flow rate. For Case 2, under the 35% height,
the Vu normal becomes different. As the low rate
decrease, the Vu normal close to low wall become
bigger compared to Case 1. This change induces the
deviation of vortex. Next we will analyse the
mechanism of the increase in Vu Normal.
-0.2 -0.1 0.0 0.1 0.2 0.3 0.4 0.5 0.6 0.7 0.8-0.10.00.10.20.30.40.50.60.70.80.91.01.1
Sp
an
No
rma
l
Vu Normal
Case1_156kg/s
Case2_156kg/s
FIG.16 THE VU NORMAL DISTRIBUTION ALONG
SYMMETRY LINE (HIGH MASS FLOW RATE)
-0.10.0 0.1 0.2 0.3 0.4 0.5 0.6 0.7 0.8 0.9 1.0 1.1-0.10.00.10.20.30.40.50.60.70.80.91.01.1
Sp
an
No
rma
l
Vu Normal
Case1_141kg/s
Case2_141kg/s
FIG.17 THE VU NORMAL DISTRIBUTION ALONG
SYMMETRY LINE (LOW MASS FLOW RATE)
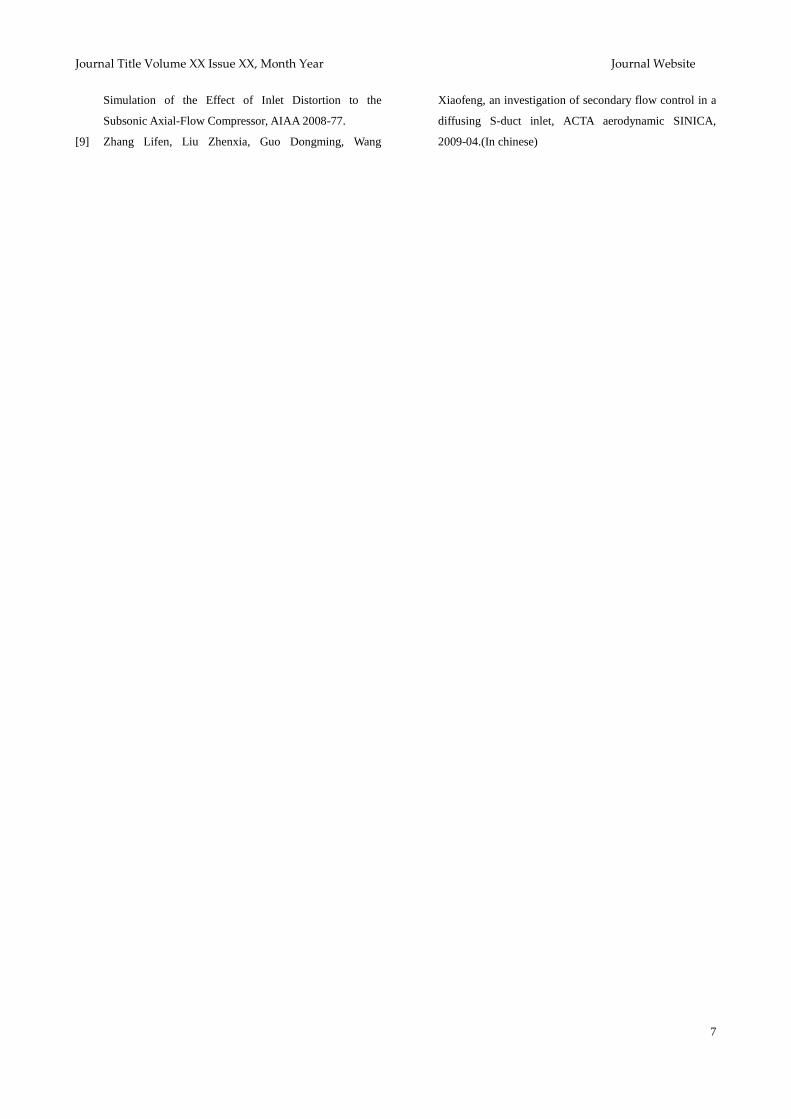
FIG.18 demonstrates Vu contours at AIP plane from
the unsteady numerical computations at high mass
flow rate condition. Close to low wall section, right
side of plane has a high Vu while left side has low
Vu. The distribution of the Vu will promote the
vortex on the left side to be stretched. Vortex on the
right side will be compressed. As a result, the
centre of vortex is transferred to right section.
Contrast to Case 1, the value of Vu is bigger. So
some force may be produced by the response to the
distortion. What is the cause of the force? The
difference of static pressure on the plane may be the
factor of the change.
Journal Website Journal Title Volume * Issue *, Month Year
FIG.18 VU DISTRIBUTION AT AIP (LEFT: CASE1; RIGHT:
CASE 2)
FIG.19 shows the pressure contour at AIP plane. It
is obvious that flow structure is different. The high
pressure section in Case 2 is transferred to the left
side of the AIP plane contrast to that in Case 1. So
by the rotation of fan, the response of parts of the
circumferential blades to the distortion is different.
High pressure section will move in the adverse
orientation of the rotation. And in Case2, the
difference of the pressure in high section and low
section is bigger than Case 1. An extra force in
circumferential direction will produce. The flow
will be accelerated. But in left side of the plane, the
acceleration is bigger than that of right side. As a
result of this, the symmetry line move towards the
right. The “swirl vortex” turns into a “bulk vortex”.
FIG.19 PRESSURE DISTRIBUTION AT AIP(LEFT: CASE1;
RIGHT: CASE 2)
Conclusions
The purpose of this work was to explore the
influence of fan ingestion on the performance of S-
Shaped inlet. To achieve this goal, unsteady
numerical computations have been used to capture
the fundamental characteristics of S-inlet flows like
the separation etc. By analysing the flow field, we
can draw the conclusions as follows:
1. The Dc (distortion intensity) decreases with
mass flow rate decreases and Dc with fan
ingestion is more serious than that with
stagnation pressure at the outlet AIP plane;
2. Under the ingestion of fan, at AIP plane, the
“Swirl vortex” is transformed into “bulk
vortex”. The symmetry line is transferred
along the rotation direction;
3. Change of the stagnation pressure gradient
along circumferential direction is the cause of
transform of the vortex structure at AIP plane.
Fan response to distortion is different when
rotor blades enter and leave the distortion
section.
References
[1] Anabtawi, Amer J.; Blackwelder, Ron; Liebeck,
Robert; and Lissaman, Peter: Experimental Investigation
of Boundary Layer Ingesting Diffusers of a Semi-Circular
Cross Section. AIAA-98-0945, 1998.
[2] Anabtawi, Amer J.; Blackwelder, Ron F.; Lissaman, Peter
B.S.; and Liebeck, Robert H.: An Experimental
Investigation of Boundary Layer Ingestion in a Diffusing
S-Duct With and Without Passive Flow Control. AIAA
99-0739, 1999.
[3] A. P. Plas, M. A. Sargeant, V. Madani, D. Crichton, E. M.
Greitzer,T. P. Hynes, C. A. Hall**; Performance of a
Boundary Layer Ingesting (BLI) Propulsion System,
AIAA 2007-450.
[4] Gorton, S. A., Owens, L. R., Jenkins, L. N., Allan, B. G.,
and Schuster, E. P., \Active Flow Control on a Boundary-
Layer-Ingesting Inlet," 42nd AIAA Aerospace Sciences
Meeting & Exhibit, No. AIAA-2004-1203, AIAA, Reno,
Nevada, January200;
[5] Lie beck, R.H.; Page, M.A.; and Rawdon, B.K.: Blended-
Wing-Body Subsonic Commercial Transport. AIAA 98-
0438, Jan. 1998.
[6] Roman,D.; Allen,J.B., Liebeck, R.H., Aerodynamic
Design Challenges of the Blended-Wing-Body Subsonic
Transport. AIAA-2000-4335, 2000.
[7] Steven R. Wellborn, etc. Study of the compressible Flow
in a Diffusing S-Duct, Journal of Propulsion and Power,
1994-10-05.
[8] Yanfeng Zhang, Wuli Chu, Xingen Lu, Numerical
Journal Title Volume XX Issue XX, Month Year Journal Website
7
Simulation of the Effect of Inlet Distortion to the
Subsonic Axial-Flow Compressor, AIAA 2008-77.
[9] Zhang Lifen, Liu Zhenxia, Guo Dongming, Wang
Xiaofeng, an investigation of secondary flow control in a
diffusing S-duct inlet, ACTA aerodynamic SINICA,
2009-04.(In chinese)