Influence of plectrum shape and jack velocity on the sound ... · Influence of plectrum shape and...
12
Influence of plectrum shape and jack velocity on the sound of the harpsichord: An experimental study Arthur Pat e, a) Jean-Lo € ıc Le Carrou, Arthur Givois, and Alexandre Roy b) Sorbonne Universit es, UPMC Univ Paris 06, CNRS, LAM/Institut d’Alembert, 4 place Jussieu, 75252 Paris Cedex 05, France (Received 18 August 2016; revised 30 January 2017; accepted 5 February 2017; published online 6 March 2017) A controversial discussion in the musical community regards the ability of the harpsichord to pro- duce sound level or timbre changes. The jack velocity (controlled in real time within a musical con- text) and the plectrum shape (modified by the musician or maker prior to the performance) appear to be the two control parameters at the disposal of the harpsichord makers and players for shaping the sound. This article initiates the acoustical study of the control parameters of the harpsichord, presenting a framework for the investigation of these two parameters with means of experimental mechanics measurement. A robotic finger is used for producing repeatable plucks with various jack velocities and plectrum shapes. The plectrum bending, vibrating string’s initial conditions, and radi- ated sound are recorded and analysed. First, results are obtained from measurements carried out on one string, for four plectrum shapes and four jack velocities. The plectrum shape has been found to have an influence on its bending behavior when interacting with the string; on the string’s initial conditions (position and velocity); and on the resulting sound (sound level, spectral centroid, and decay time). The jack velocity does not have an influence on any of the measured quantities. V C 2017 Acoustical Society of America.[http://dx.doi.org/10.1121/1.4976955] [JW] Pages: 1523–1534 I. INTRODUCTION A. State of the art A number of acoustical studies of the harpsichord has accompanied the rediscovery of this instrument in the 20th and early 21st centuries. Most of them have focused on the radiated sound, 1,2 in particular, on the soundboard, with means of vibration modeling, 3 simulation, 4 or measure- ment. 5–9 Tracing back the chain of sound production, one finds studies about the harpsichord strings, investigating experimentally and theoretically their mechanical properties in relation with their vibratory behavior. 10,11 The knowledge of the string vibration, the string/ soundboard coupling, and the soundboard radiation explain a large part of the harpsichord sound. Yet it seems that the string excitation has been much less investigated, despite the fact that this process is indeed the origin of the sound. Hence the harpsichord players would be expected to control the string excitation to some extent, as, e.g., guitarists 12 or harpists do 13 … But it is actually commonly said and believed that harpsichordists have a very low level of con- trol on the dynamics (changes in sound level) and the tim- bre, so that the main features of expressivity in harpsichord playing would rather be the note onset asynchrony or the phrasing, 14–16 the choice of the “register” (determining the number of plectra plucking simultaneously the string and the plucking position along the string), or the velocity at which the finger presses the key. 17 It seems that the only way for the harpsichordist to control the sound of the instru- ment when playing is to change the velocity of key press- ing. Hall 18 showed that different key velocities (hence different jack velocities) can produce different spectral characteristics and different sound levels. That the sound level could be increased with higher jack velocities has been confirmed 19 and then refuted. 20 Acoustical as well as perceptual measurements have shown that different key velocities produce measurable (“minor but audible”) differ- ences both in sound level and spectral characteristics of harpsichord tones. 21 Yet there is another leeway for “shaping” the sound of the harpsichord: the “voicing” process. This empirical proce- dure is carried out by musicians or makers and aims at modi- fying the shape of the plectra in order to get homogeneous sound and touch over the whole tessitura of an instrument. Only a few studies have been done about the plectrum. Qualitative reasoning has suggested 22 that the plectrum, due to its narrowness in comparison with the length of the string, should not alter the vibration of the string, whereas a simple plucked string model has shown that the string’s initial shape and frequency content of vibration signal are altered by the plectrum thickness. 23 This has been confirmed experimen- tally in the case of the classical guitar: The frequency con- tent and the loudness of guitar tones seem to depend on the plectrum characteristics. 24 In the case of the harpsichord, dif- ferent plectrum materials have been compared, focusing on their wearing properties. 25 Using a constant-section beam model, the string motion while in contact with the plectrum and therefore its initial conditions of vibration have been a) Also at: CRC, USR 3224-ECR Mus ee de la Musique, Cit e de la Musique, Philharmonie de Paris, 221 avenue Jean Jaure `s, F-75019 Paris, France. Electronic mail: [email protected] b) Also at: Sorbonne Universit es, UPMC Univ. Paris 06, CNRS, ISIR, 4 place Jussieu, 75252 Paris Cedex 05, France. J. Acoust. Soc. Am. 141 (3), March 2017 V C 2017 Acoustical Society of America 1523 0001-4966/2017/141(3)/1523/12/$30.00
Transcript of Influence of plectrum shape and jack velocity on the sound ... · Influence of plectrum shape and...

Influence of plectrum shape and jack velocity on the soundof the harpsichord: An experimental study
Arthur Pat�e,a) Jean-Lo€ıc Le Carrou, Arthur Givois, and Alexandre Royb)
Sorbonne Universit�es, UPMC Univ Paris 06, CNRS, LAM/Institut d’Alembert, 4 place Jussieu, 75252 ParisCedex 05, France
(Received 18 August 2016; revised 30 January 2017; accepted 5 February 2017; published online 6March 2017)
A controversial discussion in the musical community regards the ability of the harpsichord to pro-
duce sound level or timbre changes. The jack velocity (controlled in real time within a musical con-
text) and the plectrum shape (modified by the musician or maker prior to the performance) appear
to be the two control parameters at the disposal of the harpsichord makers and players for shaping
the sound. This article initiates the acoustical study of the control parameters of the harpsichord,
presenting a framework for the investigation of these two parameters with means of experimental
mechanics measurement. A robotic finger is used for producing repeatable plucks with various jack
velocities and plectrum shapes. The plectrum bending, vibrating string’s initial conditions, and radi-
ated sound are recorded and analysed. First, results are obtained from measurements carried out on
one string, for four plectrum shapes and four jack velocities. The plectrum shape has been found to
have an influence on its bending behavior when interacting with the string; on the string’s initial
conditions (position and velocity); and on the resulting sound (sound level, spectral centroid, and
decay time). The jack velocity does not have an influence on any of the measured quantities.VC 2017 Acoustical Society of America. [http://dx.doi.org/10.1121/1.4976955]
[JW] Pages: 1523–1534
I. INTRODUCTION
A. State of the art
A number of acoustical studies of the harpsichord has
accompanied the rediscovery of this instrument in the 20th
and early 21st centuries. Most of them have focused on
the radiated sound,1,2 in particular, on the soundboard, with
means of vibration modeling,3 simulation,4 or measure-
ment.5–9 Tracing back the chain of sound production, one
finds studies about the harpsichord strings, investigating
experimentally and theoretically their mechanical properties
in relation with their vibratory behavior.10,11
The knowledge of the string vibration, the string/
soundboard coupling, and the soundboard radiation explain
a large part of the harpsichord sound. Yet it seems that the
string excitation has been much less investigated, despite
the fact that this process is indeed the origin of the sound.
Hence the harpsichord players would be expected to control
the string excitation to some extent, as, e.g., guitarists12 or
harpists do13… But it is actually commonly said and
believed that harpsichordists have a very low level of con-
trol on the dynamics (changes in sound level) and the tim-
bre, so that the main features of expressivity in harpsichord
playing would rather be the note onset asynchrony or the
phrasing,14–16 the choice of the “register” (determining the
number of plectra plucking simultaneously the string and
the plucking position along the string), or the velocity at
which the finger presses the key.17 It seems that the only
way for the harpsichordist to control the sound of the instru-
ment when playing is to change the velocity of key press-
ing. Hall18 showed that different key velocities (hence
different jack velocities) can produce different spectral
characteristics and different sound levels. That the sound
level could be increased with higher jack velocities has
been confirmed19 and then refuted.20 Acoustical as well as
perceptual measurements have shown that different key
velocities produce measurable (“minor but audible”) differ-
ences both in sound level and spectral characteristics of
harpsichord tones.21
Yet there is another leeway for “shaping” the sound of
the harpsichord: the “voicing” process. This empirical proce-
dure is carried out by musicians or makers and aims at modi-
fying the shape of the plectra in order to get homogeneous
sound and touch over the whole tessitura of an instrument.
Only a few studies have been done about the plectrum.
Qualitative reasoning has suggested22 that the plectrum, due
to its narrowness in comparison with the length of the string,
should not alter the vibration of the string, whereas a simple
plucked string model has shown that the string’s initial shape
and frequency content of vibration signal are altered by the
plectrum thickness.23 This has been confirmed experimen-
tally in the case of the classical guitar: The frequency con-
tent and the loudness of guitar tones seem to depend on the
plectrum characteristics.24 In the case of the harpsichord, dif-
ferent plectrum materials have been compared, focusing on
their wearing properties.25 Using a constant-section beam
model, the string motion while in contact with the plectrum
and therefore its initial conditions of vibration have been
a)Also at: CRC, USR 3224-ECR Mus�ee de la Musique, Cit�e de la Musique,
Philharmonie de Paris, 221 avenue Jean Jaures, F-75019 Paris, France.
Electronic mail: [email protected])Also at: Sorbonne Universit�es, UPMC Univ. Paris 06, CNRS, ISIR, 4 place
Jussieu, 75252 Paris Cedex 05, France.
J. Acoust. Soc. Am. 141 (3), March 2017 VC 2017 Acoustical Society of America 15230001-4966/2017/141(3)/1523/12/$30.00

modeled.26–29 However, the literature lacks experimental
studies about the plectrum geometry. To the knowledge of
the authors of the present study, there is only one study about
the influence of the harpsichord plectrum geometry. This
study30 found that audio recordings exhibited a high-
frequency sound called a “pre-transient,” supposedly caused
by the plectrum vibration just after the string release. The
frequency of this sound has been shown to depend on the
material and the geometry of the plectrum. The study of the
plectrum geometry also has strong rationales in the field of
organology and musicology: Understanding how plectrum
shape modifications can alter the sound might be interesting
to players, makers, or teachers. In a more historical perspec-
tive, there is a clear need to characterize ancient instru-
ments,31 e.g., for restoration purposes.4 The establishment
and understanding of the link between plectrum geometry
and sound can help characterize instruments so priceless,
ancient, and fragile that they should no longer be played or
touched.
This article presents an experimental framework for the
study of the effect of plectrum shape and jack velocity (as
the two control parameters over the sound of the harpsi-
chord) on the sound. First results are presented. Section I B
describes the plucking mechanism and Sec. I C details the
objectives of this study.
B. The harpsichord plucking mechanism
A drawing of the plucking mechanism, reduced to the
jack and the plectrum, is presented in Fig. 1. The finger
presses the key (not represented here), which is a lever caus-
ing the jack to move upwards. In order to describe the pluck-
ing process, the following characteristic times are defined:
ti: The time at which the finger starts pressing the key;
tc: The beginning of the phase where the string and the plec-
trum are in contact;
ts: The beginning of the string/plectrum slipping phase;
tr: The time at which the string is released.
For ti< t< tc the jack is moving toward the string but
the plectrum has not yet met the string. For tc< t< ts, the
plectrum lifts the string, leading it in a purely vertical
motion. For ts< t< tr, the vertical motion of the string due to
the jack movement goes on, yet due to the deflection of the
plectrum the string starts slipping on the plectrum. At t¼ trthe string loses contact with the plectrum: it is released from
its rest position with finite displacement and velocity and
then starts vibrating.
C. Objectives
The bending behavior of the plectrum is partly (the
other main factor being the plectrum material) controlled by
its geometry, hence the initial conditions of the string vibra-
tion are modified by the plectrum geometry. It is therefore
expected that the resulting sound is influenced by the plec-
trum geometry. During a musical performance, the gesture
of the harpsichord player can provide the jack with different
velocities. This parameter too might have an influence on
the sound. This paper introduces a framework aiming at
experimentally studying the influence of the plectrum geom-
etry and the jack velocity on (a) the bending behavior of
the plectrum, (b) the string’s initial conditions, and (c) the
sound. Section II presents the design of the experiment
aimed at comparing four different plectrum shapes in terms
of mechanical and audio descriptors. Section III gives the
results of the measurements and Sec. IV discusses them.
This paper focuses on one string and a limited set of plectra;
this choice is discussed in Sec. IV.
II. EXPERIMENT
This section describes the design of the experiment.
First the harpsichord (Sec. II A) and the plectra (Sec. II B)
are described. Then the measurement methods for the plec-
trum bending, string’s initial conditions, and sound are pre-
sented (Sec. II C), followed by the processing required for
obtaining readable results (Sec. II D).
FIG. 1. Drawing of the plucking mech-
anism. Horizontal dashed lines repre-
sent the rest position of the jack and
the axis of the string (dashed circle
represent the rest position of the
string). The jack moves at velocity Vj
and the string is released at velocity v0.
Note that the string is in reality closer
to the plectrum tip at ti: this distance
has been exaggerated for improving
the readability of the drawing.
1524 J. Acoust. Soc. Am. 141 (3), March 2017 Pat�e et al.

A. Harpsichord
The experiment is carried out on a harpsichord made by
the French maker M. Ducornet in 1989. This instrument was
made according to the specifications of Flemish harpsichords
of the 17th century, but with only one keyboard and one
register: For each pressed key only one plectrum plucks
the string. The strings are stretched to nominal tension. This
study focuses on a single key, corresponding to the G4-
string (diameter d¼ 0.32 mm, cross-section S¼ pd2/4¼ 8.04
� 10–2 mm2, speaking length L¼ 475 mm, plucking point at
xp¼ 121.5 mm from the pin, string made of iron with density
q¼ 7860 kg m–3, and Young’s modulus E¼ 169� 109 Pa),
tuned at f0¼ 367 Hz (the harpsichord was tuned with a
meantone temperament at A4¼ 415 Hz prior to the
measurements). The estimated string tension is therefore
T ¼ 4qSL2f 20 ¼ 76:84 N. The different plectra investigated
in this study all correspond to this key/string. The harpsi-
chord has a stop rail for the keys: If the finger continuously
pushes the key, the lever motion is stopped by the key hitting
the stop rail. For higher jack velocities, the jack can be
thrown upwards and it is stopped by the jack rail. Both stop
and jack rails are fitted with a small quantity of felt under-
neath in order to dampen the impact noise.
B. Plectrum shape
Four plectrum shapes are investigated in this study. They
are carved out of a polyoxymethylene [(CH20)n better known
by harpsichord users as the commercial name “DelrinVR
,” a
registered name by DuPontTM
(USA)] plate. This material has
progressively gained popularity among the harpsichord com-
munity, showing a better operating life and resistance to
hygrometric and temperature changes than the traditional
materials such as quill and leather,32,33 and is nowadays the
most common material used for plectra in harpsichords. Each
of the plectra is clamped on a jack, and all jacks are identical.
Plectrum P1 is the plectrum made by the harpsichord maker
himself: it is therefore adapted to the harpsichord of the study
(with its current strings and mechanism setup.) An experi-
enced harpsichord player at our laboratory shaped the plectra
P2, P3, and P4 for the same key, with the aim of producing
significantly different geometries than P1. These three other
geometries are caricatural on purpose: They exhibit features
that can be encountered in actual plectra, and are meant to
sample the variety of real plectra shapes.
The dimensions of the plectra have been accurately
measured using a photogrametric method. This method has
been previously described in detail35 and only a brief
description is given here. For each plectrum, a picture is
taken with a Nikon D800 (Japan) camera equipped with a
60 mm 1:2.8D lens, making sure the focal distance is kept
constant and the light level is sufficient to insure correct con-
trast between the plectra and the black background. From the
pictures a contour detection (Sobel method36) is applied in
order to retrieve the plectrum profiles (respective to both
thickness and width from top and side pictures of the plec-
tra). Figures 2(a) and 2(b) show, respectively, the measured
thickness and width of each of the four plectra. In terms of
thickness, P1 and P4 are very close to one another: They
exhibit a linearly decreasing thickness from clamping point
to tip, and the major difference between P1 and P4 is the
curved tip of P1 (which is typical of playable harpsichord
plectra). In contrast, P2 and P3 have an almost constant
thickness with a steep decrease at the tip. Compared with P1
and P4, the curvature of the tip of P2 and P3 starts however
at a closer position with respect to the plectrum/jack clamp-
ing point. In terms of width profile, all plectra present an
almost linearly decreasing width, with each plectrum exhib-
iting a different slope. P1 shows the steepest width decrease,
followed by P4, P2, and P3 (the latter two being very close
to one another.) P3 is significantly longer than the three other
plectra.
The frequency of the first bending mode was also mea-
sured for each plectrum.35 For this purpose, plectra were
excited with a Monacor SP-60/8 (Germany) loudspeaker
playing a 5 s long logarithmic sweep signal from 2000 to
8000 Hz.37 From the measurement of the pressure excitation
signal [Bruel & Kjær 4961 (Denmark) microphone] and of
the plectrum vibration [Polytec PDV 100 (USA) laser vibr-
ometer], the impulse response function of the plectra was
computed and analyzed with the esprit method38 in order to
get the first bending frequency. The first bending frequency
for each plectrum is listed in Table I.
C. Experimental setup
A robotic finger is used in order to provide a repeatable
excitation of the string. A detailed description of the robotic
finger is given in a previous article.34 The robot has previ-
ously been used for studying the plucking process in the
harp39,40 and has then been adapted to the harpsichord.41
The robotic finger has two degrees of freedom (rotations)
and is position-driven. Instructions are given to the robot so
that the fingertip presses the key with a purely vertical,
constant-speed translation movement. The motion of the
key is monitored using a fibre optic sensor Philtec D171-Q
(USA) measuring the key depression.
FIG. 2. (Color online) Thickness (a) and width (b) profile for each of the
four plectra. Thickness and width are measured along the plectrum length/xaxis whose origin is at the plectrum-to-jack clamping point.
J. Acoust. Soc. Am. 141 (3), March 2017 Pat�e et al. 1525

The radiated sound is measured with a Bruel & Kjær
2669 microphone placed 1 m above the centre of the sound-
board (similar results are obtained with a microphone
located at the position of the musician’s ear.) This location is
consistent with the literature21 and with the common practice
of recording engineers.
A Phantom Miro M120 (USA) high-speed camera
(16 000 frames per second, 320� 240 pixels resolution) is
used together with additional spotlights in order to measure
the plectrum deflection.
The string motion is recorded with two perpendicular
(for two string polarizations) optical sensors (sensor for hori-
zontal string motion is located 6.0 mm from the nut and
115 mm from the plucking point, sensor for vertical string
motion is located 13.0 mm from the nut and 108 mm from
the plucking point). During its motion, the string cuts a light
beam (one beam for each sensor), producing a voltage pro-
portional to the displacement. The operating and calibration
of these sensors are described in details in a recent article.42
The drawing in Fig. 3 summarizes the experimental setup.
The data are recorded in real-time using a MATLAB (USA) inter-
face controlling National Instruments (NI)-9234 (USA) acquisi-
tion cards mounted on a NI-9178 chassis. In order to study how
the measured features depend on the jack velocity Vj, measure-
ments are done for various jack velocities (see Sec. II D).
D. Data processing
The raw data need some pre-processing in order to be
analysed. Figure 4 gives an example of the results obtained
during the experiment. The key depression and the vertical
and horizontal displacement of the string are plotted along
with the characteristic times defined in Sec. I B. Note that
the string displacement measurement has to be expressed at
the plucking position. Assuming that before the release the
string shape is a triangle whose top is at the plucking point, a
simple proportionality rule is used considering the respective
distances from the nut and bridge of each of the optical sen-
sors and of the plectrum.
The characteristic times defined in Sec. I B are identified
as follows:
ti: identified as the first instant at which the key depression
signal exceeds by 5% its rest value (mean of the first 20
samples);
tc: identified as the first instant at which the string vertical
motion signal declines by 1% from its rest value (mean of
the first 20 samples);
ts: identified as the first instant at which the string horizontal
motion signal exceeds by 1% its rest value (mean of the first
20 samples);
tr: identified as the instant at which the vertical velocity of
the string reaches its maximum. Note that for t> tr the
robotic finger keeps pushing the key with the same force
(the same would occur with a human finger in playing con-
ditions): at first there is no more resistance due to the string
so the key moves quicker (bump on the key depression plot
just after tr), then the robot adapts its velocity to the instruc-
tions it has been given, and finally the key meets the felt of
the stop rail which offers a high resistance so the key is
moving slower.
The robot is checked to provide a constant jack velocity.
The velocity of the jack is derived from a linear regression
TABLE I. For each plectrum of the study, measured first bending frequency, in Hz. The mean of ten measurement is given, and the uncertainty interval is two
standard deviations below and above the mean.
Plectrum P1 P2 P3 P4
First bending frequency (Hz) 6195.06 6 1.56 5424.42 6 1.54 4240.89 6 1.68 5938.00 6 2.80
FIG. 3. Drawing of the experimental setup. A robotic finger pushes the key
at constant velocity. The string displacement (two directions) is measured
with optical sensors. The plectrum deflection is measured with a high-speed
camera. The radiated sound is measured with a microphone located 1 m
above the centre of the soundboard.
FIG. 4. Vertical and horizontal displacement of the string (at plucking
point), and key depression corresponding to a single measurement at
Vj¼ 0.05 m s�1. Characteristic times are indicated with dashed lines: ti, the
time at which the finger starts pressing the key; tc, the time at which the
plectrum starts pulling the string away; ts, the time at which the string starts
slipping on the plectrum; tr, the time at which the string is released.
1526 J. Acoust. Soc. Am. 141 (3), March 2017 Pat�e et al.

of the key depression (scaled with the law of the lever) sig-
nal between ti and tr.In order to study velocities that can be obtained in playing
conditions,43 the following jack velocities are investigated:
Vj¼ 0.05 m s�1, Vj¼ 0.1 m s�1, Vj¼ 0.2 m s�1, Vj¼ 0.3 m s�1.
1. Plectrum deflection
Figure 5(a) shows an example plectrum deflection just
before tr the release time. In practice, the camera, and opti-
cal sensors are synchronized, so that the last picture of the
bent plectrum before tr can be automatically extracted. This
picture is first deskewed using parameters from the camera
calibration made prior to the measurements.44,45 From such
calibrated pictures the final shape of the bent plectrum is
computed: (a) first the image is manually cropped in order
to keep only the plectrum and the string visible, then (b) a
contour detection algorithm is run using the Prewitt
method46 with ad hoc threshold, and (c) the contour detec-
tion is manually checked, discarding irrelevant points. In
order to make the result easier to present and read, the iden-
tified points of the contour are fitted to a polynomial corre-
sponding to the equation of the deflection of a bent beam.
To a first approximation, the plectrum can be considered to
bend according to the equation of a cantilever constant-I
beam loaded at its free end, which can be found in the
literature47
y xð Þ ¼ PL3
6EI
3x2
L2� x3
L3
� �; (1)
where y(x) is the deflection at abscissa x, P is the force
applied at x¼L with L the length of the beam, E is the
Young’s modulus, and I is the quadratic moment of the
beam section. The identified points of the contour are fitted
to a polynomial of order 3 consistent with Eq. (1)
yðxÞ ¼ ax3 þ bx2 þ dxþ c; (2)
checking that d, c� a, b in order to comply with the absence
of zeroth- and first-order terms in Eq. (1). The result of the
contour detection as well as the polynomial fit are given in
Fig. 5(b).
2. String’s initial conditions
The string’s initial conditions are estimated from the
signals of the optical sensors. The initial displacement x0 and
y0 are the values given by the horizontal and vertical optical
sensor, respectively, at tr the time of string release. In order
to estimate the string’s initial velocities vx0 and vy0 (respec-
tively, the initial velocities along the horizontal and vertical
axes), the following method is used for the signals of each
optical sensor:
• Collect the 100 samples preceding tr;• Compute a polynomial regression of order 2 (correspond-
ing to the shape of the string trajectory observed before tr)on this truncated signal;
• Estimate the velocity by evaluating the derivative of the
polynomial at t¼ tr.
We also define the magnitude of initial displacement as:
D0 ¼ffiffiffiffiffiffiffiffiffiffiffiffiffiffix2
0 þ y20
p, the magnitude of initial velocity as:
v0 ¼ffiffiffiffiffiffiffiffiffiffiffiffiffiffiffiffiffiffiffivx2
0 þ vy20
p, and the angle of release which is the angle
between the plectrum tip and the horizontal axis
c0 ¼ a tanðy0=x0Þ.
3. Audio features
In order not to disturb the audio analysis with noise
coming from the robotic devices and the measurement appa-
ratus, only the first 2 s (starting from tr) of the audio signals
where kept for the computation of audio features. The fol-
lowing audio features are computed from the signal of the
microphone:
Equivalent sound level Leq(A) computed from the pressure
signal p(t):
Leq ¼ 10 log10
1
T
ðT
t¼0
p2 tð Þp2
ref
dt
!; (3)
where pref¼ 2� 10�5 Pa, and T¼ 2 s. The A-weighting
scale48 is then used because it is easy to compute and is a
satisfactory first-order approximation of the human hearing;
Spectral centroid (SC) represents the centre of gravity of
the spectrum and is defined as49
SC ¼
XN
k¼1
fkak
XN
k¼1
ak
; (4)
and is computed from the discrete spectrum of the pressure
signal: fk and ak are, respectively, the frequency and ampli-
tude in bin k;
FIG. 5. Deflection of the plectrum P1
(jack velocity Vj¼ 0.05 m s�1) just
before the release of the string at tr. (a)
Photograph from the high-speed cam-
era and (b) corresponding contour
identification and third-order polyno-
mial fit.
J. Acoust. Soc. Am. 141 (3), March 2017 Pat�e et al. 1527
Decay time T10 computed from the energy decay curve
(EDC). The EDC is defined as50
EDCðtÞ ¼ðt
0
p2ðsÞds: (5)
A linear regression of the EDC is then computed, from
which the decay time T10 is derived.51 The T10 is defined as
the time needed to decrease by an amount of 10 dB from its
maximum level. Prior to selecting a threshold of 10 dB and
to computing the T10, it was checked that no signal exhibits
any double-decay in the EDCs (all signals decay linearly.)
Log rise time defined in the field of psychoacoustics.52
Here it is defined as the time needed by the energy (propor-
tional to the squared signal) to reach its maximum, starting
from a pre-defined threshold (here a tenth of the maximum
energy.53) We then take the decimal logarithm of this time.
Note that we also computed this rise time (also called
“attack time”) with different thresholds, with or without the
logarithm, all options giving similar results.
Note that these audio features were selected because they are
very simple and synthetic descriptors of traditional basic sound
aspects (amplitude—Leq(A), spectrum shape or repartition of
spectral energy—SC, decay—T10, and attack—log rise time).
They are used to attempt to categorize the sounds according to
basic acoustic criteria rather than to provide an estimate of the
sound quality, which we leave to perceptual studies.
III. RESULTS
This section presents the results of the experiment, and is
divided as follows: First the plectrum deflection measurements
are analyzed (Sec. III A), then the initial conditions of the
string (Sec. III B), and eventually the audio features computed
from the microphone measurements (Sec. III C.)
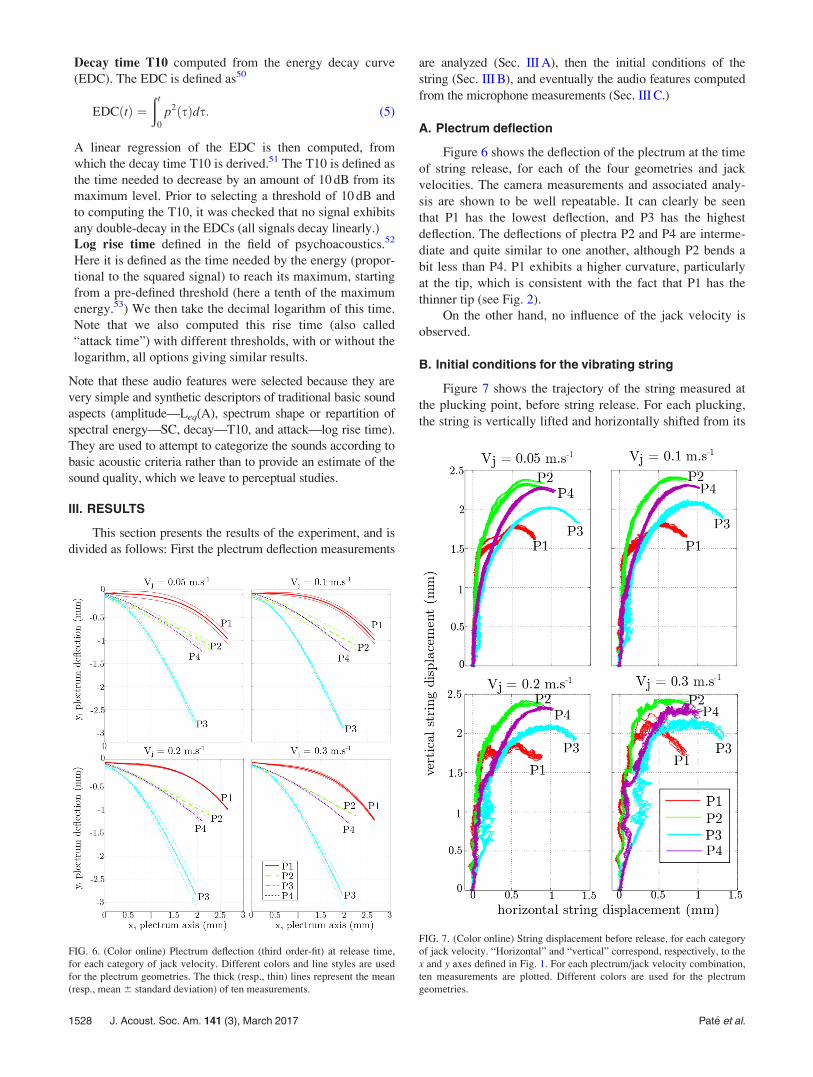
A. Plectrum deflection
Figure 6 shows the deflection of the plectrum at the time
of string release, for each of the four geometries and jack
velocities. The camera measurements and associated analy-
sis are shown to be well repeatable. It can clearly be seen
that P1 has the lowest deflection, and P3 has the highest
deflection. The deflections of plectra P2 and P4 are interme-
diate and quite similar to one another, although P2 bends a
bit less than P4. P1 exhibits a higher curvature, particularly
at the tip, which is consistent with the fact that P1 has the
thinner tip (see Fig. 2).
On the other hand, no influence of the jack velocity is
observed.
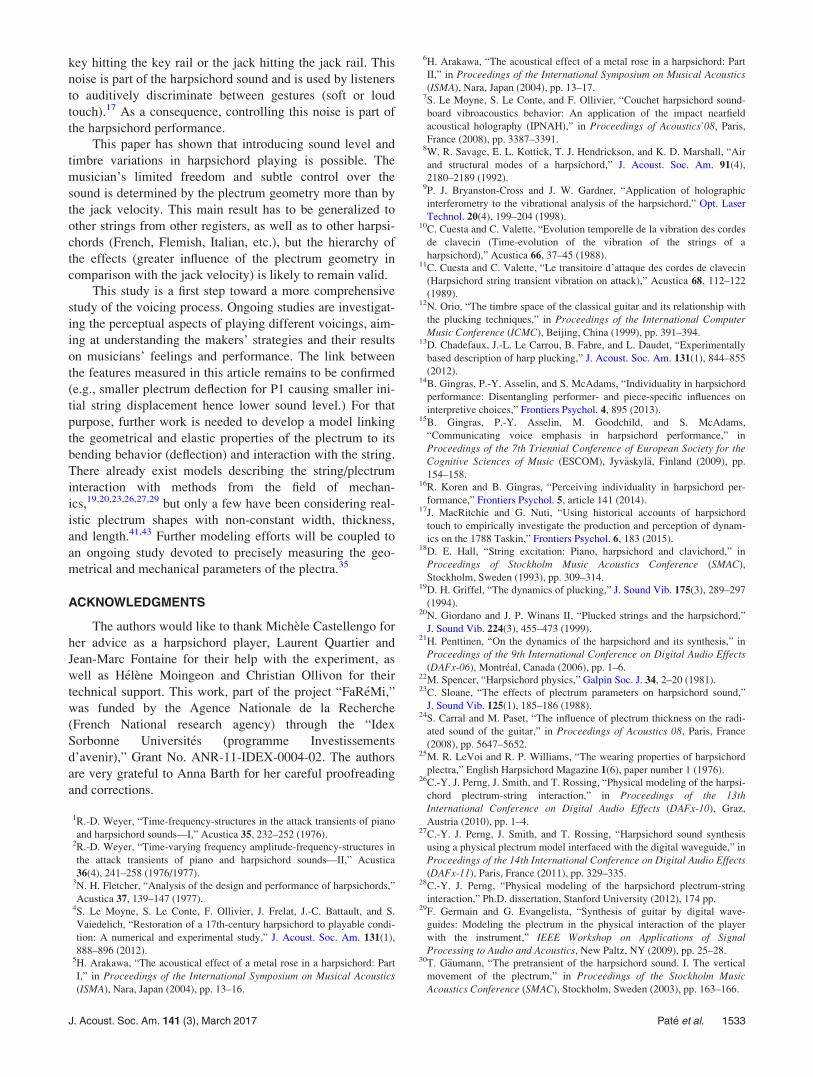
B. Initial conditions for the vibrating string
Figure 7 shows the trajectory of the string measured at
the plucking point, before string release. For each plucking,
the string is vertically lifted and horizontally shifted from its
FIG. 6. (Color online) Plectrum deflection (third order-fit) at release time,
for each category of jack velocity. Different colors and line styles are used
for the plectrum geometries. The thick (resp., thin) lines represent the mean
(resp., mean 6 standard deviation) of ten measurements.
FIG. 7. (Color online) String displacement before release, for each category
of jack velocity. “Horizontal” and “vertical” correspond, respectively, to the
x and y axes defined in Fig. 1. For each plectrum/jack velocity combination,
ten measurements are plotted. Different colors are used for the plectrum
geometries.
1528 J. Acoust. Soc. Am. 141 (3), March 2017 Pat�e et al.

rest position (x, y)¼ (0, 0) to the initial position of vibration
(x, y)¼ (x0, y0). Different plectrum geometries clearly lead
to different string trajectories and hence different initial con-
ditions (see below for more details.) The jack velocity does
not change the overall shape of the trajectory, but higher
jack velocities foster horizontal (the string slips back and
forth on the plectrum) and vertical (both upward jack push-
ing motion and string restoring force apply on the plectrum)
oscillations, indicating that the string and plectrum motions
are no longer quasi-static but dynamic for higher jack
velocities.
The identified initial conditions of the string are plotted
in Fig. 8(a) (magnitude of initial displacement and velocity),
Fig. 8(b) (horizontal and vertical components of initial dis-
placement), and Fig. 8(c) (initial angle of string release
against magnitude of initial velocity.)
Figure 8(a) clearly shows that the magnitude of the ini-
tial displacement is dependent on the plectrum shape: P2,
P3, and P4 move the string much further away than P1, and
P3 produces smaller initial displacement than P2 and P4. It
is then expected that P1 produces lower sound levels.
Figure 8(b) gives a more detailed view into the initial
displacement. The plectra differ not only by the magnitude
of the initial displacement, but also by the distribution of
horizontal and vertical initial displacements. P2 and P4 pro-
vide much higher vertical displacements: With P2 and P4
the string is primarily excited in the direction in which the
soundboard vibrates, and louder sound levels are expected.
P3 provides the string with a large horizontal displacement;
hence a less efficient sound radiation is expected with tones
produced by P3. Figure 8(b) also shows differences in the
ranges of variation: The plectra differ in the variation range
of the initial (horizontal and vertical) displacements they can
provide to the string. The largest horizontal variation range
is achieved by plectrum P1: Different jack velocities can
change the horizontal initial displacement of the string by up
to 0.1 mm versus 0.05 mm for the other plectra. The vertical
variation ranges of the four plectra are similar and approxi-
mately equal to 0.1 mm.
Moreover one can notice the influence of the jack veloc-
ity: For all plectra, the quicker the jack moves, the further
the vertical release position of the string from its rest posi-
tion. The influence of the jack velocity on the horizontal dis-
placement is less clear: For P1, the faster the jack moves, the
further the string is horizontally released from its rest posi-
tion, whereas for P2, P3, and P4 the velocity of the jack has
no influence on the horizontal displacement of the string.
Figure 8(c) shows that the magnitudes of initial velocity
provided by each plectrum do not stand out from each other
as clearly as observed for the initial displacement. For plec-
tra P1, P3, and P4, it is clear that increasing the jack velocity
increases the initial velocity of the string. For a given jack
velocity, initial string velocities provided by P1 and P3 cover
wider ranges than P2 and P4. Note that for higher jack veloc-
ities an increase in the variability in the initial string velocity
and unexpectedly high string’s initial velocities (P1 and
Vj¼ 0.03 m�s�1) is observed. This may indicate a limitation
of the plucking robot for higher velocities.
Figure 8(c) shows that the initial angle of string release
depends on the jack velocity and on the plectrum shape. The
higher the jack velocity, the higher the initial angle.
Plucking with P3 results in smaller initial angles, plucking
FIG. 8. Measured string’s initial conditions. (a) Magnitude D0 ¼ffiffiffiffiffiffiffiffiffiffiffiffiffiffiffix2
0 þ y20
pof the displacement and magnitude v0 ¼
ffiffiffiffiffiffiffiffiffiffiffiffiffiffiffiffiffiffiffivx2
0 þ vy20
pof the velocity, (b)
horizontal x0 and vertical y0 initial displacement of the vibrating string, and
(c) initial angle of string release versus magnitude v0 of the initial string
velocity, for each plectrum geometry and jack velocity. A color-code is used
for the categories of jack velocity, markers are used for the plectrum geome-
tries. Distances are counted from the string’s rest position for t< ti.
J. Acoust. Soc. Am. 141 (3), March 2017 Pat�e et al. 1529

with P1 or P4 results in intermediate angles, whereas pluck-
ing with P2 results in small initial angles. P2 and P4 show a
very small variation range in initial angle, in comparison
with P1 and P3.
The slightly wider ranges (depending on the jack veloc-
ity) observed in the initial horizontal displacement and angle
for P1 can be interpreted as a finer and more precise control
given to the player: Controlling the jack velocity, the player
has access to a broader range of string’s initial conditions
when using P1. This should not come as a surprise since P1
has been designed and adjusted by the maker himself for this
very harpsichord.
C. Audio features
We present here the results from the microphone
measurements.54
1. Spectrograms and waveforms
Figure 9 presents the waveform and spectrogram of the
attack transient extracted from the audio recordings, for each
plectrum, at jack velocity Vj¼ 0.1 m s�1 (this jack velocity
has been chosen because it is an intermediate velocity, the
tendencies presented in the following are similar for the
other jack velocities, the only difference being higher ampli-
tudes for higher jack velocities, see Sec. III C 2 for more
details on this aspect). No influence of the plectrum geome-
try is observed on the waveform: this holds close to the
attack transient as shown in Fig. 9, and also further away
from the attack transient.
On the other hand, it can be seen in the spectrograms that
each plectrum produces its own sound signature in the attack
transient. Red ellipses in Fig. 9 show typical zones of spectral
energy reinforcements: between 6 and 6.5 kHz for P1 and P4,
around 5 kHz for P2, and between 3 and 4 kHz for P3. These
frequency formants correspond roughly to the measured fre-
quencies of the plectra as given in Table I. An explanation for
this, which has been proposed by G€aumann,30 is that the
microphone picks up the acoustic emissions of the plectrum
vibrating shortly after string release, presumably resulting in
these observed formants.
2. Audio features
We present next the audio features (described in Sec.
II D 3) computed from the audio recordings.
a. Sound level. The sound levels are plotted in
Fig. 10(a). For all jack velocities, plucking the string with
P1 (resp., P4) clearly leads to a softer (resp., louder) tone:
Such sound level differences [1 to 2 dB(A) lower than the
other plectra] might be audible (the just noticeable differ-
ence in sound level being approximately 1 dB.55) This is
consistent with the result of Sec. III B showing that the
string’s initial displacement provided by P1 is smaller. The
observed tendencies are supported by a 4 (plectrum)� 4
(velocity) analysis of variance (ANOVA)56 on the Leq(A)
showing that the plectrum geometry has a significant influ-
ence on the sound level [F(3,144)¼ 219.48, p< 0.01**57].
A Tukey HSD post hoc test shows that, in terms of the
sound level of the resulting tones, P1 is different from P2
(p< 0.01**), P3 (p< 0.01**), and P4 (p< 0.01**), and that
P4 is different from P2 (p< 0.01**) and P3 (p< 0.01**).
The two-way ANOVA also shows a significant influ-
ence of the jack velocity [F(3,144)¼ 4.48, p< 0.01**] on
the sound level. A Tukey post hoc test shows that only the
extreme jack velocities (Vj¼ 0.05 m s�1 and Vj¼ 0.3 m s�1)
are significantly different (p< 0.01**), which is obvious
for the tones produced by P1 and P2, but not for P3 and P4.
This apparent inconsistency can be explained by the signifi-
cance of the interaction jack velocity� plectrum geometry
[F(9,144)¼ 2.41, p¼ 0.014*].
b. SC. The SC values are plotted in Fig. 10(b). No
dependence on the jack velocity is observed. Tones resulting
from a plucking with P1, P3, and P4 have the highest SC.
Tones produced by P2 have the lowest SC. This is confirmed
FIG. 9. (Color online) Waveform and
spectrogram of the attack transient
extracted from the audio recordings,
for each plectrum, at jack velocity
Vj¼ 0.1 m s�1. (a) P1, (b) P2, (c) P3,
and (d) P4. Red ellipses highlight the
distinctive features in the spectro-
grams. The spectrograms have been
trimmed to the frequency range where
differences can be seen between the
plectra.
1530 J. Acoust. Soc. Am. 141 (3), March 2017 Pat�e et al.

by a 4 (plectrum geometry) � 4 (jack velocity) ANOVA on
the SC values, showing that the plectrum geometry has an
influence on the SC [F(3,144)¼ 16.48, p< 0.01**], whereas
the jack velocity [F(3,144)¼ 1.28, p¼ 0.28] and the jack
velocity� plectrum geometry interaction [F(9,144)¼ 0.89,
p¼ 0.53] are not significant. A Tukey HSD post hoc test
shows that P2 and P1 (p< 0.01**), P2 and P3 (p< 0.01**),
and P2 and P4 (p< 0.01**) are significantly different from
one another in terms of the SC of the tones they produced.
This suggests that P1, P3, and P4 may produce
brighter58,59 sounds than P2. This remains to be confirmed
by perceptual tests that may be conducted with stimuli
derived from the recordings of this study. However, it can be
remarked that P2 is wider than P1 and P4, and hence may
favor lower frequencies.23
c. T10. The T10 values are plotted in Fig. 11(a). The
jack velocity does not seem to have an influence on the
decay time in general, whereas plectrum P1 seems to pro-
duce faster decaying tones. This is confirmed by a 4 (plec-
trum geometry)� 4 (jack velocity) ANOVA on the T10
values, showing that the plectrum geometry has an influence
on the T10 [F(3,144)¼ 9.21, p< 0.01**], whereas the jack
velocity [F(3,144)¼ 0.81, p¼ 0.49] and the jack velocity
� plectrum geometry interaction [F(9,144)¼ 1.29, p¼ 0.25]
are not significant. A Tukey HSD post hoc test shows that P1
has a significantly different influence on the T10 than P2
(p< 0.01**), P3 (p< 0.01**), and P4 (p< 0.01**).
d. Log rise time. The log rise times are plotted in Fig. 11.
Surprisingly, the attack time does not seem to depend on either
the plectrum geometry or the jack velocity. This is confirmed
by a 4 (plectrum geometry)� 4 (jack velocity) ANOVA on
the log rise time, showing no significant influence of either
the plectrum geometry [F(3,144)¼ 2.21, p¼ 0.09], the jack
velocity [F(3,144)¼ 0.37, p¼ 0.77], or their interaction
[F(9,144)¼ 0.61, p¼ 0.78].
IV. DISCUSSION
A. Link between the measurements
Links can be made between the different measurements
[please refer to Figs. 2(a), 6, 8(a), and 10(a) throughout this
paragraph]. First, the thickness profile of the plectra influen-
ces their bending shape: P1, and to a lesser extent P4, has a
regularly decreasing thickness from its clamping point to its
end, resulting in an increasing bending angle (from almost
null angle and horizontal tangent to high angles), that is
“curvier” in bending shape. In contrast, P2 and P3 are
slightly thinner at the clamping point, although have almost
constant thickness. This results in a high curvature which
remains constant along the entire length.
FIG. 10. (a) Equivalent A-weighted sound level and (b) SC, for each plec-
trum geometry. A color-code is used for the categories of jack velocity.
Dashed lines highlight which plectrum geometries are significantly different
one from another.
FIG. 11. (a) Decay time (T10) and (b) log rise time, for each plectrum
geometry. A color-code is used for the categories of jack velocity. Dashed
lines highlight which plectrum geometries are significantly different from
one another.
J. Acoust. Soc. Am. 141 (3), March 2017 Pat�e et al. 1531

Second, the plectrum thickness at its clamping point
controls its maximum deflection. P1 (resp., P3), which shows
the highest (resp., smallest) thickness at the jack/plectrum
clamping point, has the minimum (resp., maximum) deflec-
tion. Similarly, P2 and P4 with intermediate thickness, show
intermediate deflections.
Third, the maximum deflection controls the initial string
displacement and the sound level. P1 has the smallest maxi-
mum deflection, leading to smaller horizontal (x0) and verti-
cal (y0) initial string displacements. This causes smaller
amplitude for the vibrating string and therefore a lower
sound level. Accordingly, P2 and P4 have similar and higher
maximum deflections leading to similar initial string dis-
placements. These string’s initial displacements (vertical, in
particular) are higher than those caused by P1, this results in
louder sound levels. By contrast, P3, with the highest maxi-
mum deflection, tends to increase the horizontal string dis-
placement by a lot and only slightly increase the vertical
initial string displacement (with respect to P1). An explana-
tion is that the large and straight deflection of P3 favors the
(horizontal) slipping of the string on the plectrum, making
the horizontal component prevail over the vertical compo-
nent in the initial string displacement. P3 also produces
louder sound levels than for P1, presumably mostly because
P3 plucks have a higher vertical initial string displacement
than P1 plucks.
B. Further remarks
The sound level increase that is sometimes observed for
higher jack velocities (Vj¼ 0.3 m s�1) might come from the
noise made by the jack hitting the jack rail or by the key hit-
ting the stop rail.60 The introduction of this additional per-
cussive noise with higher velocities has been described in a
recent article17 showing that the perception of harpsichord
dynamics is strongly related to the presence or absence of
this percussive noise. Here the percussive noise at high jack
velocities may increase the sound level, at least for tones
produced by P1 and P2. However, this percussive noise does
not change the SC values (no jack velocity dependence for
the SC). Yet it should be emphasized that this phenomenon
may depend on the instrument, whether or not equipped with
a stop rail, with different quantities of felt, etc. There might
be other noise sources, such as the plectrum touching the
string on its way back just before the damper touches the
string, but this aspect of the sound has not been studied here.
No clear difference is observed in terms of decay time
(T10.) This may mean that no jack velocity or plectrum
shape alters the string’s initial conditions enough to change
the balance between the horizontal and vertical string polar-
izations. Such a change would result in different couplings
with the soundboard and potentially in decay time inhomo-
geneities (some notes with “normal” decay, some adjacent
notes with much smaller decay.)
As a more general remark, it should be emphasized that
the plectra of this study have been cut with different shapes
on purpose, in order to provoke noticeable and measurable
differences, keeping however shapes adapted to the string
investigated thus playable plectra. Differences in plectrum
deflection and initial conditions of the vibrating string are
very clear, but computed sound descriptors show less clear
differences: Even more subtle changes can be expected with
“real” plectra (i.e., plectra actually mounted on harpsichords
and used by musicians.)
Finally, it is observed that in comparison with the plec-
trum shape, the jack velocity has little to no influence on the
features measured in this study. This indicates that apart
from gesture and interpretation strategies (legato or staccatoplay, in order to favor or inhibit the overlap between notes
and smooth out the note onsets), the main control parameter
for the musician is the plectrum shape. This is not a real-
time parameter, but it is rather part of the instrument setup
prior to the performance. Unsurprisingly harpsichord players
pay close attention to the voicing process. Furthermore, it is
observed that changing the plectrum shape can change the
variation range of the string’s initial conditions: With P1, the
only “real” plectrum (i.e., the only plectrum designed for
musician use), the initial displacement and velocity of the
string are more dependent on the jack velocity than with
other plectra. This suggests that if players are able to adapt
to the plectrum and finely vary the jack velocity when play-
ing, they may be able to change the sound very subtly.
The present study investigated one string only, in the
medium register of the instrument. Extending the experiment
to all strings of the instrument would be very onerous (a new
set of plectra would have to be designed for each string, typi-
cal jack velocities in playing conditions would have to be
measured for each string before running the experiment) and
would probably not change the results of this paper. The
investigation of other strings will bring changes in the string
tension and in the string/plectrum frictional behavior, but if
plectra are designed in a way that they have features of play-
able plectra, then the results of this study are likely to hold
(the plectrum shape is more influential than the jack velocity,
the shape of the plectrum determines its bending behavior
and therefore the string’s initial conditions.)
V. CONCLUSION
In this article we presented an experimental framework
studying the influence of different plectrum geometries and
jack velocities on the string/plectrum interaction and on the
sound, along with results obtained for a single string.
Objective descriptors have been derived from measurements
such as the initial displacement, velocity and angle of the
string, sound level, SC, decay time, and log rise time of the
resulting radiated sound, and the plectrum shape before
string release.
As expected, plectra differing in their geometry clearly
have different bending behaviors, changing the initial condi-
tions of the vibrating string and the sound (sound level and
SC.) The bending frequency of the plectrum has been shown
to be part of the transient of the radiated sound. The jack
velocity has been shown to have only little influence on the
string’s initial conditions, and no influence on the plectrum
deflection. The influence of the jack velocity on the sound
level may be mostly explained by the appearance at high
jack velocities of a percussive noise corresponding to the
1532 J. Acoust. Soc. Am. 141 (3), March 2017 Pat�e et al.
key hitting the key rail or the jack hitting the jack rail. This
noise is part of the harpsichord sound and is used by listeners
to auditively discriminate between gestures (soft or loud
touch).17 As a consequence, controlling this noise is part of
the harpsichord performance.
This paper has shown that introducing sound level and
timbre variations in harpsichord playing is possible. The
musician’s limited freedom and subtle control over the
sound is determined by the plectrum geometry more than by
the jack velocity. This main result has to be generalized to
other strings from other registers, as well as to other harpsi-
chords (French, Flemish, Italian, etc.), but the hierarchy of
the effects (greater influence of the plectrum geometry in
comparison with the jack velocity) is likely to remain valid.
This study is a first step toward a more comprehensive
study of the voicing process. Ongoing studies are investigat-
ing the perceptual aspects of playing different voicings, aim-
ing at understanding the makers’ strategies and their results
on musicians’ feelings and performance. The link between
the features measured in this article remains to be confirmed
(e.g., smaller plectrum deflection for P1 causing smaller ini-
tial string displacement hence lower sound level.) For that
purpose, further work is needed to develop a model linking
the geometrical and elastic properties of the plectrum to its
bending behavior (deflection) and interaction with the string.
There already exist models describing the string/plectrum
interaction with methods from the field of mechan-
ics,19,20,23,26,27,29 but only a few have been considering real-
istic plectrum shapes with non-constant width, thickness,
and length.41,43 Further modeling efforts will be coupled to
an ongoing study devoted to precisely measuring the geo-
metrical and mechanical parameters of the plectra.35
ACKNOWLEDGMENTS
The authors would like to thank Michele Castellengo for
her advice as a harpsichord player, Laurent Quartier and
Jean-Marc Fontaine for their help with the experiment, as
well as H�elene Moingeon and Christian Ollivon for their
technical support. This work, part of the project “FaR�eMi,”
was funded by the Agence Nationale de la Recherche
(French National research agency) through the “Idex
Sorbonne Universit�es (programme Investissements
d’avenir),” Grant No. ANR-11-IDEX-0004-02. The authors
are very grateful to Anna Barth for her careful proofreading
and corrections.
1R.-D. Weyer, “Time-frequency-structures in the attack transients of piano
and harpsichord sounds—I,” Acustica 35, 232–252 (1976).2R.-D. Weyer, “Time-varying frequency amplitude-frequency-structures in
the attack transients of piano and harpsichord sounds—II,” Acustica
36(4), 241–258 (1976/1977).3N. H. Fletcher, “Analysis of the design and performance of harpsichords,”
Acustica 37, 139–147 (1977).4S. Le Moyne, S. Le Conte, F. Ollivier, J. Frelat, J.-C. Battault, and S.
Vaiedelich, “Restoration of a 17th-century harpsichord to playable condi-
tion: A numerical and experimental study,” J. Acoust. Soc. Am. 131(1),
888–896 (2012).5H. Arakawa, “The acoustical effect of a metal rose in a harpsichord: Part
I,” in Proceedings of the International Symposium on Musical Acoustics(ISMA), Nara, Japan (2004), pp. 13–16.
6H. Arakawa, “The acoustical effect of a metal rose in a harpsichord: Part
II,” in Proceedings of the International Symposium on Musical Acoustics(ISMA), Nara, Japan (2004), pp. 13–17.
7S. Le Moyne, S. Le Conte, and F. Ollivier, “Couchet harpsichord sound-
board vibroacoustics behavior: An application of the impact nearfield
acoustical holography (IPNAH),” in Proceedings of Acoustics’08, Paris,
France (2008), pp. 3387–3391.8W. R. Savage, E. L. Kottick, T. J. Hendrickson, and K. D. Marshall, “Air
and structural modes of a harpsichord,” J. Acoust. Soc. Am. 91(4),
2180–2189 (1992).9P. J. Bryanston-Cross and J. W. Gardner, “Application of holographic
interferometry to the vibrational analysis of the harpsichord,” Opt. Laser
Technol. 20(4), 199–204 (1998).10C. Cuesta and C. Valette, “Evolution temporelle de la vibration des cordes
de clavecin (Time-evolution of the vibration of the strings of a
harpsichord),” Acustica 66, 37–45 (1988).11C. Cuesta and C. Valette, “Le transitoire d’attaque des cordes de clavecin
(Harpsichord string transient vibration on attack),” Acustica 68, 112–122
(1989).12N. Orio, “The timbre space of the classical guitar and its relationship with
the plucking techniques,” in Proceedings of the International ComputerMusic Conference (ICMC), Beijing, China (1999), pp. 391–394.
13D. Chadefaux, J.-L. Le Carrou, B. Fabre, and L. Daudet, “Experimentally
based description of harp plucking,” J. Acoust. Soc. Am. 131(1), 844–855
(2012).14B. Gingras, P.-Y. Asselin, and S. McAdams, “Individuality in harpsichord
performance: Disentangling performer- and piece-specific influences on
interpretive choices,” Frontiers Psychol. 4, 895 (2013).15B. Gingras, P.-Y. Asselin, M. Goodchild, and S. McAdams,
“Communicating voice emphasis in harpsichord performance,” in
Proceedings of the 7th Triennial Conference of European Society for theCognitive Sciences of Music (ESCOM), Jyv€askyl€a, Finland (2009), pp.
154–158.16R. Koren and B. Gingras, “Perceiving individuality in harpsichord per-
formance,” Frontiers Psychol. 5, article 141 (2014).17J. MacRitchie and G. Nuti, “Using historical accounts of harpsichord
touch to empirically investigate the production and perception of dynam-
ics on the 1788 Taskin,” Frontiers Psychol. 6, 183 (2015).18D. E. Hall, “String excitation: Piano, harpsichord and clavichord,” in
Proceedings of Stockholm Music Acoustics Conference (SMAC),
Stockholm, Sweden (1993), pp. 309–314.19D. H. Griffel, “The dynamics of plucking,” J. Sound Vib. 175(3), 289–297
(1994).20N. Giordano and J. P. Winans II, “Plucked strings and the harpsichord,”
J. Sound Vib. 224(3), 455–473 (1999).21H. Penttinen, “On the dynamics of the harpsichord and its synthesis,” in
Proceedings of the 9th International Conference on Digital Audio Effects(DAFx-06), Montr�eal, Canada (2006), pp. 1–6.
22M. Spencer, “Harpsichord physics,” Galpin Soc. J. 34, 2–20 (1981).23C. Sloane, “The effects of plectrum parameters on harpsichord sound,”
J. Sound Vib. 125(1), 185–186 (1988).24S. Carral and M. Paset, “The influence of plectrum thickness on the radi-
ated sound of the guitar,” in Proceedings of Acoustics 08, Paris, France
(2008), pp. 5647–5652.25M. R. LeVoi and R. P. Williams, “The wearing properties of harpsichord
plectra,” English Harpsichord Magazine 1(6), paper number 1 (1976).26C.-Y. J. Perng, J. Smith, and T. Rossing, “Physical modeling of the harpsi-
chord plectrum-string interaction,” in Proceedings of the 13thInternational Conference on Digital Audio Effects (DAFx-10), Graz,
Austria (2010), pp. 1–4.27C.-Y. J. Perng, J. Smith, and T. Rossing, “Harpsichord sound synthesis
using a physical plectrum model interfaced with the digital waveguide,” in
Proceedings of the 14th International Conference on Digital Audio Effects(DAFx-11), Paris, France (2011), pp. 329–335.
28C.-Y. J. Perng, “Physical modeling of the harpsichord plectrum-string
interaction,” Ph.D. dissertation, Stanford University (2012), 174 pp.29F. Germain and G. Evangelista, “Synthesis of guitar by digital wave-
guides: Modeling the plectrum in the physical interaction of the player
with the instrument,” IEEE Workshop on Applications of SignalProcessing to Audio and Acoustics, New Paltz, NY (2009), pp. 25–28.
30T. G€aumann, “The pretransient of the harpsichord sound. I. The vertical
movement of the plectrum,” in Proceedings of the Stockholm MusicAcoustics Conference (SMAC), Stockholm, Sweden (2003), pp. 163–166.
J. Acoust. Soc. Am. 141 (3), March 2017 Pat�e et al. 1533

31A. Beurmann and A. Schneider, “Sonological analysis of harpsichord
sounds,” in Proceedings of the Stockholm Music Acoustics Conference(SMAC), Stockholm, Sweden (2003), pp. 167–170.
32F. Hubbard, Three Centuries of Harpsichord Making (Harvard University
Press, Cambridge, MA, 1965), p. 205, pp. 227–228.33E. L. Kottick, The Harpsichord Owner’s Guide (The University of North
Carolina Press, Chapel Hill, NC, 1992), p. 19, pp. 91–102.34D. Chadefaux, J.-L. Le Carrou, M.-A. Vitrani, S. Billout, and L. Quartier,
“Harp plucking robotic finger,” in IEEE/RSJ International Conference onIntelligent Robots and Systems, Vilamoura, Algarve, Portugal (2012), pp.
4886–4891.35A. Givois, A. Pat�e, J.-L. Le Carrou, S. Le Conte, and S. Vaiedelich, “Un
dispositif de mesure des caract�eristiques g�eom�etriques et m�ecaniques de
becs de clavecin (A measurement apparatus for geometrical and mechani-
cal characteristics of harpsichord plectra),” in Proceedings of the Congresfrancais d’Acoustique (French Congress on Acoustics), Le Mans, France
(2016), pp. 1785–1791.36I. Sobel and G. Feldman, “A 3x3 isotropic gradient operator for image
processing,” talk at Stanford Artificial Project (1968), cited in PatternClassification and Scene Analysis, edited by R. Duda and P. Hart (John
Wiley and Sons, New York, 1973), pp. 271–272.37A. Farina, “Simultaneous measurement of impulse response and distortion
with a swept-sine technique,” in Proceedings of the 108th AudioEngineering Society Convention, Audio Engineering Society (2000).
38R. Roy and T. Kailath, “ESPRIT-estimation of signal parameters via rota-
tional invariance techniques,” IEEE Trans. Acoust., Speech Signal
Process. 37(7), 984–995 (1989).39D. Chadefaux, A. Roy, J.-L. Le Carrou, M.-A. Vitrani, and B. Fabre,
“Bio-inspired robot to study stringed instruments: Application to the
harp,” in Proceedings of the Stockholm Musical Acoustics Conference(SMAC), paper number Gi2P, Stockholm, Sweden (2013).
40J.-L. Le Carrou, D. Chadefaux, M.-A. Vitrani, S. Billout, and L. Quartier,
“DROPIC: A tool for the study of string instruments in playing con-
ditions,” in Proceedings of Acoustics 2012, Nantes, France (2012), pp.
451–456.41A. Roy, J.-L. Le Carrou, B. Fabre, and M.-A. Vitrani, “Mechanical analy-
sis of the voicing process in the harpsichord,” in Proceedings of theInternational Symposium on Musical Acoustics (ISMA), Le Mans, France
(2014), pp. 255–260.42J.-L. Le Carrou, D. Chadefaux, L. Seydoux, and B. Fabre, “A low-cost
high-precision measurement method of string motion,” J. Sound Vib. 333,
3881–3888 (2014).43D. Chadefaux, J.-L. Le Carrou, S. Le Conte, and M. Castellengo,
“Analysis of the harpsichord plectrum-string interaction,” in Proceedingsof the Stockholm Musical Acoustics Conference (SMAC), paper number
Gi1P, Stockholm, Sweden (2013).
44A. Roy, “D�eveloppement d’une plateforme robotis�ee pour l’�etude des
instruments de musique �a cordes pinc�ees (Development of a robotic plat-
form for the study of plucked string musical instruments),” Ph.D. disserta-
tion, Universit�e Pierre et Marie Curie (2015), 152 pp.45Z. Zhang, “A flexible new technique for camera calibration,” IEEE Trans.
Pattern Anal. Machine Intell. 22(11), 1330–1334 (2000).46J. M. S. Prewitt, “Object enhancement and extraction,” in Picture
Processing and Psychopictorics, edited by B. Lipkin and A. Rosenfeld
(Academic Press, New York, 1970), pp. 75–149.47Y. Xiong, Formulaire de R�esistance des Mat�eriaux (Handbook of Strength
of Materials) (Eyrolles Publisher, Paris, France, 2002), 50 pp.48Norm DIN EN 61672-1 2003-10/norm NF EN 61672.49G. Peeters, B. L. Giordano, P. Susini, N. Misdariis, and S. McAdams,
“The timbre toolbox: Extracting audio descriptors from musical signals,”
J. Acoust. Soc. Am. 130(5), 2902–2916 (2011).50M. R. Schroeder, “New methods of measuring reverberation time,”
J. Acoust. Soc. Am. 37, 409–412 (1965).51A. Pat�e, J.-L. Le Carrou, and B. Fabre, “Predicting the decay time of solid
body electric guitar tones,” J. Acoust. Soc. Am. 135(5), 3045–3055
(2014).52J. Krimphoff, S. McAdams, and S. Winsberg, “Caract�erisation du timbre
des sons complexes. II. Analyses acoustiques et quantification psychophy-
sique (Characterization of the timbre of complex sounds. II. Acoustical
analyses and psychophysical quantization),” Suppl�ement au Journal de
Physique III(4)C5, 625–628 (1994).53Y.-Y. Kong, A. Mullangi, J. Marozeau, and M. Epstein, “Temporal and
spectral cues for musical timbre perception in electric hearing,” J. Speech
Lang. Hear. Res. 54(3), 981–994 (2011).54Note it has been checked that no change in pitch resulted from either a
change in plectrum geometry or jack velocity.55E. Zwicker and H. Fastl, Psychoacoustics—Facts and Models, Springer
Series in Information Sciences, 2nd ed. (Springer, Heidelberg, Germany,
1999).56Normality (Jarque-Bera test) and homoscedasticity (Levene’s test) of data
have been checked before performing each ANOVA presented here. The
p-values are denoted with * (resp., **) if they are significant at the level
a¼ 0.05 (resp., a¼ 0.01). Note that the samples for the string’s initial con-
ditions x0, y0, v0, and c0 all were of unequal homoscedasticity, so that it
was not possible to run ANOVAs for the string’s initial conditions.57The notation ** is used to indicate a p-value significant at the level
a¼ 0.01.58P. Iverson and C. L. Krumhansl, “Isolating the dynamic attributes of musi-
cal timbre,” J. Acoust. Soc. Am. 94(5), 2595–2603 (1993).59J. M. Grey, “Multidimensional scaling of musical timbres,” J. Acoust.
Soc. Am. 61(5), 1270–1277 (1977).60There is however no noise of the finger against the key since the robotic
finger rested on the key before each measurement.
1534 J. Acoust. Soc. Am. 141 (3), March 2017 Pat�e et al.