INFLUENCE OF PHYSICAL ROAD CHARACTERISTICS ON ROAD CRASHES
111
INFLUENCE OF PHYSICAL ROAD CHARACTERISTICS ON ROAD CRASHES JASON JENSEN BENG 2004
Transcript of INFLUENCE OF PHYSICAL ROAD CHARACTERISTICS ON ROAD CRASHES

INFLUENCE OF PHYSICAL ROAD CHARACTERISTICS ON ROAD
CRASHES
JASON JENSEN
BENG
2004


University of Southern Queensland
Faculty of Engineering and Surveying
Influence of Physical Road Characteristics on Road Crashes
A dissertation submitted by
Jason W. Jensen
in fulfilment of the requirements of
Courses ENG4111 and 4112 Research Project
towards the degree of
Bachelor of Engineering (Civil)
Submitted: October, 2004

i
Abstract
The objectives of this project were to find correlations between the ‘tidal flow’ of traffic
and the frequency of road crashes, as well as between various broad scale road
environment factors and the frequency of road crashes. This was achieved through an in
depth examination of crash data for the Southern District, as well as the combined data
of the areas covered by the Toowoomba City Council and the Gatton Shire Council.
When examining the data for correlations, the traffic flow and crash rate along with
various road environment characteristics were considered.
It was found that a greater traffic flow did not mean a greater crash rate would result
with the time periods with lower traffic flow having higher crash rates. However,
correlations were established between various road environment factors and the
frequency of road crashes. Road environment characteristics that were found to
influence the amount of road crashes included the seal width, pavement width,
formation width, the speed limit zones and the AADT of the road. These correlations
can now be used in the prediction of the likelihood of crash zones of roads.

ii
University of Southern Queensland
Faculty of Engineering and Surveying
………….ENG4111 & ENG4112 Research Project………..
Limitations of Use The Council of the University of Southern Queensland, its Faculty of Engineering and Surveying, and the staff of the University of Southern Queensland, do not accept any responsibility for the truth, accuracy or completeness of material contained within or associated with this dissertation. Persons using all or any part of this material do so at their own risk, and not at the risk of the Council of the University of Southern Queensland, its Faculty of Engineering and Surveying or the staff of the University of Southern Queensland. This dissertation reports an educational exercise and has no purpose or validity beyond this exercise. The sole purpose of the course pair entitled "Research Project" is to contribute to the overall education within the student’s chosen degree programme. This document, the associated hardware, software, drawings, and other material set out in the associated appendices should not be used for any other purpose: if they are used, it is entirely at the risk of the user. Prof G Baker Dean Faculty of Engineering and Surveying
iii
Certification
I certify that the ideas, designs and experimental work, results, analyses and conclusions
set out in this dissertation are entirely my own effort, except where otherwise indicated
and acknowledged.
I further certify that the work is original and has not been previously submitted for
assessment in any other course or institution, except where specifically stated.
Jason Jensen Student Number: Q11224289
Signature
Date

iv
Acknowledgements
For their technical support I would like to thank Mr Mal McIlwaith from Queensland
Transport for sourcing and supplying me with the crash data and sharing with me his
ideas on the topic and Associate Professor Ron Ayers for his guidance and advice when
I first started the undertaking of this project. Finally I would like to thank my family
and beautiful girlfriend for their support, encouragement and belief because without
them I would never have made it this far.
J. Jensen
University of Southern Queensland
October 2004

v
Contents
Certification ................................................................................................................ iii
Acknowledgements...................................................................................................... iv
List of Figures........................................................................................................... viii
List of Tables............................................................................................................... ix
Chapter 1 ..................................................................................................................... 1
Introduction ................................................................................................................. 1
1.1 Aims of Project ...........................................................................................................1
1.2 Dissertation Overview ................................................................................................2
Chapter 2 ..................................................................................................................... 4
Background Studies ..................................................................................................... 4
2.1 Introduction ..............................................................................................................4
2.2 Background .................................................................................................................5
2.3 Literature ....................................................................................................................5 2.3.1 Crash Data ............................................................................................................................ 5
2.3.2 Correlation of Influencing Parameters ............................................................................... 10
2.4 Chapter Summary ....................................................................................................15
Chapter 3 ................................................................................................................... 16
Southern District........................................................................................................ 16
3.1 Introduction ..............................................................................................................16
3.2 Size .............................................................................................................................17
3.3 Towns and Local Government Areas .....................................................................19 3.3.1 Towns................................................................................................................................. 19 3.3.2 Local Government Areas.................................................................................................... 19

vi
3.4 Road Types................................................................................................................21 3.4.1 State Highways................................................................................................................... 21 3.4.2 Main Roads ........................................................................................................................ 22 3.4.3 Secondary Roads ................................................................................................................ 23
3.5 Chapter Summary ....................................................................................................24
Chapter 4 ................................................................................................................... 25
Data and Methodology............................................................................................... 25
4.1 Introduction ..............................................................................................................25
4.2 Data............................................................................................................................26 4.2.1 Crash Data .......................................................................................................................... 26 4.2.2 Road Data ........................................................................................................................... 27 4.2.3 Southern District Traffic Census ........................................................................................ 28
4.3 Methodology..............................................................................................................29 4.3.1 Obtaining the Crash Data ................................................................................................... 29 4.3.2 Initial Work Undertaken on Crash Data ............................................................................. 29 4.3.3 Correlation of Road and Crash Data................................................................................... 31 4.3.4 Analysis of Data ................................................................................................................. 34
4.4 Chapter Summary ....................................................................................................37
Chapter 5 ................................................................................................................... 38
Tidal Flow and Crashes ............................................................................................. 38
5.1 Introduction ..............................................................................................................38
5.2 Toowoomba and Gatton...........................................................................................39
5.3 Southern District ......................................................................................................41
5.4 Chapter Summary ....................................................................................................44
Chapter 6 ................................................................................................................... 45
Road Environment and Crashes ................................................................................ 45
6.1 Introduction ..............................................................................................................45
6.2 Seal Width .................................................................................................................46 6.2.1 Toowoomba and Gatton ..................................................................................................... 46 6.2.2 Southern District ................................................................................................................ 49
6.3 Pavement Width .......................................................................................................51 6.3.1 Toowoomba and Gatton ..................................................................................................... 51 6.3.2 Southern District ................................................................................................................ 54
6.4 Formation Width ......................................................................................................56 6.4.1 Toowoomba and Gatton ..................................................................................................... 56 6.4.2 Southern District ................................................................................................................ 58
6.5 Speed Limit Zones ....................................................................................................61 6.5.1 Toowoomba and Gatton ..................................................................................................... 61 6.5.2 Southern District ................................................................................................................ 62
6.6 AADT Vs. Width ......................................................................................................63 6.6.1 Seal Width .......................................................................................................................... 64 6.6.2 Pavement Width ................................................................................................................. 65 6.6.3 Formation Width ................................................................................................................ 69
6.7 Chapter Summary ....................................................................................................73
Chapter 7 ................................................................................................................... 74
Discussion of Results ................................................................................................. 74

vii
7.1 Introduction ..............................................................................................................74
7.2 Tidal Flow..................................................................................................................75
7.3 Road Environment ...................................................................................................75 7.3.1 Seal Width .......................................................................................................................... 76 7.3.2 Pavement Width ................................................................................................................. 76 7.3.3 Formation Width ................................................................................................................ 77 7.3.4 Speed Limit Zones.............................................................................................................. 77 7.3.5 AADT vs. Width ................................................................................................................ 78
7.4 Chapter Summary ....................................................................................................78
Chapter 8 ................................................................................................................... 79
Conclusions and Further Work ................................................................................. 79
8.1 Conclusions ...............................................................................................................79
8.2 Further Work............................................................................................................81
List of References....................................................................................................... 82
Bibliography .............................................................................................................. 85
Appendix A ................................................................................................................ 86
Project Specification .................................................................................................. 86
Appendix B ................................................................................................................ 88
Southern District Road Classifications ...................................................................... 88
B1 State Highways..........................................................................................................89
B2 Main Roads ...............................................................................................................90
B3 Secondary Roads ......................................................................................................92
Appendix C ................................................................................................................ 93
NAASRA Road Classification System........................................................................ 93
C1 Rural Areas ...............................................................................................................94
C1 Rural Areas ...............................................................................................................94
C2 Urban Areas ..............................................................................................................95
Appendix D ................................................................................................................ 96
Crash Data................................................................................................................. 96
Appendix E ................................................................................................................ 98
Road Data .................................................................................................................. 98

viii
List of Figures
Figure 2.1: Appropriate Road Crash Report Form ..................................................................................... 7 Figure 2.2: Involvement of Factors in Accidents ....................................................................................... 12 Figure 2.3: The Adapted Haddon Matrix for Road Crashes...................................................................... 14 Figure 3.1: Location of Southern District in Queensland.......................................................................... 17 Figure 3.2: Detailed View of the Southern District ................................................................................... 18 Figure 4.1: Initial Crash Data file containing Four Districts.................................................................... 30 Figure 4.2: ‘Local Government Authority’ Identification.......................................................................... 31 Figure 4.3: Identifying Crash Road ‘RsectID’........................................................................................... 32 Figure 4.4: Chainage Distance, ‘TDIST’, of the Road .............................................................................. 32 Figure 4.5: Road Data Matching Crash Data Above ................................................................................ 33 Figure 4.6: Direction of Travel factor used to determine Carriageway .................................................... 34 Figure 6.1: Double Lane Sealed Shoulders – Toowoomba and Gatton..................................................... 48 Figure 6.2: Four Lane Sealed Shoulders – Toowoomba and Gatton......................................................... 48 Figure 6.3: Double Lane Sealed Shoulders – Southern District ................................................................ 49 Figure 6.4: Four Lane Sealed Shoulders – Southern District.................................................................... 51 Figure 6.5: Single Lane Pavement Width – Toowoomba and Gatton ........................................................ 53 Figure 6.6: Double Lane Pavement Width – Toowoomba and Gatton ...................................................... 53 Figure 6.7: Single Lane Pavement Width – Southern District ................................................................... 54 Figure 6.8: Double Lane Pavement Width – Southern District ................................................................. 56 Figure 6.9: Single Lane Formation Width – Toowoomba and Gatton....................................................... 58 Figure 6.10: Single Lane Formation Width – Southern District................................................................ 60 Figure 6.11: Double Lane Formation Width – Southern District .............................................................. 60 Figure 6.12: Speed Limit Zone Crashes – Toowoomba and Gatton ......................................................... 62 Figure 6.13: Speed Limit Zone Crashes – Southern District ..................................................................... 63

ix
List of Tables
Table 5.1: Tidal Flow – Toowoomba and Gatton ...................................................................................... 39 Table 5.2: Tidal Flow – Southern District ................................................................................................. 42 Table 6.1: Seal Width Crashes/Km – Toowoomba and Gatton.................................................................. 47 Table 6.2: Seal Width Crashes/Km – Southern District ............................................................................. 50 Table 6.3: Pavement Width Crashes/Km – Toowoomba and Gatton......................................................... 52 Table 6.4: Pavement Width Crashes/Km – Southern District .................................................................... 55 Table 6.5: Formation Width Crashes/Km – Toowoomba and Gatton........................................................ 57 Table 6.6: Formation Width Crashes/Km – Southern District................................................................... 59 Table 6.7: Speed Limit Zone Crashes/Km – Toowoomba and Gatton ....................................................... 61 Table 6.8: Speed Limit Zone Crashes – Southern District ......................................................................... 62 Table 6.9: AADT vs. Width - Double Lane Sealed Shoulders Southern District........................................ 65 Table 6.10: AADT vs. Width - Single Lane Pavement Toowoomba and Gatton ........................................ 66 Table 6.11: AADT vs. Width - Single Lane Pavement Southern District ................................................... 67 Table 6.12: AADT vs. Width – Double Lane Pavement Southern District ................................................. 68 Table 6.13: AADT vs. Width - Single Lane Formation Toowoomba and Gatton....................................... 69 Table 6.14: AADT vs. Width - Single Lane Formation Southern District .................................................. 71 Table 6.15: AADT vs. Width - Double Lane Formation Southern District ................................................ 72

1
Chapter 1
Introduction
1.1 Aims of Project
This project is a result of Mal McIlwaith from Queensland Transport and his interest in
the road environment and its involvement of road crashes. He is also interested in
whether or not it plays a larger role than is currently thought in crashes. This project has
then, in turn, evolved from this query.
The usual approach to investigating road crashes is to report on the characteristics that
are specifically related to the drivers of the vehicles involved in the accident. This
project investigates if certain road environments play a larger role in accidents than is
currently understood.

2
The initial aim of this project was to find a correlation between the ‘tidal flow’ of traffic
and the frequency of road crashes. The percentage of heavy vehicles in this ‘tidal flow’
also had to be considered.
The major aim was to find correlations between various broad scale road environment
factors and the frequency of road crashes. These correlations were then used to predict
the likely crash zones of roads.
1.2 Dissertation Overview
The second chapter of this dissertation gives a background on the project undertaken
and also uses a literature review. This review reveals information gained in previous
studies relating to the issues of crash data analyses and the correlation of crash rates
with influencing parameters.
The third chapter gives an explanation of Southern District and the features of the
district such as the size, towns and local government areas included within the
boundaries. It also incorporates the road types that are examined with specific examples
of these roads.
The fourth chapter describes the three types of data that were required to be analysed in
this project. These three data sets were the crash data, road data and the Southern
District traffic census. The methodology used to complete the project is also outlined,
explaining how each stage was completed.

3
The fifth chapter reports on the analysis of the factors relating to the ‘tidal flow’ of
traffic and the crash rate. The crash rate, crashes per one million vehicles, for time
periods of four hours on certain roads in each area was found. Then it was compared to
the other roads and the tidal flow of traffic during these periods
The sixth chapter reports on the analysis of the factors relating to the road environment
and the frequency of road crashes. The factors that were analysed as part of the road
environment included the seal width, pavement width, formation width, speed limit
zones and the AADT vs. Width.
Chapter seven discusses the results gained from the previous two chapters. Each section
compares the results of the analyses for each study area. They then go on to report on
any correlations that were found concerning the factor that is discussed in each section.
Chapter eight includes conclusions and recommendations from the analysis of the data
as well as any further work that could be continued on with as a continuation of this
project.

4
Chapter 2
Background Studies
2.1 Introduction
This chapter gives a background on the project undertaken and how it started. It then
goes on to a use a literature review. This review reveals information gained in previous
studies relating to the issues of crash data analyses and the correlation of crash rates
with influencing parameters. It also looks at the similarities and differences between
past studies and how they relate to the aims of the present study.
5
2.2 Background
The usual approach to investigating road crashes is to report on the characteristics that
are specifically related to the drivers of the vehicles involved in the accident. This
project investigates if certain road environments play a larger role in accidents than is
currently understood.
This project is a result of Mal McIlwaith from Queensland Transport and his interest in
the road environment and its involvement of road crashes. He is also interested in
whether or not it plays a larger role than is currently thought in crashes. This project has
then, in turn, evolved from this query.
2.3 Literature
Before any work could commence on this project, there was a need for a review of
literature. This literature is in two specific areas: the analysis of crash data and the
correlation of crash rates with influencing parameters. These two issues are
comprehensively examined below through the use of a literature review.
2.3.1 Crash Data
Crash data describing accidents occurring on Australian roads, has been collected since
1911 (NAASRA, 1988). The Bureau of Transport and Communications Economics
(1995) report that in Queensland, the Australian Bureau of Statistics recorded this crash

6
data until early 1989 when this responsibility was transferred to the Statistics
department of Queensland Transport.
In Austroads (2004) it is noted that if the data recorded is to be considered good, and
therefore useful to users of this data, it must be able to achieve various factors. These
factors are as follows:
• crash sites can be located accurately,
• the succession of events occurring throughout the accident sequence are able to
be determined,
• contributing factors to the crash can be established; and
• common factors relating a number of crashes can be ascertained.
These are considered important so that when the data is analysed for various reasons, it
is as complete as possible to be able to determine, for example, if a certain section of
road is a problem area or “a black spot”. NAASRA (1988) has a recommended road
crash report form, which can be seen in Figure 2.1, as used by South Australia.

7
Figure 2.1: Appropriate Road Crash Report Form
(Source: NAASRA (1988))

8
In NAASRA (1988) there are several suggested potential sources that crash data can be
obtained from. However, the most commonly accepted and used source from the given
range of choices are the Police Road Crash Reports. It is important to understand that
not all crashes are reported and there are specific requirements for reporting accidents.
NAASRA (1988, p.13) explain that these guidelines in Queensland are,
“all casualty crashes, and property damage crashes where the estimated cost
of damage exceeds $1000.”
The minimum figure stated above (damage exceeding $1000) for reporting an accident
was raised in December 1991 to an amount of $2500 (Bureau of Transport and
Communications Economics, 1995). The crash data is recorded from reported accidents
that meet the criteria established above.
Austroads (2004) have stated that a road crash is made up of three components that
interact. These components are listed as the human factor, the vehicle factor and the
road factor. Austroads have defined that
“a crash or accident may be considered as a ‘failure’ in the system”
(Austroads, 2004, p.10).
In general, road crash data is analysed using factors that influence the accident, which
are then recorded. According to Queensland Transport (2002) and the Victorian
Transport Accident Commission (2004), the common factors that are used by these two
organizations are the age and gender of involved parties, the type of transport in the
accident, and if pedestrians are also involved, the characteristics of the crash and the

9
factors contributing to the crash. Characteristics of crashes concern information
regarding the number of vehicles involved in the accident, the time of day and week
when the accident happened and if the accident occurred in a metropolitan or rural area.
According to Queensland Transport (2002), the major factors contributing to crashes are
alcohol involvement, speed, fatigue and seat belt usage.
Symmons, Haworth and Johnston (2004), also used the above statistics when analysing
road crashes but also extended these factors to include a limited investigation of the
road characteristics of the accident site. These extended factors include if the location
was an intersection or not, the road alignment (i.e. if the road was a straight or part of a
curve etc.) and if it was a divided or undivided carriageway. The factors included by
Symmons, et al. involving the road characteristics will be analysed when the Southern
District data is analysed. However these factors will be increased to include more
information about the road environment. These increased factors will include such
information as road width, seal type etc. as recommended by NAASRA (1988).
Although NAASRA (1988) also suggests that when investigating accidents, the above
human or driver influencing factors be used, they also recommend that the investigation
be taken further by using relevant site conditions including those described in the
previous paragraph. In particular, the most important of these conditions are road,
lighting, road surface and visibility. The road factor is the most detailed including
features such as width, number of lanes, markings, camber and gradient. Lighting and
visibility are as they imply, with lighting describing the illumination of a section of
pavement at nighttime and visibility referring to the distance and quality of a drivers
view. Finally the road surface factor concerns the type of surface, condition of the
surface and the roughness of this surface. Symmons, et al. (2004) used some road

10
characteristics in their analysis and NAASRA (1988) recommended that a number of
road environment details that can and will be analysed in more depth. These factors
relating to the road environment will be included in the investigation of the influence of
the physical road characteristics on road crashes.
Hutchinson (1987) suggests that Great Britain, South Australia, Western Australia and
most states of U.S.A also only collect the information that both Queensland and
Victorian departments use to analyse crash data. Although the information from
Hutchinson appears to be outdated, it can be seen through recent literature from
Queensland and Victoria transport departments, that government departments do not use
any data concerning the road environment when analysing road crashes. This project,
will therefore attempt to develop a correlation between road environments, many factors
of which are rarely considered by government departments, and road crashes.
2.3.2 Correlation of Influencing Parameters
The first and often the most examined characteristics are the age and gender
characteristics of drivers. According to Queensland Transport (2002) the age category,
of three year intervals, that is involved in the most amounts of road crashes is the 17 to
20 year old bracket. Expanding to this category it can also be seen that the group of 17
to 24 year olds, males make up about 85% of the total. Symmons et al. (2004) found
that those under the age of 25 years old were the largest group involved in accidents but
were mostly passengers. However the drivers that were most involved were in the 25 to
39 year old category. It was agreed that males made up the greatest amount of road
users involved in road crashes.

11
Contrary to the results above was the amount of higher age (above 35) drivers involved
in accidents in rural Victoria. Symmons et al. (2004) discovered that in rural Victoria
accidents at intersections accounted for 37% of crashes. It was also found that only
21% of crashes occurred on curves. The accidents at intersections were the least severe
and accidents on curves were the most severe. However, there were a low percentage of
accidents taking place on curves.
Of the factors contributing to crashes alcohol was the most common factor according to
Queensland Transport (2002), with disobeying traffic following narrowly behind.
Trailing these were inexperience, speed and then a lack of concentration.
The correlations discussed above are mostly about accidents where the human factors
causing accidents are analysed. The remainder of this section details studies that
investigated the impact of the road environment on accidents. The Bureau of Transport
and Communications Economics (1995) stated that the demands that the road
environment places on a driver are dependent on the flow of traffic, geometric design
features of the road and also the type of road being used. The Bureau of Transport and
Communications Economics Bureau (1995) also believes that the performance of the
driver needs to increase as the demands of the road environment, which is put on the
driver, also increases. Hence, it is when the performance off the driver does not meet
the demand of the road environment that road crashes occur.
The Road and Traffic Authority (1996) illustrate how each of the three components of
the transport system contributes to road crashes. The Human Factors causing a crash is
95%, the Road Environment contributing 28% of the time and various Vehicle factors
being at fault 8% of the time. From Figure 2.2 it can be seen that the Road Environment

12
is the sole cause in 4% of accidents and is a contributing factor when combined with
Human factors 24% of the time.
Figure 2.2: Involvement of Factors in Accidents
(Source: Road and Traffic Authority (1996))
The road environment features above were found to be influenced by:
• Road and road side engineering,
• Traffic management; and
• Transport and land use.
Of these factors it can be seen from the Haddon Matrix, Figure 2.3 that before an
accident occurs the factors affecting the probability of a crash are:
• Road Engineering factors,
• Traffic Engineering factors,
• Land Use,

13
• Road Network Features; and
• External factors.
Of these factors, roadside factors and traffic engineering are still factors at work when
an accident is occurring.
As mentioned earlier, road side engineering is a consideration included in the road
environment. A report by Kloeden, McLean, Baldock and Cockington (1999), on road
side hazards, concluded that in 39% of accidents between 1985 and 1996, a road side
hazard played a part in fatal accidents. It was also concluded that 38% of
hospitalizations between 1994 and 1996 involved an accident involving a road side
hazard.
From these conclusions it was recommended by Kloeden et al. (1999) that as the road
environment plays a large role in keeping motorists from running off the road, a number
of improvements should undertaken with respect to the road environment to assist in
this. The aspects of the road environment that were recommended to be improved were
the horizontal alignment of the road, an upgrade of the road surface condition and
sealed shoulders that incorporate appropriate edge lines.

14
Figure 2.3: The Adapted Haddon Matrix for Road Crashes
(Source: Road and Transport Authority (1996))

15
2.4 Chapter Summary
This chapter has given a background on this project and how it began. After the
background had been established the literature review revealed information gained from
past studies on the issues of the analysis of crash data and the correlation of crash rates
with influencing parameters.
From the literature review, it was seen previous studies have been undertaken showing
that various road environments can be contributing factors to a crash. In spite of these
findings very few, if not any, state or federal authorities examine any road data relating
to accident sites when analysing crash data and gathering statistics.

16
Chapter 3
Southern District
3.1 Introduction
As the area of investigation for this project is the Southern District of Main Roads, an
explanation of this area is necessary to fully understand the results found. This chapter
includes the features of the district such as the size, towns and local government areas
included within the boundaries. It also incorporates the road types that are examined
with specific examples of these roads.

17
3.2 Size
The area that is classified as the Southern District by Main Roads is a parcel of land
that is located on the western edge of South East Queensland, district number three in
Figure 3.1. The most western point of the Western boundary is positioned
approximately twenty-five kilometres to the west of Chinchilla and the corresponding
point to the East is situated approximately twenty kilometres North of Ipswich. The
distance that spans between these points is roughly 250 kilometres.
Figure 3.1: Location of Southern District in Queensland
(Source: Main Roads (19/10/2004))

18
In the North-South direction, the span is almost 300 kilometres with the most Southerly
part of the boundary being thirty-five kilometres South of Millmerran and to the North
this point is about 125 kilometres North of Chinchilla (Figure 3.2).
Figure 3.2: Detailed View of the Southern District
(Source: Main Roads Administrative Boundaries)

19
3.3 Towns and Local Government Areas
3.3.1 Towns
With the Southern District being as large as it is, it is obvious that there are numerous
towns in this area. Most towns are only small rural centres but there are a few larger
towns of note. These are Murgon, Kingaroy and Nanango to the North, Chinchilla and
Dalby to the West, Gatton, Laidley and Esk to the East and Millmerran and Pittsworth.
The largest and perhaps most important town in the District, which can be classed as a
city, is found centrally in the investigated area. This city is Toowoomba and it is also
found along with the one other centrally located town of Crows Nest.
These towns discussed above are considered small rural towns when compared to
centres such as Brisbane. The only exception in the entire district is Toowoomba,
being much larger than the other towns. Most of the towns above are the principal
towns of the shires listed below.
3.3.2 Local Government Areas
Within the southern District there are seventeen different Local Government Areas, as
seen in Figure 3.2. Working from North to South they are:
• Chinchilla,
• Wondai,
• Murgon,
• Kingaroy,

20
• Nanango,
• Wambo,
• Rosalie,
• Dalby Town,
• Crows Nest,
• Esk,
• Gatton,
• Laidley,
• Toowoomba City,
• Cambooya,
• Jondaryn,
• Pittsworth; and
• Millmerran
Most of these shires are rural shires that have to service large areas which contain
substantial amounts of roads. More often than not, these shires have restricted budgets
that need to be used with careful consideration. However, roads are not the only
consideration that these councils need to acknowledge when determining where the
funds from their respective budgets are to be spent. As a result, roads can often fall into
a below satisfactory condition. The only local authority, from the list above, that has a
large budget is the Toowoomba City Council. However, the Toowoomba City Council
has a minimal amount of roads that are considered throughout this study, and as a
result, minimal maintenance is required.
As a comparison of budgets that councils have available to spend on roads the
Kingaroy Shire budget for roads and the Toowoomba City Council budget have been

21
compared. In the Financial year of 2002/2003 Kingaroy Shire Council had an
expenditure of approximately $2.272 Million on maintenance and construction
(http://kingaroy.qld.gov.au, 2004) and the Toowoomba City Council, in the same
financial year, spent $11.04 Million (http://www.toowoomba.qld.gov.au, 2004). This
demonstrates the different levels of funds available for expenditure on roads that exists
between the rural shires and city councils.
3.4 Road Types
There are three different types of roads that are examined in the Southern District of
Main Roads for the purposes of this project. These are state highways, main roads and
secondary roads, all of which are described in more detail below.
3.4.1 State Highways
State highways according to the NAASRA Road Classification System (refer to
Appendix C1) is a Class 1 road which is described as:
“those roads which form the principal avenue for communications between
major regions of Australia, including direct connections between capital
cities.” (Bureau of Transport and Regional Economics, 2003)
in the road data, these road classifications range from national highways to state
strategic to regional roads. The Main Roads categorisation system, as seen in Appendix

22
B, classifies roads as state highways with numbers 10 – 49. These numbers are usually
followed by a letter ‘A’, then successively progressing through the alphabet. These
letters represent a particular section of the road as the highways pass through many
towns. In the case of 18A, the Warrego Highway, the ‘A’ represents the section of
highway between Ipswich and Toowoomba then 18B is the section from Toowoomba
to Dalby.
Examples of these roads are, as mentioned above, the Warrego Highway, which travels
between Brisbane and Miles. Another example is the New England Highway which
starts in Yarraman and travels to Warwick and a final example is the Gore Highway,
running from Toowoomba to Goondiwindi. A full list of these roads and the
corresponding section is included in Appendix B1.
3.4.2 Main Roads
Main roads are defined as Class 2 in the NAASRA classification system (Appendix C1)
which explicitly defines these roads as:
“those roads, not being Class 1, whose main function is to form the principal
avenue of communication for movements:
•Between capital city and adjoining states and their capital
cities; or
•Between a capital city and key towns; or
•Between key towns.” (Bureau of Transport and Regional
Economics, 2003)

23
the classification received by these roads in the road data is either regional roads or
district roads. In terms of Main Roads categorisation, main roads are classified using
numbers 100 – 999. Unlike state highways these roads are not followed by any
lettering system. This is because these roads consist of only one section.
Main roads generally are roads that connect two towns and thus, take their name from
the towns that the road connects. This is by far, the most common road type in the
Southern District. Examples of this type of roads are the Oakey – Cooyar Road, Esk –
Kilcoy Road, Gatton – Helidon Road and Chinchilla – Tara Road. A complete list
containing all of the Main Roads and classifications can be found in Appendix B2.
3.4.3 Secondary Roads
A secondary road according to NAASRA is:
“those roads, not being Class 1 or 2, whose main function is to form an
avenue of communication for movements:
•Between important centres and the Class 1 and Class 2 roads
and/or key towns; or
•Between important centres; or
•Of an arterial nature within a town in a rural area”
(Bureau of Transport and Regional Economics, 2003)
the road data also refer to these roads as either regional roads but most often are
classified as district roads. The classification used for secondary roads by Main Roads

24
is a number between 1000 – 9999. These roads are much like main roads in the respect
that they are also roads that join neighbouring towns. However, the towns they join are
not as significant. The major difference between main roads and secondary roads, is
that secondary roads carry less traffic and therefore are not as frequently used.
Examples of these roads include the Millmerran – Cecil Plains Road, Murphy’s Creek
Road and Bunya Mountains Road.
3.5 Chapter Summary
This chapter has described the area analysed in this project, the Southern District. The
first factor relating to the Southern District that was analysed was the size of the district.
This revealed the district to be approximately 250 kilometres by 300 kilometres (at
maximum distances) in area. Next, the towns and local government areas were reported
on, from this it was found that there were seventeen different local government areas in
the district. The major towns in the district were also found to be the principal towns of
these areas.
Finally, the different types of roads in the district that were of significance were
described. There are three different classes of roads contained in the Southern District
that were to be considered in the analysis. They were state highways, main roads and
secondary roads. In the descriptions of these three road classifications, a description
from NAASRA was specified for each, the classification method as used by Main
Roads was described also and finally, examples of the particular road type were given.

25
Chapter 4
Data and Methodology
4.1 Introduction
This chapter describes the three types of data that were required to be analysed in this
project. These data sets were the crash data, road data and traffic census data. After the
types of data are described, the methodology used to complete the project was outlined,
explaining how each stage was completed. The steps that were undertaken throughout
the work carried out in this project included how the data was obtained, the initial work
undertaken on crash data, the correlation of the road and crash data and the procedure
required to be completed in the analysis of this data.

26
4.2 Data
Three sets of data are required for this project to be undertaken. These data
compilations include the crash data for the Southern District, the road data associated
with this area and also the Southern District traffic census data. Below is a description
of the contents of these files and the particular factors that are considered to be more
important than others.
4.2.1 Crash Data
Initially the crash data was sourced from Mal McIlwaith, also one of the supervisors for
this project, from Queensland Transport. This data can be accessed by referring to
Appendix D. The crash data contains information about crashes for the period, 1998 to
2002. The initial data file contained information on 13 339 accidents and covering from
four Main Roads districts namely these were the Southern District, the area of interest
for this project, the Wide Bay District, the South West District and the Border District.
The number of recorded accidents dropped to 6456 when the data was reduced to only
include the Southern District. The crash data not only indicated the district in which the
accident has occurred but also other information regarding accidents.
This information includes details such as the severity of the crash, how many vehicles
were involved, the age of the driver, the type of vehicle involved in the crash and driver
factors which include:
• fatigue,
• speed,

27
• alcohol; and
• seat belt usage
Furthermore, the crash data also includes other details comprising the date and time that
the accident happened, environmental factors, possible driver errors, any vehicle defects
before the accident and any violations of the road rules contributing to the accident.
Many factors are recorded in the crash data, but there was a small selection that was the
most useful. The factors that are contained within the crash data which were the most
useful in examining the data were the local government area in which the accident
happened, the Section ID of the offending road, the direction that the vehicle in the
crash was travelling and the chainage distance of the road where the accident took
place. An explanation of how this information is important is included later in the
methodology section of this chapter.
4.2.2 Road Data
The source of the road data is the Southern District Main Roads organisation with the
data being received on a floppy disk in the Microsoft Excel format. The road data
information describes the physical environment of the roads within the Southern
District. As with the crash data, the road data can also be viewed by referring to
Appendix E.
The most important factors in the road data, in regard to organising the data as
explained below, were the road section, carriageway code and the section of the

28
identified road by the start and end chainage distances of the Road ‘TDIST_START’
and ‘TDIST_END’
The remaining road data contained factors such as:
• Width (Seal, Pavement and Formation),
• Seal Age,
• Pavement Age,
• Pavement Depth,
• AADT data,
• Percentage of Heavy Vehicles,
• Roughness of Road,
• Speed Limit; and
• Terrain Description
Of these factors the particular factors that were considered to be the most important to
consider in the analysis were the width including seal, pavement and formation and the
AADT data of the roads.
4.2.3 Southern District Traffic Census
The traffic census data is a data set that is mostly concerned with the counting of traffic
at different locations through out the Southern District. As with the road data the traffic
census is from the Southern District Main Roads organisation but this data is supplied
on a CD in PDF format. The main features of this data is the listing of the AADT
figures for each road in the Southern District, intersection counts for intersections that
29
are mainly situated around the city of Toowoomba and also there is a break up of the
AADT figures into hourly timeslots for selected major roads from the Southern District.
This last feature is the most important for the analysis of the data.
4.3 Methodology
This section describes the steps taken before and during the analysis of the data. This
extends from obtaining the crash data, to the method used in reviewing and organising
the initial data before it could be analysed. Finally, the method used to analyse the data
is described.
4.3.1 Obtaining the Crash Data
The crash data was obtained by meeting with Mal McIlwaith at Queensland Transport,
who had already organised the data. During the meeting, the data was placed in
Microsoft Excel format and burnt onto a blank CD-R. Mal then allowed the CD to be
taken and the data contained on the CD to be used for the purposes of this project.
4.3.2 Initial Work Undertaken on Crash Data
Before the data could be analysed, the data needed to be reviewed and organised into
the appropriate format. As was indicated previously in this chapter, the initial crash
data contained information on four districts, as shown in Figure 4.1, but for this project
only one district, the Southern District, was required. To condense the file to contain

30
data only concerning the Southern District, any line of data in the column labelled
‘Southern District’ that contained ‘z balance SR’ was deleted. This removed any
accidents that did not occur in the Southern District.
Next, another file needed to be created containing just two local government areas. This
was because of the need to examine an initial data area. The two areas chosen for this
project were Toowoomba City Council and Gatton Shire Council. To do this any line
of data from the Southern District data file, previously created, that didn’t contain
‘Gatton Shire Council’ or ‘Toowoomba City Council’ under the ‘Local Govt Authority’,
heading were deleted. This can be seen in Figure 4.2. This process organised the crash
data into a file primarily concerned with Toowoomba and Gatton data.
Figure 4.1: Initial Crash Data file containing Four Districts

31
Figure 4.2: ‘Local Government Authority’ Identification
4.3.3 Correlation of Road and Crash Data
Once the crash data had been organised into the two separate files of the Southern
District, and the two local government areas, these files needed to be integrated together
to create files of road data that matched up to the locations of the crashes. This was
achieved by reviewing the crash data file and identifying the road by finding the
classification under ‘RsectID’, or Road Section Identification Number. This is displayed
in Figure 4.3. The exact chainage of the road, at which the accident occurred, was
recognised in the column headed ‘TDIST’, as seen in Figure 4.4.

32
Figure 4.3: Identifying Crash Road ‘RsectID’
Figure 4.4: Chainage Distance, ‘TDIST’, of the Road
Once these characteristics have been identified, it is possible to refer to the road data
and identify the section of road that the accident occurred. For instance, the crash that is
described by line one of the crash data in Figures 4.3 and 4.4, matches up to the road
data contained in line 62 of Figure 4.5 below. Once the correct sections of road had
been identified, the data line describing the road was copied to a new file. To build a
data set of road data relating to crashes, the crash data file must be matched line by line
to the road data using the method outlined above.

33
Figure 4.5: Road Data Matching Crash Data Above
In Figure 4.5 above, lines 57 and 58 describe the characteristics of the section of road
between chainage 55 and 56, as well as the carriageway code in column two. This
column differentiates between two carriageways, coded ‘2’ and ‘3’ respectively. This is
because this section of road has two carriageways, one in each direction, separated by a
median strip. The code ‘2’ refers to the carriageway that travels in the same direction as
the originally gazetted direction of the road. In the case of 18A, the Warrego Highway
between Ipswich and Toowoomba, the gazetted direction is from Ipswich to
Toowoomba. In the crash data it can be determined through the use of the column
‘Direction travel Unit 1’, as seen in Figure 4.6, which direction the vehicle was
travelling. In the case in Figure 4.6 the vehicle was travelling Eastbound on 18A. So, if
this accident occurred on a dual carriage way section of road, the carriageway being
used by this vehicle would have been coded ‘3’ because it was travelling against the
gazetted direction.

34
Figure 4.6: Direction of Travel factor used to determine Carriageway
4.3.4 Analysis of Data
Tidal Flow
The first step in the analysis of the tidal flow for the Toowoomba and Gatton region and
the Southern District was to establish which roads were to be analysed. This was
achieved by checking the roads that were included in the Southern District Traffic
Census. Once the roads that were to be analysed were established, the data from the
crash data for the roads analysed was organised into separate files for each road.
After the files were created it was decided that the time periods to be analysed were to
be four hour periods. However the data in the Traffic Census was broken into a
percentage of the AADT for only hourly periods instead of the four hourly periods that
were desired. To overcome this problem the percentages for the hourly periods were
added together to create percentages for the desired periods. Using these percentages
the traffic flow during the time period was found from the AADT of the road.

35
The next step in the process was to sum the amount of accidents in each time period for
each road. After this was complete the amount of crashes per one million vehicles
could be calculated. First the number of crashes was divided by the traffic flow
however the time period that the accidents occurred over was five years. This required
the traffic flow to be multiplied by 1826 days, four years of 365 days and a leap year
with 366 days. The figures that were obtained were then multiplied by one million to
convert the statistics to per one million vehicles.
Seal, Pavement and Formation Width
Before the analysis of these factors could begin the size of the width categories needed
to be established. It was decided that a category width of half a metre was likely to
produce reliable results. The category widths could have been as low as 0.1 metres but
it was felt that this width was unlikely to affect drivers and 0.5 metres was likely to be a
greater influence to drivers.
After the width categories were established the road data was sought through, summing
the length of road in each width category, for each area. Once this was complete the
data for the roads was also sorted then adding the amount of accidents that occurred in
each width category. The final step in the analysis of these factors was to divide the
amount of accidents by the length of the road. This produced statistics with units of
crashes per kilometre of road.
Each width type was then broken up into different road categories. This was achieved
with an AustRoads manual, Rural Road Design (2003). The road categories for the seal
widths were established with Table 11.1 and Table 11.2 from this publication. Table

36
11.2 and 11.2 were also used to create categories for the pavement widths. The
formation width categories were then found using Table 11.6 also from Austroads 2003.
Speed Limit Zones
The method used to analyse the speed limit zones was very similar to that used to
analyse the seal, pavement and formation widths. The first step was to sum the length
of roads for each speed limit then the amount of accidents that occurred in each zone
was also summed. As before the amount of crashes was divided by the length of the
road again producing an amount of crashes per kilometre of road.
AADT vs. Width
From the data found when analysing the width factors it could be seen which road types
were possible to analyse in this section. Once the road types to analyse were found
from the data, individual files for each width category were created for the road data and
the road data correlated from the crash data. These files were then split into the
different AADT categories.
Once again the crashes per kilometre of road were found by dividing the amount of
crashes in the AADT category for the width category by the length of the road in the
AADT and width category.

37
4.4 Chapter Summary
This chapter described the three types of data that were required to be analysed in this
project, the crash data, road data and Southern District traffic census. A description of
the contents of these files and the particular factors that were considered to be more
important than others was established. Once the data types were described, the
methodology used to complete the project was outlined, explaining how each stage was
completed. The steps that were described included how the data was obtained, the
initial work undertaken on the crash data, the correlation of the road and crash data and
the procedure that was completed in the analysis of the data.

38
Chapter 5
Tidal Flow and Crashes
5.1 Introduction
This chapter reports on the analysis of the factors relating to the ‘tidal flow’ of traffic
and the frequency of road crashes. The crash rate, crashes per one million vehicles, for
time periods of four hours on certain roads in each area was found. Then it was
compared to the other roads and the tidal flow of traffic during these periods. This
analysis was conducted in relation to the two examination areas, the initial area of
Toowoomba and Gatton and the entire study area of the Southern District.

39
5.2 Toowoomba and Gatton
This section seeks to establish if there is a correlation between the tidal flow of traffic
and the amount of road crashes in the Toowoomba and Gatton districts. Table 5.1
below was constructed to assist in this task. The Total Flow is the amount of vehicles
that travel along the road during the time period shown in one day and the number of
crashes being the total amount of crashes that occurred on that road in the time period,
in between 1998 and 2002. From these statistics the Crash Rate could be found, the
Crash Rate is the number of crashes per one million vehicles that travel the road.
Road 0 - 4 4 - 8 8 - 12 12 - 16 16 - 20 20 - 24 Total Flow 677 1544 2757 2486 2163 902
18A # Crashes 11 37 97 99 108 39 Crash Rate 8.8 13.1 19.2 21.8 27.3 23.6 Total Flow 138 1321 2507 2630 2389 617
18B # Crashes 5 21 89 87 84 21 Crash Rate 19.8 8.7 19.4 18.1 19.2 18.6 Total Flow 148 1657 3868 3902 3822 980
22A # Crashes 7 11 46 42 39 22 Crash Rate 25.9 3.6 6.5 5.8 5.5 12.3 Total Flow 242 960 4973 5747 4760 1521
22B # Crashes 2 11 45 70 61 20 Crash Rate 4.5 6.2 4.9 6.6 7.1 7.2 Total Flow 87 334 559 619 558 197
28A # Crashes 3 9 29 24 18 4 Crash Rate 18.8 14.7 28.4 21.2 17.6 11.1 Total Flow 14 79 174 182 135 36
313 # Crashes 0 2 7 4 4 0 Crash Rate 0 13.8 22.1 12.1 16.2 0 Total Flow 119 997 2803 2690 2148 508
314 # Crashes 2 13 22 25 23 10 Crash Rate 9.2 7.1 4.2 5.1 5.8 10.7
Table 5.1: Tidal Flow – Toowoomba and Gatton

40
From Table 5.1 the road 313 can be disregarded due to the small amount of crashes that
have occurred, which produces unreliable results. A slight correlation that can be seen
from Table 5.1 is that occasionally one of the tired times, 0 – 4 or 20 – 24, has a higher
crash rate despite having less accidents occurring than at other times during the day.
There are four particular occurrences of correlation mentioned above including 18A,
22A, 22B and 314. Road 18A has its highest crash rate, although comparable to the
other periods, during the time period of 0 – 4 likewise with 22A. This road also has a
crash rate that is much higher during this period than any other during the day and is
double that of the second highest crash rate. The crash rate of 22B is the highest during
the period of 20 – 24 but is also very comparable to the other periods. The road 314 two
highest periods occur during both time periods with 20 – 24 being the highest with a
crash rate of 10.7 and the second highest period being 0 – 4 with a crash rate of 9.2.
Another correlation that can be seen is that the traffic flow during the period 0 – 4 is
consistently much less than the other time periods and the crash rates for this time
period are comparable to the other periods, if not greater. Every road in these districts
has this statistic in common and a specific example of this is road 314. This road has a
traffic flow of 119 and a crash rate of 9.2 which is second only to that of 10.7 occurring
during 20 – 24 with traffic flow of 508 and a maximum flow of 2803 vehicles during 8 -
12.
Other examples of this include 22A as mentioned above with a crash rate that is double
the period with the second highest crash rate for that road. Also there is 18B with only
138 vehicles utilising the road, compared to 2630 at its busiest period, but a crash rate of
19.8 which is the highest for this road. From this evidence given above it can be seen

41
that in the Toowoomba and Gatton region a larger tidal flow does not mean a larger
crash rate.
5.3 Southern District
As with the above section this section seeks to establish if there is a correlation between
the tidal flow of traffic and the amount of road crashes but in the Southern District.
Table 5.2 below is much the same as Table 5.1 but includes roads that are found outside
the Toowoomba and Gatton districts and the traffic flow of the roads that pass through
both areas changed, if required, to represent the average flow of the road more
accurately. Again the Total Flow is the amount of vehicles that travel along the road
during the time period shown in one day, the number of crashes being the total amount
of crashes that occurred on that road during the particular time period, between 1998
and 2002 and the Crash Rate the number of crashes per one million vehicles that travel
the road.
The roads which flow was changed to more accurately reflect the average flow of the
roads that pass through both areas were 22A and 22B. Again there are roads with too
few accidents occuring to precisely generate accurate statistics. In the Southern District
these roads are 313, 325, 416 and 426. However some examples from these roads are
used but with disclaimers to the legitimacy of the statistics generated.

42
Road 0 - 4 4 - 8 8 - 12 12 - 16 16 - 20 20 - 24 Total Flow 677 1544 1757 1486 2163 901
18A # Crashes 20 61 138 143 147 57 Crash Rate 16.1 21.6 27.4 31.5 37.2 34.6 Total Flow 137 1321 2507 2630 2389 617
18B # Crashes 15 45 117 122 126 33 Crash Rate 59.9 18.6 25.5 25.4 28.8 29.2 Total Flow 44 170 497 521 377 110
18C # Crashes 6 7 22 15 15 7 Crash Rate 74.6 22.5 24.2 15.7 21.7 34.8 Total Flow 12 126 372 349 275 58
22A # Crashes 19 24 77 75 75 37 Crash Rate 867.1 104.3 113.3 117.6 149.3 349.3 Total Flow 55 557 1384 1365 1246 275
22B # Crashes 5 17 58 86 68 25 Crash Rate 49.7 16.7 22.9 34.5 29.8 49.7 Total Flow 87 334 559 619 558 197
28A # Crashes 12 31 47 40 42 14 Crash Rate 75.5 50.8 46.1 35.3 41.2 38.9 Total Flow 70 177 370 395 324 152
28B # Crashes 5 2 4 10 2 3 Crash Rate 39.1 6.1 5.9 13.8 3.3 10.8 Total Flow 39 160 454 444 352 99
35A # Crashes 1 2 9 14 10 2 Crash Rate 14.1 6.8 10.8 17.2 15.5 11.1 Total Flow 40 316 743 748 524 115
40B # Crashes 9 10 35 41 25 14 Crash Rate 123.2 17.3 25.7 30.1 26.1 66.6 Total Flow 49 395 989 900 684 166
40C # Crashes 5 3 27 36 31 15 Crash Rate 55.8 4.1 14.9 21.9 24.8 49.4 Total Flow 87 323 831 815 644 208
45B # Crashes 4 9 17 23 27 8 Crash Rate 25.1 15.2 11.2 15.4 22.9 21.1 Total Flow 14 78 174 182 135 36
313 # Crashes 0 2 11 4 5 0 Crash Rate 0 14.1 34.6 12.1 20.2 0 Total Flow 119 997 2803 2690 2148 508
314 # Crashes 2 15 22 25 24 10 Crash Rate 9.2 8.2 4.2 5.1 6.1 10.7 Total Flow 6 57 143 140 111 21
325 # Crashes 0 1 0 2 3 0 Crash Rate 0 9.6 0 7.8 14.8 0 Total Flow 1 18 67 66 39 6
416 # Crashes 1 2 4 5 3 1 Crash Rate 547.6 60.8 32.6 41.4 42.1 91.2 Total Flow 6 54 118 113 83 21
426 # Crashes 3 3 7 9 12 1 Crash Rate 273.8 30.4 32.4 43.6 79.1 26.1
Table 5.2: Tidal Flow – Southern District

43
From Table 5.2 above it can be seen that the crash rate for the road 22A is quite high,
much higher than any other road in the Southern District. This high crash rate seems to
be due to the low traffic flow that the road 22A has compared to the other roads that
were analysed. When this is combined with a high amount of crashes, as is the case, a
high crash rate is produced.
The lowest crash rate for this road is 104.3 and the highest 867.1, these figures are quite
high when for the majority of roads in the Southern District that were analysed have a
crash rate of generally 20 – 40 with some time periods having a crash rate slightly
above this figure. Two other roads have crash rates that are similarly high with these
roads being 416 and 426 however due to the low number of crashes the accuracy of this
figure is questionable. This is due to the considerable difference to the crash rate that
one crash difference, to the number of crashes, makes.
A correlation that can be seen from Table 5.2 is, that every road, during 0 – 4 has a low
tidal flow compared to other time periods but often has a comparable or higher crash
rate. An example of this is road 45B which only has 87 vehicles using the road in this
period but has a crash rate of 25.1 which is higher than the other periods for this road.
Another example is 40C which has even les traffic during this period with only 49
vehicles but a higher crash rate of 55.8 which is also the highest for this road. In the
Southern District all roads have the lowest traffic flow during the period of 0 – 4 for the
entire day and all but 18A and 35A have the highest crash rate
Although the period of 0 – 4 has a low traffic flow but a high or comparable crash rate
this also occurs in the period of 20 – 24. The examples where the 0 – 4 and 20 – 24
have the two lowest traffic flow but high crash rates include18C, 22A, 22B, 40B and

44
40C. According to the information above it was shown that the crash rate, where the
traffic flow is the lowest, is the highest during the tired times.
5.4 Chapter Summary
This chapter reported on the analysis of the ‘tidal flow’ of traffic and the crash rate of
the roads in the Toowoomba and Gatton areas and the Southern District. The crash rate
that was analysed was the number of crashes per on million vehicles using the road and
this was compared to the traffic flow of the road during four hour time periods for one
day. From the analysis conducted it was found that a higher traffic flow rarely
translated into a higher crash rate.

45
Chapter 6
Road Environment and Crashes
6.1 Introduction
This chapter reports on the analysis of the factors relating to the road environment and
the frequency of road crashes. These factors that were analysed as part of the road
environment included the seal width, pavement width, formation width, speed limit
zones and the AADT vs. Width. These factors were analysed in relation to the two
examination areas of the initial area of Toowoomba and Gatton and the entire study area
of the Southern District.

46
6.2 Seal Width
The seal width refers to the width of the bitumous seal that covers the pavement
beneath. The seal width of a road is commonly narrower than the pavement or
formation width, hence creating shoulders which are usually unsealed. This section
endeavours to find a correlation between the width of the sealed road and the frequency
of road crashes that occur on these roads.
6.2.1 Toowoomba and Gatton
To accurately depict the amount of crashes that occurs on certain sealed widths the
amount of crashes, per kilometre of road that is of a certain width, needed to be found
for an accurate analysis of the data. This information is shown in Table 6.1 below.
From this the categories of single lane unsealed shoulders, single lane sealed shoulders,
double lane unsealed shoulders and four lane unsealed shoulders all have data sets
which are too small to establish accurate correlations so for this section are disregarded.
This leaves the categories of double lane sealed shoulders and four lanes sealed
shoulders. From Figure 6.1 and Figure 6.2 below it can be seen that a correlation can
not be seen for either of these categories. One reason for this could be the lengths of
road that are analysed, particularly in the category of four lanes sealed shoulders. The
reason the lengths are a problem is that they are very small, with the four lane category
having lengths that are at longest two Kilometres in length. This produces statistics that
are unreliable and inaccurate, as is the case in this situation.

47
Width Length # Crashes Crashes/Km
3.5 - 3.9 3 1 0.34.0 - 4.4 1 1 1.0
4.5 - 4.9 0 0 0.05.0 - 5.4 5 3 0.65.5 - 5.9 21 11 0.5
6.0 - 6.4 16 18 1.16.5 - 6.9 24 21 0.9
7.0 - 7.4 4 20 5.07.5 -7.9 7 21 3.08.0 - 8.4 13.23 27 2.08.5 - 8.9 5.58 45 8.19.0 - 9.4 15 89 5.99.5 - 9.9 8 63 7.9
10.0 - 10.4 28 125 4.510.5 - 10.9 14.17 50 3.511.0 - 11.4 18 54 3.011.5 - 11.9 9 53 5.912.0 - 12.4 1 3 3.0
12.5 - 12.9 5 28 5.613.0 -13.4 2 48 24.013.5 - 13.9 1 46 46.014.0 - 14.4 4 66 16.514.5 -14.9 0 0 0.015.0 - 15.4 0 0 0.0
15.5 - 15.9 1.27 18 14.216.0 - 16.4 2 82 41.016.5 - 16.9 1 36 36.017.0 - 17.4 1 24 24.017.5 - 17.9 2 69 34.518.0 - 18.4 2 71 35.518.5 - 18.9 1 2 2.019.0 - 19.4 1 101 101.019.5 - 19.9 0 0 0.020.0 - 20.4 1 10 10.020.5 - 20.9 1 46 46.021.0 - 21.4 1 52 52.021.5 - 21.9 0 0 0.022.0 - 22.4 0 0 0.022.5 - 23.0 1.01 62 61.4
Four Lanes Unsealed Shoulders
Four Lanes Sealed Shoulders
Single Lane Unsealed Shoulders
Single Lane Sealed Shoulders
Double Lane Unsealed Shoulders
Double Lane Sealed Shoulders
Table 6.1: Seal Width Crashes/Km – Toowoomba and Gatton

48
Seal Width - Double Lane Sealed Shoulders Toowoomba and Gatton
0.0
2.0
4.0
6.0
8.0
10.0
7.0 -7.4
7.5 -7.9
8.0 -8.4
8.5 -8.9
9.0 -9.4
9.5 -9.9
10.0 -10.4
10.5 -10.9
11.0 -11.4
11.5 -11.9
12.0 -12.4
Seal Width
Cra
shes
/Km
Figure 6.1: Double Lane Sealed Shoulders – Toowoomba and Gatton
Seal Width - Four Lanes Sealed Shoulders Toowoomba and Gatton
0.020.040.060.080.0
100.0120.0
15.5
- 15.9
16.0
- 16.4
16.5
- 16.9
17.0
- 17.4
17.5
- 17.9
18.0
- 18.4
18.5
- 18.9
19.0
- 19.4
19.5
- 19.9
20.0
- 20.4
20.5
- 20.9
21.0
- 21.4
21.5
- 21.9
22.0
- 22.4
22.5
- 23.0
Seal Width
Cra
shes
/Km
Figure 6.2: Four Lane Sealed Shoulders – Toowoomba and Gatton

49
6.2.2 Southern District
As with the Toowoomba and Gatton districts there are only two sealed road widths that
contain enough information for an accurate analysis. Those roads were that same as
above, being double lane sealed shoulders and four lane sealed shoulders as shown in
Table 6.2 below.
The graph of double lane sealed shoulders in Figure 6.3 illustrates a good correlation.
As the width of the road increases the crashes per kilometre of road is generally
increasing. Even though the data on the length of the road for four lane sealed
shoulders is considered to be too low to present accurate statistics there is still a slight
correlation shown in Figure 6.4. This correlation is the same as in Toowoomba and
Gatton, with the crashes per kilometre increasing as the width of the road increases.
Seal Width - Double Lane Sealed Shoulders Southern District
0.00.51.01.52.02.53.03.5
7.0 -7.4
7.5 -7.9
8.0 -8.4
8.5 -8.9
9.0 -9.4
9.5 -9.9
10.0 -10.4
10.5 -10.9
11.0 -11.4
11.5 -11.9
12.0 -12.4
Seal Width
Cra
shes
/Km
Figure 6.3: Double Lane Sealed Shoulders – Southern District

50
Width # Crashes Length Crashes/Km
2.5 - 2.9 1 3.68 0.33.0 - 3.4 4 5 0.83.5 - 3.9 26 212.82 0.14.0 - 4.4 10 86.46 0.1
4.5 - 4.9 13 52 0.35.0 - 5.4 23 137.87 0.25.5 - 5.9 66 233.46 0.3
6.0 - 6.4 235 614.12 0.46.5 - 6.9 143 208.92 0.7
7.0 - 7.4 157 257.4 0.67.5 -7.9 121 132.23 0.98.0 - 8.4 181 212.61 0.98.5 - 8.9 162 89.806 1.89.0 - 9.4 383 308.892 1.29.5 - 9.9 186 81.19 2.3
10.0 - 10.4 204 100.03 2.010.5 - 10.9 127 48.88 2.611.0 - 11.4 130 56.67 2.311.5 - 11.9 99 33.86 2.912.0 - 12.4 73 35.65 2.0
12.5 - 12.9 43 10 4.313.0 -13.4 82 15 5.513.5 - 13.9 62 5.54 11.214.0 - 14.4 83 8 10.414.5 -14.9 5 2 2.515.0 - 15.4 14 2 7.0
15.5 - 15.9 18 2 9.016.0 - 16.4 95 5 19.016.5 - 16.9 41 2.21 18.617.0 - 17.4 24 1 24.017.5 - 17.9 86 5 17.218.0 - 18.4 79 14 5.618.5 - 18.9 5 2 2.519.0 - 19.4 108 2 54.019.5 - 19.9 6 1 6.020.0 - 20.4 16 1 16.020.5 - 20.9 46 1 46.021.0 - 21.4 53 1 53.021.5 - 21.9 9 1 9.022.0 - 22.4 42 2.96 14.222.5 - 23.0 76 1.2 63.3
Double Lane Sealed Shoulders
Four Lanes Unsealed Shoulders
Four Lanes Sealed Shoulders
Single Lane Unsealed Shoulders
Single Lane Sealed Shoulders
Double Lane Unsealed Shoulders
Table 6.2: Seal Width Crashes/Km – Southern District

51
Seal Width - Four Lanes Sealed Shoulders Southern District
0.010.020.030.040.050.060.070.0
15.5
- 15.9
16.0
- 16.4
16.5
- 16.9
17.0
- 17.4
17.5
- 17.9
18.0
- 18.4
18.5
- 18.9
19.0
- 19.4
19.5
- 19.9
20.0
- 20.4
20.5
- 20.9
21.0
- 21.4
21.5
- 21.9
22.0
- 22.4
22.5
- 23.0
Seal Width
Cra
shes
/Km
Figure 6.4: Four Lane Sealed Shoulders – Southern District
6.3 Pavement Width
The pavement width is the width of the road that includes the traffic lanes and the
shoulders on each side of the road. In this section the correlation is sought between the
frequency of road crashes and the width of the formation on these roads.
6.3.1 Toowoomba and Gatton
Of the three different width categories in Table 6.3 only four lanes is not appropriate for
analysis due to the minimal lengths of road sections. The first two, single lane and
double lane provide visual correlations as shown in Figures 6.5 and 6.6.

52
Width # Crashes Length Crashes/Km
6.5 - 6.9 4 6 0.77.0 - 7.4 15 10 1.57.5 -7.9 26 12 2.28.0 - 8.4 51 46.23 1.18.5 - 8.9 43 15 2.9
9.0 - 9.4 92 28 3.39.5 - 9.9 44 9 4.9
10.0 - 10.4 136 33 4.110.5 - 10.9 85 26 3.311.0 - 11.4 37 18.58 2.011.5 - 11.9 49 8 6.112.0 - 12.4 13 4 3.312.5 - 12.9 37 6 6.213.0 -13.4 50 3.17 15.813.5 - 13.9 46 1 46.014.0 - 14.4 40 3 13.314.5 -14.9 0 0 0.015.0 - 15.4 26 1 26.0
15.5 - 15.9 18 1.27 14.216.0 - 16.4 82 2 41.016.5 - 16.9 36 1 36.017.0 - 17.4 24 1 24.017.5 - 17.9 27 1 27.018.0 - 18.4 31 1 31.018.5 - 18.9 84 3 28.019.0 - 19.4 101 1 101.019.5 - 19.9 0 0 0.020.0 - 20.4 0 0 0.020.5 - 20.9 0 0 0.021.0 - 21.4 108 3 36.021.5 - 21.9 0 0 0.022.0 - 22.4 9 1 9.022.5 - 23.0 62 1.01 61.4
Single Lane
Double Lane
Four Lanes
Table 6.3: Pavement Width Crashes/Km – Toowoomba and Gatton
In both Figure 6.5 and 6.6 the crashes per kilometre of road increases as the width of the
road increases. In Figure 6.5 this is a gradual increase but in Figure 6.6 the increase
does not start until the width of the road is approximately 12.5m. The crashes per
kilometre increase until the width reaches 13.9m then the crashes reduce. Hence a
correlation exists for both single lane and double lane pavements that suggests the
number of crashes increases as the width of the pavement increases.

53
Pavement Width - Single Lane Toowoomba and Gatton
0.00.51.01.52.02.53.03.5
6.5 - 6.9 7.0 - 7.4 7.5 -7.9 8.0 - 8.4 8.5 - 8.9
Pavement Width
Cra
shes
/Km
Figure 6.5: Single Lane Pavement Width – Toowoomba and Gatton
Pavement Width - Double Lane Toowoomba and Gatton
0.010.020.030.040.050.0
9.0 -
9.4
9.5 -
9.9
10.0
- 10.4
10.5
- 10.9
11.0
- 11.4
11.5
- 11.9
12.0
- 12.4
12.5
- 12.9
13.0
-13.4
13.5
- 13.9
14.0
- 14.4
14.5
-14.9
15.0
- 15.4
Pavement Width
Cra
shes
/Km
Figure 6.6: Double Lane Pavement Width – Toowoomba and Gatton

54
6.3.2 Southern District
The Southern district data is much like the data from the Toowoomba and Gatton region
with the lengths of the road for four lane pavements being again too small for an
accurate analysis. This therefore leaves the categories of single lane and double lane
pavements as before.
Pavement Width - Single Lane Southern District
0.0
0.1
0.2
0.3
0.4
0.5
0.6
3.5 -3.9
4.0 -4.4
4.5 -4.9
5.0 -5.4
5.5 -5.9
6.0 -6.4
6.5 -6.9
7.0 -7.4
7.5 -7.9
8.0 -8.4
8.5 -8.9
Pavement Width
Cra
shes
/Km
Figure 6.7: Single Lane Pavement Width – Southern District
The correlation displayed in Figure 6.7 for a single lane pavement is not as clear as
those seen in previous examples but the overall general trend is for the crashes per
kilometre to increase along with an increase in the width. The trend displayed in Figure
6.8 for a double lane pavement is again generally an increase in crashes as the width
increases.

55
Width # Crashes Length Crashes/Km
3.5 - 3.9 1 10.23 0.14.0 - 4.4 0 0 0.04.5 - 4.9 0 0 0.05.0 - 5.4 1 3.68 0.35.5 - 5.9 4 16.47 0.26.0 - 6.4 6 43.96 0.16.5 - 6.9 11 53.34 0.27.0 - 7.4 30 62.59 0.57.5 -7.9 72 214.57 0.38.0 - 8.4 234 549.6 0.48.5 - 8.9 183 456.808 0.4
9.0 - 9.4 557 716.82 0.89.5 - 9.9 228 164.35 1.4
10.0 - 10.4 418 253.29 1.710.5 - 10.9 239 141.42 1.711.0 - 11.4 152 93 1.611.5 - 11.9 121 51.7 2.312.0 - 12.4 69 39.97 1.712.5 - 12.9 74 19.61 3.813.0 -13.4 93 14.17 6.613.5 - 13.9 78 11 7.114.0 - 14.4 50 5.72 8.714.5 -14.9 11 4.31 2.615.0 - 15.4 43 5 8.6
15.5 - 15.9 18 1.27 14.216.0 - 16.4 101 6.41 15.816.5 - 16.9 0 0 0.017.0 - 17.4 24 1.21 19.817.5 - 17.9 41 2 20.518.0 - 18.4 34 2 17.018.5 - 18.9 97 6 16.219.0 - 19.4 108 2 54.019.5 - 19.9 0 0 0.020.0 - 20.4 6 1 6.020.5 - 20.9 0 0 0.021.0 - 21.4 123 4.54 27.121.5 - 21.9 0 0 0.022.0 - 22.4 54 3.96 13.622.5 - 23.0 76 1.2 63.3
Single Lane
Double Lane
Four Lanes
Table 6.4: Pavement Width Crashes/Km – Southern District

56
Pavement Width - Double Lane Southern District
0.0
2.0
4.0
6.0
8.0
10.0
9.0 -
9.4
9.5 -
9.9
10.0
- 10.4
10.5
- 10.9
11.0
- 11.4
11.5
- 11.9
12.0
- 12.4
12.5
- 12.9
13.0
-13.4
13.5
- 13.9
14.0
- 14.4
14.5
-14.9
15.0
- 15.4
Pavement Width
Cra
shes
/Km
Figure 6.8: Double Lane Pavement Width – Southern District
6.4 Formation Width
The formation width is the total width of the road from one side of the road to the
respective opposite side including the verges that support the shoulders and can locate
the guide posts. In this section correlation is sought between the frequency of road
crashes and the width of the formation on these roads.
6.4.1 Toowoomba and Gatton
From Table 6.5 there is only one category that an analysis would be valid to analyse.
This is again because of the minimal lengths of road that exist in the categories of
double lane formation width and four lane formation width. This leaves the single lane

57
formation the only category available to be analysed in the Toowoomba and Gatton
region.
Width # Crashes Length Crashes/Km
6.5 - 6.9 4 6 0.77.0 - 7.4 15 10 1.57.5 -7.9 26 12 2.28.0 - 8.4 51 46.23 1.18.5 - 8.9 43 15 2.99.0 - 9.4 92 28 3.39.5 - 9.9 44 9 4.9
10.0 - 10.4 123 32 3.810.5 - 10.9 83 25 3.3
11.0 - 11.4 59 21.58 2.711.5 - 11.9 49 8 6.112.0 - 12.4 15 5 3.012.5 - 12.9 28 5 5.613.0 -13.4 50 3.17 15.813.5 - 13.9 46 1 46.014.0 - 14.4 40 3 13.314.5 -14.9 26 1 26.015.0 - 15.4 0 0 0.015.5 - 15.9 18 1.27 14.216.0 - 16.4 82 2 41.016.5 - 16.9 36 1 36.017.0 - 17.4 24 1 24.0
17.5 - 17.9 27 1 27.018.0 - 18.4 31 1 31.018.5 - 18.9 84 3 28.019.0 - 19.4 101 1 101.019.5 - 19.9 0 0 0.020.0 - 20.4 0 0 0.020.5 - 20.9 0 0 0.021.0 - 21.4 108 3 36.021.5 - 21.9 0 0 0.022.0 - 22.4 9 1 9.022.5 - 23.0 62 1.01 61.4
Single Lane
Double Lane
Four Lanes
Table 6.5: Formation Width Crashes/Km – Toowoomba and Gatton
From Figure 6.9, which aids in the analysis of the single lane formation width, the
general trend is shown as increasing the width causing the amount of crashes to also
rise.

58
Formation WIdth - Single Lane Toowoomba and Gatton
0.01.0
2.03.04.0
5.06.0
6.5 -6.9
7.0 -7.4
7.5 -7.9
8.0 -8.4
8.5 -8.9
9.0 -9.4
9.5 -9.9
10.0 -10.4
10.5 -10.9
Formation Width
Cra
shes
/Km
Figure 6.9: Single Lane Formation Width – Toowoomba and Gatton
6.4.2 Southern District
Unlike the Toowoomba and Gatton region the double lane category is able to be
analysed due to an increase in the length of roads in these width sections. Due to the
increase of data when the analysis area is increased to the entire Southern District the
trends that are seen for these roads types becomes clearer. This can be seen in Figures
6.10 and 6.11 below. These correlations that can be seen in these figures are same that
have been seen before with the amount of crashes increasing as the width of the
formation increases.

59
Width # Crashes Length Crashes/Km
5.0 - 5.4 1 3.68 0.35.5 - 5.9 1 11.47 0.16.0 - 6.4 8 32.23 0.26.5 - 6.9 10 36.34 0.37.0 - 7.4 28 64.49 0.47.5 -7.9 67 228.57 0.38.0 - 8.4 235 557.75 0.48.5 - 8.9 197 439.658 0.49.0 - 9.4 546 373.42 1.59.5 - 9.9 232 172.35 1.3
10.0 - 10.4 412 255.29 1.610.5 - 10.9 234 144.42 1.6
11.0 - 11.4 173 92 1.911.5 - 11.9 120 49.7 2.412.0 - 12.4 71 44.6 1.612.5 - 12.9 65 18.61 3.513.0 -13.4 93 14.17 6.613.5 - 13.9 79 11 7.214.0 - 14.4 50 5.72 8.714.5 -14.9 37 5.31 7.015.0 - 15.4 17 4 4.315.5 - 15.9 18 1.27 14.216.0 - 16.4 100 5.41 18.516.5 - 16.9 36 1 36.017.0 - 17.4 24 1 24.0
17.5 - 17.9 41 2 20.518.0 - 18.4 34 2 17.018.5 - 18.9 97 6 16.219.0 - 19.4 108 2 54.019.5 - 19.9 0 0 0.020.0 - 20.4 6 1 6.020.5 - 20.9 3 1 3.021.0 - 21.4 123 4.54 27.121.5 - 21.9 1 1 1.022.0 - 22.4 51 2.96 17.222.5 - 23.0 76 1.2 63.3
Single Lane
Double Lane
Four Lanes
Table 6.6: Formation Width Crashes/Km – Southern District

60
Formation Width - Single Lane Southern District
0.00.20.40.60.81.01.21.41.61.8
5.0 -5.4
5.5 -5.9
6.0 -6.4
6.5 -6.9
7.0 -7.4
7.5 -7.9
8.0 -8.4
8.5 -8.9
9.0 -9.4
9.5 -9.9
10.0-
10.4
10.5-
10.9
Formation Width
Cra
shes
/Km
Figure 6.10: Single Lane Formation Width – Southern District
Formation Width - Double Lane Southern District
0.05.0
10.015.020.025.030.035.040.0
11.0
- 11.4
11.5
- 11.9
12.0
- 12.4
12.5
- 12.9
13.0
-13.4
13.5
- 13.9
14.0
- 14.4
14.5
-14.9
15.0
- 15.4
15.5
- 15.9
16.0
- 16.4
16.5
- 16.9
17.0
- 17.4
Formation Width
Cra
shes
/Km
Figure 6.11: Double Lane Formation Width – Southern District

61
6.5 Speed Limit Zones
This section simply examined the amount of accidents that occur in each speed limit
zone in between 1998 and 2002. It is intended to determine whether or not there is any
speed limit zone that accidents occur in more than others.
6.5.1 Toowoomba and Gatton
The analysis of the Toowoomba and Gatton areas reveals a very strong correlation
between the number of crashes and the speed limit zone that they occur in. This
correlation is easy to see in Table 6.7, but is demonstrated even more effectively by the
graph in Figure 6.12 below. This figure reveals that more accidents occur per kilometre
of road then any other zone as the amount of accidents per kilometre of road decreases
as the speed limit rises. Another point of interest is the crashes per kilometre of road in
the 60 Km/h zones are much higher than the other zones.
Speed Length # Crashes Crashes/Km60 50.32 917 18.280 19 86 4.5
100 184.74 316 1.7
Table 6.7: Speed Limit Zone Crashes/Km – Toowoomba and Gatton

62
Speed Zones - Toowoomba and Gatton
0.0
5.0
10.0
15.0
20.0
60 80 100
Speed Zone
Cra
shes
/Km
Figure 6.12: Speed Limit Zone Crashes – Toowoomba and Gatton
6.5.2 Southern District
The correlation is also evident in the analysis of the data for the Southern District from
Figure 6.13 below. The correlation is the same with the crashes per kilometre being the
highest in the 60 Km/h zone and reducing as the speed limit rises. Comparing the two
areas it was found that 59% of the crashes per kilometre, in the 60 Km/h zone, in the
Southern District occurred in the Toowoomba and Gatton areas. Also 83% of the
crashes per kilometre, in the 100 Km/h zones in the Southern District, occurred outside
of the Toowoomba and Gatton areas.
Speed Length # Crashes Crashes/Km60 142.21 1265 8.970 1.74 3 1.780 118.11 300 2.5
100 2703.428 1739 0.6110 35.37 9 0.3
Table 6.8: Speed Limit Zone Crashes – Southern District

63
Speed Zones Southern District
0.0
2.0
4.0
6.0
8.0
10.0
60 70 80 100 110
Speed Zone
Cra
shes
/Km
Figure 6.13: Speed Limit Zone Crashes – Southern District
6.6 AADT Vs. Width
This section analyses the relationship between the AADT of the road and the width of
the road relating to seal, pavement and formation. The aim of this section is to
investigate the affect of the AADT and width of the road on the number of crashes on
the road.

64
6.6.1 Seal Width
Toowoomba and Gatton
The data for the Toowoomba and Gatton was not beneficial to analyse as it would not
have provided any accurate statistics. Therefore no analysis was conducted for any
category of road in this section.
Southern District
The only road category that would show accurate results after analysis for the Southern
District was the double lane sealed shoulders. The analysis of which is found in Table
6.9 below. From Table 6.9 it can be seen that the low flow and medium flow have
roughly the same amount of crashes with the high flow category being higher. The low
and medium flow can only be analysed up to 9.9 metres but it can be seen that the three
categories really do not increase as the width increases.

65
Width AADT Length # Crashes Crashes/Km< 500 90.86 17 0.2
7.0 - 7.4 500 - 1000 72.59 26 0.4> 1000 91.95 114 1.2< 500 54 15 0.3
7.5 - 7.9 500 - 1000 19 4 0.2> 1000 59.23 102 1.7< 500 70.36 19 0.3
8.0 - 8.4 500 - 1000 53.09 13 0.2> 1000 89.16 149 1.7< 500 16.11 11 0.7
8.5 - 8.9 500 - 1000 15.186 8 0.5> 1000 58.51 143 2.4< 500 38.31 14 0.4
9.0 - 9.4 500 - 1000 53.282 19 0.4> 1000 217.3 350 1.6< 500 3.74 3 0.8
9.5 - 9.9 500 - 1000 13 9 0.7> 1000 64.45 181 2.8< 500 4 1 0.3
10.0 - 10.4 500 - 1000 2 3 1.5> 1000 94.03 200 2.1< 500 2 0 0.0
10.4 -10.9 500 - 1000 2 1 0.5> 1000 45.27 126 2.8< 500 1 0 0.0
11.0 - 11.4 500 - 1000 1 1 1.0> 1000 55 129 2.3< 500 2.36 6 2.5
11.5 - 11.9 500 - 1000 0 0 0.0> 1000 30.34 93 3.1< 500 3.4 8 2.4
12.0 - 12.4 500 - 1000 0 0 0.0> 1000 32.5 65 2.0
Table 6.9: AADT vs. Width - Double Lane Sealed Shoulders Southern District
6.6.2 Pavement Width
Toowoomba and Gatton
There was only one road category for pavement widths to be analysed for this region
and that was the single lane. Table 6.10 below provides the analysis of this road type.

66
Width AADT Length # Crashes Crashes/Km< 500 0 0 0.0
6.5 - 6.9 500 - 1000 7.57 1 0.1> 1000 2 3 1.5< 500 6 2 0.3
7.0 - 7.4 500 - 1000 3 1 0.3> 1000 3 12 4.0< 500 0 0 0.0
7.5 - 7.9 500 - 1000 4 1 0.3> 1000 8.23 25 3.0< 500 1 0 0.0
8.0 - 8.4 500 - 1000 18 8 0.4> 1000 27.23 43 1.6< 500 0 0 0.0
8.5 - 8.9 500 - 1000 4 3 0.8> 1000 12 40 3.3
Table 6.10: AADT vs. Width - Single Lane Pavement Toowoomba and Gatton
It is gain shown that high flow is higher than the medium and low flow categories but
there is no data for the low flow section. For medium flow the amount of crashes
steadily increase as the width of the road increases while the amount of crashes
occurring on high flow roads remains steady as the width increases.
Southern District
The Southern District data provided two road categories that were able to be analysed,
they were the single and double lane pavements. The analyses are included in Table
6.11 and 6.12 respectively, below.
For the single lane pavement in Table 6.11 the low flow is analysable throughout the
entire width of the road but remains steady and the amount of crashes occurring is again
relatively similar to that of medium flow. Medium flow is analysed from 5.5 metres
wide onwards but unlike low flow displays a slight increase in crashes as the width
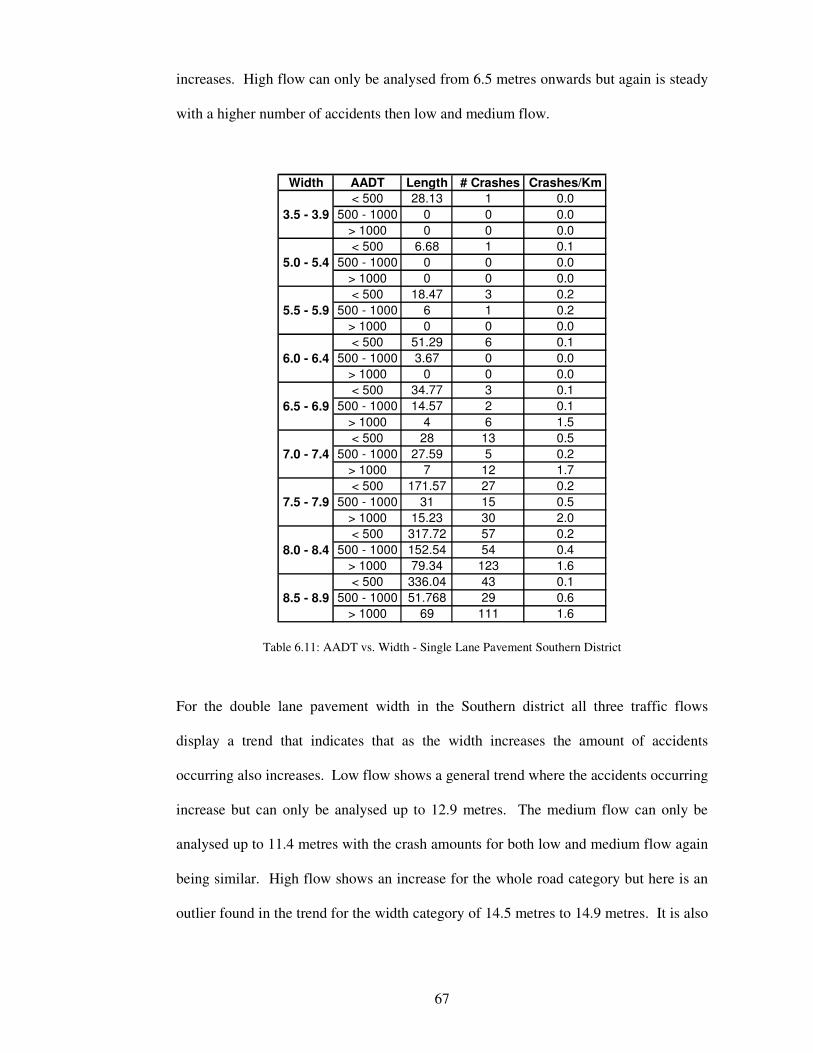
67
increases. High flow can only be analysed from 6.5 metres onwards but again is steady
with a higher number of accidents then low and medium flow.
Width AADT Length # Crashes Crashes/Km< 500 28.13 1 0.0
3.5 - 3.9 500 - 1000 0 0 0.0> 1000 0 0 0.0< 500 6.68 1 0.1
5.0 - 5.4 500 - 1000 0 0 0.0> 1000 0 0 0.0< 500 18.47 3 0.2
5.5 - 5.9 500 - 1000 6 1 0.2> 1000 0 0 0.0< 500 51.29 6 0.1
6.0 - 6.4 500 - 1000 3.67 0 0.0> 1000 0 0 0.0< 500 34.77 3 0.1
6.5 - 6.9 500 - 1000 14.57 2 0.1> 1000 4 6 1.5< 500 28 13 0.5
7.0 - 7.4 500 - 1000 27.59 5 0.2> 1000 7 12 1.7< 500 171.57 27 0.2
7.5 - 7.9 500 - 1000 31 15 0.5> 1000 15.23 30 2.0< 500 317.72 57 0.2
8.0 - 8.4 500 - 1000 152.54 54 0.4> 1000 79.34 123 1.6< 500 336.04 43 0.1
8.5 - 8.9 500 - 1000 51.768 29 0.6> 1000 69 111 1.6
Table 6.11: AADT vs. Width - Single Lane Pavement Southern District
For the double lane pavement width in the Southern district all three traffic flows
display a trend that indicates that as the width increases the amount of accidents
occurring also increases. Low flow shows a general trend where the accidents occurring
increase but can only be analysed up to 12.9 metres. The medium flow can only be
analysed up to 11.4 metres with the crash amounts for both low and medium flow again
being similar. High flow shows an increase for the whole road category but here is an
outlier found in the trend for the width category of 14.5 metres to 14.9 metres. It is also

68
shown again that the amount of crashes for high flow is higher than low and medium
flow.
Width AADT Length # Crashes Crashes/Km< 500 235.81 57 0.2
9.0 - 9.4 500 - 1000 131.46 48 0.4> 1000 349.55 452 1.3< 500 38.03 11 0.3
9.5 - 9.9 500 - 1000 30 22 0.7> 1000 96.32 195 2.0< 500 28.41 15 0.5
10.0 - 10.4 500 - 1000 33 14 0.4> 1000 191.88 389 2.0< 500 35.74 7 0.2
10.5 - 10.9 500 - 1000 21 10 0.5> 1000 84.68 222 2.6< 500 10.86 1 0.1
11.0 - 11.4 500 - 1000 4 5 1.3> 1000 78.14 146 1.9< 500 6.36 6 0.9
11.5 - 11.9 500 - 1000 1 0 0.0> 1000 44.34 117 2.6< 500 4.07 3 0.7
12.0 - 12.4 500 - 1000 1 0 0.0> 1000 34.53 66 1.9< 500 2.61 5 1.9
12.5 - 12.9 500 - 1000 0 0 0.0> 1000 17 69 4.1< 500 0 0 0.0
13.0 - 13.4 500 - 1000 1 3 3.0> 1000 13.17 90 6.8< 500 0 0 0.0
13.5 - 13.9 500 - 1000 1 2 2.0> 1000 10 77 7.7< 500 1 1 1.0
14.0 - 14.4 500 - 1000 0 0 0.0> 1000 4.72 49 10.4< 500 0.31 0 0.0
14.5 - 14.9 500 - 1000 1 1 1.0> 1000 3 10 3.3< 500 0 0 0.0
15.0 - 15.4 500 - 1000 0 0 0.0> 1000 5 43 8.6
Table 6.12: AADT vs. Width – Double Lane Pavement Southern District

69
6.6.3 Formation Width
Toowoomba and Gatton
The only road category that could be analysed for the Toowoomba and Gatton region
was the single lane formation. Below is Table 6.13 that displays the analysis of the data
for this road category.
Width AADT Length # Crashes Crashes/Km< 500 0 0 0.0
6.5 - 6.9 500 - 1000 7.57 1 0.1> 1000 2 3 1.5< 500 6 2 0.3
7.0 - 7.4 500 - 1000 3 1 0.3> 1000 3 12 4.0< 500 0 0 0.0
7.5 - 7.9 500 - 1000 4 1 0.3> 1000 8.23 25 3.0< 500 1 0 0.0
8.0 - 8.4 500 - 1000 18 8 0.4> 1000 27.23 43 1.6< 500 0 0 0.0
8.5 - 8.9 500 - 1000 4 3 0.8> 1000 12 40 3.3< 500 0 0 0.0
9.0 - 9.4 500 - 1000 6 1 0.2> 1000 22 91 4.1< 500 1 0 0.0
9.5 - 9.9 500 - 1000 0 0 0.0> 1000 11 44 4.0< 500 0 0 0.0
10.0 - 10.4 500 - 1000 1 0 0.0> 1000 31 123 4.0< 500 0 0 0.0
105. 10.9 500 - 1000 0 0 0.0> 1000 25 83 3.3
Table 6.13: AADT vs. Width - Single Lane Formation Toowoomba and Gatton
For the second time with a single lane road in the Toowoomba and Gatton region the
low flow category contains no data so is therefore unable to be analysed in this section.
Medium flow is able to be analysed up to 9.4 metres and shows and increase in the

70
amount of accidents happening however high flow still has more accidents occurring.
High flow does not show an increase but is steady thorough out the entire width of the
single lane formation.
Southern District
The two road categories that are able to be analysed for the formation width in the
Southern District. Table 6.14 contains the information from the single lane formation
and Table 6.14 is for the double lane analysis.
All three flow categories remain steady throughout the width of the single lane
formation. Medium flow can only be analysed from 5.5 metres on wards and high flow
from 6.5 metres. As with all the previous analysis in this section the high flow category
has more accidents occurring than the low and medium category which are both
comparable with each other.

71
Width AADT Length # Crashes Crashes/Km< 500 3.68 1 0.3
5.0 - 5.4 500 - 1000 0 0 0.0> 1000 0 0 0.0< 500 10.47 0 0.0
5.5 - 5.9 500 - 1000 6 1 0.2> 1000 0 0 0.0< 500 55.52 8 0.1
6.0 - 6.4 500 - 1000 3.67 0 0.0> 1000 0 0 0.0< 500 31.77 2 0.1
6.5 - 6.9 500 - 1000 14.57 2 0.1> 1000 4 6 1.5< 500 29.9 11 0.4
7.0 - 7.4 500 - 1000 27.59 5 0.2> 1000 7 12 1.7< 500 187.57 23 0.1
7.5 - 7.9 500 - 1000 30 15 0.5> 1000 13.23 29 2.2< 500 330.87 54 0.2
8.0 - 8.4 500 - 1000 143.54 52 0.4> 1000 83.34 129 1.5< 500 310.89 46 0.1
8.5 - 8.9 500 - 1000 56.768 31 0.5> 1000 72 121 1.7< 500 253.81 59 0.2
9.0 - 9.4 500 - 1000 139.46 49 0.4> 1000 345.55 438 1.3< 500 45.03 13 0.3
9.5 - 9.9 500 - 1000 29 22 0.8> 1000 98.32 197 2.0< 500 36.41 17 0.5
10.0 - 10.4 500 - 1000 32 13 0.4> 1000 186.88 382 2.0< 500 38.74 9 0.2
10.4 - 10.9 500 - 1000 22 11 0.5> 1000 83.68 214 2.6
Table 6.14: AADT vs. Width - Single Lane Formation Southern District
The double lane analysis can be seen in Table 6.15 below. The only flow category that
can be analysed is the high flow category as there is no data on medium flow and not
enough data for an accurate analysis to be conducted on low flow. High flow however
shows high amount of crashes that increases as the width increases.

72
Width AADT Length # Crashes Crashes/Km< 500 5.86 1 0.2
11.0 - 11.4 500 - 1000 3 4 1.3> 1000 83.14 168 2.0< 500 7.36 7 1.0
11.5 - 11.9 500 - 1000 0 0 0.0> 1000 42.34 113 2.7< 500 8.07 3 0.4
12.0 - 12.4 500 - 1000 1 0 0.0> 1000 35.53 68 1.9< 500 2.61 5 1.9
12.5 - 12.9 500 - 1000 0 0 0.0> 1000 16 60 3.8< 500 0 0 0.0
13.0 - 13.4 500 - 1000 1 3 3.0> 1000 13.17 90 6.8< 500 0 0 0.0
13.5 - 13.9 500 - 1000 1 2 2.0> 1000 10 77 7.7< 500 1 1 1.0
14.0 - 14.4 500 - 1000 0 0 0.0> 1000 4.72 49 10.4< 500 0.31 0 0.0
14.5 - 14.9 500 - 1000 1 1 1.0> 1000 4 36 9.0< 500 0 0 0.0
15.0 - 15.4 500 - 1000 0 0 0.0> 1000 4 17 4.3< 500 0 0 0.0
15.5 - 15.9 500 - 1000 0 0 0.0> 1000 1.27 18 14.2< 500 0 0 0.0
16.0 - 16.4 500 - 1000 0.41 1 2.4> 1000 5 99 19.8< 500 0.21 0 0.0
16.5 - 16.9 500 - 1000 0 0 0.0> 1000 1 36 36.0< 500 0 0 0.0
17.0 - 17.4 500 - 1000 0 0 0.0> 1000 1 24 24.0
Table 6.15: AADT vs. Width - Double Lane Formation Southern District

73
6.7 Chapter Summary
This chapter reported on the analysis of the factors relating to the road environment and
the frequency of road crashes. The factors that were analysed included seal width,
pavement width, formation width, speed limit zones and the AADT vs. Width.
Throughout the three width categories it was found that as the width increases the
amount of crashes also increases. In addition to this it was also seen that as the speed
limit increases the amount of crashes decreases. From the AADT vs. Width section it
was found that low and medium flow display low amounts of crashes when compared to
the amount of accidents occurring for high flow which has higher crash occurrences.

74
Chapter 7
Discussion of Results
7.1 Introduction
This chapter discusses the results gained from the previous two chapters. This includes
an analysis of the ‘tidal flow’ and road environment factors in relation to the frequency
of road crashes. Each section compares the results of these analyses for each study area.
Furthermore a report on any correlations that were found for each section is included.

75
7.2 Tidal Flow
I n the Toowoomba and Gatton region it was established that there the periods of 0 – 4
and 20 – 24 have a high crash rate despite a low traffic flow. This was likewise found
in the Southern District. From both of the study areas, particularly the Southern
District, it was noted that the period of 0 – 4 consistently had low traffic flows but high
crash rates that in many cases were the highest for the road.
In the Southern District it was found that the road 22A had crash rates throughout the
day that were much higher than any other road in the region the reasons for these are
thought to be because of a small traffic flow combined with a high number of crashes
causing a high crash rate. The traffic flow was lower than the average for the roads and
the number of crashes was also higher for this section of road.
It was concluded from the analysis of the Southern District and the Toowoomba and
Gatton region that a high traffic flow does not necessarily translate into a high crash
rate.
7.3 Road Environment
The analysis of the road environment in relation to road crashes required the analysis of
various factors and their relationship to the frequency of road crashes. Below, these
factors are analysed in an attempt to discover if particular features of these factors are
more likely to be present at an accident site.

76
7.3.1 Seal Width
No correlation could be found in the data from the Toowoomba and Gatton regions that
indicates a correlation between the seal width of the road and the amount of crashes on
these roads. However in the Southern District from the data that analysable it was
indicates for both double lane sealed shoulders and four lane sealed shoulders the
amount of accidents occurring does increase as the width of the seal of the road
increases.
From this section it was found that as the seal width increases the amount of accidents
also increases. This was only found throughout the Southern District on double lane
sealed shoulders and four lane shoulders. The other categories were not able to be
analysed due to insufficient data sets.
7.3.2 Pavement Width
This section analysed the width of the pavement and its relation to the amount of
crashes. The roads analysed were single lane roads and double lane roads but four lane
roads were disregarded. This is again because of insufficient lengths of road for this
road category in the data. Again it was found that the two types of roads analysed
indicated a correlation existed between crashes and the pavement of the road. These
correlations were also apparent in the data for the Toowoomba and Gatton region and
the Southern District.

77
The correlation that was found again suggests that as the width of the pavement
increases the amount of crashes also increases. However the trends that were found
sometimes were steady followed by a sudden increase as was the case with double lane
roads in the Southern District.
7.3.3 Formation Width
For the Toowoomba and Gatton region the only category of road that could be analysed
was the single lane formation. For the Southern District the single lane and double lane
formations could be analysed. The reason for the other categories not being able to be
analysed is the same as before with the lengths of road, for the formation widths, being
too short for an accurate investigation.
For the single lane formation in the Toowoomba and Gatton region the same correlation
was found as in the previous sections with the amount of crashes increasing with the
formation width increasing. The trends that were found for the two road types in the
Southern District data show a steady increase of the number of crashes as the formation
width increases.
7.3.4 Speed Limit Zones
Both the Toowoomba and Gatton region and Southern District displayed a conclusive
trend between the speed limit zone and the amount of crashes that occur in these zones.
The trend for both area shows that the amount of crashes decreases as the speed limit of
the road increases. However from the amount of crashes in 60 Km/h zones in the
Southern District 59% occurred in the Toowoomba and Gatton region. Furthermore

78
80% of the accidents in 100Km/h zones in the Southern District happened outside of
Toowoomba and Gatton. This suggests that most of the accidents in 60Km/h zones
occur in Toowoomba and Gatton and most accidents in 100Km/h zones happen outside
Toowoomba and Gatton.
7.3.5 AADT vs. Width
This section found that the higher the flow of the road the higher the amount of
accidents. Low and medium flow were found to have comparable amounts of accidents
occur on those roads but the high flow roads consistently had more accidents occurring.
Occasionally throughout the analysis a trend could be seen where as the width of the
road increased the number of accidents occurring also increased. However it was also
seen that as the width of the road increased the amount of accidents remained steady.
7.4 Chapter Summary
This chapter discussed the results gained from the previous two chapters. These results
included an analysis of the ‘tidal flow’ and road environment factors in relation to the
frequency of road crashes. Each section above compared the results of these analyses
for each study area.

79
Chapter 8
Conclusions and Further Work
8.1 Conclusions
From the tidal flow analysis it could be seen that a higher traffic flow did not
necessarily indicate that a higher crash rate would result. In fact the higher crash rates
occurred during 0 – 4 and 20 – 24 with these periods have a lower traffic flow. These
periods are known as the tired times. The higher crash rate may result from a number of
reasons. These reason could be that as these are the tired times the amount of accidents
are from drives getting tired and going to sleep at the wheel. The reason that the drivers
may go to sleep may be because of the low traffic flow does not make a driver
concentrate as much as normal.

80
The seal, pavement and formation width all show a correlation that indicated that when
the width of each of these factors increases the amount of accidents occurring also
increases. The factor from these three that influences the drivers the most is the seal
width followed by the formation width with the pavement width the factor affecting a
driver the least. It was also shown through the analysis of the width vs. AADT that the
amount of crashes occurring at very least remains steady as the width increases but
usually increases. This is an interesting finding as when the width of the road increases
the amount of accidents should decrease as there is a lot more margin for error by the
driver. One reason why this may occur is that when the road is narrow a driver
concentrates more and when the road width increases the driver relaxes and does not
pay as much attention as when the road was narrower.
From the width vs. AADT it was found that higher flow roads have more accidents
occurring than the low and medium flow roads. This is unsurprising as the more cars
there are on the road the higher the chances of an accident occurring.
The analysis of the speed limit zones produced interesting results that suggested that as
the speed limit raised the amount of accidents that occurred reduced. However it was
found that most 60 Km/h accidents were in the Toowoomba and Gatton region and the
100 Km/h accidents were outside of Toowoomba and Gatton region. A reason for
higher accidents occurring in 60 Km/h zones on main roads could be due to the fact that
some drivers slow down and some do not. This creates traffic flows with, generally,
half the traffic at one speed and the other half at another. This effect would increase the
likelihood of accidents occurring.

81
8.2 Further Work
Another factor that was not analysed in this project due to lack of data and time is
crashes that occur on curves compared to straight sections of road. This data is
available from main roads and would be interesting factor to analyse to complement the
work which has already been done.
Due to the initial crash data that was received covering four districts this analysis could
be reproduced looking at different a different district and focus areas. After this
analysis is complete the findings from the other districts analysis could be compared to
those found in this project. If this was completed it could be seen if the results found in
this district apply to a greater area.
An inadequacy of this project is the fact that the analysis conducted only covered the
main roads. An investigation could be completed along the same lines as this project
looking at the factors in the inner city. These factors could include footpath widths,
trees, power poles and other roadside hazards along with an analysis of the major
intersections.
The analysis of crash data in this project was very broad, disregarding the determined
cause of the crash and only looking at the road data at every crash location. It would be
interesting to analyse each crash individually to only analyse the accidents that have
been determined to have been caused by the road environment. Some problems that
may arise with undertaking this study is that because most accident are classified as
being caused by driver related characteristics, a minimal amount of data could be
analysed which would affect the integrity of the analysis.

82
List of References
Austroads 2003, Rural Road Design, Austroads Incorporated, Sydney.
Austroads 2004, Treatment of Crash Locations, PIRION Pty Ltd, Canberra.
Ayers, R. 2003, Transport Engineering Study Book 1, USQ Distance Education Centre,
Toowoomba, Qld.
Bureau of Transport and Communications Economics 1995, Evaluation of the Black
Spot Program, Australian Government Publishing Service, Canberra.
Bureau of Transport and Regional Economics 2003, ‘State spending on roads’,
Workingpaper 56, URL: www.bte.gov.au/docs/wp_56/WP56.pdf (27 August 2004).
Hutchinson, T. P. 1987, Road Accident Statistics, Rumsby Scientific Publishing,
Adelaide.

83
Kingaroy Shire Council 2004, 2002/2003 Annual Report, URL:
http://kingaroy.qld.gov.au (4 October 2004).
Kloeden C. N., McLean A. J., Baldock M. R. J. & Cockington A. J. T. 1999, ‘Severe
and Fatal Car Crashes Due to Roadside Hazards’, NHMRC Road Accident Research
Unit, University of Adelaide.
Main Roads 2004, District Maps, URL: www.mainroads.qld.gov.au, (19 October 2004).
NAASRA 1988, Guide to Traffic Engineering Practices: Road Crashes, Ambassador
Press Pty Ltd, Granville, NSW.
Queensland Transport 2002, Road Traffic Crashes in Queensland 2001, Queensland
Transport, Brisbane, QLD.
Road and Traffic Authority 1996, Road Environment Safety: A Practitioners Reference
Guide to Safer Roads, Road and Traffic Authority, Haymarket, NSW.
Symmons, M., Haworth, N. & Johnston, I. 2004, ‘Rural Road Safety – Overview of
Crash Statistics’, Monash University Accident Research Centre, Melbourne.
Toowoomba City Council 2004, ‘2002/2003 Annual Report’, URL:
http://www.toowoomba.qld.gov.au (4 October 2004).

84
Transport Accident Commission 2004, Statistics, URL: www.tac.vic.gov.au (7 April
2004).

85
Bibliography
De Veaux, R. D & Velleman, P. F 2004, Intro Stats, Pearson Education, Inc., United
States of America.
Moore, D. S. 2000, The Basic Practice of Statistics, 2nd edn, W H. Freeman and
Company, United States of America.
Pline, J. L. (ed.) 1999, Traffic Engineering Handbook, Institute of Transportation
Engineers, Washington.

86
Appendix A
Project Specification
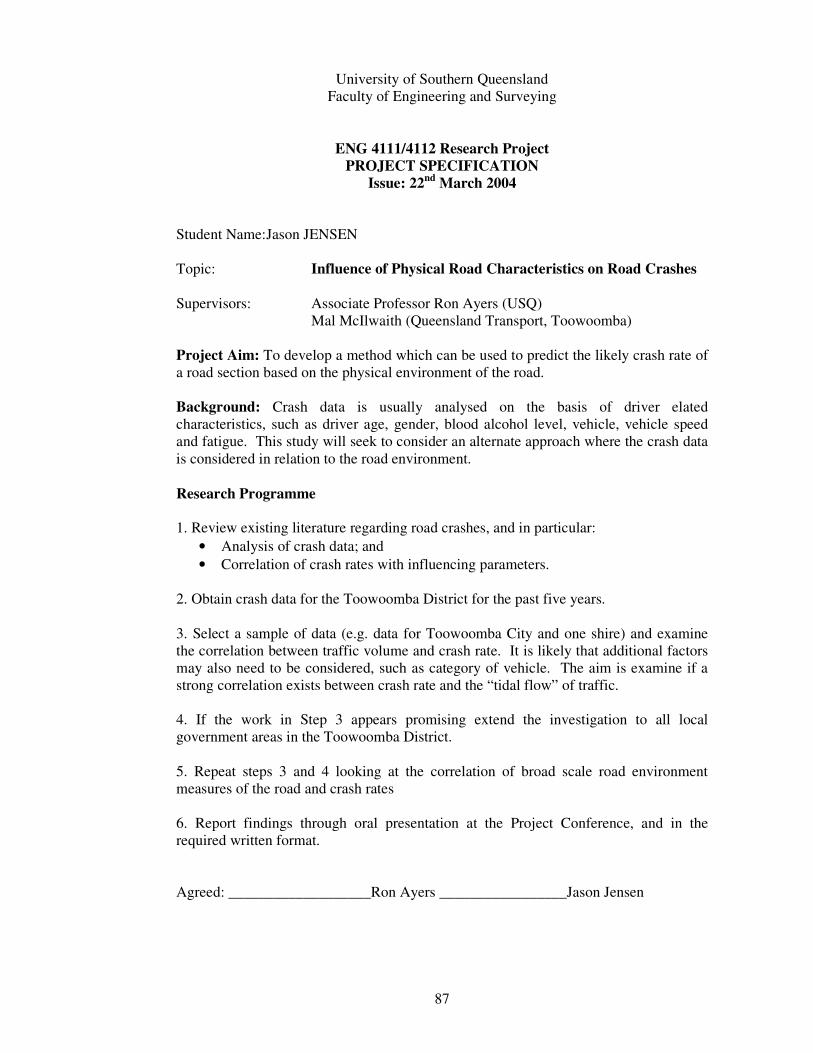
87
University of Southern Queensland Faculty of Engineering and Surveying
ENG 4111/4112 Research Project PROJECT SPECIFICATION
Issue: 22nd March 2004 Student Name: Jason JENSEN Topic: Influence of Physical Road Characteristics on Road Crashes Supervisors: Associate Professor Ron Ayers (USQ) Mal McIlwaith (Queensland Transport, Toowoomba) Project Aim: To develop a method which can be used to predict the likely crash rate of a road section based on the physical environment of the road. Background: Crash data is usually analysed on the basis of driver elated characteristics, such as driver age, gender, blood alcohol level, vehicle, vehicle speed and fatigue. This study will seek to consider an alternate approach where the crash data is considered in relation to the road environment. Research Programme 1. Review existing literature regarding road crashes, and in particular:
• Analysis of crash data; and • Correlation of crash rates with influencing parameters.
2. Obtain crash data for the Toowoomba District for the past five years. 3. Select a sample of data (e.g. data for Toowoomba City and one shire) and examine the correlation between traffic volume and crash rate. It is likely that additional factors may also need to be considered, such as category of vehicle. The aim is examine if a strong correlation exists between crash rate and the “tidal flow” of traffic. 4. If the work in Step 3 appears promising extend the investigation to all local government areas in the Toowoomba District. 5. Repeat steps 3 and 4 looking at the correlation of broad scale road environment measures of the road and crash rates 6. Report findings through oral presentation at the Project Conference, and in the required written format. Agreed: ___________________Ron Ayers _________________Jason Jensen

88
Appendix B
Southern District Road Classifications

89
B1 State Highways
Road Classification Road Name and Location 18A Warrego Highway (Ipswich – Toowoomba)
18B Warrego Highway (Toowoomba – Dalby)
18C Warrego Highway (Dalby – Miles)
22A New England Highway (Yarraman – Toowoomba)
22B New England Highway (Toowoomba – Warwick)
28A Gore Highway (Toowoomba – Millmerran)
28B Gore Highway (Millmerran – Goondiwindi)
35A Moonie Highway (Dalby – St. George)
40B D’Aguilar Highway (Kilcoy – Yarraman)
40C D’Aguilar Highway (Yarraman – Kingaroy)
41A Burnett Highway (Nanango – Goomeri)
42A Brisbane Valley Highway (Ipswich – Harlin)
45A Bunya Highway (Dalby – Kingaroy)
45B Bunya Highway (Kingaroy – Goomeri)

90
B2 Main Roads
Road Classification Road Name and Location
308 Rosewood – Laidley Road
311 Laidley – Plainlands Road
312 Gatton – Laidley Road
313 Gatton – Clifton Road
314 Gatton – Helidon Road
320 Charlton Connection Road
321 Drayton Connection Road
323 Oakey – Pittsworth Road
324 Toowoomba – Cecil Plains Road
325 Dalby – Cecil Plains Road
327 Pampas – Horraine Road
330 Felton – Clifton Road
331 Toowoomba – Karara Road
332 Pittsworth – Felton Road
335 Millmerran – Leyburn Road
337 Millmerran – Inglewood Road
340 Dalby – Kogan Road
341 Chinchilla – Tara Road
342 Kogan – Condamine Road
405 Esk – Kilcoy Road
410 Wivenhoe – Somerset Road
411 Coominya Connection Road
412 Forest Hill – Fernvale Road
414 Esk – Hampton Road
416 Dalby – Cooyar Road
417 Oakey – Cooyar Road
418 Pechey – Maclagan Road
419 Kingaroy – Cooyar Road
421 Dalby – Jandowae Road
422 Macalister – Bell Road
423 Jandowae Connection Road

91
Road Classification Road Name and Location
424 Kingaroy – Jandowae Road
426 Chinchilla – Wondai Road
428 Kingaroy – Burrandowan Road
429 Nanango – Tarong Road
435 Munduberra – Durong Road
436 Wondai – Proston Road
437 Murgon – Barambah Road
439 Murgon – Gayndah Road
491 Kilcoy – Murgon Road

92
B3 Secondary Roads
Road Classification Road Name and Location
3083 Mulgowie Road
3102 Greenmount – Hirstvale Road
3131 Mount Sylvia Road
3203 Bowenville – Norwin Road
3221 Brookstead – Norwin Road
3251 Millmerran – Cecil Plains Road
3304 Cambooya Connection Road
3308 Nobby Connection Road
3341 Greenmount Connection Road
3401 Daandine – Nandi Road
3402 Tara – Kogan Road
3403 Warra – Kogan Road
4023 Mount Glorious Road
4104 Murphy’s Creek Road
4144 Gatton – Esk Road
4161 Bunya Mountains Road
4163 Bunya Mountains – Maclagan Road
4196 Maidenwell – Bunya Mountains Road
4201 Warra – Canaga Creek Road
4202 Kingaroy – Barker’s Creek Road
4206 Memerambi – Gordonbrook Road
4261 Auburn Road
4356 Proston – Boondooma Road
4364 Boondooma Dam Road
4365 Byee Road

93
Appendix C
NAASRA Road Classification System

94
C1 Rural Areas
Class 1 Those roads which form the principal avenue for communications between major regions of Australia, including direct connections between capital cities. Class 2 Those roads, not being Class 1, whose main function is to form the principal avenue of communication for movements: •Between capital city and adjoining states and their capital cities; or •Between a capital city and key towns; or •Between key towns. Class 3 Those roads, not being Class 1 or 2, whose main function is to form an avenue of communication for movements: •Between important centres and the Class 1 and Class 2 roads and/or key towns; or •Between important centres; or •Of an arterial nature within a town in a rural area. Class 4 Those roads, not being of Class 1, 2 or 3, whose main function is to provide access to abutting property (including property within a town in a rural area). Class 5 Those roads which provide almost exclusively for one activity or function which cannot be assigned to Classes 1, 2, 3 or 4.

95
C2 Urban Areas
Class 6 Those roads whose main function is to perform the principal avenue of communication for massive traffic movements. Class 7 Those roads, not being Class 6, whose main function is to supplement the Class 6 roads in providing for traffic movements or which distribute traffic to local street systems. Class 8 Those roads not being Class 6 or 7, whose main function is to provide access to abutting property. Class 9 Those roads which provide almost exclusively for one activity or function and which cannot be assigned to Class 6, 7 or 8.

96
Appendix D
Crash Data

97

98
Appendix E
Road Data

99