Influence of physical forcing on the spatial distribution ...
14
MARINE ECOLOGY PROGRESS SERIES Mar. Ecol. Prog. Ser. Published January 26 Influence of physical forcing on the spatial distribution of marine fauna near Resolution Island (eastern Hudson Strait) ' Department of Fisheries and Oceans, Arctic Biological Station, 555 Boul. Saint-Pierre, Sainte-Anne de Bellevue, Quebec, Canada H9X 3R4 Department of Fisheries and Oceans, Freshwater Institute, 501 University Crescent, Winnipeg. Manitoba, Canada R3T 2N6 Department of Atmospheric and Oceanic Sciences, McGill University, 805 Sherbrooke St. West, Montreal, Quebec, Canada H3A 2K6 ABSTRACT: The vertical and horizontal distribution of zooplankton, pandalid shrimp and fish were studied off Resolution Island (eastern Hudson Strait) using a multistage plankton sampler (BIONESS), acoustic echo integration and bottom trawling. Zooplankton concentration was highest above a sub- marine trench extending into the study area. The depth of the center of mass of the vertical distribution of most zooplankters was related to total depth. In addition, the die1 vertical distribution of shrimps and mysids was correlated with light levels, suggesting active movements. Die1 vertical movements of chaetognaths and copepods were correlated with tidal amplitude and isopycnal depth, suggesting passive displacement. Horizontally, shrimp and fish biomass was concentrated in and above the trench, indicating retention within the benthic boundary layer. It is postulated that the combination of bathy- metric features and current conditions off Resolution Island generates a persistent eddy-like structure leading to the passive accumulation of the zooplanktonic prey of shrimp. Local retention of pandalid shrimp is attained by their daytime concentration in the deeper waters of the trench within the benthic boundary layer and their retention within the gyre during their nighttime planktonic feeding forays. INTRODUCTION Technological improvements in biological sampling gear have allowed more detailed study of oceanic phenomena occurring at smaller spatial and temporal scales, bringing a new awareness of the inherent vari- ability in marine systems. In this respect, acoustic sampling was shown to be a powerful tool (Sprong et al. 1990, Crawford et al. 1992) for high-resolution studies of small-scale processes (Denman & Powell 1984, Legendre & Demers 1984). Thls approach focusses on how and why the biological patterns develop and what maintains them (see the review of Haury & Pieper Present addresses: ' Environnement Canada, Centre Saint-Laurent, 105 ave. McGi11, 4' et., Montreal, Quebec. Canada H2Y 2E7 " Waquoit Bay National Estuarine Research Reserve, PO Box 3092, Waquoit, Massachussetts 02536, USA 1987). Ultimately, the distribution of organisms is the end-product of the interactions among animal morphol- ogy, behaviour and physical forces, all operating at dif- ferent scales. There is growing evidence for increased residence time in eddies generated by bathymetric and coastline features (e.g. Boucher et al. 1987). In addition, shelf break and areas of bathymetric irregularities are in- creasingly reported as sites of high zooplankton con- centrations (Herman et al. 1981, Le Fevre & Frontier 1988). Turbulence, tidal currents, internal waves, fronts and upwelling can also alter the vertical distribution of zooplankters (see Mann & Lazier 1991). The phenomena generating variability in the horizontal distribution at a 1 to 100 km scale can be used to determine retention mechanisms in distinct areas, which is of crucial impor- tance for fisheries stock definition (Sinclair & Iles 1989). This study examines the horizontal and vertical dis- tribution of organisms in the highly energetic area of O Inter-Research 1993
Transcript of Influence of physical forcing on the spatial distribution ...

MARINE ECOLOGY PROGRESS SERIES Mar. Ecol. Prog. Ser. Published January 26
Influence of physical forcing on the spatial distribution of marine fauna near Resolution Island (eastern Hudson Strait)
' Department of Fisheries and Oceans, Arctic Biological Station, 555 Boul. Saint-Pierre, Sainte-Anne de Bellevue, Quebec, Canada H9X 3R4
Department of Fisheries and Oceans, Freshwater Institute, 501 University Crescent, Winnipeg. Manitoba, Canada R3T 2N6 Department of Atmospheric and Oceanic Sciences, McGill University, 805 Sherbrooke St. West, Montreal, Quebec,
Canada H3A 2K6
ABSTRACT: The vertical and horizontal distribution of zooplankton, pandalid shrimp and fish were studied off Resolution Island (eastern Hudson Strait) using a multistage plankton sampler (BIONESS), acoustic echo integration and bottom trawling. Zooplankton concentration was highest above a sub- marine trench extending into the study area. The depth of the center of mass of the vertical distribution of most zooplankters was related to total depth. In addition, the die1 vertical distribution of shrimps and mysids was correlated with light levels, suggesting active movements. Die1 vertical movements of chaetognaths and copepods were correlated with tidal amplitude and isopycnal depth, suggesting passive displacement. Horizontally, shrimp and fish biomass was concentrated in and above the trench, indicating retention within the benthic boundary layer. It is postulated that the combination of bathy- metric features and current conditions off Resolution Island generates a persistent eddy-like structure leading to the passive accumulation of the zooplanktonic prey of shrimp. Local retention of pandalid shrimp is attained by their daytime concentration in the deeper waters of the trench within the benthic boundary layer and their retention within the gyre during their nighttime planktonic feeding forays.
INTRODUCTION
Technological improvements in biological sampling gear have allowed more detailed study of oceanic phenomena occurring at smaller spatial and temporal scales, bringing a new awareness of the inherent vari- ability in marine systems. In this respect, acoustic sampling was shown to be a powerful tool (Sprong et al. 1990, Crawford et al. 1992) for high-resolution studies of small-scale processes (Denman & Powell 1984, Legendre & Demers 1984). Thls approach focusses on how and why the biological patterns develop and what maintains them (see the review of Haury & Pieper
Present addresses: ' Environnement Canada, Centre Saint-Laurent, 105 ave.
McGi11, 4' et., Montreal, Quebec. Canada H2Y 2E7 " Waquoit Bay National Estuarine Research Reserve, PO Box
3092, Waquoit, Massachussetts 02536, USA
1987). Ultimately, the distribution of organisms is the end-product of the interactions among animal morphol- ogy, behaviour and physical forces, all operating at dif- ferent scales.
There is growing evidence for increased residence time in eddies generated by bathymetric and coastline features (e.g. Boucher et al. 1987). In addition, shelf break and areas of bathymetric irregularities are in- creasingly reported as sites of high zooplankton con- centrations (Herman et al. 1981, Le Fevre & Frontier 1988). Turbulence, tidal currents, internal waves, fronts and upwelling can also alter the vertical distribution of zooplankters (see Mann & Lazier 1991). The phenomena generating variability in the horizontal distribution at a 1 to 100 km scale can be used to determine retention mechanisms in distinct areas, which is of crucial impor- tance for fisheries stock definition (Sinclair & Iles 1989).
This study examines the horizontal and vertical dis- tribution of organisms in the highly energetic area of
O Inter-Research 1993

2 Mar. Ecol. Prog. Ser. 92: 1-14, 1993
eastern Hudson Strait and the physical processes that may be responsible for the local retention of micro- and macrozooplankters. Data were originally gathered to study the distribution and feeding of shrimp Pandalus montagui during their movements off the bottom (Crawford et al. 1992, Hudon et al. 1992). An a postenori examination of data suggested the influence of bathymetry on the meso-scale (km) distribution of pelagic and migratory zooplankters over a wide range of sizes, which prompted the present analysis.
STUDY AREA
Hudson Strait extends over 750 km in length from its eastern boundary with the Labrador Sea to its western connection with Foxe Channel (Fig. 1). It acts as a tran- sition zone between the less saline waters of Hudson Bay and the more oceanic Labrador Sea (Drinkwater 1986). The average width of the strait is 150 km, with a minimum of 70 km near Resolution Island. Mid- channel depths range from 300 to 400 m, with a deep basin (1000 m) just west of its eastern boundary. A sill (<400 m) marks the eastern end of the basin. Off Resolution Island, tidal amplitudes are in the order of 6 to 9.5 m (Canadian Hydrographic Service 1988) and residual surface currents are about 15 to 20 cm S-' (Drinkwater 1986). Sea ice usually covers much of the strait from mid-December to July.
Over the last 20 yr, data from hydrographic observa- tions, current meter moorings, drogues and satellite imagery have been used to characterize the c~rculation and water mass properties in Hudson Strait (LeBlond et al. 1981, Drinkwater 1983, 1986, 1988, 1990, Cher- niawsky & LeBlond 1987). Waters near the northwest part of Resolution Island are under the influence of the Baffin Island current, which enters Hudson Strait from the north via Gabriel Strait (Fig. 1). Density stratifica- tion parameters calculated for this area identify it as a transition zone (Drinkwater & Jones 1987) with a frontal area in Gabriel Strait, where swift tidal currents are observed (Canadian Hydrographic Service 1983). Near the southwest edge of the island, a bank (<300 m) is contiguous with the deepening waters at the entrance to Hudson Strait, where intense mixing also takes place (Drinkwater & Jones 1987).
Water temperature increases with depth below 200 m to reach a maximum of nearly 2 "C around 400 m, reflecting the influence of the deeper Labrador Sea water. This water mass is transported into the Strait through the deep central trench extending along the axis of eastern Hudson Strait (Drinkwater 1986). Spatial differences in the rates of vertical mixing by the tides led Griffiths et al. (1981) to predict the presence of fronts southeast of Resolution Island. Drinkwater &
Jones (1987) found evidence for these tidal fronts and documented their influence on nutrients and chloro- phyll. The mixing of Arctic and Labrador Sea waters occurs off the southwest edge of the island across the mouth of Hudson Strait, and is characterized by a frontal region of highly mixed waters and high near- surface nitrate and chlorophyll concentrations (Drink- water & Jones 1987). This area coincides with the loca- tion of commercially exploited shrimp concentrations in eastern Hudson Strait (Hudon 1990), suggesting that the distribution of the living resources may be physi- cally controlled.
MATERIAL AND METHODS
Sampling. Sampling took place from August 22 to September 2, 1988, in an 800 km2 study area west of Resolution Island (Fig. l), where high shrimp catches by the commercial fishery had been made in previous years (Hudon 1990). An acoustic survey of the study area was made using a 120 kHz single-beam trans- ducer towed 60 to 100 m below the surface. The survey was designed to study the distribution of shrimp in the study area, while accounting for their die1 vertical migration off the bottom. Two target strengths derived from a n examination of the literature were used in estimating shrimp biomass. Specific details are pro- vided in Crawford et al. (1992). Acoustic observations were also conducted simultaneously during the BIONESS sampling (see below).
The abundance and distribution of demersal fish and shrimp in the study area derived from the acoustic survey were supplemented by trawling as a means to groundtruth the data. Twenty-four bottom trawl tows were made using a Sputnik 1600 shrimp trawl with a 13 mm mesh lining in the codend (Parsons et al. 1990). Tow data included the date, time, position (lat., long.), depth, and light intensity. Predominant species were identified, weighed, measured, and their abundance was standardized to a 0.5 h tow duration. The horizon- tal distribution of shrimp and fish captures (kg per standard 0.5 h tow) over the study area was mapped (Crawford & Fox 1992).
The small-scale vertical distribution of zooplankton at 3 locations in the study area was studied with a Bedford Institute of Oceanography Net and Environmental Sensing System (BIONESS; Sameoto et al. 1980). The sampler was fitted with an Applied Microsystems salinity-temperature-depth (STD) recorder BIONESS sampling was conducted every 2 h, for 3 series of 13, 27 and 27 h respectively (8, 13, and 13 sets respectively). Each BIONESS set was made at about 3 m S-', using nine l-m2-aperture nets (five of 500 and four of 333 pm mesh). The descending part of each set was made with

Hudon et al.: Influence of physical forc~ng on fauna1 distribution
all nets closed and was used to obtain an STD profile. The first net was opened at a mean height of 12.5 m above the bottom, and sampled upwards over a 25 m layer. The next 6 nets were opened sequentially at each 25 m interval, and the final 2 nets sampled a 50 m stratum, the last obliquely to the surface. Each net was open for about 3 min, filtering approximately 450 m3 of water. Filtering efficiency, calculated as the ratio of internal to external flowmeter values, always exceeded 65 %. A total of 34 sets (306 samples) were made. Tide ele- vation (m) at the beginning of each set was derived from tide tables (Canadian Hydro-
- graphic Service 1988). Surface light inten-
UNGAVA B A Y sity was measured at the beginning of each set with a photometer (Gossen Luna 6).
The first BIONESS series of sets were made with 500 pm mesh nets sampling the deep layer (nets 1 to 5, bottom to 250 m) , and 333 pm mesh nets sampling the sur- face layer (nets 6 to 9, 200 m to surface). The order of the nets was inverted for the third series, to account for potential bias in the vertical distribution of smallest zoo- plankton. Zooplankton samples were preserved in 10 % formalin, sorted into major taxonomical groups (or by species where possible), counted and weighed (wet weight; to nearest 0.01 g) after removing excess water by holding on a 333 pm nitex sieve. For each sample (i.e. the contents of one net), the numerically dominant species in each major group was 6, recorded. The abundance of individual
66O 65' instars of 5 abundant copepod species was
in a subsample each Fig. 1 (a) Location of the study area , west of Resolution Island, in eastern For each commonly encountered cope- Hudson Strait (inset). Arrows indicate the d i rec t~on of mean currents podite stage (5 species), as well as for the (adapted from Drinkwater 1986). The study area (pentagon) where acoustics
10 macrozooplankters most frequently and trawling were carned out was based on the sltes of large shrimp catches in previous years. (b) Locations of BIONESS Serles I, I1 and I11 with respect
encountered, an individual wet weight was to the bathyrnetry (meters) determined by weighing several (2 to 829) animals originating from a number (2 to 9) of samples. The copepodite stages of the 5 most common Pearson r correlations between the ZCMs of the species were enumerated. Densities of each group of different groups were calculated to determine if their zooplankters were calculated in mg m-3 for each sam- center of mass oscillated synchronously in the water ple, and used for further calculations. column. The occurrence of differences of ZCM between
Data analyses. The depth of the center of mass BIONESS series for each group of organisms, and IZCM) of zooplankton was calculated as: between each group for all series, was tested with l-way
ANOVAs. ZCM values were square-root transformed to ZCM = pi z,
homogenize the variance between groups. where pi = the proportion of the total biomass of organ- The invertebrates collected in the BIONESS be- isms caught withln the ith depth interval (C pi = 1); longed to 11 taxonomical groups, among which size and zi = the mid-depth of the ith interval. and swimming abilities varied widely. Relations be-

4 Mar. Ecol. Prog. Ser. 92: 1-14. 1993
tween swimming/sinking speed and wet weight were using l-way ANOVAs made on loglo ( x + l ) trans- derived from the literature. Measurements of cruising formed concentrations (mg wet weight m-3) between speeds of longer durations were preferred to short- BIONESS series. term measures. For crustaceans, the speed of swim- ming upwards was estimated from a linear regression between long-duration (>30 min) speed measure- RESULTS ments (log,, cm S-') reported for various species (Hardy & Bainbridge 1954) and their estimated aver- Physical conditions age wet weight (loglo mg). Passive sinking speed was estimated from the rough value of 1 body length S-' Acoustic observations indicated that the 3 BIONESS (Rudyakov & Tseitlin 1980). series were located in areas of different bottom topo-
Non-parametric correlations (Spearman rank) were graphy: Series I and I1 were done at the edge and in the calculated between physical (total depth, light inten- deep part (respectively) of a trench cutting across the sity, tide elevation, isopycnal depth) and biological bank, whereas Series I11 was located on the same bank (ZCM) variables for different groups. Horizontal differ- away from the trench (Figs. l b & 2a). All 3 series con- ences in zooplankton concentrations were detected sisted in nighttime and daytime sets (Fig. 2b). Dusk
started at about 18:00 h local time, and complete darkness was observed by
I II m 21:30 h. Morning intensities increased
- loo z? " a, 150
;---.-. .---. . ' , . . ,. , . ' . I . . . . , . ' I . S .
200 S
250 D
300
350
400 -
rapidly between 05:OO and 08:OO h. Depth of lsopycnal 27.0 The study occurred during spring L@&hp tides with maximum amplitude of 8 m
in Acadia Cove (Resolution Island) on August 30 (Canadian Hydrographic Service 1988). Tidal amplitudes were
, . . , - - - . - 4 to 5, 6 to 8 and 5 to 7 m during BIO- . . - . '.---., . Total depth NESS Series I , I1 and 111, respectively
(Fig. 2c). STD profiles made concur- rently with biological sampling indi-
--
-- p -- ; - - --
. . . 4 8 12 20 00 4 8 12 16 12 16 20 00 4 8 12
cated the predominance of well-mixed b 70 - X
waters throughout the study area, but 3 2 60 coverage was insufficient to deter- i?
50 mine the occurrence of any large-scale S retentive structure. A positive corre- 2 40 - lation was observed between tempera- g 30 ture and salinity at the bottom (r = a, 20 C .-
Surface light intensi 0.878, n = 34, p = 0.0001). Isopycnal + r 10 C3, .-
depth (U, = 27.0) was negatively corre- 2
o lated to bottom temperature (r = -0.649, 4 8 12 20 00 4 8 12 16 12 16 20 00 4 8 12 n = 34, p = 0.0001) and salinity (r =
-0.535, n = 34, p = 0.0001.). Calculation Tidal amplitude of partial correlation coefficients
showed that only temperature exerted a significant influence on isopycnal
was depth, held once constant the effect (rs,, of = salinity 0.1418, p = 0.6237; rm., = -0.7748, p = 0.0109). Tidal amplitude, as determined from the tables, was not correlated with any
C 8 -
4 8 12 20 00 4 8 1 2 16 12 1 6 20 00 4 8 12 other physical variable.
Sampling time (hour) In addition to the semi-diurnal periodicity of the isopycnal oscillations,
Fig. 2. Physical conditions during sampling for vertical distribution of zooplankton during the 3 consecutive BIONESS time series. (a) Total depth and depth of iso- there was evidence of higher frequency
pycnal 27.0 at the beginning of each set. (b) Surface l~gh t intensity. (c) Tidal and shoaling the 27.0 amplitude. The time interval between successive data polnts is approximately 2 h isopleths (Fig. 2a). Readily apparent in
a,
+ 3 E 3
2 .- I .. 0 - L :
;!A::_':::::-'

Hudon et al.: Influence of physical forcing on fauna1 distribution
all 3 series is the weak stratification of the water column and the large amplitude of the vertical oscillations of the density field. Density differences over the entire water column were generally less than 0.8 U, units.
Differences among series suggested that the shoal- ing of isopleths might be related to spatial rather than temporal variability. Mean cr, values for the second series were intermediate to
Series I and 111 (14.36 and 16.29 g m-2, respectively). This difference persisted when the concentrations of organ- isms were compared per unit of volume (Table 2). BIONESS Series 11, which was located just above the trough, exhibited the highest average concentrations of shrimp, hyperiid amphipods, euphausiids, and cope-
those before and after. At mid-depth, peak to peak values of 150 m for the 27.0 U, isopleth were observed in the second series. In computing the mean density at 75, 150 and 200 m for each series, one finds a positive difference of 0.22 to 0.23 U, units between the first and third series at all 3 depths.
Horizontal distribution of organisms off Resolution Island
Trawl and acoustic data independently showed that shrimp were concentrated in 2 portions of the study area. Highest con- centrations were found in the southern corner (the deepest part of the study area), whereas a lesser concentration was located about 18 km away, near the center of the study area (Fig. 3). Since the distri- butions using each gear were generated from data collected as much as 1 wk apart, their similarity suggests that the honzon- tal distribution was fairly stable for this period and indicates a possible link be- tween shrimp density and bathymetric features. Several species of demersal and pelagic fishes exhibited higher densities in the areas of shrimp concentration as well (Fig. 3) . The areas of shrimp and fish concentrations correspond to 2 areas of different bottom topography: a deep (>300 m) trench at the southeastern end and its shallower (250 to 300 m) continua- tion towards a central bank (Fig. l).
Zooplankton species composition and abundance
The distribution of zooplankters col- lected in the BIONESS samples (Table 1) also showed considerable horizontal patch- iness. Total wet weight per unit of sea surface area was significantly higher (25.12 g m->) for BIONESS Series I1 than for
Fig. 3. Horizontal distribution (density contour isopleths and data points are in kg wet weight per 0.5 h tow) of invertebrates and fish in the study area interpolated from Sputnik trawl catches (except for b). (a) Pandalus montagui, (b) total biomass from acoustic data, (c) jellyfish, (d) Arctic cod Boreogadus saida, (e) Nybelin's sculpin Triglops nybelini, (f) Northern alli- gatorfish Aspidophoroides olriki, (g) spiny lumpsucker Eumicrotremus
spinosus. (h) deepwater redfish Sebastes spp.

6 tvlar. Ecol. Prog. Ser 92: 1-14, 1993
Table 1. List of organlsrns captured in the BIONESS (B) and in the bottom trawl (T). Species in bold prlnt were the most common species in each group. Where appropnate, the life stage of the organism IS ~nd~ca ted (L: larva, J: juvede ; A: adult)
Phylum Genus Species B T
Cnidaria Aglantha Atolla
Ctenophora Beroe
Chaetognatha Sagltta Sagitta Eukrohnia
Annelida Tomopteris Polychaeta Autolytus
Arthropoda Ostracoda Conchoecia
Conchoecia
Copepoda C a k n u s Calan us Calanus ~LIelliu'id Bradyidius Pseudocalanus Microcalanus Scolecithrice1la Ziichseia Oithona Heterorha bdus
Malacostraca Boreomysis
Mysidacea Mysis Meterythrops
Amphipoda Themisto Themisto Themisto Hyperia Onlsimus Gammarus Hallrages
Euphausiacea Meganyctiphanes Th ysanoessa Thysanoessa Thysanoessa
Decapoda Pandalus Pandalus
Mollusca Clione Gastropoda Spiratella
Cephalopoda Gonatus
Vertebrata Osteichthyes Triglops
Myoxocephalus Sebastes Llparis Hippoglossoides Triglops Reinhardtius Bathylagus Liparis Gadus
Gonostomattdae
Myctophidae
digitale (0. F. Miiller) + SPP. cucumis Fabricius? + elegans Verrill + maxima (Connant) + hamafa (Mobius) + septentrionalis Steenstrup + SPP. +
elegans Sars borealis Sars
glacialis Jaschnov + finmarchicus (Gunnerus) + hyperboreus Kroyer + io17g-a (iibbock) + similis (G. 0. Sars) + n~inu tus (Krayer) + puslllus G. 0. Sars + minor (Brady) + norvegica Socck similis Claus + norvegicus (Boeck) + arctica (Krayer) + polaris Holrnquist + robusta S. I . Smith + compressa Goes + libellula (Lichtenstein) + abyssorurn Boeck + galba (Montagu) + litoralis (Krayer) + setosus Dementieva + tulvocinctus (M. Sars) + norvegica ( M . Sars) + + inermis (Krayer) + + longicaudata (Kreyer) + raschi (M. Sars) + montagui (Kreyer) + A borealis (Krsyer) + A
limacina (Phipps) + helicina (Phipps) + fabricii (Lichtenstein)? J A
nybelini Jensen J , A scorpius Linne L SPP. J fa bricii Krayer L, J , A pla tessoides (Fabricius) L murrrayi Gunther J hippoglossoides (Walbum) L euryops Goode & Bean L tunicatus Reinhardt L SPP. L
pods (Table 2) . Copepods (73 % by weight), shrimp (Pandalus montagui, 11 Oh), amphipods (mostly Themisto spp., 10 %) and chaetognaths (mostly Eukhronia hamata, 4 %) comprised most of the total biomass. Among cope- pods, specimens > l mm accounted for 88 % of copepod biomass (Calanus finmarchicuslglacialis complex and C. hyperboreus).
The ZCM of each group of organ- isms (except cnidarians; ANOVA, F = 5.24, 2 df, p = 0.019) did not differ between series, allowing the results from the 3 BIONESS series to be pooled. The depth distributions varied markedly among groups of organisms (ANOVA, F = 33.78, 7 df, p = 0.0001) (Fig. 4A). The ZCM of shrimps (marked with the letters ab on Fig. 4A) over- lapped with that of mysids (group a ) and chaetognaths (group b), but was significantly deeper than all other groups (c to f ) . Cnidarians (group d), hyperiid amphipods (group e ) and pteropods (group f ) were found in water significantly shallower than the others. The actual depth range of each group was much wider than ZCM values, since the latter repre- sents a weighted average of the over- all depth distribution of the organisms. This suggested that, although the bulk of individuals of each group (ex- pressed by the ZCM values) main- tained itself at a 'preferred' depth (related to feeding or physiology), a small proportion of the animals (expressed by the total range of occur- rence) was dispersed throughout the water column by other factors (such as vertical advection).
The ZCM exhibited ontogenetic- related variations for 3 of the copepod species. Early copepodite stages of Calanus finmarchicus/glacialis com- plex, C. hyperboreus and Pseudo- calanus spp. were found in shallower water than the later copepodite and adult stages (Fig. 4B). The depth range of juvenile C. finmarchicus/ glacialis (C1 to CIII) var~ed by ? 35 m about the mean depth of 50 m. Early copepod stages tended to occur in a narrower depth range (upper 150 m)

Hudon et al.. Influence of physical forc~ng on fauna1 distnbution 7
Table 2. Mean concentration (mg m ' wet weight) sampled than the later stages, which became increasingly over the entire water column for each major zooplankter for scattered as their ZCM moved down the water each BIONESS series. One-way ANOVAs were computed on column, loglo ( x + l ) transformed data. Bold values are significantly higher than the others at the specified probability level. ns: non-significant; '<0.05, significant; " ~ 0 . 0 1 , highly
significant; "' < 0.001, very highly significant Die1 cycle of vertical distribution
Series
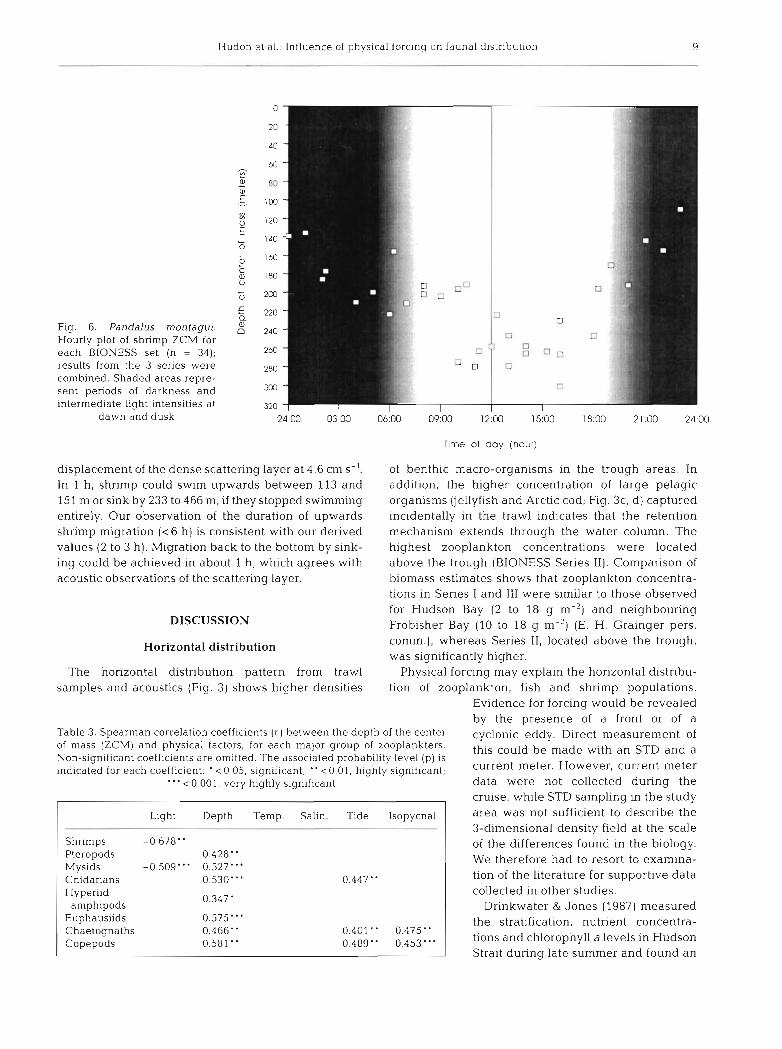
P I The bulk of shrimp biomass oscillated daily between I I I 111 100 and 300 m (Figs. 5 & 6). The ZCM of shrimp
. . Shrimps 4.48 14.11 3.99 Pteropods 0.38 0.83 0.78 ns Mvsids 0.06 0.11 0.11 ns
1 N u m b e r of sets - 0 12
became progressively deeper in the morning hours, reaching its deepest point between 10:OO and 15:OO h (Fig. 6). Light appeared to be the primary factor in
Cnidarians 0.13 0.25 0.23 ns Hyperiid
5.17 13.31 5.23 . . . amphipods . . . Euphausiids 0.08 0.30 0.28 Chaetognaths 1.80 2.66 2.82 Copepods 41.62 55.96 48.88 Total 53.83 87.69 62.64
i t r - I. r
l E%= - er-
C ? D "
W U S .
l 3
ab
determining the ZCM of shrimp (Table 3). Mysids, cnidarians, hyperiid amphlpods and euphau-
siids were captured at shallower depths at the onset of darkness (Fig. 5C to F). Pteropods had an erratic pattern with respect to light, changing from one series to the other. For all groups except shrimp, ZCM was primarily correlated with total depth (Table 3), suggesting vertical
Fig. 4. Vertical range of ZCM ob- served during the 3 BIONESS series for (A) major groups of macrozoo- plankters and (B) copepodite stages for the 5 most abundant copepod species. Groups of macrozooplank- ters distributed at significantly dif- ferent ZCMs are identified by differ- ent letters (see text for more detailed explanation). The line between copepodite stages links the mean ZCM values, showing the progres-
sive descent of older stages
n , N u m b e r ofsets
~ u m w ~ w u m w ~ w ~ n m ~ v w m ~ v w n m w v w
Calanus linmarchicus I glacialis Caldnus hyperboreus Metridia longa Pscudocalanus spp Euchaeta norvegica
Mar. Ecol. Prog. Ser. 92: 1-14, 1993
130 150
150
200
200
BIONESS SERIES BIONESS SERIES
U TIME (HOURS) 0 12
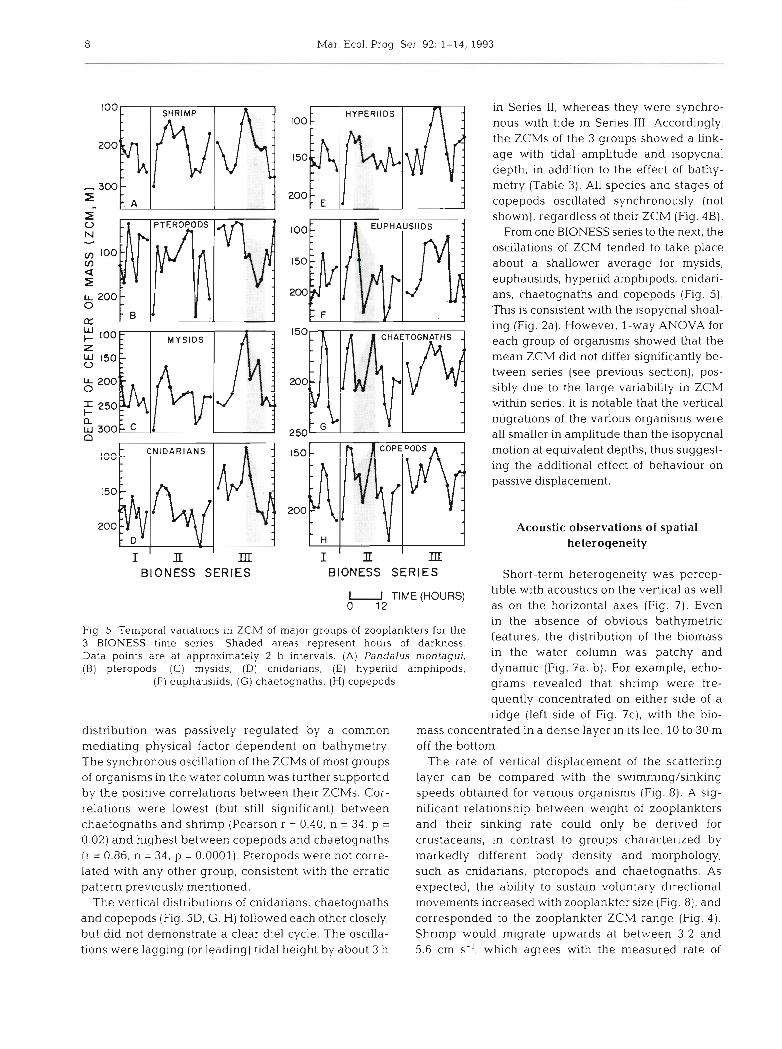
Fig. 5 . Temporal variations in ZCM of major groups of zooplankters for the 3 BlONESS time series. Shaded areas represent hours of darkness. Data points are at approximately 2 h intervals. (A) Pandalus montagui. (B) pteropods, (C) rnysids, (D) cnidarians. (E) hyperiid arnphipods,
(F) euphausiids, (G) chaetognaths, (H) copepods
distribution was passively regulated by a common mediating physical factor dependent on bathymetry. The synchronous oscillation of the ZCMs of most groups of organisms in the water column was further supported by the positive correlations between their ZCMs. Cor- relations were lowest (but still significant) between chaetognaths and shrimp (Pearson r = 0.40, n = 34, p =
0.02) and highest between copepods and chaetognaths (r = 0.86, n = 34, p = 0.0001). Pteropods were not corre- lated with any other group, consistent with the erratic pattern previously mentioned.
The vertical distributions of cnidarians, chaetognaths and copepods (Fig. 5D, G, H) followed each other closely, but did not demonstrate a clear die], cycle. The oscilla- tions were lagging (or leading) tidal height by about 3 h
in Series 11, whereas they were synchro- nous with tide in Series 111. Accordingly, the ZCMs of the 3 groups showed a link- age with tidal amplitude and isopycnal depth, in addition to the effect of bathy- metry (Table 3). All species and stages of copepods oscillated synchronously (not shown), regardless of their ZCM (Fig. 4B) .
From one BIONESS series to the next, the oscillations of ZCM tended to take place about a shallower average for mysids, euphausiids, hyperiid amphipods, cnidari- ans, chaetognaths and copepods (Fig. 5). This is consistent with the isopycnal shoal- ing (Fig. 2a). However, l-way ANOVA for each group of organisms showed that the mean ZCM did not differ significantly be- tween series (see previous section), pos- sibly due to the large variability in ZCM within series. It is notable that the vertical migrations of the various organisms were all smaller in amplitude than the isopycnal motion at equivalent depths, thus suggest- ing the additional effect of behaviour on passive displacement.
Acoustic observations of spatial heterogeneity
Short-term heterogeneity was percep- tible with acoustics on the vertical as well as on the horizontal axes (Fig. 7). Even in the absence of obvious bathymetric features, the distribution of the biomass in the water column was patchy and dynamic (Fig. ?a, b). For example, echo- grams revealed that shrimp were fre- quently concentrated on either side of a ridge (left side of Fig. ?c), with the bi.0-
mass concentrated in a dense layer in ~ t s lee, 10 to 30 m off the bottom.
The rate of vertical displacement of the scattering layer can be compared with the swimming/sinking speeds obtained for various organisms (Fig. 8). A sig- nificant relationship between weight of zooplankters and their sinking rate could only be derived for crustaceans, in contrast to groups characterized by markedly different body density and morphology, such as cnidarians, pteropods and chaetognaths. As expected, the ability to sustain voluntary directional movements increased with zooplankter size (Fig. 8), and corresponded to the zooplankter ZCM range (Fig. 4 ) . Shrimp wou1.d migrate upwards at between 3.2 and 5.6 cm S-', which agrees with the measured rate of
Hudon et al.: Influence of physical forclng on fauna1 distribut~on 9
Fig. 6. Pandalus montagui. Hourly plot of shrimp ZCM for each BIONESS set (n = 34); results from the 3 series were combined. Shaded areas repre- sent periods of darkness and ~ntermediate light ~ntensities at
dawn and dusk 24 00 03.00 O6:OO 09:OO 12:OO 15,00 18:00 21 .OO 24:OO
Time of day (hour)
displacement of the dense scattering layer at 4.6 cm S-'. of benthic macro-organisms in the trough areas. In In 1 h , shrimp could swim upwards between 113 and addition, the higher concentration of large pelagic 151 m or sink by 233 to 466 m, if they stopped swimming organisms (jellyfish and Arctic cod; Fig. 3c, d) captured entirely. Our observation of the duration of upwards incidentally in the trawl indicates that the retention shrimp migration ( < 6 h) is consistent with our derived mechanism extends through the water column. The values (2 to 3 h). Migration back to the bottom by sink- highest zooplankton concentrations were located ing could be achieved in about 1 h, which agrees with above the trough (BIONESS Series 11). Comparison of acoustic observations of the scattering layer. biomass estimates shows that zooplankton concentra-
tions in Series I and 111 were similar to those observed
DISCUSSION
Horizontal distribution
for Hudson Bay (2 to 18 g m-') and neighbouring Frobisher Bay (10 to 18 g m-') (E. H. Grainger pers. comm.), whereas Series 11, located above the trough, was significantly higher.
The horizontal distribution pattern from trawl Physical forcing may explain the horizontal distribu- samples and acoustics (Fig. 3) shows higher densities tion of zooplankton, fish and shrimp populations.
Evidence for forcing would be revealed by the presence of a front or of a
Table 3. Spearman correlation coefflclents ( r ) between the depth of the center cyclonic eddy, Direct measurement of of mass (ZCM) and physical factors, for each major group of zooplankters. this could be made with an STD and a Non-significant coefficients are omitted. The associated probability level (p) is indicated for each coefficient: ' <0.05, significant; " <0.01, highly significant; current current meter
"' < 0.001, very highly significant data were not collected during the cruise, while STD sampling in the study area was not sufficient to describe the 3-dimensional density field at the scale
Shrimps -0.678" of the differences found in the biology. Pteropods 0.428. ' We therefore had to resort to examina- Mysids -0.509 " 0.527. " Cnidarians 0.530"' 0 447" tion of the literature for supportive data Hyperiid
amphipods 0.347 '
Euphausiids 0.575"' Chaetognaths 0.466 " 0.401 m 0.475" Copepods 0.581 " 0.489" 0.453 m "
collected in other studies. Drinkwater & Jones (1987) measured
the stratification, nutrient concentra- tions and chlorophyll a levels in Hudson Strait during late summer and found an

10 Mar. Ecol. Prog. Ser. 92: 1-14, 1993
a TIME
Fig. 7. Echograms from the study area near Resolution Island. Echograms (a) and (b) are from BIONESS Series 11. Echogram (c) was obtained from about the center of the pentagonal study area. The depths indicated at the top and bottom of each echogram refer to transducer and bottom depths, respectively. The time at the beglnnlng and end of each sequence is indicated. (a) At night, small organisms (seen as specks on the echogram) were d~str~buted throughout the water column. The presence of an Internal wave was also revealed. Distance shown = ca 3.4 km. (b) As dawn approached, organisms descended near the sea bed. The compounding effect of physical factors on the vertical distrib- ution and movements of organisms was visible, as organisms were concentrated along the edge of internal waves. The path of the BIONESS sampler is also visible. Distance shown = ca 3.8 km. (c) After dawn, most - but not all - biomass was near the bottom. In this ~nstance, a dense scattering layer occurred about 30 m above the bottom, in association with a ridge.
Distance shown = ca 3.6 km
area of relatively weak vertical density gradients over the upper 50 m south of Resolution Island (to the east of our sampling area). Surface to bottom density differ- ences found in our survey were similar to those found in their study. However, Drinkwater & Jones (1987) reported that surface nutrient and chlorophyll a levels were relatively high compared to regions east of Resolution Island and in most of Hudson Strait west of Ungava Bay. Their findings do not support the presence of a well-defined front in our study region.
LeBlond et al. (1981) showed the trajectory of a sur- face drifter passing westward into Hudson Strait near Resolution Island. The drifter executed a counterclock- wise loop centred about 30 km southwest of the island, with a tangential velocity of about 20 cm S-'. Other factors (e.g. wind) could explain the looping drifter path, but it may also indicate the presence of a cyclonic eddy. If the eddy was a quasi-permanent feature, we might expect raised isopycnals within the eddy, similar to what was observed in our data. Generation of the eddy may be related to bottom topography.
Thomson & Wilson (1987) and Crawford et al. (1985) showed the importance of bathymetric features for the generation of eddies near the entrance of Queen Charlotte Sound. Retention times for passive drifters increased significantly in these areas. Furthermore, in a study of British Columbia shelf circulation, Freeland & McIntosh (1989) and Freeland & Denman (1982) found the presence of a cyclonic eddy to be related to the bathymetric influence of a small canyon (2 180 m). The mean flow orientation and bottom topography of our study area resembles that found in their studies. LeBlond et al. (1981) showed that for stratification levels present (N= 6 X 10⁻³ S-'), the stratification scale (fL/N, where f is the Coriolis parameter, L is a length scale and N is the Brunt-Vaisala frequency) is suffi- ciently large that the influence of bottom features extends to the ocean surface in our study region. Although we have no way to confirm the existence of eddy-like features southwest of Resolution Island, the observed biological distribution, bathymetry and the single observation by LeBlond et al. (1981) suggest this to be possible.
Vertical distribution
Shrimp were found to feed actively on copepods during their nocturnal migrations and also, to a lesser extent, on benthos and suprabenthos in daytime (Hudon et al. 1992). The swimming and sinking speeds calculated for shrimp (Fig 8) agreed well with the acoustic observations. Previous studies have shown that low concentrations of small shrimp re- mained in the water column during daytime (Hudon et al. 1992) whereas the bulk of the population rapidly

Hudon et al.. Influence of physical forcing on fauna1 distribution 11
0 UPWARD SWIMMING (US)
Cnidarians Pteropods
-2 -2 - I 0 I 2 3 4
W E T W E I G H T ( LOG,, rng)
Fig. 8. Linear regressions between upward swimming and sinking speeds (log,o cm S-') and ~ndividual wet weight (loglo mg). The regression l ~ n e labeled 'US' represents predicted values for upward swimming calculated from Hardy & Bainbridge's (1954) values of sustained swimming (>30 min) for crustaceans (only). The regression line labeled 'PS' represents predicted sinking speed values from Rudyakov & Tseitlin (1980), as equal to 1 body length S-'. Corresponding speeds are indicated for organisms captured in this study (numbered 1 to 17), superimposed on the regression lines. Numbers identify species as follows: (1) Pseudo- calanus spp , (2) Metridia longa 111-IV, (3) V-VI; (4) Calanus finmarchicus 1-111, (5) IV-VI; (6) Calanus hyperboreus 111-IV, (7) V-VI; (8) Euchaeta nol-veyica IV-VI; ( 9 ) Eukrohnia hamata; (10) Aglanlha digitale; (1 1 ) Spiratella helicina; ( 1 2 ) Clione lirnacina; (1 3) Themjsto cornpressa; (1 4) Thysanoessa inermjs; (1 5) Metherythrops robusta; (1 6 ) Mysis polaris; (17) Pandalus rnontagui. Values reported for Sagitta elegans, A4eganyctiphanes norvegica (Hardy & Bainbridge 19641, Cavolinia tridentata
and Gleba cordata (Gilmer 1974) were used to approximate those of species 9, l ? . 11 and 12, respectively
sunk to the bottom at dawn (Crawford et al. 1992). Consequently, the progressive decline of shrimp ZCM we observed in morning hours (Fig. 6) probably underestimates their actual downward movements, since BIONESS could not sample efficiently the shrimp concentrated near the bottom. Low shrimp concentrations in daytime in the water column would likely be below the detection threshold of acoustics. Daytime residence of the bulk of the population within the benthic boundary layer would attenuate horizontal displacement, thus increasing shrimp reten- tion in the study area. The concentration of juvenile gadids in the benthic boundary layer above the gravel bed of Georges Bank and their dispersion a s they undertake vertical foraging (Lough et al. 1989) is a similar example of the interaction of behaviour and water movements affecting spatial distribution. Other groups of less dense organisms, such as pteropods (Gilmer 1974) and chaetognaths (Hardy & Bainbridge 1954), have comparatively faster swimming speeds per unit of body weight, which explains their devia- tion from the regression line (Fig. 8). In the case of pteropods, the striking differences in vertical distri- bution and die1 migration pattern (Fig. 5b) can be related to their peculiar morphology and feeding ecol- ogy. The 2 pteropod species found in this study be-
long to a single, linear food web: the large pteropod Clione lirnacina is a specialized predator of the smaller herbivorous pteropod species Spiratella helicina (Lalli 1970), the latter being a herbivorous feeder on diatoms, tintinnids and dinoflagellates (Morton 1954).
At the other end of the sizehwimming ability scale, chaetognaths, copepods and cnidarians exhibited vertical movements related to water mass character- istics (isopycnal distribution), indicative of passive transport (Table 3). Such passive vertical displacement by internal waves (Haury et al. 1983) and along iso- pycnal surfaces (Wishner & Allison 1986) has previ- ously been reported for small zooplankters. The inter- section of regression lines for upwards swimming and passive sinking takes place at a size of 0.7 mg, which is the size at which sinking and swimming speed a re equal. As a result, crustaceans below this size (corre- sponding to small copepods) do not have to swim continuously to maintain their vertical position.
Successive instars of copepod species a re a parti- cularly interesting group with respect to factors regulating their vertical distribution, since they a re morphologically homogeneous as a group and overlap (sometimes ontogenically, e.g. large Calanus spp.) the threshold size of 0.7 m g at which sinking speed equals upwards swimming capability. Copepods weighing
Mar. Ecol. Prog. Ser. 92: 1 - 14, 1993
< 0.3 mg (size < 1 mm) [Calanus finmarchicus (stages I to Ill), all stages of Pseudocalanus spp.. Metridia longa (stages 111 and IV), Calanus hyperboreus (stage 11) and Euchaeta norvegica (stage I I ) ] accounted for only 7.2 '% of copepod biomass. This is considered to be an underestimate as the relatively large mesh size nets that were used are not efficient in capturing these small-size zooplankters (Vannucci 1968). Early copepodite stages could have been concentrated in the euphotic zone to graze phytoplankton, while the bulk of later stages progressively moved to deeper water. The ZCM of the 2 most abundant copepod species exhibited a sharp drop at the copepodite stage reach- ing a weight >0.7 mg (C. finmarchicus V, C. hyper- boreus IV). These observations are consistent with the increases in sinking rate, swimming ability and migratory capacity as copepods grow in size.
Chaetognaths were found in greatest abundance ixmediately b e l ~ , " ~ :he depth of copepcc! ccr?cer?tra- tion, and their ZCMs were highly correlated, indi- cating synchronous oscillations. This correspondence likely results from the combined effects of passive displacement and of the important predator-prey rela- tionship between these 2 groups.
Correlations between the diel cycle of vertical distri- bution and physical factors (Table 3) indicated that only the largest crustaceans (shrimp and mysids) had sufficient swimming power to overcome the physical effects of water advection and pursue their vertical migration in relation to light intensity. For all zoo- plankters smaller than shnmps, bathymetry was sig- nificantly correlated with their ZCM (Table 3). This bathymetric effect was most pronounced for the sec- ond series (Fig. 2a, middle panel) when the center of mass of most organisms oscillated in parallel with bottom contour (280 to 370 m). When advected over a bank, organisms would respond either by actively narrowing their depth range or by maintaining it pas- sively, thus increasing the overlap of their depth range. Alternately, their vertical range would widen as the water column deepened. Whether this phenomenon is regulated passively through physical conditions and/or actively through behaviour (for example, adjustment of relative depth with respect to predators, prey or light) remains to be determined. This phenomenon could explain the common appearance of a deep scattering layer associated with bottom topographic features. The presence of internal waves was observed on several occasions in the scattering layer (Fig. 7 ) . The concen- tration of planktonic organisms along the internal wave surface indicates passive vertical displacement, resulting in a more variable vertical distribution.
The ZCM of cnidarians, which are relatively weak swimmers in spite of their large size, was additionally influenced by tidal amplitude, suggesting an in-
creased passive component. The absence of effects other than that of depth on the ZCM of hyperiid amphipods, euphausiids and pteropods (Table 3) could in part be due to the coarser (50 to 100 m strata) sampling of the surface layer (0 to 100 m) in com- parison with the bottom layer (25 m strata). These organisms comprise herbivorous feeders, which could regulate their distribution primarily according to other factors, such as phytoplankton distribution in the surface layers.
Physical forcing of the vertical distribution of the organisms was dominated by internal tide oscillations. Detailed comparison of the predicted surface tide with the vertical oscillations of isopycnals at the 3 locations was limited by sampling interval (2 to 6 h), vessel motion around the 'fixed' stations, large horizontal density gradients, weak vertical density gradients and strong tidal flow. Isopycnals oscillated with a semi- diurna! periodicity (2 h!, with a quarter-diurnal or higher-frequency signal superimposed. The confound- ing effects of temporal variability on spatial effects cannot be neglected and should be investigated in the future.
Community persistence
Our results suggest that the physical conditions generated by the bathymetry and flow regime off Resolution Island have multiple consequences on the horizontal and vertical distribution of zooplankters and suprabenthic organi.sms. We hypothesize that the existence of a retention area generated by a narrow underwater canyon could be the mechanism leading to the concentration of planktonic and suprabenthic organisms forming a primarily plankton-based com- munity. Small zooplankters (copepods and chaetog- naths) are concentrated passively and serve as prey items for shrimp, which undertake nightly vertical feeding forays into the water column. Larger zoo- plankters (such as mysids and pandalid shrimp), which are characterized by a more developed swimming capability, maintain their diel vertical migrations in relation to light intensity. Local reten- tion of pandalid shrimp is enhanced by their daytime concentration in the deeper waters of the canyon in the benthic boundary layer (30 to 40 m). Other organ- isms may also take advantage of this retention mecha- nism and of the resulting plentiful food resources. Pelagic cnidanans, chaetognaths, hyperiid amphi- pods, predatory pteropods and Arctic cod occur in high concentrations. The combination of physical forcing and specific bathyrnetric features could thus allow the persistence of this small oasis at the eastern entrance of Hudson Strait.

Hudon et al. Influence of physical forc~ng on fauna1 distribut~on 13
Acknowledgements. The help of Vincent Jarry and Georges Lobb in keeping the BlONESS operational was invaluable. Don Parsons, Pat Veitch, John Jorgensen, Jack Fife and John Percy also contributed to the field work. We thank Luc Ra~nvllle for the ~dentification and supervlslon of the analyses of copepodite stages. Yvon Letarte and Guy Prefontaine helped w ~ t h data entry and statistical analyses. F~gures were drafted by Ursula Seidenfuss and Jean-Claude Croteau. The comments of Ken Drinkwater, Bob Conover and 2 anonymous reviewers on an earlier version of the manuscript are acknowledged with thanks. The authors thank the officers and crew of FRV 'Alfred Needler' R.G.I. is supported by the Natural Sc~ences and Engineering Research Council of Canada.
LITERATURE CITED
Boucher, J., Ibanez, F., Prieur, L. (1987). Daily and seasonal variations in the spatial distribution of zooplankton popu- l a t i o n ~ in relation to the physical structure in the Ligurian Sea front. J . mar. Res. 45: 133-173
Canadian Hydrograph~c Service (1983). Sai l~ng directions. Labrador and Hudson Bay, 5th edn. Fisheries and Oceans Communications Directorate, Ottawa
Canadian Hydrographic Service (1988). Tides and current tables, Vol. 4. Arctic and Hudson Bay. Fisheries and Oceans Communications Directorate, Ottawa
Cherniawsky, J . , LeBlond, P. (1987). The baroclinic circula- tion in Hudson Strait. Atm.-Ocean 25: 416-426
Crawford, R. E., Fox, J . K. (1992). Visualization of echo sounder data with a microcomputer Can. Tech. Rep. Fish. Aquat. Sci. 1840
Crawford, R. E., Hudon, C., Parsons, D. G . (1992). An acoustic study of shrimp (Pandalus montagu~] distr~bution near Resolution Island (eastern Hudson Strait). Can. J . Fish. Aquat. Sci. 49: 842-856
Crawford, W., Huggett, W., Woodward, M,, Daniel, P. (1985). Summer circulation of the waters in Queen Charlotte Sound. Atm.-Ocean 23: 393-413
Denman, K. L., Powell, T M (1984). Effects of physical processes on planktonic ecosystems in the coastal ocean. Oceanogr, mar. Biol. A Rev. 22: 125-168
Drlnkwater, K. F. (1983). Moored current meter data from Hudson Strait, 1982. Can. Data Rep. Fish. Aquat. Sci. 381
Drinkwater, K. F. (1986). Physical oceanography of Hudson Strait and Ungava Bay. In: Martini, I. (ed.) Canadian in- land seas. Elsevier, Amsterdam. p. 237-264
Drinkwater, K. F. (1988). On the mean and tidal currents in Hudson Strait. Atm.-Ocean 26: 252-266
Drinkwater, K. F. (1990) Physical and chemical oceano- graphy. In: Percy, J A. (ed . ) Proceedings of a workshop: M a r ~ n e Ecosystem Studies in Hudson Stralt (MESHS). November 9-10, 1989, Montreal, Quebec. Can. Tech. Rep. Fish. Aquat. Sci. 1770, p. 87-97
Drinkwater, K. F., Jones, E. P. (1987). Density stratification, nutrient and chlorophyll distributions in the Hudson Strait region during summer and their relation to tidal mixing. Cont Shelf Res. 7: 599-607
Freeland, H., Denman, K (1982). A topographically con- trolled upwelling center off southern Vancouver Island. J . mar. Res. 40: 1069-1093
Freeland, H., McIntosh, P. (1989). The vorticity balance of the southern British Columbia continental shelf. Atm.-Ocean 27: 643-657
Gilmer. R. W. (1974). Some aspects of feeding in theco- somatous pteropod molluscs. J . exp. mar. Biol. Ecol. 15: 127-144
Griffiths. D. K., Pingree, R.. Sinclair. M. (1981). Summer tidal fronts in the near-arctic regions of Foxe Basin and Hudson Bay. Deep Sea Res. 28A: 865-873
Hardy, A C., Bainbridge, R (1954). Experimental observa- tions of the vertical mlgratlon of planktonic anlmals. J . mar. b~o l . Ass. U.K. 33. 409-448
Haury, L. R., Pieper, R. E. (1987). Zooplankton: scales of bio- logical and physical events. In: Soule, D. F., Kleppel. G. S. (eds). Marine organisms as indicators. Springer-Verlag, New York, p. 35-72
Haury. L R , Wiebe, P. H., Orr. M H., Briscoe, M. G (1983). T~dally generated high-frequency internal wave packets and t h e ~ r effects on plankton in Massachusetts Bay. J . mar. Res. 41: 65-112
Herman, A. W., Sameoto, D. D., Longhurst, A. R. (1981). Vertical and horizontal distribution patterns of copepods near the shelf-break south of Nova Scotia. Can. J . Fish. Aquat. Sci. 38: 1065-1076
Hudon, C. (1990). Distribution of shrimp and fish by-catch assemblages in the canadian eastern Arctic in relation to water circulation. Can. J F ~ s h . Aquat. Sci. 47: 1710-1723
Hudon, C., Parsons, D. G., Crawford, R. E. (1992). Diel pelagic foraging by a pandalid shnmp (Pandalus montagui] off Resolut~on Island (eastern Hudson Strait). Can. J . Fish. Aquat. Sci. 49: 565-576
Lalli, C. M. (1970). Structure and function of the buccal appa- ratus of Clione limacina (Phipps) with a review of feeding in gyrnnosomatous pteropods. J exp. mar. Biol. Ecol. 4: 101-118
LeBlond, P., Osborn, T. , Hodg~ns , D. , Goodman, R., hletge, M. (1981). Surface circulat~on in the western Labrador Sea. Deep Sea Res. 28A: 683-693
Le Fevre, J . . Frontier, S. (1988). Influence of temporal charac- teristics of physical phenomena on plankton dynamics, a s shown by northwest European marine ecosystems. In: Rotschild, B. J. (ed). Towards a theory on biological- physical interactions in the world ocean. Kluwer, Dordrecht. p . 245-272
Legendre, L., Demers, S. (1984). Towards dynamic biological oceanography and lirnnology. Can. J . Fish. Aquat. Sci. 41. 2-19
Lough, R. G.. Valentine, P. C.. Potter, D. C., Aud~tore , P. J.. Bolz, G . R., Neilson, J . D.. Perry. R. I. (1989). Ecology and distribution of juvenile cod and haddock in relation to sediment type and bottom currents on eastern Georges Bank. Mar. Ecol. Prog. Ser. 56: 1-12
Mann, K. H., Lazier, J . R. N. (1991). Dynamics of marine ecosystems. Biological-physlcal Interactions in the oceans. Blackwell Scientific Publications, Boston
Morton, J. E . (1954). The biology of Limacina retroversa. J . mar. biol. Ass. U.K. 33: 297-312
Parsons, D. G., Crawford, R. E., Hudon, C. (1990). A hydroa- coustical evaluation of the efficacy of bottom trawl surveys for estimating abundance of pandalid shrimp. ICES Shell. Symp. No. 24. ICES, Moncton [mimeo]
Rudyakov, Ya. A., Tseitlin, V. B (1980). The passive sinking rate of pelagic marine organisms. Okeanologlya 20: 931-936 (Can. Transl. Fish. Aquat. Sci. 4707)
Sameoto, D. D., Jaroszynski, L. O., Fraser, W. B. (1980) BIO- NESS, a new design in multiple net zooplankton samplers. Can. J . Fish. Aquat. Sci. 37: 722-724
Sinclair. M-, Iles, T D. (1989). Population regulation and speciation in the oceans. J. Cons. int. Explor. Mer 45: 165-175

14 Mar. Ecol. Prog. Ser. 92: 1-14. 1993
Sprong, I . , Kuipers, B. R. , W~tte, H. (1990). Acoustic phe- nomena related to an enr~ched benthic zone In the North Sea J . Plankton Res. 12: 1251-1261
Thornson, R., Wilson, R. (1987). Coastal countercurrent and mesoscale eddy formation by tidal rectification near an oceanic cape. J. phys. Oceanogr. 17: 2096-2126
This article was presented b y G. C. Harding, Dartmouth, N.S., Canada
Vannucci, M. (1968). Loss of organisms through the meshes In: Tranter, D. J. (ed.) Zooplankton sampling. Monographs on oceanographc methodology 2. UNESCO, Paris, p. 77-86
Wishner, K. F., Allison. S. K. (1986). The distribution and abundance of copepods in relation to the physical struc- ture of the Gulf Stream. Deep Sea Res. 6: 705-731
Manuscript first received: April 8, 1992 Revised version accepted: November 2, 1992


![Measurement-based estimation of the spatial gradient of ... · PDF fileMeasurement-based estimation of the spatial gradient of aerosol radiative forcing ... Matsui et al. [2006]](https://static.fdocuments.in/doc/165x107/5aadd32c7f8b9a190d8b616e/measurement-based-estimation-of-the-spatial-gradient-of-estimation-of-the-spatial.jpg)