INFLUENCE OF MULTIPLE DEGRADING COMPONENTS ON GAS TURBINE ...
8
Proceedings of GPPS Forum 18 Global Power and Propulsion Society Zurich, 10 th -12 th January 2018 www.gpps.global This work is licensed under a Creative Commons Attribution 4.0 International License CC-BY 4.0 GPPS-2018-0014 INFLUENCE OF MULTIPLE DEGRADING COMPONENTS ON GAS TURBINE FUEL CELL HYBRID SYSTEM LIFETIME Valentina Zaccaria Mälardalen University [email protected] Västerås, Sweden Alessandra Cuneo University of Genoa [email protected] Genova, Italy Alessandro Sorce University of Genoa [email protected] Genova, Italy ABSTRACT Energy system reliability and operational cost depend highly on the performance degradation experienced by system components. In complex systems, degradation of each single component affects matching and interactions of different system parts. Gas turbine fuel cell hybrid systems combine two different technologies to produce power with an extremely high conversion efficiency. Severe performance decay over time currently limits high temperature fuel cells lifetime; although at a different rate, gas turbine engines also experience gradual deterioration phenomena such as erosion, corrosion, and creep. This work aims at evaluating, for the first time, the complex performance interaction between degrading components in a hybrid system. The effect of deterioration in gas turbine pressure ratio and efficiency on fuel cell performance was analyzed, and at the same time, the impact of the degrading fuel cell thermal output on turbine blade aging was modeled to estimate a remaining useful lifetime. INTRODUCTION Small-scale technologies are nowadays playing an increasingly important role in power systems to accommodate a growing penetration of non-dispatchable renewable energy sources (NDRES). Micro gas turbine and internal combustion engine based systems are acquiring the role of grid supporters in this new energy mix. Micro gas turbines are playing a main role in the distributed generation applications, because of their flexibility that allows to operate in partnership with renewable sources in an extremely volatile energy market. Flexibility is mandatory for peaking unit, while high efficiency, even in off- design condition, is the key point to reduce carbon emissions for generators designed to run continuously [1]. The combination of a micro gas turbine (mGT) and a solid oxide fuel cell (SOFC) in a hybrid system has been considered for decades as a promising technology for low-emissions power generation [2-4]. The efficiency of a hybrid system can be generally above 50% even for 100 kW size and up to 60% for 1 MW size, making it suitable for distributed generation applications [4, 5]. Similar efficiency level can be reached by combined cycles; however, plant sizes in the range 400 - 1000 MW are not suitable for distributed generation, so paying transformation losses in the efficiency chain. Although many theoretical studies showed the environmental and economic benefits of SOFC-GT hybrid systems, the main obstacles to commercialization are considered the fuel cell high cost and limited lifetime [6]. As stated before, not just design efficiency but also its variations with load (off-design performance) and over time (degradation) are crucial from an environmental and economic point of view. Hybrid systems gather the advantages of two very different systems on the efficiency side, with an excellent off-design characteristic, but have to deal with mutual interaction of degradation mechanisms. In this scenario, it is becoming even more necessary to guarantee system availability and reliability, and to reduce lifecycle costs, which depend highly on components degradation over time. Predicting elements and components life (or time between overhauls, TBO) is a fundamental step to estimate the possible economic return. Mechanisms limiting SOFC operating life have been widely investigated [7, 8]. In previous work by the Authors, the effect of fuel cell degradation over time on the hybrid system performance and economic return was analyzed [9, 10]. In those studies, the fuel cell was considered the only component experiencing performance deterioration, while gas
Transcript of INFLUENCE OF MULTIPLE DEGRADING COMPONENTS ON GAS TURBINE ...
Proceedings of GPPS Forum 18 Global Power and Propulsion Society
Zurich, 10th-12th January 2018 www.gpps.global
This work is licensed under a Creative Commons Attribution 4.0 International License CC-BY 4.0
GPPS-2018-0014
INFLUENCE OF MULTIPLE DEGRADING COMPONENTS ON GAS TURBINE FUEL CELL HYBRID SYSTEM LIFETIME
Valentina Zaccaria Mälardalen University
[email protected] Västerås, Sweden
Alessandra Cuneo University of Genoa
[email protected] Genova, Italy
Alessandro Sorce University of Genoa
[email protected] Genova, Italy
ABSTRACT
Energy system reliability and operational cost depend
highly on the performance degradation experienced by system
components. In complex systems, degradation of each single
component affects matching and interactions of different
system parts. Gas turbine fuel cell hybrid systems combine
two different technologies to produce power with an
extremely high conversion efficiency. Severe performance
decay over time currently limits high temperature fuel cells
lifetime; although at a different rate, gas turbine engines also
experience gradual deterioration phenomena such as erosion,
corrosion, and creep. This work aims at evaluating, for the first
time, the complex performance interaction between degrading
components in a hybrid system. The effect of deterioration in
gas turbine pressure ratio and efficiency on fuel cell
performance was analyzed, and at the same time, the impact
of the degrading fuel cell thermal output on turbine blade
aging was modeled to estimate a remaining useful lifetime.
INTRODUCTION
Small-scale technologies are nowadays playing an
increasingly important role in power systems to accommodate
a growing penetration of non-dispatchable renewable energy
sources (NDRES). Micro gas turbine and internal combustion
engine based systems are acquiring the role of grid supporters
in this new energy mix. Micro gas turbines are playing a main
role in the distributed generation applications, because of their
flexibility that allows to operate in partnership with renewable
sources in an extremely volatile energy market. Flexibility is
mandatory for peaking unit, while high efficiency, even in off-
design condition, is the key point to reduce carbon emissions
for generators designed to run continuously [1].
The combination of a micro gas turbine (mGT) and a solid
oxide fuel cell (SOFC) in a hybrid system has been considered
for decades as a promising technology for low-emissions
power generation [2-4]. The efficiency of a hybrid system can
be generally above 50% even for 100 kW size and up to 60%
for 1 MW size, making it suitable for distributed generation
applications [4, 5]. Similar efficiency level can be reached by
combined cycles; however, plant sizes in the range 400 - 1000
MW are not suitable for distributed generation, so paying
transformation losses in the efficiency chain. Although many
theoretical studies showed the environmental and economic
benefits of SOFC-GT hybrid systems, the main obstacles to
commercialization are considered the fuel cell high cost and
limited lifetime [6].
As stated before, not just design efficiency but also its
variations with load (off-design performance) and over time
(degradation) are crucial from an environmental and economic
point of view. Hybrid systems gather the advantages of two
very different systems on the efficiency side, with an excellent
off-design characteristic, but have to deal with mutual
interaction of degradation mechanisms. In this scenario, it is
becoming even more necessary to guarantee system
availability and reliability, and to reduce lifecycle costs, which
depend highly on components degradation over time.
Predicting elements and components life (or time between
overhauls, TBO) is a fundamental step to estimate the possible
economic return.
Mechanisms limiting SOFC operating life have been
widely investigated [7, 8]. In previous work by the Authors,
the effect of fuel cell degradation over time on the hybrid
system performance and economic return was analyzed [9,
10]. In those studies, the fuel cell was considered the only
component experiencing performance deterioration, while gas

2
turbine degradation was neglected. With this assumption, it
was suggested that, in contrast with most of the performance
analyses in the literature, the power share between SOFC and
mGT should be about 50:50 to maximize the economic return.
As all the engines, gas turbines experience wear and tear
over time. Typical degradation phenomena include
compressor fouling, blade erosion, hot corrosion, and creep,
among others. An extensive review of gas turbine degradation
was provided by Kurz [11]. Existing studies generally focus
on large machines, while performance deterioration in micro
gas turbines is rarely discussed, without analyzing the
economic impact [12, 13]. Nevertheless, micro gas turbine
degradation can be reasonably considered to occur following
the same mechanisms as in large turbomachinery. In
particular, micro gas turbine blades are normally uncooled,
limiting the turbine inlet temperature (TIT) to 950°C for nickel
alloys blades, e.g. IN738 [14, 15]. For this reason,
temperature-induced aging phenomena of the blades (e.g.
creep) can be a major issue. Different models, ranging from
finite elements to probabilistic and real-time approximate
models, have been proposed to estimate blades remaining
lifetime [16-19]. The effect of turbine load on blades creep
was investigated by Mohamed et al. [17]. Dependence of
creep life on ambient and operating conditions was object of
different studies [20, 21].
Degradation of multiple components and subsystems may
be aggravated by components interaction. For example,
degradation of one component can initiate or accelerate the
failure of another one; if this aspect is ignored, failure risk can
be underestimated. One reason is that a change in one
component performance characteristic leads to a mismatch on
the engine level, hence, the operating conditions vary affecting
other components degradation. Studies on degraded
components interaction in energy systems are limited. The
effect of compressor fouling and operating conditions on creep
of turbine blades was investigated showing that creep is
accelerated in a machine with a degraded compressor [21].
Sun et al. analyzed interactive failures in mechanical systems,
modelling the influence of multiple components [22].
In an mGT/SOFC hybrid system, coupling phenomena
and interactions are complex. Components matching over the
operability range is a delicate problem, to ensure system safe
operations. Even in healthy conditions, small perturbations
can be propagated and amplified in the system if not
adequately controlled, causing for example compressor stall
or excessive thermal stress in the SOFC stack [23]. The
objective of this work is to assess the interdependent effects of
components degradation in a hybrid system. Simultaneous
fuel cell stack degradation and gas turbine degradation is
studied to evaluate the impact on system lifetime and
economic return compared to the case study of a previous
work (where only fuel cell degradation was considered) [10].
METHODOLOGY
Cycle overview
In a directly coupled hybrid system, the pressurized
SOFC stack replaces the traditional combustion chamber of a
gas turbine, as shown in the diagram of Figure 1. The
compressed air leaving the compressor is preheated by the
turbine exhausts and sent to the fuel cell cathode side. On the
anode side, fuel such as natural gas, syngas or biogas is
supplied, and electrical power is generated through
electrochemical reactions. Anode and cathode exhausts mix in
a combustion volume (off-gas burner) where the unutilized
fuel still present in the anode exit stream is oxidized with the
excess oxygen from the cathode stream. Subsequently, the hot
gas enters the turbine and additional electrical power is
produced.
System model
The hybrid system model was developed in MATLAB
Simulink and extensively described in previous publications
[24, 25]. A degradation factor, function of fuel cell operating
temperature, current density, and fuel utilization, increments
the overpotential over time simulating a degradation in
performance [25]. Since in previous work, a constant voltage
operating mode was selected as the most economically
beneficial [9], for comparison, the same operating strategy is
applied in this study, summarized as it follows:
Fuel cell current is decreased over time to offset
degradation and keep constant voltage;
Consequently, fuel cell power and fuel utilization
decrease following the current;
Gas turbine power is increased by incrementing the
fuel flow through the anode and thus the thermal
power transferred from the fuel cell system to the
turbine;
The total system power, sum of fuel cell and gas
turbine power, is kept constant.
A size of 400 kW was selected for both the fuel cell stack
and the micro gas turbine, while the system was designed to
deliver a total of 500 kW of electric power. That means that,
at the beginning of the fuel cell life, the turbine generates only
100 kW; as the fuel cell power degrades, the turbine load is
increased to compensate the power loss, and when the design
power is reached (i.e. the fuel cell degraded by 75%), the stack
needs to be replaced with a new one. A curve of efficiency of
the recuperated gas turbine cycle as function of load was built
from available empirical data and is shown in Figure 2 [5, 26].

Proceedings of GPPS Forum 18 Global Power and Propulsion Society
Zurich, 10th-12th January 2018 www.gpps.global
This work is licensed under a Creative Commons Attribution 4.0 International License CC-BY 4.0
Figure 1. Schematic diagram of the hybrid system
Figure 2. Gas turbine efficiency as a function of power
Degradation cases
Two parameters were considered to quantify gas turbine
degradation: compressor pressure ratio (β) and overall gas
turbine efficiency (η). Several phenomena from compressor
fouling to blade erosion and increased tip clearance are known
to decrease engine efficiency [11]. In a single-shaft machine,
loss in compressor efficiency mostly reduces the pressure
ratio, while the flow through the machine is usually not
significantly affected [11]. Hence, only degradation of
efficiency and pressure ratio was considered, also because
these two parameters are expected to influence fuel cell
performance.
The rate of performance deterioration over time can vary
significantly from engine to engine and depending on
operating conditions. For this reason, data available in the
open literature are very limited. In particular, trends of
degrading operating parameters in micro gas turbine are
scarcely published. However, some estimations can be
extrapolated from data of larger machines to assume
reasonable case studies [27-29].
Looking at maintenance plans of commercially available
micro turbines, a maximum of 30,000 hours of operation was
assumed between overhauls [30]. Three cases were compared
to evaluate the impact of gas turbine degradation on the fuel
cell and system performance: 2% decay in 30,000 hours of
compressor β and engine η, 5% decay, and 7% decay.
Meanwhile, the fuel cell degraded always according to the
degradation model presented in [25].
Turbine inlet temperature effect
Turbine inlet temperature (TIT) has a major effect on the
performance of a hybrid system. Turbine power output and
efficiency are obviously influenced by operating TIT, but also
gas turbine degradation. As turbine inlet pressure and mass
flow rate remained constant (with a slight increase of flow rate
due to the fuel flow, from 2% to 3%), the increase in thermal
energy released by the degrading SOFC incremented the TIT
and hence the power output and efficiency. This effect, similar
to those experienced by stand-alone micro gas turbine (in
which rotational speed and thus mass flow rate are maintained
constant) was modeled through the off-design performance

4
curve of Fig. 2, taking into account the actual thermal energy
entering the expander and its design value.
On the maintenance side, turbomachinery subject to
continuous operation experiences several damaging
mechanisms caused by high operating temperature (e.g. creep
deflection, erosion, oxidation, corrosion). However, creep
rupture of hot gas path components is the primary life limiter
and is the mechanism that generally determines the
maintenance interval [31].
The effect on the expander lifetime of a TIT exceedance
above the design temperature can be assimilated to a peak
load, with respect to parts life effect, as usually evaluated for
heavy duty gas turbines. No increase in life was taken into
account for firing temperature below design value. The case
of a firing temperature above design condition was modeled
with a creep law using the Larson-Miller Parameter (P) as in
the creep formula of Equation 1.
𝑃 = 𝑇𝐼𝑇(20 + log 𝑡) ∙ 10−3 (1)
For a design temperature of 950°C and a design life of
30,000 hours, P has a value of 29.94. This result was found in
good accordance with peak load effects over maintenance
prescribed by OEM of heavy duty gas turbines [31].
Fixing the value of P, a corrected time between overhauls
t can be calculated depending on the operating TIT, when this
latter exceeds 950°C. For example, for a TIT exceedance of
10°C above the design value, the TBO would be reduced to
19,000 hours. Three additional cases were thus analyzed by
taking into account the effect of the TIT on gas turbine
degradation; for comparison with the previous test cases, a
maximum degradation of 2%, 5%, and 7% at the end of life
was considered. The temperature-dependent degradation rate
was then calculated as shown in Equation 2.
𝐷𝑅𝑇𝐼𝑇 = 𝐷𝑅𝑑𝑒𝑠𝑖𝑔𝑛 ∙30,000ℎ
𝑇𝐵𝑂𝑇𝐼𝑇 (2)
Where DRdesign was set at 2%, 5%, and 7%, respectively,
and TBOTIT was calculated from Equation 1.
Economic model
A simple economic model was used to calculate the
impact of gas turbine replacements over the lifetime of the
system. The same cost assumptions of a previous work were
employed to have a comparison with the base case, and they
are reported in Table 1 [10].
Table 1. Economic assumptions
Recuperated gas turbine [32,
33]
-159.7 * ln(mGT size) +
2089.2 [$/kW]
SOFC stack 1000 $/kW
Inverter [32] 10% stack cost
Gas turbine overhaul cost 80% gas turbine cost
Fuel cost 0.1 $/kg
Electricity price (feed-in
tariff to favor SOFC market
penetration)
0.14 $/kWh
Annual maintenance 3% capital investment
Discount rate 0.01
The economic parameter used to assess the maximum
number of acceptable overhauls was the internal rate of return
(IRR), calculated as shown in Equation 3.
∑CFNj
(1+IRR)jEOLj=1 − TCI = 0 (3)
Where TUO is the time until overhaul, i.e. the time
elapsed between the beginning of life and subsequent gas
turbine overhauls. The annual cash flow, CF, includes the sold
electricity, the fuel consumption, and the annual maintenance
cost.
RESULTS AND DISCUSSION
Three cases and different subcases were analyzed and
compared:
Case 0: only the fuel cell degrades, no gas turbine
replacements
Case 1: gas turbine replacement every 30,000 hours,
constant degradation rate for β and η over time
- Case 1a: 2% constant degradation rate
- Case 1b: 5% constant degradation rate
- Case 1c: 7% constant degradation rate
Case 2: β and η actual degradation rate and gas
turbine replacement time are function of TIT
exceedance according to Eq. 1 and 2
- Case 2a: 2% degradation at replacement
time
- Case 2b: 5% degradation at replacement
time
- Case 2c: 7% degradation at replacement
time
Constant degradation rate
For Case 1, the micro gas turbine was replaced every
30,000 hours of operations, while the fuel cell stack lasted 20
years with the operating strategy previously discussed. Hence,
the gas turbine was replaced 5 times during the fuel cell
lifetime. Three constant degradation rates for β and η were
considered to analyze the effect on the fuel cell performance
and lifetime.
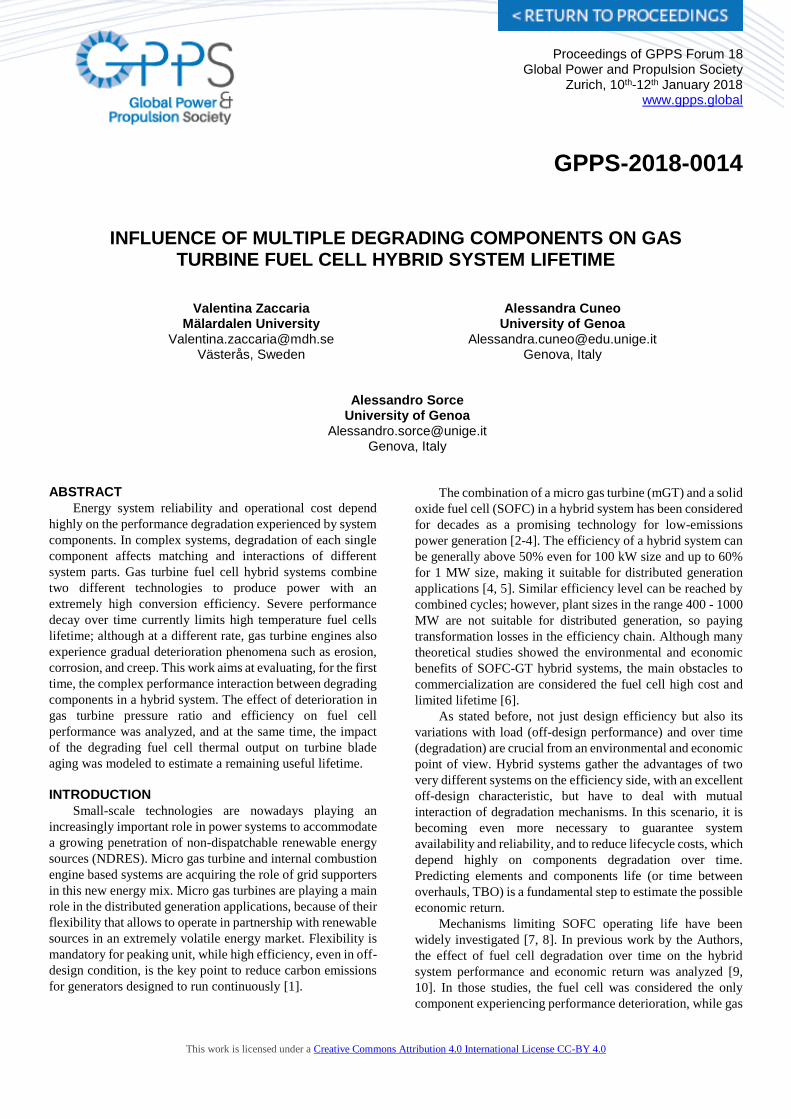
Figure 3 shows the system efficiency over time for Case
1a, 1b, 1c, and Case 0 (where gas turbine degradation and
replacements are neglected). The overall trend is a decrease in
system efficiency due to fuel cell performance deterioration,
i.e. a decrement in power output at constant voltage. A further
decrease over time is due to gas turbine efficiency
degradation, which is recovered every 30,000 hours when the
machine is replaced. A smaller contribution is due to the loss
in fuel cell performance caused by a degradation in
compressor pressure ratio.
Degradation in fuel cell inlet pressure is expected to
slightly increase cell overpotential, thus aggravating fuel cell
degradation. In contrast, degradation in gas turbine efficiency
causes the control system to increase the fuel flow to
5
maintained constant power; a higher flow rate through the
anode is expected to lower the overpotential and mitigate
degradation phenomena. However, both effects were
negligible and the fuel cell life was not affected in either way:
the maximum difference was a 3 months shorter life for the
Case 1c compared with Case 0.
Figure 3. System efficiency trends with constant
gas turbine degradation rate
An economic evaluation was performed by computing the
IRR. The maximum value of IRR was always found at 20
years, therefore considering to operate the system until the fuel
cell end of life and to replace the gas turbine when needed.
Hence, the lifetime of the system was not affected by the rate
of gas turbine degradation over time. The IRR values for the
4 cases are reported in Table 2. A not surprising reduction in
IRR with increased implanted degradation rate was observed.
Note that in Case 0, gas turbine replacements were not
considered.
Table 2. IRR values comparison for Case 1 (constant
degradation rates)
Case 0 –
Base case
Case 1a –
2%
Case 1b –
5%
Case 1c –
7%
0.17 0.138 0.127 0.107
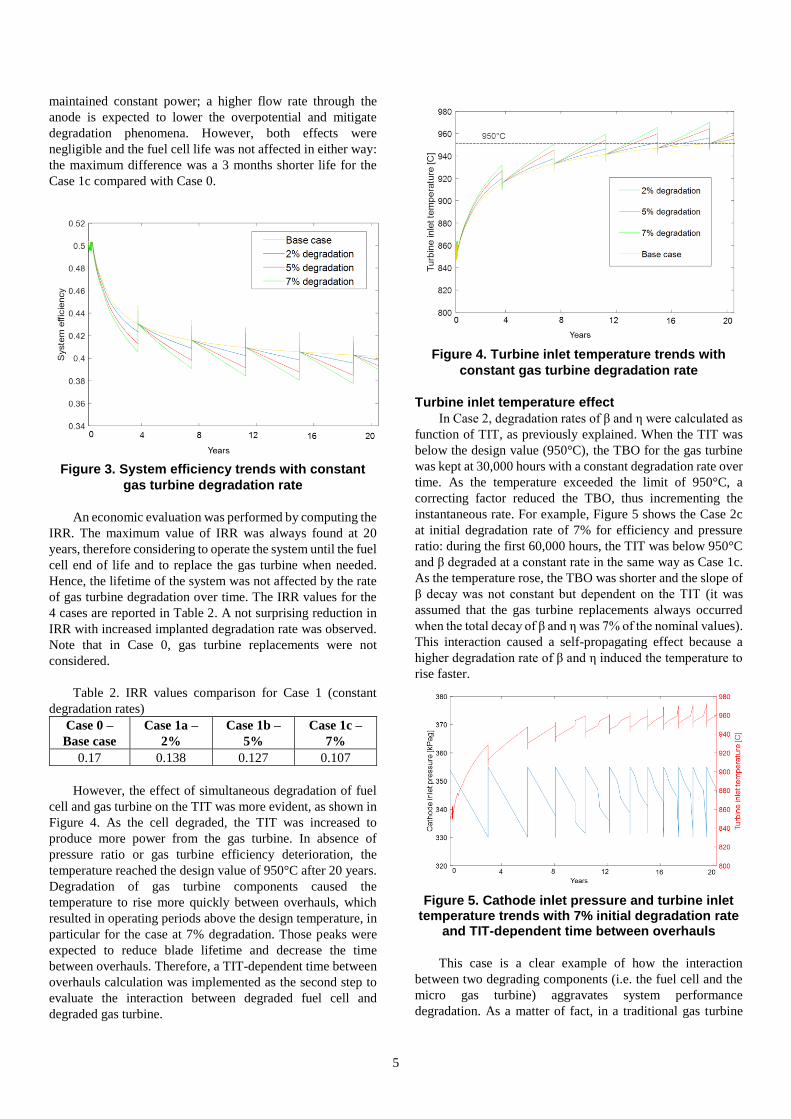
However, the effect of simultaneous degradation of fuel
cell and gas turbine on the TIT was more evident, as shown in
Figure 4. As the cell degraded, the TIT was increased to
produce more power from the gas turbine. In absence of
pressure ratio or gas turbine efficiency deterioration, the
temperature reached the design value of 950°C after 20 years.
Degradation of gas turbine components caused the
temperature to rise more quickly between overhauls, which
resulted in operating periods above the design temperature, in
particular for the case at 7% degradation. Those peaks were
expected to reduce blade lifetime and decrease the time
between overhauls. Therefore, a TIT-dependent time between
overhauls calculation was implemented as the second step to
evaluate the interaction between degraded fuel cell and
degraded gas turbine.
Figure 4. Turbine inlet temperature trends with
constant gas turbine degradation rate
Turbine inlet temperature effect
In Case 2, degradation rates of β and η were calculated as
function of TIT, as previously explained. When the TIT was
below the design value (950°C), the TBO for the gas turbine
was kept at 30,000 hours with a constant degradation rate over
time. As the temperature exceeded the limit of 950°C, a
correcting factor reduced the TBO, thus incrementing the
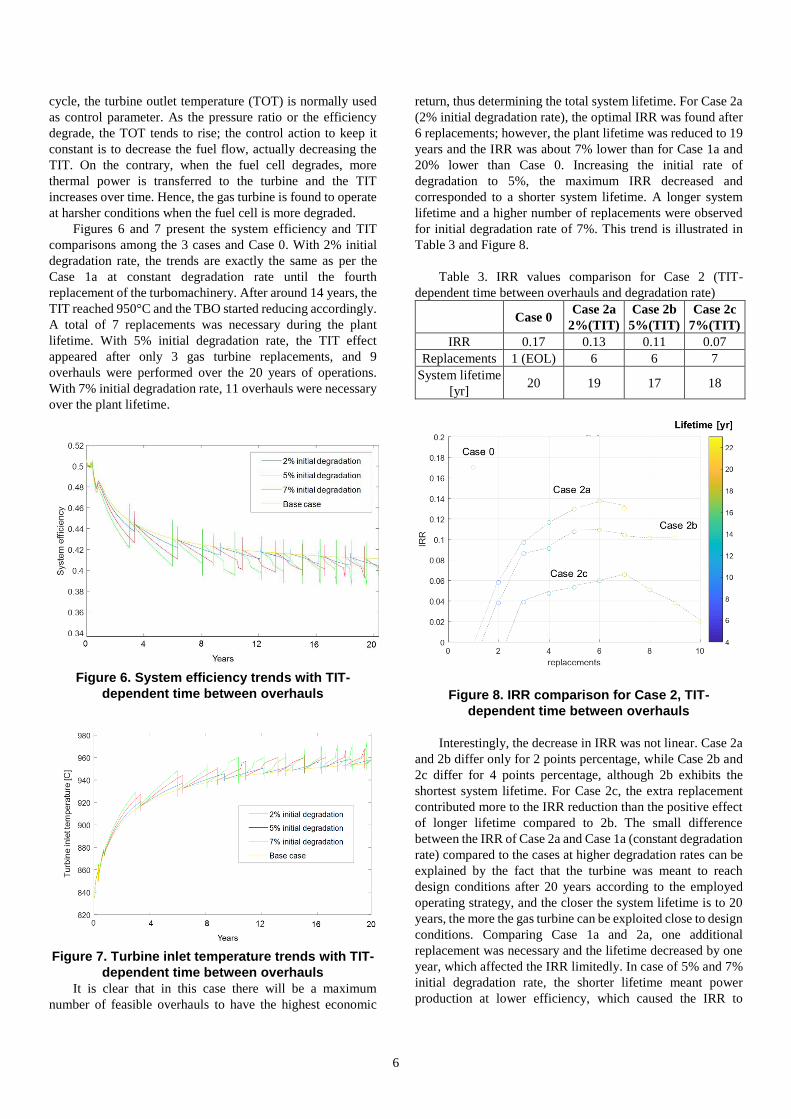
instantaneous rate. For example, Figure 5 shows the Case 2c
at initial degradation rate of 7% for efficiency and pressure
ratio: during the first 60,000 hours, the TIT was below 950°C
and β degraded at a constant rate in the same way as Case 1c.
As the temperature rose, the TBO was shorter and the slope of
β decay was not constant but dependent on the TIT (it was
assumed that the gas turbine replacements always occurred
when the total decay of β and η was 7% of the nominal values).
This interaction caused a self-propagating effect because a
higher degradation rate of β and η induced the temperature to
rise faster.
Figure 5. Cathode inlet pressure and turbine inlet
temperature trends with 7% initial degradation rate and TIT-dependent time between overhauls
This case is a clear example of how the interaction
between two degrading components (i.e. the fuel cell and the
micro gas turbine) aggravates system performance
degradation. As a matter of fact, in a traditional gas turbine
6
cycle, the turbine outlet temperature (TOT) is normally used
as control parameter. As the pressure ratio or the efficiency
degrade, the TOT tends to rise; the control action to keep it
constant is to decrease the fuel flow, actually decreasing the
TIT. On the contrary, when the fuel cell degrades, more
thermal power is transferred to the turbine and the TIT
increases over time. Hence, the gas turbine is found to operate
at harsher conditions when the fuel cell is more degraded.
Figures 6 and 7 present the system efficiency and TIT
comparisons among the 3 cases and Case 0. With 2% initial
degradation rate, the trends are exactly the same as per the
Case 1a at constant degradation rate until the fourth
replacement of the turbomachinery. After around 14 years, the
TIT reached 950°C and the TBO started reducing accordingly.
A total of 7 replacements was necessary during the plant
lifetime. With 5% initial degradation rate, the TIT effect
appeared after only 3 gas turbine replacements, and 9
overhauls were performed over the 20 years of operations.
With 7% initial degradation rate, 11 overhauls were necessary
over the plant lifetime.
Figure 6. System efficiency trends with TIT-
dependent time between overhauls
Figure 7. Turbine inlet temperature trends with TIT-
dependent time between overhauls
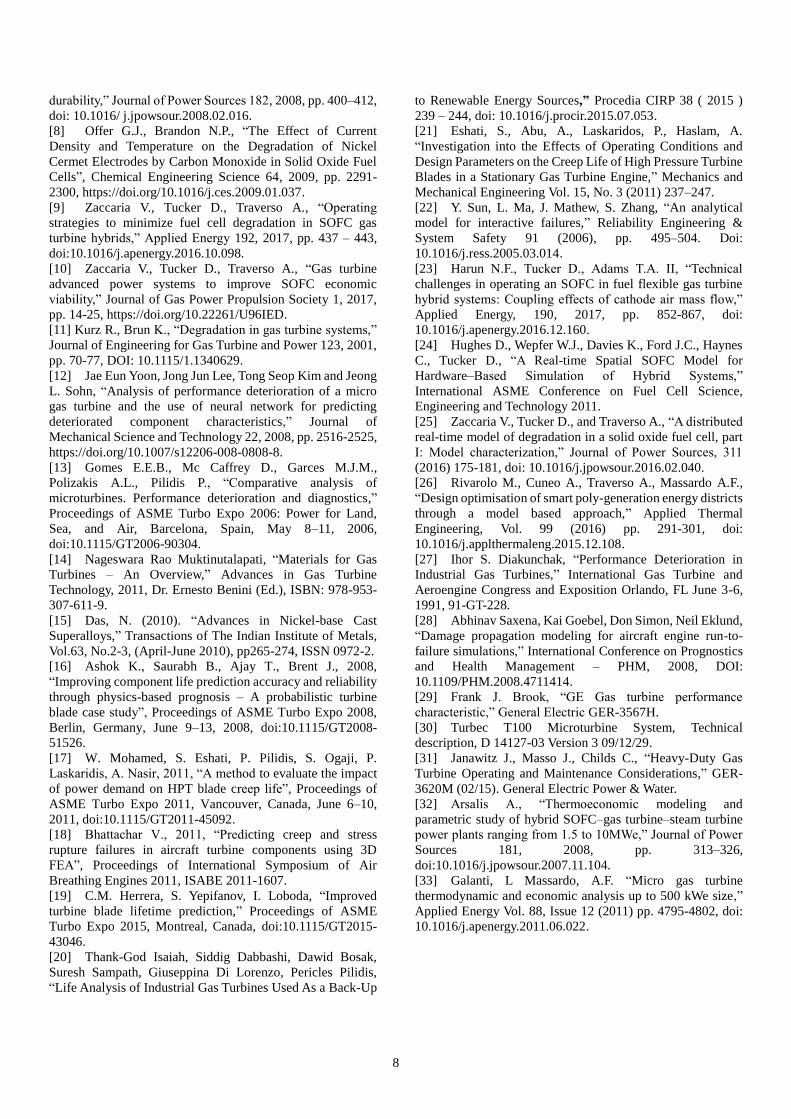
It is clear that in this case there will be a maximum
number of feasible overhauls to have the highest economic
return, thus determining the total system lifetime. For Case 2a
(2% initial degradation rate), the optimal IRR was found after
6 replacements; however, the plant lifetime was reduced to 19
years and the IRR was about 7% lower than for Case 1a and
20% lower than Case 0. Increasing the initial rate of
degradation to 5%, the maximum IRR decreased and
corresponded to a shorter system lifetime. A longer system
lifetime and a higher number of replacements were observed
for initial degradation rate of 7%. This trend is illustrated in
Table 3 and Figure 8.
Table 3. IRR values comparison for Case 2 (TIT-
dependent time between overhauls and degradation rate)
Case 0 Case 2a
2%(TIT)
Case 2b
5%(TIT)
Case 2c
7%(TIT)
IRR 0.17 0.13 0.11 0.07
Replacements 1 (EOL) 6 6 7
System lifetime
[yr] 20 19 17 18
Figure 8. IRR comparison for Case 2, TIT-
dependent time between overhauls
Interestingly, the decrease in IRR was not linear. Case 2a
and 2b differ only for 2 points percentage, while Case 2b and
2c differ for 4 points percentage, although 2b exhibits the
shortest system lifetime. For Case 2c, the extra replacement
contributed more to the IRR reduction than the positive effect
of longer lifetime compared to 2b. The small difference
between the IRR of Case 2a and Case 1a (constant degradation
rate) compared to the cases at higher degradation rates can be
explained by the fact that the turbine was meant to reach
design conditions after 20 years according to the employed
operating strategy, and the closer the system lifetime is to 20
years, the more the gas turbine can be exploited close to design
conditions. Comparing Case 1a and 2a, one additional
replacement was necessary and the lifetime decreased by one
year, which affected the IRR limitedly. In case of 5% and 7%
initial degradation rate, the shorter lifetime meant power
production at lower efficiency, which caused the IRR to

7
decrease more than the sole contribution of extra gas turbine
overhauls. After 7 replacements, the IRR in Case 2c dropped.
It is worth to notice that, even in the case with shorter
lifetime, Case 2b, the gas turbine power at the end of life was
390 kW, very close to the optimal size of 400 kW. However,
in general, system power share optimization should be
performed considering the interaction between a degraded fuel
cell and a degraded turbine, and the consequent reduction in
useful lifetime depending on the expected degradation rate of
β and η.
CONCLUSIONS
The effect of multiple components degradation on the
performance of a micro gas turbine fuel cell hybrid system was
analyzed. Two cases were taken into consideration: constant
degradation of compressor pressure ratio and gas turbine
efficiency over a fixed time between overhauls, and a TBO
depending on the operating TIT. The impact on system
efficiency, lifetime, and IRR was assessed by varying the
degradation rate of the gas turbine components between 2%
and 7%. The main conclusions are summarized by the
following bullet points:
With a constant TBO, the degradation rate of β and η
did not impact the system lifetime. The maximum
IRR was found for all cases at 20 years, considering
5 gas turbine overhauls over this period.
With constant TBO, the plant IRR decreased linearly
with increasing degradation rate of β and η from 2%
to 7%.
In all cases, the TIT exceeded the design value of
950°C before the end of life, indicating that a
replacement strategy based on the TIT would be
necessary to ensure system safe operations.
When the TBO was considered as a function of the
TIT, both system lifetime and IRR were strongly
dependent on the assumption of design degradation
rate.
In this latter case, performance degradation of the
fuel cell stack aggravated gas turbine degradation.
With a design degradation rate of 2% for β and η, a
20% reduction in IRR was observed compared to the
base case, due to the shorter system lifetime and the
additional gas turbine replacement.
With 5% design degradation rate, the larger
decrement in lifetime reduced IRR more despite only
one extra overhaul, resulting in a 14% lower IRR
(35% lower than the base case).
With 7% design degradation rate, a total of 7 gas
turbine overhauls over 18 years resulted in an IRR
60% lower than the case without gas turbine
deterioration.
Hence, when the interaction between degraded
components is considered, system lifetime and economic
return can change significantly. In designing the system (e.g.
the optimal power share between fuel cell and gas turbine) and
defining the operating strategy to mitigate degradation effect,
the interaction aspect needs to be taken into account.
For future work, an improved operating strategy will be
investigated, to regulate TIT and maximize the time between
overhauls.
NOMENCLATURE
CF Cash flow [$]
DR degradation rate [%]
IRR Internal rate of return
mGT micro gas turbine
NDRES non-dispatchable renewable energy sources
OEM original equipment manufacturer
OGB off-gas burner
P Larson-Miller parameter
SOFC solid oxide fuel cell
t time [yr]
TBO time between overhaul
TCI total capital investment [$]
TIT turbine inlet temperature [K]
TUO time until overhaul [yr]
η gas turbine cycle efficiency
β pressure ratio
ACKNOWLEDGMENTS
This work was partially supported by the Swedish
Knowledge Foundation (KKS). The authors would like to
acknowledge Professor Konstantinos Kyprianidis for his
helpful review of the work. This
project has received funding from the
European Union’s Horizon 2020
research and innovation programme
under grant agreement No 641073.
REFERENCES [1] International Energy Agency, “Repowering Market-
Market design and regulation during the transition to low-
carbon power systems,” Report, March 2016.
[2] Massardo A.F., McDonald C.F., Korakianitis T.,
“Microturbine/Fuel Cell coupling for high efficiency electrical
power generation”, Journal of Engineering for Gas Turbines
and Power 124, 2002, pp. 110-116, DOI: 10.1115/1.1398552.
[3] Song T.W., Sohn J.L., Kim T.S., Ro S.T., “Performance
characteristics of a MW-class SOFC/GT hybrid system based
on a commercially available gas turbine”, Journal of Power
Sources 158, 2006, pp. 361–367, doi:
10.1016/j.jpowsour.2005.09.031.
[4] McLarty D., Brouwer J., Samuelsen S., 2013, “Hybrid
Fuel Cell Gas Turbine System Design and Optimization,”
Journal of Fuel Cell Science and Technology 10, 2013, pp.
041005-1, DOI: 10.1115/1.4024569.
[5] Ferrari M.L., Traverso A., Massardo A.F., “Smart
polygeneration grids: experimental performance curves of
different prime movers,” Applied Energy 162, 2016, pp. 622–
630, doi:10.1016/j.apenergy.2015.10.144.
[6] Wang J., “Barriers of scaling-up fuel cells: cost,
durability and reliability,” Energy 80, 2014, pp. 509-521,
doi:10.1016/j.energy.2014.12.007.
[7] Yokokawa H., Tu H., Iwanshitz B., Mai A.,
“Fundamental mechanisms limiting solid oxide fuel cell
8
durability,” Journal of Power Sources 182, 2008, pp. 400–412,
doi: 10.1016/ j.jpowsour.2008.02.016.
[8] Offer G.J., Brandon N.P., “The Effect of Current
Density and Temperature on the Degradation of Nickel
Cermet Electrodes by Carbon Monoxide in Solid Oxide Fuel
Cells”, Chemical Engineering Science 64, 2009, pp. 2291-
2300, https://doi.org/10.1016/j.ces.2009.01.037.
[9] Zaccaria V., Tucker D., Traverso A., “Operating
strategies to minimize fuel cell degradation in SOFC gas
turbine hybrids,” Applied Energy 192, 2017, pp. 437 – 443,
doi:10.1016/j.apenergy.2016.10.098.
[10] Zaccaria V., Tucker D., Traverso A., “Gas turbine
advanced power systems to improve SOFC economic
viability,” Journal of Gas Power Propulsion Society 1, 2017,
pp. 14-25, https://doi.org/10.22261/U96IED.
[11] Kurz R., Brun K., “Degradation in gas turbine systems,”
Journal of Engineering for Gas Turbine and Power 123, 2001,
pp. 70-77, DOI: 10.1115/1.1340629.
[12] Jae Eun Yoon, Jong Jun Lee, Tong Seop Kim and Jeong
L. Sohn, “Analysis of performance deterioration of a micro
gas turbine and the use of neural network for predicting
deteriorated component characteristics,” Journal of
Mechanical Science and Technology 22, 2008, pp. 2516-2525,
https://doi.org/10.1007/s12206-008-0808-8.
[13] Gomes E.E.B., Mc Caffrey D., Garces M.J.M.,
Polizakis A.L., Pilidis P., “Comparative analysis of
microturbines. Performance deterioration and diagnostics,”
Proceedings of ASME Turbo Expo 2006: Power for Land,
Sea, and Air, Barcelona, Spain, May 8–11, 2006,
doi:10.1115/GT2006-90304.
[14] Nageswara Rao Muktinutalapati, “Materials for Gas
Turbines – An Overview,” Advances in Gas Turbine
Technology, 2011, Dr. Ernesto Benini (Ed.), ISBN: 978-953-
307-611-9.
[15] Das, N. (2010). “Advances in Nickel-base Cast
Superalloys,” Transactions of The Indian Institute of Metals,
Vol.63, No.2-3, (April-June 2010), pp265-274, ISSN 0972-2.
[16] Ashok K., Saurabh B., Ajay T., Brent J., 2008,
“Improving component life prediction accuracy and reliability
through physics-based prognosis – A probabilistic turbine
blade case study”, Proceedings of ASME Turbo Expo 2008,
Berlin, Germany, June 9–13, 2008, doi:10.1115/GT2008-
51526.
[17] W. Mohamed, S. Eshati, P. Pilidis, S. Ogaji, P.
Laskaridis, A. Nasir, 2011, “A method to evaluate the impact
of power demand on HPT blade creep life”, Proceedings of
ASME Turbo Expo 2011, Vancouver, Canada, June 6–10,
2011, doi:10.1115/GT2011-45092.
[18] Bhattachar V., 2011, “Predicting creep and stress
rupture failures in aircraft turbine components using 3D
FEA”, Proceedings of International Symposium of Air
Breathing Engines 2011, ISABE 2011-1607.
[19] C.M. Herrera, S. Yepifanov, I. Loboda, “Improved
turbine blade lifetime prediction,” Proceedings of ASME
Turbo Expo 2015, Montreal, Canada, doi:10.1115/GT2015-
43046.
[20] Thank-God Isaiah, Siddig Dabbashi, Dawid Bosak,
Suresh Sampath, Giuseppina Di Lorenzo, Pericles Pilidis,
“Life Analysis of Industrial Gas Turbines Used As a Back-Up
to Renewable Energy Sources,” Procedia CIRP 38 ( 2015 )
239 – 244, doi: 10.1016/j.procir.2015.07.053.
[21] Eshati, S., Abu, A., Laskaridos, P., Haslam, A.
“Investigation into the Effects of Operating Conditions and
Design Parameters on the Creep Life of High Pressure Turbine
Blades in a Stationary Gas Turbine Engine,” Mechanics and
Mechanical Engineering Vol. 15, No. 3 (2011) 237–247.
[22] Y. Sun, L. Ma, J. Mathew, S. Zhang, “An analytical
model for interactive failures,” Reliability Engineering &
System Safety 91 (2006), pp. 495–504. Doi:
10.1016/j.ress.2005.03.014.
[23] Harun N.F., Tucker D., Adams T.A. II, “Technical
challenges in operating an SOFC in fuel flexible gas turbine
hybrid systems: Coupling effects of cathode air mass flow,”
Applied Energy, 190, 2017, pp. 852-867, doi:
10.1016/j.apenergy.2016.12.160.
[24] Hughes D., Wepfer W.J., Davies K., Ford J.C., Haynes
C., Tucker D., “A Real-time Spatial SOFC Model for
Hardware–Based Simulation of Hybrid Systems,”
International ASME Conference on Fuel Cell Science,
Engineering and Technology 2011.
[25] Zaccaria V., Tucker D., and Traverso A., “A distributed
real-time model of degradation in a solid oxide fuel cell, part
I: Model characterization,” Journal of Power Sources, 311
(2016) 175-181, doi: 10.1016/j.jpowsour.2016.02.040.
[26] Rivarolo M., Cuneo A., Traverso A., Massardo A.F.,
“Design optimisation of smart poly-generation energy districts
through a model based approach,” Applied Thermal
Engineering, Vol. 99 (2016) pp. 291-301, doi:
10.1016/j.applthermaleng.2015.12.108.
[27] Ihor S. Diakunchak, “Performance Deterioration in
Industrial Gas Turbines,” International Gas Turbine and
Aeroengine Congress and Exposition Orlando, FL June 3-6,
1991, 91-GT-228.
[28] Abhinav Saxena, Kai Goebel, Don Simon, Neil Eklund,
“Damage propagation modeling for aircraft engine run-to-
failure simulations,” International Conference on Prognostics
and Health Management – PHM, 2008, DOI:
10.1109/PHM.2008.4711414.
[29] Frank J. Brook, “GE Gas turbine performance
characteristic,” General Electric GER-3567H.
[30] Turbec T100 Microturbine System, Technical
description, D 14127-03 Version 3 09/12/29.
[31] Janawitz J., Masso J., Childs C., “Heavy-Duty Gas
Turbine Operating and Maintenance Considerations,” GER-
3620M (02/15). General Electric Power & Water.
[32] Arsalis A., “Thermoeconomic modeling and
parametric study of hybrid SOFC–gas turbine–steam turbine
power plants ranging from 1.5 to 10MWe,” Journal of Power
Sources 181, 2008, pp. 313–326,
doi:10.1016/j.jpowsour.2007.11.104.
[33] Galanti, L Massardo, A.F. “Micro gas turbine
thermodynamic and economic analysis up to 500 kWe size,”
Applied Energy Vol. 88, Issue 12 (2011) pp. 4795-4802, doi:
10.1016/j.apenergy.2011.06.022.