Influence of Infill Panels and their Distribution on ... · PDF fileSend Orders of Reprints at...
18
Send Orders of Reprints at [email protected] 236 The Open Construction and Building Technology Journal, 2012, 6, (Suppl 1-M15) 236-253 1874-8368/12 2012 Bentham Open Open Access Influence of Infill Panels and their Distribution on Seismic Behavior of Existing Reinforced Concrete Buildings Gaetano Manfredi 1 , Paolo Ricci* ,1 and Gerardo M. Verderame 1 1 Department of Structural Engineering, University of Naples Federico II, Via Claudio 21, 80125 Naples, Italy Abstract: Infills can highly influence the seismic response of a Reinforced Concrete (RC) building: generally speaking, their presence leads to an increase in global stiffness and strength, but their brittle behavior can result in an increase of displacement demand if a certain threshold of seismic intensity is overcome. Moreover, presence of infills often leads to a change in the collapse mechanism compared with the bare structure, leading, for instance, to column-sway storey mecha- nisms characterized by a detrimental localization of inelastic displacement demand. In this paper, a numerical investiga- tion of the influence of infills on the seismic behavior of a case-study existing gravity load designed RC building is car- ried out. Different infill configurations are considered (Bare, Uniformly infilled and Soft-storey infilled). Seismic capacity assessment is carried out by means of Static Push-Over analyses, within the N2 spectral assessment framework. A sensi- tivity analysis is carried out, thus evaluating the influence of main material and model parameters on seismic response at different Limit States, namely Damage Limitation and Near Collapse, mainly due to the change in parameters as effective period of vibration, base shear and displacement capacity. Keywords: Existing, infills, infill distribution, reinforced concrete, seismic capacity, sensitivity analysis. INTRODUCTION A growing attention is addressed to the influence of in- fills on the seismic behavior of Reinforced Concrete (RC) buildings. Their presence leads to an increase in lateral stiff- ness, thus modifying the dynamic properties of the structure, resulting in a lower period of vibration [1]. The local interac- tion between the panels and the adjacent structural elements can lead to brittle failure mechanisms [2], also of a kind that may not be considered in an usual seismic design or assess- ment: for instance, sliding shear failure may take place at the interface between column element and joint panel [3]. Dur- ing last decades, the importance of this issue was widely recognized by earthquake engineering researchers, also based on the observation of damage to RC buildings with infills after severe earthquakes (e.g., Kocaeli 1999 [4]), lead- ing to first full-scale experimental tests on infilled RC frames [5] and code prescriptions about the consideration of infills in seismic design [6]. As a result, from the second half of 1990s on, several valuable numerical efforts have been made to investigate the seismic behavior of RC frames with infills through nonlinear analyses. Fardis and Panagiotakos [7] and Kappos et al., [8] evaluated the influence of infills on the seismic response of RC frames designed for seismic loads according to contemporary earthquake engineering principles [6]. Further studies [9, 10] focused the attention on different issues of seismic behavior of infilled frames such as the localization of displacement demand and the in- crease in stiffness and strength, also based on experimental *Address correspondence to this author at the Department of Structural Engineering, University of Naples Federico II, Via Claudio 21, 80125 Naples, Italy; Tel: +390817683672; Fax +390817685921; E-mails: [email protected]; results [5, 11]. Fundamental studies were carried out by Dolšek and Fajfar: the authors analyzed the influence of in- fills on seismic demand depending on their mechanical char- acteristics and the design typology of the RC structure [12] and modeling issues of infilled RC frames [13]. In [14] the authors proposed a R-μ-T relationship accounting for the typical degrading force-displacement response of an infilled RC frame, in order to carry out the seismic assessment of infilled RC frames through the N2 method [15]. Such rela- tionship was applied to the seismic assessment of two case- study structures in [16]. The same procedure was applied to a case study structure in different infill configurations in [17] and [18], leading to a simplified estimation of failure prob- ability at different Limit States, taking into account the influ- ence of the uncertainty in capacity and response of infill elements. The influence of uncertainty on seismic capacity of infilled RC frames was analyzed in [19] through the con- struction of fragility curves and in [20] by means of a sensitivity analysis. In this paper, a numerical investigation on the influence of infills on the seismic behavior of a case-study Gravity Load Designed (GLD) building is carried out by means of Static Push-Over (SPO) analyses, within the N2 spectral assessment framework. Different infill configurations are considered (Bare, Uniformly infilled and Soft-storey in- filled), and a sensitivity analysis is carried out, thus evaluat- ing the influence of main material and capacity parameters on seismic response for different Limit States. CASE STUDY STRUCTURE: NUMERICAL MODEL- LING AND ANALYSIS METHODOLOGY The case study structure is a GLD building, defined by means of a simulated design procedure according to code prescriptions and design practices in force in Italy between
-
Upload
duongxuyen -
Category
Documents
-
view
218 -
download
1
Transcript of Influence of Infill Panels and their Distribution on ... · PDF fileSend Orders of Reprints at...

Send Orders of Reprints at [email protected]
236 The Open Construction and Building Technology Journal, 2012, 6, (Suppl 1-M15) 236-253
1874-8368/12 2012 Bentham Open
Open Access Influence of Infill Panels and their Distribution on Seismic Behavior of Existing Reinforced Concrete Buildings Gaetano Manfredi1, Paolo Ricci*,1 and Gerardo M. Verderame1
1Department of Structural Engineering, University of Naples Federico II, Via Claudio 21, 80125 Naples, Italy
Abstract: Infills can highly influence the seismic response of a Reinforced Concrete (RC) building: generally speaking, their presence leads to an increase in global stiffness and strength, but their brittle behavior can result in an increase of displacement demand if a certain threshold of seismic intensity is overcome. Moreover, presence of infills often leads to a change in the collapse mechanism compared with the bare structure, leading, for instance, to column-sway storey mecha-nisms characterized by a detrimental localization of inelastic displacement demand. In this paper, a numerical investiga-tion of the influence of infills on the seismic behavior of a case-study existing gravity load designed RC building is car-ried out. Different infill configurations are considered (Bare, Uniformly infilled and Soft-storey infilled). Seismic capacity assessment is carried out by means of Static Push-Over analyses, within the N2 spectral assessment framework. A sensi-tivity analysis is carried out, thus evaluating the influence of main material and model parameters on seismic response at different Limit States, namely Damage Limitation and Near Collapse, mainly due to the change in parameters as effective period of vibration, base shear and displacement capacity.
Keywords: Existing, infills, infill distribution, reinforced concrete, seismic capacity, sensitivity analysis.
INTRODUCTION
A growing attention is addressed to the influence of in-fills on the seismic behavior of Reinforced Concrete (RC) buildings. Their presence leads to an increase in lateral stiff-ness, thus modifying the dynamic properties of the structure, resulting in a lower period of vibration [1]. The local interac-tion between the panels and the adjacent structural elements can lead to brittle failure mechanisms [2], also of a kind that may not be considered in an usual seismic design or assess-ment: for instance, sliding shear failure may take place at the interface between column element and joint panel [3]. Dur-ing last decades, the importance of this issue was widely recognized by earthquake engineering researchers, also based on the observation of damage to RC buildings with infills after severe earthquakes (e.g., Kocaeli 1999 [4]), lead-ing to first full-scale experimental tests on infilled RC frames [5] and code prescriptions about the consideration of infills in seismic design [6]. As a result, from the second half of 1990s on, several valuable numerical efforts have been made to investigate the seismic behavior of RC frames with infills through nonlinear analyses. Fardis and Panagiotakos [7] and Kappos et al., [8] evaluated the influence of infills on the seismic response of RC frames designed for seismic loads according to contemporary earthquake engineering principles [6]. Further studies [9, 10] focused the attention on different issues of seismic behavior of infilled frames such as the localization of displacement demand and the in-crease in stiffness and strength, also based on experimental
*Address correspondence to this author at the Department of Structural Engineering, University of Naples Federico II, Via Claudio 21, 80125 Naples, Italy; Tel: +390817683672; Fax +390817685921; E-mails: [email protected];
results [5, 11]. Fundamental studies were carried out by Dolšek and Fajfar: the authors analyzed the influence of in-fills on seismic demand depending on their mechanical char-acteristics and the design typology of the RC structure [12] and modeling issues of infilled RC frames [13]. In [14] the authors proposed a R-µ-T relationship accounting for the typical degrading force-displacement response of an infilled RC frame, in order to carry out the seismic assessment of infilled RC frames through the N2 method [15]. Such rela-tionship was applied to the seismic assessment of two case-study structures in [16]. The same procedure was applied to a case study structure in different infill configurations in [17] and [18], leading to a simplified estimation of failure prob-ability at different Limit States, taking into account the influ-ence of the uncertainty in capacity and response of infill elements. The influence of uncertainty on seismic capacity of infilled RC frames was analyzed in [19] through the con-struction of fragility curves and in [20] by means of a sensitivity analysis.
In this paper, a numerical investigation on the influence of infills on the seismic behavior of a case-study Gravity Load Designed (GLD) building is carried out by means of Static Push-Over (SPO) analyses, within the N2 spectral assessment framework. Different infill configurations are considered (Bare, Uniformly infilled and Soft-storey in-filled), and a sensitivity analysis is carried out, thus evaluat-ing the influence of main material and capacity parameters on seismic response for different Limit States.
CASE STUDY STRUCTURE: NUMERICAL MODEL-LING AND ANALYSIS METHODOLOGY
The case study structure is a GLD building, defined by means of a simulated design procedure according to code prescriptions and design practices in force in Italy between

Influence of Infill Panels and their Distribution The Open Construction and Building Technology Journal, 2012, Volume 6 237
1950s and 1970s [21, 22]. The building is symmetric in plan, both in longitudinal (X) and in transverse (Y) direction. It is a four-storey building, with five bays in longitudinal direc-tion and three bays in transverse direction. Interstorey height is equal to 3.0 m, bay length is equal to 4.5 m. The structural configuration follows the parallel plane frames system: grav-ity loads from slabs are carried only by frames in longitudi-nal direction. Beams in transverse direction are present only in the external frames. Slab way is always parallel to the transverse direction. Element dimensions are calculated ac-cording to the allowable stresses method; the design value for maximum concrete compressive stress is assumed equal to 5.0 and 7.5 MPa for axial load and axial load combined with bending, respectively. Column dimensions are calcu-lated according only to the axial load, beam dimensions and reinforcement are determined from bending due to loads from slabs. Reinforcement in columns corresponds to the minimum amount of 0.8% of the section area, as prescribed by code [21]. Reinforcing bars are smooth.
Three hypotheses are made for infills: Case 1: infill panels are uniformly distributed along the
height (Uniformly infilled frame, see Fig. (1a). Case 2: first storey is bare and upper storeys are infilled
(Pilotis frame, see Fig. (1b)). Case 3: no infill panel is present (Bare frame, see Fig.
(1c)). Infill panels, if present, are uniformly distributed in all
the external frames of the building. Panel thickness is equal to 20cm. Presence of openings is not taken into account.
Nonlinear response of RC elements is modelled by means of a lumped plasticity approach: beams and columns are represented by elastic elements with rotational hinges at the ends. A three-linear envelope is used, characteristic points are cracking, yielding and ultimate. Section moment and curvature at cracking and yielding are calculated on a fiber section, for an axial load value corresponding to gravity loads. The behavior is assumed linear elastic up to cracking and perfectly-plastic after yielding. Rotations at yielding and ultimate are evaluated through the formulations given in [23]. No reduction of ultimate rotation for the lack of seismic detailing is applied, due to the presence of smooth rein-forcement [24].
Infill panels are modelled by means of equivalent struts. The adopted model for the envelope curve of the force-displacement relationship is the model proposed by in [25, 26]. The ratio between post-capping degrading stiffness and elastic stiffness (parameter α) is assumed equal to 0.03. The ratio between residual strength and maximum strength (pa-rameter β) is assumed equal to 0.01.
Nonlinear SPO analyses are performed on the case study building both in X and Y direction. The assumed lateral load pattern is proportional to the displacement shape of the first mode. Lateral response is evaluated in terms of base shear-top displacement relationship. Structural modelling, numeri-cal analyses and post-processing of damage data, including the 3D graphic visualization of the deformed shape, are per-formed through the “PBEE toolbox” software [27], combin-ing MATLAB® with OpenSees [28], modified in order to include also infill elements [20, 29]. Each SPO analysis run took about 180 or 90 seconds on a standard Intel® Core™ 2 Duo processor, if infills were present or not in the numerical model, respectively.
When the lateral response is characterized by a strength degradation due to infill failure, a multi-linearization of the pushover curve is carried out by applying the equal energy rule respectively between the initial point and the maximum resistance point, between the maximum resistance point and the point corresponding to the last infill failure, between the point corresponding to the last infill failure and the point corresponding to the first RC element conventional collapse. When the lateral response is not characterized by a strength degradation (because infill elements are not present or not involved in the collapse mechanism) an elasto-plastic bi-linearization is carried out by applying the equal energy rule between the initial point and the maximum resistance point. Moreover, the procedure proposed in [16] to improve the accuracy of the displacement demand assessment in the case of low seismic demand is applied, by approximating the first part of the pushover curve by a bilinear curve rather than a linear one and applying specific R-µ-T relationships in this range of behavior, as proposed by the authors.
Two limit states are defined: Damage Limitation (DL), corresponding to the displacement when the last infill in a storey reaches its maximum resistance thus starting to degrade [17] or when the first yielding in RC members oc-
Fig. (1). Uniformly infilled (a), Pilotis (b) and Bare (c) frames

238 The Open Construction and Building Technology Journal, 2012, Volume 6 Manfredi et al.
curs, and Near Collapse (NC), corresponding to the first conventional collapse in RC members.
IN2 curves [30] for the equivalent SDOF systems are ob-tained by assuming as Intensity Measure both the elastic spectral acceleration at the period of the equivalent SDOF system (Sae(Teff)) and the Peak Ground Acceleration (PGA). Values of these seismic intensity parameters corresponding to characteristic values of displacement (ductility) demand (including the considered Limit States) are calculated, based on the R-µ-T relationships given in [14] or in [31] for de-grading or non-degrading response, respectively.
The R-µ-T proposed by Dolšek and Fajfar [14] is aimed at evaluating the inelastic displacement demand starting from elastic demand spectra based on SDOF systems charac-terized by the typical idealized force-displacement envelope of an infilled RC frame see Fig. (2).
Fig. (2). Force-displacement envelope of the SDOF system [14].
The first, equivalent elastic part represented both the ini-tial elastic behavior and the behavior after cracking has oc-curred in both the frame and the infills. The second part, corresponding to the horizontal branch, represented yielding. The third part represented the strength degradation of the infills. Then, the horizontal branch represented the stage when infills are failed and only the RC frame resists the horizontal actions. A parametric study was carried out exe-cuting nonlinear dynamic analyses on the considered SDOF system with three sets of 7 accelerograms, varying different parameters: • T/TC: ratio between the period of the SDOF system and
the corner period of the ground motion; • ru: ratio between the residual strength and the maximum
strength (F3/F1, see Fig. (2)); • µs: ductility at the beginning of the degradation (D2/D1);
• µu: ductility at the end of the degradation (D3/D1).
Based on obtained results, an increase in ductility de-mand was observed with decreasing ru. Moreover, it was observed that µu had a negligible influence on ductility de-mand. Hence, this parameter was not included in the pro-posed relationship. It can also be observed that, from a quali-tative standpoint, based on this relationship, the sudden in-crease in displacement demand observed when a soft-storey occurs in uniformly infilled structures for a seismic demand exceeding a certain threshold (e.g., [12]) may be explained not only by the localization of the displacement demand, but also by the typical brittle behavior shown by the structural response when this is controlled by the response of a storey where the infills fail; such a strength drop is represented through the parameter ru. Based on such relationship, seismic assessment of infilled RC buildings can be included within the spectral framework of the N2 method [15], through SPO analyses.
Elastic spectra are the Uniform Hazard Newmark-Hall demand spectra adopted in Italian code [32] – provided by [33] – for a high seismic city in Southern Italy (Avellino, Lon.: 14.793 Lat.: 40.915). Soil type A (stiff soil) and 1st topographic category are assumed (no amplification for stratigraphic or topographic effects). It is worth noting that a double iterative procedure is required to evaluate Sae(Teff) and PGA from the characteristic parameters of equivalent SDOF system – namely the ductility at the point of interest (µ), the period (Teff) and for degrading systems also the duc-tility at the beginning of the degradation (µs) and the ratio between the residual strength and the maximum strength (ru) – for the following reasons: • The spectral shape depends on some parameters, such as
the corner period (TC) and the ratio between the spectral acceleration on the constant branch and the PGA (F0), which are not constant with the seismic intensity (i.e., with the return period), hence also the ratio between Sae(Teff) and PGA changes with the seismic intensity;
• Some characteristic parameters of the elastic spectrum, such as TC, are input parameters for the R-µ-T relation-ship, but also depends on the results obtained from the R-µ-T relationship since they depends on the seismic inten-sity.
Due to the fact that the ratio between Sae(Teff) and PGA is not constant, the IN2 curves in terms of Sae(Teff) or in terms of PGA may have different shapes.
Table 1. Summary of median and CoV values for the selected Random Variables.
R.V. Median Value Reference Distribution CoV Reference
fc 25.0 MPa [35] Lognormal 0.310 [35]
fy 369.7 MPa [36] Lognormal 0.080 [36]
Gw 1240 MPa [26] Lognormal 0.300 [19, 37, 38]
θy 1.015*calculated [23]
(Eq. 2.20a, Table 2.4) Lognormal 0.331
[23] (Table 2.4)
θu 0.995*calculated [23]
(Eq. 3.27a, Table 3.2) Lognormal 0.409
[23] (Table 3.2)

Influence of Infill Panels and their Distribution The Open Construction and Building Technology Journal, 2012, Volume 6 239
Demand spectra are provided by INGV [33] in terms of parameters PGA, F0 and TC* (which is multiplied by another coefficient depending on stratigraphic characteristics, CC, to obtain TC) for a range of return periods from 30 to 2475 years. For intermediate values of seismic intensity, an inter-polation procedure is proposed [32]. Nevertheless, in this study there is the need to extend elastic demand spectra above and below the extreme values, as in [34]. To this aim, the formulations proposed for the interpolation procedure are also used to extrapolate the above mentioned parameters out of the given range of values.
In order to evaluate the influence of material characteris-tics and element capacity on the seismic response of the case study structure, the following parameters are selected as Random Variables to carry out a sensitivity analysis: • Concrete compressive strength fc; • Steel yield strength fy; • Infill shear elastic modulus Gw; • Chord rotation at yielding in RC members θy; • Chord rotation at ultimate in RC members θu.
A lognormal distribution is assumed for all of the Ran-dom Variables. Each distribution is defined through the cen-tral (median) value and the Coefficient of Variation (CoV), see Table 1.
For the concrete compressive strength, reference values come from a statistical analysis on the mechanical properties of concrete employed in Italy during 1960s [35]. For the steel yield strength, values are referred to Aq50 steel typol-ogy, the most widely spread in Italy during 1960s [36].
The determination of infill material characteristics is af-fected by high difficulties and uncertainties, and literature does not offer an enough large amount of experimental data. In this study, a median value of 1240 MPa for the shear elas-tic modulus Gw is adopted, based on wallette tests carried out at the University of Pavia on specimens made up of hollow clay bricks with a void ratio of 42%, selected as representa-tive of typical light non-structural masonry [26]. Neverthe-less, there are further infill mechanical characteristics to be determined in order to define, according to the adopted model, the load-displacement relationship of the infill trusses, namely the elastic Young’s modulus Ew and the shear cracking stress τcr. A certain amount of correlation cer-
Fig. (3). Schematic construction of an IN2 curve in terms of Sae(Teff) (a) and PGA (b) for Model #1 – Uniformly infilled frame – X direction (elastic demand spectra at DL and NC are reported as solid yellow and red curves, respectively; diamonds and squares correspond to elastic and inelastic acceleration-displacement demand points, respectively).
Uniformly infilled frame – X direction
Fig. (4). Obtained (black) and idealized (red) pushover curves and IN2 (blue) curve (a); deformed shape and element damage at NC (b) (Model #1 – Uniformly Infilled frame – X direction).
0 0.02 0.04 0.06 0.08 0.1 0.12 0.140
0.5
1
1.5
2
2.5
Sd [m]
S ae(T
eff) [
g]
0 0.02 0.04 0.06 0.08 0.1 0.12 0.140
0.5
1
1.5
2
2.5
Sd [m]
PGA
[g]
PGANC
PGADL
0 0.02 0.04 0.06 0.08 0.1 0.12 0.140
0.5
1
1.5
2
2.5
Top displacement in X direction [m]
Sa
e(T
eff)
[g]
(a) (b)

240 The Open Construction and Building Technology Journal, 2012, Volume 6 Manfredi et al.
tainly exists between these parameters, although it is not easy at all to be determined. In this study, a fully correlation is assumed, based on the proposal of the Italian code [39] for the mechanical characteristics of hollow clay brick panels. Hence, the ratio between Ew and Gw is assumed equal to 10/3, whereas τcr is assumed as linearly dependent on Gw, assuming τcr equal to 0.3 and 0.4 MPa for Gw equal to 1080 and 1620 MPa, respectively. As far as the modelling of un-certainty in infill mechanical characteristics is concerned, based on some indications from literature [19, 37, 38] a CoV equal to 0.30 is assumed for Gw.
As far as deformations at yielding and ultimate in RC members are concerned, median and CoV values are evalu-ated starting from the values calculated through the formula-tions proposed in [23] and using median and CoV values of
the experimental-to-predicted ratio, as illustrated by the author.
SENSITIVITY OF SEISMIC CAPACITY TO MATE-RIAL AND MODEL VARIABLES
Based on the assumed Random Variables, a sensitivity analysis is carried out to investigate the influence of each variable on the seismic capacity of the case study structure. To this aim, two models are generated for each random vari-able assuming median-minus-1.7-standard-deviation and median-plus-1.7-standard-deviation values for the consid-ered variable, and median values for the remaining variables. In addition to these analyses, another one is carried out as-suming median values for all of the variables (Model #1).
In the following, obtained results are presented and dis-cussed for Uniformly infilled, Pilotis and Bare frames, in
Fig. (5). Results of sensitivity analysis for NC (a) and DL (b) LSs (Uniformly Infilled frame – X direction).
Table 2. Results of pushover and IN2 analyses on the Uniformly Infilled frame in X direction.
Mod
el N
o.
Mod
ified
V
aria
ble
Val
ue
Tel [s
ec]
Δlim
[m]
Δco
ll [m
]
Tef
f [se
c]
µ s
Cs,m
ax [g
]
Cs,m
in [g
]
r u
µ lim
µ col
l
Rlim
Rco
ll
S ae,
lim [g
]
S ae,
coll [
g]
PGA
lim [g
]
PGA
coll [
g]
Stor
ey in
-vo
lved
in
colla
pse
ΔPG
A,N
C
[%]
ΔPG
A,li
m
[%]
1 - - 0.13 0.01 0.14 0.16 3.04 0.73 0.29 0.39 2.21 23.26 1.33 2.97 0.97 2.17 0.38 0.80 1 - -
2 fc µ-1.7σ 0.13 0.01 0.11 0.16 2.89 0.70 0.26 0.37 2.23 18.74 1.34 2.62 0.94 1.84 0.37 0.69 1 -14.4 -2.5
3 " µ+1.7σ 0.13 0.01 0.17 0.16 2.94 0.76 0.30 0.40 2.15 27.21 1.31 3.19 0.99 2.42 0.39 0.90 1 12.3 2.5
4 fy µ-1.7σ 0.13 0.01 0.14 0.16 3.00 0.73 0.27 0.37 2.21 23.29 1.33 2.88 0.97 2.10 0.38 0.78 1 -3.1 0.2
5 " µ+1.7σ 0.13 0.01 0.14 0.16 3.04 0.73 0.30 0.41 2.20 23.28 1.33 3.08 0.97 2.24 0.38 0.83 1 3.4 -0.2
6 Gw µ-1.7σ 0.16 0.02 0.16 0.20 3.44 0.57 0.23 0.41 2.41 20.95 1.50 3.74 0.85 2.13 0.34 0.79 2 -2.2 -10.8
7 " µ+1.7σ 0.10 0.01 0.14 0.13 2.57 1.00 0.29 0.29 2.21 25.46 1.25 2.01 1.26 2.02 0.52 0.85 1 6.0 35.7
8 θy µ-1.7σ 0.13 0.01 0.14 0.16 3.05 0.73 0.29 0.39 2.20 23.19 1.33 2.97 0.97 2.17 0.38 0.80 1 0.0 0.1
9 " µ+1.7σ 0.13 0.01 0.14 0.16 3.02 0.73 0.29 0.39 2.21 23.38 1.33 2.98 0.97 2.17 0.38 0.80 1 0.1 -0.2
10 θu µ-1.7σ 0.13 0.01 0.07 0.16 3.04 0.73 0.29 0.39 2.21 12.21 1.33 2.25 0.97 1.64 0.38 0.62 1 -23.0 0.0
11 " µ+1.7σ 0.13 0.01 0.27 0.16 3.04 0.73 0.29 0.39 2.21 44.82 1.33 4.17 0.97 3.04 0.38 1.15 1 42.6 0.0
-60 -40 -20 0 20 40 60
thy
fy
Gw
fc
thu
Change in PGA at collapse (%)
Va
ria
ble
Sensitivity analysis
Upper value
Lower value
-60 -40 -20 0 20 40 60
thu
thy
fy
fc
Gw
Change in PGA at last infill maximum (%)
Va
riab
le
Sensitivity analysis
Upper value
Lower value
(a) (b)

Influence of Infill Panels and their Distribution The Open Construction and Building Technology Journal, 2012, Volume 6 241
both longitudinal (X) and transverse (Y) directions and at Damage Limitation and Near Collapse Limit States. Ob-tained and idealized pushover curves and corresponding IN2 curves – both in terms of Sae(Teff) and PGA – are reported for different models, in black, red and blues colors, respectively. The [Sd, Sae(Teff)] and [Sd, PGA] points on IN2 curves corre-sponding to DL and NC Limit State are reported as yellow and red circles, respectively. The dashed horizontal branch in IN2 curves after the NC Limit State conventionally repre-sents the structural failure [18]. The schematic construction of an IN2 curve, both in terms of Sae(Teff) and PGA, is illus-trated in Fig. (3), referring to Model #1 of Uniformly infilled frame in X direction.
It is to be noted that the influence of each single variable, which will be illustrated through the sensitivity analysis, not only depends on the influence of the variable on the seismic response, but also depends on the dispersion assumed for that variable through the assigned CoV, which leads to con-sider – as Lower and Upper limits – values more or less dis-tant from the central (median) value.
Pushover and IN2 curves for Model #1 of Uniformly in-filled frame in X direction are reported in Fig. (4a), de-formed shape at NC is reported in Fig. (4b). Results of sensi-tivity analysis for NC and DL Limit States are reported in Figs. (5a and 5b), respectively. Numerical results are also reported in Table 2.
The building collapses under a soft-storey mechanism at the 1st storey in all cases except when a lower value is as-sumed for infill mechanical characteristics: in this case there is a soft-storey mechanism at the 2nd storey.
The sensitivity analysis shows that θu has the highest in-fluence on the PGA at collapse. This is clearly due to the fact the displacement capacity at collapse is directly given by the rotational capacity of columns, given the soft-storey collapse mechanism. Thus, an increase in θu results in an increase in the MDOF displacement capacity at first RC element col-lapse (Dcollapse), that is, an increase in the ductility at first RC element collapse (µcollapse), leading to higher values of Sae(Teff) leading to collapse (Sae,collapse) (see Fig. (6a)) and, hence, of the corresponding PGA (PGAcollapse) (see Fig. (6b)). Vice versa if θu decreases. fc influences the collapse capacity through the value of θu: given equal the axial load, as fc increases the axial load ratio decreases and the rota-tional capacity of the columns increases, thus leading to a higher global ductility. Vice versa if fc decreases. When Ew, Gw and τcr increase, several effects can be observed: the in-crease in stiffness and strength leads to a lower Teff and a higher maximum inelastic acceleration capacity (Cs,max); the minimum inelastic acceleration capacity (Cs,min) does not change significantly, hence a detrimental decrease in ru is observed. Dcollapse does not change significantly, but the decrease in the displacement at yielding of the equivalent SDOF system (Sdy) leads to an increase in µcollapse. These effects globally lead to a much lower value of the strength reduction factor at collapse (Rcollapse); however, the higher base shear capacity Cs,max leads to a value of Sae,collapse only slightly lower, compared with Model #1 (see Fig. (7a)). Nevertheless, due to the decrease in Teff, this lower value of Sae,collapse corresponds to a higher value of PGAcollapse (see Fig. (7b)). Opposite observations, compared with the previ-ous case, can be made when Ew, Gw and τcr increase, thus resulting in a lower PGAcollapse (see Fig. (7b)). When Ew,
Fig. (6). Obtained (black) and idealized (red) pushover curves and IN2 (blue) curves in terms of Sae(Teff) (a) and PGA (b) for Models #10, #1 and #11: Lower, Median and Upper values for θu (Uniformly Infilled frame – X direction).
Fig. (7). Obtained (black) and idealized (red) pushover curves and IN2 (blue) curves in terms of Sae(Teff) (a) and PGA (b) for Models #6, #1 and #7: Lower, Median and Upper values for infill mechanical characteristics (Uniformly Infilled frame – X direction).
0 0.05 0.1 0.15 0.2 0.25 0.3 0.350
0.5
1
1.5
2
2.5
3
3.5
Top displacement in X direction [m]
Sa
e(T
eff)
[g]
0 0.05 0.1 0.15 0.2 0.25 0.3 0.350
0.2
0.4
0.6
0.8
1
1.2
1.4
Top displacement in X direction [m]
PG
A [g
]
(a) (b)
0 0.02 0.04 0.06 0.08 0.1 0.12 0.14 0.160
0.5
1
1.5
2
2.5
Top displacement in X direction [m]
Sae
(Tef
f) [g]
0 0.02 0.04 0.06 0.08 0.1 0.12 0.14 0.160
0.1
0.2
0.3
0.4
0.5
0.6
0.7
0.8
0.9
Top displacement in X direction [m]P
GA
[g]
(a) (b)

242 The Open Construction and Building Technology Journal, 2012, Volume 6 Manfredi et al.
Gw and τcr decrease, the building collapses under a soft-storey mechanism at the 2nd storey instead of the 1st one. From a qualitative standpoint, a higher infill strength leads to a more uniform distribution of maximum interstorey shear strength along the height of the building: more uniform this distribution, higher the probability to have a soft storey mechanism at the 1st storey, where the shear demand is higher. For the same reason, a lower infill strength may lead to the formation of a soft-storey mechanism at the 2nd storey instead of the 1st one. At the 2nd storey the strength of RC columns is lower, thus leading to a lower value of the resid-ual strength Cs,min, which is essentially due to the contribu-tion of RC frame due to the failure of infills. The only pa-rameter significantly influenced by fy is the residual base shear Cs,min. An increase in fy results in a higher Cs,min, thus leading to a higher ru. This beneficial effect results in a higher Rcollapse, leading to higher values of Sae,collapse and PGAcollapse. Vice versa if fy decreases. The rotation at yield-ing θy has no significant influence on PGA capacity at col-lapse.
As far as PGA capacity at last infill maximum is con-cerned, from a qualitative standpoint, the same trend ob-served for PGA capacity at collapse with the infill mechani-cal characteristics are observed. Hence, a beneficial effect of an increase in stiffness and strength is observed. When fc increases, Cs,max increases too, mainly due to the higher con-tribution of RC columns – due to their higher stiffness and strength – to the maximum base shear, which corresponds to the attainment of the maximum strength in the infills in the storey involved in collapse and is attained for the same dis-placement. On the whole, the change in fc does not influence significantly the strength reduction factor at last infill maxi-mum (Rlim), but the increase in Cs,max leads to higher values of Sae(Teff) leading to last infill maximum (Sae,lim) and of the corresponding PGA (PGAlim). Vice versa if fc decreases.
Remaining parameters do not have a significant influence on PGAlim.
Pushover and IN2 curves for Model #1 of Uniformly in-filled frame in Y direction are reported in Fig. (8a), de-formed shape at NC is reported in Fig. (8b). Results of sensi-tivity analysis for NC and DL Limit States are reported in Figs. (9a and 9b), respectively. Numerical results are also reported in Table 3.
The building collapses under a soft-storey mechanism at the 2nd storey in all cases except when a lower value is as-sumed for fc and when an upper value is assumed for infill mechanical characteristics. In these cases, the storey in-volved by the collapse mechanism is the 1st one. As already highlighted, a lower stiffness and/or strength of the RC struc-ture and a higher strength of infills lead to a more uniform distribution of maximum interstorey shear strength along the height of the building: more uniform is this distribution, higher is the probability to have a soft storey mechanism at the 1st storey, where the shear demand is higher. The atten-tion has to be focused not only on the strength of the RC structure, but also on its stiffness. As a matter of fact, in in-filled RC frames the soft-storey collapse mechanism gener-ally takes place at the storey where – under the given distri-bution of lateral forces – the maximum ratio between the interstorey shear demand and the interstorey shear strength takes place. From a qualitative standpoint, the latter value is provided by the strength contribution of infills, correspond-ing to their maximum resistance and attained for rather low displacement values, and by a contribution of RC columns, which at this stage of behavior have not developed their en-tire strength yet. Hence, the latter contribution is signifi-cantly influenced by stiffness of RC elements, and not only by their strength. As already illustrated for the X direction, when Ew, Gw and τcr increase, several effects are observed,
Fig. (8). Obtained (black) and idealized (red) pushover curves and IN2 (blue) curve (a); deformed shape and element damage at NC (b) (Model #1 – Uniformly Infilled frame – Y direction).
Fig. (9). Results of sensitivity analysis for NC (a) and DL (b) LSs (Uniformly Infilled frame – Y direction).
Uniformly infilled frame – Y direction
0 0.02 0.04 0.06 0.08 0.1 0.12 0.140
0.2
0.4
0.6
0.8
1
1.2
1.4
1.6
1.8
2
Top displacement in Y direction [m]S
ae(T
eff)
[g]
-60 -40 -20 0 20 40 60
thy
fy
Gw
fc
thu
Change in PGA at collapse (%)
Va
ria
ble
Sensitivity analysis
Upper value
Lower value
-60 -40 -20 0 20 40 60
thu
fy
thy
fc
Gw
Change in PGA at last infill maximum (%)
Va
ria
ble
Sensitivity analysis
Upper value
Lower value
(a) (b)

Influence of Infill Panels and their Distribution The Open Construction and Building Technology Journal, 2012, Volume 6 243
including the decrease in ru, globally leading to a lower value of Rcollapse; this effect may or may not be counterbalanced by the higher Cs,max. Opposite to X direction, in the case of Y direction the effect of decrease in Rcollapse prevails over the increase in Cs,max, leading to a lower Sae,collapse see Fig. (10a) and also to a lower PGAcollapse see Fig. (10b). Vice versa when lower values of infill mechanical characteristics are considered. The influence of remaining parameter is quite similar to X direction.
As far as PGA capacity at last infill maximum is con-cerned, opposite to PGA capacity at collapse, a beneficial effect of the increase in Ew, Gw and τcr is observed; as a mat-ter of fact, see Fig. (10a), the beneficial effect of a higher strength (higher value of Cs,max) on the capacity – in terms of Sae(Teff) – is more important when the ductility capacity is in a lower range of values (e.g., DL limit state). If the ductility capacity is, on average, higher (e.g., NC limit state), the det-rimental effect of a more brittle behavior (lower value of ru) on the corresponding capacity – expressed as Sae(Teff) – tends
to prevail. This trend is reflected by the decrease in the slope of IN2 curves when the infill mechanical characteristics as-sume upper values. Based on these observations, when Ew, Gw and τcr decrease a lower PGA capacity at last infill maximum is expected. Nevertheless, due to the full correla-tion assumed between the infill mechanical characteristics, in the adopted model a lower strength and a lower secant-to-maximum stiffness are observed at the same time, resulting in a higher displacement capacity at this Limit State. This effect partially counterbalances the detrimental effect of lower initial stiffness and strength, leading to a only slightly lower PGA capacity at last infill maximum. Remaining pa-rameters do not have a significant influence on the PGA ca-pacity at last infill maximum.
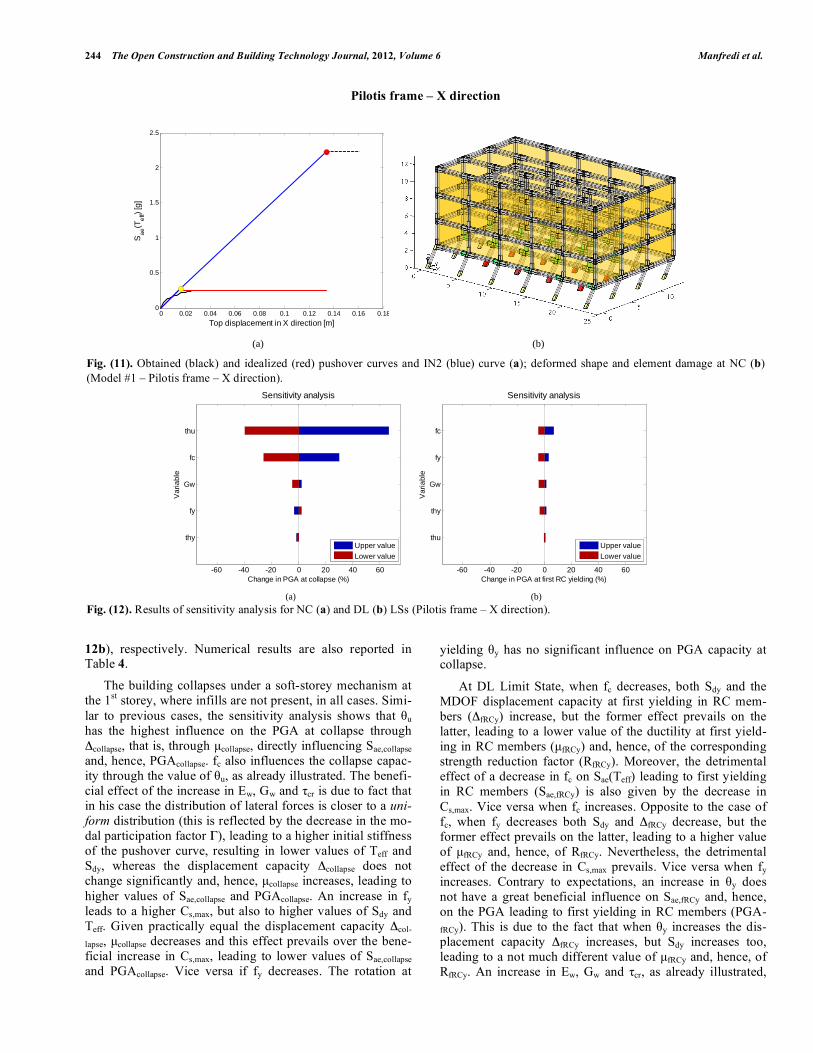
Pushover and IN2 curves for Model #1 of Pilotis frame in X direction are reported in Fig. (11a), deformed shape at NC is reported in Fig. (11b). Results of sensitivity analysis for NC and DL Limit States are reported in Figs. (12a and
Table 3. Results of pushover and IN2 analyses on the Uniformly Infilled frame in Y direction. M
odel
No.
Mod
ified
V
aria
ble
Val
ue
Tel [s
ec]
Δlim
[m]
Δco
ll [m
]
Tef
f [se
c]
µ s
Cs,m
ax [g
]
Cs,m
in [g
]
r u
µ lim
µ col
l
Rlim
Rco
ll
S ae,
lim [g
]
S ae,
coll [
g]
PGA
lim [g
]
PGA
coll [
g]
Stor
ey in
-vo
lved
in c
ol-
laps
e
ΔPG
A,N
C [%
]
ΔPG
A,li
m [%
]
1 - - 0.17 0.02 0.15 0.22 2.81 0.44 0.20 0.45 2.20 22.29 1.48 4.39 0.65 1.94 0.27 0.72 2 - -
2 fc µ-1.7σ 0.18 0.01 0.11 0.22 2.94 0.43 0.21 0.48 2.23 16.81 1.49 3.87 0.64 1.65 0.26 0.62 1 -13.4 -2.3
3 " µ+1.7σ 0.17 0.02 0.18 0.22 3.04 0.45 0.21 0.46 3.04 26.71 1.77 4.95 0.79 2.22 0.32 0.82 2 13.2 19.8
4 fy µ-1.7σ 0.17 0.02 0.15 0.22 2.86 0.44 0.19 0.42 2.19 22.26 1.48 4.25 0.65 1.88 0.27 0.70 2 -2.8 0.0
5 " µ+1.7σ 0.17 0.02 0.15 0.22 2.80 0.44 0.21 0.48 2.21 22.44 1.48 4.57 0.65 2.01 0.27 0.75 2 3.4 0.0
6 Gw µ-1.7σ 0.22 0.02 0.16 0.27 3.63 0.33 0.20 0.59 2.86 21.08 1.91 6.31 0.63 2.08 0.26 0.77 2 6.8 -3.1
7 " µ+1.7σ 0.14 0.01 0.14 0.18 2.56 0.61 0.22 0.37 2.15 22.93 1.35 3.09 0.82 1.88 0.33 0.70 1 -2.8 23.6
8 θy µ-1.7σ 0.17 0.02 0.15 0.22 2.83 0.44 0.20 0.45 2.26 22.33 1.50 4.40 0.66 1.94 0.27 0.72 2 0.2 1.4
9 " µ+1.7σ 0.17 0.02 0.15 0.22 2.80 0.44 0.20 0.45 2.20 22.30 1.48 4.40 0.65 1.94 0.27 0.72 2 -0.1 0.0
10 θu µ-1.7σ 0.17 0.02 0.08 0.22 2.81 0.44 0.20 0.44 2.20 12.05 1.48 3.09 0.65 1.36 0.27 0.52 2 -27.5 0.0
11 " µ+1.7σ 0.17 0.02 0.29 0.22 2.81 0.44 0.20 0.45 2.20 42.27 1.48 6.59 0.65 2.90 0.27 1.04 2 44.9 0.0
Fig. (10). Obtained (black) and idealized (red) pushover curves and IN2 (blue) curves in terms of Sae(Teff) (a) and PGA (b) for Models #6, #1 and #7: Lower, Median and Upper values for infill mechanical characteristics (Uniformly Infilled frame – Y direction).
0 0.02 0.04 0.06 0.08 0.1 0.12 0.14 0.160
0.5
1
1.5
2
2.5
Top displacement in Y direction [m]
Sa
e(T
eff)
[g]
0 0.02 0.04 0.06 0.08 0.1 0.12 0.14 0.160
0.1
0.2
0.3
0.4
0.5
0.6
0.7
0.8
Top displacement in Y direction [m]
PG
A [g
]
(a) (b)
244 The Open Construction and Building Technology Journal, 2012, Volume 6 Manfredi et al.
12b), respectively. Numerical results are also reported in Table 4.
The building collapses under a soft-storey mechanism at the 1st storey, where infills are not present, in all cases. Simi-lar to previous cases, the sensitivity analysis shows that θu has the highest influence on the PGA at collapse through Δcollapse, that is, through µcollapse, directly influencing Sae,collapse and, hence, PGAcollapse. fc also influences the collapse capac-ity through the value of θu, as already illustrated. The benefi-cial effect of the increase in Ew, Gw and τcr is due to fact that in his case the distribution of lateral forces is closer to a uni-form distribution (this is reflected by the decrease in the mo-dal participation factor Γ), leading to a higher initial stiffness of the pushover curve, resulting in lower values of Teff and Sdy, whereas the displacement capacity Δcollapse does not change significantly and, hence, µcollapse increases, leading to higher values of Sae,collapse and PGAcollapse. An increase in fy leads to a higher Cs,max, but also to higher values of Sdy and Teff. Given practically equal the displacement capacity Δcol-
lapse, µcollapse decreases and this effect prevails over the bene-ficial increase in Cs,max, leading to lower values of Sae,collapse and PGAcollapse. Vice versa if fy decreases. The rotation at
yielding θy has no significant influence on PGA capacity at collapse.
At DL Limit State, when fc decreases, both Sdy and the MDOF displacement capacity at first yielding in RC mem-bers (ΔfRCy) increase, but the former effect prevails on the latter, leading to a lower value of the ductility at first yield-ing in RC members (µfRCy) and, hence, of the corresponding strength reduction factor (RfRCy). Moreover, the detrimental effect of a decrease in fc on Sae(Teff) leading to first yielding in RC members (Sae,fRCy) is also given by the decrease in Cs,max. Vice versa when fc increases. Opposite to the case of fc, when fy decreases both Sdy and ΔfRCy decrease, but the former effect prevails on the latter, leading to a higher value of µfRCy and, hence, of RfRCy. Nevertheless, the detrimental effect of the decrease in Cs,max prevails. Vice versa when fy increases. Contrary to expectations, an increase in θy does not have a great beneficial influence on Sae,fRCy and, hence, on the PGA leading to first yielding in RC members (PGA-fRCy). This is due to the fact that when θy increases the dis-placement capacity ΔfRCy increases, but Sdy increases too, leading to a not much different value of µfRCy and, hence, of RfRCy. An increase in Ew, Gw and τcr, as already illustrated,
Pilotis frame – X direction
Fig. (11). Obtained (black) and idealized (red) pushover curves and IN2 (blue) curve (a); deformed shape and element damage at NC (b) (Model #1 – Pilotis frame – X direction).
Fig. (12). Results of sensitivity analysis for NC (a) and DL (b) LSs (Pilotis frame – X direction).
0 0.02 0.04 0.06 0.08 0.1 0.12 0.14 0.16 0.180
0.5
1
1.5
2
2.5
Top displacement in X direction [m]
Sa
e(T
eff)
[g]
(a) (b)
-60 -40 -20 0 20 40 60
thy
fy
Gw
fc
thu
Change in PGA at collapse (%)
Va
ria
ble
Sensitivity analysis
Upper value
Lower value
-60 -40 -20 0 20 40 60
thu
thy
Gw
fy
fc
Change in PGA at first RC yielding (%)
Va
ria
ble
Sensitivity analysis
Upper value
Lower value
(a) (b)

Influence of Infill Panels and their Distribution The Open Construction and Building Technology Journal, 2012, Volume 6 245
leads to a higher initial stiffness of the pushover curve, re-sulting in lower values of Sdy but also of ΔfRCy. These two effects counterbalance each other, globally leading to no significant change in µfRCy and, hence, in RfRCy. When Ew, Gw and τcr decrease, both Sdy and ΔfRCy increase, but the former effect prevails on the latter, leading to a lower value of µfRCy and, hence, of RfRCy.
Pushover and IN2 curves for Model #1 of Pilotis frame in Y direction are reported in Fig. (13a), deformed shape at NC is reported in Fig. (13b). Results of sensitivity analysis for NC and DL Limit States are reported in Figs. (14a and 14b), respectively. Numerical results are also reported in Table 5.
Also in this direction, the building always collapses un-der a soft-storey mechanism at the 1st storey, where infills
are not present. The same considerations made for X direc-tion can be reported for all parameters, except infill me-chanical characteristics since in this direction their influence – which was already not particularly significant in X direc-tion – is absolutely negligible, due to the lower number of infill panels in Y direction.
At first RC yielding, from a qualitative standpoint, ana-lyzed parameters influence the PGA capacity by the same way in Y direction, compared with X direction. Again, the only exception is for infill mechanical characteristics, whose influence on the seismic behavior in Y direction is absolutely negligible.
Pushover and IN2 curves for Model #1 of Bare frame in X direction are reported in Fig. (15a), deformed shape at NC is reported in Fig. (15b). Results of sensitivity analysis for
Table 4. Results of pushover and IN2 analyses on the Pilotis frame in X direction. M
odel
No.
Mod
ified
V
aria
ble
Val
ue
Tel [s
ec]
ΔfR
Cy [
m]
Δco
ll [m
]
Tef
f [se
c]
Cs,m
ax [g
]
µ fR
Cy
µ col
l
RfR
Cy
Rco
ll
S ae,
fRC
y [g]
S ae,
coll [
g]
PGA
fRC
y [g]
PGA
coll [
g]
Stor
ey in
-vo
lved
in c
ol-
laps
e
ΔPG
A,N
C [%
]
ΔPG
A,fR
Cy [
%]
1 - - 0.39 0.02 0.14 0.49 0.24 1.12 9.15 1.12 9.11 0.27 2.22 0.16 0.82 1 - -
2 fc µ-1.7σ 0.46 0.02 0.11 0.57 0.22 1.01 5.83 1.01 5.83 0.22 1.30 0.15 0.61 1 -25.7 -4.3
3 " µ+1.7σ 0.35 0.02 0.17 0.43 0.26 1.33 13.92 1.33 11.52 0.34 2.96 0.17 1.06 1 30.0 7.0
4 fy µ-1.7σ 0.38 0.02 0.14 0.48 0.23 1.15 10.14 1.15 9.83 0.27 2.28 0.15 0.84 1 2.1 -4.5
5 " µ+1.7σ 0.40 0.02 0.14 0.52 0.26 1.05 7.89 1.05 7.89 0.27 2.04 0.16 0.79 1 -3.4 3.2
6 Gw µ-1.7σ 0.39 0.02 0.14 0.52 0.24 1.02 8.18 1.02 8.18 0.25 2.00 0.15 0.78 1 -4.6 -3.9
7 " µ+1.7σ 0.38 0.02 0.14 0.48 0.24 1.16 9.58 1.16 9.35 0.28 2.28 0.16 0.84 1 2.3 1.4
8 θy µ-1.7σ 0.38 0.02 0.14 0.50 0.24 1.06 8.86 1.06 8.86 0.26 2.16 0.15 0.81 1 -1.3 -3.4
9 " µ+1.7σ 0.39 0.02 0.14 0.50 0.24 1.12 8.79 1.12 8.79 0.27 2.15 0.16 0.81 1 -1.5 1.4
10 θu µ-1.7σ 0.39 0.02 0.07 0.49 0.24 1.12 4.71 1.12 4.71 0.27 1.15 0.16 0.49 1 -39.6 0.0
11 " µ+1.7σ 0.39 0.02 0.27 0.49 0.24 1.12 17.80 1.12 15.92 0.27 3.88 0.16 1.36 1 66.6 0.0
Pilotis frame – Y direction
Fig. (13). Obtained (black) and idealized (red) pushover curves and IN2 (blue) curve (a); deformed shape and element damage at NC (b) (Model #1 – Pilotis frame – Y direction).
0 0.02 0.04 0.06 0.08 0.1 0.12 0.14 0.10
0.2
0.4
0.6
0.8
1
1.2
1.4
Top displacement in Y direction [m]
Sa
e(T
eff)
[g]
(a) (b)

246 The Open Construction and Building Technology Journal, 2012, Volume 6 Manfredi et al.
NC and DL Limit States are reported in Figs. (16a and 16b), respectively. Numerical results are also reported in Table 6.
The building collapses under a soft-storey mechanism at the 3rd storey in all cases. The formation of a soft-storey mechanism also without the presence of infill panels is likely to occur in such a building, which has not been designed for seismic loads and, obviously, does not comply with Capacity Design principles such as weak beam/strong column condi-tion. In the Uniformly infilled frame the soft-storey mecha-nism occurs at one storey at the bottom (1st or 2nd storey), thus confirming the well-known phenomenon of concentra-tion of displacement demand in bottom storeys in this kind of structures, due to the more uniform distribution of strength along the height, whereas in the Bare frame this mechanism occurs at the 3rd storey, where a decrease in col-umn dimension (and strength) is observed, due to the Gravity Load Design procedure. Again, the sensitivity analysis
shows that θu has the highest influence on the PGA at col-lapse through Δcollapse, that is, through µcollapse, directly influ-encing Sae,collapse and, hence, PGAcollapse. Similarly, fc also influences the collapse capacity through the value of θu, as already illustrated. When fy increases, the displacement ca-pacity Δcollapse does not change significantly, but Sdy in-creases, thus leading to a reduction in µcollapse. Nevertheless, this effect is counterbalanced by the increase in Cs,max, result-ing in no significant change in Sae,collapse and PGAcollapse. Vice versa if fy decreases. The rotation at yielding θy has no sig-nificant influence on PGA capacity at collapse.
At DL Limit State, when fy decreases both Sdy and ΔfRCy decrease, but (contrary to the Pilotis frame) the latter effect prevails on the former, leading to a lower value of µfRCy and, hence, of RfRCy. Moreover, the decrease in Cs,max leads to a further decrease in Sae,fRCy and PGAfRCy. Vice versa when fy increases. For the same reasons illustrated for the Pilotis
Table 5. Results of pushover and IN2 analyses on the Pilotis frame in Y direction. M
odel
No.
Mod
ified
V
aria
ble
Val
ue
Tel [s
ec]
ΔfR
Cy [
m]
Δco
ll [m
]
Tef
f [se
c]
Cs,m
ax [g
]
µ fR
Cy
µ col
l
RfR
Cy
Rco
ll
S ae,
fRC
y [g]
S ae,
coll [
g]
PGA
fRC
y [g]
PGA
coll [
g]
Stor
ey in
-vo
lved
in
colla
pse
ΔPG
A,N
C [%
]
ΔPG
A,fR
Cy
[%]
1 - - 0.54 0.02 0.14 0.68 0.19 0.98 6.18 0.99 6.18 0.18 1.15 0.15 0.63 1 - -
2 fc µ-1.7σ 0.61 0.02 0.11 0.77 0.17 0.89 3.94 0.91 3.94 0.16 0.68 0.15 0.47 1 -25.8 -2.3
3 " µ+1.7σ 0.49 0.02 0.17 0.61 0.20 1.10 8.90 1.10 8.90 0.21 1.74 0.16 0.80 1 26.1 4.4
4 fy µ-1.7σ 0.53 0.02 0.14 0.65 0.18 1.04 7.17 1.04 7.17 0.18 1.26 0.14 0.66 1 3.5 -4.3
5 " µ+1.7σ 0.55 0.02 0.14 0.71 0.20 0.94 5.38 0.95 5.38 0.19 1.07 0.16 0.62 1 -2.8 5.9
6 Gw µ-1.7σ 0.55 0.02 0.14 0.69 0.19 0.96 6.03 0.97 6.03 0.18 1.13 0.15 0.63 1 -0.6 -0.3
7 " µ+1.7σ 0.54 0.02 0.14 0.69 0.19 0.95 6.05 0.96 6.05 0.18 1.13 0.15 0.63 1 -0.4 -1.1
8 θy µ-1.7σ 0.54 0.02 0.14 0.68 0.19 0.97 6.24 0.98 6.24 0.18 1.16 0.15 0.64 1 0.4 -1.3
9 " µ+1.7σ 0.55 0.02 0.14 0.68 0.19 1.01 6.14 1.01 6.14 0.19 1.15 0.15 0.63 1 -0.2 2.4
10 θu µ-1.7σ 0.54 0.02 0.07 0.68 0.19 0.98 3.19 0.99 3.19 0.18 0.60 0.15 0.38 1 -39.4 0.0
11 " µ+1.7σ 0.54 0.02 0.27 0.68 0.19 0.98 11.99 0.99 11.99 0.18 2.24 0.15 1.05 1 65.5 0.0
Fig. (14). Results of sensitivity analysis for NC (a) and DL (b) LSs (Pilotis frame – Y direction).
-60 -40 -20 0 20 40 60
thy
Gw
fy
fc
thu
Change in PGA at collapse (%)
Va
riab
le
Sensitivity analysis
Upper value
Lower value
-60 -40 -20 0 20 40 60
thu
Gw
thy
fc
fy
Change in PGA at first RC yielding (%)
Va
riab
le
Sensitivity analysis
Upper value
Lower value
(a) (b)

Influence of Infill Panels and their Distribution The Open Construction and Building Technology Journal, 2012, Volume 6 247
frame, when fc decreases a lower value of Sae,fRCy is ob-served. Nevertheless, the increase in Teff counterbalances this effect, leading to a slightly higher capacity in terms of PGA. Vice versa when fc increases. Again, an increase in θy does not have a great beneficial influence on Sae,fRCy and, hence, on PGAfRCy, for the same reasons above illustrated for the Pilotis frame: when θy increases, the displacement capacity ΔfRCy increases, but Sdy increases too, leading to a not much different value of µfRCy and, hence, of RfRCy. As expected, θu has no significant influence on PGA capacity at this Limit State.
Pushover and IN2 curves for Model #1 of Bare frame in Y direction are reported in Fig. (17a), deformed shape at NC is reported in Fig. (17b). Results of sensitivity analysis for NC and DL Limit States are reported in Fig. (18a and 18b), respectively. Numerical results are also reported in Table 7.
In this direction, the building always collapses under a global mechanism involving all of the four storeys. This col-
lapse mechanism is certainly strongly influenced by the structural configuration, where beams in transverse direction are present only in external frames. A strong difference with the Uniformly infilled and the Pilotis frame, where the pres-ence of infill panels forces the collapse mechanism to de-velop only in one storey (at the bottom), is noted. As far as the influence of single variables is concerned, the main in-fluence of displacement capacity through θu and, indirectly, through fc is observed again. The decrease in fy leads to a lower value of Sdy, whereas the displacement capacity Δcol-
lapse does not change significantly, thus leading to a higher µcollapse and, hence, to a higher Rcollapse. However, this effect is counterbalanced by a lower Cs,max, thus leading to a only slightly higher PGAcollapse.
At DL Limit State, similar to PGA capacity at collapse, it is observed that the decrease in fy leads to a lower value of Sdy, whereas the displacement capacity ΔfRCy also decreases but in a lower measure, thus leading to a higher µfRCy and, hence, to a higher RfRCy. However, this effect is counterbal-
Fig. (15). Obtained (black) and idealized (red) pushover curves and IN2 (blue) curve (a); deformed shape and element damage at NC (b) (Model #1 – Bare frame – X direction).
Fig. (16). Results of sensitivity analysis for NC (a) and DL (b) LSs (Bare frame – X direction).
Bare frame – X direction
0 0.05 0.1 0.15 0.2 0.250
0.1
0.2
0.3
0.4
0.5
0.6
0.7
Top displacement in X direction [m]
Sa
e(T
eff)
[g]
(a) (b)
-60 -40 -20 0 20 40 60
thy
fy
fc
thu
Change in PGA at collapse (%)
Va
ria
ble
Sensitivity analysis
Upper value
Lower value
-60 -40 -20 0 20 40 60
thu
thy
fc
fy
Change in PGA at first RC yielding (%)
Va
ria
ble
Sensitivity analysis
Upper value
Lower value
(a) (b)

248 The Open Construction and Building Technology Journal, 2012, Volume 6 Manfredi et al.
anced by a lower Cs,max, thus leading to a only slightly higher PGAfRCy. As far as θy is concerned, it is observed again that when θy increases, the displacement capacity ΔfRCy increases, but Sdy increases too, thus counterbalancing the former ef-fect. Vice versa when θy decreases. For the same reasons, also fc has a negligible influence on PGA capacity at first RC yielding.
COMPARISON BETWEEN DIFFERENT IN-FILL CONFIGURATIONS AND LOADING DIRECTIONS
In this Section, the influence of different infill configura-tions on the seismic capacity of the case study building is evaluated. To this aim, IN2 curves are compared, always referring to the models where a median values are assumed for all of the variables. The comparison is carried out in both directions.
Uniformly Infilled Frame – Comparison Between X and Y Directions
If a comparison is carried out between the seismic capac-ity in X and Y directions for Model #1 see Figs. (19a and 19 b) it is observed how the displacement capacity does not change significantly and the beneficial effect of a higher strength, both maximum (Cs,max) and residual (Cs,min), leads to higher PGA capacities in X direction, both at collapse and last infill maximum. The higher strength in X direction com-pared with Y direction is due (i) to the larger amount of infill panels in X direction and (ii) to the orientation of column elements, which, following the parallel plane frame configu-ration, provide a higher strength in X direction.
Pilotis Frame – Comparison Between X and Y Directions
If a comparison is carried out between the seismic capac-ity in X and Y directions for Model #1 see Fig. (20a and 20b) it is observed how the displacement capacity at collapse
Table 6. Results of pushover and IN2 analyses on the Bare frame in X direction. M
odel
No.
Mod
ified
V
aria
ble
Val
ue
Tel [s
ec]
ΔfR
Cy [
m]
Δco
ll [m
]
Tef
f [se
c]
Cs,m
ax [g
]
µ fR
Cy
µ col
l
RfR
Cy
Rco
ll
S ae,
fRC
y [g]
S ae,
coll [
g]
PGA
fRC
y [g]
PGA
coll [
g]
Stor
ey in
-vo
lved
in c
ol-
laps
e
ΔPG
A,N
C [%
]
ΔPG
A,fR
Cy [
%]
1 - - 0.76 0.06 0.22 1.01 0.20 0.95 3.33 0.95 3.33 0.19 0.68 0.22 0.57 3 - -
2 fc µ-1.7σ 0.99 0.08 0.20 1.18 0.19 0.89 2.38 0.90 2.38 0.17 0.46 0.23 0.48 3 -16.3 3.6
3 " µ+1.7σ 0.67 0.05 0.24 0.85 0.21 1.03 4.80 1.03 4.80 0.22 1.02 0.21 0.68 3 19.8 -4.1
4 fy µ-1.7σ 0.74 0.05 0.22 1.00 0.19 0.81 3.54 0.82 3.54 0.16 0.68 0.18 0.57 3 -0.4 -16.5
5 " µ+1.7σ 0.78 0.08 0.22 1.04 0.22 1.04 3.00 1.04 3.00 0.23 0.65 0.25 0.57 3 -0.8 16.1
6 θy µ-1.7σ 0.75 0.06 0.22 1.00 0.20 0.94 3.37 0.95 3.37 0.19 0.69 0.22 0.57 3 0.2 -1.5
7 " µ+1.7σ 0.77 0.07 0.22 1.02 0.20 0.95 3.24 0.96 3.24 0.20 0.66 0.22 0.57 3 -0.6 1.8
8 θu µ-1.7σ 0.76 0.06 0.15 1.01 0.20 0.95 2.22 0.95 2.22 0.19 0.45 0.22 0.42 3 -26.5 0.0
9 " µ+1.7σ 0.76 0.06 0.36 1.01 0.20 0.95 5.50 0.95 5.50 0.19 1.12 0.22 0.84 3 46.3 0.0
Bare frame – Y direction
Fig. (17). Obtained (black) and idealized (red) pushover curves and IN2 (blue) curve (a); deformed shape and element damage at NC (b) (Model #1 – Bare frame – Y direction).
0 0.1 0.2 0.3 0.4 0.5 0.6 0.70
0.05
0.1
0.15
0.2
0.25
0.3
0.35
0.4
Top displacement in Y direction [m]
Sa
e(T
eff)
[g]
(a) (b)

Influence of Infill Panels and their Distribution The Open Construction and Building Technology Journal, 2012, Volume 6 249
does not change significantly and the beneficial effect of the higher strength in X direction compared with Y direction, due to the orientation of column elements – which, following the parallel plane frame configuration, provide a higher strength in X direction – leads to a higher Sae,collapse and also to a higher PGAcollapse in X direction. The difference between the values of Sae,collapse in X and Y directions is higher than the difference between the values of PGAcollapse, due to the difference in Teff between the two directions.
As far as first RC yielding is concerned, column orienta-tion leads to a lower displacement capacity in X direction compared with Y direction; nevertheless, beneficial effect of the higher strength in X direction leads to a higher seismic capacity in terms of Sae also at this Limit State. Again, due to the difference in Teff between the two directions, the differ-ence between the values of Sae,fRCy in X and Y directions is higher than the difference between the values of PGAfRCy.
Bare Frame – Comparison Between X and Y Directions
If a comparison is carried out between the seismic capac-ity in X and Y directions for Model #1 see Fig. (21a and 21b) a clear difference is observed in the lateral response of the building: the column-sway storey mechanism in X direc-
tion leads to a higher strength but also to a lower ductility, whereas the opposite happens in Y direction, where a global mechanism occurs. Globally, Sae,collapse in Y direction is lower than in X direction, since – due to the higher deform-ability (higher value of Sdy) – in Y direction the ductility capacity µcollapse is not as higher (compared with the X direc-tion) as the displacement capacity Δcollapse. Hence, the lower strength is not effectively counterbalanced by the higher duc-tility capacity. Nevertheless, due to the difference in Teff be-tween the two directions, in terms of PGA a higher capacity is observed in Y direction.
As far as first RC yielding is concerned, a similar dis-placement capacity is observed, but the higher value of Sdy and, above all, the lower strength, lead to a lower Sae,fRCy in Y direction. Due to the difference in Teff, this difference de-creases in terms of PGA, but, however, a higher PGAfRCy is observed in X direction.
X Direction – Comparison Between Uniformly Infilled, Pilotis and Bare Frames
A first comparison can be carried out between the IN2 curves in terms of Sae(Teff) for Uniformly infilled, Pilotis and Bare frame. Actually, the MDOF displacement capacity at
Fig. (18). Results of sensitivity analysis for NC (a) and DL (b) LSs (Bare frame – Y direction).
Table 7. Results of pushover and IN2 analyses on the Bare frame in Y direction.
Mod
el N
o.
Mod
ified
V
aria
ble
Val
ue
Tel [s
ec]
ΔfR
Cy [
m]
Δco
ll [m
]
Tef
f [se
c]
Cs,m
ax [g
]
µ fR
Cy
µ col
l
RfR
Cy
Rco
ll
S ae,
fRC
y [g]
S ae,
coll [
g]
PGA
fRC
y [g]
PGA
coll [
g]
Stor
ey in
-vo
lved
in c
ol-
laps
e
ΔPG
A,N
C [%
]
ΔPG
A,fR
Cy [
%]
1 - - 1.35 0.08 0.56 2.10 0.09 0.61 4.34 0.71 4.34 0.06 0.40 0.16 0.66 1+2+3+4 - -
2 fc µ-1.7σ 1.57 0.09 0.45 2.36 0.09 0.57 2.84 0.64 2.84 0.06 0.25 0.16 0.51 1+2+3+4 -23.3 2.5
3 " µ+1.7σ 1.19 0.07 0.67 1.85 0.09 0.70 6.45 0.79 6.45 0.07 0.60 0.16 0.83 1+2+3+4 25.5 1.5
4 fy µ-1.7σ 1.32 0.07 0.57 2.02 0.08 0.64 5.13 0.74 5.13 0.06 0.43 0.15 0.69 1+2+3+4 3.9 -6.5
5 " µ+1.7σ 1.38 0.09 0.55 2.14 0.10 0.61 3.75 0.69 3.75 0.07 0.37 0.17 0.64 1+2+3+4 -3.0 7.4
6 θy µ-1.7σ 1.34 0.08 0.56 2.07 0.09 0.62 4.44 0.71 4.44 0.06 0.40 0.16 0.67 1+2+3+4 0.9 -0.8
7 " µ+1.7σ 1.36 0.08 0.56 2.12 0.09 0.62 4.22 0.71 4.22 0.06 0.38 0.16 0.65 1+2+3+4 -1.2 1.5
8 θu µ-1.7σ 1.35 0.08 0.26 2.10 0.09 0.61 2.01 0.71 2.01 0.06 0.18 0.16 0.37 1+2+3+4 -44.3 0.0
9 " µ+1.7σ 1.35 0.08 1.14 2.10 0.09 0.61 8.80 0.71 8.80 0.06 0.80 0.16 1.13 1+2+3+4 71.1 0.0
-60 -40 -20 0 20 40 60
thy
fy
fc
thu
Change in PGA at collapse (%)
Va
ria
ble
Sensitivity analysis
Upper value
Lower value
-60 -40 -20 0 20 40 60
thu
thy
fc
fy
Change in PGA at first RC yielding (%)
Va
ria
ble
Sensitivity analysis
Upper value
Lower value
(a) (b)

250 The Open Construction and Building Technology Journal, 2012, Volume 6 Manfredi et al.
Collapse is almost coincident between the Uniformly infilled and the Pilotis frame since the collapse mechanism involve in both cases RC columns at the 1st storey; nevertheless, a lower displacement capacity of the equivalent SDOF is ob-served in Fig. (22a), due to the lower modal participation factor Γ for the Pilotis frame. The displacement capacity of the Bare frame is the highest one since in this frame the col-lapse mechanism involves the columns at the 3rd storey, which are characterized by a lower axial load and, hence, by a higher ductility. The high base shear capacity of the Uni-formly infilled frame leads to much higher values of Sae for relatively low displacement values (e.g., DL Limit State). As the ductility increases, the detrimental effect given by the increase in the slope of the IN2 curve, due to the drop of strength represented through the parameter ru, prevails over the higher base shear and, at NC Limit State, the Sae capacity of the Uniformly infilled frame is lower compared with the corresponding capacity of the Pilotis frame. The higher dis-placement capacity of the Bare frame is counterbalanced by its lower strength but, above all, by the lower stiffness of the pushover curve, resulting in lower Sae capacity at both Limit States, compared with other frames.
Nevertheless, in order to compare the seismic capacity of different frames, it is more correct to plot the IN2 curves in terms of PGA since this can be considered as a common
measure of seismic intensity, whereas it is not appropriate to compare the seismic capacity in terms of spectral accelera-tion if the periods of the various frames are significantly dif-ferent. It can be observed that the relative ratios between the seismic capacities of the Uniformly infilled and the Pilotis frame do not change significantly if PGA is considered in-stead of Sae(Teff) see Fig. (22b), because in both cases the period Teff is lower than TC, hence the spectral acceleration is on the constant branch of the spectrum. Therefore, when PGA is considered instead of Sae(Teff), the only (slight) change in the relative ratios between the seismic capacities of the frames is due to the little change in F0 with the differ-ent PGA. A severe change, instead, is observed if the seismic capacity of the Bare frame is considered in terms of PGA. In this case, due to the relatively high period Teff, the evaluation of the seismic capacity significantly changes: the PGA ca-pacity at NC Limit States remains the lowest, compared with Uniformly infilled and Bare frames, but anyhow the relative distance between the seismic capacity of the Bare frame and of remaining frames significantly decreases. Moreover, at DL Limit State the PGA capacity of the Bare frame is higher, compared with the capacity of the Pilotis frame.
In conclusion, the better seismic performance at DL Limit State is shown by the Uniformly infilled frame, due to the high contribution of infill elements in terms of stiffness
Fig. (19). Obtained (black) and idealized (red) pushover curves and IN2 (blue) curves in terms of Sae(Teff) (a) and PGA (b) for Model #1 in X and Y directions (Uniformly Infilled frame).
Fig. (20). Obtained (black) and idealized (red) pushover curves and IN2 (blue) curves in terms of Sae(Teff) (a) and PGA (b) for Model #1 in X and Y directions (Pilotis frame).
0 0.02 0.04 0.06 0.08 0.1 0.12 0.140
0.5
1
1.5
2
2.5
Top displacement [m]
Sa
e(T
eff)
[g]
0 0.02 0.04 0.06 0.08 0.1 0.12 0.140
0.1
0.2
0.3
0.4
0.5
0.6
0.7
0.8
0.9
Top displacement [m]
PG
A [g
]
(a) (b)
0 0.02 0.04 0.06 0.08 0.1 0.12 0.14 0.16 0.180
0.5
1
1.5
2
2.5
Top displacement [m]
Sa
e(T
eff)
[g]
0 0.02 0.04 0.06 0.08 0.1 0.12 0.14 0.16 0.180
0.1
0.2
0.3
0.4
0.5
0.6
0.7
0.8
0.9
Top displacement [m]
PG
A [g
]
(a) (b)

Influence of Infill Panels and their Distribution The Open Construction and Building Technology Journal, 2012, Volume 6 251
and strength, whereas at NC Limit State the better perform-ance is shown by the Pilotis frame since for higher values of ductility the detrimental effect due to the brittle behavior of infills counterbalances their strength contribution. At NC Limit State the Bare frame shows the worst behavior. Never-theless, it is to be noted that in this frame the collapse mechanism, even without infills, is an unfavorable soft-storey mechanism, as may happen in existing buildings not designed according to modern principles such as weak beam/strong column condition.
Y Direction – Comparison Between Uniformly Infilled, Pilotis and Bare Frames
In Y direction, different considerations can be made if the seismic capacity of Uniformly infilled and Pilotis frames are compared, see Fig. (23a). In the former case, the soft-storey collapse mechanism takes place at the 2nd storey, where RC columns are characterized by a slightly higher deformation capacity compared with the 1st storey, where the soft-storey collapse mechanism takes place in the Pilotis frame. Hence, the detrimental effect (in terms of SDOF dis-placement capacity) of higher modal participation factor for the Uniformly infilled frame is partially counterbalanced.
Moreover, in this direction the higher strength provided by the Uniformly infilled frame counterbalances the detrimental effect given by the increase in the slope of the IN2 curve, due to the drop of strength, thus leading to a higher capacity, in terms of Sae(Teff), at both Limit States. If the Bare frame is considered, it is noted how the global collapse mechanism provides a significantly higher ductility, compared with other frames, but also a significantly lower strength, globally re-sulting in a lower capacity, in terms of Sae(Teff), at both Limit States.
If the seismic capacity is assessed in terms of PGA, see Fig. (23b), different effects are observed: first, the relative distance between seismic capacity of Uniformly infilled and Pilotis frames decreases, especially at NC Limit State, mainly because in this case Teff is lower than TC for the Uni-formly infilled frame and higher than TC for the Pilotis. Therefore, when PGA is considered instead of Sae, seismic capacities of these frames become much closer to each other. For the same reason, the assessment of the seismic capacities of the Bare frame, which is characterized by a much higher value of Teff, significantly changes if PGA is considered in-stead of Sae(Teff), showing a seismic capacity higher than the Pilotis frame at both Limit States.
Fig. (21). Obtained (black) and idealized (red) pushover curves and IN2 (blue) curves in terms of Sae(Teff) (a) and PGA (b) for Model #1 in X and Y directions (Bare frame).
Fig. (22). Obtained (black) and idealized (red) pushover curves and IN2 (blue) curves in terms of Sae(Teff) (a) and PGA (b) for Model #1 in X direction (Uniformly infilled, Pilotis and Bare frames); collapse mechanism (c.m.) is reported.
0 0.1 0.2 0.3 0.4 0.5 0.6 0.70
0.1
0.2
0.3
0.4
0.5
0.6
0.7
Top displacement [m]
Sa
e(T
eff)
[g]
0 0.1 0.2 0.3 0.4 0.5 0.6 0.70
0.1
0.2
0.3
0.4
0.5
0.6
0.7
Top displacement [m]
PG
A [g
]
(a) (b)
0 0.05 0.1 0.15 0.2 0.250
0.5
1
1.5
2
2.5
Top displacement in X direction [m]
Sa
e(T
eff)
[g]
0 0.05 0.1 0.15 0.2 0.250
0.5
1
1.5
2
2.5
Top displacement in X direction [m]
Sa
e(T
eff)
[g]
0 0.05 0.1 0.15 0.2 0.250
0.1
0.2
0.3
0.4
0.5
0.6
0.7
0.8
0.9
Top displacement in X direction [m]
PG
A [g
]
0 0.05 0.1 0.15 0.2 0.250
0.1
0.2
0.3
0.4
0.5
0.6
0.7
0.8
0.9
Top displacement in X direction [m]
PG
A [g
]
(a) (b)

252 The Open Construction and Building Technology Journal, 2012, Volume 6 Manfredi et al.
It is observed how, in Y direction, opposite to X direc-tion, the seismic performance of the Bare frame at NC Limit State is better compared with the Pilotis frame and very closer to the Uniformly infilled frame. This is a beneficial consequence of the higher ductility provided by the global collapse mechanism observed in the Bare frame in this direc-tion. At DL Limit State, the beneficial influence of the higher stiffness and strength provided by infills leads to a higher PGA for this kind of frame.
CONCLUSIONS In this paper, the influence of main parameters influenc-
ing the seismic capacity of the case study structure has been investigated through a sensitivity analysis. Such analysis has shown that the rotational capacity of columns, directly influ-encing the displacement capacity, has the highest influence on the PGA capacity at NC for all of the investigated frames. Concrete compressive strength significantly influences the capacity at collapse, too, through its influence on the rota-tional capacity of columns. As far as PGA capacity at DL is considered, mechanical characteristics of infills have the highest influence on the response of the Uniformly Infilled frame, which is assumed to be at DL when the last infill in a storey reaches its maximum resistance, whereas for Pilotis and Bare frames the steel yield strength has the highest (but relatively lower) influence on PGA capacity at DL, which is assumed to correspond to the first yielding in RC members. Presence of infills, as expected, significantly influences the collapse mechanism: the Pilotis frame collapses under a soft-storey mechanism at the 1st storey, where infills are not pre-sent, in all of the cases investigated in the sensitivity analy-sis, whereas a soft-storey mechanism is always observed in the Uniformly Infilled frame, too, but the storey involved by the collapse mechanism can change, mainly depending on mechanical characteristics of infills.
Numerical results confirm how the presence of infills provides a beneficial increase in stiffness and strength which may or may not be counterbalanced by the detrimental effect due to the sudden loss of strength, which leads to an increase in displacement demand when a certain threshold of seismic intensity is exceeded. The latter effect is expressed in the adopted R-µ-T relationship [14] by the coefficient ru, and is reflected in the decreasing slope of IN2 curves with ru de-creasing.
Compared with the Bare frame, in the Uniformly infilled frame the beneficial influence of the increase in stiffness and strength prevails over the detrimental influence of the brittle behavior, both in X and Y direction. The detrimental effect of an irregular distribution of infills – leading, as expected, to a localization of inelastic displacement demand at the bot-tom bare storey – is evident in Y direction, where the dis-placement capacity of the Bare frame is significantly higher, due to the formation of a favorable global collapse mecha-nism. On the contrary, in X direction, where the formation of an unfavorable column-sway storey mechanism is observed also in the Bare frame, the detrimental effect of an irregular distribution of infills is not observed. These observations confirm how the evaluation of the infill influence on seismic behavior cannot be independent of the evaluation of the seismic behavior shown by the bare structure.
Moreover, it should be pointed out that special attention should be addressed to the potential brittle failure mecha-nisms due to the local interaction between infills and struc-tural elements – which have not been accounted for herein – especially for existing RC buildings that have not been de-signed adopting general principles and detailing rules pre-scribed by modern seismic codes according to Capacity De-sign philosophy.
CONFLICT OF INTEREST
The authors confirm that this article content has no con-flicts of interest.
ACKNOWLEDGEMENTS
This work was developed under the financial support of ReLUIS-DPC 2009-2012. This support is gratefully ac-knowledged.
REFERENCES [1] P. Ricci, G.M. Verderame, and G. Manfredi, “Analytical investiga-
tion of elastic period of infilled RC MRF buildings”, Eng. Struct., vol. 33, no. 2, pp. 308-319, 2011.
[2] P. Ricci, F. De Luca, and G.M. Verderame, “6th April 2009 L’Aquila earthquake, Italy: reinforced concrete building perform-ance”, B. Earthquake Eng., vol. 9, no. 1, pp. 285-305, 2011.
[3] G.M. Verderame, F. De Luca, P. Ricci, and G. Manfredi, “Prelimi-nary analysis of a soft storey mechanism after the 2009 L’Aquila earthquake”, Earthquake Eng. Struct. Dynam., vol. 40, no. 8, 925-944, 2001.
Fig. (23). Obtained (black) and idealized (red) pushover curves and IN2 (blue) curves in terms of Sae(Teff) (a) and PGA (b) for Model #1 in Y direction (Uniformly infilled, Pilotis and Bare frames); collapse mechanism (c.m.) is reported.
0 0.05 0.1 0.15 0.2 0.25 0.3 0.35 0.4 0.45 0.50
0.5
1
1.5
2
2.5
Top displacement in Y direction [m]
Sa
e(T
eff)
[g]
0 0.05 0.1 0.15 0.2 0.25 0.3 0.35 0.4 0.45 0.50
0.1
0.2
0.3
0.4
0.5
0.6
0.7
0.8
0.9
Top displacement in Y direction [m]
PG
A [g
]

Influence of Infill Panels and their Distribution The Open Construction and Building Technology Journal, 2012, Volume 6 253
[4] EERI, “1999 Kocaeli, Turkey earthquake reconnaissance report”, Earthquake Spectra, vol. 16, no. S1, pp. 237-279, 2000.
[5] P. Negro, and G. Verzeletti, “Effect of infills on the global behav-iour of R/C frames: energy considerations from pseudodynamic tests”, Earthquake Eng. Struct. Dynam., vol. 25, no. 8, pp. 753-773, 1996.
[6] CEN, 1995. European Standard ENV 1998-1-1/2/3. Eurocode 8: Design provisions for earthquake resistance of structures – Part I: General rules. Technical Committee 250/SC8, Comité Européen de Normalisation, Brussels.
[7] M.N. Fardis, and T.B. Panagiotakos, “Seismic design and response of bare and masonry-infilled reinforced concrete buildings. Part II: infilled structures”, J. Earthquake Eng., vol. 1, no. 3, pp. 475-503, 1997.
[8] A.J. Kappos, K.C. Stylianidis, and C.N. Michailidis, “Analytical models for brick masonry infilled R/C frames under lateral load-ing”, J. Earthquake Eng., vol. 2, no. 1, pp. 59-87, 1998.
[9] P. Negro, and A. Colombo, “Irregularities induced by nonstructural masonry panels in framed buildings”, Eng. Struct., vol. 19, no. 7, pp. 576-585, 1997.
[10] P. Fajfar, and D. Drobnič, Nonlinear seismic analyses of the ELSA buildings. Proceedings of the 11th European Conference on Earth-quake Engineering, Paris, France, September 6-11, 1998.
[11] A.V. Pinto, G. Verzeletti, J. Molina, H. Varum, and E. Coelho, Pseudo-dynamic tests on non-seismic resisting RC frames (infilled frame and infill strengthened frame tests). Report EUR, EC, Joint Research Centre, Ispra, Italy, 2002.
[12] M. Dolšek, and P. Fajfar, “Soft storey effects in uniformly infilled reinforced concrete frames”, J. Earthquake Eng., vol. 5, no. 1, pp. 1-12, 2001.
[13] M. Dolšek, and P. Fajfar, “Mathematical modelling of an infilled RC frame structure based on the results of pseudo-dynamic tests”, Earthquake Eng. Struct. Dynam., vol. 31, no. 6, pp. 1215-1230, 2002.
[14] M. Dolšek, and P. Fajfar, "Inelastic spectra for infilled reinforced concrete frames”, Earthquake Eng. Struct. Dynam., vol. 33, no. 15, pp. 1395-1416, 2004.
[15] P. Fajfar, “Capacity spectrum method based on inelastic demand spectra”, Earthquake Eng. Struct. Dynam., vol. 28, no. 9, pp. 979-993, 1999.
[16] M. Dolšek, and P. Fajfar, “Simplified non-linear seismic analysis of infilled reinforced concrete frames”, Earthquake Eng. Struct. Dynam., vol. 34, no. 1, pp. 49-66, 2005.
[17] M. Dolšek, and P. Fajfar, “The effect of masonry infills on the seismic response of a four-storey reinforced concrete frame – a deterministic assessment”, Eng. Struct., vol. 30, no. 7, pp. 1991-2001, 2008.
[18] M. Dolšek, and P. Fajfar, “The effect of masonry infills on the seismic response of a four-storey reinforced concrete frame – a probabilistic assessment”, Eng. Struct., vol. 30, no. 11, pp. 3186-3192, 2008.
[19] C. Dymiotis, A.J. Kappos, and M.K. Chryssanthopoulos, “Seismic reliability of masonry-infilled RC frames”, ASCE J. Struct. Eng., vol. 127, no. 3, pp. 296-305, 2001.
[20] D. Celarec, P. Ricci, and M. Dolšek, “The sensitivity of seismic response parameters to the uncertain modelling variables of ma-sonry-infilled reinforced concrete frames”, Eng. Struct., vol. 35, pp. 165-177, 2012.
[21] Regio Decreto Legge n. 2229 del 16/11/1939. Norme per la esecuz-ione delle opere in conglomerate cementizio semplice od armato. G.U. n. 92 del 18/04/1940. (in Italian)
[22] G.M. Verderame, M. Polese, C. Mariniello, and G. Manfredi, “A simulated design procedure for the assessment of seismic capacity of existing reinforced concrete buildings”, Adv. Eng. Softw., vol. 41, no. 2, pp. 323-335, 2010.
[23] M.N. Fardis, LESSLOSS – Risk mitigation for earthquakes and landslides. Guidelines for displacement-based design of buildings and bridges. Report No. 5/2007, IUSS Press, Pavia, Italy 2007.
[24] G.M. Verderame, P. Ricci, G. Manfredi, and E. Cosenza, “Ultimate chord rotation of RC columns with smooth bars: some considera-tions about EC8 prescriptions”, B. Earthquake Eng., vol. 8, no. 6, pp. 1351-1373, 2010.
[25] T.B. Panagiotakos, and M.N. Fardis, “Seismic response of infilled RC frames structures”, 11th World Conference on Earthquake En-gineering, Acapulco, México, June 23-28. Paper No. 225, 1996.
[26] M.N. Fardis, Experimental and numerical investigations on the seismic response of RC infilled frames and recommendations for code provisions. Report ECOEST-PREC8 No. 6. Prenormative re-search in support of Eurocode 8, 1997.
[27] M. Dolšek, “Development of computing environment for the seis-mic performance assessment of reinforced concrete frames by us-ing simplified nonlinear models”, B. Earthquake Eng., vol. 8, no. 6, pp. 1309-1329, 2010.
[28] F. McKenna, G.L. Fenves, and M.H. Scott, OpenSees: Open Sys-tem for Earthquake Engineering Simulation. Pacific Earthquake Engineering Research Center. University of California, Berkeley, California, USA 2004. Available at: http://opensees.berkeley.edu.
[29] P. Ricci, Seismic vulnerability of existing RC buildings. Ph.D. Thesis, University of Naples Federico II, Naples, Italy, 2010.
[30] M. Dolšek, and P. Fajfar, IN2 - A simple alternative for IDA. Pro-ceedings of the 13th World Conference on Earthquake Engineering, Vancouver, B.C., Canada, August 1-6. Paper No. 3353, 2004.
[31] T. Vidic, P. Fajfar, and M. Fischinger, “Consistent inelastic design spectra: strength and displacement”, Earthquake Eng. Struct. Dy-nam., vol. 23, no. 5, pp. 507-521, 1994.
[32] Decreto Ministeriale del 14/1/2008. Approvazione delle nuove norme tecniche per le costruzioni. G.U. n. 29 del 4/2/2008. (in Ital-ian)
[33] INGV-DPC S1, Progetto S1. Proseguimento della assistenza al DPC per il completamento e la gestione della mappa di pericolosità sismica prevista dall'Ordinanza PCM 3274 e progettazione di ulte-riori sviluppi. Istituto Nazionale di Geofisica e Vulcanologia – Di-partimento della Protezione Civile, 2007. Available at: http://esse1.mi.ingv.it (in Italian)
[34] H. Crowley, M. Colombi, B. Borzi, M. Faravelli, M. Onida, M. Lopez, D. Polli, F. Meroni, and R. Pinho, “A comparison of seis-mic risk maps for Italy”, B. Earthquake Eng., vol. 7, no. 1, pp. 149-190, 2009.
[35] G.M. Verderame, G. Manfredi, and G. Frunzio, Le proprietà mec-caniche dei calcestruzzi impiegati nelle strutture in cemento armato realizzate negli anni ’60. Atti del X congresso nazionale ANIDIS ‘‘L’ingegneria Sismica in Italia”, Potenza-Matera, Italy, September 9-13, 2001. (in Italian)
[36] G.M. Verderame, P. Ricci, M. Esposito, and F.C. Sansiviero, Le caratteristiche meccaniche degli acciai impiegati nelle strutture in c.a. realizzate dal 1950 al 1980. Atti del XXVI Convegno Naziona-le AICAP “Le prospettive di sviluppo delle opere in calcestruzzo strutturale nel terzo millennio”, May 19-21, Padua, Italy. Paper 54, 2011. (in Italian)
[37] T. Rossetto, and A. Elnashai, “A new analytical procedure for the derivation of displacement-based vulnerability curves for popula-tions of RC structures”, Eng. Struct., vol. 7, no. 3, pp. 397-409, 2005.
[38] G.M. Calvi, D. Bolognini, and A. Penna, Seismic Performance of masonry-infilled RC frames – Benefits of slight reinforcements. Invited lecture to “Sísmica 2004 - 6º Congresso Nacional de Sis-mologia e Engenharia Sísmica”, Guimarães, Portugal, April 14-16, 2004.
[39] Circolare del Ministero dei Lavori Pubblici n. 617 del 2/2/2009. Istruzioni per l’applicazione delle “Nuove norme tecniche per le costruzioni” di cui al D.M. 14 gennaio 2008. G.U. n. 47 del 26/2/2009. (in Italian).
Received: March 21, 2012 Revised: June 02, 2012 Accepted: June 04, 2012
© Manfredi et al.; Licensee Bentham Open. This is an open access article licensed under the terms of the Creative Commons Attribution Non-Commercial License (http://creativecommons.org/-licenses/by-nc/3.0/) which permits unrestricted, non-commercial use, distribution and reproduction in any medium, provided the work is properly cited.