Influence of Concrete Compressive Strength on Transfer and ...
185
University of Arkansas, Fayeeville ScholarWorks@UARK eses and Dissertations 12-2016 Influence of Concrete Compressive Strength on Transfer and Development Lengths of Prestressed Concrete Alberto Teodoro Ramirez-Garcia University of Arkansas, Fayeeville Follow this and additional works at: hp://scholarworks.uark.edu/etd Part of the Civil Engineering Commons , and the Structural Materials Commons is Dissertation is brought to you for free and open access by ScholarWorks@UARK. It has been accepted for inclusion in eses and Dissertations by an authorized administrator of ScholarWorks@UARK. For more information, please contact [email protected], [email protected]. Recommended Citation Ramirez-Garcia, Alberto Teodoro, "Influence of Concrete Compressive Strength on Transfer and Development Lengths of Prestressed Concrete" (2016). eses and Dissertations. 1770. hp://scholarworks.uark.edu/etd/1770
Transcript of Influence of Concrete Compressive Strength on Transfer and ...

University of Arkansas, FayettevilleScholarWorks@UARK
Theses and Dissertations
12-2016
Influence of Concrete Compressive Strength onTransfer and Development Lengths of PrestressedConcreteAlberto Teodoro Ramirez-GarciaUniversity of Arkansas, Fayetteville
Follow this and additional works at: http://scholarworks.uark.edu/etd
Part of the Civil Engineering Commons, and the Structural Materials Commons
This Dissertation is brought to you for free and open access by ScholarWorks@UARK. It has been accepted for inclusion in Theses and Dissertations byan authorized administrator of ScholarWorks@UARK. For more information, please contact [email protected], [email protected].
Recommended CitationRamirez-Garcia, Alberto Teodoro, "Influence of Concrete Compressive Strength on Transfer and Development Lengths of PrestressedConcrete" (2016). Theses and Dissertations. 1770.http://scholarworks.uark.edu/etd/1770

Influence of Concrete Compressive Strength on Transfer and Development Lengths of
Prestressed Concrete
A dissertation submitted in partial fulfillment
of the requirements for the degree of
Doctor of Philosophy in Civil Engineering
by
Alberto T. Ramirez-García
National University “Santiago Antúnez de Mayolo”
Bachelor of Science in Civil Engineering, 2001
University of Arkansas
Master of Science in Civil Engineering, 2012
December 2016
University of Arkansas
This dissertation is approved for recommendation to the Graduate Council.
Dr. Micah Hale
Dissertation Director
Dr. Ernie Heymsfield
Committee Member
Dr. Douglas Spearot
Committee Member
Dr. José R. Martí-Vargas
Committee Member

ABSTRACT
This research examines the relationship between concrete compressive strength and
strand bond. The goal of this research was to develop an equation that relates strand bond to
concrete compressive strength at strand release (approximately 1 day of age) and at 28 days of
age, and those equations are presented in this investigation. Strand bond is assessed by
measuring the transfer length and development length for prestressed beams cast in the
laboratory. In the U.S., strand bond is predicted using transfer length and development length
equations provided by the American Concrete Institute (ACI-318) Building Code and American
Association of State and Highway Transportation Official (AASHTO) LRFD Bridge Design
Specifications which were developed based on the 1950´s investigations. The equations
provided by both ACI and AASHTO do not address concrete strength while equations,
developed in this investigation, do account for the compressive strength of concrete at release
and testing time. Although there has been much research conducted in this matter, this research
provides a reliability data analysis relating to transfer and development lengths of prestressed
concrete beams. Unlike many of the previous programs, this research includes strands of a
known quality, the largest database of test specimens, and a variety of concrete mixtures and
concrete strengths. This research concludes with the development of an analytical model to
predict transfer length which includes concrete strength at release with fracture propagation
around the strand.

© 2016 by Alberto T. Ramirez -Garcia
All Rights Reserved

ACKNOWLEDGMENTS
I thank God and my Lord and Savior Jesus Christ for giving me these abilities and
strengths to reach this point in my life. I am extremely grateful to Dr. Micah Hale for providing
me his guidance and his wisdom for the completion of this research. His inspiration and his
knowledge in the concrete material fields of prestressed concrete are remarkable which I have
achieved in order to aim my goals. It is extremely difficult to express all the gratitude which he
deserves. He has changed my life forever.
I would like to thank my committee members: Dr. Ernie Heymsfield, Dr. Douglas
Spearot, and Dr. José R. Martí-Vargas. Their contributions made this dissertation better than it
should be.
I would like to thank my wife, Ketty, for her sincere gratitude and my kids: Ariadna,
Cristopher, Daira, Emelyn, and Michael who day by day bring me their love and hopes
selflessly. I would like to thank my Mom, brothers, and sisters for their supports and love.
Despite hard times and issues along the way, they helped me get through some of the most difficult
times.
This research cannot be completed without the assistance of a number of individuals at
the Department of Civil Engineering. I would like to thank: Richard Deschenes Jr., Canh Dang,
Cameron Murray, William Phillips, Doddridge Davis, Joseph Daniels III, and Ryan Hagedorn.
They helped me cast and test all the beams during a hot summer in 2014. I also would like to
thank David Peachee and Mark Kuss for their assistant in technical issues and the use of their
equipment.
Finally, I would like to thank my friends who have spent their time with my family as
well as a huge special gratitude to my American family: Michael and Diane Lawrence for their
love and advice.

DEDICATION
I dedicate this dissertation to my family, who always encouraged me to complete my Ph.D.
study.

TABLE OF CONTENT
: INTRODUCTION AND RESEARCH OBJECTIVES ................................... 1
INTRODUCTION ........................................................................................................ 1
MOTIVATION ............................................................................................................. 4
RESEARCH OBJECTIVES ......................................................................................... 5
DISSERTATION ORGANIZATION .......................................................................... 6
REFERENCES ...................................................................................................................... 8
: EFFECT OF CONCRETE COMPRESSIVE STRENGTH ON TRANSFER
LENGTH………………………………………………………………………………………. 10
INTRODUCTION ...................................................................................................... 11
BACKGROUND ........................................................................................................ 12
RESEARCH SIGNIFICANCE ................................................................................... 16
EXPERIMENTAL PROGRAM ................................................................................. 16
Concrete mixtures ........................................................................................ 16
Beam fabrication .......................................................................................... 18
Bond quality assessment .............................................................................. 18
Instrumentation ............................................................................................ 19
TRANSFER LENGTH ANALYSIS .......................................................................... 21
Measured transfer length data ...................................................................... 21
Transfer length data from the literature ....................................................... 24
Data reduction .............................................................................................. 28
Influence of compressive strength on transfer length .................................. 31
SUMMARY AND CONCLUSIONS ......................................................................... 34

ACKNOWLEDGEMENTS ................................................................................................ 36
REFERENCES .................................................................................................................... 37
: INFLUENCE OF CONCRETE STRENGTH ON DEVELOPMENT
LENGTH OF PRESTRESSED CONCRETE MEMBERS .................................................... 41
INTRODUCTION AND BACKGROUND ............................................................... 42
EXPERIMENTAL PROGRAM ................................................................................. 47
Concrete Mixtures ........................................................................................ 47
Beam Fabrication ......................................................................................... 48
Instrumentation and Testing ........................................................................ 49
DEVELOPMENT LENGTH ANALYSIS ................................................................. 51
Measured Development Length Data from UA ........................................... 51
Equation development ................................................................................. 56
Development Length Data from Literature .................................................. 58
Development Length Comparison of Measured and Predicted Lengths ..... 62
Influence of Concrete Strength on Development Length ............................ 66
SUMMARY AND CONCLUSIONS ......................................................................... 68
ACKNOWLEDGMENT ..................................................................................................... 70
NOTATION ........................................................................................................................ 71
REFERENCES .................................................................................................................... 72
: A HIGHER-ORDER EQUATION FOR MODELING STRAND BOND IN
PRETENSIONED CONCRETE BEAMS ................................................................................ 75
INTRODUCTION AND BACKGROUND ............................................................... 76
BACKGROUND ........................................................................................................ 78

RESEARCH SIGNIFICANCE ................................................................................... 83
MATERIAL PROPERTIES ....................................................................................... 83
Concrete ....................................................................................................... 83
Prestressing steel (strands) ........................................................................... 84
ANALYTICAL FORMULATION ............................................................................. 85
Bond Mechanisms in the Transfer Zone ...................................................... 85
Uncracked Analysis ..................................................................................... 86
Cracked Analysis ......................................................................................... 89
ANALYTICAL PREDICTION OF TRANSFER LENGTH ..................................... 98
IMPLEMENTATION OF A COMPUTER PROGRAM ........................................... 99
MODEL VALIDATION .......................................................................................... 105
Numerical example .................................................................................... 105
Transfer length comparison from measured and numerical analysis ......... 108
SUMMARY AND CONCLUSIONS ....................................................................... 116
ACKNOWLEDGEMENT ................................................................................................ 118
NOTATION ...................................................................................................................... 119
APPENDIX A ................................................................................................................... 123
APPENDIX B ................................................................................................................... 126
REFERENCES .................................................................................................................. 127
: CONCLUSIONS, CONTRIBUTIONS, AND FUTURE WORKS ............. 132
CONCLUSIONS....................................................................................................... 132
CONTRIBUTION TO THE BODY OF KNOWLEDGE ........................................ 134
FUTURE WORKS.................................................................................................... 136

APPENDIX ................................................................................................................................ 137
APPENDIX A : PROGRAM 1 ......................................................................................... 138
A.1 Code ........................................................................................................... 138
A.2 Input Data File ........................................................................................... 140
A.3 Output Data File ......................................................................................... 140
APPENDIX B : PROGRAM 2 .......................................................................................... 142
B.1 Code ........................................................................................................... 142
B.2 Input Data File ........................................................................................... 164
B.3 Output Data File ......................................................................................... 164

LIST OF FIGURES
Figure 1-1. Hoyer’s Effect - Transferring of prestress to the concrete .......................................... 1
Figure 1-2. Strand stress vs. length ................................................................................................ 2
Figure 2-1. Beam section and reinforcement detail ..................................................................... 18
Figure 2-2. Placement of DEMEC points (Photo by author). ...................................................... 20
Figure 2-3. DEMEC measurements (Photo by author). ............................................................... 20
Figure 2-4. Transfer length analysis – power regression. ............................................................ 22
Figure 2-5. Ratio of predicted to measured transfer length. ........................................................ 24
Figure 2-6. Transfer length of 12.7 mm strand from the literature. ............................................. 27
Figure 2-7. Transfer length of 15.2 mm strand from literature (** = 15.75 mm). ....................... 27
Figure 2-8. Transfer length ratio using ACI 318-14 for 12.7 mm strand. ................................... 29
Figure 2-9. Transfer length ratio using ACI 318-14 for 15.2 mm strand. ................................... 29
Figure 2-10. Transfer length ratio using Eq. 2 for 12.7 mm strand. ............................................ 30
Figure 2-11. Transfer length ratio using Eq. 2 for 15.2 mm strand. ............................................ 30
Figure 2-12. Comparison of normalized transfer lengths. ........................................................... 32
Figure 3-1. Strand stress vs. length, ACI 318-11 (R12.9) and AASHTO LRFD (C5.11.4.2-1).. 43
Figure 3-2. Reinforcement details of a prestressed concrete beam. ............................................. 49
Figure 3-3. Shear/End-Slip failure of NSLS-3D (Photo by author). ........................................... 51
Figure 3-4. Development length test results for each case of failures. ........................................ 55
Figure 3-5. Flexural bond length analysis. ................................................................................... 58
Figure 3-6. Standard normal distribution with z-scores of -1 and +1 indicated. ......................... 61
Figure 3-7. The normal distribution with different means and unequal standard deviation. ....... 63

Figure 3-8. Relationship between ACI 318-14 ratio and the normalized embedment length factor.
....................................................................................................................................................... 65
Figure 3-9. Relationship between UAPE ratio and the normalized embedment length factor. ... 65
Figure 3-10. Comparison of normalized development length factors. ........................................ 67
Figure 4-1 – Stress and displacements in thick-wall cylinder: (a) thick-wall cylinder (The z axis
is perpendicular to the plane of the figure); (b) Stresses in cylindrical volume of thickness dz; (c)
Radial displacement in cylindrical volume of thickness dz. ......................................................... 78
Figure 4-2 - Prestressed concrete beams idealized as thick-walled cylinder. .............................. 79
Figure 4-3 - Hoyer’s effect along the transfer length................................................................... 86
Figure 4-4 – Analytical expressions used for modeling the stress-crack width relationship. ...... 90
Figure 4-5 – Fracture zones around the prestressing steel. .......................................................... 91
Figure 4-6 – Stresses on the prestressing strand: (a) Discretization of prestressing steel; (b) Finite
element idealization for prestressing steel (kb is the bond stiffness). ........................................... 98
Figure 4-7 – Flowchart of the analytical model. ........................................................................ 101
Figure 4-8 – (a) Numerical analysis of transfer length using the program TWC_LTDXv1; (b)
Mechanical interlocking considered in the analysis. .................................................................. 103
Figure 4-9 – Idealization of the thick-walled cylinder. .............................................................. 104
Figure 4-10 – Transverse stress distribution: (a) Isotropic elastic analysis at station 1 (free end);
(b) Anisotropic and isotropic analysis at fracture zone at station 200 (a distance of 199 mm of the
free end) and at effective stress of 502.1 MPa (specimen SS160-6). ......................................... 107
Figure 4-11 – Correlation of between coefficient of friction and concrete cover with transfer
length........................................................................................................................................... 109

Figure 4-12 – Transfer length comparison between measured and calculated for mono strand test
series. .......................................................................................................................................... 111
Figure 4-13 – Transfer length comparison between measured and calculated for twin strand test
series. .......................................................................................................................................... 112
Figure 4-14 – Concrete strain distribution: (a) From the numerical analysis; (b) Comparison
between numerical analysis and experimental measurement using DEMEC gauges (specimen
NSC-II-12). ................................................................................................................................. 113
Figure 4-15 – Stress distribution along the beam NSC-II-12 using the proposed method: (a) Strand
stress and transfer length calculation; (b) Concrete stress and zones of analysis. ...................... 115

LIST OF TABLES
Table 2-1 - Proposed equations for predicting transfer length (MPa and mm). ........................... 15
Table 2-2 - Mixture identifications, number of tests, and compressive strength. ........................ 17
Table 2-3 - Measured transfer lengths and predicted lengths. ..................................................... 21
Table 2-4 - Transfer lengths from the literature for 12.7 mm strand. .......................................... 25
Table 2-5 - Transfer lengths from the literature for 15.2 mm strand. .......................................... 26
Table 3-1 – Proposed equations for predicting development length (Ld = Lt + Lfb) from the
literature (in MPa and mm). .......................................................................................................... 46
Table 3-2 – Number of trial beams, tests performed for transfer lengths, and concrete strength
mean for release and time of testing. ............................................................................................ 48
Table 3-3 – Development length test results of the NSCL, NSSH, and NSLS beams tested at both
ends. .............................................................................................................................................. 52
Table 3-4 – Development length test results of HSCL, HSSH, and HSLS beams (tested at both
ends). ............................................................................................................................................. 53
Table 3-5 – Development length test results of SCC, LWSCC, HSC, & UHPC beams tested at
only one end. ................................................................................................................................. 54
Table 3-6 – Reduction of the UA data set of embedment length. ................................................ 57
Table 3-7 – Data set from the literature. ...................................................................................... 59
Table 4-1 –Program notation and input data .............................................................................. 102
Table 4-2 – Input data used in the program ............................................................................... 106
Table 4-3 – Transfer length comparison between experimental and numerical results ............. 108

NOTATIONS
As area of the prestressing strand (mm2)
Ab nominal area of strand
Ag cross section area of concrete member
Ap total area of strand
Ac cross sectional area of concrete
cy clear concrete cover
ec eccentricity of the prestress force
E elastic modulus of element
Ec elastic modulus of concrete
Ep elastic modulus of strand
Epr elastic modulus of strand in the transversal direction
db diameter of the strand (mm)
f‘ci concrete compressive strength at prestress release (MPa)
f‘c concrete compressive strength at 28-days or time of testing (MPa)
fsi initial prestress (MPa)
fse effective prestress in strand after losses (MPa)
fps stress at nominal strength of the member (MPa)
ft concrete’s tensile strength
fcz concrete compressive stress due to effective prestress
fpu ultimate tensile strength
fpy yield strength
fpi initial prestressing stress

Lt transfer length of prestressing steel in pretensioned concrete members
Lfb flexural bond length
Le embedment length (mm)
Ld development length (mm)
ke normalized embedment length factor
kp normalized predicted development length factor
U’t plastic transfer bond stress coefficient
U’d plastic development bond stress coefficient
B bound modulus (MPa/mm)
Ig moment of inertia of concrete section
Poisson’s ratio of element
p Poisson’s ratio of strand
c Poisson’s ratio of concrete
p cE E Modular ratio
n integer number (2 for second-order equation and 3 for third-order equation)
λb bond factor
λsp strand perimeter factor (1 is for solid strand and 4/3 for strand seven wire)
uscE factor of unit system conversion for elastic modulus
uscT factor of unit system conversion for tensile strength
w unit weight of concrete
µ coefficient of friction between prestressing steel and concrete
σi interface pressure
r radial stress at concrete and strand interface
hoop stress
z longitudinal stress
εr radial strain
εθ hoop strain
εz longitudinal strain
εsh drying shrinkage coefficient
Kf constant factor
kt radial stress
kii constant factor (ii = 1,2,3,..,7)
bik bond surface stiffness
rp nominal radius of strand
rc,1 internal radius of concrete cylinder which equals to radius of strand after prestressing
rc,2 external radius of concrete cylinder
r radius in the radial direction
R1 inner radius
R2 outer radius
Rcr crack radius
Rfr fracture radius
τ bond stress
( , , )r z polar coordinates stresses
( , v, )u w polar coordinates displacements
p
fp increase in radius of strand due to reduction in longitudinal stress from initial prestress fsi
to effective prestress fse
p
i reduction in radius of strand due to the uniform radial compression at interface σi
c
i increase in inner radius of the thick-walled concrete cylinder due to the interface pressure
σi
c
fcz increase in inner radius of the thick-walled concrete cylinder due to the longitudinal
compressive stress at the level of strand fcz
c
sh reduction in inner radius of the thick-walled concrete cylinder due to drying shrinkage εsh
c
cr deformation of the real crack zone
c
fr deformation of the fracture zone
fr
c
Ru radial displacement at r = Rfr
x incremental of transfer zone
bif bond force around the strand surface
pxif strand stress incremental
wcr crack width at any point
wa crack width
wo initial crack width at the shear plane

A LIST OF PUBLISHED JOURNAL ARTICLES
Chapter 2: Ramirez-Garcia, A. T.; Floyd, R. W.; Micah Hale, W.; and Martí-Vargas, J. R.,
"Effect of concrete compressive strength on transfer length," Structures, V. 5. 2016,
pp. 131-40.
Chapter 3: Ramirez-Garcia, A. T.; Floyd, R. W.; Micah Hale, W.; and Martí-Vargas, J. R.,
"Influence of Concrete Strength on Development Length of Prestressed Concrete
Members," Journal of Building Engineering. V.6. 2016, pp. 173-83.
Chapter 4: Ramirez-Garcia, A. T.; Dang, C. N.; Micah Hale, W.; and Martí-Vargas, J. R., "A
Higher-Order Equation for Modeling Strand Bond in Pretensioned Concrete Beams,"
Engineering Structures. 2016. (Submitted)

1
: INTRODUCTION AND RESEARCH OBJECTIVES
INTRODUCTION
Transfer length is defined as the necessary length where the fully effective prestressing force, fse,
applied to the strand is transferred to the concrete. Figure 1-1 illustrates how the prestressing
force applied to the strand is transferred to the concrete. The cross-sectional area of the
prestressing strand is reduced as a consequence of elongation from strand tensioning and tries to
expand back to its original diameter when the tension is released. Since the prestress at the ends
of the strand is zero, the variation of the diameter from the original value at the end to the
reduced value after the transfer length creates a wedge effect in the concrete. This phenomenon
helps to transfer the stress from the strand to the concrete and is known as Hoyer’s effect [1-3].
Figure 1-1. Hoyer’s Effect - Transferring of prestress to the concrete
Development length, Ld, is defined as the essential length of strand required to develop the stress
in the strand, fps, corresponding to the full flexural strength of the member. The flexural bond
length is defined as the length of concrete beyond the transfer length required to develop the
ultimate tensile strength of the prestressing strand. Therefore, development length is the sum of

2
the transfer length and the flexural bond length. Figure 1-2 illustrates an idealization of strand
stress versus length for the pretensioned strand.
Figure 1-2. Strand stress vs. length
Investigations in transfer and development lengths began when Hanson and Kaar published their
investigation in 1959 [4]. In 1963, the American Concrete Institute 318 Building Code (ACI
318-14) implemented these equations for predicting transfer and development lengths [5]. The
equations were adopted in 1973 by the American Association of State and Highway
Transportation Officials (AASHTO) Specifications [6-8]. The ACI and AASHTO equations for
transfer length and development are shown below.
The equation for transfer length given by ACI 318-14 (Section 21.2.3) is written as follows
20.7
set b
fL d (1)
where:
Lt = transfer length (mm)

3
fse = effective prestressing stress after all losses (MPa)
db = strand diameter (mm)
In section 22.5.9.1, ACI 318-14 defines transfer length to be 50 strand diameter (50db), and the
development length is a sum of the transfer length and the flexural bond length. The flexural
bond is defined by
1
( )6.9
b ps se bL f f d (2)
where:
Lb = flexural bond length (mm)
fse = effective prestressing stress after all losses (MPa)
fps = strand stress at nominal strength of member (MPa)
db = strand diameter (mm)
Therefore, the development length, Ld, equation given by ACI 318-14 in its Section 25.4.8.1 is
the following
1 1 2
( )20.7 6.9 6.9 3
sed b ps se b ps se b
fL d f f d f f d
(3)
Although AASHTO LRFD adopted the same equations for transfer and development lengths
given by ACI 318-14[5], AASHTO LRFD has specified that the transfer length can be taken as
60 strand diameters (60db) (Article 5.11.4.1) [6]. The development length, written in Eq. (4),
must be taken as specified in its Article 5.11.4.2, and a k factor was added according to

4
recommendation of the 1988 FHWA memorandum mandated to the AASHTO Standard equation
which is the same equation given by ACI 318-14.
2
6.9 3d ps se b
kL f f d
(4)
where:
Ld = development length (mm)
fse = effective prestressing stress after all losses (MPa)
fps = strand stress at nominal strength of member (MPa)
db = strand diameter (mm)
k = 1.0 for pretensioned panels, piles, and other pretensioned members with a depth < 0.60 m.
k = 1.6 for pretensioned members with a depth 0.60 m.
k = 2.0 for debonded strand (Article 5.11.4.3)
These equations were based on early investigations which used stress-relieved Grade 1724
(Grade 250) strand with an ultimate strength, fpu, of 1724 MPa (250 ksi) which was typically
tensioned to approximately 0.70fpu. Currently, low relaxation, Grade 1862 (Grade 270) strand,
with fpu of 1862 MPa (270 ksi), is used and is tensioned to stresses up to 0.80fpu [8, 9]. In
addition to changes in strand properties, concrete properties have also changed since the
inception of these equations.
MOTIVATION
The transfer and development length equations presented in the ACI 318-14 and AASHTO
LRFD Codes are functions of the strand stress, including both the effective prestress in the strand
after all losses (fse) and strand stress at nominal strength of member (fps), and the diameter of the

5
strand (db) [5, 6]. On the other hand, researchers have shown that variables such as initial
prestress (fsi), concrete compressive strength at release time (f‘ci) and at 28-day (f‘c) affect both
transfer and development lengths [9-13]. Research has shown that the equations, both transfer
and development length, are conservative for high strength concrete (concrete with compressive
strengths greater than 62 MPa (9000 psi) at 28 days). The conservativeness of the equations is
due to the changes in material properties of both the strands and concrete since the 1950’s. Such
changes in material properties warrant a change in the prediction equations.
RESEARCH OBJECTIVES
The objectives of the research project are outlined below:
1. Conduct a thorough review of literature pertaining to transfer and development length.
The literature review will focus on experimental work and numerical analysis using finite
element method. Emphasis will be placed on research that focuses on concrete
compressive strength, initial prestress, and strand diameter.
2. Collect data from early investigations on transfer and development lengths published by
the University of Arkansas (UA) and other authors.
3. Develop transfer and development length equations using experimental data. The
development of these two equations will be the topic of the first and second journal
articles (one article on transfer length and another on development length).
4. Conduct an experimental measurement of the transfer and development lengths for 24
prestressed concrete beams which were cast at the UA. The beams were built as the same
size as the earlier specimens [165 mm (6.5 in.) by 305 mm (12 in.) by 5.5 m (18 ft.)] cast
at the UA. Preliminary research has shown that transfer lengths increased when the

6
compressive strength at release was less than 34.5 MPa (5000 psi). However, when the
compressive strength at release was greater than 34.5 MPa (5000 psi), there was little
difference in transfer length. Similar trends were apparent in the development length
results. Therefore, the compressive strengths targets at release of the proposed beams
were focused on a range from 21 MPa (3000 psi) to 55 MPa (8000 psi), but the
compressive strengths at release measured in the field were in the range from 27 MPa
(3860 psi) to 65 MPa (9390 psi). The majority of the beams were cast with compressive
strengths at release less than 34.5 MPa (5000 psi).
5. Develop a numerical method to calculate the internal contact pressure between strand
surface and concrete using the thick-walled cylinder theory, and develop a finite element
model in one dimension to predict transfer length and compare the results with the
experimental results reported in the literature. This is the subject of the third paper.
DISSERTATION ORGANIZATION
This dissertation is a compilation of three articles which were written to support the main idea of
the research. This dissertation is organized in five chapters and two appendices. Chapter 1
describes the introduction and why this research is needed. Chapter 2 describes how a new
transfer length equation was developed and examines the effect of concrete strength on the
transfer length of the prestressing strand. Chapter 3 examines a wide range of concrete
compressive strengths and their effects on the development length in prestressed concrete
members and formulation of a new equation to predict this length. Chapter 4 describes a
numerical method to calculate the contact pressure at the interface of strand and concrete which
is implemented in a one dimensional, finite element analysis which measures the transfer length

7
in prestressed concrete by an iterative process. The results obtained through numerical analysis
were compared and discussed with the experimental results reported by several authors. Finally,
conclusions, contributions of the research, and recommendations for further research in this area
are presented in Chapter 5. The appendices contain the codes of the programs written to achieve
this research.

8
REFERENCES
[1] Mahmoud ZI, Rizkalla SH, Zaghloul E-ER. Transfer and development lengths of carbon fiber
reinforced polymers prestressing reinforcement. ACI Structural Journal. 1999;96:594-602.
[2] Ruiz Coello ED. Prestress losses and development length in pretensioned ultra high
performance concrete beams [Ph.D.]. United States - Arkansas: University of Arkansas; 2007.
[3] Staton BW. Transfer lengths for prestressed concrete beams cast with self-consolidating
concrete mixtures [M.S.C.E.]. United States - Arkansas: University of Arkansas; 2006.
[4] Hanson NW, Kaar PH. Flexural bond tests of pretensioned prestressed beams. ACI Structural
Journal. 1959;55:783-802.
[5] ACI-318-14. Building code requirements for structural concrete and commentary.
Farmington Hills, MI: American Concrete Institute; 2014.
[6] AASHTO. AASHTO LRFD Bridge Design Specifications, Customary U.S. Units (6th ed.).
Washington, D.C.: American Association of State and Highway Transportation Officials 2012.
[7] Lane SN. A new development length equation for pretensioned strands in bridge beams and
piles. Turner-Fairbank Highway Research Center, 6300 Georgetown Pike, McLean, VA 22101
USA: Federal Highway Administration; 1998.
[8] Buckner CD. A review of strand development length for pretensioned concrete members. PCI
Journal. March-April 1995;40:84-105.
[9] Mitchell D, Cook WD, Khan AA, Tham T. Influence of high strength concrete on transfer
and development length of pretensioning strand. PCI Journal. May-June 1993;38:52-66.
[10] Cousins TE, Johnston DW, Zia P. Transfer and development length of epoxy coated and
uncoated prestressing strand. PCI Journal. July-August 1990;35:92-103.
[11] Ramirez JA, Russell BW. Transfer, Development, and Splice Length for
Strand/Reinforcement in High-Strength Concrete. Washington, D.C.: Transportation Research
Board, National Research Council (NCHRP-603); 2008.

9
[12] Zia P, Mostafa T. Development length of prestressing strands. PCI Journal. September-
October 1977;22:54-65.
[13] Martí-Vargas JR, Serna P, Navarro-Gregori J, Bonet JL. Effects of concrete composition on
transmission length of prestressing strands. Construction and Building Materials. 2012;27:350-6.

10
: EFFECT OF CONCRETE COMPRESSIVE STRENGTH ON TRANSFER
LENGTH
Alberto T. Ramirez-Garcia a, RoyceW. Floyd b,W. Micah Hale a, J.R.Martí-Vargas c
a Department of Civil Engineering, 4190 Bell, University of Arkansas, Fayetteville, AR 72701,
United States
b School of Civil Engineering and Environmental Science, 202 W. Boyd St. Room 334, Norman,
OK 73019, United States
c Universitat Politècnica de València (UPV), València, Spain
Abstract:
This paper examines the effect of concrete compressive strength on the transfer length of
prestressing strands. The paper includes the results from several research projects conducted at
the University of Arkansas (UA) and from testing reported in the literature. At the UA, 57
prestressed, precast beams have been cast since 2005. The beams were cast with
selfconsolidating concrete (SCC), high strength concrete (HSC), lightweight self-consolidating
concrete (LWSCC), and ultra-high performance concrete (UHPC). Using data from the UA and
from the literature, an equation to estimate transfer length was developed and presented. The
results were also compared with the American Concrete Institute (ACI 318) and the American
Association of State Highway and Transportation Officials (AASHTO) prediction equations for
transfer length, which were designed for conventional concrete. The results also showed that
there was little change in transfer length when the compressive strength at release was greater
than 34.5 MPa.
Keywords: Pretensioned concrete, Transfer length, Bond

11
INTRODUCTION
Prestressed concrete has been used extensively since the 1950's. Many buildings and bridge
structures utilize its principles, especially pre-cast structures. In the design of pretensioned
members, there is a particular focus on the length a strand must be embedded in the concrete in
order to develop its bond strength. Transfer length refers to the strand length required to transfer
the initial prestress in the strand to the concrete.
The ACI 318 Building Code and Commentary (hereafter referred to as ACI 318-14) [1] and the
AASHTO Load and Resistance Factor Design (LRFD) [2] Specifications (hereafter referred to as
AASHTO) provide equations to estimate transfer length. The equation is a function of the
effective prestress (fse) and the strand diameter (db) [1-3]. Investigators have shown that initial
prestress (fsi), and concrete compressive strength both at prestress release (f‘ci) and at 28-days
(f‘c), contribute to transfer length [3-8].
With the changes occurring regarding concrete mixture proportioning and properties, researchers
have and are questioning the accuracy of the ACI 318-14 and AASHTO equations. In these
design codes, concrete compressive strength is not a variable in the transfer length equations
even though it has been shown to affect bond [8-10]. For example, the transfer length for high
strength concrete members is less than that predicted by ACI 318-14 and AASHTO [5, 6, 11].
Transfer length is an important parameter in shear design and in determining allowable stresses.
An incorrect estimation of this length can affect the shear capacity of a member and may result
in serviceability issues that occur in the end zones at strand release [10, 12]. Therefore, there is a
need to better estimate transfer length and this can be accomplished by incorporating concrete
compressive strength in the transfer length equation.

12
BACKGROUND
Research on the transfer length in prestressed concrete members began when Hanson and Kaar
published their findings on the flexural bond behavior of prestressing strand in 1959 [13]. In
1963, the ACI Building Code implemented equations for these lengths [1]. The ACI formulas
were adopted in 1973 by AASHTO [2, 14, 15]. The equation for transfer length given by ACI
318-14 section R21.2.3 [1, 3] is written as follows:
20.7
set b
fL d (1)
where:
Lt = transfer length (mm)
fse = effective prestress after all losses (MPa)
db = strand diameter (mm)
ACI 318 also states that transfer length can be estimated as 50 strand diameters (50db) [1, 3] and
AASHTO uses 60db (Article 5.11.4.1) [2].
The early transfer length research used stress-relieved Grade 1724 strand with an ultimate
strength, fpu, of 1724 MPa, and were typically pretensioned to approximately 0.70fpu. In current
practice, low-relaxation Grade 1862 strand (fpu of 1862 MPa) is used, and is pretensioned up to
0.80fpu [2, 5, 15]. However these changes are not reflected in the code equations.
In 1977, Zia and Mostafa proposed a formula to calculate the transfer length of prestressing
strands [7]. Their equation accounted for the effects of strand size, initial prestress, effective
prestress, ultimate strength of the prestressing strand, and concrete compressive strength at
prestress release (ranging from 14 to 55 MPa). Their research showed that the equations were
more conservative (predicted larger values) than the ACI Code when the concrete strength at
release is low (14 MPa ≤ f’ci ≤ 28 MPa).

13
In 1990, Cousins, Johnson, and Zia developed analytical equations for transfer length that
included plastic and elastic behavior. In these equations new variables were introduced such as
the plastic transfer bond stress coefficient (U’t), the bond modulus (B), and the prestressing
strand area (As). Even though Cousins et al. expressed that the ACI 318 Code and AASHTO
provisions were inadequate and should be revised, the equations remained unchanged [4].
In 1993, Mitchell et al. studied the influence of concrete strength on transfer length. Their
reported concrete strengths at prestress release varied from 21 to 50 MPa and from 31 to 89 MPa
at the time of testing. Mitchell et al. developed and proposed an equation for transfer length
which predicted shorter values than ACI 318-14 for higher strength concretes [5]. Their findings
indicated a reduction in transfer length with increasing concrete compressive strength.
In 1994, Deatherage, Burdette, and Chew cast twenty full scale AASHTO Type I beams with
different strand diameters to investigate the transfer length. This work came after the Federal
Highway Administration (FHWA) enforced restrictions on the use of Grade 1862 low relaxation
seven wire prestressing strand in prestressed concrete girders in October 1988 [16]. Deatherage,
Burdette, and Chew considered different strand stresses to formulate an equation for transfer
length. The proposed equation resembles the ACI 318-14 and AASHTO equations, but the
transfer length is governed by the initial prestress (fsi) instead the effective prestress (fse) [1-3].
Although Deatherage, Burdette, and Chew made suggestions on the transfer length equation, no
changes were made because the suggestions were more conservative.
In 1996, Russell and Burns investigated the transfer length for 12.7 mm and 15.2 mm diameter
strands. They examined several variables such as strand spacing, strand debonding,
reinforcement confinement, number of strands per specimen, and size and shape of the cross
section [17]. The results showed that the transfer lengths, measured using the “95 Percent

14
Average Maximum Strain” method (95% AMS), for both 12.7 and 15.2 mm strands, were very
similar and were larger than ACI 318 and AASHTO standard provisions. Consequently, a new
equation for transfer length was proposed by the expression 13.8se bf d ; where fse (MPa) and db
(mm).
In 2006, Marti-Vargas et al. showed that for concretes with compressive strengths in the range of
21 MPa to 55 MPa, the transfer lengths were about 50% to 80% of those calculated by ACI 318-
11 [18]. Later, Marti-Vargas et al. investigated the relationship between the average bond stress
for the transfer length as a function of the concrete compressive strength [19]. The transfer
length decreased as the concrete compressive strength at prestress release increased [8, 20, 21],
and the transfer length depended on the cement content, water content, and bond stress.
In 2008, Ramirez and Russell published a report based on an investigation sponsored by the
National Cooperative Highway Research Program (NCHRP-603) [6]. In this project the transfer
length was measured in concrete specimens cast with normal-weight and high-strength concrete
at compressive strengths up to 103 MPa. The research showed that increasing concrete strength
correlated clearly with the shortening of transfer length. As a result, a new equation was
recommended for the AASHTO specifications. In particular, this new equation included the
concrete compressive strength at release (f’ci). In addition, for concrete compressive strengths at
release of 28 MPa, the transfer length was recommended to be 60db, which was the same value
provided by AASHTO. On the other hand, for concrete strengths at release greater than 62 MPa,
40 strand diameters (40db) was the recommended transfer length. Although new equations were
proposed to AASHTO, these equations for transfer length were not added to the specifications.
Shown in Table 2-1 are several equations that were developed for predicting transfer length [4,
6, 7, 14-16, 22].

15
Table 2-1 - Proposed equations for predicting transfer length (MPa and mm).
Source Transfer Length, Lt
ACI-318 / AASHTO LRFD [1] 20.7
set b
fL d
Zia and Mostafa, 1977 [7] '1.5 117si
t b
ci
fL d
f
Cousins et al., 1990 [4]
' '
' '2
t ci se st
b t ci
U f f AL
B d U f
Mitchell et al., 1993 [5] '
20.7
20.7
sit b
ci
fL d
f
Deatherage et al., 1994 [16] 20.7
sit b
fL d
Buckner, 1995 [15] 20.7
sit b
fL d
Lane, 1998 [14] '4 127si
t b
c
fL d
f
Kose and Burkett, 2005 [22] 2
'0.045 25.4si
t b
c
fL d
f
Ramirez and Russell, 2008 [6] '
31540t b b
ci
L d df
Since 2005, Hale et al have conducted a significant amount of research on transfer length [11,
23-29]. These investigations focused on different types of concrete ranging from normal
strength to ultra-high performance concrete. This paper summarizes the findings of the research
and those from the literature and proposes an equation that was based on research encompassing
many concrete types with different compressive strengths.

16
RESEARCH SIGNIFICANCE
The research project included transfer lengths measured at the University of Arkansas (UA) and
from results published in the literature. At the UA, the transfer length was measured for 57 beam
specimens. The specimens were cast with a variety of concrete types at a wide range of
compressive strengths. In addition, measured transfer lengths data were collected from the
literature. This research focuses on the effect of concrete compressive strength (at release and
28-days or time of testing) on transfer lengths. With the data, an equation was developed that
encompasses a wide range of concrete types and concrete compressive strengths.
EXPERIMENTAL PROGRAM
Concrete mixtures
For the specimens cast at the UA, 11 different mixture proportions were developed. These 11
mixtures are shown in Table 2-2. For the first six mixtures listed in Table 2-2, the first two
letters represent the compressive strength. “NS” refers to normal strength concrete mixtures and
“HS” refers to high strength concrete mixtures. The last two letters represent the type of coarse
aggregate used in the mixtures. The aggregate type included shale (SH), clay (CL), and
limestone (LS). The mixtures containing shale or clay are also lightweight mixtures with a unit
weight of approximately 1922 kg/m3. These first six mixtures were also self-consolidating. The
next two mixtures, SCC-I and SCC-III, were normal weight SCC mixtures cast with either Type
I or Type III cement. These mixtures were also normal weight (approximately 2323 kg/m3).
Mixture “HSC” was a high strength concrete mixture. Mixture “UHPC” was a commercially
available ultra-high performance concrete mixture. The final mixture “LWSCC” was a
lightweight SCC mixture proportion that was developed by prestressed concrete beam fabricator.

17
The mixture proportions were discussed in greater details in earlier publications by the authors
[11, 23-30].
The number of beams cast from each mixture and the number of transfer length tests performed
on beams cast with that particular mixture are also presented in Table 2-2. Fifty-one beams
were cast with 15.2 mm diameter [24, 26, 29] strands, and six beams were cast with 12.7 mm
diameter strands [27].
Also shown in Table 2-2 is the mean compressive strength at release and at 28 days for each
mixture. The compressive strengths at release using 15.2 mm strand ranged from 23 MPa to 155
MPa, and the 28 day strengths ranged from 34.5 MPa to 199 MPa. Furthermore, for 12.7 mm
diameter strand the compressive strengths at release ranged from 24 MPa to 37 MPa, and the 28
day strengths ranged from 41 MPa to 52 MPa.
Table 2-2 - Mixture identifications, number of tests, and compressive strength.
Concrete Mixtures
Number
of Trial
Beams
Number
of Lt
tests
f’ci
Mean,
MPa
f’c
Mean,
MPa
NSSH: Normal strength shale 5 10 28 42
NSCL: Normal strength clay 4 8 31 39
NSLS: Normal strength limestone 4 8 33 52
HSSH: High strength shale 4 8 42 48
HSCL: High strength clay 4 8 43 49
HSLS : High strength limestone 4 8 48 64
SCC-III : Self-consolidating concrete Type III 5 10 51 76
SCC-I : Self-consolidating concrete Type I 8 16 54 84
HSC : High strength concrete 6 12 64 85
UHPC : Ultra high performance concrete 7 14 124 182
LWSCC * : Lightweight self-consolidating concrete 6 12 31 46
(*) 12.7 mm diameter strand

18
Beam fabrication
At the UA, 57 fully bonded, prestressed, precast beams have been cast since 2005. Each beam
had a rectangular cross-section of 165 mm by 305 mm and was 5.5 m length. The beams
contained two, low relaxation wire Gr. 1862 prestressing strands located a distance of 254 mm,
measured from the top (compression fiber) of the beam to the centroid of the strand as shown in
Figure 2-1. Strand diameters of 12.7 mm and 15.2 mm were included in the study. Two No. 19,
Gr. 414 reinforcing bars were located near to 51 mm from the top of each beam. The beams
were reinforced with No 6 smooth bars spaced at 150 mm. The beams were cast with mixtures
shown in Table 2-2 [24, 26, 27, 29]. Two beams were cast simultaneously on a 15.2 m
prestressing bed. The strands were tensioned to 75% fpu, 1397 MPa.
A
B
Figure 2-1. Beam section and reinforcement detail
Bond quality assessment
The Standard Test for Strand Bond (STSB) was used to assess the quality of the strands used in
the UA study. The force required to induce 2.54 mm of free end slip for each specimen
exceeded the 4899 kg minimum required for individual specimens. For the three sources of
strands used in the study, the average pull out values of 8700, 10083, and 9339 kg exceeded the

19
minimum requirement of 5715 kg. Thus, the results showed that the strands were of good
quality.
Instrumentation
Before prestress release, detachable mechanical (DEMEC) strain gauge targets were attached to
the beam at the level of the prestressing strand (Figure 2-2). These targets were placed at both
ends of the beam on both faces [7, 17, 31-34]. The first target was approximately placed at 25.4
mm from the beam end, and the other DEMEC points were placed at 100 mm intervals. The
prestress was gradually released approximately 24 hours after casting. This was accomplished
by releasing the pressure in the hydraulic strand tensioning system. Each beam specimen was
labeled based on the concrete type along with a beam number. For instance, the first beam cast
using SCC with Type I cement was labeled SCCI-1 [11, 23, 25, 28]. Surface strains were
assessed using a digital DEMEC strain gauge with 200 mm gauge length. Strain readings were
taken immediately before and after prestress release and at 3, 5, 7, 14, and 28 days (Figure 2-3).
Transfer lengths were determined using the 95% Average Maximum Strain method (AMS) [17].
Transfer length was measured for both beam ends which results in 114 total tests as is shown in
Table 2-2.

20
Figure 2-2. Placement of DEMEC points (Photo by author).
Figure 2-3. DEMEC measurements (Photo by author).

21
TRANSFER LENGTH ANALYSIS
Measured transfer length data
The measured minimum, average, and maximum transfer lengths at release and at 28-days are
presented in Table 2-3. Additionally, the average concrete compressive strengths at release (f‘ci)
and at 28-days (f‘c), the average of the effective strand stress after all losses (fse), and the
predicted transfer lengths using ACI 318-14 & AASHTO are presented.
As shown in Table 2-3, the maximum measured transfer length for all beams was 1090 mm.
This occurred in the NSSH series which also had the lowest concrete compressive strength at
release. This value was greater than the predicted value of 792 mm by approximately 37.5%.
The average transfer length for all NSSH beam was 733 mm at release which was 92.4% of the
predicted value.
Table 2-3 - Measured transfer lengths and predicted lengths.
Series f’ci,
MPa
f’c,
MPa
fse,
MPa
Reported Transfer
Lengths (mm):
Release
Reported Transfer
Lengths (mm):
28 days
ACI /
AASHTO
Min. Avg. Max. Min. Avg. Max. Predicted
NSSH 28 42 1076 505 733 1090 559 681 970 792
NSCL 31 39 1069 495 597 815 424 635 841 787
NSLS 33 52 1166 450 557 991 470 609 1031 858
HSSH 42 48 1146 409 520 681 361 426 521 843
HSCL 43 49 1154 361 486 780 399 487 610 850
HSLS 48 64 1215 460 503 551 490 531 640 895
SCC-III 51 76 1216 381 457 584 368 483 610 895
SCC-I 54 84 1244 394 507 635 343 512 673 916
HSC 64 85 1256 394 506 635 432 579 724 925
UHPC 124 182 1297 267 358 432 279 361 457 955
LWSCC (*) 31 46 1186 381 525 838 330 510 686 873
(*): Strand 12.7 mm diameter was used in this case

22
At the other extreme, the predicted transfer length for the UHPC series was over 250% greater
than the average measured transfer length. The UHPC series possessed the highest compressive
strength at release and at 28 days of age. Table 2-3 shows that once the compressive strength at
release achieved 42 MPa or greater, all measured transfer lengths were less than the values
predicted by ACI 318-14 and AASHTO.
The data was analyzed using a power regression which is shown in Figure 2-4. The measured
transfer lengths are plotted versus the concrete compressive strength. The measured transfer
length at both beam ends is plotted (L = live end and D = dead end) along with the compressive
strength at release and at 28-days. The data in Figure 2-4 confirms that the measured transfer
lengths decreased as the concrete strengths increased [6, 35]. Based on the data shown in Figure
2-4, concrete compressive strength should be included in the transfer length equations [8, 20, 22,
35].
Figure 2-4. Transfer length analysis – power regression.

23
Several researchers have examined the influence of other variables on transfer length [4, 7, 8, 19,
20, 22, 31, 36]. Based on this previous research, two variable sets were included in this study.
For the first set, concrete compressive strength at release (f‘ci), initial prestress (fsi) (75 % fpu =
1397 MPa), and strand diameter (db) were examined. The variables for the second set were
concrete compressive strength at release (f‘ci), effective strand stress after all losses (fse), and
strand diameter (db). Statistical analysis was conducted for the two variable sets, and from this
analysis the first set of variables (f’ci, fsi, and db) were chosen because these variables had a
greater affect transfer length at release [5, 7]. Consequently, an equation for transfer length (Eq.
2) was derived and is shown below:
0.55
'25.7 si
t b
ci
fL d
f
(2)
where:
fsi = initial prestress (MPa)
f’ci = concrete strength at prestress release (MPa)
db = nominal strand diameter (mm)
Figure 2-5 shows the ratio between predicted and measured transfer length for the
ACI/AASHTO, NCHRP-603, and the proposed equation (Eq. 2). The ratio due to the proposed
equation and NCHRP-603 are similar when the concrete strength at release is less than 62 MPa.
The ratio is almost equal to one when the concrete strength at release is equal to 62 MPa. At
compressive strengths greater than 62 MPa, the proposed equation provides a better estimate
than the NCHRP-603 equation. At compressive strengths less than 41 MPa, the ACI 318-14 and
AASHTO equations are more accurate than the proposed and NCHRP-603 equations. In

24
addition, the ratio of the ACI 318-14 and AASHTO equations increases suddenly for higher
compressive strength (f’ci ≥ 62 MPa) while the ratio due to the proposed equation remains closer
to one.
Figure 2-5. Ratio of predicted to measured transfer length.
Transfer length data from the literature
Transfer length data [4-6, 16, 17, 19, 33, 34, 37-41] were collected from the literature in order to
examine the accuracy of the proposed equation. For 12.7 mm strands, 293 transfer length tests
were identified in the literature, and this number was reduced to 180 data points (Table 2-4).
Many researchers reported transfer lengths for the dead ends, live ends, or the average of both
ends. Therefore, the 180 data points represent the total number of transfer length analyzed, and
each transfer length was the average transfer length of both ends of a beam. For 15.2 mm

25
strands, 345 transfer length measurements were identified in the literature and then reduced to
139 data points (Table 2-5). This number represents the average transfer length for 139 beam
ends.
Table 2-4 - Transfer lengths from the literature for 12.7 mm strand.
Literature Source Number
of Tests
Data
Analyzed
Reported Transfer
Length, mm Average
f’ci,
MPa Min. Avg. Max.
Cousins et al., 1990 20 20 813 1262 1880 35
Mitchell et al., 1993 14 8 367 513 711 40
Deatherage et al., 1994 16 16 457 602 914 33
Russell and Burns, 1996 34 17 432 748 978 30
Rose and Russell, 1997 30 15 300 392 587 29
Russell and Burns, 1997 12 6 661 1050 1461 25
Mahmoud et al., 1999 8 8 350 469 600 41
Oh and Kim, 2000 36 18 463 606 826 40
Hodges, 2006 6 3 343 474 699 36
NCHRP-603, 2008 (A/B) 30 15 311 412 554 52
NCHRP-603, 2008 (D) 31 16 391 597 937 53
Bhoem et al., 2010 12 6 343 411 465 47
Marti-Vargas et al., 2012 12 12 400 533 650 39
Myers et al, 2012 8 8 351 460 630 39
UA (release) 12 6 406 525 686 31
UA (28-day) 12 6 394 510 610 46
Total Number of Tests 293 180
Note: Ramirez and Russell, 2008 (NCHRP R-603)

26
Table 2-5 - Transfer lengths from the literature for 15.2 mm strand.
Literature Source Number
of tests
Data
Analyzed
Reported transfer
length, mm Average
f’ci,
MPa Min. Avg. Max.
Cousins et al., 1990 10 10 1118 1435 1727 33
Mitchell et al., 1993 (*) 12 6 305 545 803 40
Deatherage et al., 1994 8 8 889 1032 1270 33
Russell and Burns, 1996 40 20 711 1016 1264 31
Russell and Burns, 1997 13 8 762 1043 1245 28
Oh and Kim, 2000 36 18 539 758 1022 40
NCHRP-603, 2008 (A6) 22 11 475 667 785 51
UA (release) 102 30 305 524 824 64
UA (28-day) 102 28 305 532 833 89
Total Number of Tests 345 139
(*) strand 15.75 mm; UA: University of Arkansas
The measured transfer lengths from the data set were plotted against the concrete compressive
strength at release (f’ci) which ranged from 19 MPa to 155 MPa as shown in Figure 2-6 and
Figure 2-7. For most of the data collected from the literature, the concrete compressive
strengths at release ranged from 19 MPa and 69 MPa. However, there is a limited amount of
data that includes concrete compressive strengths at release over 69 MPa [25]. Both figures
show the decrease in transfer length as concrete compressive strength at release increases. The
figures also show the range of transfer lengths at lower concrete compressive strengths. For 12.7
mm strands, the transfer lengths ranged from approximately 250 mm to 1900 mm at 28 MPa.
The highest transfer lengths were reported by Cousins et al. (1990). These values may have been
caused by unreported factors such as poor strand surface condition [4]. The data also show the
lack of change in transfer length at high release strengths.

27
Figure 2-6. Transfer length of 12.7 mm strand from the literature.
Figure 2-7. Transfer length of 15.2 mm strand from literature (** = 15.75 mm).

28
Data reduction
To determine the accuracy of the proposed equation, outliers in the data set were removed.
Outliers were determined based on the average transfer length ratio and standard deviation. The
transfer length ratio was calculated by dividing the predicted transfer length by the measured
transfer length. Predicted transfer lengths were calculated using the ACI 318-14 equation and
Eq. 2. Some assumptions were made in order to use these equations. These assumptions
included a low relaxation wire, Grade 1862 strand (12.7 mm and 15.2 mm diameter) with an
ultimate strength, fpu, of 1862 MPa, an initial prestress of 1397 MPa (fsi = 0.75fpu ), and an
effective prestress after all losses of 1117 MPa (fse = 0.60fpu) [20]. Using these values, the
predicted transfer lengths obtained using ACI 318-14 were 686 mm and 823 mm for 12.7 mm
and 15.2 mm strand, respectively.
Figure 2-8 and Figure 2-9 show the transfer length ratios (predicted/measured) versus the
measured transfer lengths. The transfer length ratios were calculated using the data set and the
values using the ACI 318-14 equation. These figures also show the average transfer length value
(AV), the standard deviation (SD), the underestimated values (UV), and the overestimated values
(OV), and the upper bound (AV + SD) and lower bound (AV – SD). For the 12.7 mm strand, the
average transfer length ratio was 1.32 with a standard deviation of 0.35. Furthermore, since the
predicted transfer length using the ACI 318-14 equation was constant for both strand sizes (686
mm and 823 mm), the plotted ratios follow the same power trend line as shown in Figure 2-8
and Figure 2-9. Figure 2-10 and Figure 2-11 show the values predicted using Eq. 2. Since the
predicted transfer length values using Eq. 2 are dependent on the concrete strength at release
(f’ci), the predicted transfer length is not constant unlike the values determined using ACI 318-
14. This is reflected in the plot of the data in Figure 2-10 and Figure 2-11.

29
Figure 2-8. Transfer length ratio using ACI 318-14 for 12.7 mm strand.
Figure 2-9. Transfer length ratio using ACI 318-14 for 15.2 mm strand.

30
Figure 2-10. Transfer length ratio using Eq. 2 for 12.7 mm strand.
Figure 2-11. Transfer length ratio using Eq. 2 for 15.2 mm strand.

31
The following conclusions can be determined from Figure 2-8 and Figure 2-10 (12.7 mm
diameter strand). The average transfer length ratio using ACI 318-14 was 1.32, and its SD was
±0.35 while the average transfer length ratio using Eq. 2 was 1.46 and its SD was ±0.38.
Therefore, the ACI 318-14 equation overestimates transfer length by 32% while the proposed
equation, Eq. 2, overestimates by 46%. Although Eq. 2 had a greater standard deviation than
ACI 318-14 (0.38 vs 0.35), the total number of measured transfer lengths between UV and OV
lines represents 39% of the data set analyzed. This represents 10% more than the ACI 318-14
equation. The percentage of excluded data for the ACI 318-14 equation is 71% which represents
10% more than the proposed equation, Eq. 2. Therefore, more data are represented between the
lower and upper bounds for Eq. 2 which means Eq. 2 better represents the measured transfer
length values obtained from the literature than the ACI 318-14 equation.
The same analysis was performed using the data set of 15.2 mm diameter strand. The average
transfer length ratio using ACI 318-14 was 1.17 with a SD of 0.44. The average transfer length
ratio was 1.12 using Eq. 2 and had a SD of 0.31. For the 15.2 mm strands, Eq. 2 overestimated
transfer length by 12% compared to 17% for ACI 318-14. The total measured transfer lengths
between the lower and upper bounds for Eq. 2 represents 72% of the data which is 9 percent
more than that represented by ACI 318-14.
Influence of compressive strength on transfer length
To determine the accuracy of Eq. 2, its predicted values were compared to those from other
proposed equations. The other proposed equations include those listed in Table 2-1 with the
exception of the Buckner equation. This equation was not included in the study because of its
similarity to the Deatherage equation which was included. In order to use some of the equations

32
shown in Table 2-1, additional inputs were necessary. Values for fpu, fsi, fse were assumed in the
previous task, but additional values were needed for the Cousins et al. equation. Those values
included the plastic transfer bond stress coefficient (U’t = 0.556), the bond modulus (B = 0.0815
MPa/mm.), and the area of the prestressing strand (As = 140 mm2) for 15.2 mm diameter strand.
Using these values, the transfer lengths were calculated, normalized with respect to the nominal
strand diameter, and plotted as shown in Figure 2-12.
Figure 2-12. Comparison of normalized transfer lengths.

33
For this analysis, the concrete compressive strength at release was varied from 28 MPa to 83
MPa while the 28 day concrete strength ranged from 41 MPa to 110 MPa. As shown in the
Figure 2-12, the ACI 318-14, AASHTO, and Deatherage et al. equations are not dependent on
concrete strength and therefore their predicted transfer length values are constant for all
strengths.
When the concrete strength at release and at 28-days were 28 MPa and 41 MPa respectively, all
predicted transfer length values using the equations in Table 2-1 were greater than the predicted
value using ACI 318-14. On the contrary, when concrete strength at release is 62 MPa or more,
all equations except for the Deatherage et al. equation predict a transfer length that is less than
that predicted by ACI 318-14. The UA equation, Eq. 2, predicts values that follow similar trends
as the other equations (excluding ACI 318-14, AASHTO, and Deatherage et al.). Eq. 2 predicts
values which are slightly different than those of the NCHRP-603 equation. For instance, Eq. 2
predicts larger transfer length values at lower compressive strengths and shorter values at higher
compressive strengths.
It should be noted that Zia and Mostafa's equation for transfer length [7] was not recommended
for compressive strengths over 55 MPa. For release strengths of 62 MPa and 83 MPa, their
equation predicts transfer lengths that are approximately 40 to 50% less than the minimum limit
recommended by NCHRP-603 (40db). In addition, Figure 2-12 shows two important
conclusions which are:
1. When the concrete strength at release and 28-days increases, the normalized transfer
length decreases for all estimated values except those predicted using the ACI 318-14
(R21.2.3) and Deatherage et al. equations. Value predicted using these two equations
34
are constant due to the fact that the transfer length does not depend on concrete
compressive strength.
2. For compressive strength at release of 83 MPa, the transfer lengths for 5 of the 7
proposed equations which are function of concrete compressive strength predict
values that are lower or equal values than the minimum transfer length (40db) [6].
The exceptions are the Kose and Burkett’s equation and Lane’s equation. However,
at a concrete strength (f’c) greater than 117 MPa, both equations predict transfer
lengths less than 40db.
SUMMARY AND CONCLUSIONS
The research project examined the measured transfer lengths of 57 prestressed concrete beams
cast with a variety of different concrete types. The concrete types included normal strength
(NS), high strength (HS), self-consolidating concrete (SCC), ultra-high performance (UHP), and
light weight (LW) concrete. Fifty one beams were fabricated with 15.2 mm, Grade 270, seven
wire low relaxation prestressing strand. The concrete compressive strengths at release for those
51 beams ranged from 23 MPa to 155 MPa. Six beams were fabricated using 12.7 mm diameter
strands with concrete compressive strengths at release between 24 MPa and 31 MPa. Measured
transfer lengths were determined using concrete surface strains along with the AMS method.
The UA data was analyzed using the power regression in order to develop a new transfer length
equation. A power regression was chosen to develop this new equation because this repression
provided a better fit than the linear regression. This was due to the influence of concrete
compressive strength on the transfer length. In addition, measured transfer lengths from the
literature were collected and analyzed and compared with ACI 318-14, ACI (50db), AASHTO

35
(60db), NCHRP-603 (40db), equations from the literature, and the proposed equation, Eq. 2.
Based on the investigation, the followings conclusions were made:
1. Transfer length in prestressed concrete members decreases as concrete compressive
strength increases. Research results also show that the ACI 318-14 and AASHTO
equations overestimate transfer lengths in members containing concrete with high
compressive strengths. Therefore, concrete compressive strength should be a factor in
predicting transfer length.
2. Based on the results of the study, Eq. 2 and the ACI 318-14 equation are recommended
when the concrete compressive strength at release is less than 34.5 MPa. Based on the
UA experimental data, 40db should be used as minimum transfer length for members
containing concrete with compressive strengths at release greater than 34.5 MPa but less
than 55 MPa. When the concrete compressive strength at release is greater than 55 MPa,
transfer length can be taken as 33db. There is little change in transfer length as concrete
compressive strength at release increases beyond 55 MPa.
3. The proposed UA equation, Eq. 2, is based on experimental data with good strand bond
(STSB values of 117 MPa or more). For strands with poor surface quality, further
investigation is needed in order to determine the applicability of the UA equation.
4. Measured transfer length values collected from the literature were compared to values
predicted using the ACI 318-14, AASHTO, and NCHRP-603 equations. The predicted
values were greater than the mean experimental values for approximately 18% of the
beams containing 12.7 mm diameter strand and 40% for beams containing15.2 mm
diameter strand.

36
5. The total data between the lower and upper bounds, [AVSD], was 53 % for the
measured transfer length ratios using ACI 318-14 and 64% for the same ratio using Eq. 2
for 12.7 mm diameter strand. For 15.2 mm strands, the total data within this range was
63% when ACI 318-14 was used and 72% when Eq. 2 was used. Therefore, the
proposed question, Eq. 2 better represents the experimental data than the ACI 318-14
equation.
6. Current equations do not adequately estimate transfer length for higher strength
concretes. Since the 1970’s, many researchers have recommended including concrete
strength in the equation for transfer length. The proposed equation, Eq. 2, does include
concrete strength and more accurately estimates transfer length for beams containing high
strength concrete.
ACKNOWLEDGEMENTS
Financial support from the Mack-Blackwell Rural Transportation Center (MBTC) Grand Award
Number DTRT07-G-0021 at the University of Arkansas is gratefully acknowledged. The authors
would like to thank Insteel Industries Inc. for providing the strand for this research.

37
REFERENCES
[1] ACI-318-14. Building code requirements for structural concrete and commentary.
Farmington Hills, MI: American Concrete Institute; 2014.
[2] AASHTO. AASHTO LRFD Bridge Design Specifications, Customary U.S. Units. 6th ed.
Washington, D.C.: American Association of State Highway and Transportation Officials
(AASHTO); 2012.
[3] ACI-318-11. Building code requirements for structural concrete and commentary.
Farmington Hills, MI: American Concrete Institute; 2011.
[4] Cousins TE, Johnston DW, Zia P. Transfer and development length of epoxy coated and
uncoated prestressing strand. PCI Journal. 1990;35:92-103.
[5] Mitchell D, Cook WD, Khan AA, Tham T. Influence of high strength concrete on transfer
and development length of pretensioning strand. PCI Journal. 1993;38:52-66.
[6] Ramirez JA, Russell BW. Transfer, Development, and Splice Length for
Strand/Reinforcement in High-Strength Concrete. Washington, D.C.: Transportation Research
Board, National Research Council (NCHRP-603); 2008.
[7] Zia P, Mostafa T. Development length of prestressing strands. PCI Journal. 1977;22:54-65.
[8] Martí-Vargas JR, Serna P, Navarro-Gregori J, Bonet JL. Effects of concrete composition on
transmission length of prestressing strands. Construction and Building Materials. 2012;27:350-6.
[9] Kose MM. Prediction of Transfer Length of Prestressing Strands Using Neural Networks.
ACI Structural Journal. 2007;104:162-9.
[10] Barnes RW, Grove JW, Burns NH. Experimental Assessment of Factors Affecting Transfer
Length. ACI Structural Journal. 2003;100:740-8.
[11] Floyd RW, Ruiz E, D., Do NH, Staton BW, Hale WM. Development lengths of high-
strength self-consolidating concrete beams. PCI Journal. 2011;56:36-53.
[12] Carroll JC, Cousins TE, Roberts-Wallmann CL. A practical approach for finite-element
modeling of transfer length in pretensioned, prestressed concrete members using end-slip
methodology. PCI Journal. 2014;59:110-29.
[13] Hanson NW, Kaar PH. Flexural bond tests of pretensioned prestressed beams. ACI
Structural Journal. 1959;55:783-802.

38
[14] Lane SN. A new development length equation for pretensioned strands in bridge beams and
piles. Turner-Fairbank Highway Research Center, 6300 Georgetown Pike, McLean, VA 22101
USA: Federal Highway Administration; 1998.
[15] Buckner CD. A review of strand development length for pretensioned concrete members.
PCI Journal. 1995;40:84-105.
[16] Deatherage JH, Burdette EG, Chew CK. Development length and lateral spacing
requirements of prestressing strands for prestressed concrete bridge girders. PCI Journal.
1994;39:70-83.
[17] Russell BW, Burns NH. Measured transfer lengths of 0.5 and 0.6 in. strands in pretensioned
concrete. PCI Journal. 1996;41:44-65.
[18] Martí-Vargas JR, Arbelaez CA, Serna-Ros P, Fernandez-Prada MA, Miguel-Sosa PF.
Transfer and development lengths of concentrically prestressed concrete. PCI Journal.
2006;51:74-85.
[19] Martí-Vargas JR, Serna P, Navarro-Gregori J, Pallarés L. Bond of 13 mm prestressing steel
strands in pretensioned concrete members. Engineering Structures. 2012;41:403-12.
[20] Martí-Vargas J, Hale W. Predicting Strand Transfer Length in Pretensioned Concrete:
Eurocode Versus North American Practice. Journal of Bridge Engineering. 2013.
[21] Martí-Vargas JR, Arbelaez CA, Serna-Ros P, Navarro-Gregori J, Pallares-Rubio L.
Analytical model for transfer length prediction of 13 mm prestressing strand. Structural
Engineering and Mechanics. 2007;26:211-29.
[22] Kose MM, Burkett WR. Formulation of new development length equation for 0.6 in.
prestressing strand. PCI Journal. 2005;50:96-105.
[23] Floyd RW, Howland MB, Micah Hale W. Evaluation of strand bond equations for
prestressed members cast with self-consolidating concrete. Engineering Structures.
2011;33:2879-87.
[24] Floyd RW. Investigating the bond of prestressing strands in lightweight self-consolidating
concrete. United States - Arkansas: University of Arkansas; 2012.
[25] John EE, Ruiz ED, Floyd RW, Hale WM. Transfer and Development Lengths and Prestress
Losses in Ultra-High-Performance Concrete Beams. Transportation Research Record: Journal of
the Transportation Research Board. 2011;2251:76-81.

39
[26] Ruiz Coello ED. Prestress losses and development length in pretensioned ultra high
performance concrete beams [Ph.D.]. United States - Arkansas: University of Arkansas; 2007.
[27] Ward D. Performance of prestressed double-tee beams cast with lightweight self-
consolidating concrete [M.S.C.E.]. United States - Arkansas: University of Arkansas; 2010.
[28] Staton BW, Do NH, Ruiz ED, Hale WM. Transfer lengths of prestressed bemas cast with
self-consolidating concrete. PCI Journal. 2009;54:64-83.
[29] Staton BW. Transfer lengths for prestressed concrete beams cast with self-consolidating
concrete mixtures [M.S.C.E.]. United States - Arkansas: University of Arkansas; 2006.
[30] Do NH, Staton BW, Hale WM. Development of high strength self-consolidating concrete
mixtures for use in prestressed bridge girders. The PCI National Bridge Conference. Grapevine,
Texas: CD-ROM; 2006.
[31] Cousins TE, Nassar A. Investigation of transfer length, flexural strength, and prestress
losses in lightweight prestressed concrete girders Charlottesville, VA: Virginia Department of
Transportation; 2003.
[32] Girgis AFM, Tuan CY. Bond strength and transfer length of pretensioned bridge girders cast
with self-consolidating concrete. PCI Journal. 2005;50:72-87.
[33] Oh BH, Kim ES. Realistic Evaluation of Transfer Lengths in Pretensioned, Prestressed
Concrete Members. ACI Structural Journal. 2000;97:821-30.
[34] Russell BW, Burns NH. Measured of transfer lengths of pretensioned concrete elements.
Journal of Structural Engineering. 1997;123:541-9.
[35] Ramirez-Garcia AT, Floyd RW, Hale M, Martí-Vargas JR. Effect of concrete compressive
strength on transfer length and development length. PCI-2013 Convention and National Bridge
Conference: Discover High Performance Precast. Gaylord Texan Resort-Grapevine, Texas: PCI
Journal; 2013.
[36] Martí-Vargas JR, Serna P, Hale WM. Strand bond performance in prestressed concrete
accounting for bond slip. Engineering Structures. 2013;51:236-44.
[37] Rose DR, Russell BW. Investigation of standardized tests to measure the bond performance
of prestressing strand. PCI Journal. 1997;42:56-80.
[38] Mahmoud ZI, Rizkalla SH, Zaghoul E-ER. Transfer and Development Lengths of Carbon
Fiber Reinforced Polymers Prestressing Reinforcement. Structural Journal. 1999;96:594-602.

40
[39] Hodges HT. Top Strand Effect and Evaluation of Effective Prestress in Prestressed Concrete
Beams [Research]. Blacksburg, VA: Virginia Polytechnic Institute and State University; 2006.
[40] Bhoem KM, Barnes RW, Schindler AK. Performance of self-consolidating concrete In
prestressed girders Highway Research Center, Harbert Engineering Center Auburn University,
AL 36830: The Alabama Department of Transportation; 2010.
[41] Myers JJ, Volz JS, Sells E, Porterfield K, Looney T, Tucker B et al. Self‐Consolidating
Concrete (SCC) for Infrastructure Elements: Report B-Bond, Transfer Length, and Development
Length of Prestressing Strand. Rolla, Missouri, MO: Missouri University of Science and
Technology; 2012.

41
: INFLUENCE OF CONCRETE STRENGTH ON DEVELOPMENT
LENGTH OF PRESTRESSED CONCRETE MEMBERS
Alberto T. Ramirez-Garcia a, Royce W. Floyd b, W. Micah Hale c, J.R. Martí-Vargas d
a Tatum-Smith Engineering, Inc, Rogers, AR, 72757, USA
b University of Oklahoma, School of Civil Engineering and Environmental Science, 202 W.
Boyd St., Norman, OK 73019, USA
c University of Arkansas, Department of Civil Engineering, 4190 Bell Engineering Center
Fayetteville, AR 72701, USA
d Institute of Concrete Science and Technology (ICITECH), Universitat Politècnica de València,
4G, Camino de Vera s/n, 46022 Valencia, Spain
Abstract:
Fifty seven prestressed concrete beams were fabricated at the University of Arkansas (UA) to
determine the influence of concrete strength on the development length of seven wire
prestressing strand. The variables considered in the investigation were the concrete compressive
strength (f’c), which ranged from 34.5 MPa to 199 MPa, and the strand diameter, which included
12.7 mm and 15.2 mm. The beams were cast with concrete types which included self-
consolidating concrete, high strength concrete, lightweight concrete, and ultra-high performance
concrete. Development length was determined through flexural testing. The research project
also summarized the findings of several studies from the literature. The measured development
lengths were compared to those calculated using the American Concrete Institute (ACI 318-14)
prediction equation for development length. The results showed that compressive strength
affects the development length and the ACI 318 equation overestimates development length.
Also, a development length equation was developed and presented in the paper.
Keywords: Prestressed concrete, strand bond, development length

42
INTRODUCTION AND BACKGROUND
When designing prestressed concrete members, engineers must determine the development
length of the prestressing strands. The development length is the sum of the transfer length and
the flexural bond length. The transfer length is the distance from the free end of the prestressing
strand necessary to fully bond the strand to the concrete. The flexural bond length, Lb, is the
length required, beginning at the end of the transfer length, to fully develop the strength of the
strand. Therefore the development length, Ld, is the distance from the free end of the strand to
the section where the nominal moment can be resisted [1]. The transfer length, flexural bond
length, and development length are shown in Figure 3-1. The ACI 318-14 (Equation 1.a) and
AASHTO (Equation 1.b) equations for estimating development length are shown below.
1
( )20.7 6.9
sed b ps se b
fL d f f d (1.a)
2
6.9 3d ps se bL f f d
(1.b)
The AASHTO equation is similar to the ACI 318-14 equation for development length, except the
development length has been modified by a k factor (Eq. 1.b) as recommended by the 1988
Federal Highway Administration (FHWA) memorandum [2-4]. The k factor amplifies the
development length calculated by the ACI 318-14 equation. For pretensioned members (panels,
piles, etc) with a depth less than 0.60 m, k = 1.0 and for other pretensioned members with a depth
greater than 0.60 m, k = 1.6. For debonded strands, k = 2.0.

43
Figure 3-1. Strand stress vs. length, ACI 318-11 (R12.9) and AASHTO LRFD (C5.11.4.2-1).
The ACI 318-14 equation was implemented in 1963 based on investigations conducted in the
1950’s [1, 5], and later the ACI 318-14 equation was adopted by AASHTO LRFD Bridge Design
Specifications (hereafter referred to as AASHTO) in 1973 [2, 3, 6]. Concrete technology has
advanced since the equations were adopted, but the equations have remained unchanged. For
example, the compressive strength of the concrete used in the seminal strand bond research by
Hanson and Kaar ranged from 26 to 54 MPa for the development length tests [5]. The use of
high strength concrete has become common in prestressed concrete bridge girders. Higher
concrete compressive strengths can increase span length, decrease girder height, and eliminate
the total number of girders in a bridge when compared to bridge girders cast with normal
strength concrete [7]. Since the original equations were based on lower strength concrete and the
compressive strength being used in current prestressed concrete applications is increasing, it is
necessary to determine the applicability of the development equations given by the ACI318-14
and AASHTO.

44
Since the inception of prestressed concrete research, researchers have investigated the bond
between the concrete and prestressing steel. The current equations provided by ACI 318-14 and
AASHTO are a function of the effective prestress (fse), stress at nominal strength of the member
(fps), and the diameter of the strand (db) [1, 6]. Updated equations have been published to amend
the current equations, but most have not been implemented by ACI 318-14 or AASHTO.
Current investigations have shown that the initial prestress (fsi) and concrete compressive
strength, both at prestress release (f‘ci) and at 28-days (f‘c), affect both transfer and development
lengths [8-12]. Researchers have also shown the measured transfer and development lengths for
high strength concrete members are less than those values predicted using ACI 318-14 and
AASHTO equations [9, 10, 13]. As such, the question has risen as to whether concrete
compressive strength should be included as a principal variable in development length equations.
Several variables have been investigated in order to improve the accuracy of the development
length equation. These variables include the concrete compressive strength at prestress release
(f‘ci) and at the time of testing (f‘c), the initial prestress in the strand (fsi), the effective prestress in
the strand after all losses (fse), the stress in the strand at nominal strength (fps), and the nominal
strand diameter (db). Although these variables are essential for development length, other
variables can be considered, such as friction between the strand and concrete, type of strand
release, strand surface condition, confining reinforcement around the strand, and type of loading
[5, 8, 10, 11, 14, 15]. Table 3-1 contains several equations for transfer lengths and flexural bond
lengths.
Some of the proposed equations in Table 3-1 were developed for concrete with compressive
strength at prestress release between 14 MPa to 55 MPa [11]. Other investigators have studied

45
the transfer and development lengths of prestressed concrete containing high-strength and
normal-weight concrete which included compressive strengths up to 103 MPa [10] and 199 MPa
[13, 16, 17]. These investigations focused on a wide range of concrete including conventional
concrete and ultra-high performance concrete. The research showed that increasing concrete
strength correlated clearly with shortening of the transfer and development lengths.
Some flexural bond length equations [3, 4, 11] use the same equation given by ACI-318-14 [1],
but includes a modification factor, λ, which varies from 0.145 to 0.290 (1 to 2 for fpu and fse in
ksi, and db in inches) [3]. For example, some researchers [11] recommend a modification factor
of 0.181 (1.25 is for fpu and fse in ksi, and db in inches) while others [4] suggest 0.218 (1.5 is for
fps and fse in ksi, and db in inches). Some of the analytical equations for transfer length and
flexural bond length which are shown in Table 3-1 include the plastic and elastic behavior [8].
Through these studies, new variables were introduced which included the plastic transfer bond
stress coefficient (U’t), the plastic bond stress coefficient for development (U’d), the bound
modulus (B), and the area of the prestressing strand (As).
Researchers at the University of Arkansas (UA) have examined the transfer length and flexural
bond length of members cast with a variety of compressive strength [13, 16, 18-23]. These
investigations focused on a wide range of concrete mixtures including conventional concrete and
ultra-high performance concrete. The research showed that increasing concrete strength
correlated clearly with shortening of the transfer and development lengths.
The types of concrete and the properties of concrete have changed since Hanson and Kaar’s
seminal research on strand bond. However, the equations to predict transfer and development
have not changed. This paper examined the development length of concrete with a wide range of
compressive strengths in order to develop an updated equation for estimating the development

46
length of prestressing steel. Once the equation was developed, data sets were collected from the
literature to determine its accuracy when compared to the ACI 318-14 equation.
Table 3-1 – Proposed equations for predicting development length (Ld = Lt + Lfb) from the
literature (in MPa and mm).
Source Transfer Length, Lt Flexural bond length, Lfb
ACI-318 / AASHTO
LRFD [1] 20.7
set b
fL d 0.145fb ps se bL f f d
Zia and Mostafa,
1977 [11] '
1.5 117sit b
ci
fL d
f 0.181fb pu se bL f f d
Cousins et al., 1990
[8]
' '
' '2
t ci se st
b t ci
U f f AL
B d U f
' '
sfb ps se
b d c
AL f f
d U f
Mitchell et al., 1993
[9] '
20.7
20.7
sit b
ci
fL d
f '
310.145fb ps se b
c
L f f df
Deatherage et al.,
1994 [4] 20.7
sit b
fL d 0.218fb ps se bL f f d
Buckner, 1995 [3] 20.7
sit b
fL d
0.145
1 2
fb ps se bL f f d
Lane, 1998 [2] '4 127si
t b
c
fL d
f
'
6.4381
pu se
fb b
c
f fL d
f
Kose and Burkett,
2005 [25]
2
'0.045 25.4si
t b
c
fL d
f
2
'203.2 0.19 (25.4 )
pu si
fb b
c
f fL d
f
Ramirez and Russell,
2008 [10] '
31540t b b
ci
L d df
'
59160fb b b
c
L d df

47
EXPERIMENTAL PROGRAM
Concrete Mixtures
For the specimens cast at the UA, 11 different mixture proportions were developed. The beams
were cast with normal strength concrete (NSC), self-consolidating concrete (SCC), high strength
concrete (HSC), lightweight self-consolidating concrete (LWSCC), and ultra-high performance
concrete (UHPC) [18, 20-22]. In addition, NSC and HSC included subgroups with different
coarse aggregates: Clay (CL), Shale (SH), and Limestone (LS). For instance, NSCL represents a
concrete mixture with normal compressive strength and contains clay coarse aggregate. The clay
and shale were lightweight aggregates, and the resulting concrete mixtures were also lightweight.
The development of these concrete mixtures and their properties (fresh and hardened) has been
discussed in detail in earlier publications by the authors [13, 16, 18-24].
The number of beams cast from each mixture and the number of flexure tests performed are
presented in Table 3-2. The mean compressive strength at release and at 28 days for each
mixture is also provided in Table 3-2. Fifty-one beams were cast with 15.2 mm diameter strands
[18, 20, 22] and six beams were cast with 12.7 mm diameter strands [21]. The compressive
strengths at release using 15.2 mm strand ranged from 23 MPa to 155 MPa, and the 28 day
strengths ranged from 34.5 MPa to 199 MPa. Furthermore, for beams containing 12.7 mm
diameter strands, the compressive strengths at release ranged from 24 MPa to 37 MPa, and the
28 day strengths were between 41 MPa to 52 MPa.

48
Table 3-2 – Number of trial beams, tests performed for transfer lengths, and concrete strength
mean for release and time of testing.
Concrete Series
Number
of Trial
Beams
Number
of Ld
tests
f’ci
Mean,
MPa
f’c
Mean,
MPa
NSCL: Normal strength clay 4 8 31 39
NSSH: Normal strength shale 5 10 28 42
NSLS: Normal strength limestone 4 8 33 52
HSCL: High strength clay 4 8 43 49
HSSH: High strength shale 4 8 42 48
HSLS : High strength limestone 4 8 48 64
SCC-I : Self-consolidating concrete Type I 8 8 54 84
SCC-III : Self-consolidating concrete Type III 5 5 51 76
HSC : High strength concrete 6 6 64 85
UHPC : Ultra high performance concrete 7 7 124 182
LWSCC * : Lightweight self-consolidating concrete 6 6 31 46
(*) 12.7 mm diameter strand
Beam Fabrication
At the UA, 57 fully bonded, prestressed, precast beams have been cast. Each beam had a
rectangular cross-section of 165 mm by 305 mm and was 5.5 m in length. The beams contained
two, low relaxation, Gr. 1862 prestressing strands, located a distance of 254 mm, measured from
the top (compression fiber) of the beam to the centroid of the strand. Strand diameters of 12.7
mm and 15.2 mm were included in the study. Two No. 19, Gr. 414 reinforcing bars were located
51 mm from the top of each beam. The shear reinforcement consisted of No 6 smooth bars
spaced at 150 mm as shown in Figure 3-2. Two beams were cast simultaneously on a 15.2 m
prestressing bed. The strands were tensioned to 75% fpu, 1397 MPa.

49
(a)
(b)
Figure 3-2. Reinforcement details of a prestressed concrete beam.
Instrumentation and Testing
Fifty-one prestressed concrete beams, using 15.2 mm strand, were tested in flexure resulting in
76 embedment lengths (Le). The remaining 6 embedment lengths were obtained from the six
prestressed concrete beams containing 12.7 mm strand. Twenty five of the fifty seven
prestressed concrete beams were tested at both ends while the remaining beams were tested at
only one end.
Each beam was loaded with a single concentrated load at a pre-determined distance.
Determination of the development length was an iterative process using different embedment
lengths. Before the start of each test, the first embedment length was assumed or was determined

50
using the value obtained from the ACI 318-14 equation. The beams were tested to failure, and
the failure mechanism was then determined. The typical failure modes observed were flexure
(FL), flexure/end slip (FL/SL), shear/flexure (SH/FL), shear/end-slip (SH/SL), flexural/end-
slip/shear (FL/SL/SH), bond (BD), shear/bond (SH/BD), or flexural/shear (FL/SH).
The applied load was measured using a pressure transducer connected to the hydraulic actuator
system. The load was continuously monitored using a data acquisition system (DAS). Linear
variable differential transformers (LVDT) were attached to each strand at the end of the beam
being tested. Readings from the LVDTs were continuously recorded and monitored using a
DAS in order to pinpoint the beginning of any strand slip [13, 16, 19]. If the beam did not
exhibit strand slip at failure, and the beam failed in flexure with crushing in the compression
fiber, a pure flexural failure was recorded. This indicated that the development length was
shorter than what was assumed. A shorter embedment length was used for the next test.
However, if strand slip was observed before the nominal moment capacity was achieved and a
bond failure occurred, a longer embedment length was used for the next test. The development
length was considered to occur at the embedment length where the bond failure and flexural
failure occurred at the same time while achieving the nominal moment capacity for the
specimen. This method for determining the development length has been employed by other
researchers [2, 4, 5, 10, 14, 25, 26].
In addition, beam deflection was recorded and monitored using a linear cable encoder placed
between the hydraulic actuator and the top plate of the loading steel roller. In general, for
flexural failures, the measured moment capacity was greater than the nominal capacity, and the
beam experienced large deformations prior to failure. The beams experiencing a pure flexural
failure experienced no strand end slip. Shown in Figure 3-3 is a shear/end slip failure. This

51
failure was characterized by noticeable shear cracks and end slip due to a partial loss of bond
between the strands and concrete. A flexural/end slip failure is characterized by typical flexural
behavior with cracks occurring directly beneath and near the applied load. There is also
significant deflection after achieving the maximum load and corresponding moment. Strand slip
occurred generally prior to or immediately after achieving the nominal moment capacity.
Figure 3-3. Shear/End-Slip failure of NSLS-3D (Photo by author).
DEVELOPMENT LENGTH ANALYSIS
Measured Development Length Data from UA
Eighty-two development length tests were conducted, and the results are summarized in Tables
3- 3, 3-4, and 3-5. Shown in Tables 3-3 and 3-4 is information from the development length
test for the normal (26 tests) and high strength concrete members (24 tests). These beams were

52
subjected to flexural tests at both ends. Likewise, data from the development length tests for
self-consolidating concrete, high strength, ultra-high performance concrete, and light weight self-
consolidating concrete members are shown in Table 3-5. The embedment length, Le is shown in
each table. This was the location of the point load for the flexural test.
Table 3-3 – Development length test results of the NSCL, NSSH, and NSLS beams tested at
both ends.
Test
No. Specimen
Le, mm
f’c,
MPa
fse,
MPa
fps,
MPa
Ld,
mm
Mn,
kN-m
Mmax,
kN-m
Failure
Type
1 NSCL-1D 1270 35 1057 1792 2402 105
106 FL
2 NSCL-1L 1143 79 SH/SL
3 NSCL-2D 1270 46 1105 1809 2367 111
121 FL
4 NSCL-2L 1397 124 FL/SH
5 NSCL-3D 1321 36 1048 1789 2407 106
109 SH/SL
6 NSCL-3L 1219 96 SH/SL
7 NSCL-4D 1219 40 1068 1802 2406 108
116 FL/SL/SH
8 NSCL-4L 1524 123 FL
9 NSSH-1D 1143 34 1041 1790 2420 105
115 FL/SL
10 NSSH-1L 1270 114 FL/SL
11 NSSH-2D 1245 42 1085 1805 2388 109
112 FL
12 NSSH-2L 1016 108 SH/SL
13 NSSH-3D 1016 43 1090 1804 2379 109
94 SH/SL
14 NSSH-3L 1143 116 FL
15 NSSH-4D 1207 46 1088 1806 2387 110
113 FL
16 NSSH-4L 1143 114 SH/SL
17 NSSH-5D 1143 45 1077 1805 2400 109
116 FL
18 NSSH-5L 1016 94 SH/SL
19 NSLS-1D 940 46 1172 1808 2267 110
107 SH/SL
20 NSLS-1L 1003 121 FL/SL
21 NSLS-2D 1016 55 1186 1813 2257 112
133 FL
22 NSLS-2L 1092 127 FL
23 NSLS-3D 1016 54 1148 1812 2310 112
123 SH/SL
24 NSLS-3L 864 115 FL/SL
25 NSLS-4D 1422 54 1159 1814 2298 113
93 SH/SL
26 NSLS-4L 1194 129 FL

53
Table 3-4 – Development length test results of HSCL, HSSH, and HSLS beams (tested at both
ends).
Test
No. Specimen
Le, mm
f’c,
MPa
fse,
MPa
fps,
MPa
Ld,
mm
Mn,
kN-m
Mmax,
kN-m
Failure
Type
27 HSCL-1D 1016 49 1154 1811 2299 111
114 FL/SL
28 HSCL-1L 1270 124 FL
29 HSCL-2D 1124 52 1150 1812 2308 112
116 FL
30 HSCL-2L 1143 116 FL/SH/SL
31 HSCL-3D 1080 46 1158 1810 2292 110
104 SH/SL
32 HSCL-3L 1143 117 SH/SL
33 HSCL-4D 953 49 1154 1811 2299 111
110 SH/SL
34 HSCL-4L 1207 117 FL
35 HSSH-1D 1016 45 1148 1809 2304 110
108 SH/SL
36 HSSH-1L 1270 122 FL
37 HSSH-2D 1080 44 1134 1808 2320 109
124 FL
38 HSSH-2L 1143 121 FL
39 HSSH-3D 889 56 1126 1812 2343 113
104 BD
40 HSSH-3L 1016 108 FL
41 HSSH-4D 1016 48 1174 1812 2272 111
118 FL
42 HSSH-4L 953 106 BD
43 HSLS-1D 1016 61 1214 1819 2229 114
123 BD
44 HSLS-1L 1270 131 FL
45 HSLS-2D 1207 63 1217 1821 2228 115
119 FL/SL
46 HSLS-2L 1143 129 FL/SL
47 HSLS-3D 1080 64 1216 1821 2229 115
118 FL
48 HSLS-3L 1207 118 FL
49 HSLS-4D 889 67 1215 1822 2233 116
107 BD
50 HSLS-4L 1016 119 FL/SL
The concrete compressive strength, f’c, at the time of the flexural test, the effective strand stress,
fse, and the stress in the strand at nominal strength, fps, are shown in the tables. The calculated
development length, Ld, using ACI 318-14 is shown in the tables along with the calculated
nominal moment capacity, Mn, and the maximum measured moment, Mmax, for all beams.
Finally, the failure type for all beam tests is shown.
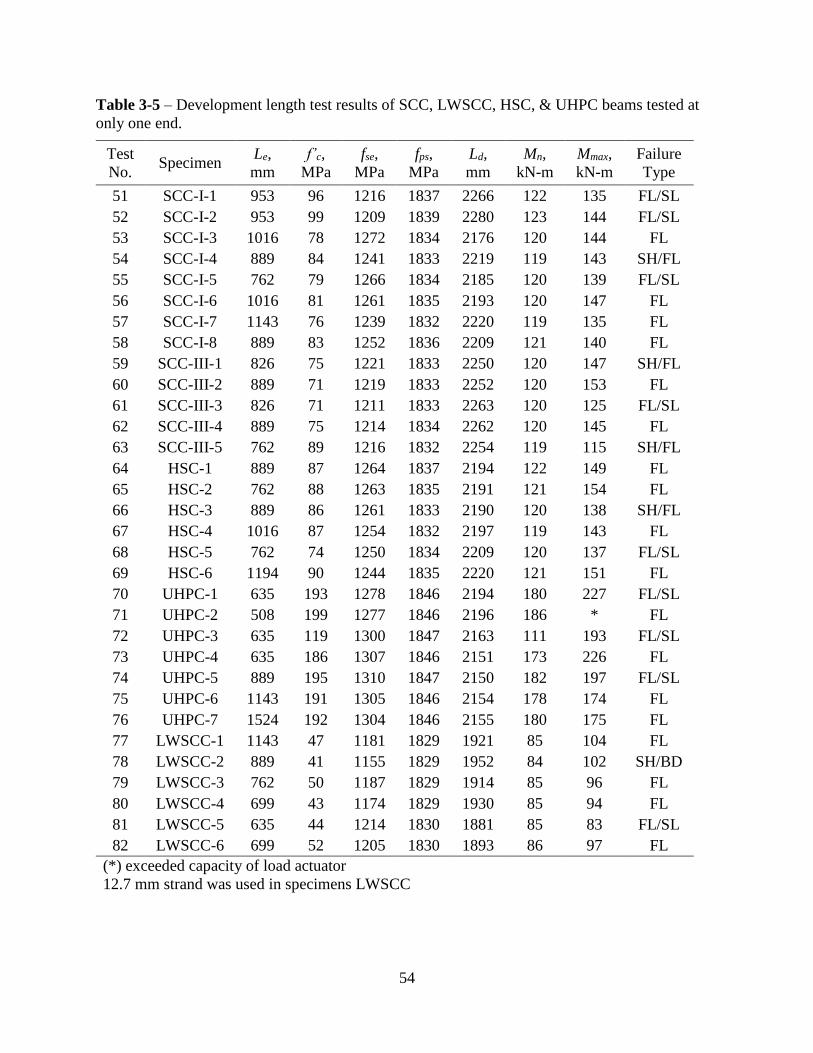
54
Table 3-5 – Development length test results of SCC, LWSCC, HSC, & UHPC beams tested at
only one end.
Test
No. Specimen
Le, mm
f’c,
MPa
fse,
MPa
fps,
MPa
Ld,
mm
Mn,
kN-m
Mmax,
kN-m
Failure
Type
51 SCC-I-1 953 96 1216 1837 2266 122 135 FL/SL
52 SCC-I-2 953 99 1209 1839 2280 123 144 FL/SL
53 SCC-I-3 1016 78 1272 1834 2176 120 144 FL
54 SCC-I-4 889 84 1241 1833 2219 119 143 SH/FL
55 SCC-I-5 762 79 1266 1834 2185 120 139 FL/SL
56 SCC-I-6 1016 81 1261 1835 2193 120 147 FL
57 SCC-I-7 1143 76 1239 1832 2220 119 135 FL
58 SCC-I-8 889 83 1252 1836 2209 121 140 FL
59 SCC-III-1 826 75 1221 1833 2250 120 147 SH/FL
60 SCC-III-2 889 71 1219 1833 2252 120 153 FL
61 SCC-III-3 826 71 1211 1833 2263 120 125 FL/SL
62 SCC-III-4 889 75 1214 1834 2262 120 145 FL
63 SCC-III-5 762 89 1216 1832 2254 119 115 SH/FL
64 HSC-1 889 87 1264 1837 2194 122 149 FL
65 HSC-2 762 88 1263 1835 2191 121 154 FL
66 HSC-3 889 86 1261 1833 2190 120 138 SH/FL
67 HSC-4 1016 87 1254 1832 2197 119 143 FL
68 HSC-5 762 74 1250 1834 2209 120 137 FL/SL
69 HSC-6 1194 90 1244 1835 2220 121 151 FL
70 UHPC-1 635 193 1278 1846 2194 180 227 FL/SL
71 UHPC-2 508 199 1277 1846 2196 186 * FL
72 UHPC-3 635 119 1300 1847 2163 111 193 FL/SL
73 UHPC-4 635 186 1307 1846 2151 173 226 FL
74 UHPC-5 889 195 1310 1847 2150 182 197 FL/SL
75 UHPC-6 1143 191 1305 1846 2154 178 174 FL
76 UHPC-7 1524 192 1304 1846 2155 180 175 FL
77 LWSCC-1 1143 47 1181 1829 1921 85 104 FL
78 LWSCC-2 889 41 1155 1829 1952 84 102 SH/BD
79 LWSCC-3 762 50 1187 1829 1914 85 96 FL
80 LWSCC-4 699 43 1174 1829 1930 85 94 FL
81 LWSCC-5 635 44 1214 1830 1881 85 83 FL/SL
82 LWSCC-6 699 52 1205 1830 1893 86 97 FL
(*) exceeded capacity of load actuator
12.7 mm strand was used in specimens LWSCC

55
Figure 3-4 shows the normalized embedment length factor (ke) for all the tests. ke is the ratio
between the measured embedment length and strand diameter (Le/db). Also, the normalized
predicted development length factor (kp) is the ratio of the predicted development length from the
ACI 318-14 equation and the strand diameter (Ld/db). This is also shown in Figure 3-4. Those
values were normalized in order to compare the development lengths of the two strand diameters
(12.7 mm and 15.2 mm) that were examined in this investigation. As shown in Figure 3-4, the
predominant failure mode was pure flexural failures (FL), which represented 47.6% of the
results. This was followed by flexural/end-slip failures (FL/SL) with 20.7%.
Figure 3-4. Development length test results for each case of failures.
The lower and upper values of the ke are 33 and 100 are also shown in Figure 3-4. These values
were found in the ultra-high performance concrete types and in the normal strength concrete
types, respectively. Beams with the greatest compressive strength had the lowest ke, and ke

56
generally increased as compressive strength decreased. The shortest embedment length tested
was 33db which was in the UHPC specimens, and the longest embedment length tested was
100db which was for the normal strength specimens. When using ACI 318-14 to predict
development length, the kp values range from 141 to 159 as shown in Figure 3-4. According to
these values, the predicted development length is conservative. This is evident in the difference
between the largest ke of 100 using the measured values and the smallest value of 141 using the
development length predicted from ACI 318-14.
Equation development
The results of development length tests for each series are summarized in Table 3-6. In each set
of tests, at least one beam exhibited strand slip before the nominal moment capacity (Mn) was
achieved, and at least one failed without strand slip occurring. When the moment causing strand
slip (Mslip) and the nominal moment capacity (Mn) occurred at the same time, that particular
embedment length was taken as the development length. Although shear failures at short
embedment lengths made determination of the development length difficult at times, comparing
the Mslip to Mn allowed the researchers to determine the development length [13, 16, 19].
As previously mentioned, the development length is the sum of the transfer length and flexural
bond length. In order to develop a new equation for development length, the flexure bond length
must first be determined [5, 27]. Flexural bond length analyses are complicated because not all
embedment length data can be considered in the statistical analysis. As explained previously, the
embedment length can only be taken as the development length when the failure occurs in both
bond and flexure simultaneously while reaching the nominal moment capacity (Mn).

57
Table 3-6 – Reduction of the UA data set of embedment length.
Beam
Series Specimens
Le,
mm
f’c,
MPa
fse,
MPa
fps, MPa
Mn,
kN-m
Mmax,
kN-m
Mslip,
kN-m
NSCL 4 1295 39 1069 1798 108 109 93
NSSH 5 1134 42 1076 1802 109 110 103
NSLS 4 1068 52 1166 1812 112 119 90
HSCL 4 1117 49 1154 1811 111 115 103
HSSH 4 1048 48 1146 1810 111 114 98
HSLS 4 1103 64 1215 1821 115 120 111
SCC-I 5 953 84 1244 1835 121 141 117
SCC-III 8 838 76 1216 1833 120 137 125
HSC 6 919 85 1256 1834 120 146 123
UHPC 7 853 182 1297 1846 170 199 198
LWSCC* 6 804 46 1186 1829 85 96 83
*: strand 12.7 mm
A flexural bond length equation was obtained using a power regression analysis and is shown in
Figure 3-5. In this figure, the flexural bond length is plotted versus values of “x”. The flexural
bond length was taken as the difference between embedment length and measured transfer length
at testing time or 28 days, and these values were plotted against values of factor “x”, defined as
'
c
ps se b
f
f f d.
A linear and power regression analysis was performed in order to calculate an appropriate
flexural bond length. The exponent value, however, was modified from -0.40 to -0.55 in order to
use the same value as previously proposed for transfer length [17]. Finally, the flexural bond
length equation is given by:
0.55
'66.5
ps se
b b
c
f fL d
f
(2)

58
Figure 3-5. Flexural bond length analysis.
The proposed transfer length equation developed in a previous study is shown below in Eq. (3)
[17, 28]. Therefore, the development length equation (UAPE) is then given by Eq. (4).
0.55
'25.7 si
t b
ci
fL d
f
(3)
0.55 0.55
' '25.7 66.5
ps sesid b b
ci c
f ffL d d
f f
(4)
Development Length Data from Literature
A data set of embedment lengths (Le) has been collected from the literature [4, 9, 10, 12, 27, 29-
31]. This data set is shown in Table 3-7 and includes the results of 188 specimens. This data set
is comprised of 103 specimens cast with 12.7 mm strand and 85 specimens cast with 15.2 mm

59
strand. As shown in Table 3-7, some researchers reported only the average value of the
embedment length, not a specific development length. In order to analyze all the data in the
same conditions, the UA data set was reduced from 82 to 57 specimens. Table 3-7 shows the
lower and upper values for embedment length and concrete strength at the time of testing. The
embedment lengths range from a low of 508 mm reported by the UA and to a high of 2946 mm
reported by Deatherage et al. The concrete strength at the time of testing ranged from 31 MPa,
reported by Mitchell et al., to 199 MPa reported by the UA.
Table 3-7 – Data set from the literature.
Source
Strand
size,
mm
Spec
imen
s
Reported Results from the Experimental
Procedure
Embedment Length
(Le),
mm
Concrete strength at
testing time (f'c),
MPa
Lower Avg. Upper Lower Avg. Upper
Mitchell et al., 1993 [9] 12.7 12 650 1021 1600 31 59 89
Deatherage et al., 1994
[4] 12.7 16 1768 1962 2337 37 42 52
Mahmoud et al., 1999
[27] 12.7 8 750 775 800 35 48 63
Hodges, 2006 [30] 12.7 6 1524 1676 1981 44 45 45
Ramirez and Russell,
2008 [10] (A/B) 12.7 16 1168 1492 1854 49 71 100
Ramirez and Russell,
2008 [10] (D) 12.7 19 1168 1561 1854 49 76 100
Marti-Vargas et al., 2012
[12] 12.7 12 600 688 850 43 64 75
Myers et al., 2012 [29] 12.7 8 1473 1664 1854 40 52 64
University of Arkansas 12.7 6 635 804 1143 41 46 52
Mitchell et al., 1993 [9] 15.75 12 676 1154 1864 31 58 89
Deatherage et al., 1994
[4] 15.2 8 1890 2255 2946 35 45 55
Ramirez and Russell,
2008 [10] (A6) 15.2 14 1473 1876 2235 49 63 101
University of Arkansas 15.2 51 508 1010 1524 34 80 199
Note: Ramirez and Russell [10] (NCHRP R-603)

60
The distribution of the ke values for the data set are plotted in Figure 3-6a. As previously
discussed, ke is the ratio between the measured embedment length and strand diameter (Le/db).
For the measured data, the mean ke was 97 with a standard deviation of 38. Approximately 68
percent of the data set from the literature falls between -1.0 and +1.0 standard deviation from the
mean. Notice also that 11 percent of the data set falls between -1.0 and -1.7 and another 15
percent between +1.0 and +2.6. Approximately 6 percent of data set falls outside the standard
normal curve. According to this analysis, the most probable development length is found
between 59db and 135db (which is 97 38).
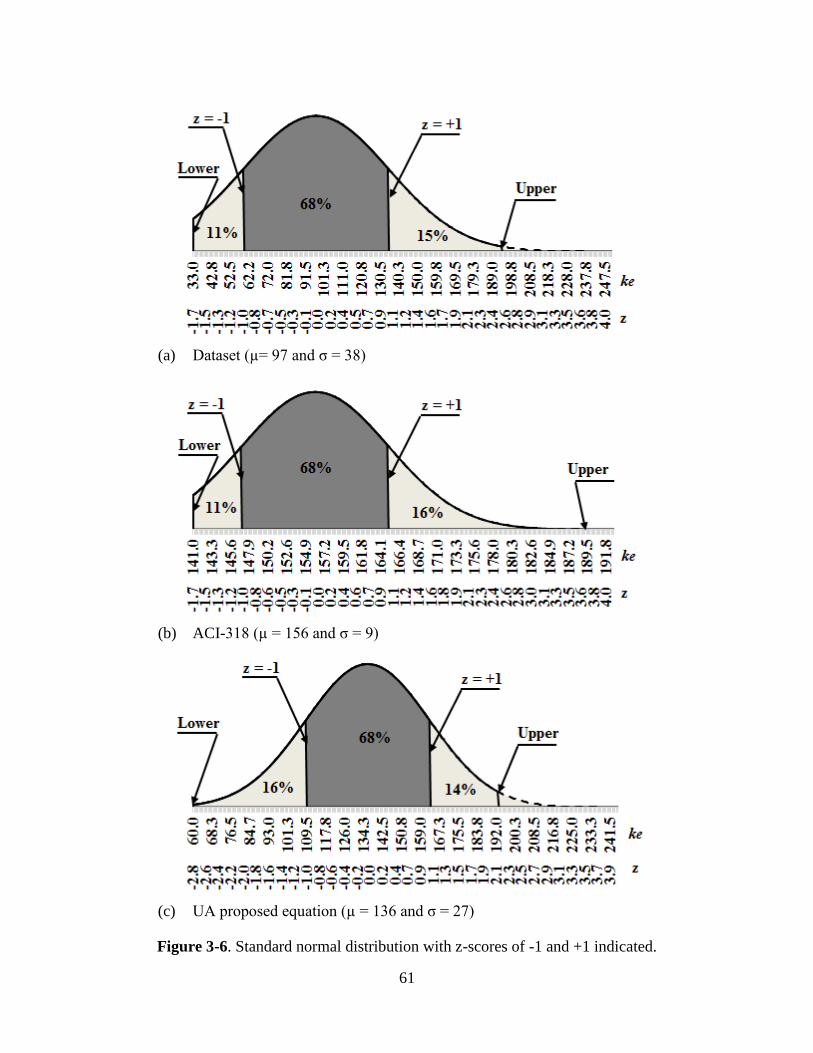
61
(a) Dataset (µ= 97 and σ = 38)
(b) ACI-318 (µ = 156 and σ = 9)
(c) UA proposed equation (µ = 136 and σ = 27)
Figure 3-6. Standard normal distribution with z-scores of -1 and +1 indicated.

62
Development Length Comparison of Measured and Predicted Lengths
The data set obtained from the literature and shown in Table 3-7 was used to compare the
accuracy of the UAPE to the ACI 318-14 equation. Using the ACI 318-14 equation to predict
development length, the kp values were plotted in Figure 3-6b. As previously mentioned, kp
represents that ratio of predicted development length to strand diameter. For some cases, values
for fps and fse were not reported and were assumed to be fps = 1862 MPa and fse =1117 MPa,
respectively. As shown in Figure 3-6b, the mean kp was 156 with a standard deviation of 9.
Approximately 68 percent of the data set from the literature falls between -1.0 and +1.0 standard
deviation from the mean. Notice also that 11 percent of the data set falls between -1.0 and -1.7
and another 16 percent between +1.0 and +3.6. Approximately 5 percent of data set falls outside
the standard normal curve. According to this analysis, the most probable development length is
between 147db and 165db,
A similar analysis was performed using the data set shown in Table 7 and the UAPE. The kp
values using the UAPE are shown in Figure 3-6c. The mean kp was 136 with a standard
deviation of 27. Approximately 68 percent of the data set from the literature falls between -1.0
and +1.0 standard deviation from the mean. Also, 14 percent of the data set falls between -1.0
and -2.8 and another 16 percent between +1.0 and +2.1. Approximately 2 percent of data set
falls outside the standard normal curve. According to this analysis, the most probable
development length is between 109db and 163db,
There are differences between predicted values of the two equations when using the data set.
The mean development length using the ACI 318-14 equation was 156db, and for the UAPE, the
mean value was 136db. Both mean values are greater than the actual mean of the data set which
was 97db. When comparing the two equations, the mean value predicted using the UAPE was

63
closer to the measured mean than the values predicted using ACI 318-14. This analysis also
indicates that the standard normal deviation generated by UAPE is more accurate than the ACI
318-14 equation. For the UAPE, only 2 percent of data are outside of the normal curve,
compared to 5 percent for the ACI-318 equation.
Another analysis was performed using the data shown in Figure 3-6. In Figure 3-7, the three
normal distributions were superimposed so that the intersection points between the three curves
could be determined. The area between the intersection points represents an area where the
development length can be found with a 41 percent probability. This area bridges the gap that
exists between the experimental results and the results from ACI 318-14. These points represent
a development length of 111db to 143db.
Figure 3-7. The normal distribution with different means and unequal standard deviation.

64
The ratio of the measured development lengths to predicted values to ke values are plotted in
Figures 3-8 and 3-9. In Figure 3-8, the predicted value was obtained using ACI 318-14, and in
Figure 3-9 the predicted development length was calculated using UAPE. Shown in both
figures are the average value (AV) of the ratio, its standard deviation (SD), the underestimation
value (which are all ratios less than the average value), the overestimation value (which are all
ratios that are greater than 1.0), the upper bound (AV+SD), and the lower bound (AV-SD).
As shown in the Figure 3-8, the data follow a trend which is increasing ke as the ratio of
measured to predicted development length also increases. The AV for the data is 0.62 with a
standard deviation of ± 0.25. Approximately 9 percent of data were considered overestimates
because their ratio of measured to predict was greater than 1.0. Underestimated values
accounted for 56 percent of the data and were those with a ratio less than 0.62, which was the
average value.
The ratio of measured to predicted using the UAPE is plotted versus ke in Figure 3-9. Although
this data follows the same general trend as that shown in Figure 3-8, the trend is not as
pronounced. The AV for the data is 0.72 with a standard deviation of ± 0.27. For this data, the
amount of data classified as an overestimation and underestimation values represented 19% and
55% of data, respectively.
When comparing the two figures, 65 percent of the data fell between the upper and lower bounds
for the UAPE compared to 60 percent of the data when using ACI 318-14. Based on those
results, the UAPE better estimates development length for the data set than the ACI 318-14
equation.
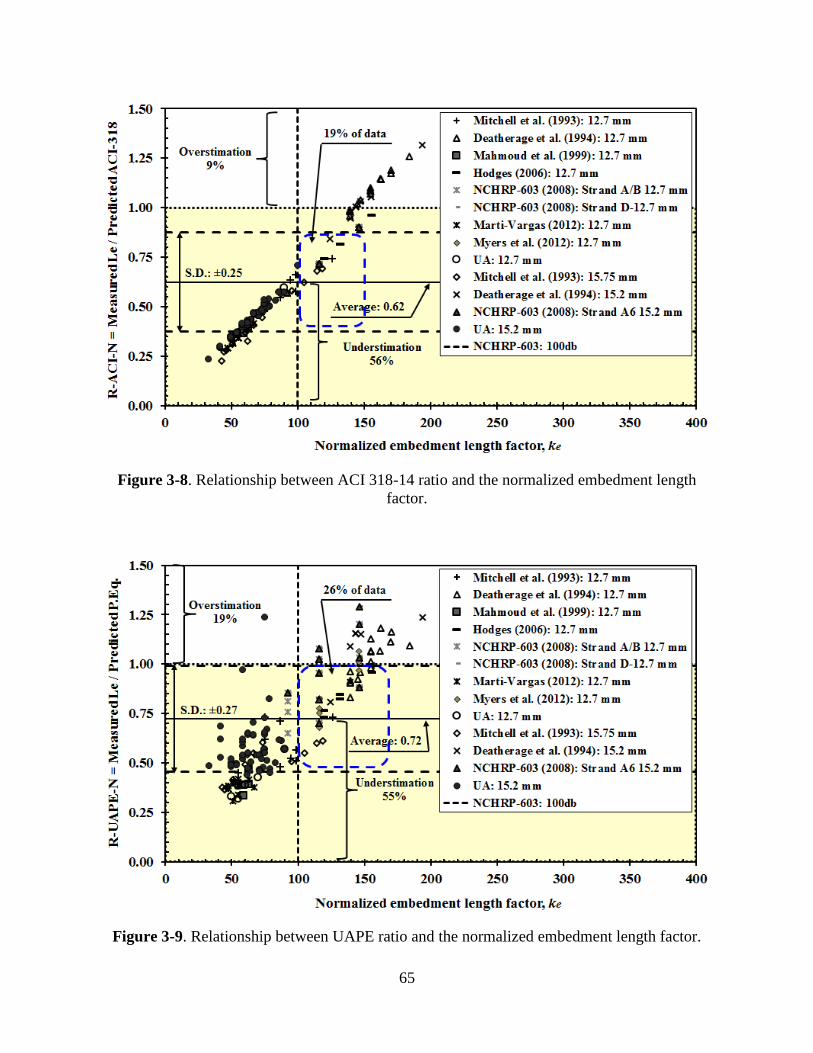
65
Figure 3-8. Relationship between ACI 318-14 ratio and the normalized embedment length
factor.
Figure 3-9. Relationship between UAPE ratio and the normalized embedment length factor.
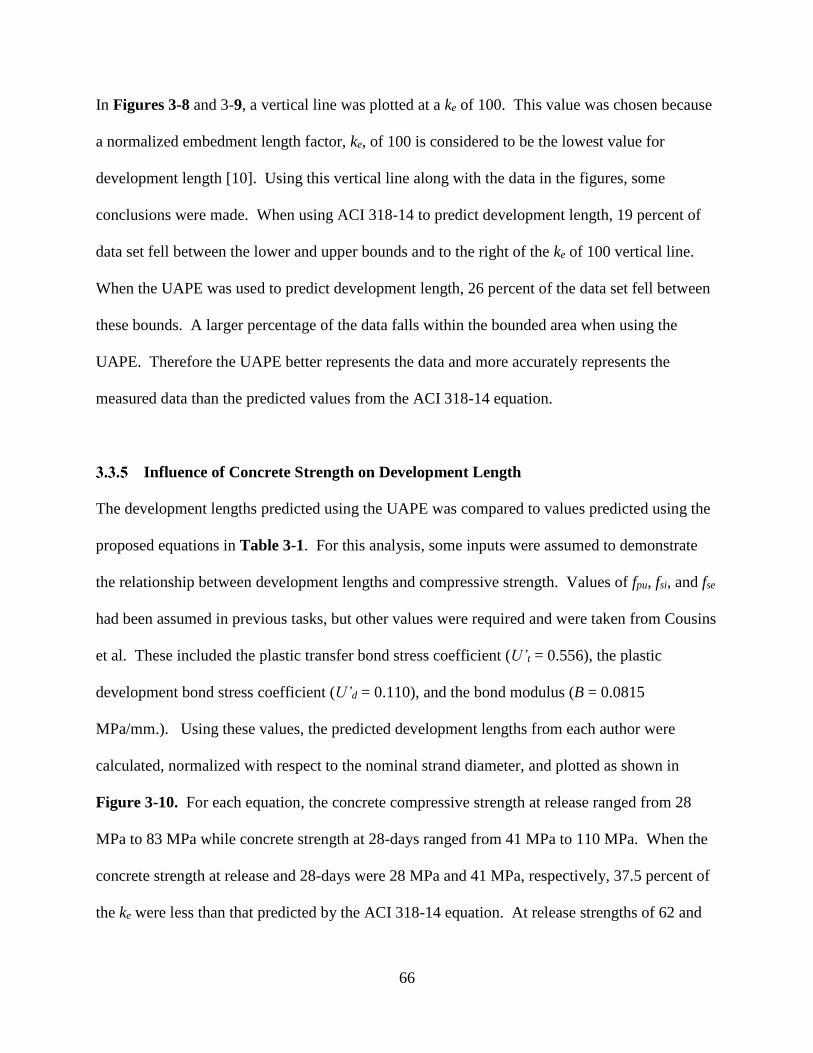
66
In Figures 3-8 and 3-9, a vertical line was plotted at a ke of 100. This value was chosen because
a normalized embedment length factor, ke, of 100 is considered to be the lowest value for
development length [10]. Using this vertical line along with the data in the figures, some
conclusions were made. When using ACI 318-14 to predict development length, 19 percent of
data set fell between the lower and upper bounds and to the right of the ke of 100 vertical line.
When the UAPE was used to predict development length, 26 percent of the data set fell between
these bounds. A larger percentage of the data falls within the bounded area when using the
UAPE. Therefore the UAPE better represents the data and more accurately represents the
measured data than the predicted values from the ACI 318-14 equation.
Influence of Concrete Strength on Development Length
The development lengths predicted using the UAPE was compared to values predicted using the
proposed equations in Table 3-1. For this analysis, some inputs were assumed to demonstrate
the relationship between development lengths and compressive strength. Values of fpu, fsi, and fse
had been assumed in previous tasks, but other values were required and were taken from Cousins
et al. These included the plastic transfer bond stress coefficient (U’t = 0.556), the plastic
development bond stress coefficient (U’d = 0.110), and the bond modulus (B = 0.0815
MPa/mm.). Using these values, the predicted development lengths from each author were
calculated, normalized with respect to the nominal strand diameter, and plotted as shown in
Figure 3-10. For each equation, the concrete compressive strength at release ranged from 28
MPa to 83 MPa while concrete strength at 28-days ranged from 41 MPa to 110 MPa. When the
concrete strength at release and 28-days were 28 MPa and 41 MPa, respectively, 37.5 percent of
the ke were less than that predicted by the ACI 318-14 equation. At release strengths of 62 and

67
83 MPa, 75 percent of the ke were less than those predicted by ACI 318-14. These results show
that the ACI 318-14 equation better estimates development length at lower compressive strengths
than at high compressive strengths.
Figure 3-10. Comparison of normalized development length factors.
Figure 3-10 reveals two important conclusions. The first is when concrete strength at release
and at 28-days increases, ke decreases for all equations where concrete strength is a variable. For
the ACI 318-14 and Deatherage et al. equations, the predicted values are constant because in
those equations, the transfer length and flexural bond length are not dependent on concrete
compressive strength. For the Zia and Mostafa and Deatherage et al. equations, there is little

68
change in development length as concrete strength increases. In these two equations, concrete
strength is only a factor in the transfer length portion of their development length equations. The
second conclusion is related to the effect of high strength concrete on the development length.
For all proposed equations which consider concrete strength at release and at 28 days, the
predicted development length is less than or equal to the 111db that was proposed as the
minimum development length in this investigation.
SUMMARY AND CONCLUSIONS
This study measured the embedment lengths and therefore determined the development lengths
for 57 prestressed concrete beams. The beams were categorized into five groups. These groups
included normal strength (NS), high strength (HS), self-consolidating concrete (SCC), ultra-high
performance (UHP), and lightweight (LW) concrete that consisted of different types of aggregate
and compressive strength. Fifty one beams were fabricated with 15.2 mm, Grade 270, seven
wire low, relaxation prestressing strand. For all beams, the concrete strengths at release ranged
from 23 MPa to 155 MPa. Six beams were fabricated using 12.7 mm diameter strand with
concrete strengths at release between 24 MPa and 31 MPa. The University of Arkansas data was
analyzed using linear and power regression in order to develop a new flexural bond length
equation which is shown below in Eq, (5).
0.55
'66.5
ps se
b b
c
f fL d
f
(5)
In addition, data of measured embedment lengths from the literature was collected, analyzed, and
compared with values predicted using ACI 318-14 and UAPE. Also, proposed development

69
length equations were taken from different researchers and compared with the UAPE equation.
The results showed how development length is influenced by the concrete strength. Based on the
following investigation, the following conclusions were made:
1. This investigation affirms that development length in prestressed concrete decreases as
compressive strength increases. Therefore, concrete compressive strength should play a
role in predicting transfer length and flexural bond length since the ACI 318 and
AASHTO equations tend to overestimate development lengths for high compressive
strengths.
2. The data set of measured embedment lengths collected from the literature were compared
with values predicted by the ACI 318-14 and the UAPE equations. The standard normal
distribution generated by the UAPE linked the area between the data set from the
experimental data with the predicted values of ACI 318-14. The “linked area” represents
a probability of 41 percent that a development length falls in that region. The lower
intersection point, which is 111db, between the normal distribution of the data set and the
predicted values of the UAPE, is the proposed minimum value for development length.
3. The proposed UA equation (UAPE) was used to estimate the development length for
concrete mixtures with a range of compressive strengths at release and at 28 days of age.
The results showed that the UAPE better estimates the flexural bond length than the ACI
318-14 and AASHTO equations.
4. The analysis of the ratio of measured to predicted development lengths for the ACI 318-
14 and UAPE equations indicates that 65 percent of the data set is found between the
upper and lower bounds when using the UAPE to predict development length. When
using the ACI 318-14 equation, 60 percent of data set is located between the bounds.

70
5. Using the data set from the literature and that from the University of Arkansas, the study
has shown that the current equations do not adequately estimate development length for
higher strength concretes. Of the proposed equations, the UAPE best estimates the
development length of prestressed members cast with high strength concrete.
ACKNOWLEDGMENT
Financial support from the Mack-Blackwell Rural Transportation Center (MBTC) at the
University of Arkansas is gratefully acknowledged. The authors would like to thank Insteel
Industries Inc. for providing the strand for this research.

71
NOTATION
As area of the prestressing strand (mm2)
db diameter of the strand (mm)
f‘ci concrete compressive strength at prestress release (MPa)
f‘c concrete compressive strength at 28-days or time of testing (MPa)
fsi initial prestress (MPa)
fse effective prestress (MPa)
fps stress at nominal strength of the member (MPa)
Lfb flexural bond length
Le embedment length (mm)
Ld development length (mm)
ke normalized embedment length factor
kp normalized predicted development length factor
U’t plastic transfer bond stress coefficient
U’d plastic development bond stress coefficient
B bound modulus (MPa/mm)

72
REFERENCES
[1] ACI-318-14, Building code requirements for structural concrete and commentary, American
Concrete Institute, Farmington Hills, MI, 2014.
[2] S.N. Lane, A new development length equation for pretensioned strands in bridge beams and
piles, Federal Highway Administration, Turner-Fairbank Highway Research Center, 6300
Georgetown Pike, McLean, VA 22101 USA, 1998.
[3] C.D. Buckner, A review of strand development length for pretensioned concrete members, PCI
Journal, 40 (1995) 84-105.
[4] J.H. Deatherage, E.G. Burdette, C.K. Chew, Development length and lateral spacing
requirements of prestressing strands for prestressed concrete bridge girders, PCI Journal, 39 (1994)
70-83.
[5] N.W. Hanson, P.H. Kaar, Flexural bond tests of pretensioned prestressed beams, ACI
Structural Journal, 55 (1959) 783-802.
[6] AASHTO, AASHTO LRFD Bridge Design Specifications, Customary U.S. Units, 6th ed.,
American Association of State Highway and Transportation Officials (AASHTO), Washington,
D.C., 2012.
[7] B.W. Russell, Impact of High Strength Concrete on the Design and Construction of
Pretensioned Girder Bridges, PCI Journal, 39 (1994) 76-89.
[8] T.E. Cousins, D.W. Johnston, P. Zia, Transfer and development length of epoxy coated and
uncoated prestressing strand, PCI Journal, 35 (1990) 92-103.
[9] D. Mitchell, W.D. Cook, A.A. Khan, T. Tham, Influence of high strength concrete on transfer
and development length of pretensioning strand, PCI Journal, 38 (1993) 52-66.
[10] J.A. Ramirez, B.W. Russell, Transfer, Development, and Splice Length for
Strand/Reinforcement in High-Strength Concrete, Transportation Research Board, National
Research Council (NCHRP-603), Washington, D.C., 2008.
[11] P. Zia, T. Mostafa, Development length of prestressing strands, PCI Journal, 22 (1977) 54-
65.
[12] J.R. Martí-Vargas, P. Serna, J. Navarro-Gregori, J.L. Bonet, Effects of concrete composition
on transmission length of prestressing strands, Construction and Building Materials, 27 (2012)
350-356.

73
[13] R.W. Floyd, E. Ruiz, D., N.H. Do, B.W. Staton, W.M. Hale, Development lengths of high-
strength self-consolidating concrete beams, PCI Journal, 56 (2011) 36-53.
[14] Y.H. Kim, D. Trejo, M.B.D. Hueste, Bond performance in self-consolidating concrete
pretensioned bridge girders, ACI Structural Journal, 109 (2012) 755-766.
[15] D.R. Rose, B.W. Russell, Investigation of standardized tests to measure the bond performance
of prestressing strand, PCI Journal, 42 (1997) 56-80.
[16] E.E. John, E.D. Ruiz, R.W. Floyd, W.M. Hale, Transfer and Development Lengths and
Prestress Losses in Ultra-High-Performance Concrete Beams, Transportation Research Record:
Journal of the Transportation Research Board, 2251 (2011) 76-81.
[17] A.T. Ramirez-Garcia, R.W. Floyd, M. Hale, J.R. Martí-Vargas, Effect of concrete
compressive strength on transfer length and development length, in: PCI-2013 Convention and
National Bridge Conference: Discover High Performance Precast, PCI Journal, Gaylord Texan
Resort-Grapevine, Texas, 2013.
[18] R.W. Floyd, Investigating the bond of prestressing strands in lightweight self-consolidating
concrete, University of Arkansas, United States - Arkansas, 2012.
[19] R.W. Floyd, M.B. Howland, W. Micah Hale, Evaluation of strand bond equations for
prestressed members cast with self-consolidating concrete, Engineering Structures, 33 (2011)
2879-2887.
[20] E.D. Ruiz Coello, Prestress losses and development length in pretensioned ultra high
performance concrete beams, in, University of Arkansas, United States - Arkansas, 2007, pp. 181.
[21] D. Ward, Performance of prestressed double-tee beams cast with lightweight self-
consolidating concrete, in, University of Arkansas, United States - Arkansas, 2010, pp. 133.
[22] B.W. Staton, Transfer lengths for prestressed concrete beams cast with self-consolidating
concrete mixtures, in, University of Arkansas, United States - Arkansas, 2006, pp. 235.
[23] B.W. Staton, N.H. Do, E.D. Ruiz, W.M. Hale, Transfer lengths of prestressed bemas cast with
self-consolidating concrete, PCI Journal, 54 (2009) 64-83.
[24] N.H. Do, B.W. Staton, W.M. Hale, Development of high strength self-consolidating concrete
mixtures for use in prestressed bridge girders, in: The PCI National Bridge Conference, CD-ROM,
Grapevine, Texas, 2006.
[25] M.M. Kose, W.R. Burkett, Formulation of new development length equation for 0.6 in.
prestressing strand, PCI Journal, 50 (2005) 96-105.

74
[26] H. Park, Z.U. Din, J.-Y. Cho, Methodological Aspects in measurement of strand transfer
length in pretensioned concrete, ACI Structural Journal, 109 (2012) 625-634.
[27] Z.I. Mahmoud, S.H. Rizkalla, E.-E.R. Zaghoul, Transfer and Development Lengths of Carbon
Fiber Reinforced Polymers Prestressing Reinforcement, Structural Journal, 96 (1999) 594-602.
[28] A.T. Ramirez-Garcia, R.W. Floyd, W. Micah Hale, J.R. Martí-Vargas, Effect of concrete
compressive strength on transfer length, Structures, 5 (2016) 131-140.
[29] J.J. Myers, J.S. Volz, E. Sells, K. Porterfield, T. Looney, B. Tucker, K. Holman, Self‐
Consolidating Concrete (SCC) for Infrastructure Elements: Report B-Bond, Transfer Length, and
Development Length of Prestressing Strand, in, Missouri University of Science and Technology,
Rolla, Missouri, MO, 2012.
[30] H.T. Hodges, Top Strand Effect and Evaluation of Effective Prestress in Prestressed Concrete
Beams, in: Civil Engineering, Virginia Polytechnic Institute and State University, Blacksburg,
VA, 2006.
[31] J.R. Martí-Vargas, P. Serna, J. Navarro-Gregori, L. Pallarés, Bond of 13 mm prestressing
steel strands in pretensioned concrete members, Engineering Structures, 41 (2012) 403-412.

75
: A HIGHER-ORDER EQUATION FOR MODELING STRAND BOND IN
PRETENSIONED CONCRETE BEAMS
Alberto T. Ramirez-Garcia1, 2, Canh N. Dang3*, W. Micah Hale2*, J.R. Martí-Vargas4
1 Tatum Smith Engineers, Inc., 1108 Poplar PI, Rogers, AR 72756, USA
2 The University of Arkansas, Department of Civil Engineering, 4190 Bell Engineering Center
Fayetteville, AR 72701, USA 3 Faculty of Civil Engineering, Ton Duc Thang University, Ho Chi Minh City, Vietnam
4 Institute of Concrete Science and Technology (ICITECH), Universitat Politècnica de València,
4G, Camino de Vera s/n, 46022 Valencia, Spain
* Corresponding authors:
Phone +1-479-575-6348
Email: [email protected]; [email protected]
Abstract
In pretensioned concrete members, the bond between prestressing strands and concrete in the
transfer zone is necessary to ensure the two materials can work as a composite material. This
study develops a computer program based on the Thick-Walled Cylinder theory to predict the
bond behavior within the transfer zone. The bond was modeled as the shearing stress acting at
the strand-concrete interface, and this generated a normal stress to the surrounding concrete. The
stresses developed in the concrete often exceeded its tensile strength, which resulted in radial
cracks at the strand-concrete interface. These cracks reduced the concrete stiffness and
redistributed the bond strength along the transfer zone. The developed program was able to
determine the bond stress distribution, degree of cracking, and transfer length of the prestressing
strands. The program was validated using a data set of transfer lengths measured at the
University of Arkansas and a data set collected from the literature.
Keywords: pretensioned concrete, transfer length, strand bond, thick-walled cylinder, crack
width.

76
INTRODUCTION AND BACKGROUND
Pretensioned concrete has been used extensively in buildings and bridge structures since the
1950's. In the design of pretensioned members, determining the transfer length is needed for
calculating concrete stresses at release and quantifying shear strength at the ultimate state.
Transfer length is the required length to transfer the prestress in the prestressing strands to the
concrete. The prestressing force is transferred to the concrete by the bond between the two
materials. The bond is a fundamental factor, which enables the strands and concrete to work as a
composite material [1]. Studies have shown that bond strength is affected by many factors [1-8],
including strand surface conditions [9], size of the strands [10], concrete compressive strength
[11], type of release [4], concrete cover [12], cement content and water to cement ratio [8], and
strand configuration [8, 13, 14]. The effects of these factors on strand bond have been validated
by analytical and experimental studies [15]. While most studies have determined that the
transfer length of prestressing strands is an indicator of strand bond, the number of studies that
directly quantifies the bond-strength modeling at the strand-concrete interface is limited [16-21].
That existing numerical models and programs propose complex procedures to quantify the
nonlinear interaction between the prestressing strands and concrete. Therefore, more research is
needed to develop a simple a reliable technique to efficiently quantify the interaction and
precisely predict the transfer length.
Prestressing steel can be considered as a homogeneous material in an analytical analysis, and its
properties are generally well defined by ASTM-A416 / A416M-15 [22]. Concrete, on the other
hand, is a heterogeneous material consisting of cement mortar and aggregates. Concrete
properties depend on many variables and are difficult to define accurately. However, concrete
can be assumed to be a homogeneous material for general applications in many civil engineering

77
structures, and this assumption is commonly accepted in the literature [23, 24]. The stress-strain
relationship of concrete is nonlinear, and it is different in compression versus in tension.
Prestressing steel is used exclusively in tension, and its stress-strain relationship is represented
by a nonlinear curve [25].
The bond at the strand-concrete interface is dependent upon the properties of prestressing steel
and concrete. The properties of the prestressing steel depend on the strain state of the material
[25-27]. The concrete exhibits a high nonlinear behavior at higher compressive-stress levels and
at the tensile state because of cracking, yielding and crushing [24]. Several investigations have
assumed a perfect bond between the concrete and the prestressing steel since there is no slip at
the contact surface of the concrete and strand. This assumption is used to simplify the
calculation in pretensioned concrete structures using numerical methods, but it does not reflect
the actual behavior of the materials.
For simplification, the design aspects related to strand bond are often solved without considering
the bond stress distribution [7]. In this paper, the bond acting at the strand-concrete interface
was modeled using the principles of solid mechanics. Previous studies determined that the stress
level in the concrete after release often exceeds the concrete’s tensile strength [28, 29], which is
responsible for the concrete cracking within the transfer zone. Therefore, this study considered
both cracked and uncracked regions adjacent to the strand within the transfer zone.
The research aims at predicting the bond behavior within the transfer zone using the Thick-
Walled Cylinder theory. A second-order equation that represents the relationship of post-peak
stress and crack width [30] was upgraded to a third-order equation. A computer program used to
predict the transfer length and bond behavior was developed to analyze the cracked and fracture

78
zone. The accuracy of the developed program was validated using a data set of transfer lengths
measured at the University of Arkansas and a data set collected from the literature.
BACKGROUND
A thick-walled cylinder, which is shown in Figure 4-1, is widely used for estimating the transfer
length in pretensioned concrete beams [12, 28, 30].
Figure 4-1 – Stress and displacements in thick-wall cylinder: (a) thick-wall cylinder (The z axis
is perpendicular to the plane of the figure); (b) Stresses in cylindrical volume of thickness dz; (c)
Radial displacement in cylindrical volume of thickness dz.

79
The cylinder thickness is constant and subjected to a uniform internal pressure p1, a uniform
external pressure p2, and an axial load P. In 1939, Hoyer and Friedrich [31] idealized a
pretensioned concrete beam as a thick-walled cylinder as shown in Figure 4-2.
Figure 4-2 - Prestressed concrete beams idealized as thick-walled cylinder.
The researchers considered the anchorage to be a result of swelling of the prestressing steel or
wires that were caused by Poisson’s ratio and proposed an equation to predict the transfer length
of prestressing strands as shown in Eq. (1).
12 2
b si set c
p c si se
d f fL
E f f
(1)
where Lt = transfer length; db = strand diameter; µ = coefficient of friction between strand and
concrete; c = Poisson’s ratio of concrete; p cE E = modular ratio;
p = Poisson’s ratio of
strand; fsi = initial prestress in strand; Ec = elastic modulus of concrete; fse = effective prestress in
strand after losses; Ep = elastic modulus of strand.

80
In the 1950s, Janney [21] developed an analytical model for the transfer length in which the
prestressing steel was considered a solid cylinder, and the concrete was considered a hollow
cylinder having the inner radius equal to the strand radius and an infinite outer radius. Janney’s
model was identical to Hoyer and Friedrich’s model, which used the thick-walled cylinder
theory. Based on this model, Janney developed an equation to predict transfer length as shown
in Eq. (2).
1 1 ln4
pb si set c
p c si
Ed f fL
E f
(2)
Researchers have reported the applicability of using the thick-walled cylinder theory to predict
the transfer length of prestressing strands [12, 17-19]. Most of the early investigations dealt with
the transfer length of small wires of different sizes [21, 32]. Later studies [7, 17, 19, 31] on the
bond of prestressing strands have dealt with multi-wire strands, including seven-wire, 12.7 mm
and 15.2 mm diameter strand [11, 33]. Weerasekera [28] used these two strand sizes to develop
a theory of bond action that used the principles of solid mechanics to predict the transfer length.
The prestressing strand was considered as a solid cylinder, and the surrounding concrete was
considered as a hollow cylinder. This was achieved through the consideration of elastic analysis
(uncracked region) and a cracked region. The proposed transfer-length equation, Eq. (3),
considered a distributed crack zone around the strand, and the concrete in the affected region was
analyzed as an anisotropic elastic material.
si bt
f t y
f AL
K f c (3)
00 '
0
si bf m
ci
f AK B
F f (3a)

81
where fsi = initial prestress in strand (MPa); Ab = nominal area of strand (mm2); Kf = constant
factor depending on values of B0 = 3.055, F0 = 52320, m0 = 0.28; ft = concrete’s tensile strength
(MPa); cy = clear concrete cover (mm); f’ci = concrete’s compressive strength at release of the
strands (MPa).
Weerasekera [28] used Gopalaratnam and Shah’s equation [29] in order to further investigate the
partially cracked and fully cracked regions. Gopalaratnam and Shah [29] had investigated the
tensile resistance of cracked concrete and proposed a power equation to calculate the tensile
stress in the cracked regions. Their findings have been used to study the crack propagation of
concrete elements subjected to tension by making some modifications. Mahmoud [30] assumed
a simple second-order relationship between post-peak stress and crack width instead of using
Gopalaratnam and Shah’s relationship [29]. Mahmoud [30] concluded this second-order
relationship provided a good agreement with the measured values.
A recent study conducted by Abdelatif et al. in 2015 [12] also affirmed the reliability of using the
using the thick-walled cylinder theory to predict the transfer length of prestressing strands. The
researchers proposed an equation for the transfer length as shown in Eq. (4). In this equation,
the prestressing strand and concrete were assumed to have elastic behavior, and the bond
between the strand and concrete was modeled using Coulomb’s friction law.
2 2
11ln 1 0.95 0.95
2
p p p p
t se se
p p p
r BL f f
B B E A E B E
(4)
where A and B are shown in Eq. (4a) and (4b) respectively

82
,1
2 2
,1 ,2 ,1
2 2
,2 ,1
1
p c
p c c c
p c
p c c c
r rA
r r rr
E E r r
(4a)
,1
2 2
,1 ,2 ,1
2 2
,2 ,1
1
p pcp c
p c c
p c c c
p c
p c c c
Ar r
E E AB
r r rr
E E r r
(4b)
where rp = nominal radius of prestressing steel (mm); rc,1 = internal radius of concrete cylinder
which equals to radius of strand after prestressing (mm); rc,2 = external radius of concrete
cylinder (mm); Ap = total area of strand (mm2); Ac = cross sectional area of concrete (mm2); Ec =
elastic modulus of concrete (GPa); Ep = elastic modulus of strand (GPa); fse = effective prestress
in strand after losses (MPa); p = Poisson’s ratio of strand; c = Poisson’s ratio of concrete; and
µ = coefficient of friction between prestressing steel and concrete
Although analytical models have been developed to predict the transfer length of prestressing
strands, most models assume that the tension stress has a linear behavior, and they do not
consider the fracture zones occurring along the concrete-strand bond interface. In this study, the
behavior of the prestressing strands and the concrete in the transfer zone is evaluated. The
variation of strand stress, which is dependent on the stiffness of the concrete adjacent to the
strands, will also be examined. In this investigation, the proposed method by Mahmoud [30],
which is a second-order equation to analyze the crack zone, is extended to the third-order
because it better fits Gopalaratnam and Shah’s relationship. Moreover, three type of cracks such
as fully cracked, partially cracked, and uncracked are considered in the model, and the actual
contact surface area and the effects of shrinkage are considered as well.

83
RESEARCH SIGNIFICANCE
A new method is proposed to improve the accuracy in quantifying the transfer length by
considering several variables such as the number of cracks, concrete cover, and fracture criteria.
A computer program was implemented based on the thick-walled cylinder theory to analyze the
crack and fracture zone and predict the transfer length of prestressing strands. The relationship
of post-peak stress and crack width proposed by Mahmoud [30] was upgraded from a second-
order to a third-order equation. A data set of 24 transfer lengths measured at the University of
Arkansas and collected from the literature was used to validate the computer program. The
research findings are then synthesized and reported.
MATERIAL PROPERTIES
Concrete
Concrete compressive strength is a significant parameter in the design of pretensioned concrete
structures. The presence of micro-cracks at the interfacial transition zone between the coarse
aggregate and the cement matrix makes the prediction of concrete strength more complex [34].
However, the radial compressive stresses generated by the release of a tensioned strand normally
do not exceed 60% of the concrete’s compressive strength (f’c) [25, 35, 36]. As a result, the
concrete can be modeled as a linear elastic material in compression, and the elastic modulus (Ec)
can be determined using Eq. (5) by [23, 24, 35, 36].
1.50.043c cE w f (5)
where w = unit weight of concrete (kg/m3); f’c = concrete’s compressive strength (MPa).

84
Concrete is stronger in compression than it is in tension. Concrete’s tensile strength is
approximately 10% of its compressive strength [24, 37]. This is a major factor that causes the
nonlinear behavior of either conventionally reinforced or prestressed concrete structures. The
stress-strain response of concrete in tension is assumed to be linear prior to cracking with the
same elastic modulus (Ec), and the concrete’s tensile strength at release of the prestressing
strands is assumed to be equal to the modulus of rupture (ft) [23-25, 35, 36].
0.62t cf f (6)
where f’c = concrete’s compressive strength (MPa).
In this investigation, the allowable compressive stress after prestress transfer was 0.60 cif (where
cif is the concrete’s compressive strength at release of prestressing strands) as recommended by
ACI 318 [35] and AASHTO LRFD [38], although a value of 0.70 cif has also been
recommended [36, 39, 40]. The Poisson’s ratio of concrete is in the range of 0.15 to 0.20 [41]
and is assumed to be equal to 0.15 when this ratio is not specified in the collected data.
Prestressing steel (strands)
The elastic modulus (Ep) and Poisson’s ratio (vp) of prestressing strands are assumed to be 197
GPa and 0.3 [38], respectively. This study used 12.7 mm and 15.2 mm, Grade 1860, low-
relaxation prestressing strands. These strands were tensioned to 1,396 MPa prior to casting the
concrete.

85
ANALYTICAL FORMULATION
A thick-walled cylinder equation was used in this investigation which can be derived from
Figure 4-1.b and Figure 4-1.c [42, 43] and detailed solutions are shown in Appendix A.
Bond Mechanisms in the Transfer Zone
Prestress is transferred to the concrete through adhesion, Hoyer´s effect, and mechanical
interlock [44, 45]. The two primary components of bond in the transfer region can be contributed
to Hoyer´s effect and mechanical interlock. Generally, adhesion is not included because it is lost
once slip occurs. Hoyer’s effect is the first primary component of bond and is due to the lateral
expansion of the strand diameter, which induces frictional forces along the longitudinal axis of
the strand [45, 46]. Mechanical interlock depends on the twisting of the strand about its
longitudinal axis as it tries to slip through the concrete. It is the second primary component of
bond and occurs between the helical lay of the individual wires in the 7-wire strand and the
surrounding concrete [45, 47].
In the transfer zone, the bond between concrete and prestressing strand is generated by high
radial pressures due to Hoyer’s effect as shown in Figure 4-3. Using Coulomb’s friction law,
bond stress (τ) can be expressed as a function of interface pressure (σi) and the coefficient of
friction (μ) as shown in Eq. (7) [7, 12].
i (7)

86
Figure 4-3 - Hoyer’s effect along the transfer length.
Janney (1954) used the coefficient of friction values in prestressing steel wires that ranged from
0.20 to 0.60 [21], whereas a coefficient of friction of 0.75 was used for seven-wire steel strands
[28]. The coefficient of friction used in this investigation, however, has been collected from the
authors reported in this investigation, and for the pretensioned concrete beams tested at the
University of Arkansas, those values have been assumed as 0.45 and 0.50.
Uncracked Analysis
In this analysis, both the concrete and strands are considered isotropic materials (elastic
analysis). The strand is modeled as a solid cylinder having a radius R1 while the concrete is
modeled as a thick-walled cylinder having the inner radius R1 and the outer radius R2. The radius
R2 is equal to the clear concrete cover [7, 28].
Using the assumption of thick-walled cylinder theory, the expressions of stresses, strains, and
displacements can be developed and solved using the constitutive law (stress–strain relationship),
equilibrium and compatibility equations, and imposing boundary conditions. The outer surface
of the concrete cylinder is assumed to behave as a free surface (stress at this point will be zero)

87
while the stresses produced by the strand’s expansion are considered as a pressure developed at
the strand-concrete interface. Moreover, the drying shrinkage of concrete (εsh) produces a
normal stress acting on the strand before prestress release, and the release generates longitudinal
compressive stresses in the concrete at the level of strand (fcz). This effect can reduce the contact
pressure due to the Hoyer’s effect. The compatibility of displacements, therefore, in the radial
direction at the prestressing steel and the concrete can be used to develop the interfacial pressure
as shown by:
p p c c c
fp i i fcz sh (8)
where: p
fp = increase in radius of strand due to the reduction in longitudinal stress from initial
prestress fsi to effective prestress fse; p
i = reduction in strand radius due to the uniform radial
compression at interface σi; c
i = increase in the inner radius of the thick-walled concrete
cylinder due to the interface pressure σi; c
fcz = increase in the inner radius of the thick-walled
concrete cylinder due to the longitudinal compressive stress at the level of strand fcz; c
sh =
reduction in the inner radius of the thick-walled concrete cylinder due to drying shrinkage εsh.
Each of the following parameters described above was extensively described by Mahmoud [30]
and those parameters are explained in Appendix B. Knowing all the parameters, Eq. (8) can be
solved by the following equation as given below:
1
si se czp c sh
p c
i
p c
pr c
f f f
E E
K
E E
(9)

88
where fsi = initial prestress in strand; fse = effective stress in strand after all losses; Ep = elastic
modulus of strand in the longitudinal direction; Epr = elastic modulus of strand in the transversal
direction (in this investigation this value is taken as Ep); νc = Poisson’s ratio for concrete; νp =
Poisson’s ratio for strand; εsh = drying shrinkage coefficient as derived in Eq. (9.b); fcz =
compressive stress in concrete at the level of the strand as derived in Eq. (9.c); Kc = a parameter
shown in Eq. (9.a).
2 2
1 2
2 2
2 1
1 1c c
c
R RK
R R
(9.a)
The drying shrinkage coefficient can be estimated using AASHTO-LRFD [38] as shown below
30.48 10sh s hs f tdk k k k (9.b)
where
ks = factor for the effect of the volume-to-surface ratio, 1.45 0.0051 1.0sVk
S (V in mm3
and S in mm2)
khs = humidity factor for shrinkage, 2.00 0.014hsk H ; the relative humidity (H) was
assumed as 70%.
kf = factor for the effect of concrete strength, '
35
7f
ci
kf
(f’ci in MPa)
ktd = time-development factor, '61 0.58
td
ci
tk
f t
; t in days (t = 1-day at time of release)
The concrete compressive stress at the level of the prestress strand (fcz) varies from zero at the
end of the beam to a maximum value at the end of the transfer length and is estimated by:
21 c
cz se p
g g
ef f A
A I
(9.c)

89
where fse = effective prestress in strand after losses; Ap = total area of the strand; Ag = cross
section area of the concrete member; ec = eccentricity of the prestressing force; and Ig = moment
of inertia of concrete section.
Cracked Analysis
4.5.3.1 Behavior of Concrete in Tension
Concrete is weak in tension. The tensile stresses generated by Hoyer’s effect normally exceed
the concrete’s tensile strength [28, 29]. Within the transfer zone, the concrete adjacent to the
prestressing strand exhibits cracking at different stress levels. The relationship between the post-
peak stress and crack width is shown below [29]:
crkw
pe
(10)
where σ = post-peak tensile stress; σp = tensile strength (peak value of σ); λ = 1.01 (assumed
value in [29]); k = 64.18 mm-1 [48]; wcr = crack width in mm; wo = 0.05 mm, which is the initial
crack width at the shear plane.
Eq. (10) can be re-written as shown in Eq. (11) [30]. In this equation, n is a degree polynomial
equation. Mahmoud [30] proposed a second-order equation (n = 2), and the corresponding curve
is shown in Figure 4-4. In this study, a third-order equation (n = 3) is proposed to increase the
accuracy in predicting transfer length as discussed in later sections.
1
n
crp
o
w
w
(11)

90
Figure 4-4 – Analytical expressions used for modeling the stress-crack width relationship.
4.5.3.2 Considerations of Fracture Zones Surrounding the Prestressing Steel
The state of cracking around the strand caused by the internal pressure after strand release is
shown in Figure 4-5.
The state of cracking is divided into three zones, which includes the real cracked zone, the
fracture zone, and the uncracked zone. The first zone may occur as soon as the strand is
released, so the concrete region adjacent to the strand is cracked due to high internal pressure.
This region is defined as the distance from the strand surface to the radial crack at r = Rcr at
which the crack width is 0.05 mm, and the hoop stress is considered to be zero for crack widths
greater than 0.05 mm. The fracture zone is the distance from Rcr to Rfr at which the hoop stress,
which is transferred across the crack, varies from zero at r = Rcr and wo = 0.05 mm to the
maximum value of ft, concrete’s tensile strength, at the effective crack tip where r = Rfr and wo =

91
0. In this case, at a certain distance from the end, the concrete around the prestressing steel is
considered partially cracked because of the decrease in pressure. The uncracked zone extends
from the effective crack tip (r = Rfr) to the outer surface of the concrete (r = R2), and the hoop
stress decreases when the radius increases from r = Rfr to r = R2 according to the elastic theory of
the thick-walled cylinder. At further distances from the end of the strand, also, the surrounding
concrete is not cracked because the pressure in this part is negligible.
Figure 4-5 – Fracture zones around the prestressing steel.
In this analysis, Mahmoud’s theory [30] was applied for the crack width (wa), which is assumed
at the strand-concrete interface of the thick-walled cylinder and depends on the variations of
strand radius (p p
fp i ) [where p
fp = increase in strand radius due to reduction in longitudinal
stress from initial prestress fsi to effective prestress fse; and p
i = reduction in radius of strand

92
due to the uniform radial compression at interface σi] and the assumed number of radial cracks
(Nrc), which varies from 1 to 6 [30]. The crack width equation, therefore, is given by:
121
si se ia p p
rc p pr
f fRw
N E E
(12)
4.5.3.3 Compatibility Condition
The cracked analysis is solved using an elastic analysis as discussed previously [30]. Eq. (8) is
rewritten as:
fr
p p c c c c c
fp i cr fr R fcz shu (13)
where c
cr = deformation of the real crack zone; c
fr = deformation of the fracture zone; and fr
c
Ru =
radial displacement at r = Rfr.
The elastic modulus of concrete in the cracked regions was assumed to be elastic. The micro-
cracks generally occur around the strand, and the crack depth is less than a concrete cover of 75
mm, as shown in Table 4-2. There is no crack propagation through the prestressed concrete
beam (from bottom to the top) because the initial prestress is transferred to the concrete along the
strand. The mechanical properties of concrete were calculated using the given equations in
Section 4.1.
4.5.3.3.1 Deformation of the real crack zone, c
cr
The real crack zone is characterized by the condition where the tensile stress (σθ) is not
transmitted across this zone because the crack width is greater than wo (initial crack width at the

93
shear plane). The thick-walled cylinder equation for this zone can be written as Eq. (14) [28,
30].
0r rd
dr r
(14)
Solving the first order differential equation and applying the boundary condition of σr = -σi at r =
R1, an expression of radial stress (σr) is obtained as shown below:
1r i
R
r (15)
The deformation of the real crack zone ( c
cr ) can be calculated using the following equations:
1
crR
c
cr r
R
dr (15.a)
rr
cE
(15.b)
1
1
lnc i crcr
c
RR
E R
(15.c)
where c
cr = deformation of the real crack zone; R1 : inner radius; σi = interface pressure; Ec =
elastic modulus of concrete; and Rcr = crack radius.
4.5.3.3.2 Deformation of the fracture zone, c
fr
In this zone, two cases, Case A and Case B, were considered in the analysis. The second-order
equation was explained by Mahmoud [30], and that idea was used to develop the third-order
equation (n = 3). The maximum hoop stress ( ) at the edge of the fracture zone (Rfr) is
considered to be equal to the rupture strength of concrete (ft). Thus, the hoop stress can be
expressed by Eq. 16.

94
3
crt
fr cr
r Rf
R R
(16)
where = hoop stress; ft = concrete tensile strength; Rfr = fracture radius; r = radius in the radial
direction; and Rcr = crack radius.
CASE A: the hoop stress is obtained by solving the third-order equation (Eq. 16) which is
shown below:
3 2 2 33 3t cr cr crk r r R rR R (16.a)
3
tt
fr cr
fk
R R
(16.b)
Substituting Eq. 16.a-b into Eq. A.1 (see Appendix A) and using a boundary condition of radial
stress 1r i crR R at crr R , an expression of radial stress (σr) is given as:
432 2 31 3
4 2 4
crr i t cr cr cr
RR rk r R rR R
r r
(16.c)
Where σi = interface pressure; r = radius in the radial direction; R1 = inner radius; kt = radial
stress; and Rcr = crack radius.
The total deformation of the fracture zone in the radial direction, therefore, is the integration of
the radial strain εr (Eq. A.2) from r = Rcr to r = Rfr where the longitudinal stress z has been
neglected.
1 1lnfrc i
fr
c cr
RR k
E R
(16.d)

95
where:
3 3 2 2 24 4
1 43
31 4 1 3 1 2 ...
16 3 4
1 ln4
cr fr cr cr fr crfr cr
c c c
t
c frcrcr fr cr c
cr
R R R R R RR R
kk
E RRR R R
R
(16.e)
CASE B: if the crack width at the strand-concrete interface (wa) is less than or equal to 0.05 mm,
then the real crack zone would not be formed, and the hoop stress is calculated using Eq. (12).
The relationship between the crack width (wcr) at any point on the interface, the radius r, and the
crack width wa can be expressed by:
1
fr
cr a
fr
R rw w
R R
(17.a)
where Rfr = fracture radius; R1 = inner radius; and r = radius in the radial direction.
Using this value of wcr in Eq. (11) with n = 3, the hoop stress or tensile stress can be expressed
by:
2 3
2 3 23t fr fr frf k R r k R r k R r (17.b)
Where the constant factors are the following:
2
1
3 a t
o fr
w fk
w R R
(17.c)
2
3 2
1
3 a t
o fr
w fk
w R R
(17.d)
3
23 3
1
a t
o fr
w fk
w R R
(17.e)

96
Substituting Eq. (17.b) into Eq. (A.1) and using a boundary condition of radial stress r i at
1r R , an expression for radial stress (σr) is shown below:
2 32 3 2 21 4
2 3 23
3
2 3 2 4r i t fr fr fr fr fr fr
R kr r rf k R k R rR k R R r R r
r r
(17.f)
where:
2 2 3 2 2 3
4 1 2 1 1 3 1 1 1 23 1 1 1 1
1 1 3 1
2 3 2 4t fr fr fr fr fr frk f R k R R R k R R R R R k R R R R R R R
(17.g)
The deformation of the fracture zone in the radial direction is the integration of the radial strain εr
from r = R1 to r = Rfr. Thus, Eqs. (17.b-17.f) are used to calculate the deformation of the
fracture zone as shown as:
1 5
1
lnfrc i
fr
c
RR k
E R
(17.h)
where:
2 225 1 1 1
2 2 2 3 331 1 1
4 4213 2 2 3 323
1 1 1
11 1 1 2
4
1 11 1 2 1 3
2 9
31 1 2 1 3 1 4
4 3 16
tfr c fr fr c fr c
c c
fr fr c fr fr c fr c
c
frfr fr
fr fr c fr c fr c c
c
f kk R R R R R R R
E E
kR R R R R R R R
E
R RR RkR R R R R R R
E
4
1
lnfr
c
Rk
E R
(17.i)

97
4.5.3.3.3 Radial displacement of the uncracked zone, fr
c
Ru
The tensile stress σθ at the inner surface of the uncracked zone must be taken as the value of
rupture strength of concrete ft. So that, the radial stress at r = Rfr can be given by:
2 2
2
2 2
2fr
fr
R t
fr
R Rf
R R
(18.a)
The radial displacement, then, at r = Rfr can be calculated using Eqs. A.2-A.3.
fr
fr fr
t c Rc
R fr fr
c
fu R R
E
(18.b)
where fr = the circumferential strain at r = Rfr.
4.5.3.4 Contact Pressure, σi
Knowing the displacement components of the compatibility Eq. 13, the contact pressure at the
strand-concrete interface can be developed for the case of cracked analysis as following:
1fr
p c c c
i fp i R fcz sh
j
k uk
(19)
where:
1 16 1
1 1
1 11 ln ln ln
fr p frcrp
pr c cr pr c
R RRR Rk R
E E R R E E R
(19.a)
1 17 1 2
1 1 1
1 11 ln ln ln
fr p cr frcrp
pr c pr c
R R RRR Rk R
E E R R E E R
(19.b)
Case A: 1ik k and 6jk k
Case B: 5ik k and 7jk k

98
ANALYTICAL PREDICTION OF TRANSFER LENGTH
Measuring the transfer length of prestressing strands is time-consuming, and errors from the
method of taking the readings and from the instrument calibration can exist. Numerical
modeling using the thick-walled cylinder theory is an alternative technique to predict the transfer
length and calculate the contact pressures for different fracture zones at the strand-concrete
interface. Since the contact pressure i is known, the bond stress can be calculated for a
particular x increment using Coulomb’s friction law. Figure 4-6 shows the stresses on the
prestressing strand and the finite-element idealization used in this analysis. The incremental x
required to transfer an incremental stress pxif to the concrete can be calculated as following:
4
3
p pxi
b i
A fx
d
(20)
Using a finite-element analysis, this expression can be expressed by:
bi bif k x (21)
where Ap = strand area, bif = bond stress around the strand surface.
Figure 4-6 – Stresses on the prestressing strand: (a) Discretization of prestressing steel; (b)
Finite element idealization for prestressing steel (kb is the bond stiffness).

99
The bond surface stiffness is represented by4
3bi b b ik d
. The coefficient λb is a bond
factor that depends on strand diameter, number of radial cracks, and twisting angle of helical
wire with respect to the center wire [49], strand surface and mechanical interlocking [50], axial
and helical strain [49, 51], and concrete strength [17, 18]. This study found that the coefficient
λb varied from 0.50 to 1.55. As the variation of strand stress is equal to pxi bi pf f A , the
strand stress at section i+1, therefore, is calculated by the relation:
1 pxipx i px if f f
(22)
As a result, prestressing force and stress in the concrete at the level of the strand at section i+1
are shown in the following equations, respectively:
1 1px i px iP A f
(23)
2
1 1
1 c
cz i x i
g g
ef P
A I
(24)
Transfer length, therefore, can be obtained from the summation of the calculated increments of
x from the free end of the beam.
IMPLEMENTATION OF A COMPUTER PROGRAM
Equations presented in previous sections were implemented in a computer program due time
necessary to complete the calculations by hand. Using the computer program, the equations can
be solved in a matter of seconds. Figure 4-7 shows the major steps of the program that was
developed to calculate the transfer length using the thick-walled cylinder theory. Table 4-1
presents the program notation and input data used in the program. The program results are
shown in Figure 4-8.a.

100
Numerical modeling of the transfer length in pretensioned concrete members generally consists
of two important considerations: the constitutive laws and the finite-element method (FEM).
The constitutive laws control the elastoplastic response of the simulated thick-walled concrete
cylinder after the strand is released. The compatibility of displacements in the radial direction at
the interface of the prestressing steel and the concrete were assumed equal, and from this
relationship, the interfacial contact pressure between strand and concrete can be calculated. This
calculation is an iterative process, therefore, a numerical procedure to calculate the internal
contact pressure and the FEM in one dimension were implemented to calculate the bond, strand
stress, prestressing force, and concrete stress at each iteration.

101
Figure 4-7 – Flowchart of the analytical model.
TA = 0
TA = 0
Type of analysis (TA):
Uncracked = 0
Cracked and Fracture zone = 1
Type of contact pressure
Pressure 1 (σi): NTP = 0
Pressure 2 (σi = ft): NTP = 1
Assume number of
radial cracks (NRC)
NRC = 1 to 6
Method of Analysis
Mahmoud’s Method: ATP = 0
Proposed Method: ATP = 1
Physical and mechanical
properties
Δx = 1
NITER = 0; FSI(1) = 0.0; LT(1) =0.0
NITER = NITER +1
Elastic analysis
Complete crack and
fracture zone analysis
Only fracture zone
analysis
Print: Bond (i+1); FSI(i+1);
Pi(i+1); Fcz(i+1); LT(i+1)
Stop
End
100
100
FSI(i+1)-FSI(i) = 0.01
wa = w0
Read the name of
the input data
Start
Yes No
Yes Yes
No
No

102
Table 4-1 –Program notation and input data
Identifier Definition Identifier Definition
NDB Number of strands
DB Strand diameter
FSI Initial prestressing stress
EP Elastic modulus of strand
PR_P Poisson’s ratio of strand
UNIT Type of analysis (0 for U.S.
units and 1 for international
units)
FCI Concrete compressive strength at
release
EC Elastic modulus of concrete
FT Concrete tension strength
PR_C Poisson’s ratio of concrete
CX Concrete cover at x axes
CY Concrete cover at y axis
S Spacing between strands
B Width of the beam
H Deep of the beam
BLNG Length of the beam
FRICT Coefficient of friction
W0 Initial crack width
NI Number of iteration
HR Relative humidity
TM Time in days
TA Type of analysis
NRC Number of radial cracks
Δx Incremental of transfer zone
NITER Number of iterations
wa Crack width
Bond(i+1) Bond stress at section i+1
FSI(i+1) Effective stress at section i+1
Pi(i+1) Prestressing force at section i+1
Fcz(i+1) Concrete stress at level of the
strand at section i+1
LT(i+1) Transfer length at section i+1
Input Data:
Row 1: NDB, DB, FSI, EP, PR_P, UNIT
Row 2: FCI, PR_C
Row 3: CX, CY, S
Row 4: B, H, BLNG
Row 5: FRICT, W0, NI
Row 6: HR, TM
(Strand Properties)
(Concrete Properties)
(Position of a Strand, see Fig. 10)
(Beam Section)
(Factors for Fracture)
(Factors for Shrinkage)

103
(a)
(b)
Figure 4-8 – (a) Numerical analysis of transfer length using the program TWC_LTDXv1; (b)
Mechanical interlocking considered in the analysis.

104
Another consideration implemented in this program is that the perimeter of a strand is not equal
to bd , which is for a perfect circle (see Fig. 4-8.b). Therefore, the solid cylinder of radius R1
has been defined from the nominal strand diameter, whereas bond stresses have been computed
by considering the actual strand perimeter of 4/3bd (where db is the nominal strand diameter).
In addition, the clear concrete cover (cy) and the effective strand cover (ceff, as defined in [7])
were taken from bottom fiber or lateral fiber to the surface of strand as shown in Figure 4-9.
Also, the bond mechanism was multiplied by a factor (λb) which depends on the mechanical
interlocking and other factors as explained previously. The mechanical interlocking was
idealized as a constant normal pressure around the strand (Figure 4-8.b). Transfer length is
calculated through an iterative process. At each iteration, corresponding to a certain length, a
contact pressure is calculated in order to calculate the bond stress, the strand stress, and the
concrete stress at this length. Having these values, concrete and strand strains can be calculated.
Figure 4-9 – Idealization of the thick-walled cylinder.

105
MODEL VALIDATION
Numerical example
A data set of 24 beams obtained through experimental investigations conducted by several
researchers is summarized in Table 4-2 [2, 4, 5, 8, 14, 15, 17, 18, 30, 51-54]. This table also
includes the input data for the developed computer program. For the pure-elastic analysis,
variables needed for the input data were taken from Mahmoud [30] and Weerasekera [28] as
follows: strand diameter db = 12.7 mm, initial prestress fsi = 1300 MPa, elastic modulus of the
strand Ep = 200 GPa, Poisson’s ratio for strand vp = 0.30, concrete strength at release f’ci = 30
MPa, Poisson’s ratio for concrete vc = 0.15, concrete cover cy = 46.35 mm, and beam cross
section of 100 x 200 mm. The distributions of radial and hoop stress at the free end of the beam
are obtained using Eq. 18 and shown in Figure 4-10.a. This figure shows that the tensile stress
near the strand and along the circumferential direction is approximately 11 times greater than the
concrete’s tensile strength at release while the radial stress is approximately 2.2 times greater
than the concrete’s compressive strength at release. However, cracking in the concrete around
the strand occurs after release, which required a more refined analysis, was implemented in this
investigation as shown in Figure 4-10.b. This figure shows the three zones considered in this
investigation for the case of specimen SS160-6 (see Table 4-2). The result presented from this
figure is calculated at station 200 (a distance of 199 mm from the free end), which gives the
effective strand stress of 502.1 MPa. The station represents the number of iterations in the
program and for this example the increment is 1 mm. At this station, the cracked zone, fracture
zone, and uncracked zone are shown. The cracked zone is where the hoop stress is zero, the
fracture zone is where the hoop stress is increasing from zero to the concrete’s tensile strength at
release, and the uncracked zone is where the hoop stress begins to decrease from the allowable
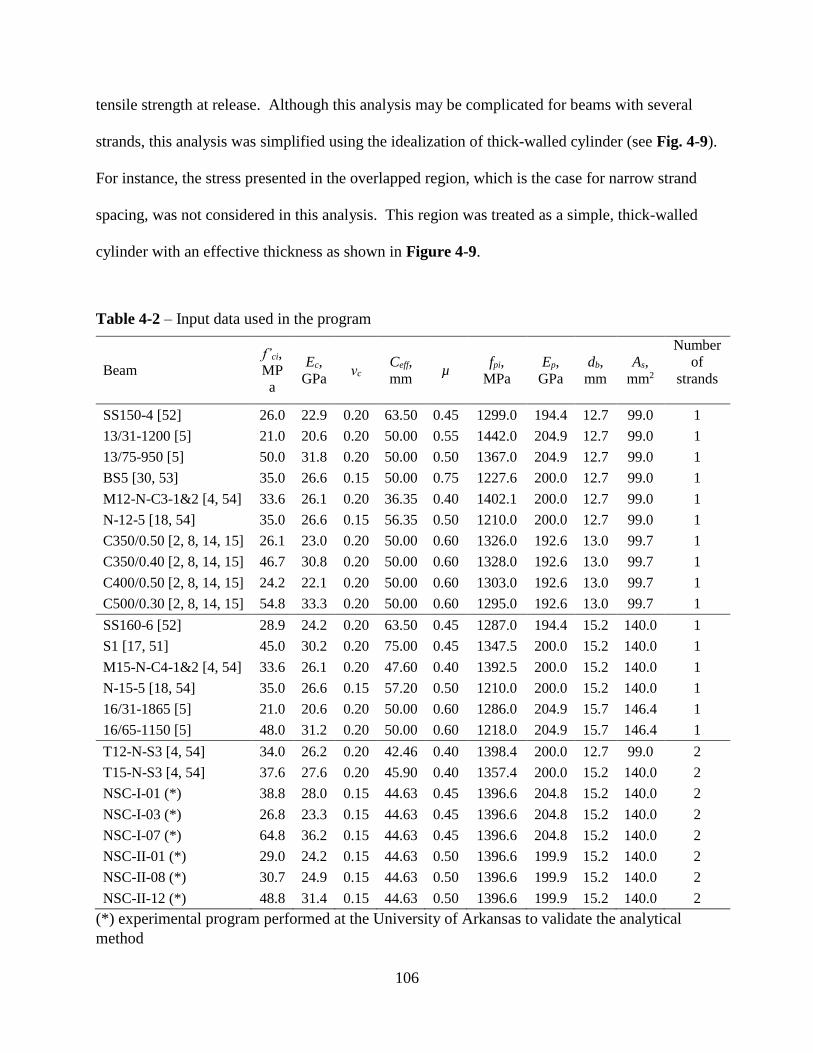
106
tensile strength at release. Although this analysis may be complicated for beams with several
strands, this analysis was simplified using the idealization of thick-walled cylinder (see Fig. 4-9).
For instance, the stress presented in the overlapped region, which is the case for narrow strand
spacing, was not considered in this analysis. This region was treated as a simple, thick-walled
cylinder with an effective thickness as shown in Figure 4-9.
Table 4-2 – Input data used in the program
Beam
f’ci,
MP
a
Ec,
GPa νc
Ceff,
mm µ
fpi,
MPa
Ep,
GPa
db,
mm
As,
mm2
Number
of
strands
SS150-4 [52] 26.0 22.9 0.20 63.50 0.45 1299.0 194.4 12.7 99.0 1
13/31-1200 [5] 21.0 20.6 0.20 50.00 0.55 1442.0 204.9 12.7 99.0 1
13/75-950 [5] 50.0 31.8 0.20 50.00 0.50 1367.0 204.9 12.7 99.0 1
BS5 [30, 53] 35.0 26.6 0.15 50.00 0.75 1227.6 200.0 12.7 99.0 1
M12-N-C3-1&2 [4, 54] 33.6 26.1 0.20 36.35 0.40 1402.1 200.0 12.7 99.0 1
N-12-5 [18, 54] 35.0 26.6 0.15 56.35 0.50 1210.0 200.0 12.7 99.0 1
C350/0.50 [2, 8, 14, 15] 26.1 23.0 0.20 50.00 0.60 1326.0 192.6 13.0 99.7 1
C350/0.40 [2, 8, 14, 15] 46.7 30.8 0.20 50.00 0.60 1328.0 192.6 13.0 99.7 1
C400/0.50 [2, 8, 14, 15] 24.2 22.1 0.20 50.00 0.60 1303.0 192.6 13.0 99.7 1
C500/0.30 [2, 8, 14, 15] 54.8 33.3 0.20 50.00 0.60 1295.0 192.6 13.0 99.7 1
SS160-6 [52] 28.9 24.2 0.20 63.50 0.45 1287.0 194.4 15.2 140.0 1
S1 [17, 51] 45.0 30.2 0.20 75.00 0.45 1347.5 200.0 15.2 140.0 1
M15-N-C4-1&2 [4, 54] 33.6 26.1 0.20 47.60 0.40 1392.5 200.0 15.2 140.0 1
N-15-5 [18, 54] 35.0 26.6 0.15 57.20 0.50 1210.0 200.0 15.2 140.0 1
16/31-1865 [5] 21.0 20.6 0.20 50.00 0.60 1286.0 204.9 15.7 146.4 1
16/65-1150 [5] 48.0 31.2 0.20 50.00 0.60 1218.0 204.9 15.7 146.4 1
T12-N-S3 [4, 54] 34.0 26.2 0.20 42.46 0.40 1398.4 200.0 12.7 99.0 2
T15-N-S3 [4, 54] 37.6 27.6 0.20 45.90 0.40 1357.4 200.0 15.2 140.0 2
NSC-I-01 (*) 38.8 28.0 0.15 44.63 0.45 1396.6 204.8 15.2 140.0 2
NSC-I-03 (*) 26.8 23.3 0.15 44.63 0.45 1396.6 204.8 15.2 140.0 2
NSC-I-07 (*) 64.8 36.2 0.15 44.63 0.45 1396.6 204.8 15.2 140.0 2
NSC-II-01 (*) 29.0 24.2 0.15 44.63 0.50 1396.6 199.9 15.2 140.0 2
NSC-II-08 (*) 30.7 24.9 0.15 44.63 0.50 1396.6 199.9 15.2 140.0 2
NSC-II-12 (*) 48.8 31.4 0.15 44.63 0.50 1396.6 199.9 15.2 140.0 2
(*) experimental program performed at the University of Arkansas to validate the analytical
method

107
(a)
(b)
Figure 4-10 – Transverse stress distribution: (a) Isotropic elastic analysis at station 1 (free end);
(b) Anisotropic and isotropic analysis at fracture zone at station 200 (a distance of 199 mm of the
free end) and at effective stress of 502.1 MPa (specimen SS160-6).

108
Transfer length comparison from measured and numerical analysis
Table 4-3 compares the experimental and numerical results. The numerical results presented in
this table are plotted in Figure 4-11.a-b.
Table 4-3 – Transfer length comparison between experimental and numerical results
Specimen
Beam Section
b x h x L,
mm
Transfer length Lt, mm
Measured
Mahmoud's
Method
(2nd order)
Proposed
Method
(3rd order)
SS150-4 [52] 102x127x3668 737 738 771
13/31-1200 [5] 150x225x1200 710 729 772
13/75-950 [5] 100x200x950 405 466 490
BS5 [30, 53] 100x250x1900 550 557 588
M12-N-C3-1&2 [4, 54] 112.7x200x3000 851 857 894
N-12-5 [18, 54] 112.7x112.7x1900 617 639 652
C350/0.50 [2, 8, 14, 15] 100x100x2000 550 626 651
C350/0.40 [2, 8, 14, 15] 100x100x2000 550 557 497
C400/0.50 [2, 8, 14, 15] 100x100x2000 650 657 682
C500/0.30 [2, 8, 14, 15] 100x100x2000 400 421 394
SS160-6 [52] 102x127x3668 762 778 808
S1 [17, 51] 150x150x3000 1092 1047 1062
M15-N-C4-1&2 [4, 54] 115.2x200x3000 839 870 903
N-15-5 [18, 54] 115.2x115.2x1900 727 749 715
16/31-1865 [5] 200x250x1865 872 848 896
16/65-1150 [5] 200x250x1150 427 486 435
T12-N-S3 [4, 54] 150.8x200x3000 808 806 840
T15-N-S3 [4, 54] 160.8x200x3000 997 998 1030
NSC-I-01 (*) 165x305x5500 709 655 686
NSC-I-03 (*) 165x305x5500 830 867 903
NSC-I-07 (*) 165x305x5500 565 554 581
NSC-II-01 (*) 165x305x5500 768 834 739
NSC-II-08 (*) 165x305x5500 816 799 834
NSC-II-12 (*) 165x305x5500 612 584 612
(*) experimental program performed at the University of Arkansas to validate the analytical
method
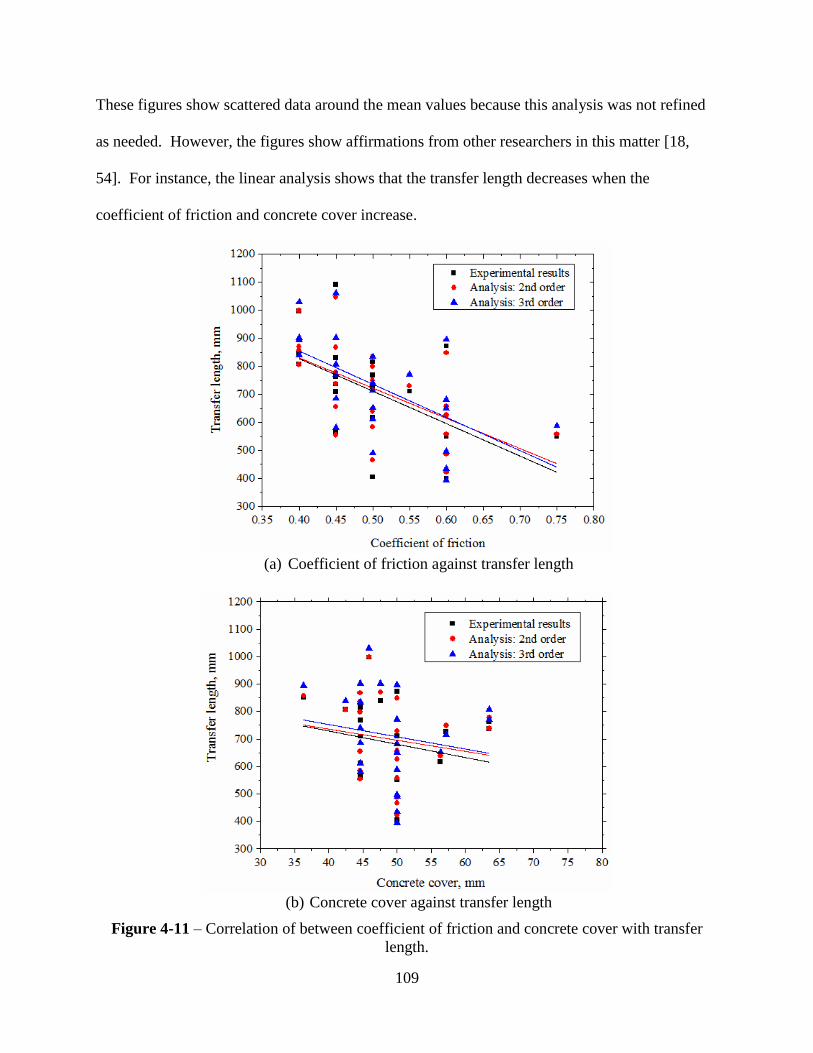
109
These figures show scattered data around the mean values because this analysis was not refined
as needed. However, the figures show affirmations from other researchers in this matter [18,
54]. For instance, the linear analysis shows that the transfer length decreases when the
coefficient of friction and concrete cover increase.
(a) Coefficient of friction against transfer length
(b) Concrete cover against transfer length
Figure 4-11 – Correlation of between coefficient of friction and concrete cover with transfer
length.

110
Additionally, Lim et al. [18] affirmed that the transfer length decreases not only with increasing
concrete strength but also with increasing concrete cover [54]. If transfer length decreases when
the coefficient of friction increases, this coefficient can be proportional to the concrete strength.
In other words, the coefficient of friction is high for high-strength concrete. Therefore, the bond
between strand and high-strength concrete is greater than that of low-strength concrete. The
trend lines of experimental and proposed method (3rd order) are parallel while the trend line of
Mahmoud´s method (2nd order) presents a different slope than others. This is a result of the
higher order equation for modeling transfer length using the thick-walled cylinder model.
Figure 4-12 provides a comparison of transfer length for mono strand series, which are strand
diameters of 12.7 mm and 13 mm (Figure 4-12.a) and strand diameters of 15.2 mm and 15.7
mm (Figure 4-12.b). Figure 4-12.a includes six results for strand diameter 12.7 mm and four
results from strand diameter 13 mm. The upper and lower calculated values using the proposed
method are 21% greater than the measured value for specimen 13/75-950 and 10% less than the
measured value for specimen C350/0.40, respectively. On the other hand, Figure 4-12.b shows
the four results for 15.2 mm strand and two results for the 15.7 mm. The upper and lower given
values by the proposed method are 8% greater than the measured value for specimen M15-N-C4-
1&2 and 3% less than the measured values for specimen S1, respectively. In addition, Figure 4-
13 provides a comparison of transfer length for eight specimens that contained two strands. The
strand diameter was either 12.7 mm or 15.2 mm. The upper and lower values are 9% greater
than the measured value for specimen NSC-I-03 and 4% less than the measured value for
specimen NSC-II-01, respectively.

111
(a) Strand diameter 12.7 mm and 13 mm
(b) Strand diameter 15.2 mm and 15.7 mm
Figure 4-12 – Transfer length comparison between measured and calculated for mono strand test
series.
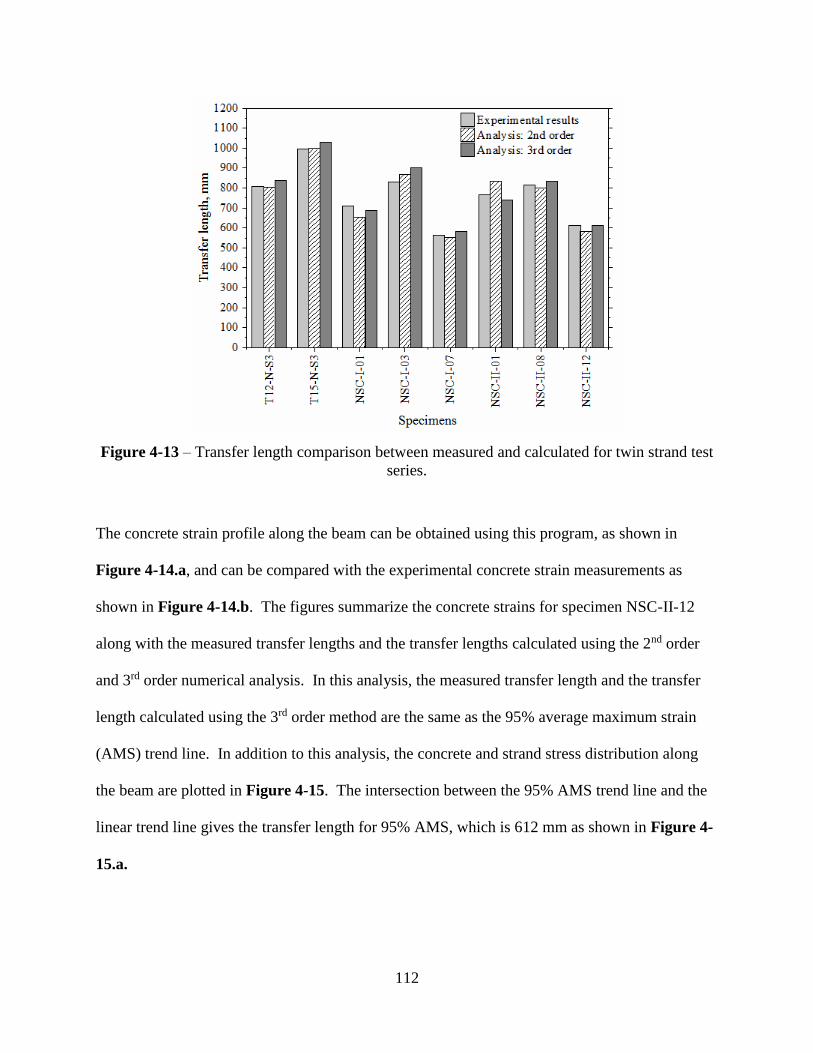
112
Figure 4-13 – Transfer length comparison between measured and calculated for twin strand test
series.
The concrete strain profile along the beam can be obtained using this program, as shown in
Figure 4-14.a, and can be compared with the experimental concrete strain measurements as
shown in Figure 4-14.b. The figures summarize the concrete strains for specimen NSC-II-12
along with the measured transfer lengths and the transfer lengths calculated using the 2nd order
and 3rd order numerical analysis. In this analysis, the measured transfer length and the transfer
length calculated using the 3rd order method are the same as the 95% average maximum strain
(AMS) trend line. In addition to this analysis, the concrete and strand stress distribution along
the beam are plotted in Figure 4-15. The intersection between the 95% AMS trend line and the
linear trend line gives the transfer length for 95% AMS, which is 612 mm as shown in Figure 4-
15.a.
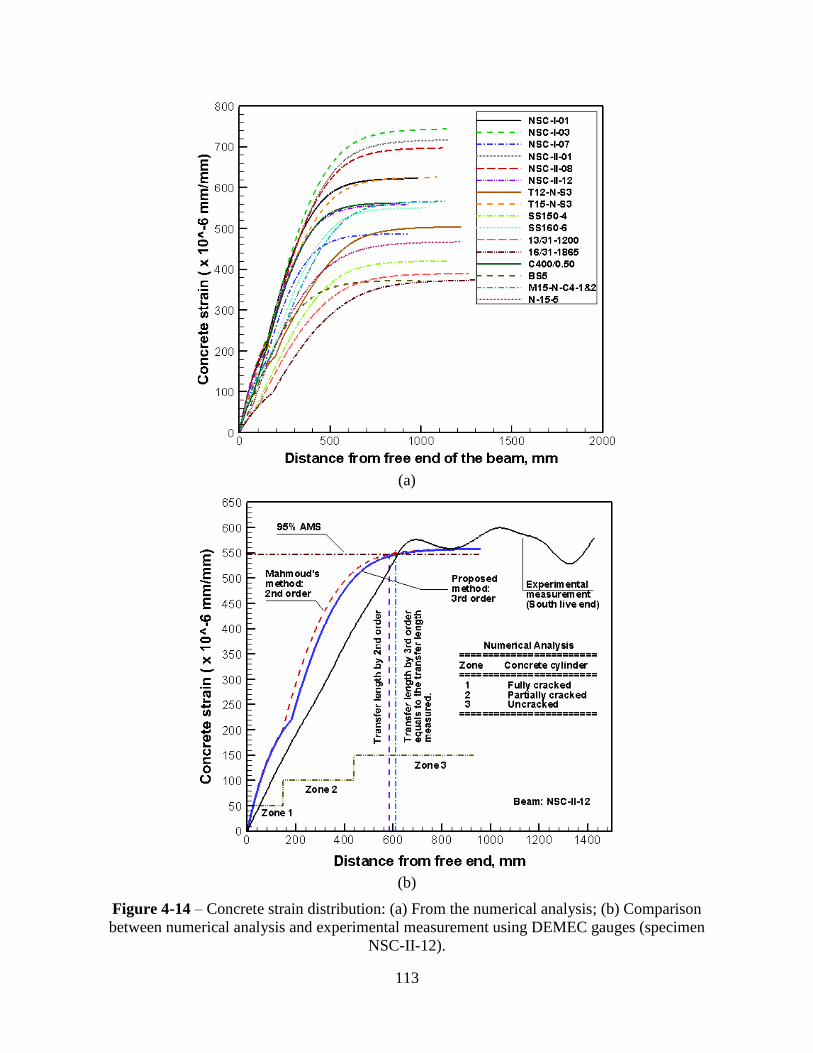
113
(a)
(b)
Figure 4-14 – Concrete strain distribution: (a) From the numerical analysis; (b) Comparison
between numerical analysis and experimental measurement using DEMEC gauges (specimen
NSC-II-12).

114
Figure 4-15.b shows three zones, and each zone presents a different type of analysis as
following: Zone 1 requires a nonlinear analysis, and a specimen in this zone is at the fully
cracked condition along the 180 mm. The cracking is due the hoop stress along this length being
greater than allowable tensile strength. Zone 2 is known as partially cracked zone and requires
linear and nonlinear analysis, and along this 305 mm, a specimen presents visible and
microscopic cracks. Zone 3 is known as the uncracked zone. This zone only requires a linear
analysis because the hoop stress is less than allowable tensile strength, and the transfer length is
found within this length (475 mm). All zones are shown in Figure 4-10.b and Figure 4-14.b.
In summary, it is expected that the use of the 3rd order equation provides a better prediction of
the measured transfer lengths when compared to the 2nd order equation. The predicted values
presented in Table 4-3 are greater than or equal to the measured values. These results could be
related to the drastic change from zone 1 to zone 2 as shown in Figure 4-14.b while the 2nd order
equation did not present this issue. The consideration of additional variables into the analysis,
typically including drying shrinkage coefficient and bond surface stiffness, possibly contributes
to the over-estimation of the predicted values. Further studies are needed to investigate this
issue.

115
(a)
(b)
Figure 4-15 – Stress distribution along the beam NSC-II-12 using the proposed method: (a)
Strand stress and transfer length calculation; (b) Concrete stress and zones of analysis.

116
SUMMARY AND CONCLUSIONS
This paper develops a computer program using the thick-walled cylinder theory to model strand
bond in pretensioned concrete beams. An expression between post-peak and crack width
proposed by Mahmoud in 1997 has been upgraded from a second-order to the third-order
equation because the hoop stress is related to the post-peak stress. Hoop stress is an important
key in this matter and affects the crack and fracture zone because of the contact pressure between
strand and concrete, which have been analyzed in this investigation. A data set of 24 transfer
lengths collected from the literature was used to validate the program. This data set consists of
various pretensioned concrete beams that were cast with one strand or two prestressing strands.
The beams with one strand were cast using 12.7 mm, 13 mm, 15.2 mm, and 15.7 mm diameter
strands while beams with two strands were cast using 12.7 mm and 15.2 mm diameter strands.
The developed computer program can be used to improve the accuracy in predicting the transfer
length by considering the number of cracks, concrete cover, fracture criteria, and elastic analysis.
Based on the investigation, the following conclusions can be drawn:
1. Using the thick-walled cylinder theory with the third-order equation (proposed in this
investigation), the predicted transfer length for all specimens with one strand, including
12.7 or 13 mm diameter strands, are between 90% and 121% of the measured values. The
predicted transfer lengths using the second-order equation ranged from 100% to 114%
when compared to the measured values. The predicted transfer lengths for specimens with
one, 15.2 mm strand ranged from 97% to 108% of the measured values while the predicted
transfer lengths due to second-order equation ranged from 96% to 114%. The predicted
transfer length for specimens with two strands (either 12.7 mm or 15.7 mm) ranged from
96% and 109 % while the predicted transfer lengths using the second-order equation are in

117
the range of 92% and 109%. The results show that the third-order equation provides a
reasonable transfer length estimate when compared to the second-order equation for beams
containing either one 15.2 mm strand or two strands of either diameter.
2. Transfer length is directly related to the bond between the strand and concrete. The strand
bond can be modeled using the Coulomb’s friction law and depends on several variables,
including the coefficient of friction, bond factor, strand diameter, strand surface, internal
pressure, and concrete strength.
3. The complexity of the proposed equations to completely and partially model the concrete
cracking most likely results in the difference in the predicted and the measured transfer
lengths, which varies between 94% and 121%. This increment of 21% of transfer length
could be associated with (1) the variation in concrete strains between zone 1 and zone 2,
which is attributed to the post-peak and crack-width relationship, and (2) the bond surface
stiffness, which is directly proportional to the transfer length.
4. Concrete strength, coefficient of friction, and concrete cover influence transfer length. The
results shown in Tables 1 and 2 indicate that transfer length decreases when these variables
increase.
5. The presence of the enhanced variables, including the bond surface stiffness and bond
factor coefficient, can provide a better prediction of transfer length. However, additional
research is need to calibrate these parameters with experimental data because these
parameters are directly proportional to the transfer length of prestressing strands.

118
ACKNOWLEDGEMENT
The authors acknowledge the financial support from the Mack-Blackwell Rural Transportation
Center (MBTC). The authors would like to thank Insteel Industries Inc. and Sumiden Wire
Products Corporation (SWPC) for providing the strands for this research.

119
NOTATION
As nominal strand area
Ab nominal area of strand
Ag cross section area of concrete member
Ap total area of strand
Ac cross sectional area of concrete
cy clear concrete cover
db strand diameter
ec eccentricity of the prestress force
E elastic modulus of element
Ec elastic modulus of concrete
Ep elastic modulus of strand
Epr elastic modulus of strand in the transversal direction
fsi initial prestress in strand
fse effective prestress in strand after losses
f’ci concrete’s compressive strength at release of strand
f’c concrete’s compressive strength
ft concrete’s tensile strength
fcz concrete compressive stress due to effective prestress
fpu ultimate tensile strength
fpy yield strength
fpi initial prestressing stress
Ig moment of inertia of concrete section

120
Poisson’s ratio of element
p Poisson’s ratio of strand
c Poisson’s ratio of concrete
p cE E modular ratio
n integer number (2 for second-order equation and 3 for third-order equation)
λb bond factor
λsp strand perimeter factor (1 is for solid strand and 4/3 for strand seven wire)
uscE factor of unit system conversion for elastic modulus
uscT factor of unit system conversion for tensile strength
Lt transfer length of prestressing steel in pretensioned concrete members
w unit weight of concrete
µ coefficient of friction between prestressing steel and concrete
σi interface pressure
r radial stress at concrete and strand interface
hoop stress
z longitudinal stress
εr radial strain
εθ hoop strain
εz longitudinal strain
εsh drying shrinkage coefficient
Kf constant factor
kt radial stress

121
kii constant factor (ii = 1,2,3,..,7)
bik bond surface stiffness
rp nominal radius of strand
rc,1 internal radius of concrete cylinder which equals to radius of strand after prestressing
rc,2 external radius of concrete cylinder
r radius in the radial direction
R1 inner radius
R2 outer radius
Rcr crack radius
Rfr fracture radius
τ bond stress
( , , )r z polar coordinates stresses
( , v, )u w polar coordinates displacements
p
fp increase in radius of strand due to reduction in longitudinal stress from initial prestress fsi
to effective prestress fse
p
i reduction in radius of strand due to the uniform radial compression at interface σi
c
i increase in inner radius of the thick-walled concrete cylinder due to the interface pressure
σi
c
fcz increase in inner radius of the thick-walled concrete cylinder due to the longitudinal
compressive stress at the level of strand fcz
c
sh reduction in inner radius of the thick-walled concrete cylinder due to drying shrinkage εsh
c
cr deformation of the real crack zone

122
c
fr deformation of the fracture zone
fr
c
Ru radial displacement at r = Rfr
x incremental of transfer zone
bif bond force around the strand surface
pxif strand stress incremental
wcr crack width at any point
wa crack width
wo initial crack width at the shear plane

123
APPENDIX A
This section presents procedures to solve the thick-walled cylinder equations, and the governing
equation of the thick-walled cylinders can be derived from Figure 4-1.b. The stresses r and
are only functions of r and the shear stress on the element must be zero. By solving the radial
force equilibrium shown in Figure 4-1.b and ignoring second-order terms, a governing equation
is given by [42, 43]:
0rrd
dr r
(A.1)
where r = normal stress in radial direction; = hoop stress in the circumferential direction; r =
radius in the radial direction.
Stresses and displacements represented in the polar coordinates as ( , , )r z and ( , v, )u w are shown
in Figure 4-1.b-c, respectively. The ends of the cylinder are assumed to be open and
unconstrained ( 0z ). The cylinder is in a condition of plane stress, and Hooke’s law used in
elastic and plastic analysis offers the strains given as following:
1
1
1
r r z
r z
z z r
E
E
E
(A.2)
where εr = radial strain; εθ = hoop strain; εz = longitudinal strain; r = radial stress at concrete
and strand interface; = hoop stress; z = longitudinal stress; and = Poisson’s ratio.
Strain-displacement compatibility equation derived from Figure 4-1.c is defined as:

124
r z
u u w
r r z
(A.3)
Using the compatibility equations and Hook’s law are sufficient to obtain a unique solution to
any axisymmetric problem with specific boundary conditions [42, 43]. Thus, Eq. (A.1) can be
rewritten as following:
2
2 2
10
u du u
r r dr r
(A.4)
A general solution to this differential equation is given by:
21
Cu C r
r (A.5)
21 2r
CuC
r r
(A.6)
21 2
CuC
r r (A.7)
Subtracting Eq. (A.6) and Eq. (A.7), is obtained in a function of C2 and r :
2
2
2
1r
EC
r
(A.8)
This equation is substituted into Eq. (A.7), and r is represented by:
1 221 1 1
zr
E EC C
r
(A.9)
where C1 and C2 are constants of integration and their values can be obtained using Eq. (A.9);
r = radial stress; E = elastic modulus of element; = Poisson’s ratio; and r = radius in the
radial direction.
To find C1 and C2, two boundary conditions were used: (1) at the inner radius: 1r R and
r i ; and (2) at the outer radius: 2r R and 0r .

125
1 22
11 1 1
zi
E EC C
R
(A.10)
1 22
2
01 1 1
zE EC C
R
(A.11)
Subtracting Eq. (A.10) and Eq. (A.11), C2 is given below:
2 2
1 2
2 2 2
2 1
1i
R RC
E R R
(A.12)
Then C1 shown below is obtained by replacing Eq. (A.12) into Eq. (A.11):
2
1
1 2 2
2 1
1i z
RC
EE R R
(A.13)
Replacing C1 and C2 in Eq. (A.9), Eq. (A.8), and Eq. (A.5), the radial stress (σr), hoop stress
(σθ), and radial displacement (u) written in Eq. (A.14-16) were derived, respectively, and the
longitudinal stress ( z ) was replaced by the concrete compressive stress due to the effective
prestress ( czf ).
2 2
1 2
2 2 2
2 1
1r i
R R
R R r
(A.14)
2 2
1 2
2 2 2
2 1
1i
R R
R R r
(A.15)
2 2
1 2
22 2
2 1
1 1 c czi c c
cc
f rR r Ru
r EE R R
(A.16)
where R1 = inner radius; R2 = outer radius; σi : interface pressure; Ec = elastic modulus of
concrete; c = Poisson’s ratio of concrete; and r = radius in the radial direction.

126
APPENDIX B
This section presents procedures to solve the uncracked equation as shown in Eq. (8) which was
widely explained by Mahmoud [30], and an equation to solve this relationship as shown in Eq.
(9) is explained below by the following procedures:
Each of the following parameters described in Eq. (8) can be expressed in Eq. (B.1-5).
1
p si sep
fp
p
f fR
E
(B.1)
1
1i pp
i
pr
RE
(B.2)
2 2
1 21
2 2
2 1
1 1c cc ii
c
R RR
E R R
(B.3)
1
c c czfcz
c
fR
E
(B.4)
1
c
sh shR (B.5)
Substituting Eqs. (B.1-5) into Eq. (8), the interfacial pressure (σi) is shown below:
1
si se czp c sh
p c
i
p c
pr c
f f f
E E
K
E E
(B.6)
127
REFERENCES
[1] Dang CN, Murray CD, Floyd RW, Hale WM, Martí-Vargas JR. Analysis of bond stress
distribution for prestressing strand by Standard Test for Strand Bond. Engineering Structures.
2014;72:152-9.
[2] Martí-Vargas JR, Serna P, Navarro-Gregori J, Pallarés L. Bond of 13 mm prestressing steel
strands in pretensioned concrete members. Engineering Structures. 2012;41:403-12.
[3] Dang CN, Floyd RW, Murray CD, Hale WM, Martí-Vargas JR. Bond Stress-Slip Model for
0.6 in. (15.2 mm) Diameter Strand. ACI Structural Journal. 2015;112:625-34.
[4] Oh BH, Kim ES. Realistic Evaluation of Transfer Lengths in Pretensioned, Prestressed
Concrete Members. ACI Structural Journal. 2000;97:821-30.
[5] Mitchell D, Cook WD, Khan AA, Tham T. Influence of high strength concrete on transfer and
development length of pretensioning strand. PCI Journal. 1993;38:52-66.
[6] Oh BH, Kim ES, Choi YC. Theoretical Analysis of Transfer Lengths in Pretensioned
Prestressed Concrete Members. Journal of Engineering Mechanics. 2006;132:1057-66.
[7] Den Uijl JA. Bond Modelling of Prestressing Strand. ACI Special Publication. 1998;180:145-
69.
[8] Martí-Vargas JR, Serna P, Navarro-Gregori J, Bonet JL. Effects of concrete composition on
transmission length of prestressing strands. Construction and Building Materials. 2012;27:350-6.
[9] Dang CN, Murray CD, Floyd RW, Hale WM, Martí-Vargas JR. A Correlation of Strand
Surface Quality to Transfer Length. ACI Structural Journal. 2014;111:1245-52.
[10] Dang CN, Floyd RW, Hale WM, Martí-Vargas JR. Measured Transfer Lengths of 0.7 in.
(17.8 mm) Strands for Pretensioned Beams. ACI Structural Journal. 2016;113:85-94.
[11] Ramirez-Garcia AT, Floyd RW, Micah Hale W, Martí-Vargas JR. Effect of concrete
compressive strength on transfer length. Structures. 2016;5:131-40.
[12] Abdelatif AO, Owen JS, Hussein MFM. Modelling the prestress transfer in pre-tensioned
concrete elements. Finite Elements in Analysis and Design. 2015;94:47-63.
[13] Zia P, Mostafa T. Development length of prestressing strands. PCI Journal. 1977;22:54-65.
[14] Martí-Vargas JR, Serna P, Hale WM. Strand bond performance in prestressed concrete
accounting for bond slip. Engineering Structures. 2013;51:236-44.

128
[15] Martí-Vargas JR, Arbelaez CA, Serna-Ros P, Navarro-Gregori J, Pallares-Rubio L. Analytical
model for transfer length prediction of 13 mm prestressing strand. Structural Engineering and
Mechanics. 2007;26:211-29.
[16] Kim YH, Trejo D, Hueste MBD. Bond performance in self-consolidating concrete
pretensioned bridge girders. ACI Structural Journal. 2012;109:755-66.
[17] Park H, Cho J-Y. Bond-Slip-Strain Relationship in Transfer Zone of Pretensioned Concrete
Elements. ACI Structural Journal. 2014;111:503-14.
[18] Lim SN, Choi YC, Oh BH, Kim JS, Shin S, Lee MK. Bond characteristics and transfer length
of prestressing strand in pretensioned concrete structures. In: Van Mier JGM, Ruiz G, Andrade C,
Yu RC, Zhang XX, editors. VIII International Conference on Fracture Mechanics of Concrete and
Concrete Structures. Toledo (Spain): FraMCoS; 2013. p. 1-8.
[19] Benítez JM, Gálvez JC. Bond modelling of prestressed concrete during the prestressing force
release. Mater Struct. 2011;44:263-78.
[20] Benítez JM, Gálvez JC, Casati MJ. Study of bond stress–slip relationship and radial dilation
in prestressed concrete. International Journal for Numerical and Analytical Methods in
Geomechanics. 2013;37:2706-26.
[21] Janney JR. Nature of Bond in Pre-Tensioned Prestressed Concrete. ACI Journal Proceedings.
1954;50:717-36.
[22] ASTM-A416/A416M-15. Standard Specification for Low-Relaxation, Seven-Wire Steel
Strand for Prestressed Concrete. West Conshohocken, PA: ASTM International; 2015.
[23] Kang YJ. Nonlinear geometric, material and time dependent analysis of reinforced and
prestressed concrete frames. Berkeley, CA: University of California; 1977. p. 252.
[24] Greunen JV. Nonlinear Geometric, Material and Time Dependent Analysis of Reinforced and
Prestressed Concrete Slabs and Panels. Berkeley, CA: University of California; 1979. p. 286.
[25] Bazant ZP, Nilson AH. State-of-the-art report on finite element analysis of reinforced
concrete. New York, NY: American Society of Civil Engineers; 1982.
[26] Naaman AE. Prestressed Concrete Analysis and Design: Fundamentals. 2nd ed. Ann Arbor,
Michigan: Techno Press 3000; 2004.
[27] Benaim R. The Design of Prestressed Concrete Bridges: Concepts and principles. New York,
NY: Taylor & Francis; 2008.

129
[28] Weerasekera IRA. Transfer and flexural bond in pretensioned prestressed concrete [Ph.D.].
Ann Arbor: University of Calgary (Canada); 1991.
[29] Gopalaratnam VS, Shah SP. Softening Response of Plain Concrete in Direct Tension. Journal
Proceedings. 1985;82:310-23.
[30] Mahmoud ZI. Bond characteristics of fibre reinforced polymers prestressing reinforcement
[Ph.D.]: Alexandria University (Egypt); 1997.
[31] Lin TY, Burns NH. Design of prestressed concrete structures. 3rd ed. New York: John Wiley
& Sons, Inc.; 1981.
[32] Hoyer E, Friedrich E. Beitrag zur Frage der Haftspannung in Eisenbetonbauteilen. Beton und
Eisen (Berlín). 1939;50:717-36.
[33] Carroll JC, Cousins TE, Roberts-Wallmann CL. A practical approach for finite-element
modeling of transfer length in pretensioned, prestressed concrete members using end-slip
methodology. PCI Journal. 2014;59:110-29.
[34] ACI-446.1R-91. Fracture Mechanics of Concrete: Concepts, Models and Determination of
Material Properties (Reapproved 1999). Reported by ACI Committee 446, Fracture Mechanics;
1991. p. 146.
[35] ACI-318-11. Building code requirements for structural concrete and commentary. Farmington
Hills, MI: American Concrete Institute; 2011.
[36] ACI-318-14. Building code requirements for structural concrete and commentary. Farmington
Hills, MI: American Concrete Institute; 2014.
[37] Mehta PK, Monteiro PJM. Concrete microstructure, properties, and materials. 3rd ed. New
York: Tata McGraw-Hill Companies, Inc.; 2006.
[38] AASHTO. AASHTO LRFD Bridge Design Specifications, U.S. Customary Units. 7th ed.
Washington, D.C.: American Association of State Highway and Transportation Officials
(AASHTO); 2014.
[39] Hale WM, Russell BW. Effect of Allowable Compressive Stress at Release on Prestress
Losses and on the Performance of Precast, Prestressed Concrete Bridge Girders. PCI Journal.
2006;51:14-25.
[40] Dolan CW, Krohn JJ. A Case for Increasing the Allowable Compressive Release Stress for
Prestressed Concrete. PCI Journal. 2007;52:102-5.

130
[41] Park R, Paulay T. Reinforced Concrete Structures. New York, NY: John Wiley & Sons; 1975.
[42] Ugural AC, Fenster SK. Advanced Mechanics of Materials and Applied Elasticity. 5th ed.
New York, NY: Pearson Education, Inc.; 2012.
[43] Fenner RT. Mechanics of Solids. John Street, London: Black Well Scientific Publications;
1989.
[44] Briere V, Harries KA, Kasan J, Hager C. Dilation behavior of seven-wire prestressing strand
– The Hoyer effect. Construction and Building Materials. 2013;40:650-8.
[45] Burgueño R, Sun Y. Stress transfer characteristics of sheathed strand in prestressed concrete
beams: computational study. PCI Journal. 2014;59:95-109.
[46] Gross SP, Burns NH. Transfer and development length of 15.2 mm (0.6 in.) diameter
prestressing strand in high performance concrete: Results of the Hoblitzell-Buckner beam tests.
National Technical Information Service, Springfield, VA 22161: Center for Transportation
Research, The University of Texas at Austin; 1995. p. 106.
[47] Chao S-H, Naaman AE, Parra-Montesinos GJ. Bond Behavior of Reinforcing Bars in Tensile
Strain-Hardening Fiber-Reinforced Cement Composites. ACI Structural Journal. 2009;106: 897-
906.
[48] Wu KR, Yao W, Li ZJ. Damage and strain softening of soncrete under uniaxial tension.
FRAMCOS-3 - Fracture Mechanics of Concrete Structures. Japan: AEDIFICATIO Publishers;
1998. p. 357-65.
[49] Moon DY, Zi G, Kim J-H, Lee S-J, Kim G. On strain change of prestressing strand during
detensioning procedures. Engineering Structures. 2010;32:2570-8.
[50] Arab AA, Badie SS, Manzari MT. A methodological approach for finite element modeling of
pretensioned concrete members at the release of pretensioning. Engineering Structures.
2011;33:1918-29.
[51] Park H, Din ZU, Cho J-Y. Methodological Aspects in measurement of strand transfer length
in pretensioned concrete. ACI Structural Journal. 2012;109:625-34.
[52] Russell BW, Burns NH. Measured of transfer lengths of pretensioned concrete elements.
Journal of Structural Engineering. 1997;123:541-9.
[53] Mahmoud ZI, Rizkalla SH, Zaghoul E-ER. Transfer and Development Lengths of Carbon
Fiber Reinforced Polymers Prestressing Reinforcement. Structural Journal. 1999;96:594-602.

131
[54] Oh BH, Lim SN, Lee MK, Yoo SW. Analysis and Prediction of Transfer Length in
Pretensioned, Prestressed Concrete Members. ACI Structural Journal. 2014;111:549-60.

132
: CONCLUSIONS, CONTRIBUTIONS, AND FUTURE WORKS
CONCLUSIONS
The principal goal of this dissertation is to examine the effect of concrete compressive
strength on transfer and development length. The second objective of the research program is to
develop an equation for predicting transfer and development length that includes concrete
compressive strength. The conclusions from the research program are listed below.
1. The results showed that transfer lengths were larger in magnitude when the compressive
strength at release was less than 34.5 MPa (5000 psi). However, when the compressive
strength at release was greater than 34.5 MPa (5000 psi), there was little difference in
transfer length. Similar trends were apparent in the development length results.
2. Research results also show that the ACI 318-14 and AASHTO equations overestimate
transfer lengths in members containing concrete with high compressive strengths.
Therefore, concrete compressive strength should be a factor in predicting transfer length.
3. Based on the results of the study, the proposed transfer length equation and the ACI 318-
14 equation are recommended when the concrete compressive strength at release is less
than 34.5 MPa. Based on the UA experimental data, 40db should be used as minimum
transfer length for members containing concrete with compressive strengths at release
greater than 34.5 MPa but less than 55 MPa. When the concrete compressive strength at
release is greater than 55 MPa, transfer length can be taken as 33db. There is little change
in transfer length as concrete compressive strength at release increases beyond 55 MPa.
4. The data set of measured embedment lengths collected from the literature were compared
with values predicted by the ACI 318-14 and the University of Arkansas’s proposed

133
equation (UAPE). The standard normal distribution generated by the UAPE linked the
area between the data set from the experimental data with the predicted values of ACI
318-14. The “linked area” represents a probability of 41 percent that a development
length falls in that region. The lower intersection point, which is 111db, between the
normal distribution of the data set and the predicted values of the UAPE, is the proposed
minimum value for development length.
5. Using the thick-walled cylinder theory with the third-order equation (proposed in this
investigation), the predicted transfer length for all specimens with one strand, including
12.7 or 13 mm diameter strands, are between 90% and 121% of the measured values.
The predicted transfer lengths using the second-order equation ranged from 100% to
114% when compared to the measured values. The predicted transfer lengths for
specimens with one, 15.2 mm strand ranged from 97% to 108% of the measured values
while the predicted transfer lengths due to second-order equation ranged from 96% to
114%. The predicted transfer length for specimens with two strands (either 12.7 mm or
15.7 mm) ranged from 96% and 109 % while the predicted transfer lengths using the
second-order equation are in the range of 92% and 109%. The results show that the
third-order equation provides a reasonable transfer length estimate when compared to the
second-order equation for beams containing either one 15.2 mm strand or two strands of
either diameter.
6. Strand bond can be modeled using the Coulomb’s friction law and depends on several
variables, including the coefficient of friction, bond factor, strand diameter, strand
surface, internal pressure, and concrete strength.

134
7. The presence of the enhanced variables, including the bond surface stiffness and bond
factor coefficient, can provide a better prediction of transfer length. However, additional
research is need to calibrate these parameters with experimental data.
8. Much of the published literature is based on the finite element analysis of either 2-D or 3-
D. That research analyzed the bond between the strand and concrete as a perfect bond
which is not true because of cracks around the strand. These cracks affect the bond, and
the perfect bond assumption between the strand and concrete cannot be used. The
program developed in this investigation with a crack criteria to address this matter
provides comparable results to the experimental results.
CONTRIBUTION TO THE BODY OF KNOWLEDGE
Several investigations have investigated the transfer and development lengths of
prestressed concrete beams since the 1950s. However, the uniqueness of this research program
lies in the types and strengths of concrete that were examined. Thus, the following contributions
are pointed out:
1. A new equation for transfer length prediction was derived as shown below from the
power regression analysis. This proposed equation depends on the variables such as: the
initial prestress, the concrete strength at release, and the nominal strand diameter.
0.55
'25.7 si
t b
ci
fL d
f

135
2. A new equation for development length prediction was developed which is a sum of the
transfer length and the flexural bond length as shown below.
0.55 0.55
' '25.7 66.5
ps sesid b b
ci c
f ffL d d
f f
3. Based on the UA experimental data, 40db should be used as minimum transfer length for
members containing compressive strengths at release greater than 34.5 MPa and less than
55 MPa. Transfer length can be predicted as 33db when the compressive strength at
release is greater than 55 MPa. Moreover, based on the wide data analysis of data from
the literature, the development length between 111db and 143db represents the 41% of the
probability of the superimposed analysis of the normal distribution, and a minimum
development length is proposed to be as 111db.
4. A new method using the thick-walled cylinder theory has been proposed to model the
bond between prestressing strand and concrete surface and estimate the transfer length.
A bond surface stiffness (kbi) and a bond factor (λb) coefficients were introduced.
Although the proposed equation is complex due to concrete cracking around the strand
surface, the transfer length estimation is reasonable for beams containing one strand or
two strands.
4
3bi b b ik d

136
FUTURE WORKS
Further numerical investigation is necessary to determine how cracks affect the bond
between strand and concrete. Bond modeling between concrete and strand surface can be further
improved so that a general equation which considers all of the parameters discussed in this
investigation. Another area of future work is further examination of the variable bond factor
which was introduced in the numerical analysis. The bond factor depends on the concrete
strength, the coefficient of friction, the concrete cover, the number of cracks, and other variables
like twisting angle of helical wire respect to the center wire.

137
APPENDIX

138
APPENDIX A: PROGRAM 1
A.1 Code
C CALCULATING NUMBER OF PARAMETERS
C BRITTEN BY: ALBERTO RAMIREZ
C UNIVERSITY OF ARKANSAS
C AUGUST 13, 2014
C MODIFIED ON FEBRUARY 20, 2015
C RATIO = Le/Ld
C
C ==================================================================
PARAMETER (NND = 10000)
IMPLICIT REAL*8 (A-H,O-Z)
DIMENSION XD(NND) !,YD(NND)
CHARACTER *80, FINP,FOUT
C ==================================================================
C
C
PRINT*, 'READ THE NAME OF THE INPUT FILE'
READ(*,100) FINP
100 FORMAT(A)
PRINT*, 'READ THE NAME OF THE OUTPUT FILE'
READ(*,100) FOUT
C DATA INP/5/, OUT/4/
C
OPEN (5, FILE = FINP)
OPEN (2, FILE = FOUT, STATUS = 'NEW')
C
C ==================================================================
C
C
READ(5,*)ND,AVG,STD ! TOTAL NUMBER OF DATA, AVERAGE, STDV
C
AVG_UP = AVG+STD ! AVG + STD = UPPER
AVG_DOWN = AVG-STD ! AVG - STD = LOWER
C
WRITE(2,110) ND,AVG,STD,AVG_UP,AVG_DOWN
110 FORMAT(//,4X,'TOTAL NUMBER OF DATA ANALYZED =',I6,/,
&4X,'AVERAGE =',F10.2,/,4X,'STANDARD DEVIATION =',F10.2,/,
&4X,'UPPER VALUE =',F10.2,/,4X,'LOWER VALUE =',F10.2)
WRITE(2,115)
115 FORMAT(//,7X,'NUM.',8X,'RATIO')
DO I = 1,ND
READ(5,*)XD(I)
WRITE(2,120)I,XD(I)
END DO
120 FORMAT(4X,I6,4X,F10.2)
C
ICOUNT1 = 0; ICOUNT2 = 0; ICOUNT3 = 0
ICOUNT4 = 0; ICOUNT5 = 0; ICOUNT6 = 0; ICOUNT7 = 0
DO I = 1,ND

139
IF(XD(I).GE.AVG_DOWN.AND.XD(I).LE.AVG_UP) ICOUNT1 = ICOUNT1 + 1
IF(XD(I).LT.1.0) ICOUNT2 = ICOUNT2 + 1
IF(XD(I).GT.AVG) ICOUNT3 = ICOUNT3 + 1
IF(XD(I).LT.AVG_DOWN) ICOUNT4 = ICOUNT4 + 1
IF(XD(I).GT.AVG_UP) ICOUNT5 = ICOUNT5 + 1
END DO
C
NA1 = ICOUNT1 ! VALUE BETWEEN OUTLINERS
NB1 = ICOUNT2 ! VALUE LESS THAN 1
NC1 = ICOUNT3 ! VALUE GREATER THAN AVG.
ND1 = ICOUNT4 ! LESS THAN LOWER OUTLINE
NE1 = ICOUNT5 ! GREATER THAN UPPER OUTLINE
NF1 = ND-NB1 ! VALUES GREATER THAN 1
C
NA2 = ABS(NC1-NF1) ! BETWEEN AVEG AND 1
NA3 = ABS(ND-ND1-NF1) ! BETWEEN LOWER AND 1
NA4 = ABS(NA3-NA1) ! BETWEEN UPPER AND 1
NA5 = ABS(ND-NC1) ! LESS THAN AVG.
NA6 = ABS(NA2-NA4) ! BETWEEN AVG AND UPPER
NA7 = ABS(NA1-NA6) ! BETWEEN AVG AND LOWER
C PORCENTAGES
PNA1 = 100.D0*NA1/ND; PNB1 = 100.D0*NB1/ND; PNC1 = 100.D0*NC1/ND;
PND1 = 100.D0*ND1/ND; PNE1 = 100.D0*NE1/ND; PNF1 = 100.D0*NF1/ND;
PNA2 = 100.D0*NA2/ND; PNA3 = 100.D0*NA3/ND; PNA4 = 100.D0*NA4/ND;
PNA5 = 100.D0*NA5/ND; PNA6 = 100.D0*NA6/ND; PNA7 = 100.D0*NA7/ND;
WRITE(2,130)NA1,PNA1,NB1,PNB1,NF1,PNF1,NC1,PNC1,NA5,PNA5,ND1,PND1,
&NE1,PNE1,NA2,PNA2,NA3,PNA3,NA4,PNA4,NA6,PNA6,NA7,PNA7
130 FORMAT(//,4X,'TOTAL NUMBERS CALCULATED FOR EACH CASE',//,
&4X,'=======================================================',/,
&9X,'CASE OF ANALYSIS',6X,'No POINTS',4X,'PERCENTAGE (%)',/,
&4X,'=======================================================',/,
&4X,'BETWEEN THE OUTLINERS ... =',I6,6X,F10.2,/,
&4X,'LESS THAN 1.0 ........... =',I6,6X,F10.2,/,
&4X,'GREATER THAN 1.0 ........ =',I6,6X,F10.2,/,
&4X,'GREATER THAN AVG. ....... =',I6,6X,F10.2,/,
&4X,'LESS THAN AVG. .......... =',I6,6X,F10.2,/,
&4X,'LESS THAN: LOWER ........ =',I6,6X,F10.2,/,
&4X,'GREATER THAN: UPPER ..... =',I6,6X,F10.2,/,
&4X,'BETWEEN AVG. AND 1.0 .... =',I6,6X,F10.2,/,
&4X,'BETWEEN LOWER AND 1.0 ... =',I6,6X,F10.2,/,
&4X,'BETWEEN UPPER AND 1.0 ... =',I6,6X,F10.2,/,
&4X,'BETWEEN AVG. AND UPPER .. =',I6,6X,F10.2,/,
&4X,'BETWEEN AVG. AND LOWER .. =',I6,6X,F10.2,/,
&4X,'=======================================================')
C
C
STOP
END

140
A.2 Input Data File
Name of the input file: ACI-M152.txt
The first row to be read by the program is: the total data to be analyzed (188), the average of data
(0.72), and the standard deviation (0.27).
After the second row the program reads the total data to be analyzed.
188, 0.72, 0.27
0.47
0.61
0.50
0.57
0.45
0.48
0.46
0.51
0.46
.
.
.
1.47
1.22
0.97
A.3 Output Data File
TOTAL NUMBER OF DATA ANALYZED = 188
AVERAGE = 0.72
STANDARD DEVIATION = 0.27
UPPER VALUE = 0.99
LOWER VALUE = 0.45
NUM. RATIO
1 0.47
2 0.61
3 0.50
4 0.57
5 0.45
6 0.48

141
7 0.46
8 0.51
9 0.46
10 0.46
11 0.54
12 0.43
13 0.61
. .
. .
. .
180 0.87
181 0.69
182 1.05
183 1.08
184 0.90
185 0.71
186 1.47
187 1.22
188 0.97
TOTAL NUMBERS CALCULATED FOR EACH CASE
=======================================================
CASE OF ANALYSIS No POINTS PERCENTAGE (%)
=======================================================
BETWEEN THE OUTLINERS …. = 123 65.43
LESS THAN 1.0 ............................ = 152 80.85
GREATER THAN 1.0 ................... = 36 19.15
GREATER THAN AVG............... = 84 44.68
LESS THAN AVG........................ = 104 55.32
LESS THAN: LOWER ……......... = 29 15.43
GREATER THAN: UPPER …....... = 48 25.53
BETWEEN LOWER AND 1.0....... = 123 65.43
BETWEEN UPPER AND 1.0 ……. = 0 0.00
BETWEEN AVG. AND UPPER … = 48 25.53
BETWEEN AVG. AND LOWER... = 75 39.89
=======================================================

142
APPENDIX B : PROGRAM 2
B.1 Code
C SUBPROGRAM TWC_LTDXv1
C BY INCREMENTING DX THE LT IS CALCULATED
C WRITTEN BY ALBERTO RAMIREZ
C UNIVERSITY OF ARKANSAS
C DECEMBER 02, 2013
C MODIFIED: MARCH 12, 2014
C MODIFIED: JUNE 21, 2014
C MODIFIED: MARCH 9, 2015
C
C
C ==================================================================
PARAMETER (NNS=10000)
IMPLICIT REAL*8 (A-H,O-Z)
DIMENSION XC(NNS),DL(NNS),ZA(NNS),BOND(NNS),FSE1(NNS),P1(NNS),
&FCZ1(NNS),XL(NNS),DATAR(NNS,NNS),FSEL(NNS,3),DINTP(2,2),
&PLINE(NNS,4)
CHARACTER *80, FINP,TINP,FOUT,PLLT,ROUT,SOUT,FINP1 !FOUT
CHARACTER *80, PLBOND,PLSTRD,PLCONC,DREAD
CHARACTER *5, TEXT,RTXT,PLT1,RTX1,RSTS,LTPL,BNPL,STRN,CONC,REA1
C
C ==================================================================
C
WRITE(*,120)
120 FORMAT(/,17X,'UNIVERSITY OF ARKANSAS',/,
&13X,'DEPARTMENT OF CIVIL ENGINEERING',//,
&1X,'PROGRAM: TWC_LT (NUMERICAL ANALYSIS OF TRANSFER LENGTHS)',/,
&1X,'WRITTEN BY: ALBERTO T. RAMIREZ',/,
&1X,'=========================================================',/)
C
C ==================================================================
PRINT*,' '
PRINT*, 'READ THE NAME OF THE INPUT FILE (WITHOUT .TXT)'
READ(*,100) FINP
100 FORMAT(A)
C PRINT*, 'READ THE NAME OF THE OUTPUT FILE'
C READ(*,100) FOUT
C DATA INP/5/,OUT/6/
C
TEXT = '.TXT'
PLT1 = '.PLT'
RTXT = '_OUT'
RTX1 = '_RSL'
RSTS = '_STRS'
LTPL = '_LT'
BNPL = '_BS'
STRN = '_STRD'
CONC = '_CONC'
REA1 = '_READ'
C MAKE FILES
TINP = TRIM(FINP) !
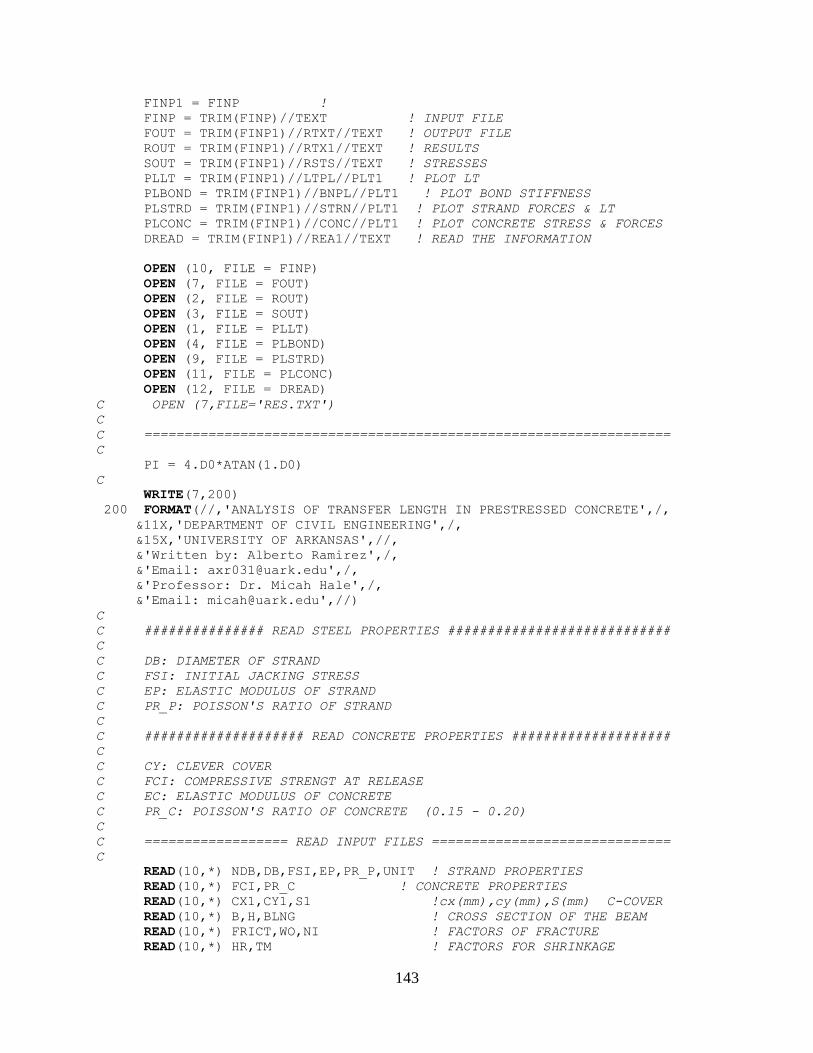
143
FINP1 = FINP !
FINP = TRIM(FINP)//TEXT ! INPUT FILE
FOUT = TRIM(FINP1)//RTXT//TEXT ! OUTPUT FILE
ROUT = TRIM(FINP1)//RTX1//TEXT ! RESULTS
SOUT = TRIM(FINP1)//RSTS//TEXT ! STRESSES
PLLT = TRIM(FINP1)//LTPL//PLT1 ! PLOT LT
PLBOND = TRIM(FINP1)//BNPL//PLT1 ! PLOT BOND STIFFNESS
PLSTRD = TRIM(FINP1)//STRN//PLT1 ! PLOT STRAND FORCES & LT
PLCONC = TRIM(FINP1)//CONC//PLT1 ! PLOT CONCRETE STRESS & FORCES
DREAD = TRIM(FINP1)//REA1//TEXT ! READ THE INFORMATION
OPEN (10, FILE = FINP)
OPEN (7, FILE = FOUT)
OPEN (2, FILE = ROUT)
OPEN (3, FILE = SOUT)
OPEN (1, FILE = PLLT)
OPEN (4, FILE = PLBOND)
OPEN (9, FILE = PLSTRD)
OPEN (11, FILE = PLCONC)
OPEN (12, FILE = DREAD)
C OPEN (7,FILE='RES.TXT')
C
C ==================================================================
C
PI = 4.D0*ATAN(1.D0)
C
WRITE(7,200)
200 FORMAT(//,'ANALYSIS OF TRANSFER LENGTH IN PRESTRESSED CONCRETE',/,
&11X,'DEPARTMENT OF CIVIL ENGINEERING',/,
&15X,'UNIVERSITY OF ARKANSAS',//,
&'Written by: Alberto Ramirez',/,
&'Email: [email protected]',/,
&'Professor: Dr. Micah Hale',/,
&'Email: [email protected]',//)
C
C ############### READ STEEL PROPERTIES ############################
C
C DB: DIAMETER OF STRAND
C FSI: INITIAL JACKING STRESS
C EP: ELASTIC MODULUS OF STRAND
C PR_P: POISSON'S RATIO OF STRAND
C
C #################### READ CONCRETE PROPERTIES ####################
C
C CY: CLEVER COVER
C FCI: COMPRESSIVE STRENGT AT RELEASE
C EC: ELASTIC MODULUS OF CONCRETE
C PR_C: POISSON'S RATIO OF CONCRETE (0.15 - 0.20)
C
C ================== READ INPUT FILES ==============================
C
READ(10,*) NDB,DB,FSI,EP,PR_P,UNIT ! STRAND PROPERTIES
READ(10,*) FCI,PR_C ! CONCRETE PROPERTIES
READ(10,*) CX1,CY1,S1 !cx(mm),cy(mm),S(mm) C-COVER
READ(10,*) B,H,BLNG ! CROSS SECTION OF THE BEAM
READ(10,*) FRICT,WO,NI ! FACTORS OF FRACTURE
READ(10,*) HR,TM ! FACTORS FOR SHRINKAGE
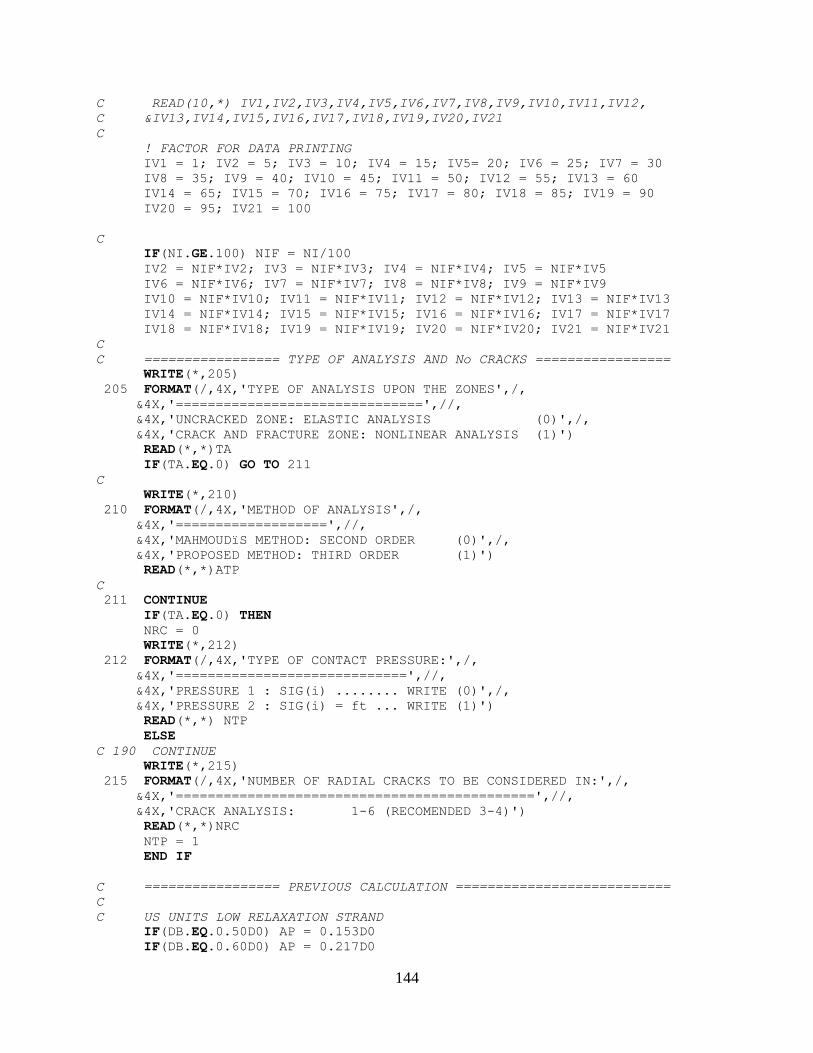
144
C READ(10,*) IV1,IV2,IV3,IV4,IV5,IV6,IV7,IV8,IV9,IV10,IV11,IV12,
C &IV13,IV14,IV15,IV16,IV17,IV18,IV19,IV20,IV21
C
! FACTOR FOR DATA PRINTING
IV1 = 1; IV2 = 5; IV3 = 10; IV4 = 15; IV5= 20; IV6 = 25; IV7 = 30
IV8 = 35; IV9 = 40; IV10 = 45; IV11 = 50; IV12 = 55; IV13 = 60
IV14 = 65; IV15 = 70; IV16 = 75; IV17 = 80; IV18 = 85; IV19 = 90
IV20 = 95; IV21 = 100
C
IF(NI.GE.100) NIF = NI/100
IV2 = NIF*IV2; IV3 = NIF*IV3; IV4 = NIF*IV4; IV5 = NIF*IV5
IV6 = NIF*IV6; IV7 = NIF*IV7; IV8 = NIF*IV8; IV9 = NIF*IV9
IV10 = NIF*IV10; IV11 = NIF*IV11; IV12 = NIF*IV12; IV13 = NIF*IV13
IV14 = NIF*IV14; IV15 = NIF*IV15; IV16 = NIF*IV16; IV17 = NIF*IV17
IV18 = NIF*IV18; IV19 = NIF*IV19; IV20 = NIF*IV20; IV21 = NIF*IV21
C
C ================= TYPE OF ANALYSIS AND No CRACKS =================
WRITE(*,205)
205 FORMAT(/,4X,'TYPE OF ANALYSIS UPON THE ZONES',/,
&4X,'===============================',//,
&4X,'UNCRACKED ZONE: ELASTIC ANALYSIS (0)',/,
&4X,'CRACK AND FRACTURE ZONE: NONLINEAR ANALYSIS (1)')
READ(*,*)TA
IF(TA.EQ.0) GO TO 211
C
WRITE(*,210)
210 FORMAT(/,4X,'METHOD OF ANALYSIS',/,
&4X,'===================',//,
&4X,'MAHMOUDïS METHOD: SECOND ORDER (0)',/,
&4X,'PROPOSED METHOD: THIRD ORDER (1)')
READ(*,*)ATP
C
211 CONTINUE
IF(TA.EQ.0) THEN
NRC = 0
WRITE(*,212)
212 FORMAT(/,4X,'TYPE OF CONTACT PRESSURE:',/,
&4X,'=============================',//,
&4X,'PRESSURE 1 : SIG(i) ........ WRITE (0)',/,
&4X,'PRESSURE 2 : SIG(i) = ft ... WRITE (1)')
READ(*,*) NTP
ELSE
C 190 CONTINUE
WRITE(*,215)
215 FORMAT(/,4X,'NUMBER OF RADIAL CRACKS TO BE CONSIDERED IN:',/,
&4X,'=============================================',//,
&4X,'CRACK ANALYSIS: 1-6 (RECOMENDED 3-4)')
READ(*,*)NRC
NTP = 1
END IF
C ================= PREVIOUS CALCULATION ===========================
C
C US UNITS LOW RELAXATION STRAND
IF(DB.EQ.0.50D0) AP = 0.153D0
IF(DB.EQ.0.60D0) AP = 0.217D0

145
IF(DB.EQ.0.70D0) AP = 0.294D0 ! IN.^2
C SI UNITS LOW RELAXATION STRAND
IF(DB.EQ.12.7D0) AP = 99.0D0 ! MM^2
IF(DB.EQ.13.0D0) AP = 99.69D0
IF(DB.EQ.15.2D0) AP = 140.D0
IF(DB.EQ.15.7D0) AP = 146.4D0
IF(DB.EQ.17.8D0) AP = 190.D0
C
C ##################### DEFINE TYPE OF UNIT #######################
C
IF(UNIT.EQ.0) THEN
WRITE(7,*) 'CUSTOMARY U.S. UNITS'
FVS = 1.D0
FFCI = 1.D0
ELSE
WRITE(7,*) 'CUSTOMARY S.I. UNITS'
FVS = 25.4D0 ! 1in. = 25.4mm
FFCI = 0.145D0 !1MPa = 0.145 ksi, 25.4D0*25.4D0/(9.81D0*0.4536D0)
END IF
C
C ========================== PRINT STRAND PROPERTIES ===============
C FOR SEVEN WIRE STRAND
C
PSTD = 4.D0*PI*DB/3.D0 ! STRAND PERIMETER OR 2*PI*R1 = PI*DB
C
WRITE(7,300)NDB,DB,AP,FSI,EP,PR_P
300 FORMAT(//,4X,'STRAND PROPERTIES',/,'=========================',//,
&'STRAND NUMBER(S) ........... =',I4,/,
&'DIAMETER ................... =',F10.2,/,
&'AREA ....................... =',F10.3,/,
&'INTIAL JACKING STRESS ...... =',F10.2,/,
&'ELASTIC MODULUS ............ =',F10.2,/,
&'POISSONS RATIO ............. =',F10.2)
C
C ================= CONCRETE PROPERTIES CALCULATION ================
C
C READ(10,*) CY,FCI,PR_C,TA
C
FCI_R = FCI
IF(UNIT.EQ.0) THEN
C EC = 33000.D0*UWC**(1.5)*SQRT(FCI) ! KSI
EC = 57.D0*SQRT(FCI*1000.D0) ! KSI
FT = 7.5D0*SQRT(FCI*1000.D0)/1000.D0 ! KSI, LIMIT IN TENSION
FT_L = 0.6D0*FCI ! LINEAR LIMIT IN COMPRESSION
ELSE
EC = 4500*SQRT(FCI) ! MPa
FT = 0.62D0*SQRT(FCI) ! LIMIT IN TENSION
FT_L = 0.6D0*FCI ! LIMIT IN COMPRESSION
END IF
C EFECTIVE CONCRETE COVER
SFACT = 1.5D0 ! ASSUMED BY UIJL
CCS = MIN(CX1,CY1)
CEFF =(2.D0*CCS+(NDB-1)*SFACT*S1)/(2.D0*NDB)
CCV = CEFF
C
WRITE(7,400)FCI,EC,PR_C,CCV,FT,FT_L
400 FORMAT(//,3X,'CONCRETE PROPERTIES',/,

146
&'=========================',//,
&'COMPRESSIVE STRENGTH AT RELEASE..... =',F10.2,/,
&'ELASTIC MODULUS..................... =',F10.2,/,
&'POISSONS RATIO ..................... =',F10.2,/,
&'CONCRETE COVER ..................... =',F10.2,/,
&'LIMIT TENSILE STRENGTH ............. =',F10.2,/,
&'LIMIT COMPRESSION STRENGTH ......... =',F10.2)
C
C =================== THICK WALLED ASSUMPTIONS =====================
C
C THICK-WALLED CYLINDER ASSUMPTION
C
R1 = DB/2 ! INNER RADIUS OF THICK-WALLED
CY = CCV-R1 ! THICK WALL OR CLEVER COVER
R2 = R1+CY ! OUTER RADIUS OF THICK-WALLED
NR = 1000 ! NUMBER OF RADIAL PARTS
DR = (R2-R1)/NR ! INCREMENT OF RADIUS
C
WRITE(7,500)R1,R2,NR,DR
500 FORMAT(//,3X,'THICK-WALLED CYLINDER',/,
&'==============================',//,
&'INNER RADIUS .......... =',F6.2,/,
&'OUTER RADIUS .......... =',F6.2,/,
&'NUMBER OF RADIAL PARTS =',I5,/,
&'INCREMENT OF RADIUS ... =',F6.5)
C
C ==================================================================
C CROSS-SECTION OF A PRESTRESSED CONCRETE BEAM
C ==================================================================
C
C B: WIDTH OF THE BEAM
C H: HIGHT OF THE BEAM
C
C READ(10,*) B,H
C
BI = B*H**3/12.D0 ! INERTIA
BA = B*H ! AREA OF THE CROSS-SECTION OF THE BEAM
ECC = H/2.D0-CY1 ! ECCENTRICITY FROM NA TO THE STRAND
VS = BA/(2.D0*(B+H)) ! V/S : VOLUME SURFACE
C PRINT*,VS,HR
C
WRITE(7,600)B,H,BA,BI,ECC
600 FORMAT(//,3X,'PRESTRESSED CONCRETE BEAM',/,
&'=================================',//,
&'WIDTH OF THE BEAM .......... =',F10.2,/,
&'HIGHT OF THE BEAM .......... =',F10.2,/,
&'AREA ....................... =',F10.2,/,
&'INERTIA .................... =',E12.3,/,
&'ECCENTRICITY ............... =',F10.2)
C
C ==================================================================
C NUMBER OF RADIAL CRACKS & FRICTION COEFFICIENT ON THE BOND
C ==================================================================
C
C NRC: NUMBER OF RADIAL CRACKS
C FRICT: FRICTION ASSUMED
C

147
C READ(10,*) NRC,FRICT,WO,NI,ATP
C
WRITE(7,700)NRC,FRICT,WO,NI
700 FORMAT(//,3X,'VALUES ASSUMED',/,
&'=================================',//,
&'NUMBER OF RADIAL CRACK .......... =',I5,/,
&'COEFFICIENT OF FRICTION ......... =',F6.2,/,
&'WIDTH OF THE CRACK .............. =',F6.4,/,
&'NUMBER OF ITERATIONS ............ =',I5,//)
C
C READ(INP,*) ATP ! ANALYSIS TYPE: QUADRATIC (0) & CUBIC (1)
C
IF(TA.EQ.0) THEN
WRITE(7,*) 'UNCRACKED ZONE: ELASTIC ANALAYSIS'
ELSE
WRITE(7,*) 'COMPLETE CRACK AND FRACTURE ZONE ANALYSIS'
IF(ATP.EQ.0) THEN
WRITE(7,*) 'ANALYSIS TYPE: SECOND ORDER'
ELSE
WRITE(7,*) 'ANALYSIS TYPE: THIRD ORDER'
END IF
END IF
C ==================================================================
C
C READ(10,*)HR,TM
C
C READ(10,*)IV1,IV2,IV3,IV4,IV5,IV6
C
C SET UP XL(I) TO ZERO
DO I = 1,NNS
XL(I) = 0.D0
P1(I) = 0.D0
FCZ1(I) = 0.D0
FSE1(I) = 0.D0
BOND(I) = 0.D0
END DO ! POSITION
C LENGTH OF EACH ELEMENT
DX = 1.D0 ! 0.001D0 !1.D0/N ! LENGTH OF EACH ELEMENT
C ==================================================================
C
FSE95 = 0.95D0*FSI ! 95% AMS
C PRINT*,FSE95
C
C ==================================================================
C
C COEFFICIENT OF SHRINKAGE
C
CALL SHRINKAGE(FVS,FFCI,VS,FCI,HR,TM,EPS_SH)
C EPS_SH = 0.D0 ! -KS*KH*(T/(T+35))*0.51*10**(-3)
WRITE(7,*) 'STRAIN DUE TO SHRINKAGE:',EPS_SH
C
C ==================================================================
C
EPR = EP ! ELASTIC MODULUS IN THE TRANSVERSAL DIRECTION
C
WRITE(1,750)
WRITE(2,800)

148
750 FORMAT(6X,'Lt(i)',6X,'Fse',6X,'FSE95',4X,'SIG(i)',3X,'SFr',5X,
*'Fcz',5X,'Rfr',5X,'Rcr',6X,'Wa',5X,'WO',5X,'STAGE')
800 FORMAT(2X,'INC.#',5X,'Lt(i)',6X,'Fse',6X,'FSE95',4X,'SIG(i)',3X,
*'SFr',5X,'Fcz',5X,'Rfr',5X,'Rcr',6X,'Wa',5X,'WO',5X,'STAGE')
C
C ==================================================================
C ======================= MAIN PROGRAM STARTS FROM HERE ============
C ==================================================================
C
FSE1(1) = 0.0
C
INJJ = 0
850 INJJ = INJJ+1
I = INJJ
C PRINT*,I
C DO 50 I = 1,NI+1
FSE = FSE1(I) ! INCREMENT OF EFFECTIVE STRESS
C FSE = DFSE*(I-1)
C
C IF(FSE.GT.FSI) FSE = FSI
FCZ = -NDB*FSE*AP*(1.D0/BA + ECC**2/BI)
C
C ====================== ELASTIC ANALYSIS ==========================
C
DPFP = (FSI-FSE)*PR_P/EP ! INCREASE IN RADIUS OF STRAND
FFCZ = -PR_C*FCZ/EC ! FACTOR OF COMPRESSIVE STRESS
C
IF(DPFP.LT.0.D0) DPFP = 0.D0
C
CALL ELSTRESS(R1,R2,PR_C,DPFP,FFCZ,EC,EPS_SH,PR_P,EPR,SIG_I)
C
C PRINT*,SIG_I
IF(SIG_I.LT.0.D0) GO TO 50
C
C WRITE(7,*)'SIG_E =',SIG_I !%%%%%%%%%%%
C
SIGR = (-1.D0)*FT*(R2**2-R1**2)/(R2**2+R1**2)
RCR = R1 ! CRACKED RADIUS EQUAL TO INNER RADIUS
RFR = R1 ! FRACTURE RADIUS EQUAL TO INNER RADIUS
XC(I) = 3 ! UNCRACKED CASE ===== CONDITION ======
C
IF(SIG_I.LT.ABS(SIGR).OR.TA.EQ.0) GO TO 40
C
C ==================================================================
C =============== BOTH COMPLETE CRACK & FRACTURE ZONE ==============
C
RCR = R1
LC = 0
30 LC = LC+1
RFR = R1+(0.0001D0*LC)*(R2-R1) ! RADIUS AT FRACTURE ZONE
C IF(RFR.GT.1.001D0*R2) GO TO 20
IF(RFR.GT.R2) GO TO 40 !**** FROM 20 TO 40
C IF(RCR.LT.R1) RCR = R1 ! MAYBE IT IS NOT NECESARY... CHECK IT!
C
IF(ATP.EQ.0) THEN
CALL CRSTRESS(R1,R2,PR_C,DPFP,FFCZ,EC,EPS_SH,PR_P,EPR,FT,
&FT_L,RFR,RCR,SIG_IR,DPFP_R,SKT)

149
C
ELSE
CALL CRSTRESS3(R1,R2,PR_C,DPFP,FFCZ,EC,EPS_SH,PR_P,EPR,FT,
&FT_L,RFR,RCR,SIG_IR,DPFP_R,SKT)
C
END IF
C
C IF(SIG_IR.GT.FT_L) SIG_IR = 0.4D0*FT_L ! $$$$$$
C
C WRITE(7,*)'SIG_CR =',SIG_IR,' RFR =',RFR !%%%%%%%%%%%
C
C ==================================================================
C
RCR_I = RCR
C CRACK WIDTH
WA = (2.D0*PI/NRC)*(DPFP_R-SIG_IR*(1.D0-PR_P)*R1/EPR)
IF(WA.LT.WO) WA = WO !******************** ADDED***********
RCR = RFR-(WO/WA)*(RFR-R1) ! RADIUS AT CRACKED ZONE
C
SFR1 = -SIG_IR*R1/RFR
C
IF(ATP.EQ.0) THEN
SIG_FR = SFR1+SKT*(RFR**2/3.D0-RCR*RFR+RCR**2-RCR**3/(3.D0*RFR))
C
ELSE
SIG_FR = SFR1+SKT*(RFR**3/4.D0-RCR*RFR**2+1.5D0*RCR**2*RFR-
& RCR**3+RCR**4/(4.D0*RFR))
END IF
C
SIG_RFR = FT*(RFR**2-R2**2)/(R2**2+RFR**2) ! RUPTURE STRENGTH C
SIG_I = SIG_IR
XC(I) = 1 ! CRACKED ZONE
C
IF(WA.LT.WO) RCR = R1
IF(ABS(SIG_RFR/SIG_FR).LT.0.98) GO TO 30 ! LESS THAN 97% MSA
C
C 20 IF(WA.GT.WO) GO TO 40 !*****????????????????
IF(WA.LT.WO) GO TO 40 !FROM GT TO LT
C
C ====================== ONLY FRACTURE ZONE ========================
C
INC = 0
LC = 0
10 LC = LC+1
RFR = R1+(0.0001D0*LC)*(R2-R1) ! RADIUS AT FRACTURE ZONE
INC = INC+1
C
IF(RFR.GE.R2) RFR=R2
IF(INC.GT.5000) GO TO 40
C
IF(ATP.EQ.0) THEN
CALL FRSTRESS(R1,R2,PR_C,DPFP,FFCZ,EC,EPS_SH,PR_P,EPR,FT,
&FT_L,RFR,RCR,WA,WO,SIG_IR,DPFP_R,SK2,SK3,SK4)
C
ELSE
CALL FRSTRESS3(R1,R2,PR_C,DPFP,FFCZ,EC,EPS_SH,PR_P,EPR,FT,
&FT_L,RFR,RCR,WA,WO,SIG_IR,DPFP_R,SK2,SK3,SK23,SK4)

150
C
END IF
C
C IF(SIG_IR.GT.FT_L) SIG_IR = 0.4D0*FT_L ! $$$$$$
C
C WRITE(7,*)'SIG_FR =',SIG_IR,' RFR =',RFR !%%%%%%%%%%%
!%%%%%%%%%%%
C ==================================================================
R = RFR
CK1 = -(R1*SIG_IR+SK4)/R
C
IF(ATP.EQ.0) THEN
SIG_FR = CK1+(FT+SK2*(RFR-0.5D0*R)+SK3*(RFR**2-RFR*R+R**2/3.D0))
ELSE
SIG_FR = CK1+(FT+SK2*(RFR-0.5D0*R)+SK3*(RFR**2-RFR*R+R**2/3.D0)+
& SK23*(RFR**3-1.5D0*RFR**2*R+RFR*R**2-R**3/4.D0))
END IF
C
SIG_RFR = FT*(RFR**2-R2**2)/(RFR**2+R2**2)
C CRACK WIDTH
WA = (2.D0*PI/NRC)*(DPFP_R-SIG_IR*(1.D0-PR_P)*R1/EPR)
C
IF(WA.LT.WO) RCR = R1 !; WA = WO
SIG_I = SIG_IR
C
XC(I) = 2 ! FRACTURE ZONE
C
IF(ABS(SIG_RFR/SIG_FR).LT.0.98) GO TO 10 ! LESS THAN 97% MSA
C
C ==================================================================
C
C ==================================================================
40 CONTINUE
C
C IF(RFR.GE.R2) WRITE(*,900)RFR,XC(I)
IF(RFR.GE.R2) RFR = R2
C 900 FORMAT(2X,F10.4,5X,'INSUFICIENT COVER STAGE',3X,F8.2,//,
C &4X,'PROBABLY THE NUMBER OF CRACKS NEEDS TO BE INCREASED',//)
C IF(RFR.GE.R2) STOP
C IF(RFR.GE.R2) GO TO 190
C
C ============== BOND BETWEEN CONCRETE AND STRAND ==================
C
IF(DB.LT.15.OR.DB.LT.0.6D0) THEN
IF(NRC.EQ.0) FBND1 = 1.00D0
IF(NRC.EQ.1) FBND1 = 1.10D0 ! OK
IF(NRC.EQ.2) FBND1 = 0.90D0 ! OK
IF(NRC.EQ.3) FBND1 = 0.75D0 ! OK
IF(NRC.EQ.4) FBND1 = 0.60D0 ! OK
IF(NRC.EQ.5) FBND1 = 0.55D0 ! OK
IF(NRC.EQ.6) FBND1 = 0.50D0 !1.25/NRC ! DUE TO SOME FACT..
INCR = 1
ELSE
C IF(DB.GT.15.OR.DB.GT.0.6D0) FBND = 0.90D0*NRC
IF(NRC.EQ.0) FBND1 = 1.00D0
IF(NRC.EQ.1) FBND1 = 1.45D0 ! OK

151
IF(NRC.EQ.2) FBND1 = 1.15D0
IF(NRC.EQ.3) FBND1 = 0.95D0 ! OK
IF(NRC.EQ.4) FBND1 = 0.85D0 ! OK
IF(NRC.EQ.5) FBND1 = 0.65D0 ! OK
IF(NRC.EQ.6) FBND1 = 0.55D0 ! OK
INCR = 2
END IF
C PRINT*,FBND1,INCR
C
C STRESSES AND FORCES AT ONE THICK WALLED CYLINDER
C
C BOND(I) = FBND*2.D0*PI*R1*FRICT*SIG_I
BOND(I+1) = FBND1*PSTD*FRICT*SIG_I ! PSTD > 2.D0*PI*R1
BONDT = NDB*BOND(I+1)
C
DFSE = BONDT*DX/AP ! AP = AREA OF ONE STRAND
C
FSE1(I+1) = FSE1(I)+DFSE
C
IF(FSE1(I+1).GT.FSI) FSE1(I+1) = FSI
P1(I+1) = NDB*FSE1(I+1)*AP
FCZ1(I+1) = -P1(I+1)*(1.D0/BA + ECC**2/BI)
C FCZ = -FSE*AP*(1.D0/BA + ECC**2/BI)
C END IF
C IF(DL(I).LT.0.D0) GO TO 50
C
C XL = XL+DL(I) ! POSITION
XL(I+1) = XL(I)+DX ! POSITION
C
C ==================================================================
C ================== WRITE TRANSFER LENGTH =========================
C ==================================================================
C
C
NJD = I
DATAR(I,1) = I; DATAR(I,2) = XL(I); DATAR(I,3) = FSE
DATAR(I,4) = FSE95; DATAR(I,5) = SIG_I; DATAR(I,6) = SIG_IR
DATAR(I,7) = FCZ; DATAR(I,8) = RFR; DATAR(I,9) = RCR_I
DATAR(I,10) = WA; DATAR(I,11) = WO; DATAR(I,12) = XC(I)
C
C WRITE(1,1000)XL(I),FSE,FSE95,SIG_I,SIG_IR,FCZ,RFR,RCR_I,WA,WO,
C &XC(I)
C WRITE(2,1050)I,XL(I),FSE,FSE95,SIG_I,SIG_IR,FCZ,RFR,RCR_I,WA,WO,
C &XC(I)
C1000 FORMAT(3F11.3,11F8.3)
C1050 FORMAT(I5,3F11.3,11F8.3)
C
C IF(FSE95.LT.FSE1(I)) WRITE(7,1100)I,XL(I),FSE1(I),SIG_I
C1100 FORMAT(/,'95% of Fsi',/,I5,7F10.3)
C
C ==================================================================
C
DO J = 1,NI
ZA(J) = 0
END DO
C
ZA(IV1) = 1; ZA(IV2) = 1; ZA(IV3) = 1; ZA(IV4) = 1; ZA(IV5) = 1
152
ZA(IV6) = 1; ZA(IV7) = 1; ZA(IV8) = 1; ZA(IV9) = 1; ZA(IV10) = 1
ZA(IV11) = 1; ZA(IV12) = 1; ZA(IV13) = 1; ZA(IV14) = 1
ZA(IV15) = 1; ZA(IV16) = 1; ZA(IV17) = 1; ZA(IV18) = 1
ZA(IV19) = 1; ZA(IV20) = 1; ZA(IV21) = 1
C
IF(ZA(I).NE.1) GO TO 50
WRITE(3,*) 'RESULTS'
C WRITE(4,*) 'RESULTS'
C
IF(XC(I).EQ.3) GO TO 3
IF(XC(I).EQ.2) GO TO 2
C
IF(ATP.EQ.0) THEN
CALL RCRSTRESS(R1,R2,DR,NR,SIG_I,RCR_I,RFR,FT,I,XL,XC,FINP1)
C
ELSE
CALL RCRSTRESS3(R1,R2,DR,NR,SIG_I,RCR_I,RFR,FT,I,XL,XC,
&FINP1)
C
END IF
C
C 200 FORMAT(I5,5F12.4)
C ==================================================================
GO TO 50
C
2 CONTINUE
C
IF(ATP.EQ.0) THEN
CALL RFRSTRESS(R1,R2,DR,NR,SIG_IR,RFR,FT,SK2,SK3,SK4,
&I,XL,XC,FINP1)
C
ELSE
CALL RFRSTRESS3(R1,R2,DR,NR,SIG_IR,RFR,FT,SK2,SK3,SK23,SK4,
&I,XL,XC,FINP1)
C
END IF
C
GO TO 50
C
3 CONTINUE
C
CALL RELSTRESS(R1,R2,DR,NR,SIG_I,I,XL,XC,FT,FT_L,FINP1,NTP)
C
50 CONTINUE
DLT = FSE1(I+1)-FSE1(I)
IF(DLT.GT.0.010) GO TO 850
C
PRINT*,FBND1,INCR ! TO SEE WHERE IT OCCURS
C PRINT*,NJD
C DO I = 1,NJD
C NJ = DATAR(I,1)
C WRITE(7,1150)NJ,(DATAR(I,J),J=2,12)
C1150 FORMAT(I5,3F11.3,11F8.3)
C END DO
C
FSE95_1 = DATAR(NJD,3)
IF(FSE95_1.LT.FSE95) THEN

153
FSE95 = 0.999D0*FSE95_1
DO I = 1,NJD
DATAR(I,4) = FSE95
END DO
ELSE
FSE95 = FSE95
END IF
C PRINT*,FSE95
C
DO I = 1,NJD
NCOL = DATAR(I,1)
WRITE(1,1000) (DATAR(I,J),J = 2,12)
WRITE(2,1050) NCOL,(DATAR(I,J),J = 2,12)
C WRITE(1,1000)XL(I),FSE,FSE95,SIG_I,SIG_IR,FCZ,RFR,RCR_I,WA,WO,
C &XC(I)
C WRITE(2,1050)I,XL(I),FSE,FSE95,SIG_I,SIG_IR,FCZ,RFR,RCR_I,WA,WO,
C &XC(I)
END DO
1000 FORMAT(3F11.3,11F8.3)
1050 FORMAT(I5,3F11.3,11F8.3)
C
C
CALL PINFL(NNS,FSEL,NJD,DATAR,FSE95,DINTP)
C PRINT*,FSEL(1,1),FSEL(1,2),FSEL(1,3)
C PRINT*,DINTP(1,1),DINTP(1,2),DINTP(2,1),DINTP(2,2)
C
X1 =DINTP(1,1); X2 = DINTP(1,2); Y1 = DINTP(2,1); Y2 = DINTP(2,2)
C
Y = FSE95
CALL INTERP(X1,X,X2,Y1,Y,Y2)
WRITE(*,1125)FSI,FSE95,FCI_R,X,NRC
WRITE(7,1125)FSI,FSE95,FCI_R,X,NRC
1125 FORMAT(//,4X,'RESULTS FROM THE ANALYSIS',/,
&4X,'=========================',/,
&4X,'INITIAL PRESSTRESS ............. =',F8.1,/
&4X,'PRESTRESS AT 95% AMS METHOD .... =',F8.1,/,
&4X,'CONCRETE STRENGHT AT RELEASE ... =',F8.1,/,
&4X,'CALCULATED TRANSFER LENGTH ..... =',F8.1,/,
&4X,'NUMBER OF RADIAL CRACKS ........ =',I5,/)
C
CALL PSLOP(NNS,NJD,DATAR,PLINE,X,Y)
C
C ===================== DATA PLOT FOR TECPLOT ======================
C BOND
DO I = 1,NJD
STIFB = BOND(2)-BOND(I)
IF(I.EQ.1) STIFB = BOND(I)
BSTRAIN = STIFB/EP
WRITE(4,1150)XL(I),BOND(I),STIFB,BSTRAIN
END DO
1150 FORMAT(5F11.3)
C
C CONCRETE
DO I = 1,NJD
CSTR = FCZ1(I)/EC*10**6 ! CONCRETE STRAIN BY 10^-6
WRITE(11,1150)XL(I),-FCZ1(I),X,-CSTR,XC(I)

154
END DO
C
C STRAND
DO I = 1,NJD
SSTR = FSE1(I)/EP
WRITE(9,1200)XL(I),FSE1(I),P1(I),FSE95,FSI,X,PLINE(I,2),SSTR,XC(I)
END DO
1200 FORMAT(10F11.3)
C
WRITE(12,1250)
1250 FORMAT(/,
&1X,'READ THIS DATA INFORMATION FOR EACH FILE BEFORE PLOTTING',/,
&1X,'========================================================',//,
&1X,'(1): FILENAME_LT.PLT',//,
&1X,'Lt(i);',2X,'Fse;',2X,'FSE95;',2X,'SIG(i);',2X,'SFr;',2X,
*'Fcz;',2X,'Rfr;',2X,'Rcr;',2X,'Wa;',2X,'WO;',2X,'STAGE',///,
&1X,'(2): FILENAME_BS.PLT',//,
&1X,'DIST. FROM FREE END;',2X,'BOND;',2X,'BOND FROM ZERO',2X,
&'BOND STRAIN',///,
&1X,'(3): FILENAME_CONC.PLT',//,
&1X,'DIST. FROM FREE END;',2X,'STRESS;',2X,'Lt;',2X,
&'STRAIN by 10^-6;',2X,'FRACT. ZONES',///,
&1X,'(4): FILENAME_STRD.PLT',//,
&1X,'DIST. FROM FREE END;',2X,'STRESS;',2X,'FORCE;',2X,'95% AMS;',
&2X,'Fsi;',2X,'Lt;',2X,'EQ. LINE Lt;',2X,'STRAIN;',2X,
&'FRACT. ZONES',///,
&1X,'(5): FILENAME_RFRXXXX.PLT OR FILENAME_RCRXXXX.PLT',//,
&1X,'RADIAL INCR.;',2X,'RADIAL STRESSES;',2X,'HOOP STRESSES;',2X,
&'Lti;',2X,'FRACT. ZONES',///,
&1X,'(6): FILENAME_RELXXXX.PLT',//,
&1X,'RADIAL INCR.;',2X,'RADIAL STRESSES;',2X,'HOOP STRESSES;',2X,
&'TENSILE LIMIT Ft;',2X,'COMPRESS. LIMIT Ft_L;',2X,'Lti;',2X,
&'FRACT. ZONES',///)
C
STOP
END
C
C ==================================================================
C SUBROUTINES
C ==================================================================
C
C =================== SUBROUTINE ELSTRESS ==========================
C ELASTIC CONTACT PRESSURE INTERFACE
C
SUBROUTINE ELSTRESS(R1,R2,PR_C,DPFP,FFCZ,EC,EPS_SH,PR_P,EPR,SIG_I)
IMPLICIT REAL*8 (A-H,O-Z)
C
SKC = ((1.D0-PR_C)*R1**2+(1.D0+PR_C)*R2**2)/(R2**2-R1**2)
SIG_I = (DPFP-FFCZ-EPS_SH)/((1-PR_P)/EPR+(SKC/EC))
RETURN
END
C
C =================== SUBROUTINE CRSTRESS ==========================
C CRACKED CONTACT PRESSURE INTERFACE
C
SUBROUTINE CRSTRESS(R1,R2,PR_C,DPFP,FFCZ,EC,EPS_SH,PR_P,EPR,FT,
&FT_L,RFR,RCR,SIG_IR,DPFP_R,SKT)

155
IMPLICIT REAL*8 (A-H,O-Z)
C
DPFP_R = DPFP*R1
DCFCZ = FFCZ*RFR !RFR !R1 (FCZ*(PR_C/EC)*RFR)
DCSH = EPS_SH*R1
C
SKT = FT/(RFR-RCR)**2
C CONSTANT K1
SK11 = (RFR**3-RCR**3)*(1.D0-3.D0*PR_C)/9.D0
SK12 = RCR*(RFR**2-RCR**2)*(1.D0-2.D0*PR_C)/2.D0
SK13 = (RCR**2)*(RFR-RCR)*(1.D0-PR_C)
SK14 = (RCR**3)*(LOG(RFR/RCR))/3.D0
C
SK1 = (SKT/EC)*(SK11-SK12+SK13-SK14)
C RADIAL DISPLACEMENT FRACTURE : RDCFR
SIG_FR = (-1.D0)*FT*(R2**2-RFR**2)/(R2**2+RFR**2)
RDCFR = RFR*(FT-PR_C*SIG_FR)/EC
C
SK6 = R1*((1.D0-PR_P)/EPR+LOG(RFR/R1)/EC)
C
SIG_IR = (DPFP_R+SK1-RDCFR-DCFCZ-DCSH)/SK6 ! SIG_I = SIG_IR
C
IF(SIG_IR.GT.FT_L) SIG_IR = FT_L
C
RETURN
END
C
C =================== SUBROUTINE FRSTRESS ==========================
C FRACTURE CONTACT PRESSURE INTERFACE
C
SUBROUTINE FRSTRESS(R1,R2,PR_C,DPFP,FFCZ,EC,EPS_SH,PR_P,EPR,FT,
&FT_L,RFR,RCR,WA,WO,SIG_IR,DPFP_R,SK2,SK3,SK4)
IMPLICIT REAL*8 (A-H,O-Z)
C
DPFP_R = DPFP*R1
DCFCZ = FFCZ*RFR !RFR ! R1 (FFCZ*(PR_C/EC)*RFR)
DCSH = EPS_SH*R1
C CONSTANTS K2, K3, & K4
SK2 = -(2.D0*WA/WO)*FT/(RFR-R1)
SK3 = (WA/WO)**2*(FT/(RFR-R1)**2)
C
SK41 = SK3*R1*(RFR**2-RFR*R1+R1**2/3.D0)
SK4 = FT*R1+SK2*R1*(RFR-0.50D0*R1)+SK41
C CONSTANT K5
SK51 = (FT/EC)*(RFR-R1)*(1.D0-PR_C)
SK52 = RFR*(RFR-R1)*(1.D0-PR_C)
SK53 = 0.25D0*(RFR**2-R1**2)*(1.D0-2.D0*PR_C)
SK54 = (RFR**2)*(RFR-R1)*(1.D0-PR_C)
SK55 = 0.50D0*RFR*(RFR**2-R1**2)*(1.D0-2.D0*PR_C)
SK56 = (RFR**3-R1**3)*(1.D0-3.D0*PR_C)/9.D0
SK57 = (SK4/EC)*LOG(RFR/R1)
C
SK5 = SK51+(SK2/EC)*(SK52-SK53)+(SK3/EC)*(SK54-SK55+SK56)-SK57
C SK5 = SK57-SK51-(SK2/EC)*(SK52-SK53)-(SK3/EC)*(SK54-SK55+SK56)
C RADIAL DISPLACEMENT RDCFR
SIG_FR = (-1.D0)*FT*(R2**2-RFR**2)/(R2**2+RFR**2)
RDCFR = RFR*(FT-PR_C*SIG_FR)/EC

156
C CONSTANT K7
C SK7 = R1*((1.D0-PR_P)/EPR+LOG(RFR/R1)/EC)
FRL = RCR*RFR/(R1**2)
SK7 = R1*((1.D0-PR_P)/EPR+LOG(FRL)/EC)
C
SIG_IR = (DPFP_R+SK5-RDCFR-DCFCZ-DCSH)/SK7
C
IF(SIG_IR.GT.FT_L) SIG_IR = FT_L
C
RETURN
END
C
C =================== SUBROUTINE RCRSTRESS ==========================
C RADIAL CRACKED STRESS
C
SUBROUTINE RCRSTRESS(R1,R2,DR,NR,SIG_I,RCR_I,RFR,FT,I,XL,XC,FINP1)
IMPLICIT REAL*8 (A-H,O-Z)
DIMENSION XC(1),XL(1)
CHARACTER *80,FILENAME,FINP1
C
ID = I
WRITE(FILENAME,'("_RCR",I4.4,".PLT")')ID
FILENAME = TRIM(FINP1)//TRIM(FILENAME)
OPEN(8,FILE = FILENAME)
C
N = NR+1
DO 35 J = 1,N !N
R = R1+DR*(J-1) ! DR = 0.01D0*(R2-R1)
IF(R.GE.RCR_I) GO TO 10
SIG_R = -SIG_I*R1/R
SIG_T = 0.D0
GO TO 30
10 IF(R.GE.RFR) GO TO 20
SKT = FT/((RFR-RCR_I)**2)
SRI = -SIG_I*R1/R
SIG_R = SRI+SKT*(R**2/3.D0-RCR_I*R+RCR_I**2-RCR_I**3/(3.D0*R))
SIG_T = SKT*(R-RCR_I)**2 ! SKT*(R**2-2*R*RCR_I+RCR_I**2)
GO TO 30
20 IF(RFR.GE.R2) RFR = 0.9995*R2
SIG_FR = FT*(R2**2-RFR**2)/(RFR**2+R2**2) ! SHOULD BE +
C
SIG_R = -SIG_FR*((R2/R)**2-1.D0)/((R2/RFR)**2-1.D0)
SIG_T = SIG_FR*((R2/R)**2+1.D0)/((R2/RFR)**2-1.D0)
C DIS_U = C1*RR/EC*((1.D0-PR_C)+(1.D0+PR_C)*(R2/RR)**2)-C4
C
C 30 WRITE(4,100)R,SIG_R,SIG_T,XL(I),XC(I)
30 WRITE(8,100)R,SIG_R,SIG_T,XL(I),XC(I)
WRITE(3,200)I,R,SIG_R,SIG_T,XL(I),XC(I)
35 CONTINUE
C 30 WRITE(3,200)I,R,SIG_R,SIG_T,XL(I),XC(I)
100 FORMAT(5F12.4)
200 FORMAT(I5,5F12.4)
C
RETURN
END
C
C
157
C =================== SUBROUTINE RFRSTRESS ==========================
C RADIAL FRACTURE STRESS
C
SUBROUTINE RFRSTRESS(R1,R2,DR,NR,SIG_IR,RFR,FT,SK2,SK3,SK4,
&I,XL,XC,FINP1)
IMPLICIT REAL*8 (A-H,O-Z)
DIMENSION XC(1),XL(1)
CHARACTER *80,FILENAME,FINP1
C
ID = I
WRITE(FILENAME,'("_RFR",I4.4,".PLT")')ID
FILENAME = TRIM(FINP1)//TRIM(FILENAME)
OPEN(8,FILE = FILENAME)
C
N = NR+1
DO 35 J = 1,N ! N = 101
R = R1+DR*(J-1) ! DR = (0.01D0*(R2-R1))
IF(R.GE.RFR) GO TO 10 !!!
C
CK1 = -(R1*SIG_IR+SK4)/R
SIG_R = CK1+(FT+SK2*(RFR-0.5D0*R)+SK3*(RFR**2-RFR*R+R**2/3.D0))
SIG_T = FT+SK2*(RFR-R)+SK3*(RFR-R)**2 !(RFR**2-2.D0*RFR*R+R**2)
GO TO 30
10 SIG_FR = FT*(R2**2-RFR**2)/(RFR**2+R2**2) ! SHOULD BE +
IF(RFR.GE.R2) GO TO 30
C
SIG_R = -SIG_FR*((R2/R)**2-1.D0)/((R2/RFR)**2-1.D0)
SIG_T = SIG_FR*((R2/R)**2+1.D0)/((R2/RFR)**2-1.D0)
C DIS_U = C1*RR/EC*((1.D0-PR_C)+(1.D0+PR_C)*(R2/RR)**2)-C4
C 30 WRITE(4,100)R,SIG_R,SIG_T,XL(I),XC(I)
30 WRITE(8,100)R,SIG_R,SIG_T,XL(I),XC(I)
WRITE(3,200)I,R,SIG_R,SIG_T,XL(I),XC(I)
35 CONTINUE
C 30 WRITE(3,200)I,R,SIG_R,SIG_T,XL(I),XC(I)
100 FORMAT(5F12.4)
200 FORMAT(I5,5F12.4)
C
RETURN
END
C
C
C =================== SUBROUTINE RELSTRESS ==========================
C RADIAL ELASTIC STRESS
C
SUBROUTINE RELSTRESS(R1,R2,DR,NR,SIG_I,I,XL,XC,FT,FT_L,FINP1,NTP)
IMPLICIT REAL*8 (A-H,O-Z)
DIMENSION XC(1),XL(1)
CHARACTER *80,FILENAME,FINP1
C
ID = I
WRITE(FILENAME,'("_REL",I4.4,".PLT")')ID
FILENAME = TRIM(FINP1)//TRIM(FILENAME)
OPEN(8,FILE = FILENAME)
C
FT_L = -FT_L
N = NR+1
C
158
C WHEN THE SIG_I IS EQUAL TO FT
IF(SIG_I.GT.FT.AND.NTP.EQ.1) THEN
SIG_I = FT
WRITE(3,*)'WHEN THE SIG_I IS EQUAL TO FT'
C
DO 30 J = 1,N !N
R = R1+DR*(J-1) ! DR = (0.01D0*(R2-R1))
C
SIG_R = -SIG_I*((R2/R)**2-1.D0)/((R2/R1)**2-1.D0)
SIG_T = SIG_I*((R2/R)**2+1.D0)/((R2/R1)**2-1.D0)
C DIS_U = C1*RR/EC*((1.D0-PR_C)+(1.D0+PR_C)*(R2/RR)**2)-C4
C
C WRITE(4,100)R,SIG_R,SIG_T,FT,FT_L,XL(I),XC(I)
WRITE(8,100)R,SIG_R,SIG_T,FT,FT_L,XL(I),XC(I)
WRITE(3,200)I,R,SIG_R,SIG_T,FT,FT_L,XL(I),XC(I)
C 30 WRITE(3,200)I,R,SIG_R,SIG_T,XL(I),XC(I)
30 CONTINUE
ELSE
DO 20 J = 1,N !N
R = R1+DR*(J-1) ! DR = (0.01D0*(R2-R1))
C
SIG_R = -SIG_I*((R2/R)**2-1.D0)/((R2/R1)**2-1.D0)
SIG_T = SIG_I*((R2/R)**2+1.D0)/((R2/R1)**2-1.D0)
C DIS_U = C1*RR/EC*((1.D0-PR_C)+(1.D0+PR_C)*(R2/RR)**2)-C4
C
C WRITE(4,100)R,SIG_R,SIG_T,FT,FT_L,XL(I),XC(I)
WRITE(8,100)R,SIG_R,SIG_T,FT,FT_L,XL(I),XC(I)
WRITE(3,200)I,R,SIG_R,SIG_T,FT,FT_L,XL(I),XC(I)
C 20 WRITE(3,200)I,R,SIG_R,SIG_T,FT,FT_L,XL(I),XC(I)
20 CONTINUE
END IF
C
100 FORMAT(7F12.4)
200 FORMAT(I5,7F12.4)
C
RETURN
END
C
C
C CUBIC ASSUMPTION
C =================== SUBROUTINE CRSTRESS3 =========================
C CRACKED CONTACT PRESSURE INTERFACE
C
SUBROUTINE CRSTRESS3(R1,R2,PR_C,DPFP,FFCZ,EC,EPS_SH,PR_P,EPR,FT,
&FT_L,RFR,RCR,SIG_IR,DPFP_R,SKT)
IMPLICIT REAL*8 (A-H,O-Z)
C
DPFP_R = DPFP*R1
DCFCZ = FFCZ*RFR !RFR !R1 (FCZ*(PR_C/EC)*RFR)
DCSH = EPS_SH*R1
C
SKT = FT/(RFR-RCR)**3
C CONSTANT K1
SK11 = (RFR**4-RCR**4)*(1.D0-4.D0*PR_C)/16.D0
SK12 = RCR*(RFR**3-RCR**3)*(1.D0-3.D0*PR_C)/3.D0
SK13 = 3.D0*RCR**2*(RFR**2-RCR**2)*(1.D0-2.D0*PR_C)/4.D0
SK14 = (RCR**3)*(RFR-RCR)*(1.D0-PR_C)

159
SK15 = (RCR**4)*(LOG(RFR/RCR))/4.D0
C
SK1 = (SKT/EC)*(SK11-SK12+SK13-SK14+SK15)
C RADIAL DISPLACEMENT FRACTURE : RDCFR
SIG_FR = FT*(RFR**2-R2**2)/(RFR**2+R2**2)
RDCFR = RFR*(FT-PR_C*SIG_FR)/EC
C
SK6 = R1*((1.D0-PR_P)/EPR+LOG(RFR/R1)/EC)
C
SIG_IR = (DPFP_R+SK1-RDCFR-DCFCZ-DCSH)/SK6 ! SIG_I = SIG_IR
C
IF(SIG_IR.GT.FT_L) SIG_IR = FT_L
C
RETURN
END
C
C =================== SUBROUTINE FRSTRESS3 =========================
C FRACTURE CONTACT PRESSURE INTERFACE
C
SUBROUTINE FRSTRESS3(R1,R2,PR_C,DPFP,FFCZ,EC,EPS_SH,PR_P,EPR,FT,
&FT_L,RFR,RCR,WA,WO,SIG_IR,DPFP_R,SK2,SK3,SK23,SK4)
IMPLICIT REAL*8 (A-H,O-Z)
C
DPFP_R = DPFP*R1
DCFCZ = FFCZ*RFR !RFR ! R1 (FFCZ*(PR_C/EC)*RFR)
DCSH = EPS_SH*R1
C CONSTANTS K2, K3, & K4
SK2 = -(3.D0*WA/WO)*FT/(RFR-R1)
SK3 = 3.D0*(WA/WO)**2*(FT/(RFR-R1)**2)
SK23 = -(WA/WO)**3*(FT/(RFR-R1)**3)
C
SK41 = SK3*R1*(RFR**2-RFR*R1+R1**2/3.D0)
SK42 = SK23*R1*(RFR**3-1.5D0*RFR**2*R1+RFR*R1**2-0.25D0*R1**3)
SK4 = FT*R1+SK2*R1*(RFR-0.50D0*R1)+SK41+SK42
C CONSTANT K5
SK51 = (FT/EC)*(RFR-R1)*(1.D0-PR_C)
SK52 = RFR*(RFR-R1)*(1.D0-PR_C)
SK53 = 0.25D0*(RFR**2-R1**2)*(1.D0-2.D0*PR_C)
SK54 = (RFR**2)*(RFR-R1)*(1.D0-PR_C)
SK55 = 0.50D0*RFR*(RFR**2-R1**2)*(1.D0-2.D0*PR_C)
SK56 = (RFR**3-R1**3)*(1.D0-3.D0*PR_C)/9.D0
SK57 = RFR**3*(RFR-R1)*(1.D0-PR_C)
SK58 = 0.75D0*(RFR**2)*(RFR**2-R1**2)*(1.D0-2.D0*PR_C)
SK59 = RFR*(RFR**3-R1**3)*(1.D0-3.D0*PR_C)/3.D0
SK510 = (RFR**4-R1**4)*(1.D0-4.D0*PR_C)/16.D0
SK511 = (SK4/EC)*LOG(RFR/R1)
C
SK5 = SK51+(SK2/EC)*(SK52-SK53)+(SK3/EC)*(SK54-SK55+SK56)+
& (SK23/EC)*(SK57-SK58+SK59-SK510)-SK511
C SK5 = SK57-SK51-(SK2/EC)*(SK52-SK53)-(SK3/EC)*(SK54-SK55+SK56)
C RADIAL DISPLACEMENT RDCFR
SIG_FR = FT*(RFR**2-R2**2)/(RFR**2+R2**2)
RDCFR = RFR*(FT-PR_C*SIG_FR)/EC
C CONSTANT K7
C SK7 = R1*((1.D0-PR_P)/EPR+LOG(RFR/R1)/EC)
FRL = RCR*RFR/(R1**2)
SK7 = R1*((1.D0-PR_P)/EPR+LOG(FRL)/EC)

160
C
SIG_IR = (DPFP_R+SK5-RDCFR-DCFCZ-DCSH)/SK7
C
IF(SIG_IR.GT.FT_L) SIG_IR = FT_L
C
RETURN
END
C
C =================== SUBROUTINE RCRSTRESS3 ========================
C RADIAL CRACKED STRESS
C
SUBROUTINE RCRSTRESS3(R1,R2,DR,NR,SIG_I,RCR_I,RFR,FT,I,XL,XC,
&FINP1)
IMPLICIT REAL*8 (A-H,O-Z)
DIMENSION XC(1),XL(1)
CHARACTER *80,FILENAME,FINP1
C
ID = I
WRITE(FILENAME,'("_RCR",I4.4,".PLT")')ID
FILENAME = TRIM(FINP1)//TRIM(FILENAME)
OPEN(8,FILE = FILENAME)
C
N = NR+1
DO 35 J = 1,N !N
R = R1+DR*(J-1) ! DR = 0.01D0*(R2-R1)
IF(R.GE.RCR_I) GO TO 10
SIG_R = -SIG_I*R1/R
SIG_T = 0.D0
GO TO 30
10 IF(R.GE.RFR) GO TO 20
SKT = FT/((RFR-RCR_I)**3)
SRI = -SIG_I*R1/R
SIG1 = R**3/4.D0-RCR_I*R**2
SIG2 = 1.5D0*R*RCR_I**2-RCR_I**3+RCR_I**4/(4.D0*R)
SIG_R = SRI+SKT*(SIG1+SIG2)
SIG_T = SKT*(R-RCR_I)**3
C SIG_T = SKT*(R**3-3*R**2*RCR_I+2*R*RCR_I**2-RCR_I**3)
GO TO 30
20 IF(RFR.GE.R2) RFR = 0.9995*R2
SIG_FR = FT*(R2**2-RFR**2)/(RFR**2+R2**2) ! SHOULD BE +
C
SIG_R = -SIG_FR*((R2/R)**2-1.D0)/((R2/RFR)**2-1.D0)
SIG_T = SIG_FR*((R2/R)**2+1.D0)/((R2/RFR)**2-1.D0)
C DIS_U = C1*RR/EC*((1.D0-PR_C)+(1.D0+PR_C)*(R2/RR)**2)-C4
C
C 30 WRITE(4,100)R,SIG_R,SIG_T,XL(I),XC(I)
30 WRITE(8,100)R,SIG_R,SIG_T,XL(I),XC(I)
WRITE(3,200)I,R,SIG_R,SIG_T,XL(I),XC(I)
C 30 WRITE(3,200)I,R,SIG_R,SIG_T,XL(I),XC(I)
35 CONTINUE
100 FORMAT(5F12.4)
200 FORMAT(I5,5F12.4)
C
RETURN
END
C
C

161
C =================== SUBROUTINE RFRSTRESS3 ========================
C RADIAL FRACTURE STRESS
C
SUBROUTINE RFRSTRESS3(R1,R2,DR,NR,SIG_IR,RFR,FT,SK2,SK3,SK23,SK4,
&I,XL,XC,FINP1)
IMPLICIT REAL*8 (A-H,O-Z)
DIMENSION XC(1),XL(1)
CHARACTER *80,FILENAME,FINP1
C
ID = I
WRITE(FILENAME,'("_RCR",I4.4,".PLT")')ID
FILENAME = TRIM(FINP1)//TRIM(FILENAME)
OPEN(8,FILE = FILENAME)
C
N = NR+1
DO 35 J = 1,N ! N = 101
R = R1+DR*(J-1) ! DR = (0.01D0*(R2-R1))
IF(R.GE.RFR) GO TO 10 !!!
C
CK1 = -(R1*SIG_IR+SK4)/R
SIG_R = CK1+(FT+SK2*(RFR-0.5D0*R)+SK3*(RFR**2-RFR*R+R**2/3.D0)+
& SK23*(RFR**3-1.5D0*RFR**2*R+RFR*R**2-R**3/4.D0))
SIG_T = FT+SK2*(RFR-R)+SK3*(RFR-R)**2+SK23*(RFR-R)**3
GO TO 30
10 SIG_FR = FT*(R2**2-RFR**2)/(RFR**2+R2**2) ! SHOULD BE +
IF(RFR.GE.R2) GO TO 30
C
SIG_R = -SIG_FR*((R2/R)**2-1.D0)/((R2/RFR)**2-1.D0)
SIG_T = SIG_FR*((R2/R)**2+1.D0)/((R2/RFR)**2-1.D0)
C DIS_U = C1*RR/EC*((1.D0-PR_C)+(1.D0+PR_C)*(R2/RR)**2)-C4
C 30 WRITE(4,100)R,SIG_R,SIG_T,XL(I),XC(I)
30 WRITE(8,100)R,SIG_R,SIG_T,XL(I),XC(I)
WRITE(3,200)I,R,SIG_R,SIG_T,XL(I),XC(I)
C 30 WRITE(3,200)I,R,SIG_R,SIG_T,XL(I),XC(I)
35 CONTINUE
100 FORMAT(5F12.4)
200 FORMAT(I5,5F12.4)
C
RETURN
END
C
C
C =================== SUBROUTINE SHRINKAGE =========================
C
SUBROUTINE SHRINKAGE(FVS,FFCI,VS,FCI,HR,TM,EPS_SH)
IMPLICIT REAL*8 (A-H,O-Z)
C
C STRAIN DUE TO SHRINKAGE, ESH, AT TIME T (AASHTO LRFD 5.4.2.3.3-1)
C
C EPS_SH = 0.D0 ! FOR TIME TM = 0.D0
VS = VS/FVS
FCI = FCI*FFCI ! FROM PSI TO KSI
HR = HR/100.D0
C PRINT*,HR
C FACTORS
FKHS = 2.D0-0.014D0*HR ! HR: RELATIVE HUMINITY IN PERCENT
FKS = 1.45D0-0.13D0*VS ! >= 1 ! VS = VOL/SUP

162
IF(FKS.LT.1.D0) FKS = 1.D0
FKF = 5.D0/(1.D0+FCI)
FKTD = TM/(61.D0-4.D0*FCI+TM)
C
SHRG = FKS*FKHS*FKF*FKTD
C PRINT*,'VS,FKHS,FKS,FKF,FKTD'
C PRINT*,VS,FKHS,FKS,FKF,FKTD
C WRITE(6,*)FKS,FKHS,FKF,FKTD
EPS_SH = -FKS*FKHS*FKF*FKTD*(0.00048D0)
FSTR_SH = -FKS*FKHS*FKF*FKTD*(0.00048D0)
C EPS_SH = -KS*KH*(T/(T+35))*0.51*10**(-3)
C PRINT*,FSTR_SH,EPS_SH,SHRG
C
RETURN
END
C
C
C
C ===============SUBROUTINE INTERPOLATION ==========================
SUBROUTINE INTERP(X1,X,X2,Y1,Y,Y2)
IMPLICIT REAL*8 (A-H,O-Z)
FAC = (X2-X1)/(Y2-Y1)
X = X1+(Y-Y1)*FAC
C B = A+(C-A)*(X2-X1)/(X3-X1)
RETURN
END
C
C =================== SUBROUTINE PINFLECTION =======================
C GET THE FIRST MAXIMUN INFLECTION POINT
SUBROUTINE PINFL(NNS,FSEL,NJD,DATAR,FSE95,DINTP)
IMPLICIT REAL*8 (A-H,O-Z)
DIMENSION DATAR(NNS,NNS),FSEL(NNS,3),DINTP(2,2)
C SET UP TO ZERO
DO I = 1,6
FSEL(I,1) = 0; FSEL(I,2) = 0.D0; FSEL(I,3) = 0.D0
END DO
C
J = 0 ; J1 = 0
DO I = 1,NJD-1
A1 = DATAR(I,3); B1 = DATAR(I+1,3)
IF(B1.GT.FSE95.AND.FSE95.GT.A1) THEN
J = 1+J
FSEL(J,1) = DATAR(I+1,1); FSEL(J,2) = DATAR(I+1,2)
FSEL(J,3) = B1
X1 = DATAR(I,2); X2 = DATAR(I+1,2)
Y1 = A1; Y2 = B1
END IF
END DO
C
DO I = 1,NJD-1
A1 = DATAR(I,3); B1 = DATAR(I+1,3)
IF(B1.GT.FSE95.AND.FSE95.GT.A1) THEN
DINTP(1,1) = DATAR(I,2); DINTP(1,2) = DATAR(I+1,2)
DINTP(2,1) = A1; DINTP(2,2) = B1
END IF
END DO
C

163
RETURN
END
C
C
C =================== SUBROUTINE PLOT LT LINE ======================
C
SUBROUTINE PSLOP(NNS,NJD,DATAR,PLINE,X,Y)
IMPLICIT REAL*8 (A-H,O-Z)
DIMENSION DATAR(NNS,NNS),PLINE(NNS,4)
C SET UP TO ZERO
DO I = 1,6
PLINE(I,1) = 0.D0; PLINE(I,2) = 0.D0
PLINE(I,3) = 0.D0; PLINE(I,4) = 0.D0
END DO
C
DO I = 1,NJD
XLT = DATAR(I,2)
PLINE(I,1) = XLT
SLOP = Y/X
PLINE(I,2) = SLOP*XLT
PLINE(I,3) = X
PLINE(I,4) = Y
END DO
C
RETURN
END
C

164
B.2 Input Data File
See Table 1, Chapter 04, for the input data
Name of the input file: DNSCII12
2, 15.2, 1396.6, 199900.0, 0.30, 1
48.8, 0.15
57.0, 51.0, 51.0
165.0, 305.0, 5500.0
0.50, 0.05, 1000
70.0, 1.0
B.3 Output Data File
ANALYSIS OF TRANSFER LENGTH IN PRESTRESSED CONCRETE
DEPARTMENT OF CIVIL ENGINEERING
UNIVERSITY OF ARKANSAS
Written by: Alberto Ramirez
Email: [email protected]
Professor: Dr. Micah Hale
Email: [email protected]
CUSTOMARY S.I. UNITS
STRAND PROPERTIES
=========================
STRAND NUMBER(S).............. = 2
DIAMETER................................. = 15.20
AREA........................................... = 140.00
INTIAL JACKING STRESS........ = 1396.60
ELASTIC MODULUS….............. = 199900.00
POISSONS RATIO……............... = 0.30

165
CONCRETE PROPERTIES
=========================
COMPRESSIVE STRENGTH AT RELEASE..... = 48.80
ELASTIC MODULUS.......................................... = 31435.65
POISSONS RATIO .............................................. = 0.15
CONCRETE COVER ........................................... = 44.63
LIMIT TENSILE STRENGTH............................. = 4.33
LIMIT COMPRESSION STRENGTH................. = 29.28
THICK-WALLED CYLINDER
==============================
INNER RADIUS.............................. = 7.60
OUTER RADIUS ............................ = 44.63
NUMBER OF RADIAL PARTS …. = 1000
INCREMENT OF RADIUS ............. = 0.03703
PRESTRESSED CONCRETE BEAM
=================================
WIDTH OF THE BEAM ......... = 165.00
HIGHT OF THE BEAM .......... = 305.00
AREA........................................ = 50325.00
INERTIA................................... = 0.390E+09
ECCENTRICITY ..................... = 101.50
VALUES ASSUMED
=================================
NUMBER OF RADIAL CRACK .......... = 6
COEFFICIENT OF FRICTION ............. = 0.50
WIDTH OF THE CRACK...................... = 0.05
NUMBER OF ITERATIONS ................ = 1000
COMPLETE CRACK AND FRACTURE ZONE ANALYSIS
ANALYSIS TYPE: THIRD ORDER
STRAIN DUE TO SHRINKAGE: -2.06413039939869836E-005
RESULTS FROM THE ANALYSIS

166
=========================
INITIAL PRESSTRESS ............................... = 1396.6
PRESTRESS AT 95% AMS METHOD….... = 1326.8
CONCRETE STRENGHT AT RELEASE ... = 48.8
CALCULATED TRANSFER LENGTH....... = 612.2
NUMBER OF RADIAL CRACKS................ = 6