Influence of compost and humic substances on soil and ...hss.ulb.uni-bonn.de/2012/2902/2902.pdf ·...
138
Institut für Nutzpflanzenwissenschaften und Ressourcenschutz (INRES) Pflanzen- und Gartenbauwissenschaften Universität Bonn, Germany MARIA MERCEDES DEL PILAR MARTINEZ SALGADO 2012 Influence of compost and humic substances on soil and fruit quality in Table Grape under intensive management in Chile
Transcript of Influence of compost and humic substances on soil and ...hss.ulb.uni-bonn.de/2012/2902/2902.pdf ·...

Institut für Nutzpfl anzenwissenschaften und Ressourcenschutz(INRES) Pfl anzen- und Gartenbauwissenschaften
Universität Bonn, Germany
MARIA MERCEDES DEL PILAR MARTINEZ SALGADO
2012
Influence of compost and humic substances on soil and fruitquality in Table Grape under intensive management in Chile

Institut für Nutzpfl anzenwissenschaften und Ressourcenschutz(INRES) Pfl anzen- und Gartenbauwissenschaften
Universität Bonn, Germany
Inaugural-Dissertation
zur
Erlangung des Grades
Doktor der Agrarwissenschaften
(Dr. Agr.)
der
Hohen Landwirtschaftlichen Fakultät
der
Rheinischen Friedrich-Wilhelms-Universität
zu Bonn
vorgelegt am 29.02.2012
von MARIA MERCEDES DEL PILAR MARTINEZ SALGADO
aus Bogotá (Colombia)
Influence of compost and humic substances on soil and fruit quality in Table Grape under intensive management in Chile

Referent: Prof. Dr. M.J.J.Janssens
Korreferent: Prof. Dr. Georg Noga Prof. Dr. Rodrigo Ortega
Tag des mündlichen Prüfung: 25. April 2012Erscheinungsjahr: 2012


DEDICATION
To Simon and Nico,to sow more tomatoes and see more frogs this spring,
and especially to bring us more love between us, for others and for the planet….
mami

ACKNOWLEDGMENTS
To God and my lucky stars to guide my steps.To Leley and Magdalena, for showing me the path of love, persistance and unconditional surrender.To Mena, Gaby, Rafa, Molo, Vilma, for their love and to be near daily living this experience with us.To Pablo for showing me the way beyond the imagination.To Pepa for showing me earthworms, soil, and the world from a pot.To René to print my life with soil and bugs.To Germán for showing patience and waiting, but I have a long way to learn.To Angela, Ana Karina, Fernanda Ma, Aura, Viviana, Luciana for being there, always strong.To Gelka, Tilo and Elias, Anke, Monika, Jean, for being such a network of child and family support during these years in Germany.Prof. Janssens for having believed in the project, and my ideas, and his contribution to grape´production in Chile.Prof. Ortega, have realized the project, for their support, dedication and patience with this microbiologist with soul of soil.To Walter, Luis, Flavio, from Hacienda El Varillar, Ovalle-Chile, for their help and dedication.To Beatriz, Jimena, Anamaria, Mauricio, Titi, Carolina and everyone in the Center for Advanced Technology for Agriculture CATA, Federico Santa Maria University of Chile.To my colleagues, director and support staff of the Horticulture Institute- INRESTo Dr. Monika Wimmer and Prof. Dr. Goldbach to open the doors of their laboratories for experimentation.To The staff of soil and organic matter in experimental Zaidin in Granada for their contributions.To Those who left, but taught me to live betterA very special thanks to Juan, Simon and Nicolas for their love, patience and eternal support.
ERKLARUNG
Ich versichere, dass ich diese arbeit selbstandigverfasst habe, keine anderen Quellen undHilfsmittel als die angegebenen benutz und dieStellen der Arbeit, die anderen Werken demWortlauf oder dem Sinn nach entnommen sind,kenntlich gemacht habe.Die Arbeit hat in gleicher oder ahnlicher Formkeiner anderen Prufungsbehorde vorgelegen.
Bonn, den 29.02.12

SUMMARY
The objective of this study was to evaluate the effects of the application of organic amendments (compost and humic extracts) on some soil quality indicators, agronomic variables, and the exportable yield in table grape (Vitis vinifera, var.Thompson seedless) grown in an inceptisol soil in the Limari valley in Chile Experimental research was performed in three stages: 1) production of compost from grape pomace and the extraction of humic substances from it, 2) evaluation of the compost and humic extract as organic amendments in pots, and 3) evaluation of humic extract under fi eld conditions. Compost was prepared using grape pomace byproduct from the production of pisco and goat manure in different proportions (9 treatments). The co-composting process was monitored during a 220-day period. The optimal treatment was defi ned according to Chilean National Standard and Compost Council USA standards for compost, including: high humifi cation ratio (humic acids/fulvic acids: HA/FA), low concentration of heavy metals and microbial pathogens, high germination percentage (%G), and the incorporation of a considerable proportion of grape pomace. The compost produced under optimal treatments was used to obtain humic extract (liquid humus) by alkaline extraction (extraction ratio compost/extractant: 1:10 p/v). In the second phase of the research compost from grape pomace, liquid humus, a commercial microbial inoculant, and chemical NPK fertilizers were assessed under experimental conditions. Four C-rates were evaluated for each organic amendment: Compost—0, 500, 1000 and 2000 kg C/ha, and liquid humus—0,100, 200 and 400 kg C/ha; and both organic materials at their maximum C-rates were also evaluated in the absence of chemical fertilization. Medium chemical fertilization levels were used. The fi eld phase of the experiment was conducted in a 1-year old table grape orchard under drip irrigation. Using a factorial experimental design, 16 treatments were evaluated during two seasons using liquid humus at four C-rates (0, 100, 200 and 400 kg C/ha) and chemical fertilizer with nitrifi cation inhibitor at four N-rates (0, 30, 60 and 120 kg/ha). Chemical, biochemical, and microbiological soil properties, as well as fruit quality and exportable yield were determined each season and plant tissue was analyzed. A methodology to select a minimum data set size for establishing compost, soil, and fruit quality indices was developed using regression and frequency analysis. In each case treatments were considered, as populations and changes in different properties were evaluated over time. Three ecosystems exhibiting different soil types were used as a base line: 1) a xerophytic forest on a mountain slope (Mountain baseline, BLM), 2) a riparian vegetation site on the Rio Claro (River baseline, BLR), and 3) a site with uncultivated soil in the same grape fi eld (AES).
The results indicated strong root development in plants treated with compost and inoculant application (p<0.029), obtaining more root dry matter than the control treatment; probably due to the production of indole acetic acid (IAA) and continuous mineralization of organic matter which increased nutrient availability. All compost treatments exhibited signifi cant increases in the enzymatic activities of β-glucosidase (p<0,0001), acid phosphatase (p<0,001), and alkaline phosphatase (p<0,0001), that were signifi cantly higher than the liquid humus treatments (56,6>13.8 UBG, 228,1>103,0 acid UP and 327,9>100,6 alkaline UP, respectively). This can be explained by the fact that compost increased total C, N and P concentrations, which stimulated enzymatic activity. In terms of organic matter content and enzymatic activity, signifi cant differences (p<0,05) were found among the three baselines considered: BLR>BLM>AES. The enzymatic activity of alkaline phosphatase and β glusocidase, and the content of humic substances (HS: humic + fulvic acids) were selected from the minimum set of variables to explain changes in the soil where table grape was grown under fi eld conditions. The application of liquid humus resulted in signifi cant (p<0,01) increases of: exportable harvest mass (from 13 T ha-1 to 16 T ha-1), water-soluble carbon, and humic substances. None of the traditional fruit quality parameters exhibited changes, the still content of total chlorophyll and polyphenoloxidase were proposed as potential indicators of fruit quality under the conditions found in this experiment.
Key words: organic amendment, liquid humus, soil and fruit quality indicators, table grape

ZUSAMMENFASSUNG
Ziel dieser Untersuchung war es, die Auswirkungen von organischen Zusätzen (Kompost und Humusextrakte) auf einige Indikatoren der Bodenqualität, der agronomischen Variablen und dem exportierbaren Ertrag von Tafelweintrauben (Vitis vinifera, var.Thompson seedless) zu untersuchen, die in einem Inceptisol-Boden in Limari Tal in Chile angebaut wurden. Eine wis-senschaftliche Untersuchung in drei Phasen wurde durchgeführt 1.) Herstellung von Kom-post aus Traubentrester und den daraus extrahierten Huminstoffen, 2.) die Bewertung von Kompost und Humusextrakten als organische Zusätze in einem Topfexperiment und 3.) die Auswirkungen von Humusextrakten im Freilandversuch. Der Kompost wurde aus Trauben-trester der Pisco Industrie und aus Ziegendung in unterschiedlichen Verhältnissen hergestellt (9 Behandlungen). Der Prozess der Co-Kompostierung wurde über einen Zeitraum von 220 Tagen überwacht. Die beste Behandlung wurde nach Vorgaben der nationalen chilenischen Standards und den Richtlinien des Compost Counsil USA festgelegt. Diese beinhalten: eine hohe Humifi zierungsrate (Huminsäuren/Fulvinsäuren: HA/FA), eine niedrige Konzentration an Schwermetallen und mikrobiellen Krankheitserregern, ein hoher Prozentsatz an Keimfähigkeit (%G) sowie die Verwendung eines beträchtlichen Anteils Traubentrester. Der aus den bes-ten Behandlungen entstandene Kompost, wurde zur Gewinnung von Huminextrakt (fl üssigen Humus) durch alkalische Extraktion (Extraktionsquotient Kompost/Extraktionsmittel: 1:10p/v) verwendet. In der zweiten Phase wurde Kompost aus Traubentrester, fl üssigem Humus, einem kommerziellen mikrobiellen Inokulanten und chemischem NPK Dünger für das Topfexperiment ausgewählt. Für jeden organischen Zusatz wurden jeweils 4 C-Raten getestet. Diese waren beim Kompost: 0, 500, 1000 y 2000 kg C ha-1 und beim fl üssigen Humus: 0,100, 200 und 400 kg C ha-1; beide organischen Substanzen mit ihrer jeweils höchsten C-Rate wurden ebenfalls ohne den Zusatz eines chemischen Düngemittels untersucht. Gedüngt wurde im mittleren Bereich. Ein Freilandversuch wurde auf einer einjährigen Tafeltraubenplantage durchgeführt, wobei die Wasserversorgung mittels Tropfbewässerung gewährleistet wurde. Innerhalb eines faktoriellen Experiments wurden 16 Behandlungen über einen Zeitraum von 2 Anbaujahren durchgeführt. Flüssiger Humus wurde dabei in 4 C-Raten (0, 100, 200 und 400 kg C ha-1 ) und der chemische Dünger mit Nitrifi kationshemmer in 4 N-Raten (0, 30, 60 und 120 kg ha-1) verwendet. In jedem Anbaujahr wurden neben der Analyse des Pfl anzengewebes, die chemischen, biochemischen und mikrobiologischen Bodeneigenschaften sowie Fruchtquali-tätseigenschaften und der exportierbare Ertrag bestimmt. Eine Methodik zur Auswahl eines Mindestdatensatzes wurde angewendet, um Indizes für die Qualität von Kompost, Boden und der Frucht mittels Regressions- und Frequenzanalyse zu erstellen. Dabei wurden die jewei-ligen Behandlungen berücksichtigt und demnach die Populationen und Veränderungen der verschiedenen Eigenschaften über die Zeit bewertet. Drei Ökosysteme mit unterschiedlichen Böden dienten als Ausgangsbasis: 1.) Xerophtenwald im Gebirge (Baseline Gebirge/BLM), 2.) Ufer nahe Vegetation am Rio Claro Fluss (Baseline Fluss, BLR), und 3.) unkultivierter Boden (AES).
Die Ergebnisse zeigten eine starke Wurzelentwicklung bei den Pfl anzen, die mit Kompost und Inokulanten (p<0,029) behandelt worden sind. Es konnte eine höhere Wurzeltrockenmas-se als in der Kontrollbehandlung festgestellt werden. Dies ist womöglich auf die Produktion von Indolessigsäure (IAA), der kontinuierlichen Mineralisierung von organischem Material und der dadurch verbesserten Nährstoffverfügbarkeit für die Pfl anze zurückzuführen. Das konn-te durch die Zunahme der enzymatischen Aktivitäten von β-Glucosidase (p<0,0001), saurer Phosphatase (p<0,001), und alkalischer Phosphatase (p<0,0001) in allen Kompost-Behan-dlungen belegt werden. Sie lagen deutlich höher als bei den Behandlungen mit fl üssigem Humus (56,6>13,8 UBG, 228,1>103,0 saures UP bzw. 327,9>100,6 alkalisches UP). Dies kann dadurch erklärt werden, dass durch den Kompost die Gehalte des Gesamt-C, -N und -P gestiegen sind, wodurch die enzymatische Aktivität angeregt wurde. Bezüglich des Gehaltes an organischem Material und der enzymatischen Aktivität konnten signifi kante Unterschiede zwischen den drei in Betracht gezogenen Ökosystemen festgestellt werden: BLR>BLM>AES.

Unter der Berücksichtigung einer Mindestanzahl von Variablen wurden die enzymatischen Aktivität der Alkalischen Phosphatase und der β-Glucosidase sowie der Huminstoffgehalt (HS: Huminsäure und Fulvinsäure) bestimmt, um anhand dieser Veränderungen des Bodens bes-timmen zu können auf dem die Tafelweintrauben unter Freilandbedingungen angebaut wor-den sind. Die Anwendung von fl üssigem Humus führte zu einer signifi kanten Zunahme des gesamten exportierbaren Ertrags (von 13 T ha-1 auf 16 T ha-1), sowie zu einer Zunahme von organischem Kohlenstoff und Huminstoffen im Boden. Keine der herkömmlichen Parameter zur Bestimmung der Fruchtqualität wies Veränderungen auf, dennoch wurden unter diesen Versuchsbedingungen der Total Chlorophyll - und Polyphenoloxidasegehalt als potentielle In-dikatoren zur Bestimmung der Fruchtqualität vorgeschlagen.
Schlüsselbegriffe: organischer Zusatz, fl üssiger Humus, Indikatoren für Bodenqualität und Fruchtqualität, Tafeltraube

11
TABLE OF CONTENTS
DEDICATION 5ACKNOWLEDGMENTS 6ERKLARUNG 7SUMMARY 8ZUSAMMENFASSUNG 9ABBREVIATIONS 17SYNOPSIS OF THE STUDY 19CHAPTER I INTRODUCTION 20CHAPTER IIOBJECTIVES AND HYPOTHESIS 22CHAPTER IIILITERATURE REVIEW 233.1 Table grape 233.1.1 Table grape in Chile 233.1.2 Climatic conditions and phenologycal stages 243.1.3 Vitis vinifera Thompson seedless, agronomical and cultural labors 243.1.4 Soil characteristics 253.1.5 Nutrient requeriments 253.2 Organic amendments 263.2.1 Compost as organic amendment 273.2.2 Humic substances as organic amendments 303.3 Soil quality 313.3.1 Defi nition 313.3.2 Soil quality indicators 323.3.2.1 Biological indicators 343.3.2.2 Microbial indicators 343.3.2.2.1 Metabolic substances 353.3.2.2.2 Functional Groups of microorganisms as soil indicators 393.3.3 Selection of indicators 413.3.4 Role of soil organic matter and associated indicators 423.3.5 Soil indicators and environmental changes 433.3.6 Soil quality index 45CHAPTER IVMATERIALS AND METHODS 474.1 Location 474.2 Composting Process 474.2.1Compost sampling 484.2.2 Analytical determinations 484.2.2.1 Microbiological analysis 484.2.2.2 Enzymatic activity 494.2.2.3 Chemical and maturity properties 494.2.3 Statistical Analysis 49

12
4.3 Evaluation of C rates in pots 504.3.1 Experimental design 504.3.1.1 Extraction of humic substances 514.3.1.2 Microbial Inoculant Production 514.3.2 Measured variables 524.3.2.1 Soil variables 524.3.2.2 Agronomic variables 524.3.2.3 Statistical analysis 524.4 Crop Production 534.4.1 General description 534.4.2 Fertilization 544.4.3 Measured tissue variables 554.4.4 Measured soil variables 554.4.5 Measured Yield and Berry Quality Characteristics 564.5 Selection of compost, soil and fruit variables for a quality 56CHAPTER VRESULTS AND DISCUSSION 585.1 Compost process monitoring 585.1.1 Compost Chemical and physical characteristics 585.1.2 Sanitary parameters and metal content 605.1.3 Microbial populations 605.1.4Compost maturity indices 645.1.5 Enzymatic activities and humic and fulvic acids as maturity indicators 655.1.6 Sensitivity of of each property for representing changes during maturation process 695.2 Evaluation of C rates in pots 715.2.1 Quality of the organic materials used 715.2.2 Effect of organic matter application on soil properties 725.2.2.1 Effect of Compost application on Biochemical Properties 745.2.2.2 Effect of compost application on Microbial Population 765.2.2.3 Effect of compost application on agronomic variables: Effect on root development
77
5.2.3 Sensitivity of each property for representing changes in management 835.3 Evaluation of C and N rates in commercial Table Grape yield 855.3.1 Changes of soil properties over the base line. 855.3.1.1 Comparison among base lines at the beginning of the experiment 875.3.1.2 Changes in time and by management over the agroecosystem base line. 895.3.2 Effect of C and N rates on soil properties 915.3.2.1 Correlation among measured soil variables 955.3.3 Effect of C and N rates on nutritional status of table grape plants 1015.3.4 Effect of C and N rates on fruit quality 1055.3.5 Compost, soil and fruit quality Minimum Data Set 108CHAPTER VIGENERAL CONCLUSIONS 111REFERENCES 114ANNEX 1 135ANNEX 2 136

13
LIST OF TABLES
Table 3.1. Grape Varieties Production in Chile, Season 2010 24Table 3.2. Main diseases affecting table grapes in Chile 25Table 3.3. Nutrient requeriments for Thompson seedless in Chile 26Table 3.4. Heavy Metals Contents of Raw materials and Compost* 28Table 3.5. Microbiological parameters for compost - Chilean Standard 28Table 3.6. Maturity Index Proposed by CCQC 29Table 3.7. Minimum set of physical, chemical and biological properties for soil quality defi nition.
33
Table 3.8. Microbial indicators used to determine soil quality 35Table 4.1. Composition of evaluated treatments 48Table 4.2. Evaluated treatments using different organic ammendments in Pot experiment
50
Table 4.3. Distribution of treatments in Field experiment 54Table 4.4. Fertilization program during the fi eld experiment 55Table 5.1. Chemical properties of materials after 220 days of composting 59Table 5.2. Metal content, percent germination and sanitary parameters measured in compost
60
Table 5.3. Correlation analysis among the compost evaluated variables 63Table 5.4. Comparison between the treatments evaluated in terms of the biochemical, chemical and microbiological parameters measured compost at fi nal time, 120 days of compostingTable 5.5. Ranking of all standardized compost variables measured during maturation process
70
Table 5.6. Selected models1, for humic substances based on biochemical properties
71
Table 5.7. Chemical and biochemical characteristics of soil, compost and liquid humus used for the pot experiment
72
Table 5.8. Effect of the applied treatments on soil chemical properties1 - pot experiment
73
Table 5.9. Effect of compost applications on soil enzymatic activities1 75
Table 5.10. Effect of compost applications on microbial populations 76Table 5.11. Pearson correlation analysis among measured agronomic and soil parameters in pot experiment
79
Table 5.12. Frequency analysis for all soil properties in pot experiment* 84Table 5.13. Comparison among base line soils in terms of chemical, biochemical and microbiological characteristics
87
Table 5.14. Change frequency, with respect to the base line, for the measured properties in the 16 evaluated AES
90
Table 5.15. Pearson correlation Soil properties, fi rst sampling -6 months(n=32) 97Table 5.16. Pearson correlation Soil properties, second sampling -12 months(n=32)
98
Table 5.17. Pearson correlation Soil properties, third sampling -18 months(n=32)
99

14
Table 5.18 Macro and micronutrient foliar content (2d. season) 102Table 5.19. Pearson correlation analysis among measured foliar parameters in fi eld experiment (n=32). fi rst season
103
Table 5.20. Pearson correlation analysis among measured foliar parameters in Field experiment second season (n=32)
104
Table 5.21 Fruit quality parameters for second harvest (2011) 106Table 5.21a Pearson correlation for fruit properties (2d. season) 106Table 5.23 Absolute weights for biochemical properties selected for estimating matrix quality
109
Table 5.24. Foliar analysis 2d. year of production 135Table 5.22. Pearson Correlation among all properties measured in fi eld experiment
136

15
LIST OF FIGURES
Figure 3.1 Humifi cation process from plant residues. Polymeric Model of HS 31Figure 3.2 Dinamics of enzymes in soil 37Figure 3.3 β Glucosidase activity 38Figure 3.4 Phospahatases activity, liberation of phosphate group 38Figure 3.5 Phosphate solubilizer bacteria, in selective culture media 41Figure 3.6 Role of Organic Matter on soil properties 42Figure 3.7 Soil quality and agricultural sustainability 44Figure 3.8 Possible temporal trends in dynamic soil quality assessments 45Figure 4.1 Location of Bauzá Table Grape Production 47Figure 4.2 Raw material used in co-composting process 48Figure 4.3 Pot experiment 51Figure 4.4 Liquid humus obtained by fractionation method 51Figure 4.5 Limits of Field experiment and Base Lines location 53Figure 4.6 Field experiment distribution 3b. Inceptisol soil detail 54Figure 4.7 Packing clasifi cation in Varillar, Bauza Company 56Figure 4.8 Potential Outcomes respect to the base line 57Figure 5.1 Temperature evolution during the mineralization process of composting 58Figure 5.2 a)Compost piles and b) Measurement of the temperature of pile 59Figure 5.3 Microbial groups behavior along the composting process. Average of 9 treatments.
61
Figure 5.4 Enzymatic activities behavior along the composting process presented by all the different pile treatments evaluated in average
66
Figure 5.5 Humic acid (HA), Fulvic acid (FA), humic substances (HS) and HA/FA ratio evolution during the composting process (average of 9 treatments)
68
Figure 5.6 E4/E6 ratio in compost after 60 days 68Figure 5.7 Corrected weights of compost properties obtained by regression and frequency response analysis
70
Figure 5.8 Variation of Soil Organic Matter (SOM) on pot experiment, as function of C rate applied
74
Figure 5.9 Variation of Water Soluble Carbon (WSC) as function of C rate applied 74Figure 5.10 General aspect and detail of the pot experiment 77Figure 5.11 Root density as function of C rate from compost 77Figure 5.12 Effect of Compost and Inoculant on (a), Soil chemical properties, (b) enzymatic activity and (c) effect of microbial inoculants root density by orthogonal contrast analysis
82
Figure 5.13 Corrected weights of soil properties obtained by regression and frequency response analysis (Pot experiment)
84
Figure 5.14. b. Field experiment under drip irrigation system. Uncultivated soil used as baseline – Agroecosystem baseline (AES)
85
Figure 5.15 Valle del Limarí, Chile 86Figure 5.16 (a) Riparian vegetation –River Base line (BLMR), (b) Mountain Base line (BLM), Xerophilic forest, (c) detail of “Espinales” in Limarí Valley
86
Figure 5.17a Comparison among base line soils in terms of biochemical properties 88Figure 5.17b Comparison among base line soils in terms of chemical properties 88

16
Figure 5.18 Corrected weights of soil properties obtained by regression and frequency response analysis (Field experiment)
91
Figure 5.19 Average E4/E6 ratio of humic substances (HS) fraction with different Carbon (C) rate
92
Figure 5.20 Effect of C application as humic extract on selected soil properties at three sampling dates
93
Figure 5.21 Effect of C and N on soil properties fi eld experiment 94Figure 5.22 Changes in chemical, biochemical and biological activities in soil – Field experiment. a) alkaline phosphatase, b) β Glucosidase c) cellulolytic microorganisms, d) pH, e) humic substances and f) water soluble carbon
100
Figure 5.23 Relation between HS in soil and a)WSC concentration and b) β Glucosidase in table grape along 18 months
100
Figure 5.24 Effect of C rate on a) Nitrate reductase activity (Nred) an b) Total Chlorophyll
105
Figure 5.25 Harvest detail. Second season 107Figure 5.26 Effect of C and N rate on exporting yield. a) carbon rate – fi rst season, b) N rate fi rst season, c) C rate second season (mean of 4 N rates)
107

17
ABBREVIATIONS
C Total CN Total NAcP Acid phosphataseActy ActinomycetesAES Base line Agro ecosystem
uncultivated soilAGS grape agroecosystemAlkP Alkaline phosphataseAmyl Amylolytic microorganismsANOVA Analysis of varianceAnt AnthocyaninATP Adenosine triphosphateAvail N Available NitrogenB BoronBact Bacteriaβ Glu β-glucosidasesBLM Mountain baselineBLR Riparian vegetation –RiverBase
lineCa CalciumCCQC Compost Council Quality of
CaliforniaCEC Cation exchange capacityCellul Cellulolytic bacteriaCQI Compost quality indices Cu CopperCV Coeffi cient of variationChl a Chlorophyll aChl b Chlorophyll bDDGE Denaturation Gradient Gel
ElectrophoresisDM Dry matterDW Dry weightDOC Dissolved organic carbonDumas Combustion methodEC Electrical conductivityEGM Exhausted grape marcER Erosion factorF&Y Fungi and yeastFA Fulvic acidsFO Field operation factorFQI Fruit quality index
GM Goat manureGP Grape pomaceGS Grape stalksHA Humic acidsHE Humic extractHM Horse manureHS Humic SubstancesISCSA Increment of shoot cross
sectional areaK PotassiumLSD Least signifi cant differenceMDS Minimum data setMetN Metabolized nitrogenN NitrogenMPN Must Probable NumberN-NH4 Ammonium nitrogenN-NO3 Nitrate NitrogenNRed Nitrate reductaseNTCh National Technical StandardOlsP Olsen PhosphorusOM Organic matterOS Oat strawP PhosphorusP sol Phosphate Solubilizing
BacteriaPCA Principal Component AnalysisPDA Potato dextrose AgarPR Pruning residuesPPO PolyphenoloxidaseProteo Proteolytic bacteriaqCO2 Respiration QuotientRD Root densitySCI Soil Conditioning IndexSCSA Shoot Cross Sectional AreaSOC Soil organic carbonSOM soil organic matterSPAD Chlorophyll by SpadSQ Soil QualitySQI Soil quality index TA Total Acidity

18
TChl Total ChlorophyllTD Trunk diameterTN Total NitrogenU UreasesUβGLU β GLU Units: μg p-nitro
phenol*g*h-1
UP Phosphatase Units: μg p-nitro phenol*g*h-1
UPPO Polyphenoloxidase UnitsUU Urease Units: μg NH4*g
-1*h-1
UV-VIS Ultra violet-visibleWHC Water holding capacityWSC Water soluble carbonYFR Yeast and fermentation
residuesZn Zinc

19
SYNOPSIS OF THE STUDY
Chapter 1: Introduction
This chapter provides a brief background leading to the development of this research. Emphasis was made on the use of solid wastes from pisco industry in Chile as a source of raw material to obtain high-quality compost and organic amendments as liquid humic acids. A review on the selection of quality indices for the evaluation of the effects of the application of organic materials in soil and quality of table grapes is presented.
Chapter 2 Objectives and hypothesis
This chapter considers the investigation questions as hypothesis and the objectives proposed to demonstrate them.
Chapter 3Literature Review
It considers generalities of the table grape crop, its nutritional requirements, climatic conditions, and agronomical characteristics. This chapter includes a review about organic amendments, uses in table grape orchards, composting process, compost quality indicators, and some previous experiences about the use of compost as amendment in table grape.
Chapter 4 Methodology
This chapter includes the optimization of composting process from grape marc, the humic substances extraction (humic and fulvic acid, HFa). It also includes the methods for the evaluation of compost and humic extract in table grape, under controlled conditions and the evaluation of humic extract as C source in table grape under fi eld conditions for two seasons. Finally, it describes the method to select chemical, physical, microbiological and biochemical properties as a minum data set to be part of a quality index for compost, soil, and fruit in table grape.
Chapter 5 Results and Discussion
This chapter was organized in four parts. The fi rst includes the process, extraction, and quality parameters of compost and liquid humic acid; the second includes the results of the pot experiment. The third part describes the results of the 2-year fi eld experiment; the fourth and last part, describes the results of the methodology proposed to select a minimum data set to explain soil and fruit quality, based on regression and frequency analysis.
Chapter VIGeneral Conclusions
This chapter includes the general conclusions of the investigation as well as the suggestions for future research related to the defi nition of compost and soil quality indicators in table grape.
References

20
CHAPTER I
INTRODUCTION
Table grape, is one of the main exporting crops in Chile, ranking third worldwide, being a major producer along with Mexico and South Africa. The crop is grown from the third to the seventh regions of Chile, covering a long territory with several grape varieties produced (ASOEX, 2010). The grape varieties grown in Chile are mostly Thompson Seedless, Red Globe and Crimson Seedless. For Thompson seedless, the optimum yield range is between 19 and 32 ton ha-1 with an average of 27 ton ha-1, while the normal yield range is between 15 - 28 ton ha-1
with an average of 21 ton ha-1 (ASOEX, 2010).
The variety Thompson Seedless has approximately 15.971 hectares planted out of 62.411 ha of table grapes (Ministerio de Agricultura de Chile, 2009,Agricultural Census, 2007 ). Coquimbo region (IV region in Geographical distribution of Chile), is a major grape producer, including wine, table grape, and Muscatel grape used for Pisco, the national spirit.
Pisco is a distilled spirit and in its process, a large amount of solid residues are produced. These residues include grape marc, exhausted marc, and grape raquises, all of which are materials with low pH and high content of phenolic compounds, which may inhibit microbial degradation activity in composting process. Compost is applied to grape crops with the idea of improving yield and quality, but normally grape marc is usually disposed on the roads, particularly in dry seasons for dust control. Grape marc has very good components in terms of nutrients, organic matter content (OM) and has shown very good effects as organic amendment (as compost or in co-composting process). In Chile, some vineyards have implemented the composting process from grape marc and bunch raquises, producing about 800 tons of compost per season, with a percentage of organic matter that ranges between 69 and 80%. The compost is used for land reclamation, at rates of approximately 10 ton ha-1 (Undurraga, 2003). Compost, humic acid, and biofertilizers (yeast) have been used to reduce nitrogen fertilizer in Thompson seedless grapes. In this respect, it was found that the humic acid lowered leaf nitrogen levels, when in combination with biofertilizer, but the presence of humic acids in combination with residues increased the level of nitrogen in leaves (Eman et al., 2008).
Paradelo et al. (2009) demonstrated the effect of humic acid application on root and humifi cation process in soil; they studied the following rates: of 4%, 8% and 16% compost, in volume, respectively. Compost at the highest rates, increased biological activity and nutrient availability, and in turn increased microbial biomass and enzyme activity. On the other hand, Fernandez et al. (2008), demonstrated carbon degradation during composting with organic wastes from distillery industry, yielding as a result the so called “exhausted grape marc” (EGM). This exhausted grape marc is very rich in nitrogen whose compactness can be adjusted mechanically by mixing during the co-EGM composting with other organic material with higher carbon content. The fi nal product is a compost which include all solid wastes from distillery, bunch stems (grape stalks-GS), with proper pH, porosity, C/N which allows for optimum composting.
Compost could be used to obtain other C fractions as humic substances, through an alkaline extraction process. This liquid amendment improves different fractions of C, including humic and fulvic acids, water soluble fractions, and C reserves as humic substances for soil microorganisms.
Changes in soil could be measured and quantifi ed using different visual, chemical, biochemical and biological soil properties as indicators of soil quality. Soil quality indicators have been

21
defi ned from the ecological, economic and social development standpoints; they usually take into account soil properties or associated crops that can be used to evaluate the dynamic changes in agro ecosystems. These indicators are not well defi ned, and must be determined for every type of soil and local conditions (Bouma, 2002). Changes in soil quality may be measured through quality indices including different indicators, to make more objective the soil quality determination, compared with a given base line.
Soil quality indices have been developed to try to explain soil quality as a principal target for ensuring the sustainability of the environment and the biosphere. Literature shows a great number of soil quality indices for both, agro-ecosystems and natural or contaminated soils, and the most straightforward index used in the literature is the metabolic quotient (qCO2) (respiration to microbial biomass ratio). This index is widely used to evaluate ecosystem development, disturbance or system maturity; however this integrates only two parameters and provides insuffi cient information about soil quality or degradation; most indices are only defi ned according to chemical, biological and biochemical soil properties but not according to crop yield or fruit quality. For this, lately there has been a wide development of multiparametric indices. This tool clearly establish differences among management systems, integrating different parameters (soil, harvest and agronomical characteristics), looking for parameters with high sensitivity, and which are easy to defi ne such as pH, organic matter, microbial biomass C, respiration or enzymatic activity (Ortega and Santibañez, 2007).
The major part of multiparametric indices has been established based on either, expert opinion (subjective), or using mathematical–statistics methods (objective). Biochemical indicators are very sensitive to changes in soil management and have not been widely used yet to establish soil or harvest quality indices. Some of these methods can provide information about what the roles of specifi c microorganisms and their enzymes are in key processes related to soil functionality and help producers defi ne the fruit quality earlier than with traditional physico-chemical analysis.
With this background, I intended to assess, in a table grape crop Thompson seedless variety, the effect of different organic amendments, on soil properties, agronomic productivity, and fruit quality and to determine a minimum set of data that can give information regarding the quality of soil and fruit. The objectives and hypothesis are presented in the next chapter.

22
Four research hypotheses were proposed for the present study:
• It is possible to defi ne compost maturity, in terms of humic substances content, using functional groups of hydrolytic microorganisms, hydrolytic enzymes, and C/N characteristics.
• Applying liquid humus can be equivalent or better than using compost in terms of its effects on soil and fruit properties.
• Changes in soil quality indicators take place at different speeds and directions depending on organic matter application levels and compared with base line soils.
• It is possible to defi ne a minimum data set to create composed quality indices based on a linear combination of several compost, soil, and fruit properties.
To prove these hypotheses, the following objectives were proposed:
General
To determine the effects of compost and humic substances on soil and fruit quality in Table Grape under intensive management.
Specific
1. Organic Matter: 1.1 To evaluate the enzymatic activity of β – glucosidase, acid and alkaline phosphata-ses, and urease, as potential biochemical indicators of organic matter quality. 1.2 To defi ne the best extraction procedure of humic and fulvic acids from compost. 1.3 To select a set of variables that could be part of a maturity index for compost.
2. Soil: 2.1 To evaluate the effect of OM type and rate on soil quality in table grape. 2.2 To defi ne, quantify, rank, and compare different soil properties that could be used as soil quality indicators, compared with a base line.
3. Agro ecosystem 3.1 To defi ne a set of variables that could be part of quality indices for soil and fruit.
CHAPTER II
OBJECTIVES AND HYPOTHESIS

23
3.1. Table grape
The vine is a species of the Ampelidaceae family. Vitis vinifera L. has its origin at the southern regions of the Caspian Sea in Europe (Armenia), as wild vines in forests of the Caucasus and Sardinia (NRC, 2011)
Table grape, is one of the main export crops from Chile, ranking third worldwide and being a major player along with Mexico and South Africa. It is grown from the third to the seventh region Chile, covering a vast territory and variety of grapes produced ( Association of Exporters of Chile ASOEX, 2010). The most common varieties found in Chile are Thompson Seedless, Crimson Seedless, Red Globe, Flame Seedless, Superior Seedless, Autumn Royal, Ribier and Princess (ASOEX, 2010); the fi rst with the highest rate of export with 27% of the total, followed by Red Globe (22%) and Crimson Seedless (18%). Thompson seedless has between 15.971 and 17.898 hectares planted out of a total of 62.411 ha of table grapes (Agriculture Census, 2007); approximately 85% of them are in production (Ministerio de Agricultura, Chile, 2009).
3.1.1. Table grape in Chile
The fi rst vines were introduced into the Captaincy General of Chile between 1541 and 1554 (Chilevinos, 2011) and the fi rst plantings and harvest were made in the city of La Serena (capital of Coquimbo Region) in 1548- 1551.
The table grape production in Chile is about 1.250.000 tons, over the 893,758 tons of the United States, which is one of the leading competitors. Thompson Seedless, Red Globe, and Crimson Seedless are the most exported varieties with 27, 22, and 18%, respectively (ASOEX, 2010). The average productivity of table grapes is 14,4 ton ha-1 (study area: Atacama, Coquimbo, Santiago and O’Higgins). In 2010, table grapes together with apple, accounted for 67% of the country’s fruit exports, with table grapes representing 36,1% of the total 847.680 tons exported during the period 2008-2009 (ASOEX Chile 2010).
The grape varieties grown in Chile are mostly Thompson Seedless, Red Globe and Crimson Seedless (table 1). With regards to yield, the optimum range is between 19,3 and 31,7 ton ha-1 with an average of 27 ton ha-1, while the normal yield is in the range of 15 to 28 ton ha-1 with a average of 20,8 ton ha-1 (Costabal, 2010).
CHAPTER III
LITERATURE REVIEW

24
Table 3.1. Grape Varieties Production in Chile, Season 2010
Variety Production (Nr. of Ha)
Thompson seedless 15971Crimpson seedless 8070Red Globe 10704Flame seedless 9108Superior seedless 3839Autumn royal 1127Ribier 469Princess 495Subtotal 49783Others 4143Total 53926
(Costabal, 2010)
3.1.2. Climatic conditions and phenologycal stages
Environmental conditions are very important for plant growth. Grapevine root system shows different patterns depending on age, cultivar, climate and environmental stresses. Ruiz (2000) defi ned two growth peaks for roots of cv. Thompson Seedless, the fi rst occurring between 3 to 10 weeks after budding and decreasing in intensity with berry growth (McArtney and Ferree, 1999). During the year, the roots grow, presenting minimal values in July and reaching similar growth levels during fl owering and harvest (Callejas et al., 2009). In spring, the root growth is superfi cial with abundant fi ne rootlets; this corresponds to one of the growth peaks and its intensity depends on the level of reserves of the roots (Terence et al., 2002). The second peak, which is less intense than the fi rst, occurs after harvesting.
The changes in root morphology including differences in root length, dry matter and rooting are associated with changes in soil temperature (McMichael and Burke, 1998).
3.1.3. Vitis vinifera Thompson seedless, agronomical and cultural labors Thompson seedless is a variety produced in several environments and countries, including Chile, Australia, Brazil, Egypt, India, Israel, Mexico and South Africa. In Chile Table grape production, is along the north-south axis, from arid to mediterranean climate; it is vulnerable different pests and pathogens (Table 3.2) like Phytophthora sp., and Botrytis cinerea that cause major problems in the root and fruit respectively. Botrytis cinerea is the most aggressive pathogen during cold storage, where research has focused describing biological indicators that estimate the prevalence of mold and splits during the storage (Zoffoli et al., 2009).

25
Table 3.2. Main diseases affecting table grapes in Chile.
Pathogen/Pest Damage SourcePhytophthora cinnamomi, P. cryptogea
Root Chilevinos, 2011
Phomopsis viticola (Sacc.) Phomopsis cane and leaf blight*
Australian Government report 2005
Plasmopora viticola Downy mildew NRC Grapes, IndiaUncinula necator Powdery Mildew NRC Grapes,IndiaXanthomonas campestris pv. viticola
Bacterial canker
Thysanoptera (thrips)
Australian Government report 2005
Frankliniella australis Morgan [Thysanoptera: Thripidae]
Chilean fl ower thrips
Frankliniella occidentalis (Pergande) [Thysanoptera: Thripidae]
Western fl ower thrips
Brevipalpus chilensis Baker [Acari: Tenuipalpidae]
Chilean false red mite
A particular feature of seedless varieties is that the berry does not grow naturally, which has resulted in the need of gibberellic acid application to increase the size of the berries (Williams and Ayars, 2004). Another management practice studied is the irrigation that this species should receive; several irrigation times were tested (6,12 and 18 hours), with the most effective being the last, which had higher pruning weight and size of berries at harvest (Selles et al., 2003).
The cycle of grape describes fi ve distinct phases: the fi rst stage from bud break to the beginning of fl owering, where the plant requires high nitrogen levels and where 90% of the required nutrients are supplied by the previously accumulated reserves; in this phase, the excess N and K defi ciency should be avoided to control an excess of putrescine. The second phase covers the period from the beginning of fl owering to fruit veraison, which defi nes the level of production; during this stage, the levels of potassium (K), boron (B) and zinc (Zn), should be reviewed; a foliar analysis should be performed and the root growth evaluated. The third phase includes from veraison to berry ripening (harvest); during this phase the berry gains caliber and should have a rapid maturation; calcium requirements are high, therefore it should be directly sprayed to the bunch. The fourth includes the second root growth peak, which requires phosphorus (P), and potassium (K); the potential defi ciencies of zinc (Zn) and boron (B) should be assessed. Finally, the fi fth phase corresponds to recess, where pruning is performed, and plants accumulate the hours of cold necessary to stimulate sprouting (Palma, 2006).
3.1.4. Soil characteristics
Chemical parameters such as pH and electrical conductivity represent plant growth balance. The pH range for optimal growth is between 2,5 to 8,5, but at pH> 6,5 the nutrients like Fe, Zn, Mn, Cu, P, Bo, and are less available and a pH <5,5, the molybdenum is not available. These changes in nutrient availability show the importance of pH in maintaining a balance of essential nutrients and thus optimizing sound quality phenology development and productivity; the conductivity of soil extract must be less than 1,5 dS m-1 (Palma, 2006).
3.1.5. Nutrient requeriments
Table grape var. Thompson seedless, exhibits different nutrient requirements according to phenologic cycle. Elements such as N, P, K, Mg and Ca are considered very important to obtain harvests between 7-25 Ton ha-1 (Table 3.3) Nutritional requirements affect performance and

26
quality of fruit. Calcium (Ca) is essential for cell wall and thus for protection against pathogens such as Botrytis, improving rooting and quality of berry; Magnesium (Mg) acts on the chlorophyll and phosphorus (P) aids in the division and transfer of energy at the cellular level. In terms of mineral nitrogen (NH4, NO3) it is estimated that more than 80 ppm in the soil is suffi cient for a high yield; the C / N is used for the characterization of nitrogen and its relationship with organic matter, where an adequate ratio is between 12 and 15 on the other hand, from 11 to 25 ppm of phosphorus is adequate (Palma, 2006).
Table 3.3. Nutrient requeriments for Thompson seedless in Chile
NUTRIENTS (kg ha-1)
HarvestTon/ha
N1 P2O51 K2O
1 MgO1 CaO1 Fe2 Mn2 Zn2 Cu2 B2
7-25* 22-90 5-35 41-48 6-25 28-204 300-1000 50-700 100-500 60-900 37-200
18-22** 80-120 30-60 110-60 30-60 60-120*Christensen and Bianchi, 1994
**Extraction curves in Thompson seedless.Palma 2006, INIA Intihuasi, Vicuña, Chile1: Kg/ha; 2:g/ha
According to Chilean National standard (INN, 1991) and international market requirements (USDA, 1971, 1999), Table grape quality includes different parameters in the fi eld, such as age, maturity, fi rmness, no splitted or crushed, yellowish-green color, no sunburn, stems free from mold and decay , and size (diameter of at least 75% of the fruit shall be between 10/16 of an inch, corresponding to 16mm. These physical properties correlate with some chemical properties like total chlorophyll, Chlorophyll a and b, ° Brix, total acidity, anthocyanin, total polyphenols concentration and polyphenoloxidase activity.
3.2. Organic amendments
The use of organic matter (OM) in agriculture is of great importance for plant nutrition, soil aggregation, structural stability, root penetration and water retention capacity. In relation to chemical properties OM application increases nutrient storage and buffer capacity and enhances the action and absorption of nutrients by rootlets. Regarding to biological properties, OM application promotes metabolic activity in the rhizosphere, encouraging and maintaining an appropriate level of microbial growth. In sum, the use of OM as an agricultural practice strongly infl uences different parameters in soil having effects even on pesticide applications as these are adsorbed by organic matter or contribute to degrade fumigants (Magdof and Weil, 2004).
Plant quality in vine is determined by adequate level of nutrients, irrigation water, root stock variety, fertilizer sources, environmental conditions, root development and soil management conditions that, at the same time, make part of agricultural sustainability. The concept of agricultural sustainability has been given great signifi cance. It is defi ned as an agroecosystem with the ability to: stay productive even under stress, maintain the quality of the environment, provide food and fi ber necessary for human beings, be economically viable and improve the quality of life for farmers and society (FAO, 1994).
Soil organic matter (SOM) is a matrix of heterogeneous compounds with carbon base; formed by the accumulation of materials of animal, plant and microorganisms in a constant state of decomposition and synthesized substances of all living and dead organisms (Manalay et al., 2007) .
Organic matter (OM) in soil is very homogeneus and represents 95 to 99% of the dry weight of living things; however, is the non living component of organic matter, and contains three C pools: root exhudates and rapid decomposed components of litter, called “active” pool; the

27
stabilized and persistent organic matter for thousands of years, called “passive pool” and the low stablilized that persists years to centuries, called “slow or intermediate C pool” (Kleber and Johnson, 2010). The content of organic matter in soils varies greatly. There are references in ranks going from 2 g kg-1 in deserts (Magdoff and Weil, 2004) to 700 g k-1 in some Histosols (Pereira et al., 2006). Organic matter is the most important fraction in soil in order to improve productivity and soil fertility by supplying organic carbon to microbial activity (Ferreira and Alarcon, 2001).
In table grape, the practice in Chile has been the application of organic amendments in order to “give back” to the soil and it has become the basis of organic agriculture. Mustin (1987), indicated that the presence of OM is generally poor, forming only around 5% of total nitrogen, together with some elements which are essential for plants such as phosphorus, magnesium, calcium, sulfur and micronutrients.
Applications of organic matter in the grape crop have been a very popular cultural practice in Spain. This practice responds to a recycling policy where organic material from urban and agricultural waste (olive-oil processing residues, winery and distillery wastes) are considered as amendments for soil, preserving organic matter content, and improving nutrient content (Barral et al., 2009). Thus, the use of this material in soil results in an environmentally friendly method to reduce the organic wastes in land fi elds.
Other organic amendments used for table grape production include animal manures (poultry, horse or goat), crop residues, wastes from food processing that can be used fresh or transformed. Among them is the application of vermicompost which increases the level of soil organic matter and thus the enzymatic and microbiological activity. Bertrán et al. (2004), determined that sludge and grape pomace can be used as organic amendments in vineyards with low SOM using a 1:2 ratio (sludge: grape pomace), humidity of 55%, temperature of 65ºC and 10% oxygen.
Organic amendments supply C, N, P and energy for microorganisms in soil (Tabatabai and Dick, 2002), and activate all soil functions associated with enzymatic hydrolysis, production of biologically active substances, and rooting, but application of unstable and/or immature organic amendments may induce several adverse effects on soil properties, plant growth and water quality. Fresh materials increase the mineralization rate of native soil organic C through improved microbial oxidation activity, and the inmobilization of available N by microorganisms substracting O2 from root respiration and reducing nitrifi cation process with formation of nitrites and sulphides (Senesi and Plaza, 2007).
For all these reasons soil quality can be measured in terms of organic matter which can affect chemical, physical and biological properties. Today there is a holistic approach to the study of soils aiming to understand the contribution of different properties and their relationship with the plant and its productivity.
3.2.1. Compost as organic amendment
The composting process is defi ned as a biological transformation of organic matter under aerobic thermophilic and mesophilic conditions by which native microorganisms produce a material which is stable, sanitized, safe and with an important concentration of humic substances (Marhuenda –Egea et al., 2007). Compost amendments are an attractive way to incorporate organic matter in the soil as it has benefi cial properties, including mobilization of mineral phosphates (Wickramatilake., 2010).
The production of compost is an alternative to burning agricultural and forestry waste, and therefore an option to reduce air pollution and loss of organic matter in soils by calcination. This agricultural practice reduces the volume of waste sent to landfi lls, as well as odors and vector attraction. In addition and particularly in Chile, the use of compost of grape pomace

28
has the potential to discourage the practice of collecting “Tierra de hojas” or “soil of leaves” which basically refers to the collection of soil and leaf litter around native trees in mountainous areas with high environmental impact reducing the cycling of organic matter in native forests. (CONAMA, 2008).
Overall, around the world the quality of compost is defi ned in terms of their chemical, physical and biological properties, with particular emphasis on the elements to guarantee the protection of the environment and health (of humans and animals).EU standards, as well as the U.S., Australia, Switzerland, Austria, leading the latter to be the most demanding in terms of quality, are defi ned on the basis of prevention, so that it can protect soil quality . Another aspect to be considered in almost all countries is the presence of human pathogens which in turn is related to the rules of the process of “temperature-time”), physical impurities, the presence of weeds and stability and phytotoxicity. (Hogg et al., 2002).
The Chilean National Standard, classifi es compost and organic amendments as Class A and B according to their physical, chemical and microbiological characteristics (Table 3.4). In general, compost moisture must be between 30-45% (wet basis), without unpleasant odors (ammonia sulphide, mercaptans, reduced sulfur). It must have an earthy odor and a dark brown to black color (EPA, 1995). Other characteristics include organic matter (OM)> 20%, pH between 5 to 8,5, and with a maximum presence of viable seeds and weed propagules of maximum 2 g-1 of compost when placed in a growth chamber (INN, 2004).
Table 3.4. Heavy Metals Contents of Raw materials and Compost*
Raw Material Mx. Concentration (mg kg-1) dry base
Chilean Standard NTCh 2880/04
EU**
Type A Type B Type A Type BArsenic (As) 15 20 - -
Cadmium (Cd) 10 2 8 0,7 1,5Copper (Cu) 1500 100 1000 100 600
Chromium (Cr) 1000 120 600 100 600Mercury (Hg) 10 1 4 0,5 1,25
Nickel (Ni) 200 20 80 50 150Lead (Pb) 800 100 300 50 120Zinc (Zn) 3000 200 2000 200 1500
*Total contents **European Union Standard (2008)
Table 3.5. Microbiological parameters for compost - Chilean Standard
Type of microorganism Limit of Tolerance
NCh 2880 & EPA EUA B
Fecal coliforms (MPN 100ml-1) <100 <1000 <1000Salmonella spp. Absent Absent AbsentViability of Helminth / Ascaris sp. <1 viable egg 1 viable egg
Compost maturity cannot be described with a single property but it is best assessed by measuring two or more parameters. Maturity is related to the stability of the material and also includes the potential impact of other chemical properties of the compost on plant development.

29
Immature compost may contain high amounts of free ammonia, certain organic acids or other water-soluble compounds which can limit seed germination and root development. Any use of compost requires it to be mature and free of any potentially phytotoxic components (Bernal et al., 2009).
Laboratory tests must be easy, rapid and reliable for proper evaluation of composts. These tests include the carbon:nitrogen ratio (C:N); ammonium-N:nitrate-N ration; analysis of humic substances; microbial biomass, cation exchange capacity (CEC); water extract analysis, germination percentage and reheating tests. All of these can provide additional information on material characteristics but have limitations when applied to the interpretation of the diversity of compost products. For example, an assumed ideal C:N ratio for a mature compost may be 10 (Compost Council Quality of California-CCQC, 2001).
Compost producers and users should realize that the presently accepted methods to evaluate stability and maturity may not completely or accurately address the most important characteristics. All of the test procedures provide indirect interpretations for the potential impact on plant growth but can be used by farmers to take appropriate decisions.
Complementary tests are recommended by the Compost Council Quality of California, and required (one from each group A and B) by the Chilean National standard (INN,2004). These tests include in group A: carbon dioxide evolution or respiration, oxygen demand and self heating, and in Group B: ammonium: nitrate ratio, ammonia concentration, volatile organic acids concentration and plant tests . With these complementary tests three rating categories are suggested in the CCQC Compost Maturity Index, including very mature, mature and immature (Table 3.6).
Table 3.6. Maturity Index Proposed by CCQC
VERY MATURE MATURE IMMATUREWell cured compost Cured compost Uncured compostNo continued decomposition
No odors
Odor production not likely Odors likely
No potential toxicity Limited toxicity potential High toxicity po-tential
Minimal impacts on soil N Signifi cant impact on soil N
Method Very Mature Mature ImmatureOUR Test O2 / unit TS / hr < 0,4 0,4 - 1,3 > 1.3
SOUR Test O2 / unit BVS / hr < 0,5 0,5 - 1,5 > 1,5CO2 Test C / unit VS / day < 2 2 - 8 >8SCL CO2 C / unit VS / day < 2 2 - 8 > 8
WERL CO2 C / unit VS / day < 5 5 - 14 < 14Dewar Temp. rise (oC) < 10 10 - 20 > 20Solvita¨ Index value 7 - 8 5 - 6 < 5
SCL = Soil Control LaboratoryWERL = Woods End Research Laboratory
The alcohol distilleries for the production of spirits such as whisky, gin, brandy or pisco, generate large amounts of solid and liquid organic waste which needs to be treated in order to reduce its polluting organic load. The environmental problems associated are low pH or presence of toxic substances for plants, such as polyphenols (Bustamante et al., 2008) that inhibit germination (Zucconi et al., 1981) and immobilization of N in soil. Different methods

30
have been proposed to use solid waste, for example yeast production (Lo Curto and Tripodo, 2001), extraction and recovery of phenolic compounds (Louili et al., 2004), pesticide activity (Corrales et al., 2010) or mulching in autumn (CONAMA, 2008).
Waste of pisco industry derived from fermentation of Muscat grapes and additional phenolic compounds, has the same characteristics of Grape marc: low pH (3,8 to 4,4) (Bustamante et al., 2008) and EC between 3 and 4, high concentrations of P, K, organic matter and micronutrients (Bustamante et al., 2007) which can potentially be used in agricultural soil.
However, the safe use of compost depends on characteristics such as stability and maturity. Some parameters to take into account for the quality of compost are stable temperature, dark brown-black ash, no odor, alkaline pH, C / N> =20. Some authors, also include low activity of hidrolytic enyzmes, low ATP content and reduction of 35% total sugars, as stability indicators of compost obtained from grape marc (Bustamante et al., 2008).
3.2.2. Humic substances as organic amendments
With the intensifi cation in agricultural production and the incorporation of irrigation systems in the plantations, the application of compost or manure is practically limited to planting or surface applications. Surface applications besides being costly are not very effi cient, because many of the nutrients get lost by run-off effect and in addition, it is necessary to incorporate the compost or manure in perennial crops where active roots may be several feet below the surface. However, when this material is applied and incorporated into the soil, different benefi cial effects are provided such as aireation, maintaining moisture and stimulation of rhizosphere-effect.
Commercial alternatives of extracted humic substances applied as a supplement of chemical fertilization and solid organic amendments, has been observed to reduce the loss of organic carbon in soil. Carboxylic acids, amino acids, extracts of manure and humic acids in liquid form, suggest interesting products that could increase the organic C content (Paustian et al., 1992).
Humic substances (HS) are natural organic products. They are found in aquatic and terrestrial ecosystems, in sediments, lignites, brown coal, compost and other deposits (Grinhut et al., 2007). In the environment, HS are a mixture of associated OM, including complex molecules and small and simpler organic structures that interact with particles and minerals (Sutton and Sposito, 2005). Humic substances are formed during humifi cation process, a secondary synthesis reaction during the transformation of organic matter. Early characterization analysis of this compounds indicated that HS are based on three fractions according to their solubility under acid or alkaline conditions. humin, the insoluble fraction of humic substances, the humic acid (HA), the soluble fraction under alkaline conditions (but not pH< 2) and fulvic acids (FA) the fraction soluble under all pH conditions, but does not indicate the existence of three different types of organic molecules (Hayes et al., 1989). The studies by Stevenson (1994) indicate that HS are comprised mainly of aromatic, aliphatic, phenolic, quinolic and N-derived components (Fig 3.1), bound through C-C, C-O-C and N-C bonds, that support the complex polymer model of HS structure (Cameron et al., 1972) and extreme stability to microbial attack (Picolo, 2001).
However, in last decade, different analytical approaches using spectroscopic, pyrolisis, and isotopic analysis, show the humic substances in soil, as a complex of macromolecules with high activity and infl uenced by soil mineral (Sulton and Sposito,2005). The origin of HS are in discution; soil biochemistry studies indicate that these molecules are a complex of polymeric organic acids with a wide range of molecular weights, including aromatic, aliphatic, phenolic and quinolic functional groups with different properties depending on the origin and age of the material (Gu et al., 1985, Chin et al., 1998).

31
Figure 3.1. Humifi cation process from plant residues. Polymeric Model of HS
(Grinhut et al., 2007, Stevenson, 1994)
Polyphenols are considered, by many authors, as humic acid precursors, because of their reactive sites suffered further transformations as condensation (Burdon, 2001). However, as was mentioned before, because of heterogenicity, humic substances, should be consider a system in soil, created by associations of components present during humifi cation process, including N derivatives (amino acids), C derives (lignin, pectins and carbohydrates that inteact by intermolecular forces. The HS formation process depends on geographical situation, temperature, plant exhudates infl uence, microorganisms, biochemical and physical factors (Grinhut et al., 2007, Tiquia, 2005).
Humic substances have different effects on plants. Vaughan and Malcolm (1985) and Chen et al. (2004), showed evidence of stimulation on plant growth by humic substances and consequently increased yield by acting on mechanisms involved in: cell respiration, photosynthesis, protein synthesis, water, and nutrient uptake, enzyme activities. Results have been demonstrated to be C rate dependent and particularly effective at low concentration (Chen and Aviad, 1990). Optimal concentrations capable to affect and stimulate plant growth have been generally found in the range of 50-300 mg L–1, but positive effects have been also seen with lower concentrations (Chen et al., 2004).
3.3. Soil quality
3.3.1. Definition
The concept of soil quality should be associated with production and fertility. Doran and Parkin (1994) had defi ned soil quality as “the soil’s ability to operate within environmental limits, to sustain biological productivity while maintaining environmental quality and promoting the health of the fl ora and fauna”. Soil quality is determined through dynamic properties of soil such as organic matter and diversity of organisms or microorganisms. These properties change and their function is measured through promoting productivity of the system without losing their properties, reduce environmental pollutants and pathogens and promote the health of plants, animals and humans.
The concept of sustainability and resilience of soil was described by Blum and Santelises (1994), including six ecological and human functions; soil as biomass producer; soil as fi ltering

32
matrix and reactor of polluting compounds; soil as buffer and carrier of material to protect the environment, groundwater and food chain from contamination; soil as habitat for countless species or as a biological and genetic reserve; soil as a physical environment and; soil as natural resource and cultural heritage. These concepts suggested by Warketin (1996), served as the basis of the current concept of soil quality, proposed by the Soil Science Society of America, “The capacity of soil to function within ecosystem boundaries to sustain biological productivity, maintain environmental quality, and promote plant and animal health” (Karlen et al., 1997). By 2008, the defi nition of soil quality focused mainly on its function and changes through time are measured with quality indices which are defi ned for crops taking into account specifi c conditions (Karlen et al., 2008).
Once soil quality has been established for a specifi c situation it is possible to defi ne policies and actions such as agricultural practices which allow to maintain or improve this quality. Therefore in order to give an accurate assessment of soil quality, parameters must meet three main aspects: fi rst, choose appropriate indicators to complete a minimum data set, second transform indicators into scores, and fi nally, report the scores as indices. Statistical techniques such as principal component analysis, factor analysis or regression and coeffi cient of variation analysis have been useful to identify the critical parameters as indicators of quality (Masto et al., 2008, Velasquez et al., 2007; Janvier et al., 2007; Arshad and Martin, 2002, Ortega and Santibáñez, 2007).
3.3.2. Soil quality indicators
Indicators of soil quality have been defi ned, from the ecological, economic and social development points of view; they usually take into account soil properties or associated crops that can be used to answer the dynamic changes in agro ecosystems. These indicators are not well defi ned, nor are there accepted or approved parameters to characterize or to defi ne soil quality (Bouma, 2002). Changes in soil quality can be measured through indicators, which include physical, chemical, biological, and biochemical processes and characteristics so it is necessary to provide quality indices including different indicators, to make more objective the soil quality determination.
According to the USDA-NRCS (2006), indicators of soil quality are classifi ed into four categories that include visual, physical, chemical, and biological indicators (Table 3.7). Visual indicators can be obtained through fi eld visits, perception of farmers and local knowledge. These indicators are identifi ed through observation or photographic interpretation, subsoil exposure, erosion, presence of weeds, color, type of coverage and by comparison with native systems. All these parameters give a clear idea whether soil quality, has been positively or negatively affected. Mairura et al. (2007) reported in Kenya, the integration between scientist and farmer´s evaluations show how the use of local knowledge as indicator is valid for consistent classifi cation of soil quality.

33
Table 3.7. Minimum set of physical, chemical and biological properties for soil quality defi nition.
Indicators of soil condition Relation and function of the soil condition
Physical Parameters
Texture Water holding capacity and chemical in solu-tion transport
Soil and root deep Productivity potential and erosion
Infi ltration and density Leaching potential, productivity and erosion
Chemical parameters
Organic matter Soil fertility, stability and erosion
pH Biological and chemical activity
Electrical conductivity Microbial and plant activity
N, P y K extractable Potential of N mineralization and nutrient availability
Biological Parameters
C and N Microbial biomass Catalytic potential
Enzymatic activity Biochemical reactions in soil and nutrient cycling.
Organisms (colembola, worms, ants) Biodiversity and biological activity
Doran and Parkin, 1996; Gutierrez, 2009
In addition, these indicators should be sensitive enough to detect changes, measureable, easy to interpret and affordable to many users. In this sense, they constitute an effective tool to show important changes in soil properties (Benintende et al., 2008; Janvier et al., 2007).
Physical indicators are those that refl ect the way the soil accepts, holds and transmits water to the plants, as well as how it responds to stress situations. Parameters include infi ltration and bulk density, aggregate stability, water holding capacity and soil conductivity (Mon et al., 2007).
Aggregation and aggregate stability are physical properties that respond to any kind of changes that happen to the soil. An aggregate is a group of soil particles that cohere more strongly to each other than to other adjoining particles. The aggregates in soil form clusters and these defi ne the soil structure. Biotic and abiotic factors play important roles in the formation of soil aggregates; roots disrupt and promote granulation. Organic matter binds the soil particles and promote the growth of microorganisms which can contribute to form the water-stable aggregates, through the production of extracellular polysaccharides, glomalin, mycelium and cementant substances (Cabria et al, 2002 and Silvya et al., 2005).
Chemical indicators include pH, salinity, organic matter, phosphorus concentration, cation exchange capacity, nutrient cycling, and the presence of contaminants such as heavy metals, organic compounds, radioactive substances, etc. These indicators determine the soil-plant-related organisms, nutrient and water availability for plants and other organisms and the mobility of contaminants. Chemical fertility and soil quality indicators, in conventional and organic crops, have an intimate relationship with soil biology. Garcia-Ruiz et al. (2009), described differences in the total carbon exchange capacity of Ca+2 and K+, which are present in high levels in soils with organic management, but no signifi cant differences in the exchange of sodium carbonate, total nitrogen, pH and CEC. Chemical indicators consist of a set of parameters which include

34
organic matter content (% OM), total and oxidized carbon, total nitrogen, N-NO3 and N-NH4, pH, electrical conductivity and the percentage of humic and fulvic acids.
Biological indicators is another group which includes properties associated to biological activity on organic matter such as microbial biomass (Suman et al., 2006) and soil respiration (Janssens et al., 2006; Marriot and Wander 2006). Other biological indicators are abundance, diversity, food chains, stability of communities (Doran and Zeiss, 2000), organisms associated to mesofauna such as earthworms (Andersen, 2008), nematodes (Blair, 1996) and arthropods. Biological activities such as enzyme activity (Liu et al., 2008), and potentially mineralized nitrogen or CO2 production are associated to this group of biological indicators (Doran and Zeiss 2000, Tejada et al., 2006).
3.3.2.1. Biological indicators
Concentration or population of earthworms, nematodes, termites, ants, as well as microbial biomass, fungi, actinomycetes, or lichens are used as biological indicators, because of their role in soil development and conservation, nutrient cycling and fertility (Anderson, 2003).
Soil organisms are sensitive indicators, and refl ect the infl uence of human management and climate changes. Similarly, soil organisms are indicators of quality and health because their diversity and abundance may be related to different functions such as decomposition of organic matter, plant and root development (competition). Soil organisms are also related to sequestration and detoxifi cation of heavy metals (Nakatsu et al., 2005), pesticides and other pollutants, disease-suppressive soil and presence of pathogens in soil and plant (Schroth and Hancock, 1982; Gao et al., 2008; Scherwinsky et al., 2007; Hartmann and Widmer, 2006; Del Val et al., 1999).
Metabolic processes such as microbial respiration are used to detect microbial activity in soil. A common used index: the metabolic quotient (qCO2), defi ned as the ratio between respiration and microbial biomass, is associated to mineralization of organic substrate per unit of microbial biomass (Bastida et al., 2008). Enzymes such as cellulases, arylsulfatase, ammonium monooxigenase and phosphatases are considered biological indicators, and relate to specifi c functions of substrate degradation or mineralization of organic S, N or P. Soil enzyme activity is a potential indicator of ecosystem health and can be operationally practical and sensitive. Enzyme activity can offer an holistic “biological fi ngerprints” of soil management in the past, including information related to soil tillage and structure (Dick 2000). Determination of decomposition rates of plant debris in bags or measurements of the number of weed seeds, or the presence and quantifi cation of pathogenic organisms’ populations can also serve as biological indicators of soil quality (Janssens, 2006).
3.3.2.2. Microbial indicators
Soil contains a large variety of microbial taxa with a wide diversity of metabolic activities (Parkinson and Coleman, 1991) and microorganisms play a leading role in soil development and preservation specially associated to decomposition of dead organisms and incorporation to biogeochemical cycles (Six et al., 1998). Soil microbial biomass is a sensitive indicator infl uenced by different ecological factors like plant diversity, root exudates, soil organic matter level, moisture, and climate changes. Microorganisms in soil play a key role in nutrient cycling and energy fl ow (Li and Chen, 2004) and gives information about the impact of intercropping, incorporation of organic matter, management practices (Shannon et al., 2002 ) and tillage activities, because all of these affect microbial activity at the plant rhizosphere, and processes such as N mineralization (Suman et al., 2006).
Microbial communities respond to environmental stress or ecosystem disturbance, because of changes in the availability of energetic compounds that support microbial populations (Marinari et al., 2007) but it is very diffi cult to evaluate concentration, number of species and

35
frequencies and these values can be only estimated. For this reason it is impossible to defi ne diversity of species using a single soil analysis (Anderson, 2003). It is important to observe the interdependency between biodiversity and functional parameters and to defi ne the sensitivity groups respect to functions in soil. According to Domsch et al. (1983) in Anderson (2003), Rhizobium species, actinomycetes, nitrifying bacteria, and microorganisms associated to organic matter decomposition show higher degree of sensitivity if compared to total bacteria, total fungi, and denitrifi cation or ammonifi cation process.
Any environmental impact that affects members of a microbial community should be detectable at the community level by a change of a particular total microbial activity (qCO2, Vmax, Km). Similarly, microorganisms respond more rapidly to environmental stress in comparison to higher organisms, because of their direct contact with the surrounding medium given their surface:volume ratio. In most cases, changes in microbial population or activity precede changes in physical and chemical properties of soil, providing early indications of improvement or deterioration of the soil. In general, microbial indicators should be selected based on easiness of measurement, reproducibility and sensitivity to the variables that control the quality and soil health. Table 3.8 presents a set of data of microbial indicators (Nielsen and Winding, 2002).
Table 3.8. Microbial indicators used to determine soil quality.
PARAMETER MICROBIAL INDICATORS METHOD
BiodiversityGenetic diversity PCR – DGGE – T-RFLPFunctional diversity BIOLOGTM
Lipids PLFA
Carbon Cycle
Respiration CO2 Production or O2 Consump-tion
Decomposition of Organic Matter Enzymatic activityEnzymatic activity Enzymes– cultura media– DGGEMethanotrophic FISH – PLFA
Nitrogen Cycle
N mineralization NH4+ accumulation
Nitrifi cation NH4+ oxidation
Desnitrifi cation Acetylen assay
N fi xation MPN – nitrogenase activity– PCR
BiomassFungi, yeast PLFA – ErgosterolProtozoan MPNRelation fungi- bacteria PLFA
Microbial activity
Bacteriophage Host-specifi c assay
RNA determination RT-PCR – FISH
Microbial physiology CO2 production or O2 consumption
Key speciesMycorhizal Microscopy – PCRHuman pathogens Selective media– PCR
3.3.2.2.1. Metabolic substances
• Ergosterol
Ergosterol, is the main endogenous sterol of fungi, actinomycetes and some microalgae. Its concentration is an important indicator of fungal growth on organic compounds and mineralization associated to fungic activity (Battilani et al. 1996). Ergosterol is a stable compound in soil and can support different stress conditions. Barajas-Aceves et al. (2002)

36
demonstrated that heavy metals (Cu 80 ppm, Zn 50 ppm or Cd 10 ppm) and fungicides (thiram 3 ppm or pentachlorophenol 1.5 ppm) reduced the metabolic activity between 18% and 53% (pollutant-stressed cultures) but did not affect the ergosterol content, while the fungicide Zineb (25 ppm) reduced signifi cantly ergosterol content in biomass basis.
Molope et al. (1987) working with pastures and arable soils, found correlation between fungi hyphae and ergosterol quantity and soil aggregates stability demonstrating by electronic microscopy the importance of fungi, on physical process involving rearrangement of the clay micelles, in soil.
Also Puglisi et al. (2003), analyzed the content of cholesterol, sitosterol and ergosterol in agricultural soils of Italy, determining that the rotation does not affect the presence of these sterols in soil.
• Enzymes Enzymes in soil refer to a product of microbial, animal (worms), or plant metabolism. Their role in relation to organic matter focuses on mineralization processes. Enzymes have been studied as indicators of soil quality since the 80’s (Karlen et al., 2008).
Soil organic mineralization involves metabolic processes and enzymes are catalytic substances in these biological reactions. Soil enzymes have been reported to be a key factor in the availability of essential nutrients in the soil (N and P). Their activity depends on the availability of the substrate and product, as well as the presence of inhibitors such as humic substances, clay or CO2 (Ebersberger et al., 2003) and various soil biotic and abiotic components such as mineral colloids and weather conditions (Kandeler et al., 2006).
Enzymes play a key role as indicators of the effect of agricultural practices, soil management (De la Paz- Jimenez et al., 2002) or soil fertility status (Dick et al., 1988; Masciandaro et al., 1999). Enzymes may also indicate processes of degradation or desertifi cation of soils (Garcia et al., 1997). Enzymes are more sensitive than total C concentration in response to vegetation disturbance (Cadwell et al., 1999) and to agricultural management practices in tropics or semiarid conditions (Caravaca et al., 2002). Enzymes are directly related to the portion of soluble organic matter and show the effects of organic amendments applied to the soil (Gutiérrez et al., 2008.) The most studied enzymes in soil are those related to SOM mineralization, diversity and availability of nutrients such as N, P, and S.
Enzymes are related with biogeochemical cycles, the degradation of organic matter and soil remediation processes, so that they can determine, together with other physical or chemical properties, the quality of a given soil (Gelsomino et al., 2006). Enzymes are associated with living cells, in non-proliferating cells such as fungal spores or cysts, attached to dead cells or cell debris though can also be found free (Fig. 3.2). The enzymes not associated with living cells are called abiontics, and are present in soil solution or associated to clay, mineral particles and humic acids where they are immobilized (Burns, 1982). This immobilized condition can remain stable and protect the enzymes of denaturalization by proteolysis and heat (Rao et al. 2000).
Few enzymes have potential as indicators of soil quality. Dehydrogenases, have a long history as biological indicators because they are generally closely related to the average activity of living microorganisms. Dehydrogenases only exist as an integral part of viable microorganisms. However, dehydrogenases could be not such good indicators when detecting long-term changes or history of soil quality. They depend on the microorganism being alive and can change only if changes in soil management or climatic conditions are signifi cant and affect the microbial population. For this reason another group of enzymes, hydrolases, that are related to organic matter content, can be permanent indicators of quality. They are extracellular enzymes and are probably protected and coupled to complex clays or humic acids (Dick et al., 1996).

37
Fig 3.2. Dinamics of enzymes in soilBurns, 1992, adapted by Gutierrez (2008).
In general, hydrolytic enzymes are a good choice as indicators because organic waste decomposing organisms are probably the biggest contributors of soil enzymatic activity. Organic matter has different organic compounds and the hydrolysis of those are key in the biogeochemical cycles of C, N, P and S. Most of the studies made with hydrolytic enzymes, such as β-glucosidase, urease, phosphatases and sulphatase are associated with the mineralization of nutrients important in plant nutrition.
♦ β glucosidases
This group of enzymes, hydrolyse carbohydrates with β-D-glucoside bonds, such as maltose and cellobiose (Klose and Tabatabai, 2002) producing glucose as a C and energy source for microorganisms (Fig 3.3). Among the most studied is the β glucosidase, an enzyme associated with the biodegradation of cellulose and cellobiose which is directly related to the content of glucose, C content and microbial biomass in soil (Esen, 1993). This enzyme plays an important role in making energy available in the soil which relates directly to the content of labile C and with the ability to stabilize soil organic matter, showing low seasonal variability (Knight and Dick, 2004). β Glucosidase is sensitive to soil management practices in short periods of time, i.e. less than two years (Dick et al., 1996; Sotres et al., 2005).
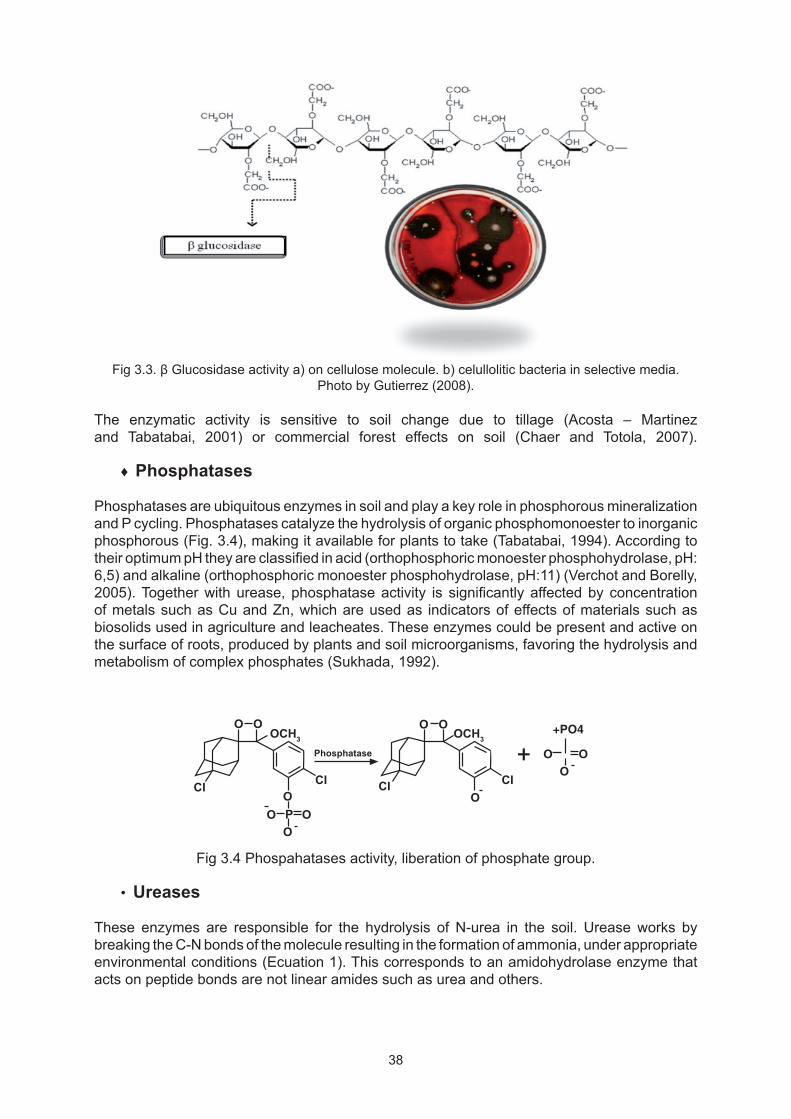
38
Fig 3.3. β Glucosidase activity a) on cellulose molecule. b) celullolitic bacteria in selective media.
Photo by Gutierrez (2008).
The enzymatic activity is sensitive to soil change due to tillage (Acosta – Martinez and Tabatabai, 2001) or commercial forest effects on soil (Chaer and Totola, 2007).
♦ Phosphatases
Phosphatases are ubiquitous enzymes in soil and play a key role in phosphorous mineralization and P cycling. Phosphatases catalyze the hydrolysis of organic phosphomonoester to inorganic phosphorous (Fig. 3.4), making it available for plants to take (Tabatabai, 1994). According to their optimum pH they are classifi ed in acid (orthophosphoric monoester phosphohydrolase, pH: 6,5) and alkaline (orthophosphoric monoester phosphohydrolase, pH:11) (Verchot and Borelly, 2005). Together with urease, phosphatase activity is signifi cantly affected by concentration of metals such as Cu and Zn, which are used as indicators of effects of materials such as biosolids used in agriculture and leacheates. These enzymes could be present and active on the surface of roots, produced by plants and soil microorganisms, favoring the hydrolysis and metabolism of complex phosphates (Sukhada, 1992).
++PO4
Fig 3.4 Phospahatases activity, liberation of phosphate group.
• Ureases
These enzymes are responsible for the hydrolysis of N-urea in the soil. Urease works by breaking the C-N bonds of the molecule resulting in the formation of ammonia, under appropriate environmental conditions (Ecuation 1). This corresponds to an amidohydrolase enzyme that acts on peptide bonds are not linear amides such as urea and others.

39
Urease activity has been used as an indicator in different areas, for example in the application of compost in soil (Garcia-Gil et al., 2000).
3.3.2.2.2. Functional Groups of microorganisms as soil indicators
The study of soil microorganisms has acquired great importance, not only in order to know what kind of organisms inhabit in the soil but also to understand soil quality, as evidenced by its state of recovery or degradation. Through the microbial analysis, it is possible to obtain general parameters such as the determination of C and N microbial biomass, nitrogen mineralization, soil respiration, ATP and level of some enzymes that allow the detection of a specifi c substrate (Hernandez et al., 2007).
Some organisms like actinomycetes, amylolytic, heterotrophic, proteolytic, yeasts and fungi are associated with development, nutrition and plant health, including phytostimulation, biofertilization, biological control, and bioremediation.
• Celullolytic
Cellulolitic microorganisms as its name describes, have the ability to hydrolyze cellulose. The molecule of cellulose is an unbranched polymer of 1000 to 1 million D-glucose units, linked together with beta-1,4 glycosidic bonds. Cellulose can be obtained from different sources, but differ in the crystalline structures and bindings from other organic compounds. There are two types of hydrogen bonds in cellulose molecules: C3 OH group and C6 OH group; these bonds in one molecule are bounded to the oxygen of the glucosidic bond of the other molecule. Normally, the beta-1,4 glycosidic bonds are not too diffi cult to break, but in the cellulose molecule, the presence of these hydrogen bonds, gives to cellulose the possibility to form very tightly packed crystals. These crystals are broken by exogluconases, a subgroup of cellulase enzyme that includes β glucosidase, which acts upon the terminal glucosidic bond. This breaking of bonds continues in amorphous cellulose allowing the penetration of endogluconase, another subgroup of cellulase that catalyzes the hydrolysis of internal bonds (Lynd et al., 2002).
• Yeast
Colonies of this group of fungi are characterized by single-celled organisms and multiply by budding or fi ssion. Its morphological characteristics are important for identifi cation, and can be ascomycetes or basidiomycetes (Botha, 2011).
Yeasts are of great ecological importance because they act with biotic and abiotic factors of the system, and they have the ability to infl uence microbial and plant growth and, in addition, participate in the formation of soil aggregates. Yeasts play an important role by contributing to mineralization of organic matter. Many of the yeast species have shown no intraspecifi c diversity maintaining its functionality in soil. The function is related to the assimilation of different sources of carbon and nitrogen (Kurtzman and Fell, 1998, cited by Botha, 2011).
The yeasts found in soil, are able to use L-arabinose, D-xylose and cellobiose aerobically (Botha, 2006), derived from the enzymatic hydrolysis of hemicellulose by bacteria and molds acting on plant debri. There are yeasts also able to assimilate intermediates in the degradation of lignin (Sláviková, et al., 2002).
It is also recognized that soil yeast have the ability to promote plant growth directly or indirectly (El-Tarabily and Sivasithamparam, 2006), by antagonism and competition (Botha, 2011).

40
• Proteolytic microorganismsThese soil microorganisms are associated with protein degradation and their regulation at the ecosystem level. Proteolysis refers to protease activity and is found in different organisms in plants, animals and microorganisms. Proteases of microorganisms are the major protein-degrading source in soil.
These proteolytic enzymes are classifi ed in two types: neutral metalloproteases and serine proteases. Some organisms such as Bacillus subtilis, B. amyloliquefaciens, Pseudomonas sp., Lysobacter enzymogenes and Escherichia coli have both types as extracellular enzymes and the level of expression is based on genetic information. The method by which these organisms regulate the expression of these enzymes is subject to physical and chemical factors in the environment (Mrkonjic et al., 2008).
Mrkonjic et al. (2008), evaluated the effects of N and organic carbon on proteolytic enzymes, and found a variation in the number of 16 rRNA copies depending on soil management practices. Extracellular proteases have been detected in different culture media and could be used as indicators of soil disturbation (Kaiser et al., 2010).
• Phosphate solubilizing bacteria
Phosphorus solubilization by microorganisms is one of the most important processes in the soil. This element is usually found in large amounts in soil, but their availability is relatively low, and depends specially on soil pH. In the presence of carbohydrates, microorganisms, produce organic acids (Fig. 3.5) and thus changing the pH around, or they produce acid or alkaline phosphatases which break the phosphates groups in organic matter (Mikanova et al., 2002).
Rodríguez and Fraga (1999), described the use of phosphate solubilizing microorganisms as inoculum to get better absorption of phosphorus by the plant, thus increasing crop yield. The genera Pseudomonas, Bacillus and Rhizobium sp. have as primary mechanism the production of organic acids and acid phosphatase for the mineralization of organic phosphorus in soil (Caballero et al., 2007). Based on the multifunctionality of these groups of microorganisms many biofertilizers have been commercially developed and some have been isolated from thermo-resistant strains of microorganisms for composting processes (Chang and Yang, 2009); and others have been used to remove phosphorus from contaminated sediments (Kim et al., 2005).
Fig. 3.5. Phosphate solubilizer bacteria, in selective culture media. Gutiérrez (2008) (with permission)
41
• Heterotrophic Bacteria
These organisms are related to the decomposition and mineralization processes of organic matter. In general, nutrient competition generates microbial interaction, depending on the metabolism of plants and different populations of microorganisms that promote plant growth. This relationship depends on the environment in the rhizosphere, type of plant exudates, genetic response of the microorganism species and chemoattractants in the rhizosphere (Reyes et al., 2008). Root exudates consist of sugars, mucigel, organic acids and amino acids which can form 40% of plant photosynthates. Exudates create an environment favorable for the activity of plant growth promoting bacteria. The exudates are the main element of the released soluble organic compounds (Peña and Reyes, 2007).
3.3.3. Selection of indicators
Soil quality is estimated by observing or measuring different properties or processes, and several of these indicators can be used to determine soil quality indices.
According to Doran and Zeiss (2000) and Cantu et al. (2007), indicators should be limited and manageable in number by different types of users, simple and easy to measure, covering the largest possible situations (soil types), including temporal variation and have high sensitivity to environmental changes and soil management.
The selection of indicators for specifi c functions depends on the soil being assessed. These functions include support for the development of living organisms, water and nutrient fl ows, diversity and productivity of plants and animals, elimination or detoxifi cation of organic and inorganic contaminants. Likewise, the selection depends on the sensitivity of these properties to soil management or changes in climate, as well as the accessibility and usefulness to producers, scientists, conservationists and policy makers (Doran and Parkin, 1996, Rezaei et al., 2006).
The selection of indicators implies to know the target of the research and the capacity to interpret the indicator. The sensitivity of the soil property depends on the relationship between the indicator and the soil function that is being evaluated, the facility and reliability of measurement, the variation in times (crop rotation, effect of seasons) or cultural management as application of organic matter (Rezaei et al., 2006).
Moreover, many soil ecosystem functions are diffi cult to infer directly and, consequently, other measurable properties are necessary to defi ne soil quality especially in time (Magdoff and Weil, 2004). Some indicators may change faster than other ones; thus, not only the changes detected must be real but also suffi ciently sensitive within short periods. In this way, thanks to the indicator a quick action on the agro ecosystem can be implemented to correct problems before undesirable situations or irreversible loss of soil quality occurs. General properties such as aggregate stability, density, pH, salinity, cation exchange capacity, microbial biomass, enzymatic activity, and basal respiration are used as indicators of soil quality (Magdoff and Weil, 2004).
In fact, some authors suggest that a soil quality indicator is not adequate if it is not directly related to the target user. If the goal is a soil quality index for crop production, then soil organic matter, infi ltration, soil aggregation, pH, microbial biomass, N forms, density, electrical conductivity or salinity, and removable nutrients, represent a group of indicators that can be used to describe most of soil basic functions. In addition with these functions, the ability to accept, hold and release water to plants, maintain productivity and respond to management and erosion processes could be included (Rezaei et al., 2006).
In the same way, for a better interpretation of soil quality indicators, Segnestam (2002) suggested the need of using a baseline to compare and determine positive or negative impacts on environment. Variations in time and rates of change of the property used as indicator, as well as local conditions should be determined to defi ne potential models for larger scales but could

42
be necessary to adjust for each situation (Cantú et al., 2008). For this reason the indicators associated to organic matter are considered to determine soil quality. They can correlate with high-sensitivity properties, and can offer to stakeholders, policy or research institutions results in short time so that decisions for a given agro ecosystem can be made on a timely manner.
3.3.4. Role of soil organic matter and associated indicators
Soil organic carbon (SOC) is a soil property considered as an important indicator of soil quality (Haynes, 2005). It is directly related to the maintenance of soil structure, water holding capacity, presence of different groups of microorganisms, mineralization of organic matter and nutrient availability (Goulding et al., 2000).
Soil properties associated with soil organic matter (SOM) have been recognized as key indicators (Doran and Parkin, 1994) and to have an effect on other properties (Fig 3.6) Soil organic matter defi nes the energy supply to microorganisms, availability and quality of substrates, and the biodiversity necessary to sustain many soil functions. However, SOM varies with changes in climate, soil and crop management, being higher in places with larger average annual precipitation (Burke and Cole, 1995), lower mean annual temperature and higher clay content (Nichols, 1984). Similarly, the content of SOM is affected by intermediate grazing intensity (Allen 2010), incorporation of crop residues or the addition of organic matter fractions (Franzluebbers et al., 1998) and by soil management practices such as minimum or conservation tillage (Acosta-Martinez and Tabatabai, 2001).
Addition OrganicMatter
Increase in biologicalactivity and diversity
Reduction of rootdisease and
parasitic nematodesBetter tilth and
Water holding capacityWHC
Increase ofaggregation of
particules in soil Decomposition
Humus and growpromotingsubstances
Detoxification ofhazardoussubstances
Better yield and quality
Nutrients
Better porosity and structure
Fig. 3.6. Role of Organic Matter on soil propertiesMargdof and Weil (2004).
Regarding SOM decomposition, there are factors such as N, P, or polysaccharide content that affects its decay, altering soil properties associated with soil quality. Some fractions, like starch or protein, are easily metabolized. Humic substances are more resistant to decay (Tate, 1987) and participate in nutrient exchange processes as well as in the formation of aggregates between organic substances and mineral particles, and in the immobilization of toxic materials (Ceccanti and Garcia, 1994).
43
Content and composition of SOM is affected by soil management, particularly when comparing organic with conventional soil management. However, changes in total SOC content from land use changes may be diffi cult to detect. Water soluble organic carbon (WSC) is a property which is more sensitive to change (Haynesand Beare, 1996), because are directly related to mineralization process in aqueous medium. Chan et al. (2002), found that particulate organic matter related to aggregate stability and nitrogen mineralization is more responsive to changes in management practices, than the total organic carbon.
Once organic matter, in different stages of decomposition, such as compost, manure or humic extracts, is applied to the soil, microbial communities are able to degrade it by mineralization, which occurs, depending on the local climate (Vargas-García and Suárez-Estrella, 2008). The mineralization is the transformation through enzymatic activity, of organic matter that can reach the total destruction of organic compounds resulting in simple products such as CO2, NH3, H2O, etc. It is an important factor in recycling of N, P, S and CO2 (Leon et al., 2006) and results in the improvement of soil fertility by the accumulation of nitrogen, phosphorus, and other plant nutrients in the soil solution, effects that cannot be sustained over time. After mineralization, humifi cation, a new process, starts. Humifi cation is a process of chemical changes in organic matter, increasing molecular complexity and resistance to biodegradation. This process is also called stabilization or accumulation and refers to the inclusion or polymerization of organic molecules (Tate, 1987). Dick and McCoy (1993) indicated that mineralization and humifi cation processes take place slowly in temperate zones, offering chemical, physical, and biological benefi ts for several years by increasing the levels of soluble organic carbon (WSC). Moreover, in tropical areas, there is an active mineralization rate leading to rapid depletion of stocks of organic and mineral nutrient, depending on the type of soil and climate (Busby et al., 2007).
Mineralization and humifi cation, are opposite processes that result from chemical and biological reactions that normally take place in each soil system. To understand the dynamics of soil organic matter, it is necessary to know the balance that occurs between degradation and synthesis. Soil is naturally in equilibrium when it is not under antropogenic intervention. However, in intervened soils the equilibrium tends to be altered either by increased mineralization, with the consequent reduction of organic status, or mineralization decreases in aerobic conditions (Heredia et al., 2007).
Regarding the processes of mineralization and humifi cation, the products may vary over time, depending on environmental conditions and on the presence of available nitrogen. Authors such as Weber et al. (2007) found a relative increment of HA (in relation to FA) in urban soils amended with compost, for some time, while Stride et al. (2004) found a depolymerization of HA to FA over time in soils where compost from municipal solid waste was applied. Almendros et al., (1989, 2004) described, progressive degradation, accumulation of humic-like substances and microbial products after compost application to soil.
Likewise, differences in the concentration of HA during the humifi cation at different temperatures (Bertoncini et al., 2007, Contreras et al., 2004) with smaller increases during winter are described in the literature (Madrid et al. 2004).
3.3.5. Soil indicators and environmental changes
Agricultural production results in changes in the ecosystem, not only because of the application of fertilizers or organic amendments, but also because of the production of organic wastes, or the intensifi cation of land use with lasting, even permanent consequences, such as reduced fertility, productivity and biotic community structure (Stevenson, 1994), resulting in changes in soil quality.
When soil quality (soil properties) change, there is an effect on, water and air quality, which has an impact in terms of environmental and agricultural sustainability (Fig.3.7) (Doran and Zeiss, 2000; Andrews et al., 2002).

44
Fig. 3.7. Soil quality and agricultural sustainability. Andrews et al. (2001), USDA (2008).
The determination of the changes locally, regionally, nationally and globally, could help to better assess environmental problems, identify and evaluate the results of the implementation of International conventions and national and trade association regulations or standards. These changes could be measured using environmental indicators.
An indicator is a variable that summarizes and simplifi es important information about a phenomenon or condition making it visible. An indicator should be measured, quantifi ed and communicated in a comprehensible manner by different stakeholders such as producers, trade associations, scientifi c community or agricultural or environmental policy institutions. Indicators can include qualitative or nominal variables, ordinal or ranks, especially when there is no quantitative information available or when the geting such information may be costly. An indicator is a tool for the analysis of changes and should be simple, limited in number (high degree of aggregation), interdisciplinary, sensitive to temporal and spatial variations, climatic, environmental and anthropogenic changes (Doran and Zeiss, 2000).
Indicators are superior data as an analytical tool for several reasons. Firstly, they can work as a basis for assessment by providing information on conditions and trends of sustainable development. Secondly, as a basis of such assessments, indicators can provide input to policy formulation processes. Thirdly, by presenting several data in one number that is commonly simpler to interpret than complex statistics, they can facilitate the communication among different groups, for example between experts and non-experts. When two or more indicators, alternatively several data, are combined an index is created. Indices are commonly used at more aggregated analytical levels such as at the national or regional level. At these levels, it may not be easy to analyze the causal links using individual indicators since the relationships among different indicators become more and more complex the more aggregated the analytical level is. However, there are problems with computing indices as well. For example, sustainable development indices are extremely complex to create, and indices that cover issues from one and the same sector, or aspect, are thus more common (Segneststam, 2002).
The World Bank in its document “Indicators of Environmental and Sustainable Development”, points out the importance of establishing a baseline of activity that can impact the system positively or negatively. This base line is used to monitor or follow up on the negative impacts and to defi ne a threshold limit or goals and objectives to assess whether the positive impact of response persists over the time (Segneststam, 2002).
These indicators and indices can be developed for soils under different scenarios (Doran and Parkin, 1994) or regional or local situations (Cantú et al., 2002, Lilburne et al., 2004, Cantú et al., 2007). The construction of an index depends on the availability of adequate data and processing (Barbiroli et al., 2004). Several soil quality indices have been proposed, associated with the effect of organic matter (Andrews et al., 2002; Wander and Bollero 1999) on disturbed soils (Chaer et al., 2009) or the impact of the quality of irrigation water on soil (Mandal et al. 2008).

45
Soil classifi cation and interpretation are traditionally based on factors such as climate, parent material, time, topography and vegetation, and inherent qualities. This is the reason why single values to describe the quality of soil for all land or land uses cannot be used. The dynamics of soil that occur between 20-30 cm depth descibes the status of specifi c soil conditions, and may show relatively recent changes in land use or crop management (Karlen et al., 2003) offering the possibility of relating better with improvement or degradation processes of soil (Fig. 3.8).
Fig. 3.8. Possible temporal trends in dynamic soil quality assessments. Karlen et al., (2003). 3.3.6. Soil quality index
The concept of integrated indicators for soil proposed by Larson and Pierce (1991); applies concepts of soil ecology to assess the sustainability of the soil and ecosystem management, combining a variety of information that uses multi-objective analysis (Andrews and Carroll, 2001).
Internationally, there are kits of semiquantitative indicators, for 0-7,6 cm soil depth that include bulk density, infi ltration rate, water holding capacity, electrical conductivity, pH, NO3 and soil respiration, as developed by Soil Quality Institute (Doran, 1994, USDA-NRCS, 1998). There is also the Visual Soil Assessment protocol developed for local conditions in New Zealand and includes soil structure, porosity, color, earthworm number, evidence of a tillage pan and apparent susceptibility to wind, and water erosion. This index also correlated quality characteristics of the plant as uniform emergence, height, root development, disease incidence and costs associated with the handling properties of soil. In this protocol there are combined characteristics of pedogenesis with plant response as key indicators (Shepherd, 2000).
Four main steps are usually followed in order to determine a soil quality index or SQI: (i) to defi ne the management goal(s); (ii) to select a minimum data set (MDS) of indicators that best represent soil functions as determined by the specifi c management goals; (iii) to score the MDS indicators based on the performance of the soil functions; and (iv) to integrate the indicator score into an index of soil quality (Karlen et al.,2003; Mandal et al.,2008).
Crop yield can be an important indicator of soil quality because it serves as a plant bioassay of the interacting soil characteristics. However, productivity alone may not always be the main criterion by which sustainability of an agricultural system should be judged.
Hussain et al. (1999), adapted this SQI in order to assess the effect of three management systems (no-till, chisel plow and moldboard plow) on soil quality under maize and soybean crops. They concluded that the methodology was sensitive to detect problems on soil quality

46
caused by soil management. Glover et al. (2000) used this methodology to assess soil quality in apple orchards and observed higher SQI in integrated management than in conventional or organic managements. In Brazil, Melo Filho et al. (2007) used this methodology to assess the SQI of soils under natural forest, observing a low value of SQI mostly because they oriented its SQI to crop production (Acosta, 2011).
The Natural Resources Conservation Service USDA-NRCS, proposed in 2003 the Soil Conditioning Index (SCI) in conservation planning. This index was developed to estimate the effect of conservation practices in the maintenance or increase of organic matter levels in soil, assuming that the organic matter content in soil is an indicator of quality (USDA-NRCS, 2003). The choice of appropriate attributes or properties should allow for inclusion in the index, showing properties not only effects on the specifi ed function, but also on production and sustainability of the crop (Granatstein and Bezdicek, 1992). On this way, the values of indicators can be combined in a Soil Quality Index (SQI) that is measurable through a fl exible model. Moreover, a valid SQI could also: (i) provide an early indication of soil degradation and the need for taking remedial measures, and (ii) show changes in soil properties, according to base line (Mandal et al., 2008).
In other cases, the applied methodology standardizes the indicators. Cantu et al. (2007), in mollisols soils of low to moderate development in Argentina, determined an index of soil quality, obtaining a single value for each parameter. Indicators were according to the proportion that each operation had in the total area. Afterwards, the indicators were standardized using a 0-1 scale representing, respectively, the worst and best condition from the point of view of quality, regardless of the absolute values measured for each indicator. The authors concluded that indicators of soil resources are not universal and must be chosen depending on the environment and soil of the region.

47
4.1. Location
The study was performed within Empresas Bauzá, located in the Ovalle Comune at Limarí Valley (29°54′28″S, 71°15′15″W), in the Coquimbo Region of Chile (Fig. 4.1). The climate is classifi ed as steppe according to Köppen Climate Classifi cation System (Pidwirny and Irving, 2009 on line), with a thermal amplitude of 20°C, an average annual precipitation of 100 mm and a mean minimum and maximum temperatures of 6.3 and 28.5 ºC, respectively.
Fig.4.1. Location of Bauzá Table Grape Production
The study included four phases: 1) compost production based on grape marc, 2) extraction of humic substances from compost, 3) evaluation of compost and humic substances in a pot experiment, and 4) evaluation of humic extracts and nitrogen under fi eld conditions.
4.2. Composting Process
The compost was elaborated based on the raw materials available, and these materials were collected in October 2008 to April 2009. Nine compost piles (18 m length x 2 m width x 1,5 m height) were composted from May to November 2009 (winter-spring season) and kept in maturity until January 2010 (spring-summer season). The piles were turned mechanically every 10 days, to provide oxygen and to give homogeneity to the system. Moisture content of each pile was adjusted according to a manual test, by adding water to maintain optimum composting conditions (approximately 60% moisture). Pile temperatures were measured using thermocouples connected to loggers, and analogue thermometers at top, middle, and bottom locations of each pile. Treatments consisted on different proportions of residues from the Pisco industry, grape pomace, pruning materials, and manure (Table 4.1). The materials were
CHAPTER IV
MATERIALS AND METHODS

48
analyzed in terms of their chemical composition, physical characteristics as well as microbial activity, every 60 days, until 220 day from establishment.
Table 4.1. Composition of evaluated treatments
Treatment HM GM GP-Fresh GP-Aged YFR PR+OS Total------------------------------------------------------%----------------------------------------------------
1 1 0 89 0 0 10 1002 9 7 82 0 0 2 1003 0 0 91 0 0 5 1004 0 50 50 0 0 0 1005 0 63 33 0 0 4 1006 22 25 53 0 0 0 1007 21 26 21 28 0 4 1008 42 20 33 0 0 5 1009 0 66 34 0 0 0 100
HM=horse manure; GM=goat manure; GP=grape pomace; YFR=yeast and fermentation residues; PR=pruning residues; OS=oat straw.
Fig. 4.2. Raw material used in co-composting process. a) Goat manure b) Grape pomace “orujo” (Pis-co industry) c) Grape pomace “escobajo”
4.2.1. Compost sampling
Samples for microbiological and chemical analysis were collected, when the compost was turned, from three equidistant cross sections to a 60-cm depth from the pile surface, using a 5-cm diameter soil probe (Rodríguez et al., 2007). Ten subsamples were randomly collected and mixed to form a composite sample; two replications per treatment were collected.
4.2.2. Analytical determinations
Immediately after sampling, samples were homogenized by hand. Subsamples were taken for immediate analysis of microbiological parameters, moisture, pH, electrical conductivity and water-soluble nutrients, and for drying at 60°C up to constant weight. The rest of each sample was cooled and stored for later use.
4.2.2.1. Microbiological analysis
Bacterial (Bact) populations were determined using the micro drop method on nutritive agar (NA) (Merck). Fungi and yeast (F&Y), cellulolytic (Cellul), amylolytic (Amyl), and phosphate solubilizing microorganisms (Psol) were determined by surface plate count method in specifi c media: potato dextrose agar (PDA Merck media) yeast peptone dextrose agar (YPD, Merck)

49
cellulose agar, starch agar, milk agar and SMRS1 agar, SRSM (Sundara Rao and Sinha, 1963) respectively (Pedroza et al., 2003; Caballero et al., 2007); for the cases of the amilolytic and cellulolytic groups, it was necessary to reveal the activity by the addition of lugol (Merck) and congo red 1% (m/v), respectively (Pedroza et al., 2003). Microbial colonies were counted as colony forming units per fresh gram (cfu g-1).
4.2.2.2. Enzymatic activity
The acid (AcP) and alkaline phosphatases (AlkP) were determined using p-nitrophenyl phosphate (Sigma) as substrate, and measuring the product p-nitro phenol to determine the phosphatase units (1 phosphatase unit is defi ned as UP = μg p-nitrophenol released per gram of dry sample per hour) (Dick et al., 1996). The group of β-glucosidases (β Glu) were evaluated by also measuring the p-nitrophenol released, but in this case, from the substrate p-β-D-glucopyranoside (Sigma), expressing the results in terms of β-glucosidase units (UBG = μg p-nitro phenol released per gram of dry sample per hour) (Dick et al., 1996). Ureases (U) were extracted following the method of Nannipieri et al. (1980) and their activity measured by the indophenol blue method, it was expressed in terms of urease units (UU = μg NH4 released per gram of dry sample per hour). The following is a summary of the units used: Acid phosphatase (UP: μg p-nitrophenol g-1 h-1). Alkaline phosphatase (UP: μg p-nitrophenol g-1 h-1). β-glucosidase (UBG: μg p-nitrophenol g-1 h-1). Urease (UU: μg NH4 g
-1 h-1).
4.2.2.3. Chemical and maturity properties
Electrical conductivity (dS m-1) and pH were analyzed in 1:5 (w/v) water-soluble extract (Thompson et al., 2001: TMECC 04.10; TMECC 04.11), total carbon (TC%) and total nitrogen (TN) were determined by the dry combustion method (Dumas method) in a LECO analyzer (TMECC 04.02-D).
The extraction ratio effect on humic substances content and concentration was determined evaluating different compost:extractant ratios, including: 1:7,5, 1:10, 1:15 and 1:30, respectively. Extractant used was 0,1M KOH.
Fulvic acids (FA) content were determined, extracting the compost material with 0.5 M NaOH and after 18h of agitation and centrifugation (9000 rpm). Precipitation of humic acids (HA), was made by acidifying the extract below pH 2,0 (Schinitzer, 1982; Anderson and Schoenau, 1993). Both fractions were dried and weighed. HA and FA substances were calculated based on mg HA or FA per g of compost. Optical densities of the HS solutions were measured at 465 (E465) and 645 (E645) wavelengths on a HACH UV-Visible spectrophotometer, and these values were used to calculate de E4/E6 ratio (Chen et al., 1977). The NH4-N and NO3-N contents were determined according with the TMECC 05.02-C method. The phytotoxicity of the compost samples was determined following the method of Zucconi et al., (1981) using radish seeds (Raphanus sativus L.) and the germination percentage (% Germination), based on a control with distilled water, was determined using the method TMECC 05.05-A. All determinations were made in triplicate. Fecal coliforms and E. coli were determined using MPN technique in LMX-MUG broth. The results were expressed as most probable number (MPN) g-1 (TMECC 07.01-B). Salmonella spp. detection and quantifi cation was made according to the most probable number (MPN), expressed as MPN 4 g-1 (TMECC 07.02-B). Heavy metals were determined using digestion in nitric acid and microwave (TMECC 04.12-A) and atomic absorption spectrophotometry (TMECC 04.13-B) (Thompson et al., 2001). 4.2.3. Statistical Analysis
The experiment was treated as a factorial on a completely random design. Factors were compost piles and sampling dates. Main effects and interactions were evaluated by analysis of variance and protected LSD (p<0.05) in SAS (SAS Institute, 2000). Since one of the objectives of compost application is to add humic substances to the soil, a mathematical linear model including those

50
properties that can explain the maturity in terms of humic substances content was developed. For this, the stepwise method, within the regression procedure in SAS, was used (SAS Institute, 2008).
4.3. Evaluation of C rates in pots
4.3.1. Experimental design
One-year old nursery table grape (Vitis vinifera) plants of the Thompson seedless variety, cul-tivated on their own roots (no rootstock), were used, in a completely randomized experimental design. The evaluation period corresponded to one growing season (September to May) and one calendar year in total (from early May 2009 to May 2010). Plastic bags of 20 L of volume were used.
Treatments consisted on the application of two organic matter sources at three rates each: 1) mature compost from grape pomace and 2) liquid humus (humic substances extracted by alkaline treatment). Evaluated rates were the following: Compost, 0, 125, 250 y 500 g C pot-1; liquid humus, 0, 25, 50 and 100 g C pot-1; Compost and liquid humus at their maximum C rates were also evaluated in absence of chemical fertilization. Both products at all rates were evaluated in the presence or absence of a microbial inoculant; besides, compost and liquid humus (extracted according to methodology described in 4.3.1.1) at their maximum rates (2000 g pot-1 and 4000 ml ha-1, respectively) were evaluated in absence of chemical fertiliza-tion. With these different combinations, eighteen treatments were arranged with 6 replications, using two controls: only chemical fertilization and an absolute control without any application. Equivalent C rates for each treatment are presented in Table 4.2.
Table 4.2. Evaluated treatments using different organic ammendments in Pot experiment.
Treatment C source Chemical fertilization1
Compost (g pot-1)2
Humic + Fulvic
acids (L pot-1)3
Microbial Inoculant mL/pot -1
C rate (g pot-1)
1 Compost Yes 500 1252 Compost Yes 1000 2503 Compost Yes 2000 5004 Compost No 2000 5005 Compost Yes 500 400 5006 Compost Yes 1000 400 5007 Compost Yes 2000 400 5008 Compost No 2000 400 5009 humic+fulvic acids Yes 10 25
10 humic+fulvic acids Yes 20 5011 humic+fulvic acids Yes 40 10012 humic+fulvic acids No 40 10013 humic+fulvic acids Yes 10 400 2514 humic+fulvic acids Yes 20 400 5015 humic+fulvic acids Yes 40 400 10016 humic+fulvic acids No 40 400 10017 None Yes 018 None No 0
1Chemical fertilization: Entec 21 (stabilized ammonium with nitrifi cation inhibitor DMPP): 20 g pot (-1), phosphoric acid 15 mL/pot and potassium sulfate 10 g/pot. 2Application once at the beginning. 3 Four applications 1, 4-6 4 two applications, one at 1st week
and other at week 6th.

51
Fig. 4.3. Pot experiment, detail
Compost was obtained from an optimized co-composting process of grape pomace with goat manure (Martínez et al., 2011); liquid humus was extracted from the same compost by the fractionating method (described below), and one microbial inoculant was obtained by isolating bacteria from the compost (method described below).
4.3.1.1. Extraction of humic substances
The best extraction ratio was used to prepare the extraction of humic substances at large scale 1000 L (Ortega, personal communication).Liquid humus was obtained following a frac-tioning method of soil humic substances described by Anderson and Schoenau (1993), using a ratio 1:10 compost: extractant (0,1M KOH) and 18 hours for extraction time. As a result of this fractioning process, humic (HA) and fulvic acids (FA) were obtained (Fig. 4.4).
Fig. 4.4. Liquid humus obtained by fractionation method
4.3.1.2. Microbial Inoculant Production
The inoculant was a mixture of enzyme-producer microorganisms including Pseudomonas sp., Ochrobactrum anthropi, Brevundimonas sp. and Sphingomonas paucimobilis, isolated from compost made of grape pomace and goat manure. These microorganisms were grown to the late exponential phase in a sterilized medium prepared and standardized at the Microbiology Laboratory of the Advanced Center of Technology for Agriculture (CATA), of Federico Santa Maria University (Chile). The resulting cultures contained 6.2 x 10¹⁰ cfu ml-1 and were applied at the rate of 200 mL pot-1 in the corresponding treatments (Table 4.1). The liquid humus and inoculant were applied at the surface of the pot, surrounding the vine plant. Compost was also surface applied once, at the beginning of the experiment. Liquid

52
humus was split applied ten times during the season, while the inoculant was applied twice. Fertilized treatments included the application of 25 g N pot(-1), 9 g P2O5 pot(-1) and 30 g K2O pot(-1), applied as Novatec Solub 21 (21%N), phosphoric acid, and potassium sulphate (50 % K2O), respectively; fertilizers were applied in solution in six equal splits during the season. The cultural practices, including irrigation and manual weed control, were the same for all treatments.
4.3.2. Measured variables
Initially, organic materials were evaluated by chemical, biochemical and microbiological analyses, according to the Chilean Standard NCh 2880/2004 (INN, 2004) as well as by the standard parameters proposed by the Test Methods for Examination of Compost and Composting (TMECC, 2002).
Soil samples from each pot were collected at 20 cm depth at the end of the experiment and analyzed in laboratory to determine soil quality parameters.
4.3.2.1. Soil variables
Chemical analysis were done according to the methods recommended by the Chilean Normalization and Accreditation Commission for soil analysis (CNA, 2006), and included: NO3-N (mg*kg-1), NH4-N (mg*kg-1) (Self y Rodriguez, 1998, modifi ed by Ortega y Mardónez, 2005) Olsen-P (ppm), organic matter (OM%), total N (%), Total C (%), water soluble C (WSC), pH, and electrical conductivity (EC-dS* cm-1); humic and fulvic acids content (%-HS) were determined by the method described by Anderson and Schoenau (1993) and E4/E6 ratio was determined according to Chen et al.(1977). Microbial populations were determined by the plate count method for isolating total bacteria (Bact) (nutrient agar), fungi (F) (PDA agar), yeasts (Y) (YPD agar), actinomycetes (Acty) (oat agar), and phosphate solubilizer microorganisms (Psol) (SMRS1 agar) (Martinez et al., 2010); enzymatic activities were determined following the methods recommended by Dick et al. (1996), including β-glucosidase (β Glu: p-nitrophenol method), and acid and alkaline phosphatase (AcP and AlkP) activities (μg de para-nitrophenol g-1h ) (p-nitrophenol method); urease (U) activity (μg de NH4 g-1h) was determined by the method proposed by Kandeler et al. (1999) determining NH4 by the indophenol blue technique.
4.3.2.2. Agronomic variablesTwo agronomic parameters, trunk diameter (TD) (in cm) and plant height, were measured at times 0, 8, and 13 months from plantation. The diameter was measured with a caliper and the shoot cross sectional area (SCSA) was calculated as indicator of vigor [2].
[2]
On the other hand, at the fi nal evaluation time, roots of each treatment were collected to determine root dry matter (DM) (g) by oven desiccation at 70°C until constant weight; the root density (RD) (g L-1) was determined by washing a 250 mL of soil sample throughout a sieve to collect the rootlets, which were desiccated in oven at 70°C until constant weight to determine their dry matter; results were expressed as density units dividing the mass into the volume of soil washed.
4.3.2.3. Statistical analysis
Data were analyzed using SAS statistical software (SAS, 2008). Statistical analysis included analysis of variance (ANOVA) with protected LSD test (p<0.05), and correlation analysis. Regression analysis was used to defi ne the frequency response of measured on different matrices (soil, compost, humic extract (HE)).

53
4.4. Crop Production
4.4.1. General description
This study was carried out during two successive seasons (2009 -2010 and 2010-2011) on a year old Thompson seedless Table grape orchard, freedom rootstock, planted on sandy soil under drip irrigation system in a fi eld located within Bauza Company. Plants were maintained with basic fertilization: Basacote (slow release fertilizer NPK:16-8-12+2Mg; effective durability, 3-4 months according to producer. COMPO®, 2012) 50g/vine, goat manure 1 kg year-1, and nematicide. The vines were cane pruned with three wire trellis, supported by wooden poles and irrigated via drip irrigation system.
Three base line soils were used: the soil from the mountain xerophilic forest (BLM), the soil from the riparian vegetation around Rio Claro River (BLR) and fi nally, the uncultivated soil from the table grape agroecosystem (AGS) (Fig. 4.5). The experimental soils were alluvial inceptisols with low organic matter content (Table 4.3, Fig. 4.6), under routine chemical fertilization.
Fig. 4.5. Limits of Field experiment and Base Lines location.Total area of table grape including North and South distributed experiments, and Mountain Xerofi lic vegetation, Riparian vegeta-
tion around Rio Claro River and Agroecoystem Uncultivated asoil (AES) used as base line.
Each treatment was replicated fi ve times with one vine per treatment and the randomized complete block design was arranged in two areas (North and South) as true replications (Table. 4.3). At the end, 10 vines/ treatment were used totalling 160 plants. The texture of the soil is sandy; the physical and chemical properties of the experimental soil are presented in table 4.4.
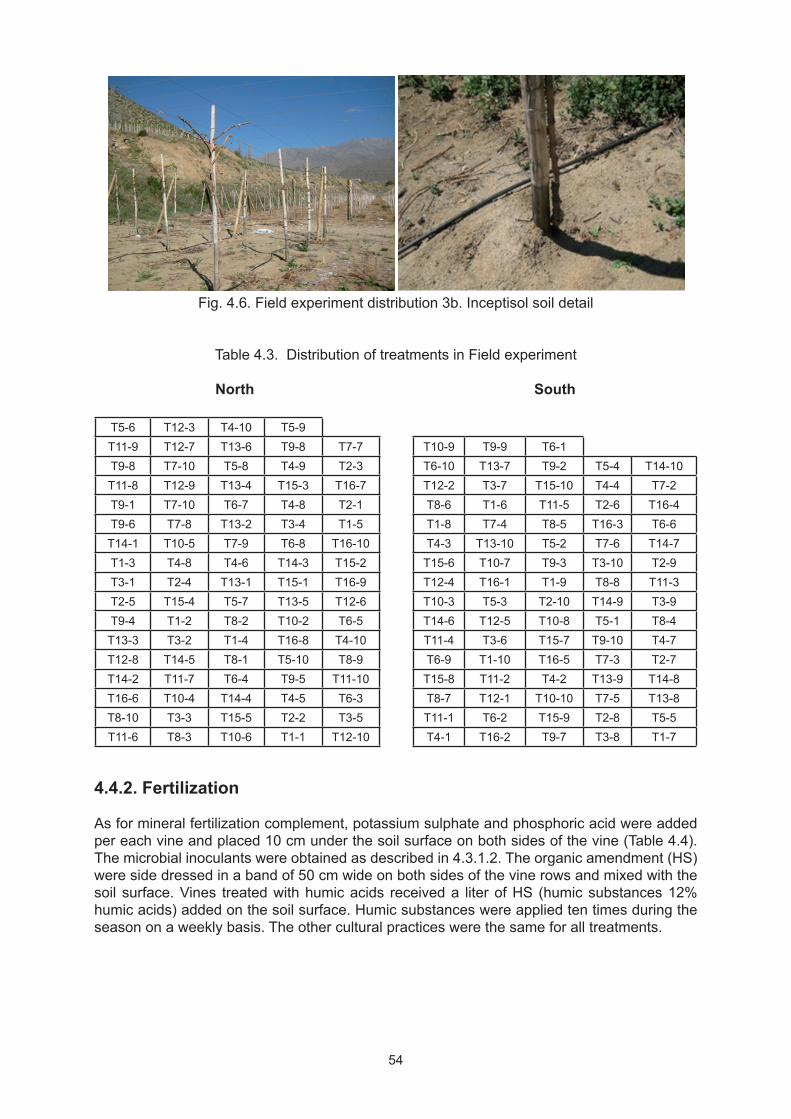
54
Fig. 4.6. Field experiment distribution 3b. Inceptisol soil detail
Table 4.3. Distribution of treatments in Field experiment
North South
T5-6 T12-3 T4-10 T5-9 T11-9 T12-7 T13-6 T9-8 T7-7 T10-9 T9-9 T6-1 T9-8 T7-10 T5-8 T4-9 T2-3 T6-10 T13-7 T9-2 T5-4 T14-10T11-8 T12-9 T13-4 T15-3 T16-7 T12-2 T3-7 T15-10 T4-4 T7-2T9-1 T7-10 T6-7 T4-8 T2-1 T8-6 T1-6 T11-5 T2-6 T16-4T9-6 T7-8 T13-2 T3-4 T1-5 T1-8 T7-4 T8-5 T16-3 T6-6
T14-1 T10-5 T7-9 T6-8 T16-10 T4-3 T13-10 T5-2 T7-6 T14-7T1-3 T4-8 T4-6 T14-3 T15-2 T15-6 T10-7 T9-3 T3-10 T2-9T3-1 T2-4 T13-1 T15-1 T16-9 T12-4 T16-1 T1-9 T8-8 T11-3T2-5 T15-4 T5-7 T13-5 T12-6 T10-3 T5-3 T2-10 T14-9 T3-9T9-4 T1-2 T8-2 T10-2 T6-5 T14-6 T12-5 T10-8 T5-1 T8-4
T13-3 T3-2 T1-4 T16-8 T4-10 T11-4 T3-6 T15-7 T9-10 T4-7T12-8 T14-5 T8-1 T5-10 T8-9 T6-9 T1-10 T16-5 T7-3 T2-7T14-2 T11-7 T6-4 T9-5 T11-10 T15-8 T11-2 T4-2 T13-9 T14-8T16-6 T10-4 T14-4 T4-5 T6-3 T8-7 T12-1 T10-10 T7-5 T13-8T8-10 T3-3 T15-5 T2-2 T3-5 T11-1 T6-2 T15-9 T2-8 T5-5T11-6 T8-3 T10-6 T1-1 T12-10 T4-1 T16-2 T9-7 T3-8 T1-7
4.4.2. Fertilization
As for mineral fertilization complement, potassium sulphate and phosphoric acid were added per each vine and placed 10 cm under the soil surface on both sides of the vine (Table 4.4). The microbial inoculants were obtained as described in 4.3.1.2. The organic amendment (HS) were side dressed in a band of 50 cm wide on both sides of the vine rows and mixed with the soil surface. Vines treated with humic acids received a liter of HS (humic substances 12% humic acids) added on the soil surface. Humic substances were applied ten times during the season on a weekly basis. The other cultural practices were the same for all treatments.

55
Table 4.4. Fertilization program during the fi eld experiment NOVATEC 21
KSO4
Phosphoric ác.
Liquid Hu-mus 6
g plant-1 g plant-1 mL plant-1
(1%)L/plant/week
Treatment C rate (kg ha-1)
N rate (kg/ha)
W1 W 2-3
W4
PH W1-6 W1-4 w1 to w10
1 0 0 0 0 0 0 30 600 0
2 125 0 0 0 0 0 30 600 2,5
3 250 0 0 0 0 0 30 600 5
4 500 0 0 0 0 0 30 600 10
5 0 30 29 23 17 23 30 600 0
6 125 30 29 23 17 23 30 600 2,5
7 250 30 29 23 17 23 30 600 5
8 500 30 29 23 17 23 30 600 10
9 0 60 57 46 34 46 30 600 0
10 125 60 57 46 34 46 30 600 2,5
11 250 60 57 46 34 46 30 600 5
12 500 60 57 46 34 46 30 600 10
13 0 120 114 91 69 91 30 600 0
14 125 120 114 91 69 91 30 600 2,5
15 250 120 114 91 69 91 30 600 5
16 500 120 114 91 69 91 30 600 10T: treatment; C: carbón rate; N: nitrogen rate; W: week; H:Harvest; PostH: Post Harvest
4.4.3. Measured tissue variables
To determine plant nutrient concentration, leaf samples were taken at veraison i.e. ripening onset (20 per experimental unit), in both seasons. Samples were dried at 65°C and were later grinded with a 40 mesh sieve. Nitrogen (N) (%) concentration was determined using a LECO (CNS-2000 Macro Elemental Analyzer; Leco Corp, St. Joseph, MI, USA). For Olsen P (ppm P), the ashes were analyzed forming a complex with molybdate-vanadate and then measured using a molecular absorption spectrophotometer. Micronutrients were determined by atomic absorption. Leaf mineral contents (total N (N), Nitrate reductase (NRed), Metabolized nitrogen (MetN), N-NH4, N-NO3, Total N (%N), Chlorophyll a (Chl a), b (Chl b) and total (TChl), and Total C (%C), were determined in blades from mature leaves (5-7th leaves from shoot top) opposite to basal clusters according to the methods described in Sadzawka et al., 2007. Total chlorophyll was determined according to Parra y Criedeman (1989), SPAD (Rozas y Echaverria,1998) and nitrate reductase defi ned as UNR :μg NO2 g
-1*h, was determined according to Godoy (2004).
4.4.4. Measured soil variables
Soil analyses were done, for the top 30 cm, before the beginning of the experiment and at har-vest, on both growing seasons. Samples were taken from each experimental unit and pH and electric conductivity (EC) were determined. At the same time chemical, microbiological and biochemical analysis (described in 4.3.2) were determined.

56
4.4.5. Measured Yield and Berry Quality Characteristics
At harvesting time (late February) the yield expressed in weight (kg) and harvest in T ha-1 of exportable fruit was determined. All bunches were collected from all plants (a total of 160 plants), and with the help of the harvesters team, the clusters were selected in the fi eld. All clusters were classifi ed according to their characteristics in “discarding” and “packing”. The weight of the discarded was obtained and this grape results in grape raisins.
The harvest boxes were transported from fi eld to packing plant, and there took place the calssifi cation of clusters according to size of the berry, color, weight, giving the properties for small (S: <700g), medium (M:700-800 g), large (L: 800-1000g) or extra large (XL: >1000g) size, all for English market (Fig. 4.7).
Fig. 4.7 Packing clasifi cation in Varillar, Bauza Company.
A sample of 6 clusters per each treatment were randomly taken from each replicate to determine berries quality in terms of Brix, Chlorophyll a and b (μg g-1 fw), Total Chlorophyll and total acidity (TA) (expressed as g tartaric acid 100 g-1 of juice); properties were determined as outlined in A.O.A.C. Polyphenols (Poly) (*100g-1) and Anthocyanins (Ant) were determined according to Longo and Vasapollo (2005) and, polyphenol oxidase content (one unit is defi ned as UPPO=μg TBQ/g*h) was determined according to Casado et al. (2005), modifi ed method. The remaining bunches were stored at 0◦C for 30 days, and after that period, berry fi rmness was determined. Additionally, in each season, grape bunches were classifi ed in exportable and national quality according to Bauza, International Market standards.
4.5. Selection of compost, soil and fruit variables for a quality
A proper index to measure quality should have certain characteristics:
1. Be simple to measure.2. Be sensitive to changes in time and management.
The sensitivity to changes can be measured in at least two ways: 1) establishing if the property changes over time, as a result of the management imposed, which technically can be proved by regressing the property of interest against time, and 2) through the variance of each prop-erty.
In order to select the properties for compost, soil and fruit quality indices, the following steps were performed.
1. Each measured property was standardized either obtaining a Z score (with mean=zero and standard deviation=one) or dividing each observation by the maximum among all ob-servations in order to obtain 0 to 1 values.

57
2. In the case of compost and soil for both, the pot and fi eld experiments, each measured property for each treatment, and for all treatments together, was regressed against time (in months) from the baseline. The outcome for these regressions could be a positive slope, a negative one, or a zero slope, which will mean no change of that particular property with re-spect to the base line (Figure 4.8). Hence, the slope will corresponded to the weight of each property. Only those variables with signifi cant (P<0,05) slopes were considered. Frequency response was estimated by dividing the number of signifi cant (P<0,05) responses among the evaluated treatments over the total number of them. Corrected weights were estimated by multiplying the average response coeffi cient (slope) times its frequency response. Final weights were corrected to add to one.
3. In the case of fruit, since there were not measurements over time, only the variability among treatments was used as a criterion to select the properties that would be part of a quality index. In this case a composed index based on coeffi cient of variation of each prop-erty (Ortega and Santibáñez, 2007) was estimated. Only those properties varying more than the average CV + 0,5 (standard deviation) were considered. Thus, only properties at the 30% superior in terms of variability were considered.
PositiveSlope>0
No ChangeSlope>0
NegativeSlope>0
Std. property
time
Fig. 4.8. Potential Outcomes respect to the base line.

58
5.1. Compost process monitoring
5.1.1. Compost Chemical and physical characteristics
The composting process was conducted in the winter-spring months with temperatures averaging 12 °C. However, as shown in Figure 5.1, the overall temperatures in all treatments (piles) showed a mesophilic phase of two weeks and then a thermophilic phase that lasted between 3-8 weeks, with a maximum temperature of 62 °C (pile 1) with a mean of 50 °C. Subsequently it remained between 40 and 50 °C, with a tendency to increase; this temperature was maintained during 6 weeks and signifi cantly decreased after the 20th week. Temperature is not only a consequence of the composting process (microbial metabolism) and turning, but also a control parameter.
According to Haug (1993) and Bernal et al. (2009) temperatures providing the maximum degradation velocity are in the range of 40-70ºC. The optimization of the composting process for grape pomace is possible, using goat manure, and bunch stems which appears to be an ideal bulking agent, providing C and improving physical properties such as porosity (given by its branch-type structure) and resistance to biodegradation of the hard-wood fraction (Tuomela et al., 2000); its chemical properties are also optimal; bunch stems’ C/N ratio is high (around 40) and equilibrates the low C/N ratio of goat manure (around 5). While this behavior is typical of composting processes (Fig. 5.2) with C/N ratio appropiate close to 25:1, it could be improved, reducing the composting time to 10-12 weeks, controlling aspects associated with handling and turning.
Tem
pera
ture
(°C)
Time (days)
00 10 20 30 40 50 60 70
10
20
30
40
50
60
70SUCo
Figure 5.1. Temperature evolution during the mineralization process of composting (Su: surface; Co: Compost pile).
The main results of the physical and chemical characteristics obtained in the different treatments are shown in table 5.1. In connection with the physical characteristics, the obtained compost materials presented loose texture corresponding to porosity near 70%, dark color, a pleasant scent throughout the process; this allowed the absence
CHAPTER V
RESULTS AND DISCUSSION

59
of leachates and therefore fl ies and other vectors. Pisco industry generates large amounts of residues, in a short period of time, along the year, during the end of summer to fall seasons (March to May). Average grape yield, for Muscatel variety, are close to 45 to 50 ton ha-1, 30% of which (12 to 15 ton* ha-1) will be grape pomace and bunch raquises that could be mixed with other materials to decrease the C/N ratio, improve quality of the fi nal product, and use it as organic matter and nutrient source, adding benefi cial microorganisms to activate soil functions, and biological control (Rivera and Avallay, 2008). Besides Pisco residues, goat and horse manure, available in the area, are used as N source; but in co-composting with Pisco solid wastes, it was possible to obtain a solid stabilized organic fertilizer, suitable for application to vineyard crops.
Table 5.1. Chemical properties of materials after 220 days of composting.
Treatment pH EC WSC N NH4-N NO3-N NH4-N /NO3-N
C/N
dS cm-1 g kg-1 % mg kg-1 mg kg-1
1 7,13±0,0 1,24±0,0 3,69±0,0 1,79±0,0 137,54±0,0 46,41±0,1 2,98±0,1 15,01±0,1 2 7,25±0,0 1,79±0,0 4,67±0,8 2,17±0,0 207,02±0,0 86,56±0,0 2,39±0,0 15,94±0,0 3 7,12±0,0 1,52±0,0 3,97±1,1 2,16±0,2 33,08±0,1 55,01±0,0 0,61±0,2 17,57±0,0 4 8,03±0,0 4,02±0,0 8,72±1,5 2,25±0,1 117,42±0,0 393,97±0,0 0,30±0,0 10,05±0,0 5 8,54±0,0 5,10±0,0 12,86±3,6 2,63±0,0 263,06±0,0 132,62±0,0 1,99±0,0 10,41±0,0 6 8,25±0,0 3,18±0,0 6,54±2,4 2,26±0,1 370,92±0,0 78,17±0,0 4,75±0,0 13,37±0,0 7 8,29±0,0 2,93±0,0 5,61±4,3 2,15±0,0 395,01±0,0 19,46±0,1 20,35±0,0 13,00±0,0 8 8,01±0,0 3,76±0,0 13,11±1,1 1,95±0,0 186,78±0,0 437,45±0,0 0,43±0,0 11,77±0,1 9 8,46±0,0 3,75±0,0 11,72±0,0 2,13±0,0 349,38±0,0 225,36±0,0 1,55±0,0 11,60±0,2
Class A* 5,0-9,0 <3,0 Nd >1 <500 Nd <3 <25 Class B* 5,0-9,0 <8,0 Nd >1 <500 Nd <3 <30
EC: Electrical conductivity. WSC: Water soluble carbon. N: Total nitrogen.;; NH4-N/NO3-N :Ammonium-Nitrogen/ratio; C/N: Carbon:NitrogenCarbon: Nitrogen Ratio C: Total carbon. Nd: not defi ned.
* NTCh 2880/04. Bold numbers did not meet the standard. + Bold numbers are signifi cant (p<0,05)
Figure 5.2. a)Compost piles and b) Measurement of the temperature of pile
The initial pH values in the piles were between 7,1 and 7,8, depending on the amount of manure included. At the end of composting, all treatments showed slightly alkaline pH, similar to those reported by other authors (Beltran, 2004; Bustamante, 2009). The levels of total organic carbon were similar to those observed in composting waste products of winery-distillery (Ranalli, 2001; Bustamante, 2009) and are above the reference value (15% C) of the Chilean Standard (NTCh 2880/04), although compared with the European standard values (30% C) are lower (European Commission, 2001). Abad et al. (2001) stated that a value of total organic matter above 80% should be adequate for potting media; all compost treatments had adequate organic matter levels (>50%) but no signifi cant differences among them were observed.

60
Mineralization processes include degradation of polymeric substances, such cellulose, lignin, protein, using the catalytic activity of different enzymes, or groups of them, that show the evolution of the compost process in terms of the decomposition of organic matter, nitrogen and phosphorous transformation, and humic substances production. Therefore, fi nal compost is a stabilized, deodorized, safe material for plants and humans, and rich in humic substances (Rallani et al., 2001; Islam et al., 2004).
5.1.2. Sanitary parameters and metal content
As complement of quality compost properties, the concentration of human pathogens, fecal indicators, and metal content was determined, thinking in the role of some bacteria in the foodborne diseases (Islam et al., 2004) and the effect of trace metal on human health. All the evaluated treatments met the specifi cations for Salmonella sp. and E coli, presenting values less than 100 MPN g-1. They also complied with the maximum metal contents, which indicates that all compost treatments could be classifi ed as Compost type A (Table 5.2), according to NTCh 2880 (2004), Biowaste EU Network (2011) and Compost Council Quality of California -CCQC (2001).
Table 5.2. Metal content, percent germination and sanitary parameters measured in compost.
Treatment Cr Cu Ni Pb Cd Zn Germination Fecal Coliforms E. coli Salmonella sp.
-------------------------------------mg kg-1-------------------------------- % MPN 100 g-1 DM MPN 4g-1 DM
1 15,5±4,9 33,5±2,1 6,95±1,2 4,6±0,9 <0,01 35,5±2,1 95±0,1 31,09±0,1 0,23 <0.02
2 7,1±1,1 31±1,4 6,5±0,8 3,95±0,7 <0,01 40±2,8 98±0,8 245,28±0,1 0,26 <0.02
3 13,65±6,5 30±0,0 6,5±0,4 4,3±0,0 <0,01 35,5±0,7 94±0,8 6,08±0,1 0,24 <0.02
4 6,2±0,1 31±1,4 8,5±0,7 5,75±0,9 <0,01 55±0,7 95±0,8 0,20±0,1 0,20 <0.02
5 10,65±4,7 31±0,0 8,8±0,2 9,85±0,2 <0,01 56,5±3,5 100±0,0 0,21±0,1 0,21 <0.02
6 12,5±3,5 34±1,4 6,9±0,1 5,0±0,1 <0,01 44,5±0,7 90±0,7 641,67±0,1 0,21 <0.02
7 18,5±2,1 33±0,0 8,15±0,6 5,45±0,9 <0,01 43,5±0,7 98.1,2 480,70±0,1 0,22 <0.02
8 9,25±0,0 36±1,4 9,15±0,6 32,5±0,3 <0,01 49,5±0,3 92±0,0 570,89±0,1 0,23 <0.02
9 13±1,4 31,5±0,7 9,35±2,3 5,2±1,2 <0,01 48±0,7 93±0,1 613,16±0,1 0,24 <0.02
Class A* 120 100 20 100 2 200 >80 <1000 Nd Absent
Class B* 600 1000 80 300 8 2000 >80 <1000 Nd Absent
* NTCh 2880/04. Nd: Not determined
5.1.3. Microbial populations
Regarding microbiological properties, the behavior of heterotrophic bacteria and fungi populations was the expected in all evaluated compost (Figure 5.3). As reported by others authors (Dazeell et al., 1991; Sánchez, 2009) the bacterial population was markedly dominant during the entire stabilization phase of composting, with all evaluated mixtures providing a good substrate for microorganisms of agricultural interest. This means that applications of compost as a soil amendment will provide a signifi cant amount of microorganisms capable of exerting different effects at the level of nutrient mobilization (immobilized phosphorus) and activating functions of mineralization of organic matter (cellulolytic, proteolytic, and amylolytic microorganisms). Isolates showed interesting organisms that have potential in biological control and disease suppression of soils, which is a signifi cant contribution to an integrated plant disease management.
During the active phase on the composting process, organic C decreases in the material due to decomposition of the organic matter by microorganisms. The degradation rate of the organic matter (OM) decreases gradually as composting progresses because the reductions of new complex and polymerized organic compounds (humifi cation) that occur during the maturation phase (Bernal et al., 2009). Important enzymes are involved in this biochemical
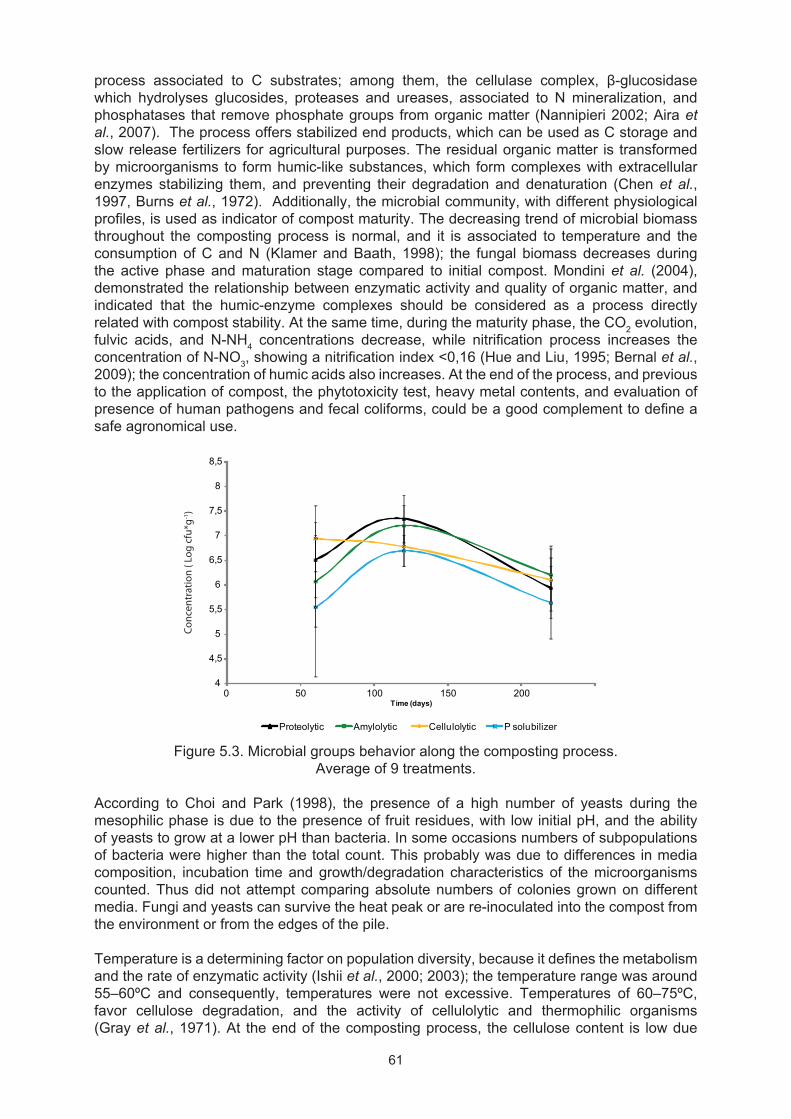
61
process associated to C substrates; among them, the cellulase complex, β-glucosidase which hydrolyses glucosides, proteases and ureases, associated to N mineralization, and phosphatases that remove phosphate groups from organic matter (Nannipieri 2002; Aira et al., 2007). The process offers stabilized end products, which can be used as C storage and slow release fertilizers for agricultural purposes. The residual organic matter is transformed by microorganisms to form humic-like substances, which form complexes with extracellular enzymes stabilizing them, and preventing their degradation and denaturation (Chen et al., 1997, Burns et al., 1972). Additionally, the microbial community, with different physiological profi les, is used as indicator of compost maturity. The decreasing trend of microbial biomass throughout the composting process is normal, and it is associated to temperature and the consumption of C and N (Klamer and Baath, 1998); the fungal biomass decreases during the active phase and maturation stage compared to initial compost. Mondini et al. (2004), demonstrated the relationship between enzymatic activity and quality of organic matter, and indicated that the humic-enzyme complexes should be considered as a process directly related with compost stability. At the same time, during the maturity phase, the CO2 evolution, fulvic acids, and N-NH4 concentrations decrease, while nitrifi cation process increases the concentration of N-NO3, showing a nitrifi cation index <0,16 (Hue and Liu, 1995; Bernal et al., 2009); the concentration of humic acids also increases. At the end of the process, and previous to the application of compost, the phytotoxicity test, heavy metal contents, and evaluation of presence of human pathogens and fecal coliforms, could be a good complement to defi ne a safe agronomical use.
2004
4,5
5
5,5
6
6,5
7
7,5
8
8,5
0 50 100 150Time (days)
Amylolytic Cellulolytic P solubilizerProteolytic
Conc
entr
atio
n ( L
og c
fu*g
-1)
Figure 5.3. Microbial groups behavior along the composting process. Average of 9 treatments.
According to Choi and Park (1998), the presence of a high number of yeasts during the mesophilic phase is due to the presence of fruit residues, with low initial pH, and the ability of yeasts to grow at a lower pH than bacteria. In some occasions numbers of subpopulations of bacteria were higher than the total count. This probably was due to differences in media composition, incubation time and growth/degradation characteristics of the microorganisms counted. Thus did not attempt comparing absolute numbers of colonies grown on different media. Fungi and yeasts can survive the heat peak or are re-inoculated into the compost from the environment or from the edges of the pile.
Temperature is a determining factor on population diversity, because it defi nes the metabolism and the rate of enzymatic activity (Ishii et al., 2000; 2003); the temperature range was around 55–60ºC and consequently, temperatures were not excessive. Temperatures of 60–75ºC, favor cellulose degradation, and the activity of cellulolytic and thermophilic organisms (Gray et al., 1971). At the end of the composting process, the cellulose content is low due

62
to mineralization and humifi cation process, and other C fractions could be inaccessible to enzymatic attack because of low water content or association with protective substances such as lignin (Stutzenberger et al., 1970; Castaldi et al., 2008).
This degradation process resulted in a decrease of the number of cellulolytic organisms, while heterotrophic bacteria showed high correlation (r = 0,734, p<0,0001) with β-glucosidase (β Glu) activity (Table 5.3). Amylolytic and proteolytic bacteria appeared mainly after the thermophilic phase, probably as result of the high amylose content, which was probably released after the biological degradation of protective substances such as cellulose, hemicellulose, and lignocellulose, and the large amount of proteins that are released when microorganisms die.
In this work most of the populations, during the maturing phase, had proteolytic, amylolytic, and cellulolytic capacities, corroborating the results from others authors (Diaz-Ravina et al., 1989; Atkinson et al., 1996). In agreement with this fi nding, Ishii et al. (2000) showed that Denaturation Gradient Gel Electrophoresis (DDGE) band patterns were more stable and more complex after cooling, indicating a higher microbial diversity. Because cellulose is an important constituent of grape pomace, the direct microbial biodegradation of cellulose will be restricted to a relatively narrow range of microorganisms, including cellulolytic bacteria, which appear frequently in this compost ecosystem (Hermann and Shann 1997).

63
Tabl
e 5.
3. C
orre
latio
n an
alys
is a
mon
g th
e co
mpo
st e
valu
ated
var
iabl
es.
*Bol
d nu
mbe
rs a
re s
ignifi c
ant (
p<0.
05)
AcP
: Aci
d P
hosp
hata
se; A
lkP
: Alk
alin
e P
hosp
hata
se; A
myl
: Am
ylol
ytic
bac
teria
; Bac
t: To
tal B
acte
ria; β
-Glu
: β g
luco
sida
se; C
/N: C
arbo
n: N
itrog
en R
atio
; Cel
lul:
Cel
lulo
lytic
bac
teria
; FA
; Ful
vic
acid
; F&
Y: F
ungi
and
Yea
st; H
A: H
umic
aci
d;
P s
ol: P
hosp
hate
Sol
ubili
zing
Bac
teria
; HA
/FA
: Hum
ic a
cid:
Ful
vic
acid
; Rat
io; N
-NH
4/N/N
O3 :
Am
mon
ium
: /N
itric
Nitr
ogen
ratio

64
5.1.4. Compost maturity indices
Germination tests are commonly used to assess the maturity and also the phytotoxicity of compost particularly associated with immature compost. A germination test is different to the growth test in which continuing changes in compost may affect the development of plants; it could represent damage at the beginning of composting, but a growth increase at the end. The germination test provides a fast answer about the presence of toxic substances in the material. Several organic substances, ammonia and heavy metals could be associated to phytotoxic response to compost (Ko et al., 2008). In this work the heavy metal content was measured at the beginning of the maturing process, showing adequate concentrations according to the Chilean compost standards (Table 5.2). According to Zucconi et al. (1981), a germination evaluation below 50%, characterizes an immature compost; the present results showed germination over 80% in all treatments, indicating that the materials were free of substances that could reduce the seed germination or inhibit root development, such as ammonia, heavy metals and volatile organic acids (Ko et al., 2008). With respect to heavy metal content, the Chilean national standard have set the maximum concentrations for Cd, Ni, As, Pb, Cr, Cu, and Zn, values of which are presented in Table 5.2. All compost treatments were well below to the limit levels proposed by the regulatory agency, and according to the maturity classifi cation proposed by the Compost Council Quality of California CCQC (2001), the compost of treatment 5 (Table 5.3 and 5.5) showed to be very mature, with low levels of heavy metals and it could be used directly for soil and peat base container plant mixes and turf top-dressing.
Table 5.4. Comparison between the treatments evaluated in terms of the biochemical, chemical and microbiological parameters measured compost at fi nal time, 120 days of
composting.T βGlu AcP AlkP U Bact F&Y Psol Cellul Prot Amyl HA FA HA/FA C/N NH4-N
/NO3-N
-----------------μg p-nitrophenol g-1h--------------- ----------------------------------- Log cfu g-1------------------------------- ------mg g-1------
1 85,0 1720,8 2298,3 1051,7 5,9 7,2 5,8 6,4 5,9 6,5 1,3 8,8 0,1 15,0 3,0
2 76,2 420,1 1093,3 1109,5 6,4 5,2 5,8 6,8 5,9 6,7 3,4 9,9 0,4 15,9 2,4
3 62,4 1232,4 1809,1 949,8 5,3 8,1 6,2 5,6 6,5 6,2 0,9 8,1 0,1 17,6 0,6
4 133,7 328,7 1359,7 575,3 4,7 6,7 4,7 6,9 6,2 7,0 6,5 11,3 0,5 10,0 0,3
5 111,2 302,7 1240,1 1143,7 4,5 6,2 6,4 5,5 5,7 5,9 8,3 9,8 0,9 10,4 2,0
6 107,5 318,7 1453,4 1396,8 4,5 5,4 5,1 5,4 6,2 5,2 3,5 9,2 0,4 13,4 4,8
7 75,3 148,4 654,8 1749.,1 5,1 6,6 5,0 5,7 5,4 5,7 5,4 7,8 0,7 13,0 20,4
8 119,4 403,0 1633,8 1003.4 5,8 6,0 5,3 6,4 5,0 6,3 3,7 13,2 0,3 11,8 0,4
9 125,6 399,8 1354,7 1559,8 5,0 5,2 6,5 6,2 6,8 6,3 2,3 15,8 0,1 11,6 1,6
p* 0,0009 <0,0001 0,0124 <0,0001 <0,0001 0,0311 0,0404 0,0268 0,0383 0,0134 0,007 <0,0001 0,0005 0,006 <0,0001
LSD 28,8 325,8 651,9 160,7 0,3 1,5 1,1 0,9 0,9 0,7 3,6 2,3 0,3 3,2 0,9
RV** 180-200 4000-6200 200-270* (p<0.05)
β-Glu: β glucosidase; AcP: Acid Phosphatase; AlkP: Alkaline Phosphatase; U: Urease; Bact: Total Bacteria; F&Y: Fungi and Yeast; P sol: Phosphate Solubilizer Bacteria; Cellul: Cellulolytic bacteria; Prot: Proteolytic bacteria; Amylo: Amylolytic bacteria;HA: Humic acid-; Fulvic Acid; HA/FA: Humic acid: Fulvic acid Ratio; C/N: Carbon: Nitrogen
Ratio; NH4-N/NO3-N :Ammonium Nitrogen/Nitric Nitrogen ratio.
**RV: Reference value for mature compost. *Castaldi et al., 2008, Bahacy and Kornillowicz, 2009.
Regarding nitrogen, total N content ranged between 1.8 and 2.6%, values similar to those reported by other authors for composted distillery residues (Ranalli, 2001); however the limits of NH4-N in all treatments were below those suggested by Zucconi et al. (1981) for mature compost (400 mg g-1). On the other hand, Bernal et al. (2009) indicated a NH4-N/ NO3-N ratio <0,16 for mature compost while a ratio <0.6 indicates stable compost (Bernal et al., 1998). In this study the treatments 3,4 and 8 were closer to this proposed ratio; however, according to Brinton (2000) in a compilation of world compost standards, values of NH4-N/ NO3-N ratio <0.5 correspond to very mature compost, and ranges 0,5-3 to mature compost, in which case all treatments except treatment 7 were considered as mature compost. Throughout composting, occur nitrogen mineralization process. In the early stages, little or no nitrate-N is formed (depends on raw material) and in the thermophilic stage, the decomposition is faster, making the NH4-N and NO3-N appear from protein and other organic N sources.
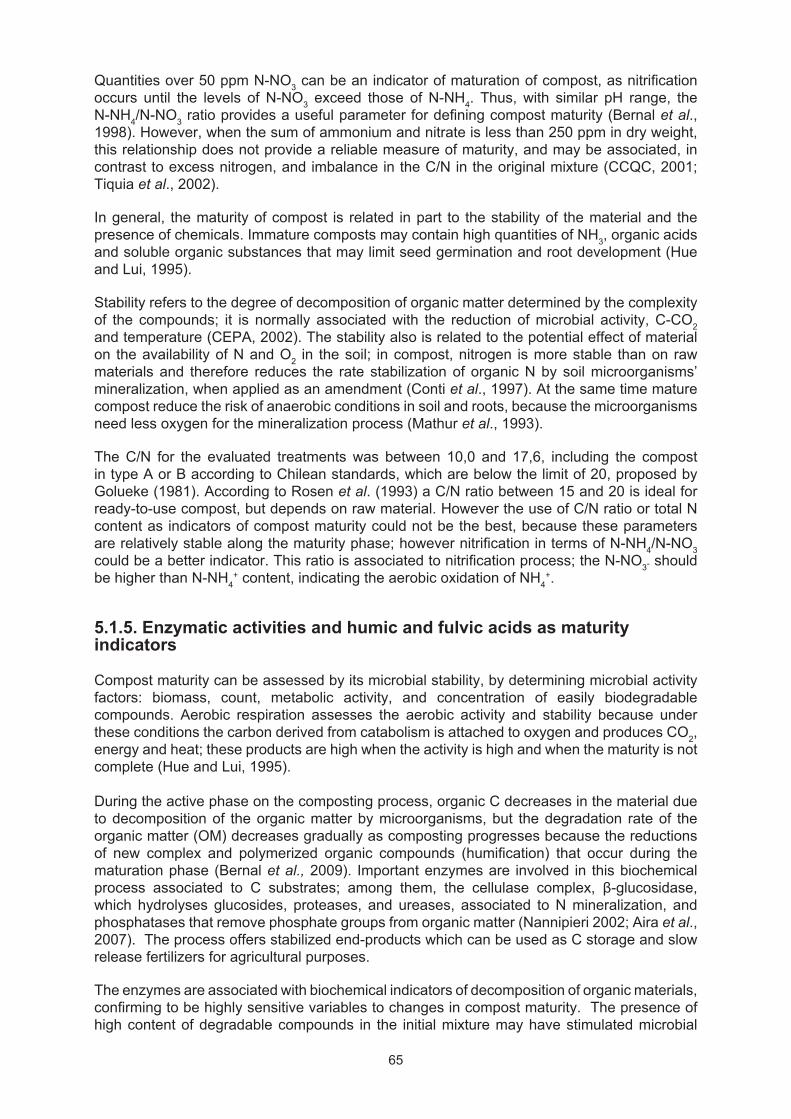
65
Quantities over 50 ppm N-NO3 can be an indicator of maturation of compost, as nitrifi cation occurs until the levels of N-NO3 exceed those of N-NH4. Thus, with similar pH range, the N-NH4/N-NO3 ratio provides a useful parameter for defi ning compost maturity (Bernal et al., 1998). However, when the sum of ammonium and nitrate is less than 250 ppm in dry weight, this relationship does not provide a reliable measure of maturity, and may be associated, in contrast to excess nitrogen, and imbalance in the C/N in the original mixture (CCQC, 2001; Tiquia et al., 2002).
In general, the maturity of compost is related in part to the stability of the material and the presence of chemicals. Immature composts may contain high quantities of NH3, organic acids and soluble organic substances that may limit seed germination and root development (Hue and Lui, 1995).
Stability refers to the degree of decomposition of organic matter determined by the complexity of the compounds; it is normally associated with the reduction of microbial activity, C-CO2 and temperature (CEPA, 2002). The stability also is related to the potential effect of material on the availability of N and O2 in the soil; in compost, nitrogen is more stable than on raw materials and therefore reduces the rate stabilization of organic N by soil microorganisms’ mineralization, when applied as an amendment (Conti et al., 1997). At the same time mature compost reduce the risk of anaerobic conditions in soil and roots, because the microorganisms need less oxygen for the mineralization process (Mathur et al., 1993).
The C/N for the evaluated treatments was between 10,0 and 17,6, including the compost in type A or B according to Chilean standards, which are below the limit of 20, proposed by Golueke (1981). According to Rosen et al. (1993) a C/N ratio between 15 and 20 is ideal for ready-to-use compost, but depends on raw material. However the use of C/N ratio or total N content as indicators of compost maturity could not be the best, because these parameters are relatively stable along the maturity phase; however nitrifi cation in terms of N-NH4/N-NO3 could be a better indicator. This ratio is associated to nitrifi cation process; the N-NO3- should be higher than N-NH4
+ content, indicating the aerobic oxidation of NH4+.
5.1.5. Enzymatic activities and humic and fulvic acids as maturity indicators
Compost maturity can be assessed by its microbial stability, by determining microbial activity factors: biomass, count, metabolic activity, and concentration of easily biodegradable compounds. Aerobic respiration assesses the aerobic activity and stability because under these conditions the carbon derived from catabolism is attached to oxygen and produces CO2, energy and heat; these products are high when the activity is high and when the maturity is not complete (Hue and Lui, 1995).
During the active phase on the composting process, organic C decreases in the material due to decomposition of the organic matter by microorganisms, but the degradation rate of the organic matter (OM) decreases gradually as composting progresses because the reductions of new complex and polymerized organic compounds (humifi cation) that occur during the maturation phase (Bernal et al., 2009). Important enzymes are involved in this biochemical process associated to C substrates; among them, the cellulase complex, β-glucosidase, which hydrolyses glucosides, proteases, and ureases, associated to N mineralization, and phosphatases that remove phosphate groups from organic matter (Nannipieri 2002; Aira et al., 2007). The process offers stabilized end-products which can be used as C storage and slow release fertilizers for agricultural purposes.
The enzymes are associated with biochemical indicators of decomposition of organic materials, confi rming to be highly sensitive variables to changes in compost maturity. The presence of high content of degradable compounds in the initial mixture may have stimulated microbial

66
growth and enzyme synthesis that will be limited by the presence of substrate in biochemical reactions (Goyal et al., 2005). The mineralization process of organic matter can be studied by following the dynamics of enzymes over time and correlating it with other factors such as water soluble carbon, humic and fulvic acids concentration or the presence of microbial groups.
β-glucosidase is an extracellular enzyme associated to hydrolysis of terminations of β-D-glucose chains to yield β-glucose (Nannipieri et al., 2002). This enzymatic activity decreases, during the composting process and, when the activity is high, it indicates the low stabilization process of the decomposing material (Castaldi et al., 2008); this decrease was evidenced in all the treatments (p<0.0001) evaluated (Figure 5.4), indicating the use of polysaccharides and the adequate stabilization phase.
Phosphomonoesterases catalyze the release of inorganic phosphorus (orthophosphate) from organic phosphomonesters (Alef et al., 1995) and are inhibited by substrate; for this, and due to the decrease of the organic induced by the phosphatases, in compost process, the phosphatases enzymes tended to decrease (López-Hernández et al., 1989); this decrease was observed in almost all the treatments (p<0.0001) (Figure 5.4).
Figure 5.4. Enzymatic activities behavior along the composting process presented by all the different pile treatments evaluated in average.
*Enzymatic Unit: Acid phosphatase (UP: μg p-nitrophenol*g-1*h-1). Alkaline phosphatase (UPAlk: μg p-nitrophenol*g-1*h-1). β-glucosidase (UBG: μg p-nitrophenol*g-1*h-1). Urease (UU: μg NH4*g-1*h-1).
The urease activity is related with the N metabolism because it hydrolyzes urea to release NH4+
(Makoi and Ndakidemi, 2008). This enzyme tends to increase at the beginning of the process because the initial high concentration of proteins induces the protease activity, releasing urea, and consequently induce the ureases enzymes. Typically, during the composting process urease activity presents fl uctuations of decrease-increase due to the depletion of the substrate urea by ureases and the synthesis of urea as a result of the proteases; it is also reported a positive correlation between urease and NH4
+ and negative correlation between urease and NO3
- (Castaldi et al., 2008). In this co-composting process, urease tended to increase along the stabilization phase (p<0,0001) (Figure 5.4).
The N was <2% in treatments 3, 5, 6 and 8, corresponding to grape pomace (91%); grape pomace: goat manure (50:50 and 33:73) and in addition with horse manure (33:20:42); in these cases, the addition of manure provided an initial C / N near 20-25:1, which made the process of proteolysis and subsequent mineralization of N resulting in a lower concentration of NH4-N, compared to other treatments. This nitrifi cation process favors the immobilization of N in the material, and is refl ected in a NH4-N / NO3-N ratio <1. Also there is less free substrate for the enzyme urease, which is refl ected in lower activity of this enzyme in these treatments (Castaldi et al., 2008).

67
The residual organic matter is transformed by microorganisms to form humic-like substances, which form complexes with extracellular enzymes stabilizing them, and preventing their degradation and denaturation (Chen et al., 1997, Burns et al., 1972). Additionally, the microbial community, with different physiological profi les, is used as indicator of compost maturity. The decreasing trend of microbial biomass throughout the composting process is normal, and it is associated to temperature and C/N source consumption (Klamer and Baath, 1998); the fungal biomass decreases during the active phase and maturation stage compared to initial compost, but the bacteria continue with degradation activity, enzymatic production and the humifi cation process. Mondini et al. (2004), demonstrated the relationship between enzymatic activity and quality of organic matter, and indicated that the humic-enzyme complexes should be considered as a process directly related with compost stability. At the same time during the maturity phase, the CO2 evolution, fulvic acids, and NH4 concentration decrease, while nitrifi cation process increase the concentration of NO3, showing a nitrifi cation index <0,16 (Hue and Liu, 1995; Bernal et al., 2009); the concentration of humic acid also increases. At the end of the process, and previous to the application of compost, the phytotoxicity test, heavy metal contents, and evaluation of presence of human pathogens and fecal coliforms, could be a good complement to defi ne a safe agronomical use.
The concentration of humic acid (HA) increased gradually over the fi rst 40 days of maturation process (p<0,0001), but also the fulvic acids concentration increased during the same period (p<0,0001) (Figure 5.5). In this study the behavior of humic substances was similar to that described by Bernal et al. (2009) using compost from animal manure; fresh and raw material contain lower levels of HA and higher contents of fulvic acids, compared to mature compost. However these contents could be variable depending on the source of raw material, therefore it would better to use humifi cation indices rather than humic substances content as indicators of compost maturity. Jimenez and Garcia (1992), proposed the ratio HA/FA (humic acid content to fulvic acid content) as a parameter related to degree of compost maturity, and considered that a value higher than 1,6 indicates a mature compost. In this research, fresh compost made of grape pomace and goat manure, showed a ratio HA/FA< 0,5, which could be a suggested limit for immature compost, and the ratio increased at the end of the study (Table 5.4).
During composting HA contents of the raw material (grape pomace and goat manure) evolved and became over FA. HA/FA ratio in pile No.5 increased to over 70%, suggesting that the degree of humifi cation in this pile was higher than others.
This results are coincident with the results obtained by Tiquia (2005), who also demonstrated that besides the mineralization of organic matter, in compost, this can be transformed into humic substances (HS), in correlation with respiration rate and oxidizing activity. In the present study the increase in humic acids concentration observed from 100 days during maturity, coincides with that of stabilization of β-glucosidase and acid phosphatases (Figure 5.4 and 5.5). However, during the later composting process (maturity) fulvic acid increased and humic acid decrease this could mean that the fraction of humic acid is used by microorganisms, probably fungi, through enzymatic mechanisms different to hydrolytic pathways.
Grinhut et al. (2007), proposed a model for humic substances degradation, in which lacases and lignin-peroxidase (LiP) attack directly the HS side chains and Mn and Cu chelates produced by basidiomycetes, could be mineralized humic substances. Trametes sp., a basidiomycete, isolated from biosolids compost showed the ability to degrade HS from leonardite, considered very stable OM. In compost as well as in soil, during humifi cation processes a large heterogeneity of substances are formed, in terms of their source, physical, chemical characteristics and variability in time and space (Guggenberger, 2005)
Different characteristics are defi ned to defi ne the compost quality, are used, especially chemical and microbial properties are include to defi ne the classifi cation and the use in yield of this material. However, it is possible use different organic material, but for horticulture systems the human pathogen and fecal indicators, could defi ne the use. For this reasons, the compost
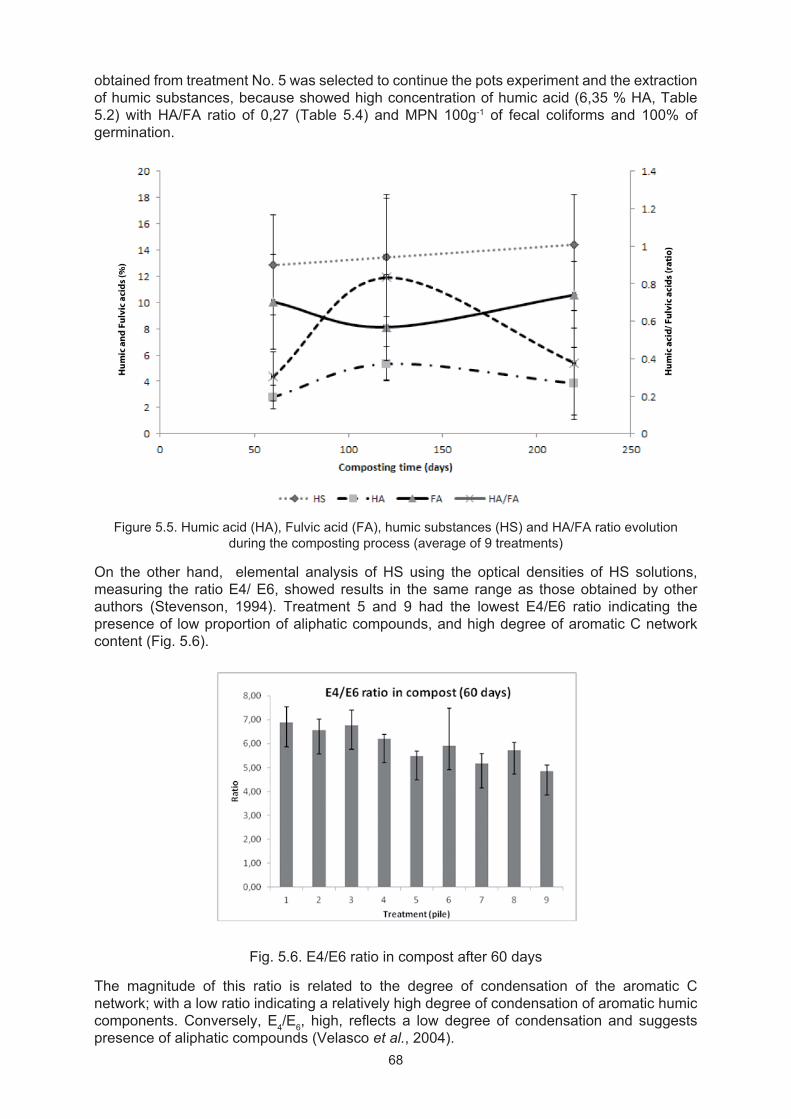
68
obtained from treatment No. 5 was selected to continue the pots experiment and the extraction of humic substances, because showed high concentration of humic acid (6,35 % HA, Table 5.2) with HA/FA ratio of 0,27 (Table 5.4) and MPN 100g-1 of fecal coliforms and 100% of germination.
Figure 5.5. Humic acid (HA), Fulvic acid (FA), humic substances (HS) and HA/FA ratio evolution during the composting process (average of 9 treatments)
On the other hand, elemental analysis of HS using the optical densities of HS solutions, measuring the ratio E4/ E6, showed results in the same range as those obtained by other authors (Stevenson, 1994). Treatment 5 and 9 had the lowest E4/E6 ratio indicating the presence of low proportion of aliphatic compounds, and high degree of aromatic C network content (Fig. 5.6).
Fig. 5.6. E4/E6 ratio in compost after 60 days
The magnitude of this ratio is related to the degree of condensation of the aromatic C network; with a low ratio indicating a relatively high degree of condensation of aromatic humic components. Conversely, E4/E6, high, refl ects a low degree of condensation and suggests presence of aliphatic compounds (Velasco et al., 2004).

69
Compost used to obtain humus liquid, was the product of treatment 5, for presenting a greater degree of polymerization, absence of human pathogens and fecal indicators, and 100% germination in radish seed test, indicating the absence of phytotoxic substances.
5.1.6. Sensitivity of of each property for representing changes during maturation process
Normally, chemical parameters related to nutrient content, are applied as quality indicators in compost used in agriculture, however it is important to defi ne these indicators, according to easy of interpretation, analysis, reference, and consistency during the processes (Gómez-Brandón et al., 2008); to the former group of desired characteristics I wanted to include the sensitivity of each indicator. Biochemical indicators, as enzymatic activities, and concentration of humic substances play an important and sensible role in monitoring the process of mineralization and maturity in compost, but it is important to adjust and standardize the methodologies in order to make the results comparable.
The content of humic substances (HS) can be a good indicator not only of the maturity of the compost but also of the potential of it as an organic amendment. Compost containing more humic substances would be a better stabilized amendment to apply to the soil.
Changes of each measured compost soil property on each treatment, with respect to the mineralization process (day 60), were determined. The objectives of this analysis were to the end of the mineralization describe the effect of treatments on several soil properties and to determine their weights which could be used in a maturity index.
Each of the 9 treatments was considered a population, to determine the proportion of them presenting changes in a given property over time (as compared to the base line). On the other hand, the weight (slope) of each property over time was estimated, in order to rank all the properties in terms of its sensitivity. Standardized variables were used and regressed on 4 times: 0, 120, and 180 days. When the slope was not signifi cantly different from zero (P>0,05) it meant that there were not changes in time over the base line and the property was not sensitive in a given treatment. On the other hand the larger the coeffi cient (slope), the higher the weight of the property (Table 5.5).
The regression of each standardized variable on time in each treatment determined that the compost properties changing most frequently and with larger weights were urease (U), acid phosphatases (AcP), cellulolytic microorganisms (Cellul), acid phosphatases (AcP), NH4
+ and N-NH4/N-NO3 ratio. Urease changed over the fi rst sampling time (mineralization process) in 89% of the 9 populations (treatments) evaluated (Table 5.6), with 0,12 as corrected weight (Fig. 5.7). Several properties changing less frequently and with lower weights which mean that they would not be good indicators of changes in compost maturity.

70
Table 5.5. Ranking of all standardized compost variables measured during maturation process
Pile AcP AlkP U β-Glu Bact F&Y Psol Cellul Prot Amyl HS pH N NH4 NO3 NH4/NO3 C C/N
1 0 0 1 0 0 1 0 1 0 0 0 0 0 0 0 0 0 0
2 1 1 1 0 0 1 0 0 0 0 1 0 0 0 0 0 0 0
3 0 1 1 1 1 0 1 1 0 0 0 0 0 1 0 0 1 0
4 1 1 0 0 0 0 0 0 0 1 0 0 0 0 0 0 1 1
5 1 0 1 1 0 0 0 1 0 0 1 0 1 1 0 1 1 1
6 1 0 1 0 1 0 0 1 0 0 0 0 0 1 1 1 0 0
7 1 1 1 1 0 0 0 0 1 0 0 0 0 1 0 1 0 0
8 0 0 1 0 0 0 0 1 0 0 0 0 0 1 0 1 0 0
9 0 0 1 0 1 0 1 0 1 0 0 0 1 0 0 0 0 0
Sum 5 4 8 3 3 2 2 5 2 1 2 0 2 5 1 4 3 2
% 56 44 89 33 33 22 22 56 22 11 22 0 22 56 11 44 33 221: property changes along the time 0: no change. Use four times (0, 6,12,18 months)
β-Glu: β glucosidase; AcP: Acid Phosphatases; AlkP: Alkaline Phosphatases; U: Urease; Bact: Total Bacteria; F&Y: Fungi and Yeast; P sol: Phosphate Solubilizer Bacteria; Cellul: Cellulolytic bacteria; Prot: Proteolytic bacteria; Amyl: Amylolytic bacteria; HA: Humic acid-; Fulvic Acid; HA/FA: Humic acid: Fulvic acid Ratio; C/N: Carbon: Nitrogen Ratio; NH4: Ammonium Nitrogen; NO3: Nitric Nitrogen; NH4-N/NO3-N :Ammonium Nitrogen/
Nitric Nitrogen ratio
0
0,05
0,1
0,15
0,2
0,25
0,3
0,35
0,4
0,45
Corre
cted
weig
ht
Figure. 5.7 Corrected weights of compost properties obtained by regression and frequency response analysis.
U: urease activity, Cellul: cellulolytic microorganisms N-NH4: Ammonium nitrogen, AcP: acid phosphatases activity, Bact:total bacteria; AlkP: alkaline phosphatase activity , NH4/NO3: ratio, βGlu: β-glucosidase activity, prot: proteolytic microorganisms; HS: humic + fulvic acids, F&Y: Fungi and yeasts, Psol: Phosphate solubilizer bacteria; Amil: amilolytic microorganisms, N: total nitrogen; N-NO3: Nitric nitrogen C: Organic Carbon; C/N
ratio.
Several models were proposed as a Minumum Data Set (MDS) to explain the content of humic substances in compost using microbiological, chemical and biochemical properties. Selected models explained between 34 to 61% of the variation of humic substances and its ratio. The same models were run using standardized variables which allowed determining the weights of each variable included in the model. Overall the most important ones were available N, and pH, among the chemical properties, cellulolytic and P-solubilizer bacteria, among the microbiological characteristics, and acid phosphatase and β- Glucosidase, among the biochemical properties (Table 5.6).
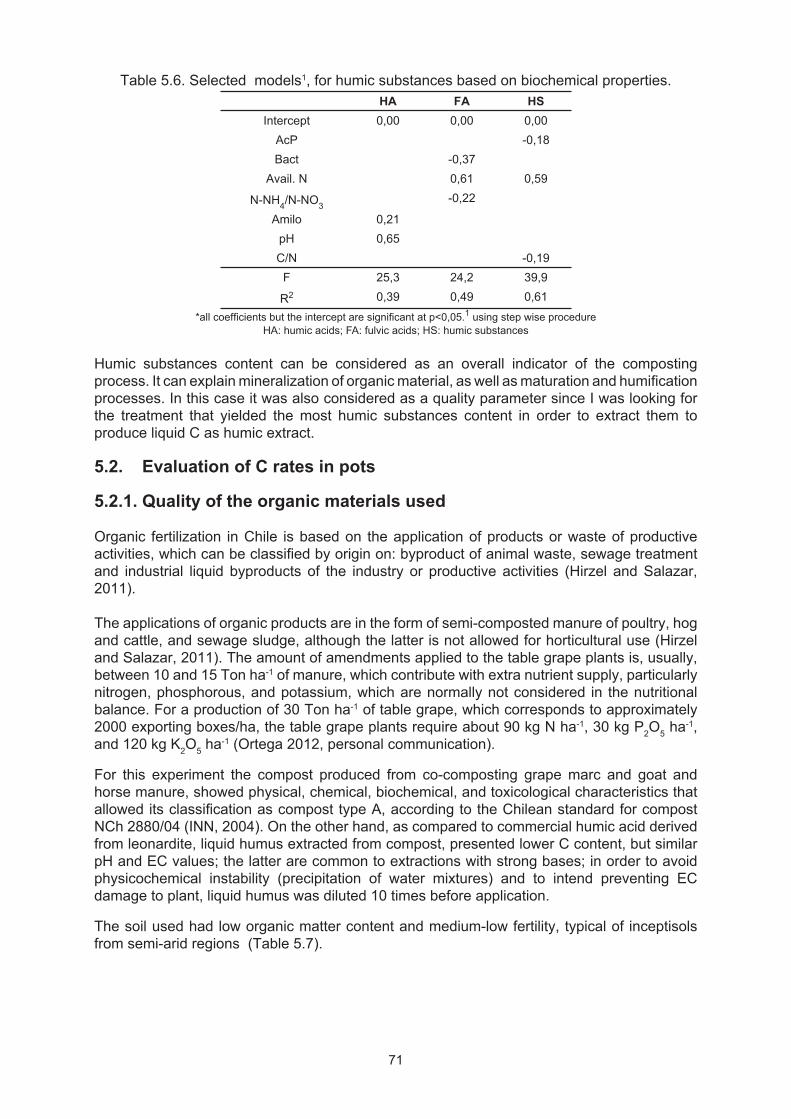
71
Table 5.6. Selected models1, for humic substances based on biochemical properties.HA FA HS
Intercept 0,00 0,00 0,00AcP -0,18Bact -0,37
Avail. N 0,61 0,59
N-NH4/N-NO3 -0,22
Amilo 0,21pH 0,65C/N -0,19F 25,3 24,2 39,9
R2 0,39 0,49 0,61*all coeffi cients but the intercept are signifi cant at p<0,05.1 using step wise procedure
HA: humic acids; FA: fulvic acids; HS: humic substances
Humic substances content can be considered as an overall indicator of the composting process. It can explain mineralization of organic material, as well as maturation and humifi cation processes. In this case it was also considered as a quality parameter since I was looking for the treatment that yielded the most humic substances content in order to extract them to produce liquid C as humic extract.
5.2. Evaluation of C rates in pots
5.2.1. Quality of the organic materials used
Organic fertilization in Chile is based on the application of products or waste of productive activities, which can be classifi ed by origin on: byproduct of animal waste, sewage treatment and industrial liquid byproducts of the industry or productive activities (Hirzel and Salazar, 2011).
The applications of organic products are in the form of semi-composted manure of poultry, hog and cattle, and sewage sludge, although the latter is not allowed for horticultural use (Hirzel and Salazar, 2011). The amount of amendments applied to the table grape plants is, usually, between 10 and 15 Ton ha-1 of manure, which contribute with extra nutrient supply, particularly nitrogen, phosphorous, and potassium, which are normally not considered in the nutritional balance. For a production of 30 Ton ha-1 of table grape, which corresponds to approximately 2000 exporting boxes/ha, the table grape plants require about 90 kg N ha-1, 30 kg P2O5 ha-1, and 120 kg K2O5 ha-1 (Ortega 2012, personal communication).
For this experiment the compost produced from co-composting grape marc and goat and horse manure, showed physical, chemical, biochemical, and toxicological characteristics that allowed its classifi cation as compost type A, according to the Chilean standard for compost NCh 2880/04 (INN, 2004). On the other hand, as compared to commercial humic acid derived from leonardite, liquid humus extracted from compost, presented lower C content, but similar pH and EC values; the latter are common to extractions with strong bases; in order to avoid physicochemical instability (precipitation of water mixtures) and to intend preventing EC damage to plant, liquid humus was diluted 10 times before application.
The soil used had low organic matter content and medium-low fertility, typical of inceptisols from semi-arid regions (Table 5.7).

72
Table 5.7. Chemical and biochemical characteristics of soil, compost and liquid humus used for the pot experiment.
Parameter Unit Soil Compost Liquid Humus Acid Phosphatase (AcP) μg p-nitrophenol g-1h-1 203 849 3
Alkaline Phosphatase (AlkP) μg p-nitrophenol g-1h-1 185 1338 33
Β-glucosidase (βGlu) μg p-nitrophenol g-1h-1 78 238 ND
Urease (U) μg NH4 g-1h-1 84 221 14
Humic substances (HS:HA+FA) % 0,54 5 2,34
pH 8,1 8,6 12,2
EC dS m-1 0,7 0,88 29,6
N-NH4 mg kg-1 8,0 72 49
N-NO3 mg kg-1 5,0 309 43
Olsen P mg kg-1 7,0 55,6 -
Total P mg kg-1 13 - 3,93
K sol mg ml-1 - - 9,7
Organic Matter (OM) % 1,4 44,5 0,80
Organic C (OC) % 1,5 24,7 0,25
Total N (TN) % 0,1 1,8 0,04
C/N ratio 11,2 13,4 6,25
Olsen-P: Phosphorus Olsen;N; N-NH4: Ammonium nitrogen N-NO3: Nitric Nitrogen; Avail N: Available N; HS: Humic substances (HA+FA) :): OM: organic matter; WSC: Water Soluble Carbon; EC: electrical conductivity
5.2.2. Effect of organic matter application on soil properties
Regarding chemical parameters (Table 5.8), soil pH and electrical conductivity (EC) presented signifi cant differences (p<0,05) among treatments; as expected, treatments with liquid humus had higher pH and EC values compared to those with compost; however, at the end of the experiment the maximum EC values were slightly lower than for the control with no organic matter. The increase in EC values, observed at the beginning of the experiment in the liquid humus, caused a signifi cant reduction on plant shoot and root growth, as well as microbial activity, which could not be recovered during the season, even though soil was heavily washed to reduce EC. For this reason the effect of liquid humus will be evaluated only over soil chemical properties and not on biochemical or plant evaluations.
Soil content of humic and fulvic acids (HS) showed to be higher (p<0,05) in all treatments in comparison with the control, particularly when the maximum level of C was added. N-NO3 was also signifi cant (p<0,05), showing higher values in compost treatments.
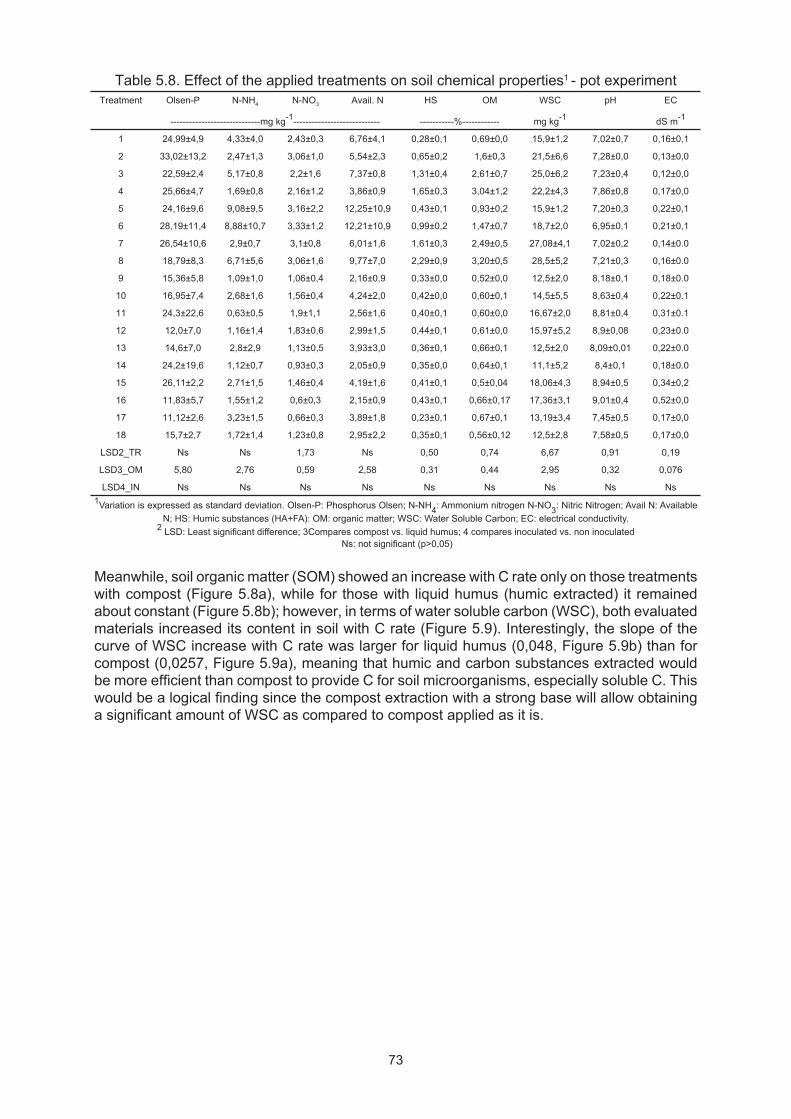
73
Table 5.8. Effect of the applied treatments on soil chemical properties1 - pot experimentTreatment Olsen-P N-NH4 N-NO3 Avail. N HS OM WSC pH EC
-----------------------------mg kg-1---------------------------- -----------%------------ mg kg-1 dS m-1
1 24,99±4,9 4,33±4,0 2,43±0,3 6,76±4,1 0,28±0,1 0,69±0,0 15,9±1,2 7,02±0,7 0,16±0,1
2 33,02±13,2 2,47±1,3 3,06±1,0 5,54±2,3 0,65±0,2 1,6±0,3 21,5±6,6 7,28±0,0 0,13±0,0
3 22,59±2,4 5,17±0,8 2,2±1,6 7,37±0,8 1,31±0,4 2,61±0,7 25,0±6,2 7,23±0,4 0,12±0,0
4 25,66±4,7 1,69±0,8 2,16±1,2 3,86±0,9 1,65±0,3 3,04±1,2 22,2±4,3 7,86±0,8 0,17±0,0
5 24,16±9,6 9,08±9,5 3,16±2,2 12,25±10,9 0,43±0,1 0,93±0,2 15,9±1,2 7,20±0,3 0,22±0,1
6 28,19±11,4 8,88±10,7 3,33±1,2 12,21±10,9 0,99±0,2 1,47±0,7 18,7±2,0 6,95±0,1 0,21±0,1
7 26,54±10,6 2,9±0,7 3,1±0,8 6,01±1,6 1,61±0,3 2,49±0,5 27,08±4,1 7,02±0,2 0,14±0.0
8 18,79±8,3 6,71±5,6 3,06±1,6 9,77±7,0 2,29±0,9 3,20±0,5 28,5±5,2 7,21±0,3 0,16±0.0
9 15,36±5,8 1,09±1,0 1,06±0,4 2,16±0,9 0,33±0,0 0,52±0,0 12,5±2,0 8,18±0,1 0,18±0.0
10 16,95±7,4 2,68±1,6 1,56±0,4 4,24±2,0 0,42±0,0 0,60±0,1 14,5±5,5 8,63±0,4 0,22±0.1
11 24,3±22,6 0,63±0,5 1,9±1,1 2,56±1,6 0,40±0,1 0,60±0,0 16,67±2,0 8,81±0,4 0,31±0.1
12 12,0±7,0 1,16±1,4 1,83±0,6 2,99±1,5 0,44±0,1 0,61±0,0 15,97±5,2 8,9±0,08 0,23±0.0
13 14,6±7,0 2,8±2,9 1,13±0,5 3,93±3,0 0,36±0,1 0,66±0,1 12,5±2,0 8,09±0,01 0,22±0.0
14 24,2±19,6 1,12±0,7 0,93±0,3 2,05±0,9 0,35±0,0 0,64±0,1 11,1±5,2 8,4±0,1 0,18±0.0
15 26,11±2,2 2,71±1,5 1,46±0,4 4,19±1,6 0,41±0,1 0,5±0,04 18,06±4,3 8,94±0,5 0,34±0,2
16 11,83±5,7 1,55±1,2 0,6±0,3 2,15±0,9 0,43±0,1 0,66±0,17 17,36±3,1 9,01±0,4 0,52±0,0
17 11,12±2,6 3,23±1,5 0,66±0,3 3,89±1,8 0,23±0,1 0,67±0,1 13,19±3,4 7,45±0,5 0,17±0,0
18 15,7±2,7 1,72±1,4 1,23±0,8 2,95±2,2 0,35±0,1 0,56±0,12 12,5±2,8 7,58±0,5 0,17±0,0
LSD2_TR Ns Ns 1,73 Ns 0,50 0,74 6,67 0,91 0,19
LSD3_OM 5,80 2,76 0,59 2,58 0,31 0,44 2,95 0,32 0,076
LSD4_IN Ns Ns Ns Ns Ns Ns Ns Ns Ns 1Variation is expressed as standard deviation. Olsen-P: Phosphorus Olsen; N-NH4: Ammonium nitrogen N-NO3: Nitric Nitrogen; Avail N: Available
N; HS: Humic substances (HA+FA): OM: organic matter; WSC: Water Soluble Carbon; EC: electrical conductivity.2 LSD: Least signifi cant difference; 3Compares compost vs. liquid humus; 4 compares inoculated vs. non inoculated
Ns: not signifi cant (p>0,05)
Meanwhile, soil organic matter (SOM) showed an increase with C rate only on those treatments with compost (Figure 5.8a), while for those with liquid humus (humic extracted) it remained about constant (Figure 5.8b); however, in terms of water soluble carbon (WSC), both evaluated materials increased its content in soil with C rate (Figure 5.9). Interestingly, the slope of the curve of WSC increase with C rate was larger for liquid humus (0,048, Figure 5.9b) than for compost (0,0257, Figure 5.9a), meaning that humic and carbon substances extracted would be more effi cient than compost to provide C for soil microorganisms, especially soluble C. This would be a logical fi nding since the compost extraction with a strong base will allow obtaining a signifi cant amount of WSC as compared to compost applied as it is.

74
y = 0,0047x + 0,4274R² = 0,941
0,0
0,5
1,0
1,5
2,0
2,5
3,0
3,5
0 100 200 300 400 500 600
SOM
(%)
C rate (g/pot)
A
C+F C C+F+I C+I Control+F Control
y = -0,0002x + 0,6149R² = 0,0112
0,0
0,1
0,2
0,3
0,4
0,5
0,6
0,7
0,8
0,9
1,0
0 20 40 60 80 100 120
SOM
(%)
C rate (g/pot)
B
HA+F HA HA+F+I HA+I Control+F Control
Figure 5.8. Variation of Soil Organic Matter (SOM) on pot experiment, as function of C rate applied: A) Compost and B) Liquid humus.
y = 0,0257x + 13,015R² = 0,905
0
5
10
15
20
25
30
0 100 200 300 400 500 600
WSC
(mg/
L)
C rate (g/pot)
A
C+F C C+F+I C+I Control+F Control
y = 0,0482x + 11,795R² = 0,703
02468
101214161820
0 20 40 60 80 100 120
WSC
(mg/
L)
C rate (g/pot)
B
HA+F HA HA+F+I HA+I Control+F Control Figure 5.9. Variation of Water Soluble Carbon (WSC) in soil, as function of C rate applied:
A) Compost and B) Liquid humus.C+F: compost and chemical fertilization; C+F+I: compost, chemical fertilization and microbial inoculant; C+I: compost and microbial inoculant; HS: humic substances; HS+F+I: humic substances, chemical fertilization and
microbial inoculant, HS+I: humic substances plus microbial inoculant, C+F: control plus chemical fertilization; C:control.
5.2.2.1. Effect of Compost application on Biochemical Properties
Biochemical analysis revealed that all compost treatments increased the activity of β-glucosidase, and acid phosphatases (p<0,05), compared with control (Table 5.10). On the other hand, urease activity showed a different pattern been decreased at the highest C rates from compost and liquid humus (p<0,05). The presence of inoculant increased activity of β-glucosidase and decreased that of urease (Table 5.10).

75
Table 5.9. Effect of compost applications on soil enzymatic activities1
Treatment
β-Glucosidase (β Glu)
Acid phosphatase (AcP)
Alkaline phosphatase (AlkP)
Urease (U)
--------------------μg p-nitrophenol g-1h-1-------------------------- μg NH4 g-1h-1
1 45,8±22,1 117,9±34,9 184,3±95,3 119.3±40,0
2 49,3±11,1 164,1±31,5 264,5±70,1 222.7±45,8
3 69,8±42,4 269,5±44,0 372,6±151,7 230.7±103,0
4 49,6±38,9 329,0±167,1 634,2±526,5 201.5±33,1
5 50,2±16,6 117,1±8,4 304,0±163,4 146.5±57,1
6 49,6±2,7 150,8±73,4 206,7±93,2 168.8±44,4
7 65,2±5,9 251,4±47,3 366,0±75,5 151.1±8,0
8 69,6±19,7 369,0±149,4 415,7±208,1 165.7±56,3
17 26,74±8,0 138,7±47,6 219,2±51,1 258.3±38,6
18 47,5±9,0 158,7±26,1 205,2±17,0 229.6±13,5
LSD2_TR 36,69 185,29 Ns Ns
LSD3_OM 18,91 112,9 Ns Ns
LSD4_IN 20,54 ns Ns 34,5 1 Variation is expressed as standard deviation
2LSD: Least signifi cant difference; 3Compares compost vs. control; 4 compares inoculated vs. non inoculated
Compost application stimulates biological activity by mineralizing it, increasing the levels of soil available N and P and of some micro elements, depending on the source. In response to biological activity, it is reported that compost generates an increment of soil microbial biomass, soil respiration, and enzyme activities such as phospho-, mono- and di estereasesesterase, dehydrogenases, β-glucosidases, arylsuphatases, deaminases, ureases and proteases; however, some cases a decrease on protease, urease and deaminase activities is observed due to a toxic effect caused by the presence of trace elements (Heargreaves et al., 2008).
In the present study, a signifi cant increase on β-glucosidase, acid and alkaline phospatasephosphatases activities was showed in compost treatments. Sources of C as cellulose, lignin, starch, N as proteins, organic P and other nutrients, present in compost stimulate biological activity and continues mineralization process; in the case of humic extract the main C sources are polyphenolic compounds with low availability and mineralization rate (Anderson, 1979), although WSC can also be an important C source for soil microorganisms. Probably, the application of liquid humus at the proper dilution would have caused the desired effects, including stimulating microbiological populations and improving enzymatic activity. It is worth noting that soil enzymes can be protected by humic substances and its activity potential depends on pH (Burns, 1978); under the conditions of this experiment a strong negative correlation between pH and all enzymatic activities evaluated was observed.
Urease activity has to be analyzed carefully because this activity can be very variable because it is affected by the presence of trace elements, oxygen concentration, and N availability. Soils with permanent availability of organic or inorganic sources of NH4, reduce signifi cantly their urease activity; the use of urea as fertilizer in agricultural soils can cause interference on the urease laboratory determination (García et al., 2003). The results of this experiment indicated a decrease on urease activity due to an inhibition by product, because compost and chemical fertilizers maintained N levels in soil causing a depression in urease activity.
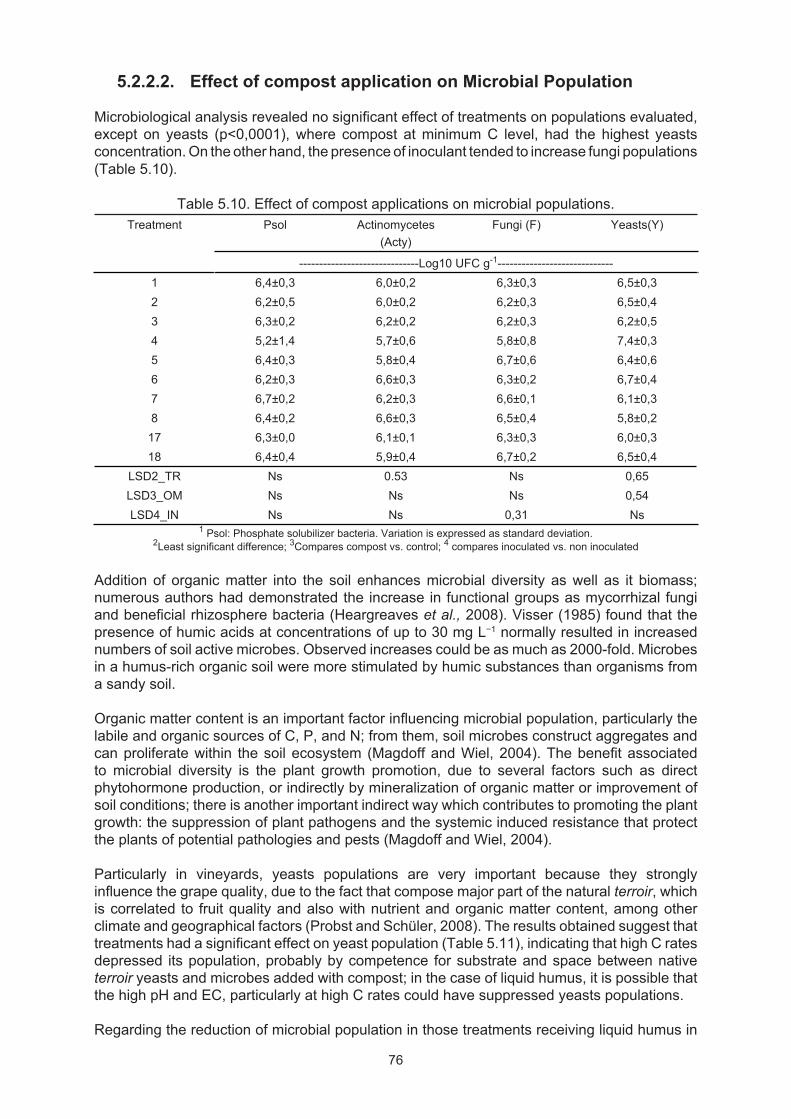
76
5.2.2.2. Effect of compost application on Microbial Population
Microbiological analysis revealed no signifi cant effect of treatments on populations evaluated, except on yeasts (p<0,0001), where compost at minimum C level, had the highest yeasts concentration. On the other hand, the presence of inoculant tended to increase fungi populations (Table 5.10).
Table 5.10. Effect of compost applications on microbial populations.Treatment Psol Actinomycetes
(Acty)Fungi (F) Yeasts(Y)
------------------------------Log10 UFC g-1----------------------------- 1 6,4±0,3 6,0±0,2 6,3±0,3 6,5±0,3 2 6,2±0,5 6,0±0,2 6,2±0,3 6,5±0,4 3 6,3±0,2 6,2±0,2 6,2±0,3 6,2±0,5 4 5,2±1,4 5,7±0,6 5,8±0,8 7,4±0,3 5 6,4±0,3 5,8±0,4 6,7±0,6 6,4±0,6 6 6,2±0,3 6,6±0,3 6,3±0,2 6,7±0,4 7 6,7±0,2 6,2±0,3 6,6±0,1 6,1±0,3 8 6,4±0,2 6,6±0,3 6,5±0,4 5,8±0,2
17 6,3±0,0 6,1±0,1 6,3±0,3 6,0±0,3 18 6,4±0,4 5,9±0,4 6,7±0,2 6,5±0,4
LSD2_TR Ns 0.53 Ns 0,65 LSD3_OM Ns Ns Ns 0,54 LSD4_IN Ns Ns 0,31 Ns
1 Psol: Phosphate solubilizer bacteria. Variation is expressed as standard deviation.2Least signifi cant difference; 3Compares compost vs. control; 4 compares inoculated vs. non inoculated
Addition of organic matter into the soil enhances microbial diversity as well as it biomass; numerous authors had demonstrated the increase in functional groups as mycorrhizal fungi and benefi cial rhizosphere bacteria (Heargreaves et al., 2008). Visser (1985) found that the presence of humic acids at concentrations of up to 30 mg L−1 normally resulted in increased numbers of soil active microbes. Observed increases could be as much as 2000-fold. Microbes in a humus-rich organic soil were more stimulated by humic substances than organisms from a sandy soil.
Organic matter content is an important factor infl uencing microbial population, particularly the labile and organic sources of C, P, and N; from them, soil microbes construct aggregates and can proliferate within the soil ecosystem (Magdoff and Wiel, 2004). The benefi t associated to microbial diversity is the plant growth promotion, due to several factors such as direct phytohormone production, or indirectly by mineralization of organic matter or improvement of soil conditions; there is another important indirect way which contributes to promoting the plant growth: the suppression of plant pathogens and the systemic induced resistance that protect the plants of potential pathologies and pests (Magdoff and Wiel, 2004).
Particularly in vineyards, yeasts populations are very important because they strongly infl uence the grape quality, due to the fact that compose major part of the natural terroir, which is correlated to fruit quality and also with nutrient and organic matter content, among other climate and geographical factors (Probst and Schüler, 2008). The results obtained suggest that treatments had a signifi cant effect on yeast population (Table 5.11), indicating that high C rates depressed its population, probably by competence for substrate and space between native terroir yeasts and microbes added with compost; in the case of liquid humus, it is possible that the high pH and EC, particularly at high C rates could have suppressed yeasts populations.
Regarding the reduction of microbial population in those treatments receiving liquid humus in
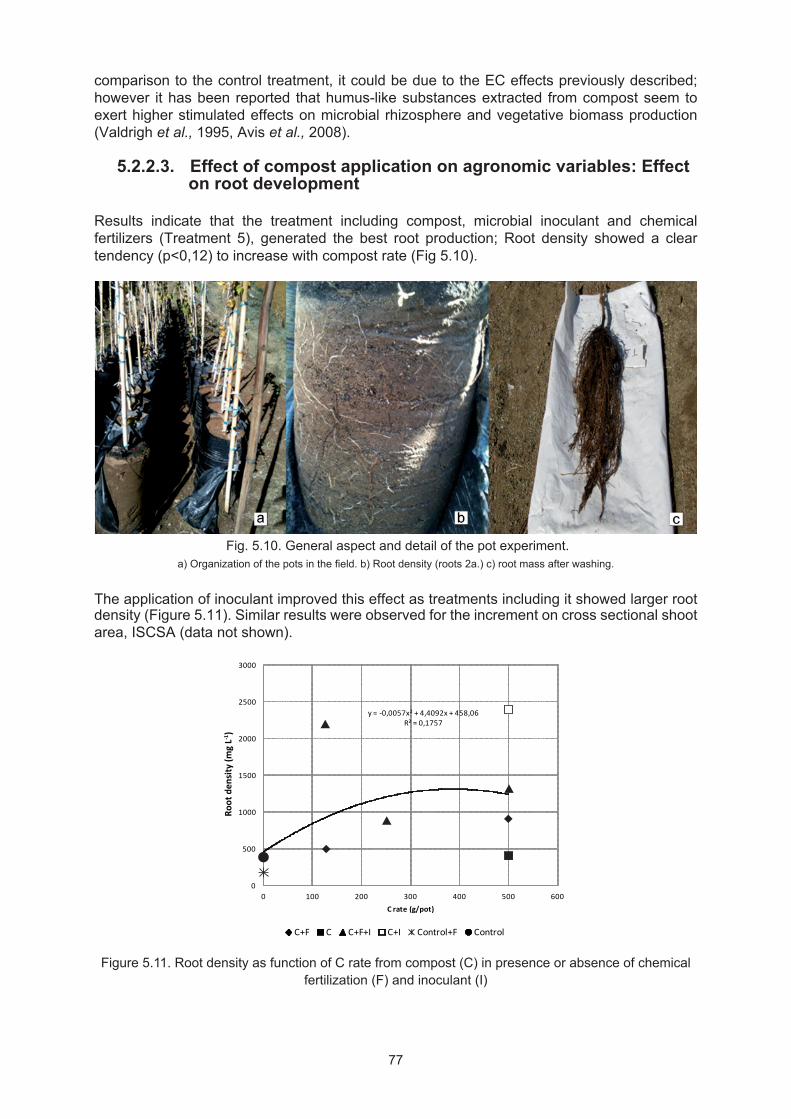
77
comparison to the control treatment, it could be due to the EC effects previously described; however it has been reported that humus-like substances extracted from compost seem to exert higher stimulated effects on microbial rhizosphere and vegetative biomass production (Valdrigh et al., 1995, Avis et al., 2008).
5.2.2.3. Effect of compost application on agronomic variables: Effecton root development
Results indicate that the treatment including compost, microbial inoculant and chemical fertilizers (Treatment 5), generated the best root production; Root density showed a clear tendency (p<0,12) to increase with compost rate (Fig 5.10).
Fig. 5.10. General aspect and detail of the pot experiment. a) Organization of the pots in the fi eld. b) Root density (roots 2a.) c) root mass after washing.
The application of inoculant improved this effect as treatments including it showed larger root density (Figure 5.11). Similar results were observed for the increment on cross sectional shoot area, ISCSA (data not shown).
y = -0,0057x2 + 4,4092x + 458,06R² = 0,1757
0
500
1000
1500
2000
2500
3000
0 100 200 300 400 500 600
Root
den
sity
(mg
L-1)
C rate (g/pot)
C+F C C+F+I C+I Control+F Control
Figure 5.11. Root density as function of C rate from compost (C) in presence or absence of chemical fertilization (F) and inoculant (I)
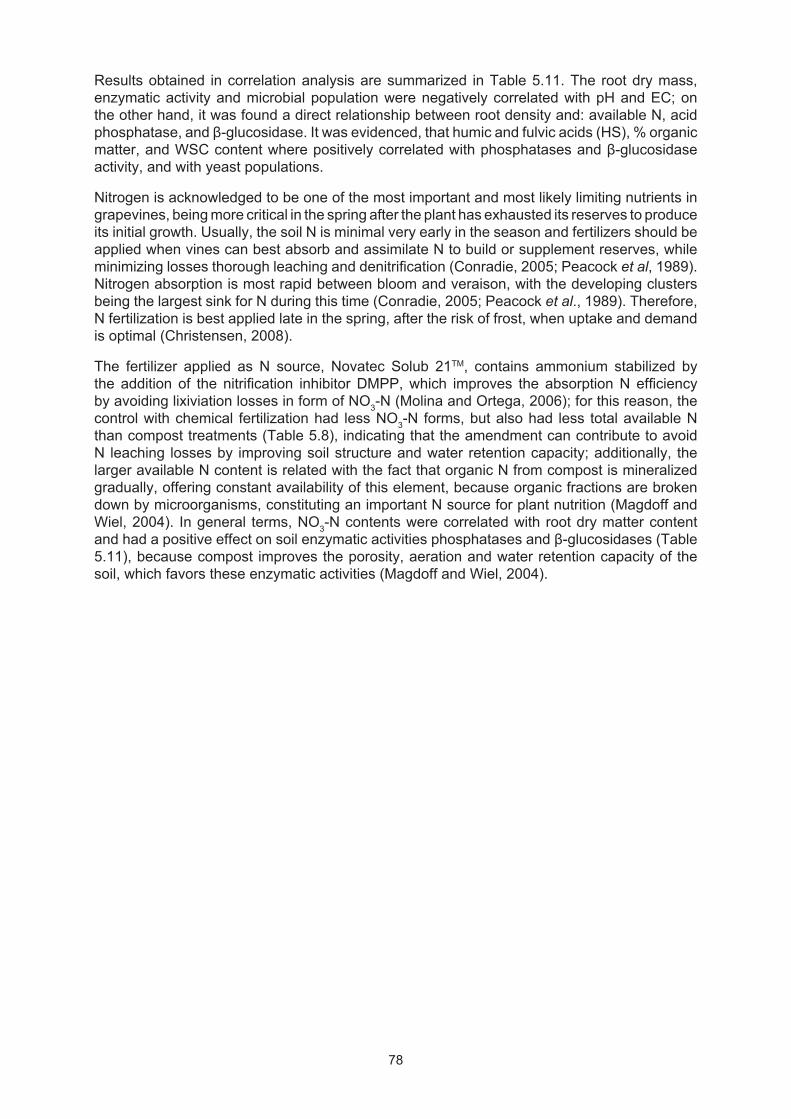
78
Results obtained in correlation analysis are summarized in Table 5.11. The root dry mass, enzymatic activity and microbial population were negatively correlated with pH and EC; on the other hand, it was found a direct relationship between root density and: available N, acid phosphatase, and β-glucosidase. It was evidenced, that humic and fulvic acids (HS), % organic matter, and WSC content where positively correlated with phosphatases and β-glucosidase activity, and with yeast populations.
Nitrogen is acknowledged to be one of the most important and most likely limiting nutrients in grapevines, being more critical in the spring after the plant has exhausted its reserves to produce its initial growth. Usually, the soil N is minimal very early in the season and fertilizers should be applied when vines can best absorb and assimilate N to build or supplement reserves, while minimizing losses thorough leaching and denitrifi cation (Conradie, 2005; Peacock et al, 1989). Nitrogen absorption is most rapid between bloom and veraison, with the developing clusters being the largest sink for N during this time (Conradie, 2005; Peacock et al., 1989). Therefore, N fertilization is best applied late in the spring, after the risk of frost, when uptake and demand is optimal (Christensen, 2008).
The fertilizer applied as N source, Novatec Solub 21TM, contains ammonium stabilized by the addition of the nitrifi cation inhibitor DMPP, which improves the absorption N effi ciency by avoiding lixiviation losses in form of NO3-N (Molina and Ortega, 2006); for this reason, the control with chemical fertilization had less NO3-N forms, but also had less total available N than compost treatments (Table 5.8), indicating that the amendment can contribute to avoid N leaching losses by improving soil structure and water retention capacity; additionally, the larger available N content is related with the fact that organic N from compost is mineralized gradually, offering constant availability of this element, because organic fractions are broken down by microorganisms, constituting an important N source for plant nutrition (Magdoff and Wiel, 2004). In general terms, NO3-N contents were correlated with root dry matter content and had a positive effect on soil enzymatic activities phosphatases and β-glucosidases (Table 5.11), because compost improves the porosity, aeration and water retention capacity of the soil, which favors these enzymatic activities (Magdoff and Wiel, 2004).
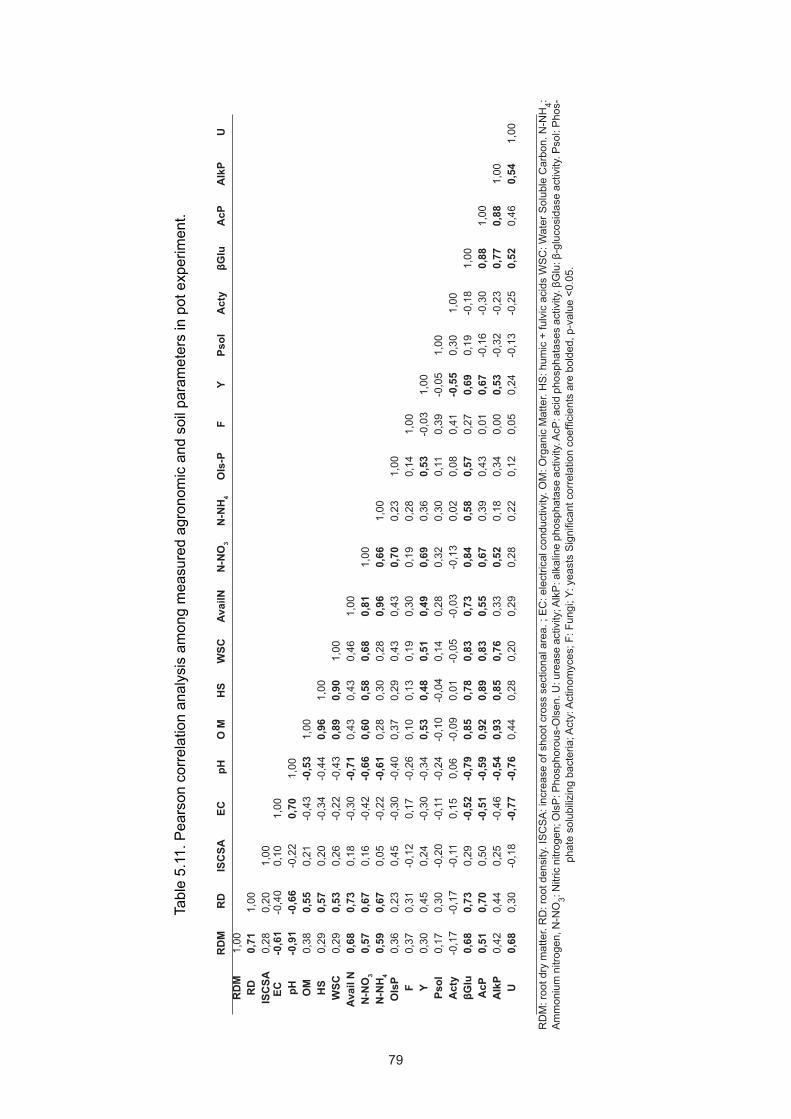
79
Tabl
e 5.
11. P
ears
on c
orre
latio
n an
alys
is a
mon
g m
easu
red
agro
nom
ic a
nd s
oil p
aram
eter
s in
pot
exp
erim
ent.
R
DM
RD
ISC
SAEC
pH
O M
HS
WSC
Avai
lNN
-NO
3N
-NH
4O
ls-P
FY
Psol
Act
yβG
luA
cPA
lkP
U R
DM
1,00
R
D0,
711,
00
IS
CSA
0,28
0,20
1,00
EC
-0,6
1-0
,40
0,10
1,00
pH
-0,9
1-0
,66
-0,2
20,
701,
00
OM
0,38
0,55
0,21
-0,4
3-0
,53
1,00
HS
0,29
0,57
0,20
-0,3
4-0
,44
0,96
1,00
W
SC0,
290,
530,
26-0
,22
-0,4
30,
890,
901,
00
Av
ail N
0,68
0,73
0,18
-0,3
0-0
,71
0,43
0,43
0,46
1,00
N
-NO
30,
570,
670,
16-0
,42
-0,6
60,
600,
580,
680,
811,
00
N
-NH
40,
590,
670,
05-0
,22
-0,6
10,
280,
300,
280,
960,
661,
00
Ols
P0,
360,
230,
45-0
,30
-0,4
00,
370,
290,
430,
430,
700,
231,
00
F
0,37
0,31
-0,1
20,
17-0
,26
0,10
0,13
0,19
0,30
0,19
0,28
0,14
1,00
Y
0,30
0,45
0,24
-0,3
0-0
,34
0,53
0,48
0,51
0,49
0,69
0,36
0,53
-0,0
31,
00
P
sol
0,17
0,30
-0,2
0-0
,11
-0,2
4-0
,10
-0,0
40,
140,
280,
320,
300,
110,
39-0
,05
1,00
A
cty
-0,1
7-0
,17
-0,1
10,
150,
06-0
,09
0,01
-0,0
5-0
,03
-0,1
30,
020,
080,
41-0
,55
0,30
1,00
βG
lu0,
680,
730,
29-0
,52
-0,7
90,
850,
780,
830,
730,
840,
580,
570,
270,
690,
19-0
,18
1,00
A
cP0,
510,
700,
50-0
,51
-0,5
90,
920,
890,
830,
550,
670,
390,
430,
010,
67-0
,16
-0,3
00,
881,
00
A
lkP
0,42
0,44
0,25
-0,4
6-0
,54
0,93
0,85
0,76
0,33
0,52
0,18
0,34
0,00
0,53
-0,3
2-0
,23
0,77
0,88
1,00
U
0,68
0,30
-0,1
8-0
,77
-0,7
60,
440,
280,
200,
290,
280,
220,
120,
050,
24-0
,13
-0,2
50,
520,
460,
541,
00
RD
M: r
oot d
ry m
atte
r. R
D: r
oot d
ensi
ty. I
SC
SA
: inc
reas
e of
sho
ot c
ross
sec
tiona
l are
a. ;
EC
: ele
ctric
al c
ondu
ctiv
ity. O
M: O
rgan
ic M
atte
r. H
S: h
umic
+ fu
lvic
aci
ds W
SC
: Wat
er S
olub
le C
arbo
n. N
-NH
4: A
mm
oniu
m n
itrog
en, N
-NO
3: Nitr
ic n
itrog
en; O
lsP
: Pho
spho
rous
-Ols
en. U
: ure
ase
activ
ity; A
lkP
: alk
alin
e ph
osph
atas
e ac
tivity
. AcP
: aci
d ph
osph
atas
es a
ctiv
ity. β
Glu
: β-g
luco
sida
se a
ctiv
ity. P
sol:
Pho
s-ph
ate
solu
biliz
ing
bact
eria
; Act
y: A
ctin
omyc
es; F
: Fun
gi; Y
: yea
sts
Sig
nifi c
ant c
orre
latio
n co
effi c
ient
s ar
e bo
lded
, p-v
alue
<0.
05.

80
The amount of N remobilized from permanent structures between bud break and fruit set accounts for up to 40% of that needed by shoots, leaves and clusters (Conradie, 1980). In addition to the needs of N as a nutrient for plant growth, fruit production and quality, supply and immobilization of available N present in the compost or organic amendments should be considered in fertilizer programs. The total nitrogen presents in compost does not become completely available to the vines. About 30% of the total nitrogen becomes available during the season, and this value varies based on compost composition, application method, soil conditions, microbial activity in soil, and environmental conditions after the application; recommendation is to discount the amount of N supplied by compost from chemical fertilizers, to reduce the risk of excess of N (Amlinger et al., 2003; Travis et al., 2003). Under the conditions of this experiment, an equivalent of 36 kg N ha-1 was applied with the maximum compost rate, out of which about 10 kg N ha-1 * season, was mineralized; this amount of N probably did not infl uence plant response since enough N was added to all treatments. It is worth noting that during establishment N needs are about 30 kg N ha-1. Flavel et al. (2005), showed that grape marc compost, obtained with 2,7% total N, applied in the 0-10 cm depth in sandy soils of Australia, produced high mineralization rates during the fi rst days application (2,4 to 7,4 mg N kg-1 day-1), due to the decomposition of the soluble fraction of compost. Over time the mineralization of N decreased, but the net balance, in 148 days, was equivalent to 18 kg N ha-1day-1 at 20 cm depth.
This experiment resulted in an increase of HS content with the C rate, especially when compost is used as organic amendment (Table 5.8), being signifi cantly higher in the treatment with high rate of compost + inoculant and no fertilizers (Treatment 8, Table 5.8); these results are due to the fact that the inoculant microbes increase enzymatic activity in soil, using compost as substrate, with mineralization of organic matter and HS production. Additionally, a positive correlation between HS and both alkaline and acid phosphatases as well as with actinomycetes population was found (Table 5.11), indicating that possibly, hydrolytic bacteria are responsible for most of hydrolysis of organic carbon sources. However, a negative correlation between HS and dry root biomass (Table 5.11) was observed, because the use of liquid humus, which had high pH and EC generating suppression on root synthesis, masking the benefi cial effect that humic substances cause on the root system.
Previous studies have shown increases in soil carbon at higher amendment loading rates. Albaladejo et al., (2008) observed doubling of soil carbon concentrations using 260 ton ha-1 of uncomposted organic municipal solid waste, and Morlat and Chausson (2008), observed after cumulative loading rate of 256-320 ton ha-1 of compost in vineyards over 16 year period, doubled carbon concentration on surface respect to soil control.
On the other hand, the labile fraction of organic matter is composed by soluble forms of C, which are easily degradable and therefore the most susceptible to mineralization (Cook and Allen, 1992), acting as an immediate energy source for microorganisms. In this experiment concentration of WSC in soil increased with C rate using both OM sources, however the rate of increase was larger for liquid humus as compared to compost, probably because the higher content of WSC in liquid humus.
Composting is a widely-used treatment whose objective is to transform organic wastes in organic amendments for agronomic use; it produces several benefi ts for plant growth as it improves chemical, physical and biological soil characteristics, generating an effect of plant growth promotion by different ways (Heargreaves et al., 2008). Thus, grape marc (GM) composting to obtain an organic amendment could be an economically and ecologically acceptable way to use it.
Grape marc is characterized by low electrical conductivity (EC) values, high organic matter (OM) and signifi cant P and K concentrations, as well as low heavy metal contents, being all of them important factors in agricultural soils. However, this residue is also notably acidic and contains signifi cant polyphenolic compounds, having these potential phytotoxic and

81
antimicrobial effects (Bustamante et al., 2008; Martinez et al., 2011); therefore composting of GM is required, in order to produce a more stable and manageable agricultural end product. This composted material can constitute a feasible option to increase soil OM content improving physical, chemical and biological properties to this ecosystem, because soil organic matter, nutrients and biological activity contribute to ecosystem level process and are important for productivity, community (Anderson, 2003; Avis et al., 2008), structure and fertility (Gil et al, 2008); however the infl uence of organic matter on soil properties depends on amount, type and size of added organic materials (Barzegar et al., 2002).
Ferrer et al. (2001) reported positive effect using 1-4 ton ha-1 of grape marc compost as a soil conditioner for corn seed germination in greenhouses. The chemical analysis of compost used in this experiment, revealed levels of free potassium, in the range of 2-3% w/w, plant macronutrients such as Ca, S, Mg were present at low levels (<1% w/w), while phosphorus (0,1-0,3% w/w) and nitrogen (1-2% w/w) levels were not very high and present in organic form. All the grape marc composts analyzed provided some benefi t in returning nutrients into the vineyard and all were signifi cant potassium sources (Issa et al., 2009). However, Flavel et al. (2005) observed negative effects on soil when grape marc compost was used as an organic fertilizer, which included an initial net immobilization of nitrogen. In the present study, it was observed that compost generated an improvement on root synthesis, and no negative effects were observed, suggesting that the nutrient and salt content were appropriate as amendment to promote rhizogenesis process especially in nursery vines.
At the end of the composting process, compost contains a large amount and diversity of microorganisms, so application of this amendment, improve the nutritional content of soil, the diversity and abundance of benefi cial organisms, acting at the same time as a source of C and energy for native soil organisms (Heargreaves et al., 2008). Perucci (1990) observed a signifi cant increase in microbial biomass carbon, nitrogen and phosphorous in soil after 12 months from the application of compost from municipal solid waste at a rate of 2,5% (w/w). In the present research, the results indicated strong root development in plants with compost application (Figure 5.12a), probably due to the fact that compost favors factors such as texture, aeration, temperature, water and nutrient availability and organic matter content, factors that affect root distribution of grapevines (Morlat & Jaquet, 1993; Richards, 1983).
Use of compost from GM mixed with chemical fertilizers and microbial inoculant resulted in the best root production (p<0,05) , due to the fact that chemical nutrition provides much part of the elements required by the plant (Fig. 5.12c), compost generates an adequate environment in terms of physical and chemical conditions for availability of these nutrients, and also, together with the inoculant, provide benefi cial microorganisms that mineralize organic matter by enzymes (Fig. 5.12b). The β-glucosidase showed less activity in treatments with compost compare with HS, expected result if the highest concentration was observed with respect to WSC in the treatments with compost. This succession of events, results in solubilization of nutrients and and synthes of humic substances, while promoting the plant growth by other mechanisms like stimulation of root elongation through the production of phytohormones like indol acetic acid (IAA) (Kloepper et al., 1998, Avis et al., 2008). Some microorganisms are described associated with grapevine, according to a study by Compant et al., (2011), they are Pseudomonas sp, Pseudomonas fl uorescens, Pseudomonas cannabina, Bacillus sp, Bacillus pumilus, Paenibacillus lautus, Arthrobacter sp, Variovora paradoxus, Rhodococcus sp among others.

82
0
2
4
6
8
10
12
14
16
18
20
CE pH WSC NO3 HS
mg/
kg o
r %
A. E ect of C on soil chemical proper es -Pot experiment -
HS
Compost
HS: humic + fulvic N-NO3: Nitric nitrogen; WSC: Water Soluble Carbon; CE: electrical conductivity.
0
50
100
150
200
250
AcP Glu AlkP U
Enzy
ma
c ac
vity
B. E ect of C on soil enzyma c ac vity -Pot experiment -
Compost
HS
AlkP: alkaline phosphatase activity. βGlu: β-glucosidase activity; AcP: acid phosphatases activity; U: urease activity.
0100200300400500600700800900
1000
With Inoculant Without inoculant
Dens
ity (
mg/
L)
c. E ect of microbial inoculant on root density -Pot experiment -
Fig. 5.12. Effect of Compost and Inoculant on (a), Soil chemical properties, (b) enzymatic activity and (c) effect of microbial inoculants root density by orthogonal contrast analysis

83
Chizhevsky and Dikusar, since 1995, suggested that benefi cial effects of humic substances on plant growth may be mediated via microbial breakdown products, or by stimulation or inhibition of enzymatic activity which could contribute to growth promotion. Cecco and DÁngolla (1984), showed a stimulating effect on pea growth of liquid humic and fulvic substances at concentrations below 5 mg L-1, and an inhibitory effect above this concentration; this stimulatory effect was attributed to the presence of free phenolic compounds in humic extracts, exhibiting a similar stimulatory action of indoleacetic acid, or by increasing the concentration of hormones in plants due to the inhibitory effect of humic substances on the enzyme IAA oxidase. In this regard, Ortega and Fernandez (2007) reported an increase in above ground and root biomass with C rate applied as humic substances extracted from vermicompost and leonardite. In the present study, the pH and EC of humic extract caused negative effects in root development, despite the dilution performed before its application; this negative effect was due to the fact that the salts concentration causes physiological stress by osmotic unbalance (Bassoi et al., 2003).
5.2.3. Sensitivity of each property for representing changes in management
Changes of each measured soil property on each treatment, with respect to the soil used as base line, were determined. The objectives of this analysis were to describe the effect of treatments on several soil properties and to determine the weights of each property in order to propose a possible model.
Each of the 18 treatments (including compost and humic extracts), was considered a population, with the idea of determining the proportion of them presenting changes in a given property over time (as compared to the base line). On the other hand the weight (slope) of each property over time was estimated and used to rank all the properties in terms of its sensitivity. Standardized variables were used and regressed over 3 times, 0, 4, 8 months. When the slope was not signifi cantly different from zero (P>0,05) it meant that there were not changes in time over the base line and the property was not sensitive enough in a given treatment. On the other hand the larger the coeffi cient (slope), the higher the weight of the property (Table 5.12).
The regression of each standardized variable on time in each treatment determined that the soil properties changing most frequently and with larger weights were Olsen-P (Ols-P), N-NH4 content, electrical conductivity %C and β-Glucosidase (β-Glu). Phosphate solubilizing bacteria changed over the base line in 94% of the 18 populations (treatments) evaluated (Table 5.12).

84
Table 5.12. Frequency analysis for all soil properties in pot experiment*
Treatment AcP AlkP U β-Glu F&Y Psol HS pH NH4 NO3 C EC OlsP1 0,00 0,00 0,26 0,00 0,00 0,35 -0,09 0,00 -0,27 0,00 -0,31 -0,42 0,27
2 0,00 0,00 0,32 0,00 0,00 0,32 0,00 0,12 -0,32 0,00 0,00 -0,43 0,41
3 0,00 0,00 0,00 0,00 0,00 0,33 0,00 0,00 0,25 0,00 0,00 -0,44 0,23
4 0,00 0,00 0,26 0,00 0,25 0,00 0,41 0,00 -0,35 0,00 0,00 -0,41 0,28
5 0,00 0,00 0,00 0,00 0,00 0,34 0,00 0,00 0,00 0,00 -0,29 -0,37 0,00
6 0,00 0,00 0,00 0,00 0,00 0,32 0,00 0,00 0,00 0,00 0,00 -0,37 0,00
7 0,00 0,00 0,00 0,00 0,00 0,38 0,39 0,00 -0,31 0,00 0,00 -0,43 0,00
8 0,00 0,00 0,00 0,00 0,00 0,34 0,64 0,00 0,00 0,00 0,00 -0,42 0,00
9 0,00 0,00 0,00 -0,32 0,00 0,29 -0,07 0,32 -0,35 -0,30 -0,33 -0,40 0,00
10 0,00 0,00 0,00 -0,34 0,00 0,28 -0,04 0,42 -0,32 0,00 -0,32 -0,37 0,00
11 0,00 0,00 -0,19 -0,35 0,00 0,35 0,00 0,46 -0,36 0,00 -0,32 -0,18 0,00
12 0,00 0,00 0,00 -0,35 0,00 0,34 0,00 0,48 -0,31 0,00 -0,32 0,00 0,00
13 0,00 0,00 0,00 -0,35 0,00 0,33 0,00 0,30 -0,28 -0,30 -0,31 0,00 0,00
14 -0,31 0,00 0,00 -0,34 0,00 0,34 -0,07 0,37 -0,35 -0,32 -0,32 0,00 0,00
15 - 0,00 -0,17 -0,35 0,00 0,39 0,00 0,49 -0,32 0,00 -0,33 -0,08 0,29
16 -0,31 0,00 0,00 -0,35 0,00 0,30 0,00 0,50 -0,35 -0,35 -0,31 0,00 0,00
17 -0,27 0,00 0,31 -0,35 -0,43 0,30 -0,11 0,00 -0,30 -0,35 -0,31 0,00 0,00
18 -0,25 0,00 0,27 0,35 -0,32 0,29 0,00 0,00 -0,35 -0,29 -0,32 0,00 0,00
All -0,08 0,00 0,18 -0,23 0,00 0,31 0,14 0,19 -0,29 -0,20 -0,23 -0,32 0,19
Freq** 22,22 0,00 38,89 55,56 16,67 94,44 44,44 50,00 83,33 33,33 66,67 66,67 27,78AlkP: alkaline phosphatase activity. AcP: acid phosphatases activity. U: urease activity; βGlu: β-glucosidase activity; F&Y: Fungi and yeasts, Psol: Phosphate solubilizing bacteria; HS: humic + fulvic acids, N-NH4: Ammonium nitrogen, N-NO3: Nitric nitrogen; C: Organic Carbon. EC: electrical
conductivity. OlsP: Phosphorous-Olsen.
*Frequency calculated as the number of responsive treatments divided by the total number of treatments.*
On the other hand their average corrected weight was 0,12 (Figure 5.3). On the other hand there were several properties changing less frequently and with lower weights which mean that they would not be good indicators of changes in management under the evaluated conditions.
0
0,05
0,1
0,15
0,2
0,25
0,3
0,35
P sol EC C Glu pH U HS OlsP AcP AlkP F&Y
Corr
ecte
d w
eigh
t
Soil Proper es -Pot experiment -Figure 5.13. Corrected weights of soil properties obtained by regression and frequency response
analysis (Pot experiment).Psol: Phosphate solubilizing bacteria, N-NH4: Ammonium nitrogen. EC: electrical conductivity, C: Organic Carbon, βGlu: β-glucosidase activity, U: urease activity; N-NO3: Nitric nitrogen, HS: humic + fulvic acids, OlsP: Phosphorous-Olsen AcP: acid phosphatases activity. AlkP: alkaline
phosphatase activity. F&Y: Fungi and yeasts.

85
Finally, the properties defi ned to explain changes in soil as minima data set under semi controlled conditions (pot experiment), were: phosphate solubilizer bacteria, ammonium nitrogen concentration, electrical conductivity, organic carbon, β glucosidase and pH.
5.3. Evaluation of C and N rates in commercial Table Grape yield
Simultaneously with the pot experiment, a fi eld study was conducted in an established, 1-year old, table grape orchard, Thompson Seedless variety grafted on “Freedom“ rootstock variety, under drip irrigation (Fig. 5.14). The effects of different C and N rates on soil, plant and fruit were assessed. Besides, quality indices for soil and fruit were developed.
Figure. 5.14. b. Field experiment under drip irrigation system. Uncultivated soil used as baseline – Agroecosystem baseline (AES)
5.3.1. Changes of soil properties over the base line.
Limary Valley is one of the most important areas in Chile in terms of grape production (table grape and pisco grapes). The area is characterized by mountainous landscape, subtropical, semiarid climate (Fig. 5.14), with winter temperatures ranging from -6°C to 15°C, and 16 to 23°C in summer; the area has an average annual temperature of approximately 18°C. The average rainfall is slightly over 125 mm/year and the area has excellent radiation levels. Soils in this semiarid region are mainly inceptisols, aridisols and entisols; they are relatively rich in sand (>50%), have low levels of organic matter (<1-2%), and tend to have alkaline pH. These factors represent extreme conditions for the soil mineralization process and, normally, under these conditions the rate of humus synthesis in crop land is low (Martínez et al., 2003). Studies by Etienne et al. (1993), in Ovalle et al. (1993), indicated that this region presents a high degree of degradation, situation that was confi rmed when sampling the base line.

86
Figure 5.15 Valle del Limarí, Chile
Xerophitic soil cover shows predominantly “espinales” like Acacia aven (Aronson et al., 1993) associated with woodlands “Lilén” (Azara celastrinal), “molle” (Schinus latifolius), “litre” (Lithraea caustic), “Guayacan” (Porlieria chilensis) and some grazing areas (Fig. 5.15 b and c). Riparian vegetation is dominated by Sauce (Salix spp.), and Guayacan, and uncultivated agroecosystem soil shows the presence of some weeds like Quingüilla (Chenopodium spp.) and Chamico (Datura stramonium) (Fig. 5.16a).
Figure 5.16. (a) Riparian vegetation –River Base line (BLMR), (b) Mountain Base line (BLM), Xerophilic forest, (c) detail of “Espinales” in Limarí Valley

87
5.3.1.1. Comparison among base lines at the beginning of the experiment
Three baselines were considered: 1) xerophytic forest at the mountain (Mountain baseline, BLM), 2) riparian vegetation by Rio Claro (River baseline, BLR), and 3) uncultivated soil (AES).Predominant soil chemical characteristics are: low organic matter and N contents, slightly acidic pH, low levels of P and medium levels of exchangeable bases (Table 5.13).
Table 5.13. Comparison among base line soils in terms of chemical, biochemical and microbiological characteristics
Units Xerofi lic Forest Mountain (BLM)
Agroecosystem Soil (AES)
Riparian Vegetation
(BLR)AcP μg de para-nitrofenol/g*h 201,4±59,5 98,9±20,3 280,6±0,0
AlkP μg de para-nitrofenol/g*h 176,36±77,7 128,5±30,8 315,7±0,0
U μg de NH4/g*h 105,7±7,28 32,87±13,0 95,7±0,0
β Glu μg de para-nitrofenol/g*h 95,6±31,25 19,8±4,24 45,00±0,0
Bact Log UFC/g 4,7±0,3 6,22±1,85 6,7±0,0
F Log UFC/g 5,09±1,2 5,63±0,46 6,0±0,0
Y Log UFC/g 3,85±0,15 5,01±0,95 1,03±0,0
Cellul Log UFC/g 4,56±0,26 5,06±0,31 5,03±0,0
Prot Log UFC/g 5,77±0,4 5,12±1,0 5,48±0,0
pH 6,76±0,0 7,6±0,14 7,7±0,0
HS % 0,58±0,0 0,49±0,1 0,69±0,0
N % 0,18±0,0 0,08±0,0 1,7±0,0
N-NH4 mg*kg-1 13,6±1,1 15,75±6,2 0,16±0,0
N-NO3 mg*kg-1 12,3±2,5 14,7±5,2 18±0,0
Ols-P mg*kg-1 9,7±4,1 19,6±4,2 36±0,0
OM % 3,83±0,7 1,52±0,44 5,84±0,0
C % 2,23±0,7 0,87±0,2 3,4±0,0
C/N 13,03±2,5 10,54±2,1 2±0,0βAcP: Acid Phosphatase; AlkP: Alkaline Phosphatase; βGlu: β glucosidase . U: urease. Bact: Total Bacteria.; ; F: Fungi, Y:
Yeast ; Cellul: Cellulolytic bacteria, Prot: Proteolitic bacteria. HS: Humic Substances (HA+FA).N: Nitrogen. NH4-N/NO3-N :Amoniacal Nitrogen/Nitric Nitrogen ratio. Ols-P: Olsen Phosphorous. OM: Organic Matter. C/N: Carbon:Nitrogen Ratio;
Overall, the riparian vegetation (BLR) had better quality soils than, BLM and this in turns than AE (Table 5.13, Figure 5.17a and 5.17b).
The analysis of variance made to compare the three baselines determined that AcP, AlkP, U, β-Glu, concentration of amilolytic bacteria (Amil), and some chemical characteristics like pH, N, N-NH4, N-NO3, Ols-P, %OM, %C, C/N showed signifi cant differences among base lines (Fig 5.17a and 5.17b). All these properties showed larger values in BLR and BLM than in agroecosystem base line (AES); BLR has permanent organic matter supply in different degradation grade. Also, the larger water availability and above ground biomass in riparian base means higher organic matter content in soil. However, apparently the xerophytic mountain base line (BLM) has organic matter rich in cellulolytic compounds and probably fresh nitrogen, according to higher urease β Glucosidase and Urease activity. In addition, BLR ecosystem receives inputs of organic matter by dragging the river in summer. The NH4 and pH was higher in BLR and agroecosystem AES, probably by the effect of run off.

88
Fig. 5.17a Comparison among base line soils in terms of biochemical properties.
** high signifi cant differenceBLR: Base line River-Riparian vegetation; BLM: Base line Mountain-xerophitic forest; AES: Base line_agroecosystem. AcP: acid phosphatase; AlkP: alkaline Phosphatase; U:
Urease; β Glu: β Glucosidase.
Fig. 5.17b Comparison among base line soils in terms of chemical properties. ** high signifi cant difference
BLR: Base line River-Riparian vegetation; BLM: Base line Mountain-xerophitic forest; AES: Base line_agroecosystem. N: total N; N-NH4: ammonium nitrogen; N-NO3: nitric nitrogen; Ols- P: Olsen Phosporous; OM: organic matter; C: organic
carbon; C/N:_ ratio
Uncultivated soil (AES) showed the lowest organic matter (OM) concentration (1,52±0,44 %) followed by mountain baseline (BLM) with 3,83±0,7 %, and riparian vegetation (BLR) (5,84±0.0), being consistent with the results of enzymatic activity which was also the lowest. According to Dick et al. (1996), enzyme activity is a property of soil rapidly changing by cultural practices, fertilizer management and crop type. The results obtained in this study, showed signifi cant differences between cultivated soil, with only one year under table grape management, including basal fertilization (nitrogen, phosphorous and potasium), and the uncultivated agroecosystem (table grape) soil.

89
5.3.1.2. Changes in time and by management over the agroecosystem base line.
Considering the agroecosystem base line (AES), on the average, there were positive changes in enzymatic activities (AcP,AlkP, U, and βGlu), microbial groups (Fungi, Yeast, Cellulolitic, and Proteolitic bacteria) and some chemical properties such as HS,OM, WSC, NH4, NO3, C, pH and Olsen P. Negative changes was observed in terms of total, amilolytic and phosphate solubilizing bacteria, electrical conductivity, total nitrogen and C/N ratio. In terms of frequency of change, the properties changing most often, in the sixteen agroecosystems (AE) (treatments) evaluated, where acid phosphatase activity (AcP), humic substances content (HS), and β-glucosidase activity (βglu), with 100, 100, and 94 % of the AE changing, respectively (Fig. 5.14). Regarding AE comparison, the ones receiving C and/or N showed similar responses as compared to the check treatment in terms of rate (slope) of change in key soil properties.

90
Tabl
e 5.
14. C
hang
e fre
quen
cy, w
ith re
spec
t to
the
base
line
, for
the
mea
sure
d pr
oper
ties
in th
e 16
eva
luat
ed A
ES
Trea
tmen
tA
cPA
lkP
Uβ-
Glu
Bac
tF&
YY
east
Pso
lC
ellu
lP
rot
Am
ilH
SO
MW
SC
pHC
EN
N
H4
NO
3N
H4/N
O3
CC
/NO
ls-P
11
00
10
00
00
00
10
11
00
00
00
01
21
10
10
00
01
10
10
01
00
01
00
01
31
00
10
01
01
00
10
01
00
00
00
01
41
01
10
01
00
10
10
11
00
00
00
00
51
00
10
00
00
10
11
00
00
00
01
10
61
10
1 0
00
01
00
11
01
00
00
01
11
71
00
10
00
00
00
11
01
00
11
01
11
81
01
00
00
00
00
10
01
00
00
00
01
91
10
10
00
00
00
10
00
00
00
00
01
101
10
10
00
00
00
10
01
00
00
00
01
111
01
10
00
00
00
10
01
00
00
00
01
121
00
10
00
00
00
10
01
00
00
00
00
131
10
10
00
00
10
10
00
00
00
00
01
141
00
10
00
00
00
10
01
00
00
00
01
151
10
10
00
00
00
10
11
00
00
00
00
161
00
10
10
01
10
10
01
00
00
00
01
Sum
166
315
01
20
45
016
33
130
01
20
33
12
%10
037
,518
,75
93,7
50
6,25
12,5
025
31,2
50
100
18,7
518
,75
81,2
50
06,
2512
,50
18,7
518
,75
75
AcP
: aci
d ph
osph
atas
es a
ctiv
ity, ;
HS
: hum
ic +
fulv
ic a
cids
, βG
lu: β
-glu
cosi
dase
act
ivity
, O
lsP
: Pho
spho
rous
-Ols
en, A
lkP
: alk
alin
e ph
osph
atas
e ac
tivity
.Por
t: pr
oteo
lytic
mic
roor
gani
sms,
WS
C: w
ater
sol
uble
ca
rbon
; Yea
st; C
ellu
l; ce
llulo
lytic
mic
roor
gani
sms;
F&
Y: F
ungi
and
yea
sts;
C: O
rgan
ic C
arbo
n, U
: ure
ase
activ
ity;
, N-N
O3: N
itric
nitr
ogen
; Bac
t: to
tal b
acte
ria;
Pso
l: P
hosp
hate
sol
ubili
zing
bac
teria
, A
mil:
am
iloly
tic b
acte
ria;;
EC
: ele
ctric
al c
ondu
ctiv
ity. N
: Org
anic
Nitr
ogen
; N-N
H4: A
mm
oniu
m n
itrog
en; C
/N r
atio

91
When estimating the weigth of each property, considering its average change (singless), and the frecuency of change, the most sensitive properties were acid phosphatase (AcP), humic substances (HS) and β glucosidase (β Glu) (Fig. 5.18).
Fig. 5.18 Corrected weights of soil properties obtained by regression and frequency response analysis (Field experiment).
AcP: acid phosphatases activity; HS: humic + fulvic acids, βGlu: β-glucosidase activity, OlsP: Phosphorous-Olse, AlkP: alkaline phosphatase activity.Port: proteolytic microorganisms, WSC: water soluble carbon; Yeast; Cellul; cellulolytic microorganisms; F&Y: Fungi and yeasts,; C: Organic Carbon, U: urease activity; N-NO3: Nitric nitrogen; Bact: total bacteria; Psol: Phosphate solubilizing bacteria, Amil:
amilolytic bacteria; EC: electrical conductivity. N: Organic Nitrogen; N-NH4: Ammonium nitrogen; C/N ratio.
5.3.2. Effect of C and N rates on soil properties
The quality of the organic matter applied, defi ned in terms of its reactive components (nutrient supply and storage), and physical characteristics (water retention capacity, structure, and others), is diffi cult to defi ne. In general SOM components can be divided into humic acids (HA) fulvic acid (FA), and humin, which are quantifi ed based on their solubility in alkaline and acid solutions (Stevenson, 1994). Soil humic substances (HS), composed by HA and FA, are stable polycyclic fractions, synthesized from simple organic matter by biochemical and microbial activity (Ortega and Fernandez, 2007). These C fractions show different absorbance at 465 (E4) and 665 nm (E6). The quality of SOM can be evaluated by C-HA/C-FA and the E4/E6 ratio and or/ through the classifi cation of HS. The C-HA/C-FA ratio defi nes humifi cation process, while E4/E6 ratio is used to characterize HA and FA; this ratio indicates the molecular size or chemical complexity degree of HS. These characteristics depend on the OM source; in this case, on the organic amendment. Depending on the source, and extraction process, they exhibit different properties in soil.
Analysis of variance revealed a strong interaction treatment by date, meaning that the effect of C and N rates on soil properties depended on the sampling date. Thus, after 6 months from establishment, C rate increased (p<0,1) HS, WSC, and pH, while N rate signifi cantly affected organic matter concentration and C/N ratio. At 12 months, C affected N-NO3, while N did with EC, and pH. Few interactions were observed between C and N rates.
At the end of the experiment, after 18 months from establishment, a signifi cant effect of C applied as humic substances in soil on the absorbance of an alkaline soil extraction, at both 465 (E4) and 665 (E6) nm was observed; this fi nding corroborates the accumulation of humic substances in soil by the application of humic extract that included C in several forms, including water soluble C (WSC), and that in fulvic and humic acids (Figure 5.19). A the same

92
time, ANOVA defi ned, C and N rate affected (p<0,1) HS, AlkP, pH, and Olsen P, and N rate signifi cantly affected the urease activity (Fig. 5.22). Most probably, humic extract applied is contributing to the accumulation or in situ formation of aliphatic groups in the soil (Velasco et al., 2004). On the other hand, C rate produced an increase in soil organic C (SOC) only at the lowest N rate used, 30 kg N ha-1 (Figure 5.20d).
Besides, the C rate, the type and quality of the organic matter applied defi ne the effi ciency of the application. Especially for intensive horticulture systems, like table grape under drip irrigation, the use of some organic matter amendments, like manure or compost, results diffi cult to apply, are expensive, and their components (particularly in fresh manure) could result in damage for the plant because of phytotoxic components (NH4, organic acids, phenolic components content). On the other hand, liquid humus or humic substances, are easy to apply through the irrigation system and along with supplying WSC, result in a stable source of C, and due to complex chemical structure, could be considered the storage of C in soil.
Fig 5.19. Average E4/E6 ratio of humic substances (HS) fraction with different Carbon (C) rate
Carbon is used as storage of energy and substrate for soil microorganisms, and contributes to plant metabolism in different forms. While C reserves obtained from photosynthesis contribute to vegetative growth and reproduction, also maintains root respiration and production of exudates that contribute to increasing and maintaining the benefi cial micro fl ora in the rhizosphere. At the same time, the application of organic amendments contributes to maintain or increase SOC concentration in soil (Conradie, 1980).
Humic substances (HS) application as C source results signifi cantly (p<0,05) increased soil pH, which was expected since the HS had alkaline pH (Figure 5.19). This would be a positive effect for acidic soils, however under the alkaline conditions of the experiment it would not since it might affect the availability of some nutrients, particularly P and micronutrients. However, under drip irrigation, fertigation is made controlling the pH of the water close to 6, therefore, in practical way, this would not be a problem.
In terms of biochemical indicators alkaline phosphatase and β-Glucosidase activities decreased with the increase in C rate (Fig. 5.20a and b). On the other hand the population o cellulolytic bacteria also decreased with C rate (Fig. 5.20d). Probably, observed effects are related to changes in pH and also to the increment of humifi ed C sources such a humic acids, after the most available C sources have been exhausted (WSC and fulvic acids) (Fig. 5.20c). On the other hand, one year before the beginning of the experiment, each plant was planted with 1 kg of semicomposted goat manure, a traditional cultural practice in table grape. This organic amendment contains organic carbon in different decomposition stages, as cellulose, hemicelluloses and protein, a complex organic substrate for cellulolytic microorganisms, which decompose the material through enzymatic activity. When this organic source completes the degradation process, the enzymatic activity stops and some functional groups as cellulolytic and proteolytic bacteria of microorganisms reduce in concentration. Humic acids can be

93
extracted from different fresh, composted, soil or marine sources and contain entirely aliphatic copolymers of several principal monomeric units originating from polysaccharides with enormous variability in composition (because there are so many possible monomeric units in the molecule) (Susic, 2008). However during the extraction process from compost, the fraction of cellulose is degraded increasing the aliphatic, aromatic and monomeric components in the extract, with low enzymatic activity (Table 5.7). For this reason, in soil the enzymatic activity is higher than base line (Table 5.14) and humic extract (Table 5.7) but over the time, decreased with humic substances application, data confi rmed in pots experiment (Table 5.9).
y = -0,0791x + 165,96R² = 0,2934
y = 0,0005x2 - 0,6121x + 337,38R² = 1
0
50
100
150
200
250
300
350
400
0 100 200 300 400 500
Enzy
ma
cA
cvi
tyμ
g p-
nitr
ophe
nol*
g-1*h
-1
C rate (kg/ha)
a. Alkaline phosphatases
6 12 18 Months
y = 0,0009x2 - 0,5896x + 168,66R² = 0,9962
y = -0,0001x2 - 0,1425x + 198,59R² = 0,9745
0
50
100
150
200
250
0 100 200 300 400 500Enzy
ma
cAc
vity
(μg p-
nitr
ophe
nol*
g-1*h
-1)
C rate (kg/ha)
b. Glucosidase
6 12 18 Months
y = -0,0004x + 6,3794R² = 0,6244
y = -3E-06x2 - 9E-05x + 6,5095R² = 0,9029
5
5,2
5,4
5,6
5,8
6
6,2
6,4
6,6
6,8
0 100 200 300 400 500
Conc
entr
aon
(Log
cfu*
g-1 )
C rate (kg/ha)
c. Celulloly c microorganisms
6 12 18 Months
y = -9E-06x2 + 0,0049x + 7,4532R² = 0,9649
y = -1E-05x2 + 0,0076x + 7,4673R² = 0,8813
y = -9E-06x2 + 0,006x + 8,0006R² = 0,9954
7
7,5
8
8,5
9
9,5
0 100 200 300 400 500
pH
Un
its
C rate (kg/ha)
d. pH6 12 18 Months
Figure 5.20 Effect of C application as humic extract on selected soil properties at three sampling dates (average of 4N rates). a). Alkaline phosphatase b) β Glucosidase c) Cellulolytic microorganisms d)pH
Nitrogen is one of the most critical nutrients in vine crops, especially in spring, during the period of rapid shoot growth, fl owering and berry formation (Winkler et al., 1974). In midsummer this need decreases, as the berries begin their process of maturity, so the availability and distribution of nitrogen previously stored in roots, trunk and canes defi nes the period of rapid growth (Alleweldt, 1984; Araujo and Williams, 1988). Therefore, it can be inferred that nitrogen should be applied when the vine can better absorb it and incorporate it as part of the reserve, while the losses of nitrogen in the soil by leaching or denitrifi cation, are reduced. Usually, there are two fertilization moments, during late spring up to fruit set and at postharvest. Nitrogen can be used by the vine plant, both in the form of ammonium (NH4
+) and nitrate (NO3-); when
the former is available, it is rapidly metabolized in roots and translocated to the shoots, leaves and clusters, while the NO3
- is present throughout the plant and throughout the year. Then, the plant starts forming amino acids, which may occur in the root tips, leaves, and even berries, mediated by the nitrate reductase enzyme.
The movement of N through the xylem occurs where it is possible to fi nd both inorganic and organic forms, limited to a few amino acids such as aspartic acid, glutamic acid and its amide,

94
arginine. In petioles (used as a diagnostic tissue to analyze plant nutritional status), a NO3+
fraction larger than 2.3% of dry weight can be found, depending on solar intensity and variety (Wermelinger, 1991).
Bell and Robson (1999), working with different nitrogen fertilizer rates (0, 50, 00, 200 and 400 g N/plant-vine) applied by irrigation in 12-year- old Cabernet Sauvignon vines, defi ned that use moderate rate of N (100 g N/ plant), stimulated vine growth and vigor (shoot extension), increased canopy density, reaching maximum petiole nitrate concentration at fl owering, and leaf area. An excess of nitrogen fertilization increases the concentration of mineral nitrogen, with accumulation of NO2
- and NO3- on berries and leaves of vine (Motasser et al., 2003).
In sandy soils, with low organic matter concentration, it is important to minimize the input of mineral nitrogen, because there is more risk of absorption and tissue accumulation or leaching losses. In this experiment the product Novatec Solub 21, was used as N source; it s, contains the nitrifi cation inhibitor DMPP, which acts blocking the ammonium monooxigenase (AMO) enzyme, produced by nitrifi cant bacteria in soil. This N fertilizer combined with stabilized organic matter with good C / N, can reduce nitrogen losses and increase nitrogen use effi ciency (NUE), also activating the rhizosphere microbial fl ora.
In the present study, after 18 months from the establishment of the experiment nitrogen application signifi cantly affected alkaline phosphatase and urease activities (Fig. 5.21a and b), which increased and decreased their activity with the N rate, respectively. On the other hand, soil pH decreased with the maximum N rate (120 kg N/ha), while SOC was lower with the minimum N rate (30 kg N/ha), (Fig. 5.21c).
The increase in C rate resulted on an increment of pH in soil, but increasing the N rate resulted in a slight acidifi cation process. Under the conditions of this experiment, these were independent processes caused by the application of an alkaline solution in case of C and a ammonium fertilizer in case of N. This fi nding results specially interesting for horticulture systems in acid soils, as was mentioned before.
y = 0,0151x2 - 0,8492x + 227,95R² = 0,9951
0
50
100
150
200
250
300
350
400
0 50 100 150
Enzy
ima
cAc
vity
( μg p-
nitr
ophe
nol*
g-1*h
-1)
N rate (kg/ha)
a. Alkaline Phosphatase
y = -0,0011x2 - 0,7085x + 146,89R² = 0,9985
0
20
40
60
80
100
120
140
160
0 50 100 150
Enzy
ma
c Ac
vity
(μg
de N
H4
g-1*h
)
N rate (kg/ha)
b. Urease
y = -6E-05x2 + 0,0033x + 8,6871R² = 0,9836
8,1
8,2
8,3
8,4
8,5
8,6
8,7
8,8
0 50 100 150
Uni
ts
N rate (kg/ha)
c. pH
Fig. 5.21 Effect of C and N on soil properties fi eld experiment a) alkaline phosphatase, b) Urease, c) pH
On the other hand, the application of high rates of C (400 kg C/ha) in combination with 60 or

95
120 kg N/ha resulted positive in relation to the increase in soil organic carbon compared to the Agroecosystem Baseline (AES). This increment can be explained by the application of humic extracts which includes soluble carbon, besides aromatic and aliphatic compounds which are slowly degradable and stable in soil. The humic substances (HS) have been related, by several authors, with improving agronomic parameters like stimulating root development (Vaughan and MacDonald, 1976) and nutrient uptake (Vaughan et al., 1985; Ortega and Fernandez, 2007). Low molecular weight fractions (including in WSC fraction) induced morphological changes in plants, similar to those caused by indole-3-acetic acid (IAA) (Muscolo et al., 1993). Studies by Lui et al. (1998) showed a positive effect of humic substances on chlorophyll leaf content, root and shoot dry weight and number of fl owers and buds in grass. Also, the extracted humic substances contained biologically active substances not from the original parent compounds, but as products of microbial metabolism; these promotion effects are not completely studied, but HS contribute to plant nutrition improving N and K availability, soil structure, water-air retention capacity, increasing soil microbial population, and acts as a buffer solution in cation exchange capacity and pH (Anderson, 1979; Margdof and Weil, 2004). In addition, humic substances can serve as carrier of micronutrients or growth factors; a theory even is proposed on which humic substances can act as a direct stimulator of plant growth by entering into the plant tissue, resulting in various biochemical effects at the cell wall, membrane, or in the cytoplasm (Magdoff and Weil, 2004).
5.3.2.1. Correlation among measured soil variables
Since there was interaction between sampling time and treatment, the correlation analysis was done by sampling date.
At six months from establishment a positive correlation was observed between the soil C content and hydrolytic enzyme activity of β-glucosidase, and acid and alkaline phosphatases. At the same time OM, fungi and yeast and N-NO3, showed many correlations with biochemical and microbiological properties (Table 5.15). This relationship held up to 12 months from establishment, especially with the β-glucosidase. B- glucosidase, wich also showed a positive correlation with soluble carbon and pH (Table 5.16). These results confi rm the usefulness of this enzyme as an indicator of changes in soil; its increased activity is probably related to an increase in WSC, and not necessarily the SOC, caused by the applications of C as humic acid extracts.
The enzyme β-glucosidase is hydrolyzes glycosides in the β-D-glucose dimer as cellobiose, intermediate in the degradation of cellulose. Numerous studies report this enzyme as an indicator of changes in the soil as a result of application of organic matter which is confi rmed in the present study. Similar results were obtained in the fi rst and second sampling date, coinciding with 6 and 12 months after application. In the third sampling date (18 months from establishment), however, this correlation is not observed, but there is negative correlation between this enzyme and the pH, which suggests that the increase in soil pH, resulting from the application of C as humic extracts, could have affected the activity (Table 5.17).
Regarding alkaline phosphatases (AlkP), correlation analysis indicated similar results as compared to other studies (Frankenberger and Dick 1983) with high correlation coeffi cients with organic C, pH and EC in fi rst and third sampling time (Table 5.15 and 5.17); this enzyme exhibits better activity in alkaline pH, and depends on availability of organic phosphates in the system. It is produced by plant and microorganisms and its activity could be increased if the plant rizospheric exhudates exhibit higher phosphate concentration. The humic extracts applied could be a possible inductor of different P and N metabolic pathways in plant being benefi ciated by this specifi c activity.
On the other hand a positive relationship between alkaline and acid phosphatases and β- glucosidase was observed.
In general, C application during 18 months, resulted in an increased activity of AlkP and β-Glu,
96
with respect to the AE base line; these biochemical properties resulted better indicators than selected microbial groups or other chemical characteristics (Fig. 5.22). These increased activities can be explained mainly by the augmented C fractions in soil, particularly HS and WSC as these properties increased with time and were modifi ed by management (Fig. 5.22 and 5.23). Natural increased was probably due to the goat manure added to each plant as explained before. After 18 months of management many treatments surpassed the BLM and BLR bases lines, meaning that table grape production can be as sustainable as any natural ecosystem (Fig. 5.22). Nonetheless, bacteria and yeasts exhibited different relationships with organic matter depending on the sampling date. These results suggest that soil bacteria were positively affected by the increment in SOM in soil; with other changes occurring in soil, especially in pH, and NH4 and NO3 availability, the yeast increased their concentration.

97
Tabl
e 5.
15. P
ears
on c
orre
latio
n S
oil p
rope
rties
, fi rs
t sam
plin
g -6
mon
ths(
n=32
)A
cPA
lkP
Uβ
Glu
Bac
tF&
YPs
olC
ellu
lPr
otA
mil
HS
OM
WSC
pHEC
NN
-NH
4N
-NO
3C
CN
Ols
P
AcP
1
Alk
P0,
351
U-0
,001
-0,0
011
β G
lu-0
,05
0,66
0,08
1
Bac
t0,
340,
53-0
,06
0,29
1
F&Y
-0,3
3-0
,28
0,04
-0,0
4-0
,27
1
Psol
-0,0
3-0
,001
-0,0
70,
12-0
,09
0,39
1
Cel
lul
0,07
0,27
0,22
0,17
0,08
0,32
0,09
1
Prot
0,01
50,
140,
070,
060,
007
0,03
0,03
0,44
1
Am
il-0
,09
0,21
-0,0
1-0
,05
-0,0
10,
750,
50,
26-0
,09
1
HS
0,25
0,06
-0,1
50,
050,
23-0
,38
-0,2
6-0
,19
-0,0
2-0
,17
1
OM
0,44
0,59
-0,1
10,
350,
51-0
,66
-0,4
60,
090,
08-0
,43
0,31
1
WSC
0,19
-0,1
3-0
,14
-0,0
2-0
,05
-0,0
30,
070,
24-0
,01
0,23
0,39
-0,0
31
pH0,
16-0
,28
-0,0
7-0
,22
0,13
0,32
0,31
0,08
-0,1
70,
470,
19-0
,13
0,25
1
EC-0
,06
0,19
0,02
0,22
-0,2
30,
010,
39-0
,12
-0,0
60,
06-0
,03
-0,1
40,
17-0
,41
1
N0,
270,
39-0
,24
0,3
0,01
-0,4
4-0
,03
-0,2
-0,1
7-0
,13
0,16
0,5
0,37
-0,3
0,41
1
N-N
H4
-0,1
90,
110,
440,
25-0
,22
-0,0
10,
050,
17-0
,01
-0,1
3-0
,04
-0,1
4-0
,05
-0,4
10,
560,
161
N-N
O3
0,06
0,51
-0,0
80,
360,
27-0
,42
-0,1
80,
340,
31-0
,40,
10,
52-0
,14
-0,3
70,
020,
190,
11
C0,
440,
59-0
,11
0,35
0,51
-0,6
6-0
,46
0,09
0,08
-0,4
30,
30,
5-0
,03
-0,2
4-0
,14
-0,5
-0,1
40,
51
CN
0,29
0,41
0,02
0,19
0,58
-0,4
-0,4
80,
260,
24-0
,37
0,25
0,75
-0,2
6-0
,07
-0,3
8-0
,17
-0,2
40,
460,
751
Ols
P0,
120,
080,
370,
040,
08-0
,41
0,37
-0,1
5-0
,007
-0,4
80,
240,
140,
05-0
,25
0,1
0,22
0,39
0,14
0,14
0,00
21
AcP
: aci
d ph
osph
atas
es a
ctiv
ity, H
S: h
umic
+ fu
lvic
aci
ds, β
Glu
: β-g
luco
sida
se a
ctiv
ity,
Ols
P: P
hosp
horo
us-O
lse,
Alk
P: a
lkal
ine
phos
phat
ase
activ
ity.P
ort:
prot
eoly
tic m
icro
orga
nism
s, W
SC
: wat
er s
olub
le
carb
on; Y
east
; Cel
lul;
cellu
loly
tic m
icro
orga
nism
s; F
&Y
: Fun
gi a
nd y
east
s; C
: Org
anic
Car
bon,
U: u
reas
e ac
tivity
; , N
-NO
3: N
itric
nitr
ogen
; Bac
t: to
tal b
acte
ria;
Pso
l: P
hosp
hate
sol
ubili
zing
bac
teria
, Am
il:
amilo
lytic
bac
teria
;; E
C: e
lect
rical
con
duct
ivity
. N: O
rgan
ic N
itrog
en; N
-NH
4: A
mm
oniu
m n
itrog
en; C
/N r
atio

98
Tabl
e 5
.16.
Pea
rson
cor
rela
tion
Soi
l pro
perti
es, s
econ
d sa
mpl
ing
-12
mon
ths(
n=32
)A
cPA
lkP
Uβ
Glu
Bac
tF&
YPs
olC
ellu
lPr
otA
mil
HS
OM
WSC
pHEC
N-N
H4
N-N
O3
CO
lsP
AcP
1
Alk
P-0
,17
1
U-0
,16
0,41
1
β G
lu0,
40,
3-0
,07
1
Bac
t-0
,13
0,35
0,46
-0,0
41
F&Y
0,05
0,02
-0,2
10,
040,
341
Psol
0,26
0,33
-0,0
50,
210,
290,
21
Cel
lul
-0,0
60,
280,
34-0
,20,
180,
010,
21
Prot
0,2
0,28
-0,0
8-0
,2-0
,03
-0,0
20,
010,
161
Am
il-0
,02
0,09
0,12
-0,0
50,
410,
06-0
,02
0,27
-0,0
81
HS
0,26
0,23
-0,1
10,
310,
03-0
,08
0,06
0,00
1-0
,26
0,09
1
OM
0,12
-0,1
1-0
,11
0,68
-0-0
,01
-0,0
8-0
,19
-0,2
20,
260,
541
WSC
00,
17-0
,12
-0,3
8-0
,25
-0,1
3-0
,01
0,01
-0,0
10,
020,
04-0
,13
1
pH0,
3-0
,33
0,26
0,68
0,22
-0,0
5-0
,13
-0,0
80,
130,
001
-0,1
4-0
,54
0,32
1
EC0,
01-0
,22
-0,0
50,
11-0
,27
0,28
-0,0
5-0
,16
-0,0
2-0
,01
0,16
0,22
0,03
-0,2
1
N-N
H4
0,00
60,
11-0
0,01
40,
03-0
,02
-0,2
8-0
,18
0,11
-0,2
70,
26-0
,14
-0,2
6-0
,06
0,00
51
N-N
O3
0,02
0,07
-0,0
70,
46-0
,16
-0,1
1-0
0,16
-0,1
40,
010,
410,
41-0
,08
-0,5
40,
66-0
,16
1
C0,
120,
17-0
,10,
68-0
-0,0
3-0
,11
0,15
-0,2
30,
260,
540,
99-0
,13
-0,5
50,
22-0
,14
0,44
1
Ols
P0,
030,
03-0
,13
0,29
-0,2
1-0
,17
-0,1
70,
170,
070,
270,
180,
51-0
-0,4
70,
050,
010,
040,
521
AcP
: aci
d ph
osph
atas
es a
ctiv
ity, ;
HS
: hum
ic +
fulv
ic a
cids
, βG
lu: β
-glu
cosi
dase
act
ivity
, O
lsP
: Pho
spho
rous
-Ols
e, A
lkP
: alk
alin
e ph
osph
atas
e ac
tivity
.Por
t: pr
oteo
lytic
mic
roor
gani
sms,
WS
C: w
ater
sol
uble
ca
rbon
; Yea
st; C
ellu
l; ce
llulo
lytic
mic
roor
gani
sms;
F&
Y: F
ungi
and
yea
sts,
;: C
: Org
anic
Car
bon,
U: u
reas
e ac
tivity
; , N
-NO
3: N
itric
nitr
ogen
; Bac
t: to
tal b
acte
ria;
Pso
l: P
hosp
hate
sol
ubili
zing
bac
teria
, Am
il:
amilo
lytic
bac
teria
;; E
C: e
lect
rical
con
duct
ivity
. N: O
rgan
ic N
itrog
en; N
-NH
4: A
mm
oniu
m n
itrog
en; C
/N r
atio

99
Tabl
e 5.
17. P
ears
on c
orre
latio
n S
oil p
rope
rties
, thi
rd s
ampl
ing
-18
mon
ths(
n=32
)
AcP
Alk
PU
β G
luY
FC
ellu
lP
rot
Am
ilH
SO
MW
SC
pHE
CN
N-N
H4
N-N
O3
CC
/NO
lsP
AcP
1
Alk
P0,
361
U0,
13-0
,21
β G
lu0,
350,
7-0
,13
1
Y-0
,13
0,17
-0,0
30,
371
F0,
270,
130,
030,
180,
171
Cel
lul
0,3
0,46
00,
340,
180,
171
Pro
t-0
,05
-0,1
-0,1
80,
110,
430,
10,
141
Am
il-0
,07
0,1
-0,0
60,
06-0
,03
0,15
-0,0
9-0
,11
HS
0,25
0,2
0,12
0,26
0,4
0,24
0,18
-0,1
10,
061
OM
0,13
0,38
-0,1
70,
27-0
,17
0,19
0,2
0,14
0,11
0,23
1
WS
C-0
,01
-0,1
30,
16-0
,31
-0,1
6-0
,06
-0,0
7-0
,1-0
,22
-0,2
6-0
,14
1
pH-0
,11
-0,6
80,
22-0
,45
0,35
0,02
-0,4
8-0
,05
-0,2
3-0
,27
-0,1
50,
311
EC
0,09
0,33
-0,1
70,
16-0
,03
-0,2
50,
33-1
9-0
,01
0,12
0,24
-0,2
7-0
,68
1
N0,
060,
250,
230,
16-0
,08
00,
120,
080,
270,
220,
3-0
,2-0
,13
0,11
1
N-N
H4
-0,1
5-0
,05
-0,4
8-0
,16
0,37
-0,3
0,15
0,22
0,02
-0,1
4-0
,23
0,04
0,3
0,21
-0,3
61
N-N
O3
0,2
0,3
-0,1
50,
410,
40,
009
0,24
0,1
0,03
0,18
0,18
-0,1
6-0
,51
0,45
-0,1
20,
31
C0,
130,
38-0
,17
0,27
0,32
0,19
00,
150,
110,
220,
99-0
,14
-0,1
50,
240,
3-0
,23
0,18
1
C/N
0,18
0,12
-0,1
0,16
0,21
0,33
00,
04-0
,33
-0,0
60,
480,
08-0
,09
0,01
1-0
,51
-0,1
20,
110,
431
Ols
P-0
,07
0,04
-0,0
50,
18-0
,17
0,14
0,28
0,27
-0,1
40,
180,
130,
010,
11-0
,30,
22-0
,10,
080,
14-0
,11
AcP
: aci
d ph
osph
atas
es a
ctiv
ity, ;
HS
: hum
ic +
fulv
ic a
cids
, βG
lu: β
-glu
cosi
dase
act
ivity
, O
lsP
: Pho
spho
rous
-Ols
e, A
lkP
: alk
alin
e ph
osph
atas
e ac
tivity
.Por
t: pr
oteo
lytic
mic
roor
gani
sms,
WS
C: w
ater
sol
uble
ca
rbon
; Yea
st; C
ellu
l; ce
llulo
lytic
mic
roor
gani
sms;
F&
Y: F
ungi
and
yea
sts,
;: C
: Org
anic
Car
bon,
U: u
reas
e ac
tivity
; , N
-NO
3: Nitr
ic n
itrog
en; B
act:
tota
l bac
teria
; P
sol:
Pho
spha
te s
olub
ilizi
ng b
acte
ria, A
mil:
am
iloly
tic b
acte
ria;;
EC
: ele
ctric
al c
ondu
ctiv
ity. N
: Org
anic
Nitr
ogen
; N-N
H4: A
mm
oniu
m n
itrog
en; C
/N r
atio

100
0
50
100
150
200
250
300
350
400
0 0 100 200 400 0 100 200 400 0 100 200 400
AES 6 months 12 months 18 months
Enzy
ma
c ac
vity
( μg p-
nitr
ophe
nol*
g-1*h
-1)
a. Alkaline Phosphatase
BLM BLR
0
50
100
150
200
250
0 0 100 200 400 0 100 200 400 0 100 200 400
AES 6 months 12 months 18 months
Enzy
ma
c Ac
vity
(μg p-
nitr
ophe
nol*
g-1*h
-1)
Glucosidase
BLM BLR
4
4,5
5
5,5
6
6,5
7
0 0 100 200 400 0 100 200 400 0 100 200 400
AES 6 months 12 months 18 months
log
(cfu
*g-1
)
c. Celluloly c microorganisms
BLM BLR
6,5
7
7,5
8
8,5
9
9,5
0 0 100 200 400 0 100 200 400 0 100 200 400
AES 6 months 12 months 18 months
pH u
nits
d. pH
BLM BLR
0
0,5
1
1,5
2
2,5
3
0 0 100 200 400 0 100 200 400 0 100 200 400
AES 6 months 12 months 18 months
HS (H
A+FA
-%)
e. Humic Substances
BLM BLR
0
50
100
150
200
250
300
350
0 0 100 200 400 0 100 200 400 0 100 200 400
AES 6 months 12 months 18 months
WSC
(mg*
L-1)
f. Water Soluble Carbon
Fig. 5.22. Changes in chemical, biochemical and biological activities in soil – Field experiment- . a) alkaline phosphatase, b) β Glucosidase c) cellulolytic microorganisms, d) pH, e) humic substances
and f) water soluble carbon
y = 80.93x + 65.626R² = 0.15
0
100
200
300
400
500
600
700
0 1 2 3 4
WSC
(mg
kg-1
)
Humic Substances -HS(%)
a. Water Soluble Carbon
6 12 18 months
y = 71.954x + 3.2246R² = 0.57
0
50
100
150
200
250
300
0 1 2 3 4
Enzy
ma
cac
vity
(μg p-
nitr
ophe
nol*
g-1*h
-1)
Humic Substances -HS (%)
b. Glucosidase
6 12 18 months
Fig. 5.23. Relation between HS in soil and a)WSC concentration and b) β Glucosidase in table grape
along 18 months

101
In sandy soils, enzymes are associated more to soil organic matter and their activity depends on the changes in electrical charge related to pH, or presence of soluble organic matter. In this case, the applications of humic extracts leave soluble carbon available in soil solution (increase the WSC concentration in soil) and this carbon is used by microorganisms producing active enzymes and changes in cationic exchange capacity in soil. Changes in CEC and pH affect the availability of different elements, and particularly P, which is involved in root growth stimulation.
The humic extract applied to soil, had 0,8% (on wet basis) of organic matter, and 3,93 mg kg-1 of total P, which was not detected by Olsen technique, since it measures only inorganic, P when done by UV-VIS spectroscopy (section 5.2.1); at the same time, HS showed low enzymatic activity for acid phosphatase, presenting detectable activity only for alkaline phosphatase and non detectable for β- glucosidase. Organic P added with the humic extract, plus the organic phosphorus present in soil, as result of goat manure application at planting, increased Organic P concentration and this could be used as consequence for microbial activity.
5.3.3. Effect of C and N rates on nutritional status of table grape plants
Analysis of variance performed on chemical and biochemical properties of leaf tissue, indicated no signifi cant differences among treatments. Similarly, it was not possible to demonstrate any effect of different C or N rates on chlorophyll content. The leaf N status often correlates with higher chlorophyll content and SPAD values; authors such as Ferrara et al.(2007), have shown that application of humic acids signifi cantly increased SPAD, total chlorophyll and chlorophyll a (Cha) in leaves of different grape types, as in grapevine rootstocks 41B and 110 Richter (Zachariakis et al. 2001).
Nutrient values found in all treatments were inside the normal ranges for table grapes and plants did not show any defi ciency or toxicity symptom (Table 5.18).

102
Tabl
e 5.
18 M
acro
and
mic
ronu
trien
t fol
iar c
onte
nt (2
d. s
easo
n)Tr
eatm
ent
NC
KP
Ca
Mg
Na
Cu
Mn
FeZn
B
%
m
g*kg
-1
12,
5±0,
245
,0±0
,71,
7±0,
00,
2±0,
02,
6±0,
60,
3±0,
043
3±10
1,1
10,3
±0,6
45,8
±1,4
149,
5±16
,165
,2±2
2,2
53,7
±20,
52
2,5±
0,1
44,9
±0,1
1,8±
0,2
0,2±
0,0
2,1±
0,3
0,2±
0,0
368,
5±21
,98,
9±0,
452
,6±2
,115
1,9±
2,0
79,7
±14,
256
,2±1
9,7
32,
4±0,
045
,7±1
,41,
5±0,
40,
2±0,
02,
6±0,
10,
3±0,
040
8,5±
41,7
11,0
±0,0
64,3
±3,7
158,
4±6,
674
,8±1
6,5
46,2
±21,
64
2,6±
0,3
45,7
±0,4
81,
5±0,
20,
2±0,
02,
5±0,
210,
3±0,
043
9,0±
60,8
11,9
±1,0
7**
74,0
±40,
317
6,7±
23,2
91,8
±19,
955
,7±2
5,35
52,
3±0,
0745
,5±0
,16
1,3±
0,13
0,2±
0,11
2,6±
2,5
0,3±
0,0
372±
408,
6±0,
2*59
,8±5
,813
9,7±
11,2
75,4
±7,7
52,4
±15,
96
2,4±
0,24
45,6
±0,7
61,
70,1
50,
2±0,
042,
1±0,
660,
2±0,
0638
4±91
,99,
5±0,
8653
,6±3
,915
9,4±
1,85
84,4
±2,4
648
,7±2
,79
72,
6±0,
0246
,3±1
,91,
5±0,
330,
2±0,
02,
5±0,
850,
3±0,
0747
0±28
,310
,5±0
,13
56,3
±4,2
155,
8±10
,290
,8±5
,447
,6±4
,63
82,
5±0,
045
,6±0
,81,
8±0,
410,
2±0,
042,
4±0,
30,
3±0,
0441
8,0±
42,4
8,6±
0,09
*69
,3±2
7,7
142,
4±3,
677
,3±1
4,9
60,1
±32,
09
2,4±
0,2
46,6
±0,1
21,
6±0,
080,
3±0,
092,
3±0,
150,
2±0,
0134
3,0±
1,41
11,4
±0,5
767
,9±1
0,44
188,
8±18
,154
,8±1
0,5
39,2
±6,9
102,
6±0,
0345
,4±0
,26
1,7±
0,14
0,3±
0,07
2,4±
0,15
0,3±
0,03
397,
0±41
,09,
9±1,
4871
,9±1
,616
9,3±
26,7
65,5
±6,6
45,0
±11,
711
2,7±
0,02
**46
,0±1
,41,
5±0,
060,
3±0,
02,
6±0,
00m
2±0,
036
1,2±
14,2
10,8
±0,7
79,2
±15,
617
9,3±
38,7
76,8
±1,3
51,9
±10,
212
2,5±
0,13
44,9
±0,5
1,6±
0,03
0,3±
0,0
2,5±
0,16
0,3±
0,08
371,
5±20
,58,
9±0,
3474
,4±2
7,2
150,
0±21
,456
,7±1
0,1
41,6
±4,0
713
2,7±
0,12
**45
,5±0
,21,
5±0,
030,
3±0,
023,
0±0,
890,
3±0,
0243
5,5±
80,9
10,1
±1,2
103,
2±19
,216
1,3±
23,0
77,5
±9,1
47,7
±6,7
142,
5±0,
1645
,5±1
,37
1,7±
0,37
0,2±
0,01
2,3±
0,4
0,2±
0,01
342,
0±25
,18,
9±0,
872
,0±6
,213
9,4±
8,9
60,1
±16,
041
,0±4
,615
2,4±
0,0
44,6
±0,2
1,7±
0,3
0,2±
0,04
2,3±
0,0
0,2±
0,0
457,
0±1,
49,
8±0,
7674
,4±0
,316
1,3±
5,7
101,
4±36
,256
,5±1
2,1
162,
3±0,
06*
44,9
±0,1
1,7±
0,1
0,2±
0,0
2,4±
0,6
0,3±
0,08
379,
0±56
,19,
9±0,
877
,2±1
8,2
176,
4±9,
810
6,8±
2,3
61,1
±2,7

103
The N fertilizer, together with the humic extract, was applied during spring up to fruit set, to correspond with rapid uptake and demand by developing clusters, and to a lesser extent by shoots and leaves. This N was metabolized during the plant, growth but during the fi rst season, rates over 60 kg N ha-1 resulted in the decrease of internal metabolic process (Fig. 5.24a). This was expected since there was more N available than the one needed. Nitrate reductase showed strong negative correlation with metabolized N (Table 5.19). Increasing N rates up to 60 kg N ha-1 increased NR activity and decreased metabolized N (Annex 1).
Nitrate reductase (NRed) is an enzyme inducible by substrate, that catalyzes the reduction of nitrate (NO3
-) ion absorbed through the roots, to nitrite (NO2-) and has been reported as an
indicator of nitrogen metabolism in Thompson seedless, under different nitrogen fertilization regimes. In this research the NR activity was inversely related to chlorophyll content and yield in the fi rst year, and showed no association with nitrate or ammonium nitrogen concentrations. During the second year, NR activity was not correlated with C or N rates, but it showed correlations with some nutrients such as B and Zn as well as with SPAD (Table 5.20). Nitrogen application was related with more plant growth which in turn means less chlorophyll concentration (Fig.5.24 b) and more metabolized nitrogen.
Table 5.19. Pearson correlation analysis among measured foliar parameters in fi eld experiment (n=32). fi rst season
CR NR Cha Chb Chl T NRed N N-NH4 N-NO3 MetN C C/NCR 1
NR ,000 1
Cha -,287 -,364 1
Chb -,296 -,225 ,931 1
TChl -,292 -,342 ,998 ,954 1
NRed ,231 ,174 -,501 -,501 -,507 1
N ,000 ,040 ,119 ,110 ,119 ,296 1
N-NH4 ,122 ,083 ,117 ,057 ,107 ,197 ,525 1
N-NO3 -,214 ,203 ,077 ,127 ,087 ,031 ,032 ,054 1
Met N ,010 -,039 ,322 ,361 ,333 -,826 -,440 -,175 -,130 1
C -,042 -,448 ,116 ,057 ,106 -,226 -,022 -,206 -,213 ,212 1
C/N -,006 -,137 -,181 -,189 -,184 -,192 -,966 -,565 -,065 ,313 ,205 1CR: Carbon Rate. NR: Nitrogen Rate. Ch a: Chlorophyll a. Ch b: Chlorophyll b. T Chl: Total Chlorophyll. NRed: Nitrate reductase. N: Organic Nitrogen. N-NH4: ammoniacal nitrogen. N-NO3: Nitric nitrogen MetN: metabolized nitrogen. C:Organic Carbon. C/N:
carbon:nitrogen ratio.
From bunch closure to veraison, when shoot growth slows, available N will also be allocated and incorporated into permanent vine structures for storage. The timing of N fertilizers, like other nutrients, should occur when demand is high and uptake is rapid. Nitrogen is needed most during the period of rapid vegetative growth, which occurs during the spring, from budbreak to early berry development. It is during this period that new growth may accumulate up to 50% of its annual N requirement (Conradie, 2005). Because active root growth and mineral uptake is generally minimal during the budbreak period, N demand is met primarily from reserves stored in the roots and other permanent woody structures (trunk, cordons and canes).

104
Tabl
e 5.
20. P
ears
on c
orre
latio
n an
alys
is a
mon
g m
easu
red
folia
r par
amet
ers
in F
ield
exp
erim
ent s
econ
d se
ason
(n=3
2)C
NO
MpH
NN
H4
NO
3 B
Zn
Fe
Mn
Ca
Na
Mg
P K
C N
SPA
D C
hl a
Chl
bTC
hlN
red
C1
N,0
001
OM
-,029
,011
1
pH,6
92-,3
84-,1
531
EC-,1
18,3
41,2
52-,6
84N
-,204
-,399
,279
-,138
1
NH
4-,2
63,2
00-,2
37-,3
03-,3
571
NO
3-,1
61,3
82,1
89-,5
18-,1
25,3
101
B,1
91-,0
59-,0
09,1
33-,3
90,1
76,1
521
Zn
,315
,114
-,096
,115
-,293
,158
,177
,703
1
Fe
,068
,099
,269
-,096
-,042
-,326
,011
,110
,207
1
Mn
,127
,449
,172
-,062
-,346
,468
,342
-,111
-,041
-,161
1
Ca
-,042
,034
,259
-,122
,189
-,065
-,022
-,460
-,280
-,101
,436
1
Na
,104
-,084
,090
-,017
-,033
,115
,383
,439
,510
-,130
-,074
-,214
1
Mg
,087
-,096
,002
-,014
,103
,077
,002
-,276
-,125
-,476
,370
,734
,074
1
P-,0
69,1
95,0
85-,1
78-,3
27,3
43,3
05,1
95-,2
02,0
34,3
96,0
00-,1
90-,1
911
K,1
07,0
39,0
09,1
47-,1
45-,0
46-,2
06,5
78,3
50,0
50-,3
15-,6
74,1
52-,5
55,1
211
C-,1
36-,1
36-,0
25-,0
97,2
39-,0
28,1
31-,2
69-,1
84,3
78-,0
88,0
26-,0
63-,2
05-,0
03-,3
321
N-,0
37,0
44,2
49-,1
08,1
68-,2
93-,0
25-,3
35-,2
30,2
42,0
28,4
41-,0
57,0
38-,0
45-,2
14,3
151
SPA
D-,1
57-,0
68,0
03-,1
12-,0
31,3
09,3
03-,1
83-,4
32-,1
98,4
71,2
43-,2
32,1
13,5
57-,4
05,1
86,0
521
Chl
a-,1
34-,1
82,4
27-,1
48,2
15-,4
23-,0
04,0
13-,1
15,4
29-,1
68,2
35-,2
19-,1
18,2
03,1
66,1
20,3
47,0
551
Chl
b-,2
03-,3
02,0
24-,1
54,0
22,3
95,0
87,0
87-,0
36-,0
21,1
06,1
42-,1
26,0
13,4
86,0
60,0
87,0
26,4
42,4
421
Chl
tota
l-,1
61-,2
24,3
87-,1
63,1
97-,2
98,0
14,0
29-,1
10,3
80-,1
29,2
38-,2
21-,1
03,2
80,1
60,1
25,3
15,1
39,9
83,5
971
Nre
d,3
28-,0
25-,1
52,1
12,0
25-,2
57-,0
47,4
25,6
00,3
49-,3
21-,2
92,2
69-,2
16-,1
78,4
02-,0
15-,2
53-,3
96,1
26,0
04,1
131
C: c
arbo
n ra
te; N
: nitr
ogen
rat
e; O
M: o
rgan
ic m
atte
r; E
C: e
lect
rical
con
duct
ivity
; N: o
rgan
ic n
itrog
en; N
itrog
en. N
-NH
4: am
mon
iaca
l nitr
ogen
. N-N
O3: N
itric
nitr
ogen
, C: F
olia
r To
tal c
arbo
n; N
: Fol
iar
Tota
l N
itrog
en; S
PA
D: C
hlor
ophy
ll by
Spa
d; C
h a:
Chl
orop
hyll
a. C
h b:
Chl
orop
hyll
b. T
Chl
: Tot
al C
hlor
ophy
ll. N
Red
: Nitr
ate
redu
ctas
e.

105
Several authors report increases in N content due to humic acid applications, both in leaf and soil, in crops such as olive (Fernandez- Escobar et al., 1996), tomato (David et al., 1994), asparagus (Tejada and González, 2003), using different origin and concentration of HS. However, in this study no effect of C rate on the nutritional status of table grape plants could be demonstrated.
y = -0,0007x2 + 0,1173x + 6,4018R² = 0,9893
0
2
4
6
8
10
12
0 20 40 60 80 100 120 140
N R
ed a
cvi
ty(μ
g N
O2
g-1 *
h)
N rate (kg N/ha)
Nitrate reductase ac vity -foliar ssue2000
1950
1900
1850
1800
1750
1700
1650
16000 50 100 150
Total Chlorophyll
y= 2,1265x + 1873,9R2 = 0,5697
N rate (kg N ha-1)
Tota
l Chl
orop
hyll
(%)
A B
Fig. 5.24. Effect of C rate on a) Nitrate reductase activity (Nred) an b) Total Chlorophyll
5.3.4. Effect of C and N rates on fruit quality
The table grape is a non-climateric fruit with relatively low rate of physiological activity; it is subject of water loss following harvest. Consumers like a fruit with exportation quality characteristics, like berry fi rmness, without defects such as decay, cracked berries, stem browning, shriveling, sunburned, dried berries or insect damage. In this experiment, two harvest were performer; at the end of February 2010 and 2011, respectively. Properties used to confi rm the harvest were sugar content (SS) 13-14,5%, yellowish-green color and no split or crush berries (Bauzá, Quality Control, Harvest. 2010, INN, 1991).
In terms of quality, table grapes harvest index reefers to minimum amount of sugar, expressed as soluble solids (SS). A value of 16,5% Brix is usually accepted as a valid harvest index for Thompson Seedless exporting procedures (USDA 1971, INN, 1991), and the composition of sugars, organic acids and amino acids in grape berries are crucial to defi ne market destination. In this study, brix, pH and tritable acidity in all treatments were above the harvest index and no differences were observed among treatments (Table 5.21) differences (p>0,05) were analysis of variance performed on both evaluated seasons revealed that there were not signifi cant effects (P>0,05) of either C or N rates on total yield or fruit quality parameters (Table 5.21). The results are similar to those obtained by Muñoz-Robledo (2011), for Thompson seedless in Chile, and confi rm the proper maturity, in terms of sugar content, at harvest, and the importance of this parameter as a sugar content indicator and harvesting index. The natural pH of Thompson seedless grape is around 3,6 for fresh fruit (Zheng et al., 2012). However, Pearson correlation for second season (Table 5.22), showed a strong relationship between pH an tritable acidity as was expected, and between pH, brix and tritable acidity and Polyphenoloxidase. At the same time this enzyme presented negative correlation with acid and alkaline phosphatases, and βGlucosidase activity in soil (data no shown, Annex 2).
Polyphenoloxidase is the enzyme associated to enzymatic browning process in fruits, and has been proved to be one of the main factors contributing to colour change of most processed fruits, including grape. The negative correlations with sugar content was also described by Zheng et al. (2012), who characterized the enzyme from Thompson seedless. In grapes, glucose and fructose account for at least 95% of the carbohydrates, and sucrose, the rest (Muñoz-Robledo, 2011) and this sugar concentration, specially, sucrose causes inhibition of PPO as well as low pHs (2,5-5,0).

106
Table 5.21 Fruit quality parameters for second harvest (2011).
Treatment Total Chlorophyll
μg/g
TotalPolyphenols
DO/100 g
Anthocyanins DO/100 g Brix
Total Acidity g L-1 Ac tart
pH Polyphenoloxidase PPO
1 1,4±1,3 57,6±10,7 0,4±0,0 19,8±0.6 3,7±0,1 3,66±0,1 613,4±442.5
2 1,6±1,5 48,7±6,3 0,3±0,0 17,8±3.0 3,6±0,1 3,64±0,1 523±315.7
3 1,8±1,6 50,4±5,3 0,4±0,0 16,8±0.9 3,5±0,2 3,53±0,1 737±696
4 2,1±2,1 48,5±0,5 0,3±0,0 18,0±1.2 3,6±0,1 3,61±0,1 780±704
5 2,4±2,1 48±3,3 0,4±0,0 16,4±3.7 3,7±0,2 3,56±0,1 760±686
6 3,1±0,4 51,9±7,0 0,3±0,1 17,8±2.3 3,6±0,0 3,66±0,1 545±264
7 1,6±1,3 55,3±0,6 0,4±0,0 19,4±0.6 3,7±0,0 3,62±0,1 773±519
8 3,9±0,0 44,5±3,4 0,4±0,1 18,6±2.5 3,7±0,0 3,68±0,0 423±241
9 2,4±1,6 42,6±14,9 0,4±0,0 18,5±2.3 3,6±0,2 3,66±0,0 851±784
10 3,4±3,4 54,5±0,3 0,4±0,0 18,4±0.4 3,6±0,1 3,58±0,1 383±143
11 2,4±1,4 39,8±12,8 0,4±0,0 19,2±0.1 3,6±0,0 3,62±0,1 477±204
12 2,5±1,3 50,9±7,1 0,4±0,1 19,7±0.7 3,6±0,0 3,61±0,0 937±813
13 3,4±0,5 48,2±8,1 0,4±0,0 18,3±0.4 3,7±0,2 3,66±0,1 238±81
14 4,6±0,8 42,2±0,2 0,4±0,1 18,2±2.3 3,6±0,1 3,56±0,1 492±339
15 4,2±1,0 46,4±3,2 0,4±0,1 19,4±0.8 3,7±0,1 3,67±0,0 268±13
16 3,8±1,2 36,37,0 0,3±0,0 20,3±0.1 3,8±0,2 3,79±0,1 407±53
LSD NS NS NS NS NS NS NS
TChl: Chlorophyill content, Poli: Poliphenol content; Anto: Anthocyanins; TA : Total Acidity ;PPO: Poliphenoloxidase activity
Table 5.21a Pearson correlation for fruit properties (2d. season)ExpH TH %EXP Chlo Poly Antho Brix pH TA PPO
ExpH 1
TH ,917 1
%EXP ,457 ,87 1
Chlo ,134 ,166 ,001 1
Poly ,078 ,072 -,016 -,278 1
Antho ,050 ,016 -,045 ,077 ,123 1
Brix ,154 ,213 -,070 ,314 -,108 ,238 1
pH ,046 -,007 ,082 -,291 -,034 -,370 ,061 1
TA -,033 ,004 ,001 ,047 ,133 ,023 ,000 -,502 1
PPO ,007 -,051 ,190 ,265 -,066 ,223 ,338 -,382 ,374 1EH: Exportable harvest., TH: Total harvest, %EXP: % exportable; Chlo: Chlorophyill content, Poly: Polyphenol content; Anto:
Anthocyanins; TA : Total Acidity ; PPO: Polyphenoloxidase activity.

107
Fig. 5.25 Harvest detail. Second season
During the fi rst season exporting yields varied between 3,4 and 11,6 Ton ha-1. Total and exportable yields during the second season (2010/2011) varied from 14,6 to 28,4 Ton ha-1 and 8,9 to 12,5 Ton ha-1, respectively, with an exporting proportion varying from 59 to 77%.These values are within the range of the expected yield for a third-leaf orchard.
In both seasons there was a signifi cant (P<0,1) effect of C rate on exportable yield. This increased linearly with C rate (Fig. 5.26 a and b).It was found that, averaging across all N rates, the application of 1 kg of C ha-1, increase exporting yield by approximately 4 to 8 kg of grape/ha (Fig. 5.27b). This means that with the maximum C rate (400 kg C ha-1), the increase in yield will be 1600 to 3200 kg of fruit ha-1 or 250 to 500 boxes/ha (Figure 5.27c).
y = 0,0076x + 13,14R² = 0,9892
0
2
4
6
8
10
12
14
16
18
0 100 200 300 400 500
Expo
rtab
le y
ield
Ton*
ha-1
C rate (kg C/ha)
E ect of C rate on exportable yield -2d season
Figure 5.26. Effect of C and N rate on exporting yield. a) carbon rate – fi rst season, b) N rate fi rst season, c) C rate second season (mean of 4 N rates).

108
Nitrogen rate affected exportable yield only during the fi rst season. Maximun exportable yield was achieved with the application of 60 kg N/ha, as Novatec Solub 21 (Fig. 5.26b). The null response to N during the second season was probably due that the plants of all treatments had suffi cient reserves to reach good yields.
5.3.5. Compost, soil and fruit quality Minimum Data SetThe concept of integrated indicators for soil quality proposed by Larson and Pierce (1991), applies terms of soil ecology to assess the sustainability of the soil and ecosystem management, combining a variety of information, using multi-objective analysis (Andrews and Carroll, 2001).
The Minimum Data Set is the third steps in the defi nition of a Soil Quality Index (SQI). Four main steps are usually followed: (i) to defi ne the management goal(s); (ii) to select a minimum data set (MDS) of indicators that best represent effi ciently and effectively soil function, as determined by the specifi c management goals; (iii) to score the MDS indicators based on their performance of soil function; and (iv) to integrate the indicator score into an index of soil quality (Karlen et al., 2003, Mandal et al., 2008). Although the steps to obtain a SQI seem clear, there is little information about the practical way of obtaining the weights of each property and integrating them into an index. Ortega and Santibañez (2007) proposed a soil index based on the variance of each soil fertility property, giving more weight to those properties varying more and viceversa. In their work, the weights were estimated by Principal Component Analysis (PCA) or by the coeffi cient of variation (CV) of each property.
Crop yield can be an important indicator of soil quality because it serves as a plant bioassay of the interacting soil characteristics. However, productivity alone may not always be the main criteria by which sustainability of an agricultural system should be judged.
A proper index to measure compost, soil and fruit quality should have certain characteristics:
1. be simple to measure.
2. be sensitive to changes in time and management.
The sensitivity to changes can be measured in several ways: 1) establishing if the property changes over time, as a result of the management imposed, which technically can be proven by regressing the property of interest against time, 2) establishing how frequently the property changes over time under different agro ecosystem managements, and 3) through the variance of each property. In general, those properties showing more variability among treatments are supposed to be more sensitive to changes in management. Since the variance is dependent upon the measurement unit of the property, coeffi cient of variation is used instead.
When several properties are measured on compost, fruit, and soil, the fi rst step is to see if the data set can be reduced to two or three properties that can explain most of the variance in it. In this work, principal component analysis (PCA) was performed on compost, soil and fruit variables. Results demonstrated that the three fi rst components explained 62, 47 and 67% of the total variance for compost, soil and fruit, respectively. This means that, in the three matrices, but particularly in the case of soil, most variables should be included to explain the total variance of the data set. If an index was to be built using PCA, this should be done including all the measured variables, which is impractical.
In this study, the corresponding compost, fruit and soil minimum data sete were estimated according to sensitivity of each property.
In the case of the fi eld experiment, changes of each measured soil property on each treatment, with respect to the agroecosystem base line, were determined. Each of the 16 treatments (including C and N rates), was considered a population, so the idea was to determine the proportion of the 16 populations presenting changes in a given property over time (as compared to the base line). The weight (slope) of each property over time was determined, in order to

109
rank all the properties in terms of its sensitivity. When the slope was not signifi cantly different from zero (P>0,05) meant that there were not changes in time over the base line and the property was not sensitive to changes in time in a given treatment. On the other hand the larger the coeffi cient (slope), the higher the weight of the property and vice versa.
The same procedure was done in the case of compost and the soil of the pot experiment.
The regression of each standardized variable on time in each treatment determined that the soil properties changing most frequently and with larger weights (>0,1) were acid phosphatase (AcP), humic substances (HS), and β-Glucosidase (β-Glu).
In the case of compost, the variable changing most frequently and with weights > 0.1 were AcP, N-NH4, U, Cellul, and Bact. On the other hand, in the case of soil from the pot experiment, the variables changing the most and more frequently, over the baseline, were β-Glu, Psol, N-NH4,EC, C, and pH. Table 5.23 shows the absolute weights of each property, originally greater than 0,1, corrected for its sum to be equal to one. It can be seen that each matrix (soil or compost), and experiment, had its own set of properties as part of a potential compost or soil quality index.
The signs of each property should be assigned by expert criteria. Thus, probably, in the case of soil of the fi eld experiment one would like to give negative sign to the β-Glu if the idea were to reduce OM cycling.
Table 5.23 Absolute weights for biochemical properties selected for estimating matrix quality.
CompostSoil
FruitPots Field
AcP 0,14 0,34 HS 0,34 β Glu 0,11 0,32 Psol 0,26
N-NH4 0,16 0,22 EC 0,19 C 0,14 pH 0,08 U 0,42
Cellul 0,17 Bact 0,11
UPPO 0,56 T Chl 0,44 Total 1 1 1 1
AcP: Acid Phosphatase; HS: humic substances; B (beta) Glu: B(simbolo beta) glucosidase; Psol: phosphate solubilizing bacteria; N-NH4 (4 subindice): ammonium nitrogen; EC: electrical conductivity; C:Organic Carbon; U: ureases; Cellul: cellulolytic
microorganisms; Bact: total bacteria; UPPO: polyphenoloxidase, T Chl: total chorophyll.
In case of a fruit quality Minimum Data Set (MDS), since normally quality variables are measured at maturity, it does not make sense to study its evolution over time to determine the weight of each variable, but trying to estimate their weights based on their variation within the data set. Thus, variables having larger Coeffi cient of Variation (CV) will have more weight and viceversa (Ortega and Santibáñez, 2007). Only those properties that weighted more than the average weight plus 0,5 standard deviation were selected. Thus, only those CV being part of the 30% superior under a normal distribution were considered. Only two properties were selected as sensitive. These were: total chlorophyll (0,3), and phenol oxidase activity (0,38). The weights were adjusted to sum one, so the fi nal weights were: chlorophyll=0,44, and phenol oxidase activity=0,56. Clearly this index will be closer to phenol oxidase activity than to anthocyanin content; thus, an FQI should have these properties with the proposed weights given a proper sign (Table 5.23).

110
The selected variables and their corresponding weights, with the proper signs, would allow obtaining quality indices for compost (CQI), soil (SQI), and fruit (FQI), which should be validated against an independent data set. From these results it is clear that most probably the SQIs would be site-specifi c and would have different properties on them. The present work developed a framework to select properties to be potentially included a quality index. However, the validation of the developed indices was out of the scope of this research.
Hussain et al. (1999) adapted a SQI in order to assess the effect of three management systems (no-till, chisel plow and moldboard plow) on SQ under maize and soybean crops. They concluded that the methodology was sensitive to detect changes on SQ caused by soil management. Glover el al. (2000) used a similar methodology to assess SQ in apple orchards and observed higher SQI in integrated management than in conventional or organic managements. In Brazil, Melo Filho el al. (2007), assessed a SQI under natural forest, observing a low value of SQI mostly because they oriented its SQI to crop production.

111
The use of organic matter is an agronomic practice steadily growing in the world’s horticulture. Under technifi ed irrigation systems, the use of solid organic amendments is diffi cult and new ways of incorporating organic matter must be explored and their effects determined; among them the use of liquid humus is a technology of great potential. In this section, the conclusions of this work are matched with the established hypotheses._________________________________________________________________________
HYPOTHESIS 1: It is possible to defi ne maturity of compost, in terms of content of humic substances, including functional groups of hydrolytic microorganisms, hydrolytic enzymes, C and N characteristics._________________________________________________________________________
Organic Wastes from the pisco industry in Chile, represent a signifi cant amount of organic matter, that can be processed by aerobic processes, like composting. The compost obtained under the proposed mixes in this study, started maturity process from day 60 of composting showing an increase of the concentration of humic substances (humic and fulvic acids). The fi nal product, showed characteristics consistent with the Chilean Offi cial Standard 2880 (2004), European Union (2010) and Compost Quality Council (2008), standards. It was possible to select some variables that could be part of a maturity index for compost, measured in terms of HS content, including: AcP, Amilolytic and total bacteria, and C/N ratio.
Additionally, if it is true that national and international quality standards for compost include microbial groups as indicators, only consider human pathogens and indicators of fecal contamination. Some hydrolytic enzymes producing microorganisms, as well as benefi cial microorganisms such as phosphate solubilizer bacteria, should be consider as compost quality indicator, in relation to the positive effect of compost once applied to soil as organic amendment.
Finally, properties directly related to the major components of organic matter, such as C and N, must be included to evaluate quality of compost. However, the relationship N-NH4/N.-NO3 is a good indicator, especially in the case of mature compost or organic amendments.
The features observed regarding humic and fulvic acids contents as well as the extraction ratio defi ned, (compost: extractant), allowed the use of material obtained in the extraction of humic substances and the production of “liquid humus”.
CHAPTER VI
General Conclusions

112
_________________________________________________________________________HYPOTHESIS 2: Applying liquid humus can be equivalent or better than compost as organic amendment in terms of its effects on soil and fruit properties._________________________________________________________________________
Liquid humus application resulted to be equivalent to compost as organic amendment, in terms of water-soluble carbon and microbial activity. However, only compost had a possitive effect on root density, which was improved by the addition of a microbial inoculant.
Applications of compost and liquid humus resulted in signifi cant changes in soil properties and plant. Water-soluble carbon showed increases in both cases, but the rate of increase was greater with liquid humus applications. Compost positively affect enzymatic activities associated with the hydrolysis of organic matter and the density and root mass. However, orthogonal contrasts analysis showed signifi cant differences in root density with application of a microbial inoculant obtained from the same compost.
Results suggest that applications of compost stimulate native microbial populations, which could not be recovered by plating methods, but that may be included in the plant growth promoting microorganisms (PGPM).
The use of liquid humus as carbon source in soil, showed signifi cant effects on different properties of soil. These effects are demonstrated by the positive correlations between hydrolytic enzymes tested, and some groups of microorganisms selected for evaluation as indicators of soil quality. Some particular correlations were obtained between acid and alkaline phosphatases as well as the β-glucosidase, and groups of cellulolytic and proteolytic microorganisms.
Also there was a signifi cant correlation between yeasts and organic matter content under fi eld conditions.
Microbiological groups selected as indicators, did not show sensitivity to changes in time and management, however enzymes produced by them resulted in good indicators.
In terms of fruit quality, the polyphenoloxidase activity, measured in berries, was a good indicator. This enzymatic activity, showed negative and strong correlation with chlorophyll content in fruit.
Liquid humus in fi eld, resulted in a signifi cant increment of exportable harvest each kg of C increased exportable yield between 4 to 8 kg grape/ha. However as numerous authors have mentioned, increment in N rate did not result in yield increase.

113
_________________________________________________________________________HYPOTHESIS 3: Changes in soil quality indicators, take place at different speeds and directions depending on organic matter application compared with base line soils _________________________________________________________________________
Application of liquid humus improved soil quality indicators (alkaline phosphatase, pH, β glucosidase, humic substances, Olsen phosphorus and water soluble carbon), carbon, whose changes took place at different speeds compared with base line soils.
The riparian vegetation base line soil selected to compare the treatments or populations under fi eld conditions, resulted in higher concentration of OM, organic and soluble N, more acidic and, higher enzymatic activity and microbial bacteria respect to mountain xerophilic forest and agroecosystem soil. Among the measured properties, there were more sensitive quality indicators, which changed at a higher speed and more frequently. These properties are: β glucosidase and Acid Phosphatase activity; phosphate solubilizing bacteria; N-NH4, electrical conductivity, pH, and humic substances content.
Alkaline phosphatase, as well as the enzyme β-glucosidase, are seen as good indicators for soil quality under table grape. The biochemical changes in these properties occurred in 100% of the populations evaluated.
Also changes in the total content of humic substances in soil indicate the incremental effect of humic acids applications in time.
_________________________________________________________________________
HYPOTHESIS 4: It is possible to defi ne a minimum data set to create composed quality indices based on a linear combination of several soil and fruit properties_________________________________________________________________________
Liquid humus application, generated differences in polyphenol oxydase and chlorophyll content, and these two properties could be suggested as a part of minimum data set for fruit quality for table grape.
The regression of each standardized variable on time in each treatment determined that the soil properties changing most frequently and with larger weights (>0,1) were acid phosphatase, humic substances, and β-Glucosidase which can be part of the mimimum data set to create composed.

114
Abad, M., Noguera, P., Burés, S. 2001. National inventory of organic wastes for use as growing media for ornamental potted plant production: case study in Spain Bioresour. Technol. 77: 197-200.
Acevedo, E., and Martinez, E. 2003. Sistema de Labranza y Productividad de los Suelos. In: E. Acevedo, ed. Sustentabilidad en cultivos anuales: Cero Labranza, Manejo de Rastrojos. Facultad de Ciencias Agronomicas, Universidad de Chile. Serie Ciencias Agronomicas N° 8, Santiago, Chile, pp: 13-27.
Acosta, Y y Paolioni, J. 2005. Actividad de la enzima deshidrogenasa en un suelo calciorthids enmendado con residuos orgánicos. Agronomía Tropical (Venezuela). 55(2):217-232.
Acosta-Martinez V. and Tabatabai M. 2001. Tillage and residue management effects on arylamidase activity in soils. Biol. Fertil. Soils. 34:21-24
Adani, F., P. Genevini, P. Zaccheo and G. Zocchi. 1998. The effect of commercial humic acid on tomato plant growth and mineral nutrition. J. Plant Nutr. 21: 561-575.
Aira, M., Monroy, F., Dominguez, J. 2007. Earthworms strongly modify microbial biomass and activity triggering enzymatic activities during vermicomposting independently of the application rates of pig slurry. Science of the Total Environment. 385(1-3): 252-261.
Albaladejo, J., Lobez J., Boix-Fayos C., Barbera G.G. 2008. Long-term effect of a single application of organic refuse on carbon sequestration and soil physical properties. J. Environ. Qual. 37:2093-2029
Aldani, F., Gonfalonieri, R., Tambore, F. 2004. Dynamic respiration index as a descriptor of the biological stability of organic wastes. J. Envrionm. Qual. 33: 1866-1876.Alef, K., Nannipieri, P. 1995. Phosphatase activity. In: K. Alef and P. Nannipieri (Eds.), Methods in applied soil microbiology and biochemistry. Academic Press, London, 335–344p.
Almendros C., 2004. Investigaciones básicas sobre el origen y la estructura molecular de las formas estables de materia orgánica relacionadas con el proceso de secuestro de carbono en los suelos. Edafología, 11(2): 229-248.
Almendros G., 1989. An analysis of some wheat straw humifi cation factors and their bearing on the response to compost of soil and plant, Sci. Total Environ. 81 (82):569–578.
Alvarez, D., Gomez., A., Leon, S y Gutierrez,A. 2010. Manejo integrado de Fertilizantes y abonos orgánicos en el cultivo de maíz. Agrociencia (México). 44(5): 575-586.
Alvarez, D., Saez, M., Blasco, J., Gomez, A y Gonzalez, E. 2006. Actividades enzimaticas de las fosfatasa acida y alcalina y la catalasa en Ruditapes philippnarium como biomarcadores Ciencias marinas.(México). 32 (02B) 447-455.
Allen D., Pringle M.J. Page K. and Dalal R.C. 2010.A review of sampling designs for the measurement of soil organic carbon in Australian grazing lands. The Rangeland Journal 32: 227–246.
Amlinger, F., Götz, B., Dreher, P., Geszti, J., Weissteiner, C. 2003. Nitrogen in biowaste and yard waste compost: dynamics of mobilisation and availability—a review. European Journal of Soil Biology. 39: 107–116. and Environment 80: 29-45.
REFERENCES
115
Andersen AN. 2008. Using ants as indicators of ecosystem change. In: Lach L., Parr, C. & Abbott, K. (eds) Ant Ecology. Oxford University Press, Oxford, UK.
Anderson T. 2003. Microbial eco-physiological indicators to assess soil quality. Agric. Ecosys. Environ., 98:285-293.
Anderson, D. W., Schoenau, J. J. 1993. Soil humus fractions. In: Carter, M. R. (Ed.). Soil sam- pling and methods of analysis. Canadian Society of Soil Science. Lewis Publisher., London, England, pp. 391–397.
Anderson, D.W. 1979. Processes of Humus formation and Transformation in soils of the canadien great plains. Journal of Soil Science. 30(1): 77–84.
Andrews, S.S. and C.R. Carroll, 2001. Designing a decision tool for sustainable agroecosystem management: Soil quality assessment of a poultry litter management case study. Ecol. Applic. 11 (6): 1573-1585.
Andrews, S.S., D.L. Karlen, and J.P. Mitchell. 2001. A comparison of soil quality indexing methods for vegetable production systems in Northern California. Agriculture, Ecosystems and Environment 1760: 1-21.
Andrews, S.S., Mitchell, J.P., Mancineelli, R., Karlen, D.L., Hartz, T.K., Horwath, W.R., Pettygrove, G.S., Scow, K.M., Munk, D.S., 2002. On-farm assessment of soil quality in California’s central valley. Agronomy Journal 94: 12– 23.
Arshad, M.A. and Martin, S., 2002. Identifying Critical Limits for Soil Quality Indicators in Agro-ecosystems. Agriculture, Ecosystems and Environment 88: 153-160.
Asociación de Exportadores de Chile. 2010. Determinación de indicadores de productividad de la industria frutícola chilena, como base para el desarrollo de mejoras competitivas. Santiago-Chile. 103p.
Atkinson, C., Jones, D., Gauthier, J. 1996. Biodegradabilities and microbial activities during composting of municipal solid waste in bench-scale reactors. Compost Science and Utilization. 4: 14– 23.
Australian Government Report.- Biosecurity Australia (2005). Final Report for the Import Risk Analysis for Table Grapes from Chile. Biosecurity Australia, Canberra, Australia. 197p.
Avis, T.J., Gravel, V., Antoun, H., Tweddell, R. 2008. Multifaceted benefi cial effects of rhizosphere microorganisms on plant health and productivity. Soil Biol & Biochem. 40(1): 1733–1740.
Balanyá, T., Sana, J., Gonzalez, M., De la Peña, M. 1994. Utilización de compost de residuos sólidos urbanos en un viñedo del Penedes. Viticultura/Enología Profesional. 31: 20-25.
Bandick A. and Dick R. 1999. Field management effects on soil enzyme activities. Soil. Biol. and Biochem. 31:1471-1479.
Barajas-Aceves, M., M. Hassan, R. Tinoco, and R. Vazquez-Duhalt. 2002. Effect of pollutants on the ergosterol content as indicator of fungal biomass. J. Microbiol. Methods 50:227–236
Barbiroli G, Casalicchio G, Raggi A (2004) A new approach to elaborate a multifunctional soil quality index. Journal of Soils and Sediments 4: 201–204
116
Barral, M., Paradelo, R., Moldes, A., Domínguez, M y Díaz-Fierros, F. 2009. Utilization of MSW compost for organic matter conservation in agricultural soils of NW Spain. Resources, Conservation and Recycling (España). 53 (9): 529-534.
Barzegar, A.R., Yousefi , A., Daryashenas, A. 2002. The effect of addition of addition of different amounts and types of organic materials on soil physical properties and yield of wheat. Plant Soil. 247: 295-301.
Bassoi, L., Hopmans, J., André, L., De Castro, J., De Alencar, C., Moura, E., Silva, J. 2003. Grapevine root distribution in drip and microsprinkler irrigation. Sci. agric. 60(2): 377-387.
Bastida F., Zsolnay A., Hernández H., García C. 2008. Past, present and future of soil quality índices: A biological perspective. Geoderma 147:159-171.
Battilani, P., G. Chiusa, C. Cervi., M. Trevisan, and C. Ghebbioni. 1996. Fungal growth and ergosterol content in tomato fruits infected by fungi. Ital. J. Food Sci. 4:283–290
Beltrán, E., Sort, X., Soliva, M., Trillas, L. 2004. Composting winery waste:sludges and grape stalks. Bioresource Technology. 95: 203-208.
Bell, S-J. & Robson, A. 1999, Effect of nitrogen fertilization on growth canopy density, and yield of Vitis vinifera L. c. Cabernet Sauvignon, Am. J. Enol. Victiv., 50:351-358.
Benintende SM, Benintende MC, Sterren MA, De Battista JJ 2008. Soil microbiological indicators of soil quality in four rice rotations systems. Ecological Indicators 8: 704-708.
Bernal, M., Alburquerque, J., Moral, R. 2009. Composting of animal manures and chemical criteria for compost maturity assessment. A review. Bioresource Technology. 100: 5444-5453.
Bernal, M., Paredes, C., Sanchez-Monedero, M., Cegarra, J. 1998. Maturity and Stability parameters in compost prepared with wide range of organic wastes. Bioresource Technology. 63: 91-99.
Bertoncini E., Dòrazio V., Senesi N. and. Mattiazzo M.E, 2007. Effects of sewage sludge amendment on the properties of two Brazilian oxisols and their humic acids, Bioresour. Technol. 99: 4972–4979
Blair, JM., Bohlen PJ., and Freckman DW. 1996. Soil invertebrates as indicators of soil quality. In Methods for Assessing Soil Quality, SSSA Special Publication 49: 273-291
Blum, WEH and AA Santelises. 1994. A concept of sustainability and resilience based on soil functions. Pp. 535-542. In: DJ Greenland & I Szboles (ed.). Soil Resilience and Sustainable Land use CAB Int., Wallingford, Oxon, UK.
Botha, A. 2011. The importance and ecology of yeasts in soil. Soil Biology y Biochemistry (Sudáfrica). 43(1): 1-8.
Bouma J. 2002. Land quality indicator of sustainable land management acress scales. Agriculture, Ecosystems & Environment. 88:129-136
Bruyn LAL 1999. Ants as bioindicators of soil function in rural environments Agriculture, Ecosystems & Environment 74 (1-3): 425-441
Bruyn LAL and Conacher AJ. 1990. The role of termites and ants in soil modifi cation - a reviewAustralian Journal of Soil Research 28(1):55 - 93

117
Bunn KE., HM Thompson., and Tarrant KA. 1996. Effects of agrochemicals on the immune systems of earthworms. Bull Environ Contam Toxicol. 57. 632-639.
Burke I. and Cole V. 1995 Infl uence of Macroclimate. Landscape Position and Management on soil organic matter in Agroecosystems. Ecological Applications. 5(1):124-131
Burns R.G. 1982. Enzyme activity in soil: location and a possible role in microbial ecology, Soil Biol. and Biochem. 14:423–427.
Burns, R.G. 1978. Enzyme activity in soil. Some theoretical and practical considerations. In: Soil enzymes. Burns, R.G. (Ed.) Academic Press, NY, USA, pp 295-340.
Burns, R.G., Pukite, A.H., McLaren, A.D. 1972. Concerning the location and persistence of soil urease. Soil Science Society of America Proceedings. 36: 308–311.
Busby R., Torberth H. and Gebhart D., 2007. Carbon and nitrogen mineralization of non-composted and composted municipal solid waste in sandy soils, Soil Biol. Biochem. 39 :1277–1283
Bustamante, M. A., Moral, R., Paredes, C., Perez-Espinosa, A., Moreno-Caselles, J., Perez-Murcia, M.D. 2008. Agrochemical characterization of the solid by-products and residues from the vinery and distillery industry. Waste Management. 28: 372-380.
Bustamante, M., Paredes, C., Morales, J., Mayoral, J., Moral, R. 2009. Study of the composting process of winery and distillery wastes using multivariate techniques. Bioresour. Technol. 100: 4766–4772.
Bustamante, M., Pérez, M., Paredes, C., Moral, R., Pérez, A., Bernal, M. 2007. Short-term Carbon and Nitrogen mineralization in soil amended with winery and distillery organic wastes. Bioresource Technology. 98: 3269-3277.
Caballero, T., Camelo, M., Martínez M., Bonilla R. 2007. Determinación de actividad fosfato solubilizadora por bacterias aisladas a partir de suelos algodoneros en los departamentos del Cesar y Meta. Suelos Ecuatoriales. 37(1): 94-100.
Cabria, F; M Calandroni & G Monterubbianesi. 2002. Tamaño y estabilidad de agregados y su relación con la conductividad Hidraulica saturada en suelos bajo labranza convencional y praderas Ciencia del Suelo 20(2):69-80.
Caldwell B., Griffi ths R. and Sollins P. 1999. Soil enzyme response to vegetation disturbance in two lowland CostaRican soils. Soil. Biol. Biochem. 31:1603-1608.
Callejas, R., Canales, P., García de Cortázar, V. 2009. Relationship between root growth of Thompson seedless grapevines and soil temperature. Chilean J. Agric. Res. 69(4): 496-502.
Cantu M., Becker A., Bedano C. and Schiavo H. 2007. Evaluacion de la calidad de suelos mediante el uso de indicadores e indices. Ci. Suelo (Argentina) 25(2): 173-178.
Cantu, M. P.1, Becker, A. R. , Bedano , J. C. , Schiavo , H. F. and Parra B. 2009. Evaluation of the impact of land use and management change by means of soil quality indicators, Córdoba, Argentina. Cadernos Lab. Xeolóxico de Laxe Coruña. 34: 203 - 214.
Cantú, MP; AR Becker; JC Bedano; TB Musso & HF Schiavo. 2002. Evaluación de la calidad ambiental y calidad de suelos mediante el uso de indicadores e índices. XVIII Congreso Argentino de la Ciencia del Suelo. CD. 6 pp
118
Caravaca F., Masciandaro G. and Ceccanti B. 2002. Lands use in relation to soil chemical and biochemical properties in semiarid Mediterranean environment. Soil & Tillage Research 68: 23-30
Casado, J. 2004. Tesis Doctoral: Aproximación cinética, molecular y proteómica al estudio de podredumbre apical en frutos de tomate (Lycopersicon esculentum M.). Implicación de polifenol oxidasa (PPO) y enzimas antioxidantes. Departamento de Agroquímica y Bioquímica, Facultad de Ciencias. Universidad de Alicante. España.
Casanova, M y Benavides, C. 1995. Ureasa activity in soils of central Chile. Agricultura técnica (Chile) 155(2):154-158.
Castaldi, P., Garau, G., Melis, P. 2008. Maturity assessment of compost from municipal solid waste through the study of enzyme activities and wáter-soluble fractions .Waste Management. 28: 534-540.
CCQC. Compost Quality Council of California 2001. Compost Maturity Index 1-26. http://www.epa.gov/osw/conserve/rrr/composting/pubs/ca-index.pdf
Ceccanti, B., Garcia, C., (1994). Coupled chemical and biochemical methodologies to characterize a composting process and the humic substances. In: Senesi, N. and Miano, T.M. (Eds.), Humic Substances In The Global Environment And Implications On Human Health. Elservier, Amsterdam. pp. 1279-1284
Cecco, G., D’Agnola, G. 1984. Plant growth regulator activity of soluble humic complexes. Can. J. Soil Sci. 64:225-228.
CEPA. California Environment Protection Agency. 2002. Integrated Waste Managment Board. Compost Maturity and Nitrogen Release Characteristics in Central Coast Vegetable Production. 1-26 p.
Chaer G. and Tótola M. 2007. Impacto do manejo de residuos organicos durante a reforma de plantios de eucalipto sobre indicadores de qualidade do solo. R. Brás. Ci. Solo. 31:1381-1396
Chaer, G., Myrold, D., Bottomley, P., 2009. A soil quality index based on the equilibrium between soil organic matter and biochemical properties of undisturbed coniferous forest soils of the Pacifi c Northwest. Soil Biology and Biochemistry. 41:822-830.
Chan, K.Y.; Heenan D.P.; Oates, A. 2002. Soil carbon fractions and relationship to soil quality under different tillage and stubble management. Soil & Tillage Research, 63:133-139
Chang, Cheng-Hsiung y Yang, Shang-Shyng. 2009. Thermo-tolerant phosphate-solubilizing microbes for multi-functional biofertilizer preparation. Bioresource Technology (Taiwán).100(4): 1648–1658
Chen Y, Aviad T (1990). Effects of humic substances on plant growth. In: McCarthy P, Calpp CE, Malcolm RL. Bloom, Readings. ASA and SSSA, Madison, WI. pp. 161-186.
Chen Y., Senesi N., and Schitzer M. 1977. Information provided in humic substances by E4/E6 ratios. Soil Sci. Soc. Am. J. 41:352-368
Chen, Y., Inbar, Y., Chefetz, B., Hadar, Y. 1997. Compost and recycling of organic wastes, in: Rosen, D., Tel-Or, E., Hadar, Y., Chen, Y. (Eds.), Modern Agriculture and the Environment. Kluwer Academic Publishers, Dordrecht, The Netherlands. 341–362 p
Chen, Y., M. De Nobili, and T. Aviad. 2004. Stimulatory effects of humic substances on plant growth, p. 131–165. In: Magdoff, F. and R. Weil (eds.). Soil organic matter in sustainable agriculture. CRC Press, Boca Raton, FL.

119
Chilean Wine History. 2011. www.chilean-wine.com/chilean -wine-history. <on line>.
Chin, Y.P., Traina, S.J., Swank, C.R., Backhus, D., 1998. Abundance and properties of dissolved organic-matter in pore waters of a fresh-water wetland. Limnol. Oceanography 43 (6): 1287–1296.
Chizhevsky, M. G., Dikusar, M. M. 1955. The role of humus and microorganisms in the root nutrition of the higher plants in water and sand cultures. Izvestiya timiryazevskoi sel skokhozyaistvennoi akademii. 2: 173-192.
Choi, M., Park, Y. 1998. The infl uence of yeast on thermophilic composting of food waste. Letters in Applied Microbiology. 26: 175–178
Christensen, L.P. 2008. Effective and effi cient management of table grape vineyard mineral nutrition. Proceedings of the San Joaquin Valley Table Grape Seminar, Visalia, California, 27 February, 2008.
Christensen, P., M. Bianchi Effect of nitrogen fertilizer timing and rate on CNA- Chilean Normalization and Accreditation Commission for soil analysis, 2006: Métodos de análisis recomendados para los suelos de Chile. 2006. Instituto de Investigaciones Agropecuarias. Serie Actas INIA N°34. CNA - Chilean Normalization and Accreditation Commission for Vegetal analysis, 2007: Métodos de análisis de tejidos vegetales 2° Edición. Serie Actas INIA N° 40.
Comisión Chilena de Normalización y Acreditación de la Sociedad Chilena de Ciencias del Suelo, CNA-SCCS. 2007. Protocolo de métodos de análisis para suelos y lodos. Zagal E. and Sadzawka A. Ed. Chile, pp. 103.
Comision Nacional de Medio Ambiente- Chile. 2008. Libro de las Especies Amenazadas. On line < www.¬conama.¬cl/¬biodiversidad/¬1313/¬articles-¬49094_LibroEspec¬iesAmenzadas.¬pdf >
Compant, S., Mitter, B., Gualberto, J., Gangl, H. y Sessitsch, A. 2011. Endophytes of Grapevine Flowers, Berries, and Seeds: Identifi cation of Cultivable Bacteria, Comparison with Other Plant Parts, and Visualization of Niches of Colonization. Microbial Ecology. 62:188–197.
COMPO, 2012. Basacote® Plus 3M. Abono complejo NPK 16-8-12+2Mg . http:// compo-expert.com/es/home/productos/fertilizantes-de-liberacion-controlada-car/basacoter/basacoter-plus-3m.html
Conradie, W. J. 2005. Partitioning of mineral nutrients and timing of fertilizer applications for optimum effi ciency. In: Christensen, L.P., Smart, D.R. (Eds.). Proceedings of the Soil Environment and Vine Mineral Nutrition Symposium. San Diego, California, pp. 69-81.
Conradie, W.J. 1980. Seasonal uptake of nutrients by Chenin blanc in sand culture: I. Nitrogen. S. Afr. J. Enol. Vitic. 1(1): 59-65.
Conti, M., Arrigo, N., Maralli, L. 1997. Relationships of soil carbon light fraction, microbial activity, humic acid production and nitrogen fertilization in the decaying process of corn stubble. Biol. Fertil. Soils. 25: 75-78.
Contreras, E., Leal, E., Martínez, M., 2004. Effect of temperature, oxidation time and substrate: oxidant ratio in the yield and composition of humic acids derived from coal, monitored by H-NMR and FT-IR. Technical Publication of the Faculty of Engineering, Universidad del Zulia, 114–122

120
Cook, B.D., Allen, D.L. 1992. Dissolved organic matter in old fi eld soils: Total amounts as a measure of available resources for soil mineralization. Soil Biol. Biochem. 24: 585-594.
Córdoba, Argentina. Cadernos Lab. Xeoloxico de Laxe Coruna. 2009. Vol. 34, pp. 203 – 214
Corrales M., Fernandez A., Vizoso M., Butz P., Charles, M.A., Eberhard F., Tauscher B. 2010. Characterization of phenolic content, in vitro biological activity and pesticide loads of extracts from white grape skins from organic and conventional cultivars. Food and Chemical Toxicology 48(12):3471-76.
Costabal, A. 2010. Determinación de indicadores de productividad de la industria frutícola chilena, como base para el desarrollo de mejoras competitivas. Asociación de Exportadores. Santiago- Chile. 9-31.
David, P. P.; Nelson, P. V.; Sanders, D. C.; 1994: A humic acid improvesgrowth of tomato seedling in solution culture. J. Plant Nutr. 17: 173-184.
Dazell H., Biddlestone A., Gray K.and Thurairajan K. 1987 Soil management: compost production and use in tropical and subtropical environments. FAO Soil Bulletin. Rome. Italia. Nº 56: 312
De la Paz Jiménez M., de la Horra A., Pruzzo L. and Palma M., 2002. Soil quality: a neu index base don microbiological and biochemical parameters. Biol fertil. Soils 35:302-306.
Del Val, J. M. Barea, and C. Azcón-Aguilar. 1999. Diversity of Arbuscular Mycorrhizal Fungus Populations in Heavy-Metal-Contaminated Soils. Appl. Envir. Microbiol. 65: 718-723.
Diaz-Ravina, M., Acea, M.J., Carballas, T. 1989. Microbiological characterization of four composted urban refuses. Biological Wastes. 30: 89–100.
Dick R. 2000 Soil enzyme stability as an ecosystem indicator. Oregon State University-Environmental Protection Agency EPA Proyect. http://cfpub.epa.gov/ncer_abstractsDick R., Myrold D. and Kerle E. 1988. Microbial biomass ans soil enzyme activities in compacted and rehabilitated skid trail soil. Soil Sci. Soc. Am. J. 52:512-516
Dick W.A and McCoy E.L 1993. Enhancing soil fertility by addition of compost. In: H.A.J. Hoitink and H.M. Keener, Editors, Science and Engineering of Composting: Design, Environmental, Microbiological and Utilization Aspects, Renaissance Publications, Worthington, OH pp622–644.
Dick, R., Breakwell, D., Turco, R. 1996. Chapter 15th Soil enzyme activities and biodiversity measurements as integrative microbiological indicators, in: Doran, J., Jones, A. (Eds.), Methods for Assessing Soil Quality. Special Publication 49. SSSA. Soil Science Society of America, USA, pp. 247-271.
Domsch KH, Jagnow G, Anderson TH (1983). An ecological concept for the assessment of side-effects of agrochemicals on soil microorganisms. Res. Rev., 86: 66-105.
Doran J W and Parkin T B, 1994. Defi ning and assessing soil quality. In Proceedings of a Symposium on Defi ning Soil Quality for a Sustainable Environment (Minneapolis, 1992), edited by JW Doran, DC Coleman, DF Bezdicek and BA Stewart, 3-21. Wisconsin: Soil Science Society of America/American Society of Agronomy.
Doran J W, Sarrantonio M and Liebig M A, 1996 Soil Health and Sustainability. Advances in Agronomy, 56: 1-54.

121
Doran J. and Parking T. 1996. Quantitative indicators of soil quality: a minimum data set: In Doran J. W., Jones A.J. (Eds) Methods for Assessing Soil Quality. Soil Sciences Society of America, Special Publication 49, Madison, WI, pp. 25-36.
Doran J. and Zeiss M. 2000. Soil Health and sustainability: managing the biotic component of soil quality. Applied Soil Ecology 15:3-11
During, H. and G. Alleweldt. 1984. The possible role of abscisic acid in sugar accumulation of grape berry. Ber. Dtsch. Bot. Ges. 97:101–113.
Ebersberger D., Niklaus P. and Kandeler E., 2003. Elevated carbon dioxide stimulates N-mineralization and enzymes activities in calcareous grassland. Soil Biol. and Biochem. 35:965-972
El-Tarabilykia, Sivasithamparan K. 2006 Potential of yeast as biocontrol agents of soil-borne fungal plant pathogens ans as plant growth promoters. Mycoscience. 2006;47:25-35
Eman, A., El-Monem. M., Saleh., M y Mostaza, E. 2008. Minimizing the quantity of mineral nitrogen fertilizers on grapevine by using humic acid, organic and biofertilizers. Research Journal of Agriculture and Biological Sciences (Sudáfrica). 4(1):46-50.
Environmental Protection Agency (Epa). 1995. Decision Maker’s Guide to Solid Waste Management, Volume II, (EPA 530-R-95-023): 1-58
Erkossa T. 2011. Tillage effects on physical qualities of a vertisol in the central highlands of EthiopiaAfrican Journal of Environmental Science and Technology 5(12):1008-1016.
Esen A. 1993. βGlucosidases: overview. IN Esen A. (Ed). β-Glucosidases and molecular biology. American Chemical Society, Washington, DC. Pp 9-17.
European Commission, 2001. Working Document. Biological treatment of Biowaste. 2nd draft. Available in: http://europa.eu.int/comm/environment/waste/facts_en.htm.
FAO. 1994.El estado mundial de la agricultura y la alimentación. Colección FAO: Agricultura Nº27. Organización de las naciones unidas para la agricultura y la alimentación. http://www.fao.org/docrep/003/t4450s/t4450s00.htm
Fernandez, F., Sanchez-Arias,V., Villaseñor, J y Rodríguez, L.2008. Evaluation of carbon degradation during co-composting of exhausted grape marc with different biowastes. Chemosphere (España). (5):670-677
Fernandez-Escobar R.; Benlloch M.; Barranco D.; Duenas A.; Ganan J.A.G..1996. Response of olive trees to foliar application of humic substances extracted from leonardite. Sci. Hortic. 66:191-200.
Ferrara G., Pacifi co A., Simeone P., Ferrara E. 2007. Preliminary study on the effects of foliar applications of humic acids on ‘Italia’ table grape. Proceedings 30th World Congress of Vine and Wine.
Ferrer, J., Páez, G., Mármol, Z., Ramones, E., Chandler, C., Marin, M., Ferrer, A. 2001. Agronomic use of biotecnologicaly processed grape wastes. Bioresource technology. 76: 39-44.
Ferrera. R y Alarcón. A. 2001. La microbiología del suelo en la agricultura sostenible. Red de revistas científi cas de América latina y El caribe Ciencias sociales y humanidades (México). 8(2):175-183.

122
Flavel, T.C., Murphy, D.V., Lalor, B., Fillery, I.R. 2005. Gross N mineralization rates after application of composted grape marc to soil. Soil Biol. and Biochem. 37: 1397-1400.
Frankenberger, W.T. Jr. y W. Dick. 1983. Relationships between enzyme activities and microbial growth and activity indices in soil. Soil Sci. Soc. Am. J. 47: 945-951.
Franzluebbers A.J; Hons F.M. y Zuberer D.A. 1998. In situ and potential CO2 evolution from a Fluventic Ustochrept in southcentral Texas as affected by tillage and cropping intensity. Soil Tillage Res., 47: 303-308.
Gao X., Yin B., Borneman J., and Becker JO. 2008. Assessment of parasitic activity of Fusarium strains obtained from a Heterodera schachtii-suppressive soil. Journal of Nematology 40:1-6.
García C., Hernández T. and Costa F. 1994. Microbial activity in soil under Mediterranean environmental conditions. Soil Biol. Biochem. 26:1185:1191.
García, C., Gil, F., Fernández, T., Trasar, C. 2003. Técnicas de análisis de parámetros bioquímicos en suelos: Medida de actividades enzimáticas y biomasa microbiana. Ediciones Mundiprensa. Spain, pp. 123-148.
Garcia, C., T. Hernandez and F. Costa, 1997. Potential use of dehydrogenase activity as an index of microbial activity in degraded soils. Commun. Soil Sci. Plant., 28: 123-134
García-Gil J C, Plaza C, Soler-Rovira P, Polo A 2000. Long-term effects of municipal solid waste compost application on soil enzyme activities and microbial biomass. Soil Biology and Biochemistry 32: 1907-1913.
García-Ruiz, R., Ochoa, V., Viñegla, V., Hinojosa., M., Peña, R., Liebanas, G., Linares, J y Carreira. J. 2009. Soil enzymes, nematode community and selected physico-chemical properties as soil quality indicators in organic and conventional olive oil farming: Infl uence of seasonality and site features. Applied Soil Ecology (España). 41 (3): 305–314.
Gelsomino A. Badalucco L., Ambrosoli R., Crecchio C., Puglisi E. and Meli S. 2006. Changes in chemical and biological soil properties as induced by anthropogenic disturbance: a case study of agricultural soil under recurrent fl ooding by wastewaters. Soil Biol. Biochem. 38: 2069-2080.
Gil, M., Calvo, L., Blanco, D., Sánchez, M. 2008. Assessing the agronomic and environmental effects of the application of cattle manure compost on soil by multivariate methods. Bioresource Technology. 99: 5763-5772.
Glover JD; Reganold JP; Andrews PK (2000) Systematic method for rating the quality of conventional, organic and integrated apple orchards in Washington State. Agriculture, Ecosystems and Environment 80: 29-45.
Godoy R. 2004. Determinacion de La actividad de la enzima nitrato reductasa bajo condiciones de frio en líneas genéticas de tomate Lycopersicon esculentum Mill. con introresiones de L. hirsutum Humb. y Bonpl. Facultad de Agronomia, Universidad Catolica de Valparaiso. Chile.
Golueke, C. 1981. Principles of biological resource recovery. Biocycle. 22: 36-40.
Gomez-Brandon, M., Lazcano, C., Dominguez, J. 2008. The evaluation of stability and maturity during the composting process of cattle manure. Chemosphere. 70(3): 436-444.
Goulding, K., Murphy D., MacDonald A.; Stockdale E. Gaunt J., Blake L.; Ayaga G. Brookes P. 2004. The role of soil organicmatter and manures in sustainable nutrient cycling. In: Rees R.,

123
Ball B., Campell C., Watson C. (Ed.) Sustainable management of soil organic matter. London: CAB. 4:221-232
Goyal, S., Dhull, S., Kapoor, K. 2005. Chemical and biological changes during composting of different organic wastes and assessment of compost maturity. Bioresource Technology. 40: 121-127.
Granatsein D., and Benzdicek D.F. 1992. The need for a soil quality index: local and regional perspectives. American Journal of Alternative Agriculture 7(12):12-16.
Gray, K.R., Sherman, K., Biddlestone, A.J. 1971. A review of composting. Part I. Process Biochemistry. 6: 32–36.
Gu B., Schitzer J., Chen L., Lianf L.,and McCarthy J. 1995. Absortion and desorption of different organic matter fractions on iron oxide. Geochim. Cosmochim. Acta 59:219-229
Guggenberger G., 2005 in Varma A. and Buscot F. Microorganisms in Soil: Roles in genesis and Functions Soil Biology 3:88-106.
Gutiérrez-Gañan, J. A. 1996. Response olive trees to foliar application of humic substances extracted from leonardite. Scientia Horticulturae 66: 191-199.
Gutiérrez V.,Pinzón A., Casas J. and Martínez M. 2008. Determination of cellulolitic activity of soil from Stevia rebaudiana Bertoni crops. Agronomia Colombiana 26(3):497-504.
Hartmann M. and Widmer F. 2006.Community Structure Analyses Are More Sensitive to Differences in Soil Bacterial Communities than Anonymous Diversity Indices Appl. Envir. Microbiol. 72: 7804-7812.
Haug R., 1993. The Practical Handbook of Compost Engineering. Lewis Publishers, Boca Raton, Florida.
Haynes R.J. (2005): Labile organic matter fractions as central components of the quality of agricultural soils. Advances in Agronomy, 85: 221–268.
Haynes, RJ and Beare, M (1996). Aggregation and organic matter storage in meso-thermal, humic soils. pp 213-262. In: MR Carter and BA Stewart (Eds). Structure and Organic Matter Storage in Agricultural Soils. CRC Lewis, Boca Raton.
Heargreaves, J., Adl, M. and Warman, P. 2008. A review of the use of composted municipal solid waste in agriculture. Agriculture, Ecosystems and Environment. 123: 1-14.
Heredia, W., Peirano, P., Borie, G., Zunino, H., and Aguilera, M.a. 2007. Organic carbon balance in Chilean volcanic soils after human intrusion and under different management practices. Acta Agric. Scandi. Section B - Plant Soil Sci. 57: 329-334
Hernandez D., Fernandez J.M., Plaza C., and Polo A. 2007. Water-soluble organic matter and biological activity of a degraded soil amended with pig slurry. Sci. Total. Environ. 378:101-103
Herrmann, R., Shann, J. 1997. Microbial community changes during the composting of municipal solid waste. Microbial Ecology. 33: 78–85.
Hirzel, J. y Salazar, F. 2011. Técnicas de conservación de suelos, agua y vegetación en territorios degradados. Capitulo 5: Uso de enmiendas orgánicas como fuente de fertilización en cultivos. Curso de acreditación para operadores SIRSD 2011. Chillan –Chile. 1-30.

124
Hogg D., Barth J., Favoino E., Centemero M., Caimi V., Amlinger F., Devliegher W., Brinton W. and Antler S. 2002. Comparison of compost standards within the EU, North America and Australasia. The Waste and Resources Action Programme –WRAP-.Oxon,UK.98p.
Hue, N., Lui, J. 1995. Predicting compost stability. Compost Science Utilization. 3: 8-15.Hussain, I., Olson, K.R., Wander, M.M., Karlen, D.L., 1999. Adaptation of soil quality indices and application to three tillage systems in southern Illinois. Soil and Tillage Research 50, 237– 249.
Instituto Nacional de Normalización INN. 2004. Norma Técnica Chilena Ofi cial, NTCh. 2880. 2004. Compost: Clasifi cación y requisitos. Gobierno de Chile.
Instituto Nacional de Normalización. INN. 1991. Norma Chilena Ofi cial (NCh 1925). Uva de Mesa. Requisitos para exportación. Instituto Nacional de Normalización. Santiago de Chile
Ishii, K., Fukui, M., S, Takii. 2000. Microbial succession during a composting process as evaluated by denaturing gradient gel electrophoresis analysis. J. Applied Microbiol. 89: 768-777.
Islam, M., Morgan, J., Doyle, M., Phatak, S., Millner, P., Jiang, X. 2004. Fate of Salmonella enterica Serovar Typhimurium on carrots and Radishes grow in fi elds treated with contaminated Manure compost or Irrigation water. Applied Environmental Microbiology. 70(4): 2407-2502.
Issa, G., Patti, A., Smernik, R., Wilkinson, K. 2009. Chemical composition of composted grape marc. Water Science & Technology. 60(5), 1265-1271.
Janssens, M.J.J., Deng, Z., Sonwa, D., Torrico, J.C., Mulindabigwi, V. and Pohlan, J. 2006. Relating agro-climax of orchards to eco-climax of natural vegetation. Acta hort. (Ishs) 707:181-186http://www.Actahort.Org/books/707/707_22.Htm
Janvier, C., Villeneuve, F., alabouvette, C., Edel – Hermann, V., Mateille, T., Steinberg, C. Soil health through soil disease suppression: which strategy from descriptors to indicators?. Soil Biology and Biochemistry. 39: 1 – 23
Jastrzêbska, E. y Kucharski, J. 2007. Dehydrogenases, urease and phosphatases activities of soil contaminated with fungicides. Plant Soil Environment. 53 (2): 51–57.
Jayasinghe, D y Parkinson, D. 2008. Actinomycetes as antagonists of litter decomposer fungi. applied soil ecology (Canada).38 (2):109 – 118.
Jiang, Y. Joyce, D. 2003. ABA effects on ethylene production, PAL activity, anthocyanin and phenolic contents of strawberry fruit. Plant Growth Regulation. 39: 171-174
Jimenez, E., Garcia, V. 1992. Determination of maturity indices for city refuse compost. Agric. Ecosyst. Environ. 38: 331-343.
Kaiser C., Koranda M., Kitzler B., Fuchslueger L., Schnecker J., Schweiger P., Rasche F., Zechmeister-Boltenstern S., Sessitsch A., and Richter A. 2010. Belowground carbon allocation by trees drives seasonal patterns of extracellular enzyme activities by altering microbial community composition in a beech forest soil. New Phytol. 187(3): 843–858.
Kandeler E., Mosier A., Morgan J., Milchunas D., King J., Rudolph S. and Tscherko D. 2006. Response of soil microbial biomass and enzyme activities to the trscient elevation of carbon dioxide in a semi-arid grassland. Soil. Biol. & Biochem. 38:2448-2460
Kandeler, E., Stemmer, M., Klimanek, E. M. 1999. Response of soil microbial biomass, urease

125
and xylanase within particle size fractions to long-term soil management. Soil Biology and Biochemistry. 31(2): 261-273.
Karlen D.L, Andrews S. , Wienhold B. and Zobeck T. 2008. Soil Quality Assessment: Past, Present and Future.J. Integr. Biosci. 6(1):3-14.
Karlen DL, Mausbach MJ, Doran JW, Cline RG, Harris RF, Schuman GE. 1997. Soil quality: A concept, defi nition, and framework for evaluation. Soil Science Society of America Journal 61: 4-10.
Karlen, D.L., S.S. Andrews, B.J. Wienhold, and J.W. Doran. 2003. Soil quality: Humankind’s foundation for survival. J. Soil Water Conserv. 58:171-179.
Kim YH, Bae B, Choung YK. 2005. Optimization of biological phosphorus removal from contaminated sediments with phosphate-solubilizing microorganisms. J Biosci Bioeng. 99(1):23-9
Klamer, M., Baath, E., 1998. Microbial community dynamics during composting of straw material studied using phospholipid fatty acid analysis. FEMS Microbiology Ecology. 27: 9–20.
Kloepper, J.W., Hume, D.J., Scher, F.M., Singleton, C., Tipping, B., Laliberte, M., Frauley, K., Kutchaw, T., Simonson, C. and Lifshitz, R. 1987. Plant growth-promoting rhizobacteria on canola (rapeseed). Plant disease 72: 42-46.
Klose, S. Tabatabai, M.A., (2002): Response of phosphomonoesterases in soils to chloroform fumigation. J. Plant Nutr. Soil Sci. 165: 429-434.
Knight T., and Dick R. 2004. Differentianting microbial and stabilized β-glucosidase activity relative to soil quality. Soil Biol. and Bioch. 36:2089-2096
Ko, Ham., Kim, Ki., Kim, H., Kim, Chi., Umeda, M. 2008. Evaluation of maturity parameters and heavy metals contents in composts made from animal manure. Waste Management. 28: 813-820.
Kurtzman and Fell, 1998Kurtzman, C. P. & Fell, J. W. (1998). The Yeasts, a Taxonomic Study. Amsterdam: Elsevier.
Larson, W.E. and F.J. Pierce. 1991. Conservation and enhancement of soil quality. p 175-203. In: Evaluation for Sustainable Land Management in the Developing World, Vol. 2: Technical papers. Bangkok, Thailand: International Board for Research and Management. IBSRAM Proceedings No. 12(2).
Leon, J., Gomez, R., Hernandez, S., Alvarez, J y Palma, D. 2006. Mineralización en suelos con incorporación de residuos orgánicos en los altos de Chiapas, México. Universidad y Ciencia (México).22 (2):163-174
Li Xiu and Chen Z. 2004. Soil microbial biomass C and N along a climatic transect in the Mongolia steppe. Biol. Fertil. Soils 39:344-351
Lilburne, L.; Sparling, G.P. and Schipper, L.A (2004) Soil quality monitoring in New Zealand: development of an interpretative framework. Agriculture Ecosystem & Environment 104, 535–544.
Liu Xiu., Li Qi, Liang Wen-Ju and Jiang Young. 2008. Distribution of soil enzyme activities and microbial biomass along latitudinal gradient in farmlands of Songliao Plain, Northeast China. Pedosphere 18(4): 431-440

126
Lo Curto, R.B., Tripodo, M.M., 2001. Yeast production from virgin grape marc. Bioresource Technology 78: 5–9.
Longo, L. Vasapollo, G. 2005. Determination of Anthocyanins in Ruscus aculeatus L. Berries. Journal of Agricultural and Food Chemistry. 53: 475-479
López-Hernandez, D. 1998. P-isotopic exchange values in relation to Po mineralization in soils with very low P-sorbing capacities. Soil Biol. Biochem. 30: 1663–1670.
Louli, V., Ragoussis, N., Magoulas, K., 2004. Recovery of phenolic antioxidants from wine industry by-products. Bioresource Technology 92: 201–208.
Madrid R., Valverde M., Guillen I., Sánchez A.and Lax A., 2004. Evolution of organic matter added to soils under cultivation conditions, J. Plant Nutr. Soil Sci. 167:39–44.
Magdoff, F., Weil, R. 2004. Soil organic matter in sustainable agriculture. CRC Press. USA, pp. 67-120, 295-327.
Mairura F., Mugendi D., Mwanje J., Ramisch J., Mbuga P., Chianu J. 2007 Integrating scientifi c and farmer´evaluation of soil quality indicators in Central Kenia. Geoderma 139:134-143.
Makoi, J., Ndakidemi, P. 2008. Selected soil enzymes: Examples of their potential roles in the ecosystem. African Journal of Biotechnology. 7(3): 181-191.
Manalay, R., Feller, C., Swift, M. 2007. Historical evolution of soil organic matter concepts and their relationships with the fertility and sustainability of cropping systems. Agriculture Ecosystems and Environment. 119: 217 – 233.
Mandal UK, Warrington DN, Bhardwaj AK, Bar-Tal A, Kautsky L, Minz D, Levy GJ (2008). Evaluating impact of irrigation water quality on a calcareous clay soil using principal component analysis. Geoderma, 144: 189-197.
Marhuenda-Egea, F.C., Martínez-Sabater, E., Jordá, J., Moral, R., Bustamante, M.A., Paredes, C., Pérez-Murcia, M.D., 2007. Dissolved organic matter fractions formed during composting of winery and distillery residues: evaluation of the process by fl uorescence excitation–emission matrix. Chemosphere 68: 301– 309.
Marinari S., Liburdi K., Masciandaro G., Ceccanti B. and Grego S. 2007. Humifi cation-mineralization pyrolytic índices and carbon fractions of soil under organic and conventional management in central Italy. Soil & Tillage Research. 92:10-17.
Marriot E., and Wander M. 2006. Total and labile soil organic matter in organic and conventional farming systems. Soil Science Society of American Journal. 70:950-959
Martínez M., Pedroza, A., Gutiérrez V. 2010. Manual de Técnicas en Microbiología Ambiental. Editorial USM, Santiago, Chile, pp. 31-41, 73-91.
Martínez, M., Ortega, R., Angulo, J., Janssens, M. 2011. Evolution of biochemical indicators in grape marc composting process and their relationship with humifi cation process during maturity. Chilean Journal of Agricultural Research. Submitted.
Masciandaro G. and Ceccanti B. 1999. Assessing soil quality in different agro-ecosystems through biochemical and chemico-structural properties of humic substances. Soil & Tillage Reseach 51:129-137
127
Masciandaro M., Ceccanti B. and Gallardo-Lancho J. 1998. Organic matter properties in cultivated versus set-aside arable soils. Agric. Ecosyst. Environm. 67:267-274.
Masto R., Chhonkar P., Singh D., Patra A. Alternative soil quality indices for evaluating the effect of intensive cropping fertilization and manuring for 31 years in the semi-arid soil of India. Environmental Monitoring and Assessment. 156(1-3):419-435
Mathur, SP., Owen, G., Schnitzer, H. 1993. Determination of compost biomatury. I Literature review. Biol. Agric. Hortic. 10: 87-108.
McArtney, S.J., Ferree, D.C. 1999. Shading effects on dry matter partitioning, remobilization of stored reserves and early season vegetative development of grapevines in the year after treatment. J. Amer. Soc. Hort. Sci. 124: 591-597.
McCarthy, A y Williams, S. 1992. Actinomycetes as agents of biodegradation in the environment — a review. Applied soil ecology .Gene (Inglaterra). 115(1-2):189-192.
McMichael, L., and J.J. Burke. 1998. Soil temperature and root growth. HortScience 33:947-950.
Melo Filho, JF ; Carvalho, L.; Silveira, D.; Sacramento, J; Silveira, E. 2009. Índice de qualidade em um latossolo amarelo coeso cultivado com citros. Revista Brasileira de Fruticultura (Impresso), 31:1168-1177.
Mikanovà,O y Novakovà, J. 2002. Evaluation of the P solubilizing activity of soil microorganisms and it sensitivity to soluble phosphate. Rostlinnà Vyroba (Republica Checa). 48(9): 397-400
Ministerio de Agricultura de Chile. 2009 Chilean Agriculture Overview. Agrarian Policies and Studies Bureau. Gobierno de Chile. Edición 2009.
Molina, M., Ortega, R. 2006. Evaluation of the nitrifi cation inhibitor 3,4-dimethylpyrazole phosphate (DMPP) in two Chilean soils. Journal of Plant Nutrition 29: 521-534.
Mon, R. Irurtia C., Botta G.F., Pozzolo O., Bellora F., Rivero D., Bomben M. 2007. Effects of supplementary irrigation on chemical and physical soil properties in the rolling pampa region of Argentina. Cienc. Inv. Agr. 34 (3):187-194
Mondini, C., Fornasier F., Sinicco, T. 2004. Enzymatic activity as a parameter for the characterization of the compost process. Soil Biol .and Biochem. 36: 1587-1594.
Morlat, R., Chausson, R. 2008. Long-term additons of organic amendments in a Loire Vally vineyard I Effects of properties of a calcareous sandy soil. Am. J. Enol. Vitic. 59: 353-363.
Morlat, R., Jacquet, A. 1993. The soil effects on the grapevine root system in several vineyards of the Loire valley (France). Vitis 32: 35-42.
Morthup, R.R., Dahlgren, R.A., McColl, J.G., 1998. Polyphenols as regulators of plant-litter-soil interactions in northern California’s pygmy forest: a positive feedback? Biogeochemistry 42: 189–220.
Mrkonjic, M., Ángel, M., Gattinger, A., Bausenwein, U., Sommer, M., Munich, J y Schloter, M. 2008. Factors infl uencing variability of proteolytic genes and activities in arable soils. Soil Biology & Biochemistry (Alemania). 40(7):1646–1653.

128
Mulvaney, R.L. 1996. Nitrogen: Inorganic Forms. 1123–1184 p. In: Sparks, D.L.; Page, A.L.; Helmke, P.A., Loeppert, R.H.; Soltanpour, P.N.; Tabatabai, M.A., Johanson, G.T. and Sumner, M.E. (Eds.), Methods of Soil Analysis, Part 3, Chemical Methods. American Society of Agronomy, Madison, WI, USA.
Muñoz-Robledo P., Robledo P., Manríquez D., Molina R., Delfi lipi B. 2011. Characterization of sugars and organic acids in comercial varieties of table grape. Chilean Journal of Agricultural Research. 71(3): 452-458
Muscolo, A., Felici, M., Concheri, G., Nardi, S., 1993. Effect of earthworm humic substances on esterase and peroxidase activity during growth of leaf explants of Nicotiana plumbaginifolia. Biology and Fertility of Soils 15: 127–131.
Nakatsu C., Carmosini N., Baldwin B., Beasley F., Kourtev P., and Konopka A. 2005. Soil Microbial Community Responses to Additions of Organic Carbon Substrates and Heavy Metals (Pb and Cr) Appl. Envir. Microbiol. 71: 7679-7689.
Nannipieri, E., Kandeler., Ruggiero, P. 2002. Enzyme activities and microbiological and biochemical processes in soil. 1–33 p. In: Burns, R.G., Dick, R. (Eds.), Enzymes in the environment, Marcel Dekker, New York.
Nannipieri, P., Ceccanti, B., Cervelli, S y Matarese, E.1980. Extraction of phosphatase, urease, protease, organic carbon and nitrogen from soil. Soil science society 44. 1011-1016.
Nichols J. 1984. Relations of organic carbon to soil properties and climate in the southern Great Plains. Soil Science Society of American Journal. 48:1382-1384
Nielsen, M.N. Winding, A. 2002. Microorganisms as Indicators of Soil Health. National Environmental Research Institute, Denmark. Technical report No. 388. 13 – 15, 22, 47 – 48.
NRC Grapes, National Research Centre for Grapes 2011.Indian Council of Agricultural Research Pune: Crop Profi le. Adsule P. Et al., Ed. India.44p.
Ortega, R. y Mardónez, R. 2005. Variabilidad espacial de la mineralización de nitrógeno en un suelo volcánico de la provincia de Ñuble, VIII región, Chile. Agricultura Técnica (Chile), 65(2): 221-231.
Ortega, R., Fernández, M. 2007. Agronomic evaluation of liquid humus derived from earthworm humic substances. Journal of Plant Nutrition 30: 2091–2104.
Ortega, R., Santibáñez, O. 2007. Agronomic evaluation of three zoning methods based on soil fertility in corn crops (Zea mays L.). Computers and Electronics in Agriculture. 58 (1): 49-59.
Palma. J. 2006. Estrategia de fertilización en vid de mesa diseños y monitoreos.. Guía de manejo nutrición vegetal de especialidad: Uva. soquimich nitratos S.A .135 p.Parada, M. 2005.I Taller Iberoamericano sobre Normativa y Control de Calidad de Inoculantes para la Agricultura. Centro de Pesquisas Gonçalo Moniz FIOCRUZ.Salvador-Bahia-Brasil. 29p
Paradelo. R., Moldes. A y Barral. M. 2009. Properties of slate mining wastes incubated with grape marc compost Ander laboratory conditions. Waste Management (España). 29(2): 579–584.
Parkinson D. and Coleman D. 1991. Microbial communities, activity and biomass. Agriculture, Ecosystems and Environment, 34: 3-33
129
Parra, R. Thompson, W. Kriedemann, P. 1989. Determination of accurate extinction coeffi cients and simultaneous equations for assaying chlorophylls a and b extracted with four different solvents: Verifi cation of the concentration of chlorophyll standards by atomic absorption spectroscopy. Biochim. Biophys. 975: 348-349.
Paustian K, Parton W.J.,and Persson J. 1992. Modeling soil organic matter in organic amended and nitrogen-fertilizer-long term-pots. Soil Science Society America Journal. 56:416-488
Peacock, W.L., Christensen, L.P., Broadbent, F.E. 1989. Uptake, storage and utilization of soil applied nitrogen by Thompson Seedless as affected by time of application. Am. J. Enol. Vitic. 40(1): 16-19.
Pedroza, A., Martínez-Salgado, M., Algeciras, N., Barrera, R., Reyes, C., Rodríguez, E., Rodríguez, N., Rojas, S. 2003. Desarrollo de un sistema de biofi ltración con bacterias proteolíticas y amilolíticas inmovilizadas utilizando subproductos del benefi cio de café. Revista de La Sociedad Química de México, 46: 271-276.
Peña, H., y Reyes, I. 2007. Aislamiento y evaluación de las bacterias fi jadora de nitrógeno y disolventes de fosfato en la promoción del crecimiento de la lechuga. Interciencia (Venezuela).32(8):560-565.
Pereira M.G., Souza Valladares G., Cunha dos Anjos L.H., de Melo Benites V., Espíndula Jr. A., Gilvani A. 2006. Organic carbon determination in histosols and soil horizons with high organic matter content from Brazil. Sci. agric. (Piracicaba, Braz.) 2006, 63 (2):187-193
Perucci, E. 1990. Effect of the addition of municipal solid-waste compost on microbial biomass and enzyme activities in soil. Biol Fertil Soils. 10: 221-226.
Pidwirny, G., Irving, K. 2009. Biology and Physical Geography. Barber School of Arts and Sciences. University of British Columbia Okanagan: hhttp://www.physicalgeography.net/fundamentals/7v.html
Pinto Silveira E. 2009. Índice de qualidade em um latossolo amarelo coeso cultivado com citros. Rev. Bras. Frutic. [Online]. 31(4): 1168-1177
Probst, B., Schüler, C. 2008. Vineyard soils under organic and conventional management-microbial biomass and activity indices and their relation to soil chemical properties. Biol Fertil Solils. 44: 443-450.
Puglisi, E., Nicelli, M., Capri, E., Trevisan, M. & Del Re, A. M., 2003. Cholesterol, β-sitosterol, ergosterol and coprostanol in agricultural soils”. Journal of Environmental Quality 32:466-471.
Rallani, G., Bottura, G., Taddei, P., Garavani, M., Marchetti, R., Sorlini, C. 2001. Composting of solid and sludge residues from agricultural and food industries: Bioindicators of monitoring and compost maturity. Journal of Environmental Science and Health. 36: 415-436.
Rao M., Voilante A. and Gianfreda L. 2000. Interaction of acid phosphatase with clays, organic molecules and organo-mineral complexes; kinetics and stability. Soil Biol. Biochem. 32: 1007-1014.
Reginald Ebhin Masto, Pramod K. Chhonkar, Dhyan Singh and Ashok K. Patra. 2008. Alternative soil quality indices for evaluating the effect of intensive cropping, fertilisation and manuring for 31 years in the semi-arid soils of India. Environmental Monitoring and Assessment. 136(1-3): 419-435

130
Reyes I., Álvarez L., El-Ayoubi H., Valery A., Selección y Evaluacion de rizobacterias promotoras de crecimiento en pimenon y maíz. Bioagro 20(1):37-48
Rezaei S., Gilkes R. and Andrews S. 2006. A minimun data set for assessing soil quality in ragenlands. Geoderma 136:229-234.
Richards, D. 1983.The grape root system. Horticultural Reviews. 5: 127-168.
Rivera M. A. La Flora de los alrededores de Ovalle. 1918. Revista Chilena de Historia Natural Tomo 22(2y3):61-65
Rivera, L., Aballay, E. 2008. Nematicide Effect of Various Soil Organic Amendments on Meloidogyne ethiopica Whitehead, 1968, on potted vine plants. Chilean Journal of Agricultural Research. 68(3): 290-296.
Rodríguez, D., Ruiz, A., Martínez-Salgado, M., Ruiz, A., Matiz, A. 2007. Uso de un inoculante termofílico en la transformación de residuos sólidos urbanos (RSU). Universitas Scientiarum. 12: 57-67.
Rodríguez, H y Fraga, R. 1999. Phosphate solubilizing bacteria and their role in plant growth promotion. Biotechnology advances (Cuba). 17(4-5): 319-339
Rosen, C.V., Halbach, T.R., Swanson, B. T., 1973. Horticultural uses of municipal solid waste components. Hort. Tchnology. 3: 167-173.
Rozas, H y Echeverria, H. 1998. Relación entre las lecturas del medidor de clorofi la (Minolta SPAD 502) en distintos estadios del ciclo del cultivo de maíz y el rendimiento en grano. Revista de la Facultad de Agronomía, La Plata 103 (1):37-44
Ruiz, S. 2000. Dinámica nutricional en cinco parrones de diferente productividad del Valle Central regado de Chile. Agric. Téc. (Chile) 60:379-398.
Ryden J.C., Ball P.R. & Garwood E.A. 1984. Nitrate leaching from grassland Nature 311: 50 - 53
Sadzawka, A., Carrasco, M., Grez., R y Mora, M. 2005. Métodos de análisis de compost. Serie actas INIA Nº30. Instituto de Investigaciones agropecuarias. Santiago-Chile. 153pp.
Sadzawka, A., Carrasco, M., Demanet, R., Florez H., Grez R., Mora, M. z Neaman A. 2007. Métodos de análisis de tejidos vegetales. Serie actas INIA No. 40. Instituto de Investigaciones Agropecuarias. Santiago-Chile. 120pp.
Sanchez, C. 2009. Lignocellulosic residues: biodegradation and bioconversion by fungi. Biotechnol. Adv. 27(2): 185–194.
Šarapatka, B. 2003. Phosphatase activities (ACP, ALP) in agroecosystem soils. “Tesis. Doctoral”. Swedish University of Agricultural Science. (Olomoucm Republica Checa). 62p.
SAS, 2008. Guide for Users. Institute Inc., Cary, N.C, 27513-2414 USA.
Scherwinski, K.; Grosch, R. and Berg, G. 2007. Root application of bacterial antagonists to fi eld-grown lettuce: effects on non-target micro-organisms and disease suppression. IOBC/WPRS Bulletin, i30 (6): 257-259.
Schinitzer, M. 1982. Organic matter characterization, in: Page, A., Miller, R., Keeney, D. (Eds.), Methods of soils analysis, Part 2, Chemical and microbiological. 2nd Ed. Agronomy monographs Nº 9. American Society.

131
Schnitzer, M. 2001. The in situ analysis of organic matter in soils. Canadian Journal of Soil Science. 81: 249–254.
Schroth M and Hancock J.1982. Disease-Suppressive Soil and Root-Colonizing Bacteria. Science 216 (4553): 1376-1381.
Segnestam L. 2002. Indicators of the environmental and sustainable development. Theories and Practical Experience, Environmental economic Series, Paper No. 89, 61 pp. World Bank
Self, J y Rodríguez, J. 1998. Laboratory manual for SC-564- soil and plant chemical análisis. Soil and plant testing laboratory, department of soil and cro sciences, colorado state university: Colorado, USA.142 pp
Selles.G., Ferreira.R., Contreras.G., Ahumada.R., Valenzuela.J y Bravo.R. 2003. Drip irrigation management in table grapes cv. Thompson Seedless grown on fi ne textured soils. Agricultura técnica (Chile). 63(2): 180-192.
Shannon D., Sen A. and Johnson D. 2002. A comparative study of the microbiology of soil structure under organic and conventional regimes. Soil Use Manage. 18: 274-283.
Shepherd G., Bureh RJ, Gregory PJ, 2000. Land-use affects the distribution of soil inorganic nitrogen in smallholder maize production system in Kenia. Biol and Fertilty of Soil. 31:348-355.
Siminis C.I., Manios V. 2001: Humic substances stimulate plant growth and nutrient accumulation in grapevine rootstocks. Acta Hortic. 549, 131-136.
Sivakumar K., Sahu M and Kathiresan K., 2005. Isolation and characterization of streptomyces producing antibiotic from mangrove environment. Asian Journal of Microbial Biotechnology and Environmental Science. 7:457-467
Six J., Elliot E.T. Paustian K. 1999. Aggregate and soil organic matter dynamics under conventional and No-tillage systems. Soil Science Society of America Journal. 63(5):1350-1358
Sláviková E., Košíková B., Mikulášová M. 2002.Biotransformation of waste lignin products by the soil-inhabiting yeast Trichosporon pullulans . Canadian Journal of Microbiology, 2002, 48:(3) 200-203
Sotres F., Cepeda C., Leiros M., Seoane S. 2005. Different approaches to evaluationg soil quality using biochemical properties. Soil Biology and Biochemistry. 37:877-887.
Stevenson, F.J. Humus Chemistry, 2nd ed. (John Wiley, New York, USA, 1994
Stutzenberger, F.J., Kaufman, A.J., Lossin, R.D. 1970. Cellulolytic activity in municipal solid waste composting. Can. J. Microbiol. 16: 553–560.
Sukhada M. 1992. Effect of VAM inoculation on plant growth, nutrient level and toot phosphatase activity in papaya (Carica papaya cv. Honez Dew). Nutrient Cycling in Agroecosystems. 31(3):263-267
Suman A., Menhi L., Singh A. and Gaur A. 2006. Microbial biomass turnover in India subtropical soil under different sugarcane intercropping systems. Agron. J. 98:698-704
Susic M., 2008. A History of humic acid research http://humicacid.wordpress.com/a-history-of-humic-acid-research/

132
Sylvia D., Fuhrmann J., Hartel P., Zuberer D. 2005. Principles and applications of soil microbiology. Prentice Hall Ed. p. 44,110-135,208-220.
Tabatabai M. 1994. Soil Enzymes, in: Brigham .M(Ed). Methods of Soil Analysis, Part 2. Book Series No.5SSSA. MadisonWI, 775-834.
Tabatabai T and Dick W., “Enzymes in soil,” in Enzymes in the Environment, R. G. Burns and R. P. Dick, Eds., pp. 567–596, Marcel Dekker, New York, NY, USA, 2002.
Tate R.L 1987. Soil Organic Matter. Biological and Ecological Effects, Wiley, New York.
Tejada M., Hernández M. and García C. 2006. Application of two organic amendments on soil restoration: effects on the soil biological properties J. Environ. Qual. 35:1010-1017
Tejada, M. and González, J. L.; 2003: Infl uence of foliar fertilization with amino acids and humic acids on productivity and quality of asparagus. Biol. Agric.Hortic. 21: 277-291.
Terence, R.B., Dunst, R.M., Joy, P. 2002. Seasonal dry matter, starch, and nutrient distribution in “Concord” grapevine roots. HortScience. 37: 313-316.
Thompson, W., Leege, P., Milner, P., Watson, M. 2001. Test methods for examination of composting and compost (TMECC). The US Composting Council, research and education foundation. US Government Printing Offi ce.
Tiquia, S., Wan, J., Tam, N. 2002. Dynamic of yard trimmings composting as determined by dehydrogenase activity, ATP content, arginine, amonifi cation and nitrifi cation potential. Prtocess Biochemistry. 37: 1057-1065.
Travis, J.W., Halbrendt, N., Hed, B., Rytter, J., Anderson, E., Jarjour, B., Griggs, J., Bates, T. 2003. A Practical Guide to the Application of Compost in Vineyards – Fall 2003. Pennsylvania State University and Cornell University, http://fpath.cas.psu.edu/compostguide.pdf.
Tuomela, M., Vikman, M., Hatakka, A., Itävaara, M. 2000. Biodegradation of lignin in the compost environment: a review. Bioresour. Technol. 72: 169–183.
Undurraga S.A. Viña Undurraga. 2003. Procesamiento del orujo y escobajo, mediante un sistema de compostación. Santiago – Chile. 2.
US Department of Agriculture (USDA) and the Composting Council Research and Education Foundation (CCREF). 2002. Test Methods for the Examination of Composting and Compost. USA, pp. 222.
USDA NSSH Part 624. Soil quality defi nitionshttp://soils.usda.gov/sqi/concepts/concepts.html
USDA, 1971. Agricultural Marketing Service, USDA. Sub-part: United States Standards for Grades of Table Grapes (European or Vinifera Type). United States Department of Agriculture. Pag 385-386.
USDA, 1999. Agricultural Marketing Service, USDA. Sub-part: United States Standards for Grades of Table Grapes (European or Vinifera Type). United States Department of Agriculture. Pag 1-15.
USDA-NRCSH. 2006. Soil quality defi nitions. Part 624. http://soils.usda.gov/sqi/concepts/concepts.html
Valdrigh, MM., Pera, A., Scatena, S., Agnolucci, M., Vallini, G.1995. Effects of humic acids
133
extracted from mined lignite or composted vegetable residues on plant growth and soil microbial populations. Compost Sci. Util. 3(1): 30-38.
Vargas-García M.C and Suárez-Estrella F., Effect of compost on biological properties of the soil. In: J. Moreno-Casco and R. Moral-Herrero, Editors, Composting, Mundi-Prensa, Madrid (2008), pp. 329–350
Vaughan, D., MacDonald, I.R., 1976. Some effects of humic acid on cation uptake by parenchyma tissue. Soil Biology & Biochemistry. 8: 415–421.
Vaughan, D., Malcom, R.E., Ord, B.G., 1985. Infl uence of humic substances on biochemical processes in plants. In: Vaughan, D., Malcom, R.E. (Eds.), Soil Organic Matter and Biological Activit, Martinus Nijhoff/Junk W, Dordrecht, The Netherlands, pp. 77–108.
Velasco, M., Campitelli, P., Zeppi, S., y Habel J. 2004. Analysis of humic acids from compost of urban wasted and soil by fl uorence spectroscopy. Agricientia 21(1): 31-38.
Velásquez, E.; Lavelle, P.; Amézquita, E.; Barrios, E.; Andrade, M. Gisq, Andrade M. 2007. A multifuntional indicator of soil quality. Soil biology and biochemistry. 39:3066-3080.
Verchot L. and Borelli T. 2005. Application of para-nitrophenol(pNP) enzyme assays in dregraded tropical soil. Soil Biol and Biochem. 37:625-633
Visser, S. 1985. Physiological action of humic substances on microbial cells. Soil Biology and Biochemistry. 17(4), 457-462.Mandi P. 2010. The experience of the fi rst bioestimulant, based on aa and peptides: a short retrospective review on the laboratory researcher and the practical results. Fertilitas Agrorum 1(1):29-43
Voča, N.; Krička, T.; Jurišic´, V.; Savic´, T. B.; Matin, A. 2009. The potential of utilisation of residue after wine production for obtaining thermal energy. Zbornik Radova 44. Hrvatski i 4 Medunarodni Simpozij Agronoma, Opatija, Hrvatska, 16-20 Veljače . 880-884
Wander MR, Bollero GA (1999) Soil quality assessment of tillage impacts of Illinois. Soil Science Society of American Journal 63: 961-971.Wang, P., Changa, C., Watson, M., Dick, W., Chen, Y., Hoitink, H. 2004. Maturity indices for composting dairy and pig manures. Soil Biol. Biochem. 37: 2109-2116.
Warkentin, B.P., Fletcher, H.F., 1977. Soil quality for intensive agriculture. Intensive Agriculture Society of Science, Soil and Manure. Proceedings of the International Seminar on Soil Environment and FertilizerManagement. National Institute of Agricultural Science, Tokyo, pp. 594– 598.
Weber J., Karczewska A., Drozd J., Licznar M., Jamroz E. and Kocowicz A., 2007. Agricultural and ecological aspects of a sandy soil as affected by the application of municipal solid waste composts, Soil Biol. Biochem. 39: 1294–1302.
Wickramatilake, A., Kouno, K., Nagaoka T. 2010. Compost amendment enhances the biological properties of Andosols and improves phosphorus utilization from added rock phosphate. Soil Science & Plant Nutrition 56(4):607-616
Williams, L. y Ayars, J. 2005. Water use of Thompson seedless grapevines as affected by the application of gibberellic acid (GA3) and trunk girdling – practices to increase berry size. Agricultural and Forest Meteorology (USA). 129: 85–94.
Zachariakis M., Tzorakakis E., Kritsotakis I., Siminis C.I., Manios V., 2001. Humic substances stimulate plant growth and nutrient accumulation in grapevine rootstocks. Acta Hortic 549: 131-136.
134
Zancada M., Almendros G., Sanz J.and Román R. 2004. Speciation of lipid and humus-like colloidal compounds in a forest soil reclaimed with municipal solid waste compost, Waste Manage. Res. 22:24–34
Zheng Y., Shi J., Pan Z. 2012. Biochemical characteristics and thermal inhibition kinetics of polzphenol oxidase extracted from Thompson seedless grape. Eur Food Res Technol. 24:1-10 <online >
Zoffoli, J., Latorre, B., Rodríguez, J y Aguilera, J. 2009. Biological indicators to estimate the prevalence of gray mold and hairline cracks on table grapes cv. Thompson seedless after cold storage. Postharvest Biology and Technology (Holanda). 52(1):126–133
Zucconi, F., Pera, A., Forte, M., De Bertoldi, M. 1981. Evaluating toxicity and immature compost. Biocycle. 22: 54-57.
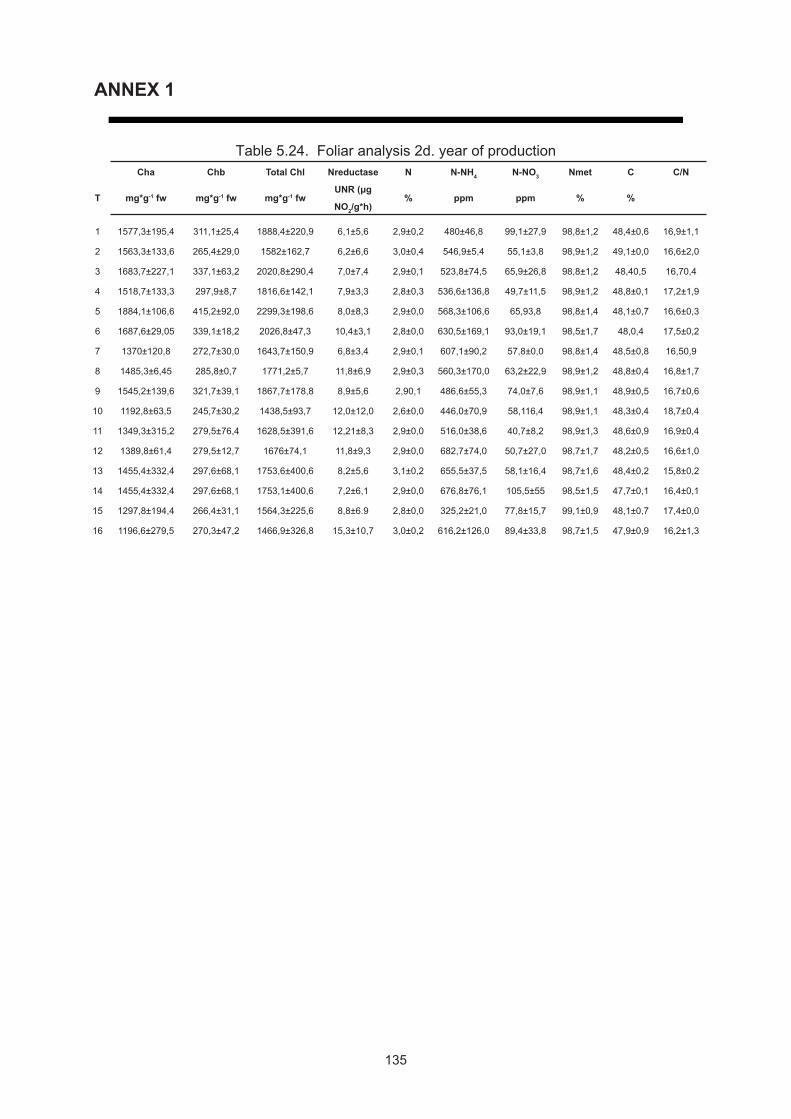
135
Table 5.24. Foliar analysis 2d. year of productionCha Chb Total Chl Nreductase N N-NH4 N-NO3 Nmet C C/N
T mg*g-1 fw mg*g-1 fw mg*g-1 fwUNR (μg
NO2/g*h)% ppm ppm % %
1 1577,3±195,4 311,1±25,4 1888,4±220,9 6,1±5,6 2,9±0,2 480±46,8 99,1±27,9 98,8±1,2 48,4±0,6 16,9±1,1
2 1563,3±133,6 265,4±29,0 1582±162,7 6,2±6,6 3,0±0,4 546,9±5,4 55,1±3,8 98,9±1,2 49,1±0,0 16,6±2,0
3 1683,7±227,1 337,1±63,2 2020,8±290,4 7,0±7,4 2,9±0,1 523,8±74,5 65,9±26,8 98,8±1,2 48,40,5 16,70,4
4 1518,7±133,3 297,9±8,7 1816,6±142,1 7,9±3,3 2,8±0,3 536,6±136,8 49,7±11,5 98,9±1,2 48,8±0,1 17,2±1,9
5 1884,1±106,6 415,2±92,0 2299,3±198,6 8,0±8,3 2,9±0,0 568,3±106,6 65,93,8 98,8±1,4 48,1±0,7 16,6±0,3
6 1687,6±29,05 339,1±18,2 2026,8±47,3 10,4±3,1 2,8±0,0 630,5±169,1 93,0±19,1 98,5±1,7 48,0,4 17,5±0,2
7 1370±120,8 272,7±30,0 1643,7±150,9 6,8±3,4 2,9±0,1 607,1±90,2 57,8±0,0 98,8±1,4 48,5±0,8 16,50,9
8 1485,3±6,45 285,8±0,7 1771,2±5,7 11,8±6,9 2,9±0,3 560,3±170,0 63,2±22,9 98,9±1,2 48,8±0,4 16,8±1,7
9 1545,2±139,6 321,7±39,1 1867,7±178,8 8,9±5,6 2,90,1 486,6±55,3 74,0±7,6 98,9±1,1 48,9±0,5 16,7±0,6
10 1192,8±63,5 245,7±30,2 1438,5±93,7 12,0±12,0 2,6±0,0 446,0±70,9 58,116,4 98,9±1,1 48,3±0,4 18,7±0,4
11 1349,3±315,2 279,5±76,4 1628,5±391,6 12,21±8,3 2,9±0,0 516,0±38,6 40,7±8,2 98,9±1,3 48,6±0,9 16,9±0,4
12 1389,8±61,4 279,5±12,7 1676±74,1 11,8±9,3 2,9±0,0 682,7±74,0 50,7±27,0 98,7±1,7 48,2±0,5 16,6±1,0
13 1455,4±332,4 297,6±68,1 1753,6±400,6 8,2±5,6 3,1±0,2 655,5±37,5 58,1±16,4 98,7±1,6 48,4±0,2 15,8±0,2
14 1455,4±332,4 297,6±68,1 1753,1±400,6 7,2±6,1 2,9±0,0 676,8±76,1 105,5±55 98,5±1,5 47,7±0,1 16,4±0,1
15 1297,8±194,4 266,4±31,1 1564,3±225,6 8,8±6.9 2,8±0,0 325,2±21,0 77,8±15,7 99,1±0,9 48,1±0,7 17,4±0,0
16 1196,6±279,5 270,3±47,2 1466,9±326,8 15,3±10,7 3,0±0,2 616,2±126,0 89,4±33,8 98,7±1,5 47,9±0,9 16,2±1,3
ANNEX 1
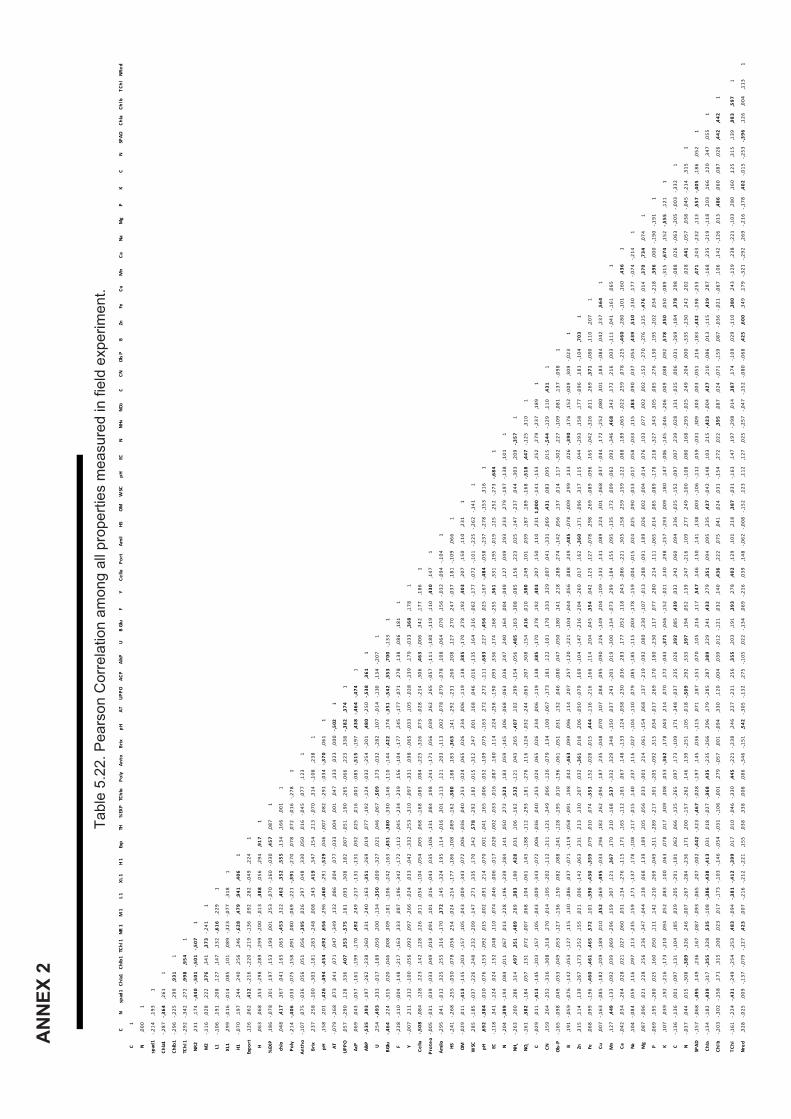
CN
spad
1Ch
la1Ch
lb1
TChl
1NR
1M
1L 1
XL 1
H 1
Exp
TH
%EX
P TC
hlo
Poly
Anto
Brix
pHAT
UPPO
ACP
AlkP
UB
Glu
FY
Cellu
Port
Amil
HSOM
WSC
pHEC
NNH
4NO
3C
CNOl
s PB
ZnFe
CuM
nCa
NaM
gP
KC
NSP
ADCh
laCh
l bT C
hlNR
ed
C1
N,0
001
spad
1-,2
14,1
931
Chla1
-,287
-,364
,261
1
Chlb
1-,2
96-,2
25,2
99,9
311
TChl
1-,2
92-,3
42,2
72,9
98,9
541
NR2
,231
,174
-,440
-,501
-,501
-,507
1
M2
-,116
,028
,222
,376
,341
,373
-,241
1
L1-,1
06,1
91,2
08,1
27,1
47,1
32-,6
16,2
291
XL1
,299
-,016
-,014
,085
,101
,089
-,323
-,077
,318
1
H1-,0
70,1
97,2
44,2
40,2
56,2
46-,6
28,4
79,9
41,4
061
Expo
rt,1
26,0
62,4
12-,2
16-,2
20-,2
19-,1
36,0
92,2
82-,0
49,2
241
H,0
63,0
68,3
53-,2
98-,2
89-,2
99-,2
00-,0
13,3
88,0
56,2
94,9
171
%EX
P,1
86-,0
78,3
01,1
97,1
53,1
90,0
01,2
53-,0
70-,1
60-,0
30,4
57,0
871
chlo
,048
,417
,367
,041
,165
,065
-,453
,322
,462
,352
,555
,134
,166
,001
1
Poly
-,214
-,406
-,033
-,075
-,158
-,091
,080
-,069
-,221
-,391
-,270
,078
,072
-,016
-,278
1
Anth
o-,1
07,0
75-,0
36,0
56,0
51,0
56-,3
95,0
26,2
97,0
48,3
30,0
50,0
16-,0
45,0
77,1
231
Brix
,237
,258
-,100
-,303
-,181
-,283
-,248
,008
,343
,419
,347
,154
,213
-,070
,314
-,108
,238
1
pH,1
58,2
01-,4
26-,4
94-,4
54-,4
92,6
56-,2
96-,4
60-,2
91-,5
29,0
46-,0
07,0
82-,2
91-,0
34-,3
70,0
611
AT-,0
79-,2
68,0
73,0
41,0
71,0
47-,3
49,1
32,0
86,0
04,0
77-,0
33,0
04,0
01,0
47,1
33,0
23,0
00-,5
021
UPPO
,057
-,290
,128
,336
,407
,353
-,575
,181
,093
,308
,182
,007
-,051
,190
,265
-,066
,223
,338
-,382
,374
1
AcP
,069
,043
-,057
-,161
-,199
-,170
,492
,249
-,217
-,131
-,131
,032
,025
,016
,001
-,085
-,515
-,197
,438
-,464
-,474
1
AlkP
-,535
,393
-,197
-,262
-,238
-,260
,331
-,240
-,163
-,351
-,269
,019
,077
-,192
-,124
-,032
-,254
-,201
,480
-,250
-,538
,361
1
U,2
54-,4
93-,3
33-,0
17-,1
89-,0
50,2
00-,1
34-,3
50-,0
09-,3
27,0
21,0
46-,0
67-,5
09,1
73-,0
32-,2
82,1
07-,0
14-,1
3 0,1
34-,2
071
BGlu
-,464
,224
-,315
,020
-,046
,008
,309
-,181
-,106
-,242
-,163
-,451
-,380
-,330
-,146
-,110
-,144
-,422
,174
-,351
-,542
,353
,700
-,133
1
F-,2
28-,1
10-,0
04-,1
48-,2
17-,1
63,3
33,0
87-,1
96-,3
42-,1
72-,1
12-,0
45-,2
34-,2
39,1
56-,1
04-,1
77,2
45-,1
77-,0
71,2
78,1
38,0
86,1
811
Y-,0
07,2
11-,3
12-,1
00-,0
56-,0
92,0
97-,2
66-,0
24,0
33-,0
42-,3
32-,2
53-,3
10-,0
97-,3
31,0
98-,0
65-,0
33,1
05-,0
28-,1
39,1
79-,0
33,3
68,1
781
Cellu
-,508
-,084
,128
,123
,142
, 128
,126
,011
-,054
-,104
-,054
,005
,068
-,168
-,085
,084
-,223
-,326
,073
-,028
-,214
,306
,463
-,006
,342
,177
,186
1
Prot
eo-,0
05-,0
31,0
39-,0
33,0
49-,0
18-,0
91,1
01,0
16-,0
43,0
35-,1
06-,1
31,0
84,1
98-,2
41-,1
71,0
56,0
39,2
62,2
65-,0
57-,1
11-,1
80-,1
19,1
10,4
30,1
471
Amilo
-,295
,041
-,012
,325
,255
,316
-,170
,372
,145
-,324
,195
,114
-,016
,301
-,113
,121
,203
-,113
,002
-,078
-,079
-,078
,108
-,064
,070
,156
-,032
-,094
-,104
1
HS-,2
41-,2
68-,2
55-,0
50-,0
78-,0
56, 2
54-,0
24-,2
14-,1
77-,1
86-,1
08-,0
89-,1
62-,3
80,1
88,1
83-,3
63,1
41-,2
92-,2
31,2
60,2
08,1
27,2
70,2
47-,0
37,1
81-,1
09,0
661
OM-,0
29,0
11-,4
13-,1
45-,2
03-,1
57,1
05-,0
43-,0
09-,3
43-,0
72,0
06-,0
36,0
40-,2
53-,0
24,0
65,0
26,2
34,0
06-,1
19,1
38,3
85-,1
70,2
78,1
92,4
03,2
07,1
50,1
10,2
311
WSC
,285
-,185
-,037
-,226
-,248
-,232
-,209
-,147
,271
,335
,170
,342
,578
-,292
,182
-,015
-,312
,247
,001
,168
,046
-,016
-,135
,164
-,316
-,062
-,177
-,072
-,101
-,225
-,262
-,141
1
pH,6
92-,3
84-,0
10-,0
76-,1
53-,0
92,0
15-,0
02-,0
91,2
14-,0
70,0
01-,0
41,1
65-,0
06-,0
52-,1
09,0
75-,1
63,2
72,2
72-,1
11-,6
83,2
27-,4
56,0
25-,1
67-,4
84-,0
58-,2
37-,2
78-,1
53,3
161
EC-,1
18,3
41-,1
24,0
24,1
52,0
48,1
10-,0
74-,0
46-,0
06-,0
17,0
20-,0
02-,0
33-,0
16-,0
87,1
60,1
14,2
24-,2
58-,1
90,0
93,3
36-,1
74,1
68-,2
55,3
61,3
31,1
95-,0
19,1
25,2
52-,2
73-,6
841
N-,2
04-,3
99-,1
94,0
84-,0
11,0
67,0
13-,2
28-,1
96-,2
39-,2
84,1
41,0
50,2
72-,5
23,1
83,0
59-,1
45,3
06-,0
68-,0
63,0
36,2
47,2
40,1
64,0
04-,0
49,1
27,0
49,2
93,2
33,2
79-,1
97-,1
38,1
011
NH4
-,263
,200
,286
,314
,497
,351
-,489
,289
,383
,180
,428
,031
,106
-,162
,532
-,121
,043
,265
-,407
,102
,299
-,154
-,056
-,485
-,163
-,308
-,085
,156
,223
,025
-,147
-,237
,044
-,303
,209
-,357
1
NO3
-,161
,382
-,184
,057
,131
,072
-,007
,068
,104
-,061
,143
-,188
-,112
-,293
,181
-,276
,116
-,124
-,032
-,244
-,063
,207
,308
-,154
,416
,010
,380
,249
,101
,039
,187
,189
-,168
-,518
,447
-,125
,310
1
C-,0
29,0
11-,4
13-,1
45-,2
03-,1
57,1
05-,0
43-,0
09-,3
43-,0
72,0
06-,0
36,0
40-,2
53-,0
24,0
65,0
26,2
34,0
06-,1
19,1
38,3
85-,1
70,2
78,1
92,4
03,2
07,1
50,1
10,2
311,
000
-,141
-,153
,252
,279
-,237
,189
1
CN,1
59,2
64-,2
52-,3
16-,3
08-,3
18,2
70-,0
14-,1
05-,2
02-,1
12-,2
11-,1
21-,3
49,0
66-,1
26-,0
79,1
34,1
00-,0
67-,1
73,1
81,1
22-,1
01,1
70,3
33,3
29-,0
07,0
41-,3
31-,0
69,4
31,0
83,0
95,0
15-,5
44-,1
29,1
10,4
311
Ols-
P-,1
65-,0
98,0
49-,0
53-,0
49-,0
53-,1
27-,1
36,1
50,0
82,0
88-,2
41-,1
28-,1
95,0
10-,1
96-,0
61-,0
51,0
31,1
32,0
46-,0
80,0
47-,0
50,1
80,1
41,2
18,2
88,2
74-,1
42,0
56,1
37,0
14,1
17-,3
02,2
27-,1
09-,0
81,1
37-,0
981
B,1
91-,0
59-,0
76-,1
42-,0
53-,1
27,1
15,1
30-,0
86,0
37-,0
71-,1
19-,0
58-,0
91,1
98,0
42-,4
63,0
99,0
96,1
14,2
07,2
57-,1
20-,2
21-,1
04-,0
44-,0
56,0
88,2
49-,4
85-,0
78-,0
09,2
99,1
33,0
26-,3
90,1
76,1
52- ,0
09,3
09-,0
231
Zn,3
15,1
14,1
39-,2
67-,1
73-,2
52,1
55,0
21,0
06-,1
42-,0
63,2
31,2
13,1
30,2
07,0
32-,3
61,0
18,2
06-,0
50-,0
79,1
69-,1
04-,1
47-,2
16-,2
04-,2
60,0
17,1
62-,3
60-,1
71-,0
96,3
17,1
15,0
44-,2
93,1
58,1
77-,0
96,1
81-,1
04,7
031
Fe,0
68,0
99-,1
96-,4
60-,4
61-,4
65,5
72,1
01-,3
90-,4
30-,3
59,0
79,0
10,0
74-,3
53,1
52-,0
28-,0
15,4
44-,1
16-,2
16,1
66,1
14,2
04-,0
45,3
54,0
42,1
25,1
27-,0
78,2
98,2
69-,0
89-,0
96,1
65-,0
42-,3
26,0
11,2
69,3
71-,0
80,1
10,2
071
Cu,0
07-,1
63-,0
85-,1
82-,2
09-,1
89,0
10,3
52-,0
69-,4
95-,0
33,2
96,1
82,2
62-,0
94,1
87,2
35-,0
48,0
70,1
07,0
84,0
95-,0
90,2
26-,1
49,2
04-,1
09-,1
32,1
31,0
89,2
24,3
01-,0
68,0
37-,0
44,1
72-,2
52,0
80,3
01,1
83-,0
84,0
42,2
37,5
641
Mn
,127
,44 9
-,133
-,092
,039
-,069
-,296
,159
,307
,121
,367
,170
,210
-,168
,537
-,332
,329
,348
-,150
,037
,243
-,201
,019
-,300
-,134
-,073
,299
-,184
,155
,095
-,135
,172
,009
-,062
,092
-,346
,468
,342
,172
,216
,003
-,111
-,041
-,161
,065
1
Ca-,0
42,0
34-,2
64,0
28,0
21,0
27,0
60,0
31-,1
34-,2
76-,1
15,1
71,1
65-,1
12-,1
81,0
67,1
48-,1
33,1
24-,0
38-,2
30,0
36,2
83,1
77,0
52,1
18,0
43-,0
86-,2
21,3
05,1
58,2
59-,1
59-,1
22,0
88,1
89-,0
65-,0
22,2
59,0
78-,2
25-,4
60-,2
80-,1
01,1
60,4
361
N a,1
04-,0
84,0
59,1
16,0
97,1
13-,2
35,1
59,1
71-,1
37,1
78-,1
08-,1
17-,0
15,1
40,2
37,1
16-,0
27-,1
04-,1
10,0
79,0
85-,1
85-,1
15-,0
03-,1
78-,1
59-,0
04-,0
15,0
24,0
25,0
90-,0
13-,0
17,0
58-,0
33,1
15,3
83,0
90,0
37-,0
54,4
39,5
10-,1
30,1
77-,0
74-,2
141
Mg
,087
-,096
,021
,228
,256
,236
-,347
-,044
,138
,068
,139
,189
,205
-,056
,033
-,001
,214
-,061
-,154
,068
,137
-,219
-,092
,080
-,230
-,107
-,013
-,288
-,091
,189
,026
,002
-,004
-,014
,076
,103
,077
,002
,002
-,152
-,270
-,276
-,125
-,476
,014
,370
,734
,074
1
P-,0
69,1
95-,2
80,0
25,1
60,0
50,1
11,1
42-,2
10,2
69-,0
49-,3
11-,2
89-,2
17,3
01-,2
05-,0
92,3
15,0
34-,0
17,2
69,1
70,1
80-,2
30,1
17,0
77,2
80,2
14,1
11-,0
65-,0
14,0
85-,0
89-,1
78,2
18-,3
27,3
43,3
05,0
85,2
76-,1
30,1
95-,2
02,0
34-,2
18,3
96,0
00-,1
90-,1
911
K,1
07,0
39,1
92-,2
16-,1
73-,2
10,0
94,0
52,0
83,1
00,0
63,0
78,0
17,3
09,3
08,0
53-,3
62,1
78,0
43,2
14,0
70,1
72-,0
43-,3
71-,0
46-,1
52-,0
21,1
30,2
98-,2
57-,2
93,0
09,1
80,1
47-,0
0 6-,1
45-,0
46-,2
06,0
09,0
88,0
92,5
78,3
50,0
50-,0
89-,3
15-,6
74,1
52-,5
55,1
211
C-,1
36-,1
36,0
01-,0
97-,1
31-,1
04,1
85,0
29-,2
05-,2
91-,1
81,0
62,0
66-,1
25-,2
65,0
97,1
73-,1
09,1
71-,3
48-,0
37,2
35,0
26,3
92,0
85,4
39,0
32,2
42,0
60,0
94,2
36-,0
25-,1
52-,0
97,0
07,2
39-,0
28,1
31-,0
25,0
06-,0
31-,2
69-,1
84,3
78,2
98-,0
88,0
26-,0
63-,2
05-,0
03-,3
321
N-,0
37,0
44,0
15-,3
08-,3
89-,3
26,2
46-,0
07-,2
67-,2
84-,2
36,1
71,2
00-,1
57-,2
62,1
46,1
39-,2
51,1
05-,0
18-,5
09,2
92,3
33,3
97,1
94,0
52,1
39,2
47-,2
16,1
09,2
77,2
49-,1
00-,1
08,0
80,1
68-,2
93-,0
25,2
49,2
04,0
00-,3
35-,2
30,2
42,2
02,0
28,4
41-,0
57,0
38-,0
45-,2
14,3
151
SPAD
-,157
-,068
-,495
,149
,236
,167
-,087
-,093
-,065
,207
-,002
-,442
-,323
-,467
-,028
-,197
,145
,036
-,115
,071
,187
-,151
,070
,105
,216
,117
,547
,146
,150
,141
,138
,003
-,106
-,112
,059
-,031
,309
,303
,003
-,051
,216
-,183
-,432
-,198
-,253
,471
,243
-,232
,113
,557
-,405
,186
,052
1
Chla
-,134
-,182
-,439
-,317
-,355
-,328
,535
-,108
-,386
-,438
-,413
,031
,018
-,027
-,368
,435
-,235
-,266
,296
,179
-,285
,287
,389
,229
,241
,433
,279
,351
,094
,095
,235
,427
-,042
-,148
,103
,215
-,423
-,004
,427
,210
-,086
,013
-,115
,429
,287
-,168
,235
-,219
-,118
,203
,166
,120
,347
,055
1
Chl b
-,203
-,302
-,158
,171
,315
,200
,023
,017
-,173
-,103
-,146
-,054
-,031
-,106
-,001
,279
-, 057
,001
-,094
,330
,120
-,004
,039
-,012
-,121
,032
,140
,436
,222
,075
,041
,024
,031
-,154
,272
,022
,395
,087
,024
-,071
-,159
,087
-,036
-,021
-,067
,106
,142
-,126
,013
,486
,060
,087
,026
,442
,442
1
T Chl
-,161
-,224
-,431
-,249
-,254
-,253
,483
-,094
-,381
-,412
-,399
,017
,010
-,046
-,330
,445
-,221
-,238
,246
,227
-,231
,256
,355
,203
,191
,393
,278
,402
,129
,101
,218
,387
-,031
-,163
,147
,197
-,298
,014
,387
,174
-,109
,029
-,110
,380
,243
-,129
,238
-,221
-,103
,280
,160
,125
,315
,139
,983
,597
1
Nred
,328
-,025
,009
-,137
-,079
-,127
,423
,007
-,216
-,212
-,221
,155
,038
,338
,008
,086
-,346
-,151
,542
-,305
-,132
,275
-,105
,022
-,134
,069
-,216
,039
,148
-,062
-,008
-,152
,123
,112
,127
,025
-,257
-,047
-,152
-,080
-,068
,425
,600
,349
,179
-,321
-,292
,269
-,216
-,178
,402
-,015
-,253
-,396
,126
,004
,113
1
AN
NEX
2
Tabl
e 5.
22. P
ears
on C
orre
latio
n am
ong
all p
rope
rties
mea
sure
d in
fi el
d ex
perim
ent.

137

138