Influence of chromium and molybdenum in solidification and ...
9
10 th International Symposium on the Science and Processing of Cast Iron – SPCI10 Influence of chromium and molybdenum in solidification and shrinkage defects for high resistance grey iron alloys L.Stuewe 1 , A.P.Tschiptschin 2 W.L.Guesser 3 and R.Fuoco 4 1 MAGMA Engenharia do Brasil, São Paulo, Brazil 2 USP - São Paulo University, Department of Materials Engineering, São Paulo, Brazil 3 UDESC – Santa Catarina University, Joinville, Brazil 4 Metso Minerals, Sorocaba, Brazil This paper presents an evaluation of Cr and Mo influence in solidification and shrinkage defects in grey cast iron. A series of five grey cast irons were produced with different Cr and Mo additions. A test casting was developed by casting process simulation to reproduce defects of an specific cylinder head. Macroshrinkage cavities were detected in the top of the test parts and microshrinkage porosity defects were analyzed in the hot spots. Macroshrinkage volumes were measured by filling the cavities with water. The microshrinkage porosities were evaluated by liquid penetrant examination and image analysis. The solidification sequence and microstructure were evaluated by thermal analysis and metallography. Combinations of 0,4%, 0,6% and 1,00 % of Cr + Mo presented a significant increase in macroshrinkage volumes and combinations of 0,6% and 1,00% of Cr + Mo presented an increase of microshrinkage porosity. In solidification Cr and Mo increased undercooling, austenite pro- eutectic fraction volume, intercellular carbides, reduced the eutectic cell size and fraction volume of graphite. Keywords: grey cast iron, shrinkage defects, thermal analysis, chromium and molybdenum, simulation Introduction Continuous increasing demands for diesel engine performance resulted in higher peak operating temperatures, consequently increased cast irons requirements for components such as cylinder heads. Grey cast iron alloys are usually used for these applications due to their good combination of physical and mechanical properties, besides good machinability and cost. Unalloyed irons do not reach the necessary properties at these temperatures, therefore alloying is required to increase thermal fatigue resistance and stability 1 . Cr and Mo are usually used for this purpose, however the addition of these elements increases the tendencies of shrinkage defects 2,3 , becoming a challenge to the foundry process engineers. Therefore it becomes necessary to improve knowledge about the influence of these elements on the solidification of grey cast irons, with the aim to better predict and control the factors that contributes to these defects. Since the shrinkage defects terminology is ambiguous in the literature, in this paper the defects caused by primary shrinkage (liquid + primary austenite shrinkage) are called macroshrinkage cavities. And defects caused by secondary shrinkage (grain boundary liquid shrinkage) are called microshrinkage porosities. Experimental Procedure To evaluate the effect of Cr and Mo a test casting was developed using casting process simulation (MAGMAsoft ), as shown in Fig.1. The casting part should represent a cylinder head section which presented shrinkage porosity in the production. The section, size core and solidification times should be the same.
Transcript of Influence of chromium and molybdenum in solidification and ...

10th
International Symposium on the Science and Processing of Cast Iron – SPCI10
Influence of chromium and molybdenum in solidification and shrinkage
defects for high resistance grey iron alloys
L.Stuewe1, A.P.Tschiptschin
2 W.L.Guesser
3 and R.Fuoco
4
1MAGMA Engenharia do Brasil, São Paulo, Brazil
2USP - São Paulo University, Department of Materials Engineering, São Paulo, Brazil
3UDESC – Santa Catarina University, Joinville, Brazil
4Metso Minerals, Sorocaba, Brazil
This paper presents an evaluation of Cr and Mo influence in solidification and shrinkage defects in grey cast iron. A series of five grey cast irons were produced with different Cr and Mo additions. A test casting was developed by casting process simulation to reproduce defects of an specific cylinder head. Macroshrinkage cavities were detected in the top of the test parts and microshrinkage porosity defects were analyzed in the hot spots. Macroshrinkage volumes were measured by filling the cavities with water. The microshrinkage porosities were evaluated by liquid penetrant examination and image analysis. The solidification sequence and microstructure were evaluated by thermal analysis and metallography. Combinations of 0,4%, 0,6% and 1,00 % of Cr + Mo presented a significant increase in macroshrinkage volumes and combinations of 0,6% and 1,00% of Cr + Mo presented an increase of microshrinkage porosity. In solidification Cr and Mo increased undercooling, austenite pro-eutectic fraction volume, intercellular carbides, reduced the eutectic cell size and fraction volume of graphite.
Keywords: grey cast iron, shrinkage defects, thermal analysis, chromium and molybdenum, simulation
Introduction
Continuous increasing demands for diesel engine performance resulted in higher peak operating temperatures,
consequently increased cast irons requirements for components such as cylinder heads. Grey cast iron alloys are usually
used for these applications due to their good combination of physical and mechanical properties, besides good
machinability and cost. Unalloyed irons do not reach the necessary properties at these temperatures, therefore alloying
is required to increase thermal fatigue resistance and stability1. Cr and Mo are usually used for this purpose, however the
addition of these elements increases the tendencies of shrinkage defects2,3
, becoming a challenge to the foundry process
engineers. Therefore it becomes necessary to improve knowledge about the influence of these elements on the
solidification of grey cast irons, with the aim to better predict and control the factors that contributes to these defects.
Since the shrinkage defects terminology is ambiguous in the literature, in this paper the defects caused by primary
shrinkage (liquid + primary austenite shrinkage) are called macroshrinkage cavities. And defects caused by secondary
shrinkage (grain boundary liquid shrinkage) are called microshrinkage porosities.
Experimental Procedure
To evaluate the effect of Cr and Mo a test casting was developed using casting process simulation (MAGMAsoft
), as
shown in Fig.1. The casting part should represent a cylinder head section which presented shrinkage porosity in the
production. The section, size core and solidification times should be the same.

10th
International Symposium on the Science and Processing of Cast Iron – SPCI10
(a)
(b)
(c)
Fig.1: (a) Test casting dimensions. (b) Test casting isometric view with gating system. (c) Simulation result of
solidification time of base alloy.
In this investigation six series of grey cast irons were planned to be produced. A base iron (alloy2), 0,2% Cr (alloy3),
0,2%Mo (alloy4), 0,2%Cr+0,2%Mo (alloy5), 0,3%Cr+0,3%Mo (alloy6) and 0,5%Cr+ 0,5%Mo (alloy8). The complete
casting procedure is published in reference 4. Macroshrinkage defects were detected in the top of test casting and the
volumes were measured by filling the cavities with a mixture of soap and water, as shown in Fig. 2 (a). The
microshrinkage porosities were analyzed qualitatively by liquid penetrants and quantified by image analysis in the
thermal center of the casting part, region C, as shown in Fig. 3. The microstructure was analyzed by optical microscopy
and image analysis. The fraction volume of graphite – Vgraf (%), fraction volume of intercellular carbides - Vcarb (%)
and diameter of eutectic cel - CE (mm) were investigated in the regions A and C as shown in Fig. 2(b).
(a) (b)
Fig.2: (a) Measurement of macroshrinkage cavities. (b) Microshrinkage and microstructure evaluation areas.
Thermal analysis was performed for each alloy using shell sand cups without tellurium. The analyzed parameters in
cooling curves are shown in Fig. 3. The equilibrium temperatures of stable (TEEi) and metastable (TEMi) where
calculated by the program Thermocalc
using equilibrium systems Fe-C-Mn-Si, Fe-C-Mn-Si-Cr, Fe-C-Mn-Si-Mo e Fe-
C-Mn-Si-Cr-Mo
Fig.3: Analyzed parameters in the cooling curve: I = primary solidification interval (I = TAL – TSE), SN =
undercooling (SN = TEE-TSE) T = Recalescence (T = TER – TSE).

10th
International Symposium on the Science and Processing of Cast Iron – SPCI10
Chemical analysis of carbon and sulfur were analyzed by direct combustion (infrared detection) and the other
elements were analyzed by ooptical emission spectrometry.
Results and Discussion
Table 1 shows the results of chemical analysis and pouring temperatures of planned alloys.
Table 1: Chemical analysis results and pouring temperature.
Alloy CE % C % Si % Mn % P % S % Cu % Sn % Cr % Mo % Pouring temp. C
02 4,12 3,38 2,18 0,46 0,03 0,13 0,77 0,10 0,03 0,00 1400
03* 4,11 3,38 2,16 0,46 0,04 0,13 0,77 0,10 0,15 0,00 1380
04 4,15 3,42 2,16 0,45 0,04 0,13 0,77 0,10 0,04 0,18 1350**
05 4,17 3,42 2,20 0,45 0,04 0,13 0,77 0,10 0,20 0,18 1400
06 4,12 3,40 2,11 0,44 0,04 0,14 0,76 0,10 0,31 0,31 1400
08 4,15 3,39 2,25 0,44 0,04 0,13 0,76 0,10 0,52 0,52 1385
*The Cr yield in the ladle was lower than expected, resulting in a lower value compared with what was planned. **Alloy 4 was poured below the
lower limit variation.
Influence of Cr and Mo in the volumes of macroshrinkage cavities and microshrinkage porosities:
All alloys presented macroshrinkage defects in the top of the casting parts. Fig. 4 shows the measured volumes of
macroshrinkages and Fig. 5 shows the images of the defects in the top of the casting parts.
(a) Alloy 2 (b) Alloy 8
Fig.4: Macro shrinkage porosity volumes for alloys with growing
addition of Cr and Mo elements. Fig.5: Macroshrinkages for alloys 2 and 8.
In alloys 3 and 4 was observed lower influence of Cr and Mo additions comparing with the unalloyed base grey cast
iron (alloy 2). However when the elements are added together in alloys 5,6 and 8 the volume of shrinkage is
significantly affected. Alloy 4 could show higher macroshrinkage volumes, because in this trial the metal was poured
with lower temperate than planned. The casting process simulation was able to predict correctly the macroshrinkage
tendency with growing Cr and Mo additions, as shown in Fig.6.

10th
International Symposium on the Science and Processing of Cast Iron – SPCI10
Fig.6: Simulation results of shrinkage prediction – alloy 2 (left), alloy 8 (right).
Higher additions of Cr and Mo also increased the microshrinkage porosities fraction volumes as shown in the Fig.7.
Just alloy 6 and 8 presented significant effect in the microshrinkage porosity. The evaluation with liquid penetrants also
revealed micro porosities only in the alloys 6 and 8 (Fig.8).
Fig.7: Microshrinkage fraction volume (%) for alloys with growing addition of Cr and Mo elements. Average of 20
optical fields measurement.
(a) Alloy 2 – base alloy (b) Alloy 8 – 0,5%Cr+0,5%Mo (c) Alloy 8 – 0,5%Cr+0,5%Mo
Fig.8: (a) – (b) Results of micro shrinkage revealed by liquid penetrants in area C of casting part. c) Microshrinkage
example in alloy 8.
Influence of Cr and Mo in cooling curves parameters:
Table 3 shows the results of thermal analysis of the cooling curves. Fig. 10 shows the cooling curves for all alloys
evaluated.

10th
International Symposium on the Science and Processing of Cast Iron – SPCI10
Table 3: Temperatures and cooling curve parameters for all casting alloys.
Alloy TAL
(oC)
TEEi
(oC)
TEMi
(oC)
DTE*
*
(oC)
TE
(oC)
TSE
(oC)
TRE
(oC)
SN
(oC)
I
(oC)
02 1185 1164 1124 40 1167 1151 1155 13 34
03 1185 1163 1125 38 1166 1149 1152 14 36
04 1184 1163 1123 40 1165 1149 1153 14 35
05 1180 1162 1124 38 1164 1147 * * *
06 1187 1161 1125 36 1164 1145 1150 16 42
08 1184 1160 1125 36 1159 1141 1145 19 43
* In the alloy five temperatures were not totally recorded due to a failed in thermocouple during the test
** DTE = TEEi – TEMi. Interval between stable ( TEEi) and metastable equilibrium (TEMi) initial eutectic temperatures.
Analyzing the eutectic temperatures TEEi and TEMi in Table 3 is possible to observe that the DTE interval between
stable and metastable equilibrium eutectic temperatures were reduced with the highest amounts of Cr an Mo as already
studied by Kanno et.al5. During cast iron solidification the elements Cr and Mo segregates to the liquid and retard the
eutectic cell nucleation6,7
, consequently reducing nucleation temperature (TE), undercooling temperature (TSE) and
undercooling (SN = TEEi-TSE). The results presented in the Fig. 11 confirm this effect for alloys 6 and 8. The other
alloys presented similar values compared with base alloy.
Fig.10: Cooling curves of all alloy castings.
(a) (b)
Fig.11: (a) Undercooling values for alloys with growing additions of Cr and Mo. (b) Cooling curves, thermal
equilibrium temperatures and undercooling values for base alloy 2 and alloy 8.
Higher undercooling leads to higher interval between TAL and TE (Fig.3a), increasing in this way the primary
solidification interval (I = TAL – TSE), as shown in results of Fig. 12 (a). The higher the primary solidification range,
the larger the expected fraction solid of pro-eutectic austenite. Pro-eutectic austenite increases macroshrinkage
tendencies. Fig. 12 (b) shows a relation between macroshrinkage defects volumes with the primary solidification interval
(I).

10th
International Symposium on the Science and Processing of Cast Iron – SPCI10
Fig.12: (a). Primary solidification interval for alloys with growing additions of Cr and Mo. (b) Relation between
macroshrinkage defects volumes and primary solidification interval (I) for alloys 2,3,4,6 and 8.
All alloys were cast with equivalent carbon close to the eutectic point, making a metallographic analysis of primary
austenite fraction solid volume more difficult. Nevertheless, foundry process simulation results show that higher Cr and
Mo additions increases the austenite fraction solid volume, as shown in Fig.13. However the difference is not so
significant and probably this is not the only factor to explain the increase of macroshrinkage tendencies with Cr and Mo
additions.
(a) Alloy 2 – base alloy – 16% austenite (b) Alloy 8 – 0,50% Cr + 0,50%Mo - 22% austenite
Fig.13: Simulation result – fraction volume of austenite (%). White dot indicates the local point of comparison results.
Influence of Cr and Mo in microstructure:
Fig. 14 (a) shows the results of fraction volume of eutectic graphite for alloys with growing additions of Cr and Mo. Just
alloys 6 and 8 presented a significant reduction value of eutectic graphite fraction volume.
(a) (b)
Fig.14: (a) Eutectic graphite fraction volume for alloys with growing additions of Cr and Mo. (b) Relation between
microshrinkage fraction volume and eutectic graphite fraction volume.
Lower eutectic graphite fraction volume leads to less eutectic expansion necessary to compensate secondary
shrinkage, consequently more microshrinkage porosities are expected. Is possible to see in Fig. 14 (b) that there is a
tendency to increase microshrinkage porosities with lower fraction volume of eutectic graphite, however it was not
10th
International Symposium on the Science and Processing of Cast Iron – SPCI10
possible to establish a direct relation between these results. Fig. 15 shows microstructures of alloys 2 and 8, highlighting
the lower graphite fraction volume in the alloy with Cr and Mo.
(a) Alloy 2 – base alloy (b) Alloy 8 – 0,5% Mo + 0,5%Cr
Fig.15: Microstructures: (a) base alloy 2 and (b) alloy 8. Optical microscopy, magnification 100x.
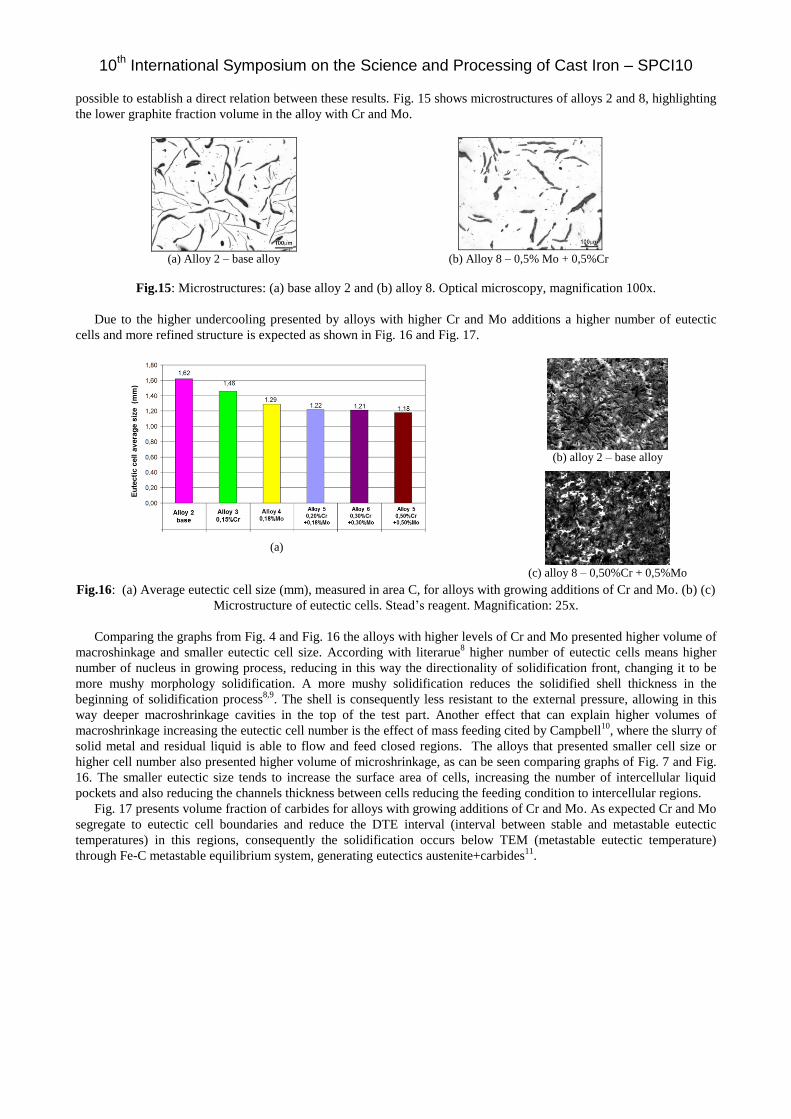
Due to the higher undercooling presented by alloys with higher Cr and Mo additions a higher number of eutectic
cells and more refined structure is expected as shown in Fig. 16 and Fig. 17.
(a)
(b) alloy 2 – base alloy
(c) alloy 8 – 0,50%Cr + 0,5%Mo
Fig.16: (a) Average eutectic cell size (mm), measured in area C, for alloys with growing additions of Cr and Mo. (b) (c)
Microstructure of eutectic cells. Stead’s reagent. Magnification: 25x.
Comparing the graphs from Fig. 4 and Fig. 16 the alloys with higher levels of Cr and Mo presented higher volume of
macroshinkage and smaller eutectic cell size. According with literarue8 higher number of eutectic cells means higher
number of nucleus in growing process, reducing in this way the directionality of solidification front, changing it to be
more mushy morphology solidification. A more mushy solidification reduces the solidified shell thickness in the
beginning of solidification process8,9
. The shell is consequently less resistant to the external pressure, allowing in this
way deeper macroshrinkage cavities in the top of the test part. Another effect that can explain higher volumes of
macroshrinkage increasing the eutectic cell number is the effect of mass feeding cited by Campbell10
, where the slurry of
solid metal and residual liquid is able to flow and feed closed regions. The alloys that presented smaller cell size or
higher cell number also presented higher volume of microshrinkage, as can be seen comparing graphs of Fig. 7 and Fig.
16. The smaller eutectic size tends to increase the surface area of cells, increasing the number of intercellular liquid
pockets and also reducing the channels thickness between cells reducing the feeding condition to intercellular regions.
Fig. 17 presents volume fraction of carbides for alloys with growing additions of Cr and Mo. As expected Cr and Mo
segregate to eutectic cell boundaries and reduce the DTE interval (interval between stable and metastable eutectic
temperatures) in this regions, consequently the solidification occurs below TEM (metastable eutectic temperature)
through Fe-C metastable equilibrium system, generating eutectics austenite+carbides11
.

10th
International Symposium on the Science and Processing of Cast Iron – SPCI10
(a) (b)
Fig.17: (a) Carbides volume fraction (%) for alloys with growing additions of Cr and Mo for evaluation areas A and C.
(b) microstructure of an intercellular carbide in alloy 8 with magnification of 100x. Nital 4% reagent.
Fig.18. Relation between volume fraction of carbides and microshrinkage volume fraction (area C).
The shrinkage of carbides solidification in relation of the liquid is approximately –1,9 V%, consequently it
generates microshrinkage porosities, therefore it was possible to correlate directly the carbide volumes with
microshrinkage volumes as shown in Fig. 18.
Conclusions
1. Growing additions of Cr and Mo in grey cast irons increased both macroshrinkage cavities and microshrinkage
porosities. When the elements were added separately and in lower amounts (0,2%) the alloys did not present
significant difference in macro and microshrinkage volumes comparing with the base alloy. However when the
elements were added together 0,2%Cr+0,2%Mo, 0,3%Cr+0,3%Mo and 0,5%Cr+0,5%Mo occurred a significant
increase in macroshrinkage tendencies. The combinations of 0,3%Cr+0,3%Mo and 0,5%Cr+0,5%Mo presented a
significant increase in microshrinkage porosities tendencies.
2. In the solidification the elements Cr and Mo reduced the DTE interval (interval between stable and metastable
equilibrium eutectic temperatures), reduced the nucleation temperature TE, increased the undercooling (SN) and
primary solidification interval (I). Due to these factors the microstructure presented higher fraction volume of pro
eutectic austenite, lower fraction volume of eutectic graphite, higher volume of intercellular carbides and higher
number of eutectic cells. According with previous studies higher number of eutectic cells can shift the shell type
solidification morphology to a more mushy solidificatiom morphology.
3. The factors that increased the macroshrinkage cavity volumes are higher fraction volume of pro eutectic austenite
and a possible change in the solidification morphology. The factors that increased the microshrinkage porosities
were reduction of eutectic graphite (necessary for expansion and secondary shrinkage compensation), increase of
fraction volume carbides and a possible change in the solidification morphology. The results here presented and
discussed did not allow to know what is the most important factor that contributes to higher shrinkage defects
increasing Cr and Mo contents in grey cast iron.
References
1 W.L.GUESSER: Propriedades Mecânicas dos Ferros Fundidos 1st ed, p.170-175, 2009, São Paulo,
Brazil, Edgard Blücher Ltda.
2 J.C HAMAKER; W. P. WOOK; F.B. ROTE: Internal porosity in gray iron castings. AFS
Transactions, v.60, p.401-431, 1952.

10th
International Symposium on the Science and Processing of Cast Iron – SPCI10
3 R.B GUNDLACH; W.G. SHOWLZ: Phosphide eutectic in gray cast irons containing molybdenum
and/or chromium. AFS Transactions, v.81, p.395-402, 1980.
4 L.STUEWE: Avaliação da influência do cromo e molibdênio na solidificação e formação de
rechupes em ferros fundidos cinzentos. Master thesis, São Paulo University, São Paulo, Brazil,
2008.
5 T.KANNO, et al.: Effect of alloying elements on eutectic temperatures in cast iron. AFS
Transactions. v.113, p.1-9, 2005.
6 J.F JANOWAK, et al.: Technical advances in cast iron metallurgy. International Cast Metals
Journal. v.06 n.04, p.847-863, 1981.
7 H.D.MERCHANT, et al.: Structure delineation of eutectic cells in cast iron. AFS Transactions.
v.70, p.973-992, 1962
8 H.D. MERCHANT: Solidification of Cast Iron – A review of literature. Recent Research on Cast
Iron. Proceedings of a seminar held in Detroit, Michigan, ASM. 1968, New York: Gordon and
Breach 831
9 I.C.H. HUGUES, et al. Factors influencing soundness of gray iron castings. AFS Transactions, v.67,
p.149-165, 1959.
10 CAMPBELL J. Castings. 2.ed. p.191-192, 1993, Oxford, United Kingdom; Butherworth-Heinemann
Ltd.
11 J.F.JANOWAk, R.B. GUNDLACH: A modern approach to alloying gray iron. AFS Transactions.
v90 p.847-863, 1982.


![Detailed Barkhausen noise and microscopy characterization ... · effect [2]. Adding nickel, manganese, chromium or molybdenum, for example, enhances the stability of austenite and](https://static.fdocuments.in/doc/165x107/5e843efd6ed27500eb3a71e3/detailed-barkhausen-noise-and-microscopy-characterization-effect-2-adding.jpg)