INFLUENCE OF CALCINATION TEMPERATURE ON THE …chalcogen.ro/1237_Jiittiarporn.pdfINFLUENCE OF...
12
Digest Journal of Nanomaterials and Biostructures Vol. 10, No. 4, October - December 2015, p. 1237 - 1248 INFLUENCE OF CALCINATION TEMPERATURE ON THE STRUCTURAL AND PHOTOCHROMIC PROPERTIES OF NANOCRYSTALLINE MoO3 P.JITTIARPORN a,c , L.SIKONG a,c* , K.KOOPTARNOND a,c , W.TAWEEPREDA b a Department of Mining and Materials Engineering, Faculty of Engineering, Prince of Songkla University, Hat Yai, Songkhla 90112, Thailand b Department of Materials Science and Technology, Faculty of Science, Prince of Songkla University, Hat Yai, Songkhla 90112, Thailand c Center of Excellence in Materials Engineering (CEME), Prince of Songkla University, Hat Yai, Songkhla, 90112, Thailand Nanocrystalline metastable hexagonal and thermodynamically stable orthorhombic MoO3were successfully synthesized by precipitation, and calcined at various temperatures in the range 200-500ºC. The influence of calcination temperature on crystal structure, crystallite size, thermal properties, morphology, optical properties, and photochromic properties was determined. The 432ºC phase transformation temperature of hexagonal flower-like MoO3to an orthorhombic platelet structure was determined. The band gap energy of MoO3 varied from 3.13 to 3.20 eV, depending on calcination temperature. The photochromic properties were determined with UV irradiation and CIE Lab colour system. The hexagonal MoO3 from low temperature calcination had an about seven-fold photochromic efficiency relative to orthorhombic MoO3. (Received September 17, 2015; Accepted November 1, 2015) Keywords:Hexagonal MoO3; Orthorhombic MoO3; Precipitation method; Calcination temperature; Photochromic properties 1. Introduction Molybdenum trioxide (MoO3) is an important material with extensive applications in many fields such as supported catalysts, gas sensors, electrodes of rechargeable batteries, counter electrodes of dye sensitized solar cells, antimicrobials [1-5], and especially as chromogenic materials. Its electrochromic, thermochromic, and photochromic responses are defined as colour responses to the transfer of electrons by oxidation/reduction, tochanges in temperature, or to electromagnetic radiation [6,7]. Applications in automobile and building glazing, and energy conservation use photochromic materials. So far, the various methods used to fabricate MoO3 include hydrothermal, sonochemistry, sol-gel, RF magnetron sputtering, spray pyrolysis, chemical vapor deposition, precipitation, and thermal evaporation, among others [8-15]. The oxide MoO3 has three common crystal structures. The well-known thermodynamically stable orthorhombic MoO3 (α-MoO3) has MoO6 octahedral base in its unit cell, and all the MoO3 components share edges and corners forming a zigzag chain and layered structure. The metastable monoclinic MoO3 (β-MoO3) has the MoO6 octahedral unit with shared corners resulting in a distorted cube [16], and the metastable hexagonal MoO3 (h-MoO3) is also constructed of zigzag chains of MoO6 octahedra connected at cis-positions [17]. Metastable structures often provide new and improved properties relative to thermodynamically stable structures [18]. A multitude of factors affect the photochromic efficiency of MoO3, for example absorption of water or moisture in air [15], specific surface area of MoO3 [8], band gap energy [8], effects of * Corresponding author: [email protected]
Transcript of INFLUENCE OF CALCINATION TEMPERATURE ON THE …chalcogen.ro/1237_Jiittiarporn.pdfINFLUENCE OF...

Digest Journal of Nanomaterials and Biostructures Vol. 10, No. 4, October - December 2015, p. 1237 - 1248
INFLUENCE OF CALCINATION TEMPERATURE ON THE STRUCTURAL
AND PHOTOCHROMIC PROPERTIES OF NANOCRYSTALLINE MoO3
P.JITTIARPORNa,c, L.SIKONGa,c*, K.KOOPTARNONDa,c, W.TAWEEPREDAb aDepartment of Mining and Materials Engineering, Faculty of Engineering,
Prince of Songkla University, Hat Yai, Songkhla 90112, Thailand bDepartment of Materials Science and Technology, Faculty of Science,
Prince of Songkla University, Hat Yai, Songkhla 90112, Thailand cCenter of Excellence in Materials Engineering (CEME),
Prince of Songkla University, Hat Yai, Songkhla, 90112, Thailand
Nanocrystalline metastable hexagonal and thermodynamically stable orthorhombic
MoO3were successfully synthesized by precipitation, and calcined at various temperatures
in the range 200-500ºC. The influence of calcination temperature on crystal structure,
crystallite size, thermal properties, morphology, optical properties, and photochromic
properties was determined. The 432ºC phase transformation temperature of hexagonal
flower-like MoO3to an orthorhombic platelet structure was determined. The band gap
energy of MoO3 varied from 3.13 to 3.20 eV, depending on calcination temperature. The
photochromic properties were determined with UV irradiation and CIE Lab colour system.
The hexagonal MoO3 from low temperature calcination had an about seven-fold
photochromic efficiency relative to orthorhombic MoO3.
(Received September 17, 2015; Accepted November 1, 2015)
Keywords:Hexagonal MoO3; Orthorhombic MoO3; Precipitation method;
Calcination temperature; Photochromic properties
1. Introduction
Molybdenum trioxide (MoO3) is an important material with extensive applications in many
fields such as supported catalysts, gas sensors, electrodes of rechargeable batteries, counter
electrodes of dye sensitized solar cells, antimicrobials [1-5], and especially as chromogenic
materials. Its electrochromic, thermochromic, and photochromic responses are defined as colour
responses to the transfer of electrons by oxidation/reduction, tochanges in temperature, or to
electromagnetic radiation [6,7]. Applications in automobile and building glazing, and energy
conservation use photochromic materials. So far, the various methods used to fabricate MoO3
include hydrothermal, sonochemistry, sol-gel, RF magnetron sputtering, spray pyrolysis, chemical
vapor deposition, precipitation, and thermal evaporation, among others [8-15].
The oxide MoO3 has three common crystal structures. The well-known thermodynamically
stable orthorhombic MoO3 (α-MoO3) has MoO6 octahedral base in its unit cell, and all the MoO3
components share edges and corners forming a zigzag chain and layered structure. The metastable
monoclinic MoO3 (β-MoO3) has the MoO6 octahedral unit with shared corners resulting in a
distorted cube [16], and the metastable hexagonal MoO3 (h-MoO3) is also constructed of zigzag
chains of MoO6 octahedra connected at cis-positions [17]. Metastable structures often provide new
and improved properties relative to thermodynamically stable structures [18].
A multitude of factors affect the photochromic efficiency of MoO3, for example absorption
of water or moisture in air [15], specific surface area of MoO3 [8], band gap energy [8], effects of
* Corresponding author: [email protected]

1238
dopants [19, 20]and oxygen vacancies or defect concentrations in the MoO3 lattice [15].The structure
of MoO3 may have a large effect on its photochromic properties, and it can be easily modified by a
heat treatment or calcination at a high temperature. In this present work, we have investigated the
effects of calcination temperature on structural, morphological, and optical properties of
nanocrystallineMoO3powders, and we also report on the photochromic properties of particles
synthesized by precipitation and calcined at temperatures in the range 200-500ºC.
2. Material and methods
2.1 Synthesis of nanocrystalline MoO3 powders
Ammonium heptamolybdate tetrahydrate ((NH4)6Mo7O24.4H2O or AHM, Ajax Finechem)
and concentrated nitric acid (37% HNO3, J.T.Baker) analytical grade reagents were used as the
starting materials to prepare MoO3 powder using precipitation. First, (NH4)6Mo7O24.4H2O was
dissolved in distilled water to 0.2 M solution under vigorous magnetic stirring for about 15 min.
Then concentrated HNO3 was added dropwise into the AHM aqueous solution with continuous
stirring. The suspension was held at 85 °C for 1 h. After that, the precipitate was collected by
filtration and washed several times with distilled water and ethanol. The powder was dried at 70°C
for 6 h in a hot air oven. Finally, the powder was calcined at various temperatures, namely at 200,
300, 400 and 500°C, for 1 h. The chemical reaction forming the precipitated MoO3 is:
(NH4)6Mo7O24.4H2O(aq) + 6HNO3→ 7MoO3(s) + 6NH4NO3(aq) + 7H2O (1)
2.2 Characterizations
The crystalline structure and the crystallite size of the powders were characterized by X-ray
diffraction (XRD, Philips X-pert) with Cu-Kα radiation. The microstructures and particle sizes of
the MoO3 powders were assessed by scanning electron microscopy (SEM, Quanta, FEI). The
oxidation state and functional groups of each sample were determined by X-ray photoelectron
spectrometer (XPS) and Fourier transform infrared spectroscopy (FTIR, Bruker Vertex) at
Synchrotron Light Research Institute (SLRI) of Thailand, respectively. Thermogravimetric analysis
(TGA, PERKIN ELMER,TGA7) and differential thermal analysis (DTA, PERKIN ELMER, DTA7)
were used in the range from room temperature to 800°C with a rate of 10°C/min, in nitrogen
atmosphere. The optical properties of the samples were studied by recording the diffuse reflectance
spectra using a UV-visible spectrophotometer (Shimadzu UV2401) and a barium sulfate (BaSO4)
plate was used as the reference.
2.3 Photochromic property testing
Photochromic properties of the powder samples were quantified by a colour difference
meter (HunterLab, ColourFlex). The colour standard used was the CIE Lab uniform colour. The
colour determinations of samples were done after UV irradiation at 90 W power in a reflecting box,
for designated times in the range from 0 to 360 minutes.Non-irradiated MoO3 powder was used for
the white calibration reference. The L*, a* and b* colour parameters were recorded, and from them
the colour differences were calculated as:
ΔC = [(ΔL*)2+(Δa*)2+(Δb*)2]1/2 (2)
where ΔC is colour difference of a powder sample before and after UV irradiation, L* is the
transparency index (light to dark axis), and a* and b* are the chroma indexes for green to red axis
and yellow to blue axis, respectively.

1239
3. Results and Discussion
3.1 XRD analysis
The structural and lattice parameters of MoO3 samples were characterized using XRD. Fig.1
and Table 1 show the XRD results for the MoO3 samples calcined at 200, 300, 400 and 500°C. For
the hexagonal and orthorhombic structures of MoO3, the lattice parameters a, b and c were calculated
from the interplanar spacing of the {h k l} plane with Miller indices h k l. Eq. (3) is for hexagonal
structure and (4) is for orthorhombic structure.
2
2
2
22
2 3
41
c
l
a
khkh
dhkl
(3)
2
2
2
2
2
2
2
1
c
l
b
k
a
h
dhkl
(4)
where dhkl is the lattice spacing of the (hkl) plane and a , b and c are the lattice parameters.
The diffraction peaks of the calcined MoO3 samples at 200-300ºC were matched to single
phase hexagonal MoO3(JCPDS Card No.21-0569, h-MoO3). The sharp and high intensity diffraction
peaks observed indicate that the h-MoO3 in the samples was of high crystallinity and purity. For
MoO3 calcined at 400°C, the XRD patterns indicated two structures of MoO3 that match the h-
MoO3(JCPDS Card No.21-0569), and the orthorhombic structure of MoO3(JCPDS Card No. 35-
0609, α-MoO3). The fractions of hexagonal and orthorhombic phases in the samples were 87.34%
and 12.66%, respectively.
Fig.1 XRD patterns of nanocrystalline MoO3 samples calcined at various temperatures.
With calcination temperature increased to 500°C, the diffraction peaks of single-phase
orthorhombic MoO3 appeared in the XRD patterns, and the diffraction patterns are well consistent
with the JCPDS Card No.35-0609. In the XRD patterns across all samples, no characteristic peaks
for other impurities were observed.
The lattice parameters of the MoO3 powders calcined at various temperatures are
summarized in Table 1. The determined lattice parameters aandb of the hexagonal MoO3 clearly
increased while c decreased with temperature, in the range from 200ºC to 400ºC. Furthermore, the
lattice parameters a, b and c of orthorhombic MoO3 also increased with calcination temperature, at
the experimental points 400 and 500ºC where it was present. The crystallite sizes of calcined MoO3
samples can be estimated using Scherrer's formula [12].
The crystallite sizes for h-MoO3 were estimated to be 45, 48, and 48 nm for the calcination
temperatures 200, 300 and 400°C, respectively. Moreover, the crystallite sizes of α-MoO3 were 43

1240
and 46 nm in the samples calcined at 400 and 500ºC, respectively. Increasing the calcination
temperature promotes crystal grain growth and reduces defects in the crystallites [21]. A decrease
in MoO3 crystallinity decreases the grain boundary energy and the total energy of the system. In
addition, the grain size as a function of time can be approximated by [22]:
(r)n-(r0)n = Kt (5)
where r0 is an initial grains radius, r is the grain radius at time (t), and n is a grain-growth exponent
depending on the growth mechanism. The constant K can be estimated from an Arrhenius’s equation
[22]:
K = Koexp(-QG/RT) (6)
where Ko is a constant, QG is the activation energy of grain growth, R is the gas constant, and T is
the absolute temperature. Based on Eq. (5) and (6), the crystallite size of MoO3 should increase with
calcination temperature. The calcination temperature in general tends to affect the crystallite size of
a material [21].
Table 1 The crystallite structure data and optical properties of nanocrystalline
MoO3 calcined at various temperatures
Calcination
temperature
(ºC)
Structure Crystallite
size (nm)
Lattice parameters Eg(eV) E0
a (Å) b (Å) c (Å) c/a
200
300
400
500
Hexagonal
Hexagonal
Hexagonal
Orthorhombic
Orthorhombic
45
48
48
43
46
10.5857
10.5906
10.5938
3.9594
3.9626
10.5857
10.5906
10.5938
13.8515
13.8747
14.9008
14.8980
14.8874
3.6967
3.6979
1.4076
1.4067
1.4052
-
-
3.15
3.13
3.17
-
3.20
0.1429
0.1458
0.1179
-
0.0873
3.2 Thermal properties
Fig. 2 shows the thermogravimetric and differential thermal analyses of an as-prepared
MoO3 powder sample. The curve shows four obvious weight loss steps. From 50°C to 200ºC, the
first weight loss step is about 2.82%, corresponding to the removal of water adsorbed on the MoO3
surface [23].
In the second stage from 200 to 450°C, the weight loss is about 2.77%, caused by the
combustion of ammonium compounds from the MoO3 powder sample [24, 25]. The third step in the
temperature range 450-700ºC slightly increased the sample mass by 0.36 % due to uptake of oxygen
[26]. Finally, the fourth step of weight loss at temperatures above 700ºC is attributed to the
sublimation of MoO3 [27]. Characterization with DTA is shown in Fig.2b. It was performed in order
to study the phase transformations of MoO3. An exothermic peak gave 432ºC as the estimated phase
transition temperature, from metastable h-MoO3 to the thermodynamically stable α-MoO3 structure
[23]. This corroborates the phase transformation of MoO3 inferred from the XRD patterns in Fig.1
because at high calcination temperatures, the increased mobility of atoms causes re-crystallization
of MoO3 that transforms the crystallite structure.

1241
Fig.2 (a) TGA and (b) DTA curves of an as-prepared MoO3 powder
3.3 Morphological studies
The morphologies of the nanocrystallineMoO3 powder samples were assessed from SEM
images. Fig.3(a, b) and 3(c) shows SEM micrographs of the aggregation of hexagonal rod particles,
and growth from a center to form flower-like aggregates when calcined at 200 and 300ºC. The
diameter of each hexagonal rod is about500 nm to 3 μm, and the length about 2 to 9 µm. This
phenomenon is due to the minimization of surface energy [28]. For the MoO3 powder calcined at
400ºC, both hexagonal rods and hexagonal plates are clearly observed in Fig. 3(d). These hexagonal
rods have diameters from 360 nm to about 2 μm, and lengths of about 2.6-7.3 μm. The diameters of
the hexagonal plates, such as those marked by red dashed lines in Fig. 3(d), were about 1.4 to 4 μm
with thicknesses of about 140 nm. When the calcination temperature was raised from 400°C to
500°C (Fig. 3(e) and Fig. 3(f)), the morphology changed from rods to plates, like those shown in
Fig. 3(d). The diameter of MoO3 platelets was in the range 3 to 8 μm, and the average thickness
more than 140 nm. The decreasing length and diameter of the MoO3 products with calcination
temperature is attributed to the temperature promoting grain growth [21]. The size of the MoO3
particles, which was measured from the SEM micrographs, was largerthan the crystallite size
calculated from Scherrer's equation, which indicated that theparticles were polycrystalline.

1242
Fig. 3 SEM micrographs of nanocrystalline MoO3 powder calcined at (a)
( b) 200°C, (c) 300°C, (d) 400°C and (e) (f) 500°C
3.4 FT-IR analysis
The FT-IR spectra of the calcined nanocrystalline MoO3 samples are given for the
wavenumber range 4000-400 cm-1 in Fig.4. All the spectra show a broad absorption band at 3433,
and a sharp band at 1607 cm−1, which are attributed to stretching and bending vibrations of -OH in
the water adsorbed on MoO3 surfaces. The strengths of these bands decreased with the calcination
temperature of nanocrystalline MoO3, matching results reported by M. Dhanasankar et al. [10].
A metal oxide generally provides absorption bands below 1000 cm-1 due to interatomic
vibrations [3].For h-MoO3 calcined at 200-400ºC such peaks are present at 919 and 977cm-1,
indicating Mo=O [29]. The peak at 700 cm−1 is characteristic of Mo-O stretching and bending
vibrations [30]. The peaks at around 527 and576 cm-1 are due to Mo-O vibrations, in good agreement
with reference [29].
Fig.4 FT-IR spectra of nanocrystalline MoO3 samples calcined at various temperatures.

1243
The α-MoO3 shows three major absorption peaks of metal oxide. Firstly, it is evident that
the strong absorption band at 586 cm-1 is due to O-Mo-O stretching mode of corner-sharing oxygen
atoms [30]. The second, oxygen stretching vibration mode of Mo-O-Mo occurs at 865 cm-1 with a
strong absorption peak [29, 31]. The last major absorption peak of α-MoO3 metal oxide is at 992
cm-1, indicating Mo=O terminal stretching mode vibrations in the layered α–MoO3 structure [29-
31].
The broad absorption peak at 3148 and the sharp peak at 1401 cm−1 are assigned to the
stretching and bending vibrations of N-H in NH4+ from residual AHM precursor[23], and the
intensities of these bands decreased with calcination temperature.The N-H indications disappear
with calcination at 500ºC because the NH4+ from AHM decomposes above 450ºC [24, 25], as also
evidenced by the TGA/DTA analysis in Fig. 2.
3.5 XPS analysis
The oxidation state and chemical bonding state of nanocrystalline h-MoO3 calcined at 300ºC
was further assessed by XPS analysis. The XPS results for Mo 3d, O 1s and C 1s are shown in Figs.
5(a), (b) and (c), respectively. The Mo 3d peaks were fit by two Gaussian curves, whose binding
energies centered at 232.9 and 236.1 eV, relating to Mo 3d5/2 and Mo 3d3/2, respectively. These
two Mo 3d peaks confirm the oxidation state in MoO3 as Mo6+[32]. The binding energies of O 1s at
530.9 and 531.3 eV can be associated with the O2- ion formation from MoO3 [33], and with surface
contamination such as C-O bonding [26], respectively. The last characteristic in these XPS spectra
is the position of C 1s peak. The C 1s spectrum shown in Fig.5(c) can be decomposed into two peaks
at 284.9 and 286.6 eV, indicating the –CH2–CH2– and the C–O bonds of hydrocarbon contaminants
adsorbed from air on the surface [34, 35], respectively.
Fig.5 X-ray photoelectron spectra of nanocrystallineh-MoO3 calcinated at 300ºC.

1244
3.6 Optical properties
The UV –Vis DRS spectra of the nanocrystallineMoO3samples are shown in Fig.6. The
absorbance spectra were measured for wavelengths in the range 350-550 nm. It is obvious that all
samples were highly transparent in this visible spectral region. The absorption peak shifts towards
longer wavelengths (red-shift) with the calcination temperature.
Based on the absorption spectra, we can calculate the band gap energy from [13, 36, 37]:
(αE) = A(E-Eg)m (7)
where A is a constant, E (= hc/λ) is the photon energy, Eg is the optical band gap, α is the optical
absorption coefficient, and m = 1/2 for direct transition and m = 2 for indirect transition. The
coefficient α can be approximated by [36]:
α = A/d (8)
where A is the measured absorbance and d is the thickness of the samples in a UV–vis cell (0.4 cm).
Further, E can be approximated by:
E = 1,240/λ (9)
where λ is the measured wavelength in nanometers.
The optical band gap energy of nanocrystalline MoO3 is found by extrapolating the linear
portion in an (αhν)2 vs. hν plot, as shown in Fig.7. The band gaps of nanocrystalline MoO3 calcined
at 200, 300, 400 and 500ºC were about 3.15, 3.13, 3.17 and 3.20 eV, respectively. There was a clear
increase in band gap energy with the highest calcination temperature, relative to the lower
temperatures. The energy band gap of a material depends upon various factors, such as degree of
crystallinity, structure otherwise, morphology, particle size distribution, and lattice defects [29, 34].
Fig.6 Optical spectra of nanocrystalline MoO3 calcined at various temperatures.
Fig.7The (αhv)2 versus E curves of nanocrystalline MoO3 samples calcined at various temperatures.

1245
Fig.8 The ln(α) versus E plots are used to estimate the defect concentrations in nanocrystalline
MoO3 powders calcined at various temperatures.
Moreover, the band gap energy also depends on the defect concentration. In this work, the
decrease in the band gap energy value may be attributed to the occupation of electrons in oxygen
vacancies that act as donor centers. The centers are in the forbidden gap and form a narrow donor
band below the conduction band [12], giving rise to narrow band gap energy. The defect
concentration can be estimated as follows [38,39]:
α E = α0exp (E/E0) (10)
where α is the absorption coefficient estimated from the measured absorbance, α0 is a constant, E is
the photon energy and E0 is an empirical parameter that depends on the defect concentration,
temperature and structural disorder.Plots of the natural logarithm of α vs. E are shown in Fig. 8, and
the reciprocal slopes imply E0 estimates of the defect concentration as summarized in Table 1.When
the calcination temperature increases the defect concentration of MoO3 decreases, and the α-MoO3
powder calcined at 500ºC had the lowest defect concentration (oxygen vacancies). Relative to the
h-MoO3 powders calcined at 200-400ºC it had red-shift in the band gap (higher band gap energy),
increased grain size [21], decreased defect density in the tail states, and relaxation of distorted or
dangling bonds [11].
3.7 Photochromic properties
Fig.9 shows the colour differences (ΔC) before and after UV irradiation for various times.
For all nanocrystallineMoO3 samples, the colour difference increased with UV irradiation time. The
photochromic mechanism of MoO3 is modeled by double insert/extraction of H+ ion from water
molecules adsorbed on MoO3 surface and electrons, to form hydrogen molybdenum bronze
(HxMoVxMoVI
1-xO3) as follows [8, 40]:
MoO3 + hv → MoO3 + e−+ h+ (11)
H2O + 2h+ → 2H+ + O (12)
MoO3 (clear) + xH+ + xe− → HxMoVxMoVI
1-xO3 (bluish) (13)
MoVIA + MoV
B ℎ𝑣→ MoV
A+ MoVIB (14)
The photochromic efficiency of h-MoO3 calcined at 200-300ºC was clearly better than that
of α-MoO3 calcined at 500ºC. This observed difference in photochromic properties may be explained
by differences in various factors.

1246
Fig.9 The colour differences (ΔC) as functions of UV irradiation time, for nanocrystalline
MoO3 powders calcined at various temperatures
Firstly, the h-MoO3 had better photochromic properties than the α-MoO3 matches the
general notion that metastable structures often provide new and improved properties relative to
thermodynamically stable structures [18]. The metastable h-MoO3 that is composed of zigzag chains
of MoO6 octahedra connected at cis-positions acts as a tunnel structure. This hexagonal tunneling
structure in metastable h-MoO3 provides channels for H+, and the intercalation of monovalent ions
facilitates electron-hole separation in the photochromic mechanism of Eq. (11). The trapped H+ ions
then form HxMoVxMoVI
1-xO3, observed in the photochromic properties. Meanwhile, the
thermodynamically stable orthorhombic MoO3 (α-MoO3) has an MoO6 octahedral base in its unit
cell, and all the MoO3 components share edges and corners forming a zigzag chains and a layered
structure, but the tunnel formation is missing from this structure [33].
Secondary, a low band gap energy promotes the formation of hydrogen molybdenum
bronze. The defect concentration (oxygen vacancies) contributes to the diffusion of protons
generated from the reaction of adsorbed water with holes (Eq.(12)), so these can easily diffuse into
the MoO3 lattice and combine with MoO3 to form HxMoVxMoVI
1-xO3 (Eq. (13)) and rapidly turns
deep blue. A low band gap energy and a high defect concentrations in h-MoO3 are probably the
primary reasons for its higher photochromic efficiency relative to α-MoO3. This agrees well with
the optical analysis in Fig.7 and Fig.8.
Finally, the amount of surface absorbed water on MoO3 might have been important. The
FT-IR results in Fig.4 show a lesser amount of–OH groups in the α-MoO3 (calcined at 500ºC) than
in the h-MoO3 (calcined at lower temperatures). This indicates that the moisture absorption on h-
MoO3 is higher than on α-MoO3, contributing to photochromic properties.
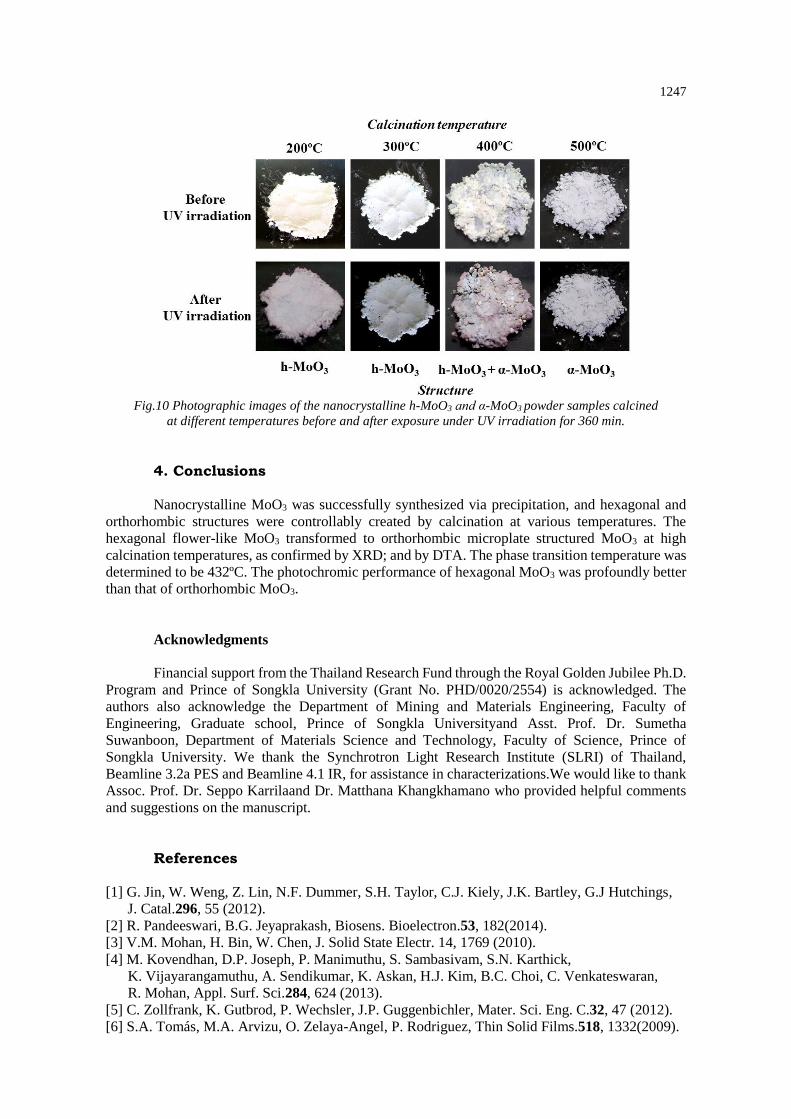
The photos in Fig.10 show nanocrystalline h-MoO3 and α-MoO3 powders before and after
360 minute UV irradiation. The h-MoO3 powders (200ºC and 300ºC) are white and pale-blue in
colour, changing to blue or deep blue with UV irradiation.In contrast, the α-MoO3 (500ºC) was pale-
gray and turned to deep-gray with similar UV exposure. The MoO3 calcined at 400ºC was
intermediate in nature, suggesting that initial white colour indicates h-MoO3 while pale-gray
indicates the α-MoO3, based on the XRD patterns in Fig.1. After 360 minute UV irradiation, the
white h-MoO3 powders distinctly turned deep-blue or pale purple, while the pale-gray α-MoO3
changes less dramatically due to its lesser photochromic properties. This agrees well with the
photochromic mechanisms discussed earlier.
1247
Fig.10 Photographic images of the nanocrystalline h-MoO3 and α-MoO3 powder samples calcined
at different temperatures before and after exposure under UV irradiation for 360 min.
4. Conclusions
Nanocrystalline MoO3 was successfully synthesized via precipitation, and hexagonal and
orthorhombic structures were controllably created by calcination at various temperatures. The
hexagonal flower-like MoO3 transformed to orthorhombic microplate structured MoO3 at high
calcination temperatures, as confirmed by XRD; and by DTA. The phase transition temperature was
determined to be 432ºC. The photochromic performance of hexagonal MoO3 was profoundly better
than that of orthorhombic MoO3.
Acknowledgments
Financial support from the Thailand Research Fund through the Royal Golden Jubilee Ph.D.
Program and Prince of Songkla University (Grant No. PHD/0020/2554) is acknowledged. The
authors also acknowledge the Department of Mining and Materials Engineering, Faculty of
Engineering, Graduate school, Prince of Songkla Universityand Asst. Prof. Dr. Sumetha
Suwanboon, Department of Materials Science and Technology, Faculty of Science, Prince of
Songkla University. We thank the Synchrotron Light Research Institute (SLRI) of Thailand,
Beamline 3.2a PES and Beamline 4.1 IR, for assistance in characterizations.We would like to thank
Assoc. Prof. Dr. Seppo Karrilaand Dr. Matthana Khangkhamano who provided helpful comments
and suggestions on the manuscript.
References
[1] G. Jin, W. Weng, Z. Lin, N.F. Dummer, S.H. Taylor, C.J. Kiely, J.K. Bartley, G.J Hutchings,
J. Catal.296, 55 (2012).
[2] R. Pandeeswari, B.G. Jeyaprakash, Biosens. Bioelectron.53, 182(2014).
[3] V.M. Mohan, H. Bin, W. Chen, J. Solid State Electr. 14, 1769 (2010).
[4] M. Kovendhan, D.P. Joseph, P. Manimuthu, S. Sambasivam, S.N. Karthick,
K. Vijayarangamuthu, A. Sendikumar, K. Askan, H.J. Kim, B.C. Choi, C. Venkateswaran,
R. Mohan, Appl. Surf. Sci.284, 624 (2013).
[5] C. Zollfrank, K. Gutbrod, P. Wechsler, J.P. Guggenbichler, Mater. Sci. Eng. C.32, 47 (2012).
[6] S.A. Tomás, M.A. Arvizu, O. Zelaya-Angel, P. Rodriguez, Thin Solid Films.518, 1332(2009).

1248
[7] M. Dhanasankar, K.K. Purushothaman, G. Muralidharan, Solid State Sci.12, 246(2011).
[8] Y. Shen, R. Huang, Y. Li, S. Yao, Appl. Surf. Sci.258, 414(2011).
[9] Z. Shen, G. Chen, Y. Yu, Q. Wang, C. Zhou, L. Hao, Y. Li, L. He, R. Mu, J. Mater. Chem.
22, 19646(2012).
[10] M. Dhanasankar, K.K. Purushothaman, G. Muralidharan, Appl. Surf. Sci.257, 2074(2011).
[11] I. Navas, R. Vinodkumar, V.P.M. Pilliai, Appl. Phys. A.103, 373 (2011).
[12] A. Bouzidi, N. Benramdane, H. Tabet-Derraz, C.Mathieu, B. Khelifa, R. Desfeux, Mater. Sci.
Eng. B.97, 5(2003).
[13] Y.J. Lee, C.W. Park, D.G. Kim, W.T. Nichols, S.T. Oh, Y.D. Kim, J. Ceram. Process. Res.
11, 52(2010).
[14] J. Song, X. Ni, L. Gao, H. Zheng, Mater. Chem. Phys.102, 245 (2007).
[15] G.G. Allogho, P.V. Ashrit, Thin Silid Films.520, 2326 (2012).
[16] A.D. Sayede, T. Amriou, M. Pernisek, B. Khelifa, C. Mathieu, Chem. Phys.316, 72(2005).
[17] R. Irmawati, M. Shafizah, Int. J. Basic Appl. Sci.09, 34 (2009).
[18] O. Mougin, J. Dubois, F. Mathieu, A. Rousset, J.Solid State Chem.152, 353 (2000).
[19] K. Srinivasa Rao, K.V. Madhuri, S. Uthanna, O.M. Hussain, C. Julien, Mater. Sci. Eng. B.
100, 79(2003).
[20] J.N. Yao, Y.A. Yang, B.H. Loo, J. Phys. Chem. B.102, 1856 (1998).
[21] A.Gaber, M.A. Abdel-Rahim, A.Y. Abdel-Latif, M.N. Abdel-Salam, Int. J. Electrochem. Sci.
9, 81 (2014).
[22] R.W. Kelsall, I.W. Hamley, M. Geoghegan, Nanoscale Science and Technology, John Wiley
and Sons, West Sussex (2005).
[23] A. Chithambararaj, A.C. Bose, Beilstein J. Nanotechnol.2, 585 (2011).
[24] R.S. Mann, K.C. Khulbe, B. Chem. Soc. Jpn.48, 1021 (1975).
[25] K. Manukyan, D. Davtyan, J. Bossert, S. Kharatyan, Chem. Eng. J.168, 925(2011).
[26] S. Bai, S. Chen, L. Chen, K. Zhang, R. Luo, D. Li, C.C. Liu, Sensors Actuat. B- Chem.
174, 51(2012).
[27] R.F. de Farias, J. Phys. Chem. Solids.64, 1241(2003).
[28] R.L. Penn, J.F. Banfield, Geochim. Cosmochim. Ac. 63, 1549(1999).
[29] P. Wongkrua, T. Thongtem, S. Thongtem, J. Nanomater.2013, 1 (2013).
[30] T.H. Chiang, H.C. Yeh, J. Alloy. Compd.585, 535 (2014).
[31] A. Klinbumrung,T. Thongtem, S. Thongtem, J. Nanomater.2012, 1 (2012).
[32] L. Zheng, Y. Xu, D. Jin, Y. Xie, Chem. Mater.21, 5681 (2009).
[33] Z. Li, L. Gao, S. Zheng, Mater. Lett.57, 4605 (2003).
[34] G.E. Buono-Core, G. Cabello, A.H. Klahn, A. Lucero, M.V. Nuñez, B. Torrejón, C. Castillo,
Polyhedron.29, 1551(2010).
[35] J. Wlatowska-Mrowlecka, S.D. Diesbach, V. Maurice, S. Zanna, L. Klein, E. Briand,
I. Vickridge, P. Marcus, J. Phys. Chem. C.112, 11050 (2008).
[36] S. Suwanboon, P. Amornpitoksuk, A. Sukolrat, Ceram. Int.37, 1359 (2011).
[37] Z. Hussain, J. Mater. Res.16, 2695 (2001).
[38] P. Jittiarporn, L. Sikong, K. Kooptarnond, W. Taweepreda, Ceram. Int.40, 13487 (2014).
[39] P. Jitti-a-porn, S. Suwanboon, P. Amornpitoksuk, O. Patarapaiboolchai, J. Ceram. Process.
Res.12, 85 (2011).
[40] Y. Shen, R. Huang, Y. Cao, P. Wang, Mater. Sci. Eng. B.172, 237 (2010).


![Nordic Concrete Research · 2018. 12. 21. · compressive strength [10, 15-19]. Besides the mineralogy and calcination temperature, other parameters during production potentially](https://static.fdocuments.in/doc/165x107/6127d57ef42f6b281655b92d/nordic-concrete-research-2018-12-21-compressive-strength-10-15-19-besides.jpg)