Osteosynthesis of Displaced Intra-Articular Calcaneal Fractures

UNIVERSITEIT GENT
Faculteit Geneeskunde en Gezondheidswetenschappen
Academiejaar 2011-2012
Influence of birth weight on calcaneal bone stiffness
in Belgian pre-adolescent children
Scientific Article
Masterproef voorgelegd tot het behalen van de graad van
Master in de Verpleegkunde en de Vroedkunde
Door Karen Van den Bussche
Promotor: dr. Isabelle Sioen
Co-promotor: Nathalie Michels
1
Influence of birth weight on calcaneal bone stiffness in Belgian pre-
adolescent children
Karen Van den Bussche1, Nathalie Michels
1, Luis Gracia-Marco
2,3, Diana Herrmann
4, Gabriele Eiben
5,
Stefaan De Henauw1,6
, Isabelle Sioen1,7
, on behalf of the IDEFICS consortium
1 Department of Public Health, Ghent University, UZ 2 Blok A, De Pintelaan 185, 9000 Ghent,
Belgium
2 GENUD (Growth, Exercise, NUtrition and Development) Research Group, University of Zaragoza,
C/ Corona de Aragon 42, 50009 Zaragoza, Spain
3 School of Sport and Health Sciences, University of Exeter, Heavitree Road, Exeter, EX12LU, UK.
4 BIPS - Institute for Epidemiology and Prevention Research GmbH, Achterstrasse 30, D-28359
Bremen, Germany
5 Department of Pediatrics, Institute of Clinical Sciences, The Queen Silvia Children’s Hospital,
Sahlgrenska Academy at University of Gothenburg, 416 85 Göteborg, Sweden
6 Department of Health Sciences, Vesalius, University College Ghent, Keramiekstraat 80, 9000 Ghent,
Belgium
7 FWO, Research Foundation Flanders, Egmontstraat 5, 1000 Brussels, Belgium
Corresponding author: Karen Van den Bussche, Department of Public Health, Ghent University, UZ
2 Blok A, De Pintelaan 185, B-9000 Ghent, Belgium. Email: [email protected]; Telephone:
+32 494 05 35 87.
DISCLOSURES: NONE
Keywords: birth weight; children; calcaneal quantitative ultrasound; bone stiffness
Running title: Birth weight and bone stiffness in children

2
Abstract
Purpose: The aim of this study was to investigate the relation between birth weight and calcaneal
bone stiffness in a large sample of Belgian healthy pre-adolescent children.
Methods: Participants were 827 children (3.6–11.2 y, 51.6% boys) from the Belgian cohort of the
IDEFICS study. Birth weight was obtained using a parental questionnaire and quantitative ultrasound
(QUS) measurements were performed to determine the calcaneal Broadband Ultrasound Attenuation
(BUA), Speed of Sound (SOS) and Stiffness Index (SI) using Lunar Achilles Device.
Results: The average birth weight was 3435.7 ± 512.0 g for boys and 3256.9 ± 471.1 g for girls. The
average calcaneal QUS measurements were equal to 89.6 ± 24.0 (23.3 to 153.9) dB/MHz for BUA,
1621.4 ± 49.6 (1516.3 to 1776.5) m/sec for SOS and 92.8 ± 15.6 (49.0 to 163.0) for SI. Birth weight
was positively associated with BUA (r = 0.128; p = 0.002) and with SOS (r = -0.157; p < 0.001). The
associations remained after correcting for age and sex in multiple regression analyses, but disappeared
after correcting for anthropometric covariates.
Conclusion: Our findings suggest that birth weight, as a rough proxy indicator for genetic and
environmental influences during intrauterine life, is associated with BUA and SOS in pre-adolescent
children and may therefore influence the risk of osteoporosis later in life. Further studies using QUS
are needed to investigate the consistency of the results of this study.

3
Introduction
Osteoporosis is one of the most widespread, costly and debilitating diseases in Europe [1,2]. The
World Health Organization (WHO) defined osteoporosis as a progressive systemic skeletal disease
that is characterized by low bone mass and microarchitectural deterioration of bone tissue, with a
consequent increase in bone fragility and in fracture risk [3]. This skeletal disease most often appears
acutely in the form of a fracture at high age, but the origin can be found at much younger age, with
two major factors determining the increased fracture risk: achieved peak bone mass during the third
life decade and the rate of bone loss thereafter [4, 5]. Peak bone mass is almost entirely achieved in the
first two decades of life and the amount is determined by heredity, calcium and vitamin D intake
through nutrition, hormones, physical activity and other lifestyle factors (e.g. tobacco and alcohol use)
[6-12]. To attain the maximal peak bone mass in healthy children and adolescents, and prevent
osteoporosis later in life, public health strategies should address on all fronts starting at very early age.
Recent studies investigated other early determinants of osteoporosis of which birth weight is one of
them. At this stage, several studies have shown associations between birth weight and adult bone mass
[13-17]. It is uncertain whether that influence of birth weight is already visible in childhood. Several
studies with varying sample sizes (from 64 till 6876) investigated birth weight and bone health in
children between the ages of 6 and 10 years old; most of them analyzed different bone sites with dual
energy X-ray absorptiometry (DXA) [18-23] and one study used quantitative ultrasound (QUS) in this
age group [24]. The study results are hard to compare and are not conclusive. Moreover, no literature
is available for children at pre-school age. Generally, no recent studies investigating the influence of
birth weight on bone health in young Belgian children are available. To provide more in depth
knowledge on the relation between birth weight and bone health in young children, this study
investigated a large sample of Belgian, healthy pre-school and primary school children.
To determine the bone strength in these children, QUS was used in this study, an easy to use, radiation
free, portable and cost-effective tool [25]. Two associated parameters Speed of Sound (SOS) and
Broadband Ultrasound Attenuation (BUA) were determined. These QUS parameters are related to
trabecular bone, the most metabolic active bone tissue, with a higher variation rate compared to

4
cortical bone tissue. QUS can be measured at different sites (e.g. at the phalangeal or the tibia) of
which the calcaneus is the most popular site since it consists almost entirely of trabecular bone [25,
26]. So far, the number of studies using QUS to investigate the relationship between birth weight and
bone strength in pre- and primary school children are limited [24].
Therefore, the purpose of this research is to further investigate the influence of birth weight as
independent variable on bone strength assessed by calcaneal bone stiffness in a large sample of healthy
children at prepubertal age.

5
Materials and methods
Subjects
The subjects are participants of the Belgian cohort of the EU 6th Framework Programme IDEFICS
study (Identification and prevention of Dietary- and lifestyle-induced health EFfects In Children and
infantS; www.idefics.eu). The IDEFICS study is a unique longitudinal and multicenter study
investigating factors that influence the health, growth and development of European children with
emphasis on obesity and its co-morbid conditions. The study was conducted in eight European
countries and included two measurement periods: a baseline survey in 2007 – 2008 and a follow-up
survey in 2009-2010. In this paper, only the data of the Belgian IDEFICS participants are used and the
bone parameters used in this paper were collected in 2009 – 2010. The participating Belgian children
are residents from two regions in the Northern Dutch-speaking part of Belgium: the city of Aalter
(51°05’N, March-June 2010) and the city of Geraardsbergen (50°46’ N, October 2009 – February
2010). At baseline, the children were contacted using random cluster sampling (all children from a
selection of classes from all schools in the control and intervention cities) [27-30]. For the purpose of
this analysis, data of 827 children aged 3 – 11 years old (427 boys and 400 girls, mean age 7.7 ± 1.5
years) were available (227 children from Geraardsbergen en 600 children from Aalter) in which QUS
measurements were performed and data on birth weight was available. Twins or triplets were excluded
since multiple birth influences the birth weight. The study was conducted according to the guidelines
laid down in the Helsinki Declaration of the World Medical Association. The project protocol was
approved by the Ethical Committee of the Ghent University Hospital. Written informed consent was
obtained from all parents of the participating children.
Measurements
1. Questionnaire
A self-administered parental questionnaire was used to obtain information on the following variables:
sex of the child, birth date, birth length and birth weight. The age of the child at time of examination
was calculated using date of birth and date of examination.

6
2. Quantitative Ultrasound
QUS measurements were performed with a Lunar Achilles Insight (GE Healthcare, Milwaukee, WI).
This portable device measures bone stiffness using ultrasound waves. The first outcome parameter
BUA reflects the absorption of sound waves and is expressed as decibels per megahertz (n = 596). The
second parameter SOS expresses the stiffness of a material by the ratio of the traversed distance to the
transit time, in meter per second (n = 600). The more complex the bone structure, the more sound
waves will be absorbed. The Stiffness Index (SI) is a third, derived, parameter (n = 827). SI is
calculated by a linear combination of BUA and SOS (SI= (0.67 x BUA) + (0.28 x SOS – 420)) [31,
32]. The real time image of the calcaneus and the Region of Interest (ROI) ensures that the
measurement is precise. During the entire study period, daily calibration was done and measurements
were made according to the standard procedure provided by the manufacturer. The use of an adapter
for the children’s feet ensured the proper position of the calcaneus. The main heel bones (os calcis) of
both feet were measured once and the mean of both measurements was calculated and used in the
statistical analyses. The overall QUS measurement required about ten minutes per child.
3. Anthropometric measurements and body composition
Anthropometric measurements were performed by two trained researchers. Height was measured with
a standard clinical Seca 224 stadiometer (Seca GmbH & Co. KG., Hamburg, Germany) to the nearest
0.1 cm. Weight was determined with a standard balance (Tanita BC 420 SMA; Tanita, Amsterdam,
The Netherlands) to the nearest 0.1 kg, without shoes and in light clothing. The two measurement
instruments did not need further calibration or maintenance except the daily verification of the degree
of horizontality. The Tanita balance (adapted to the small foot size of children) also measured leg-to-
leg impedance (ohm). The Tyrrell formula was used to calculate the fat-free mass (FFM, in kg) based
on this impedance value [33]. To take weight into account, %FFM was computed using the
formula %FFM = (FFM/weight)*100.
Body mass index (BMI) was computed according to the following formula: BMI = weight (kg)
/height² (m²) [34]. Z-scores of each child’s weight, height and BMI was determined using the LMS
method (with British reference population) which summarizes the distribution of this variables at each
age by its median and coefficient of variation, plus a measure of skewness based on the Box-Cox

7
power required to transform the data to normality [35]. Waist and hip circumferences were measured
using a Seca 200 inelastic tape (Seca GmbH & Co. KG., Hamburg, Germany, precision 0.1 cm, range
0-150 cm), which did not need any calibration. The ratio of waist/hip circumference was calculated
and used in the analyses. A Holtain skinfold caliper (Holtain Ltd., Crosswell, UK, range 0-40 mm)
was used to measure skinfold thickness at the previously marked points. The calipers were calibrated
every morning and additionally when dropped by means of a calibration block of 20 mm. Skinfold
measurements were obtained at two sites (triceps and subscapular) according to the International
standards for anthropometric assessment (ISAK) [36]. Skinfold thickness was measured twice at each
site and the mean of both measurements was calculated. If both measurements differed more than 2
mm, a third measurement was performed and the mean was calculated between the two closer values
differing less than 2 mm. Additionally, the sum of both skinfold thicknesses were computed and used
as indicator of the fat distribution in the upper limbs.
Statistical analysis
After logarithmic transformation of the tricipital skinfold thickness, the subscapular skinfold thickness,
the sum of both and the waist/hip ratio, all the residuals showed a satisfactory pattern (normal
distribution). Descriptive data by sex were examined with independent samples T-tests (for normally
distributed variables) and Mann-Whitney U tests (for non-normally distributed variables). Since an
interaction between sex and the bone variables was not observed (p > 0.05), boys and girls were
analysed together. Pearson correlation coefficients were performed to define potential confounders in
the association bone – birth weight. Stepwise multiple regression analysis was used to find the best
models predicting the dependent variables BUA, SOS and SI respectively. Birth weight was included
as an independent variable and sex and age were included as confounders in all analyses, since sex had
an influence on birth weight and age on anthropometric variables. Different variables were included as
covariates in multiple models, separate for BUA, SOS and SI. All statistical measurements were
obtained using the PASW Statistics Program version 20.0.0 (SPSS Inc, IBM, IL, USA) and statistical
results with p < 0.05 were considered as statistically significant.

8
Results
Subject characteristics
Information of the boys and girls early life factors, body composition and current characteristics are
summarized in table 1. The mean birth weight, birth length and the mean %FFM were slightly higher
in boys compared to girls (p < 0.001). Tricipital, subscapular and the sum of both skinfold thicknesses
were higher in girls compared to boys (p < 0.001). No sex differences in bone parameters were found.
Table 1. Descriptive characteristics of the studied children by sex Mean ± standard deviation (SD)
Boys Girls P-value
(n = 427) (n = 400) (sex difference)
Early life factors
Birth weight (g)
3435.7 ±
512.0
3256.9 ±
471.1 < 0.001
Birth height (cm) 50.6 ± 2.3 49.7 ± 2.6 < 0.001
Current subject characteristics
Calcaneal BUA (dB/MHz) 91.4 ± 25.3 87.7 ± 22.6 0.066
Calcaneal SOS (m/sec) 1621.2 ± 47.3 1621.6 ± 51.9 0.925
Calcaneal SI 93.7 ± 15.5 91.9 ± 15.6 0.097
Age (years) 7.8 ± 1.5 7.7 ± 1.6 0.244
Height z-score 0.4 ± 1.0 0.3 ± 1.1 0.203
Height (cm) 128.6 ± 10.7 127.3 ± 10.5 0.087
Weight z-score 0.2 ± 1.0 0.1 ± 1.1 0.765
Weight (kg) 26.5 ± 6.0 26.3 ± 6.5 0.555
BMI z-score -0.1 ± 1.0 -0.1 ± 1.2 0.684
Waist/hip ratio* 0.9 – 0.05 0.85 – 0.06 0.066
Tricipital skinfold thickness (mm)* 8.75 – 3.5 10.9 – 4.9 < 0.001
Subscapular skinfold thickness (mm)* 5.4 – 1.5 6.4 – 2.9 < 0.001
Sum skinfolds (mm)* 14.1 – 4.4 17.2 – 7.7 < 0.001
Fat-free mass (%) 75.9 ± 5.4 69.7 ± 10.1 < 0.001
SI: Stiffness Index; BUA: Broadband Ultrasound Attenuation; SOS: Speed of Sound; IOTF:
International Obesity Task Force; * Mann-Whitney U test. Median – Interquartile range (IQR)

9
Correlation coefficients
Correlation analyses between birth weight and bone measurements are presented in Figure 1.
Significant correlations were found between birth weight and SOS (r = -0.157; p < 0.001) as well as
between birth weight and BUA (r = 0.128; p = 0.002). No association has been observed between birth
weight and SI. Table 2 shows the correlation coefficients between the calcaneal bone parameters
(BUA, SOS and SI), age and anthropometric variables. BUA and SOS were significantly associated
with age and all the anthropometric variables (all p < 0.05), except for the association between SOS
and %FFM (p = 0.316). SI was significantly correlated with height, weight, FFM and %FFM (all p <
0.05). Generally, the skinfolds and BMI z-score had a weak association with the bone parameters in
contrast to the variables height, weight and waist z-score. FFM was strongly associated with BUA,
SOS and SI (all p < 0.001) but that association weakened when using the %FFM. The anthropometric
variables height, weight and fat-free mass were further analyzed in stepwise multiple regression
analysis due to high correlation coefficients. The variables birth length, BMI z-score, waist z-score,
waist/hip ratio and the skinfolds thicknesses were not retained because of low correlation coefficients.
r = 0.128; p = 0.002; n = 596 r = -0.157; p < 0.001; n = 600 r = -0.024; p = 0.496; n = 827
Figure 1. Correlation (Pearson) of birth weight and calcaneal BUA, SOS and SI

10
Table 2. Results of Pearson’s correlations between bone parameters and anthropometric variables
BUA (dB/MHz) SOS (m/sec) SI
n = 596 n = 600 n = 827
Age (years) 0.489*** -0.451*** 0.171***
Birth length (cm) 0.156*** -0.151*** 0.003
Height z-score 0.303*** -0.356*** 0.016
Height (cm) 0.574*** -0.571*** 0.153***
Weight z-score 0.293*** -0.377*** 0.005
Weight (kg) 0.527*** -0.574*** 0.111***
BMI z-score 0.163*** -0.257*** -0.014
Waist z-score 0.236*** -0.343*** 0.005
Waist/hip ratio (log) -0.171*** 0.163*** -0.010
Tricipital skinfold thickness (log) 0.117** -0.254*** -0.060
Subscapular skinfold thickness (log) 0.146*** -0.257*** -0.030
Sum skinfolds (log) 0.139*** -0.273*** -0.048
Fat-free mass (kg) 0.570*** -0.552*** 0.164***
Fat-free mass (%) 0.083* 0.041 0.094**
***≤ 0.001; **< 0.010; *<0.050; BMI: Body Mass Index; (log): log-transformed variables
Stepwise multiple regression
Multiple regression analyses were performed to explore independent variables (including birth weight)
influencing BUA, SOS and the calculated parameter SI. Table 3 shows the association between
calcaneal BUA and birth weight. Model A shows raw data, Model B = Model A + sex and age
(confounders), Model C = Model B + weight z-score, Model D = Model C + %FFM and Model E =
Model C + height z-score. Height z-score and %FFM could not be together in the model due to
multicollinearity, a high correlation between both covariates. Birth weight retained a positive
association with BUA after controlling for age and sex (model B) but showed no significant
associations after controlling for anthropometric variables (model C, D and E). Sex was not associated
with BUA in any model. Age influenced BUA in four models except in model C where weight z-score
was added. Finally, weight z-score, %FFM and height z-score were significantly associated with BUA.
The adjusted R² was low for model A (R² = 0.015) but higher after controlling in the other models.
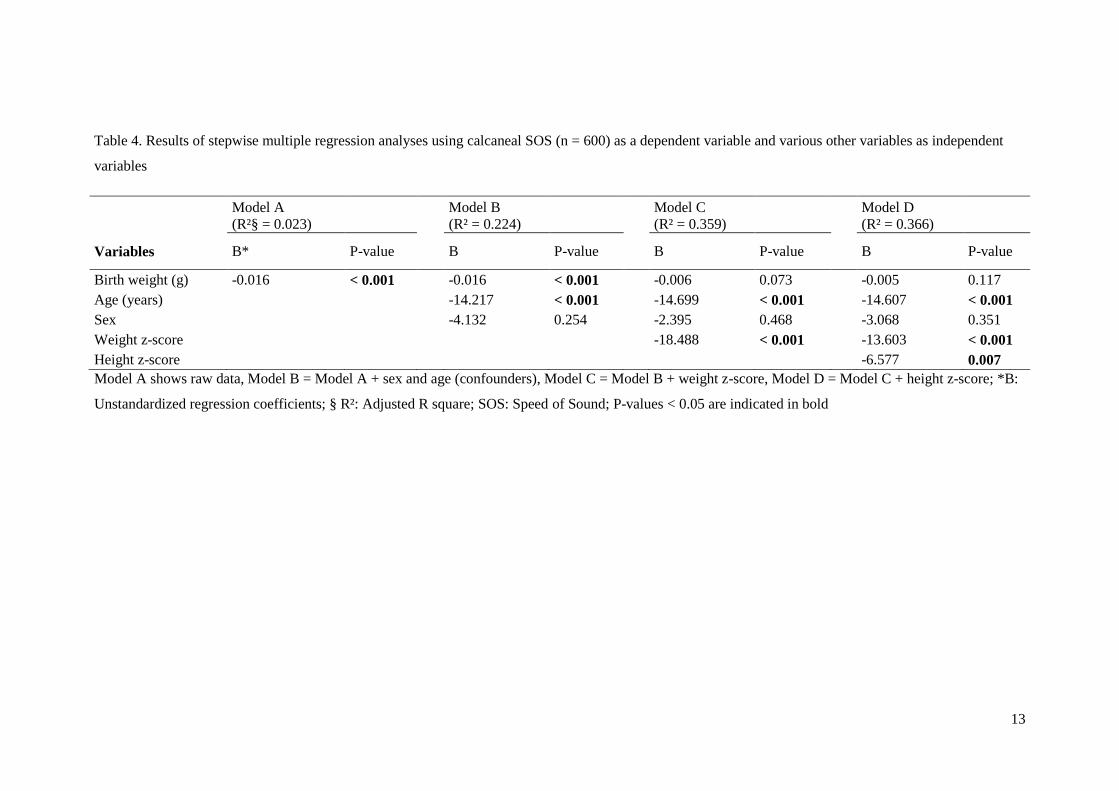
Table 4 shows the association between calcaneal SOS and birth weight. Model A shows raw data,
Model B = Model A + sex and age (confounders), Model C = Model B + weight z-score, Model D =
Model C + height z-score. Birth weight retained a negative association with SOS, also after controlling

11
for age and sex (model B) but showed no significant associations after adjusting for weight z-score
(model C) and height z-score (model D). Age, weight z-score and height z-score were independently
associated with SOS. As was the case for calcaneal BUA, sex had no influence on calcaneal SOS. The
unadjusted model A explained less of the variation in SOS than the adjusted models. Table 5 shows
the association between calcaneal SI and birth weight. Model A shows raw data, Model B = Model A
+ sex and age (confounders) and Model C = Model B + %FFM. In line with the insignificant
univariate correlation between birth weight and SI, birth weight did not predict SI in any of the
regression models. Age was the only predictor of SI (p < 0.001). The variable %FFM did not show
significant associations with SI. The adjusted R² was very low in all models.

12
Table 3. Results of stepwise multiple regression analyses using calcaneal BUA (n = 596) as a dependent variable and various other variables as independent
variables
Model A
(R²§ = 0.015)
Model B
(R² = 0.252)
Model C
(R² = 0.338)
Model D
(R² = 0.351)
Model E
(R² = 0.346)
Variables B* P-value B P-value B P-value B P-value B P-value
Birth weight (g) 0.006 0.002
0.006 0.001
0.002 0.230
0.002 0.339
0.002 0.994
Age (years)
7.422 < 0.001
7.616 0.510
7.442 < 0.001
7.566 < 0.001
Sex
-1.565 0.367
-2.165 0.185
-0.013 0.994
-1.824 0.262
Weight z-score
7.166 < 0.001
8.255 < 0.001
4.534 < 0.001
FFM (%)
0.374 < 0.001
Height z-score
3.537 0.003
Model A shows raw data, Model B = Model A + sex and age (confounders), Model C = Model B + weight z-score, Model D = Model C + %FFM and Model
E = Model C + height z-score; *B: Unstandardized regression coefficients; § R²: Adjusted R square; FFM (%): percentage fat-free mass (lean mass); BUA:
Broadband Ultrasound Attenuation; P-values < 0.05 are indicated in bold
13
Table 4. Results of stepwise multiple regression analyses using calcaneal SOS (n = 600) as a dependent variable and various other variables as independent
variables
Model A
(R²§ = 0.023)
Model B
(R² = 0.224)
Model C
(R² = 0.359)
Model D
(R² = 0.366)
Variables B* P-value B P-value B P-value B P-value
Birth weight (g) -0.016 < 0.001
-0.016 < 0.001
-0.006 0.073
-0.005 0.117
Age (years)
-14.217 < 0.001
-14.699 < 0.001
-14.607 < 0.001
Sex
-4.132 0.254
-2.395 0.468
-3.068 0.351
Weight z-score
-18.488 < 0.001
-13.603 < 0.001
Height z-score
-6.577 0.007
Model A shows raw data, Model B = Model A + sex and age (confounders), Model C = Model B + weight z-score, Model D = Model C + height z-score; *B:
Unstandardized regression coefficients; § R²: Adjusted R square; SOS: Speed of Sound; P-values < 0.05 are indicated in bold

14
Table 5. Results of stepwise multiple regression analyses using calcaneal SI (n = 827) as a dependent variable and various other variables as independent
variables
Model A
(R²§ = -0.001)
Model B
(R² = 0.029)
Model C
(R² = 0.032)
Variables B* P-value B P-value B P-value
Birth weight (g) -0.001 0.496
-0.001 0.344
-0.001 0.391
Age (years)
1.694 < 0.001
1.649 < 0.001
Sex
-1.770 0.104
-0.935 0.423
FFM (%)
0.123 0.067
Model A shows raw data, Model B = Model A + sex and age (confounders) and Model C = Model B + %FFM; *B: Unstandardized regression coefficients; §
R²: Adjusted R square; FFM (%): percentage fat-free mass (lean mass); SI: Stiffness Index; P-values < 0.05 are indicated in bold

15
Discussion
This study investigated the relationship between birth weight and bone strength assessed as calcaneal
BUA, SOS and SI–values measured by QUS in 827 healthy children, aged 3 to 11 years. The main
findings were that birth weight was significantly positively correlated with BUA and significantly
negatively correlated with SOS even after correction for age and sex in multiple regression analyses.
When adjusting for other covariates such as weight and height, the association with birth weight did
not persist. No significant correlation was found between birth weight and SI. Sex had no influence on
bone strength and age was positively related with BUA and SI and negatively related with SOS.
Inconsistent results exist on the effect of birth weight on bone strength in pre-adolescent populations.
Both Liao et al. [37] and Micklesfield et al. [24] investigated the influence of birth weight on bone
properties using QUS measurements at the tibia and calcaneus, respectively. Liao et al. concluded that
birth weight had a positive influence on bone strength at the age of three months in 542 Chinese
children [37], while no significant correlations were found between birth weight and BUA and SOS in
109 South-African children between the ages of 7 and 9 years [24]. The first study is not comparable
with our study sample due to differences in nationality and age of the population, while the second
study examined the same bone site as in our study but the mixed ancestral origin, smaller sample size
or the use of the nondominant calcaneus could possibly explain the lack of evidence supporting this
association [24].
Four studies investigated the influence of birth weight, with correlation analyses, on bone properties
using total body DXA measurements [18-21]. Ganpule et al. assessed total body bone mass density
(BMD) in 698 Indian children aged 6 years old and concluded that birth weight was positively
correlated with increased total body BMD [18]. Macdonald-Wallis et al. assessed different bone
properties at spine bone and total body in 6877 nine year old children and found similar positive
correlations with birth weight [20]. Micklesfield et al. examined 64 children between 7 and 9 years old
with DXA and did not found any positive correlations with birth weight whereby the dissimilarity in
sample size and method of measurement could explain the different results [21]. Finally Jones &
Dwyer investigated BMD of the lumbar spine and femoral neck in 330 Australian children at the age

16
of 8 and concluded that birth weight has an influence on femoral neck BMD but not on lumbar spine
BMD [19].
Summarized, six studies examined correlations between birth weight and different bone parameters in
prepubertal children, without taking potential confounders into account. Half of the studies draw
similar conclusions as we did. The other half did not found any relationship between birth weight and
bone health which could be explained by differences in study population and design.
Only four studies investigating the relation between birth weight and bone health in pre-adolescent
children considered also the role of potential covariates [19, 22, 23, 38]. In these studies, bone
properties were measured using DXA: at the lumbar spine and femoral neck by Jones & Dwyer [19],
the total body by Steer & Tobias [22], the lumbar spine, femoral neck and total body by Vidulich et al.
[23] and total body and lumbar spine by Ay et al. [38]. Ay et al. examined 252 Dutch children at the
age of 6 months and found an influence of birth weight on BMD and bone mineral content (BMC)
after correcting for sex, gestational age and current age [38]. Unlike our study, Ay et al. did not add
other potential covariates such as anthropometric variables in the regression model. Steer & Tobias
found similar results in 109 nine year old children when only correcting for sex, age and gestational
age. However, after additionally correcting for parental weight and height in a second model and the
child’s weight and height in a third model, this association decreased but was still significant with
exception of BMC and bone area (BA) in the third model [22]. Similar effects were found in 330
Australian eight year old children: a relationship between birth weight and BMD when correcting for
sex and growth variables and even when additionally correcting for breastfeeding, maternal smoking
during pregnancy, calcium intake, sunlight exposure and sports participation [19]. However, the
association disappeared after additionally correcting for maternal BMD. Also, in 476 ten year old
South-African children with mixed ancestral origin no association between birth weight and bone
health was found after adjusting for bone age, sex, race, socio-economic status, current height and
weight [23]. Taken together, our research – having the advantage that radiation-free QUS was used –
gave similar results as literature using bone health parameters assessed by DXA: an association
between birth weight and bone health parameters after correcting for age and sex, but less or no
association after correcting for additional confounders.

17
Strengths and limitations of the study
The strength of this study is the availability of a large representative population-based sample of both
boys and girls from Belgian pre-school and primary school. Compared to other studies investigating
birth weight and bone health in childhood, this cohort has a large sample from a previously unexplored
age group (from 3 till 11 years). Data on early life factors, QUS measurements and a large battery of
anthropometric measurements were complete for all 827 children. Consequently, the analyses could be
corrected for potential confounders (age, sex and anthropometric variables). To ensure quality, trained
researchers performed the QUS and anthropometric measurements. For the QUS measurement both
feet (os calcis) were measured which has the advantage of showing bone metabolic changes first since
it consist for 90% of trabecular bone and has a high turnover rate [39]. The average of the parameters
measured at the left foot and at the right foot was calculated. In literature, different approaches can be
found: some measure the right foot [40], the left foot [41, 42], twice the dominant leg [43] or scan both
but choose the left foot when no difference in results [44]. Taking two feet into account could increase
the accuracy.
Nevertheless, this study has some drawbacks as well. First important limitation is the absence of an
exact gestational age per child as this could be an important potential confounder [18, 20, 37, 38]. A
second limitation is the difference between the number of primary school children (n = 685) and pre-
school children (n = 142). Therefore, analyses were not divided in age groups but age was added as a
confounder in all analyses. Finally, a few remarks on the bone measurements with the QUS method.
First, with this method light inaccurate measurements can occur due to difficult positioning and
immobilization of the small feet in children. Therefore trained and only a limited number of
researchers were used to obtain the QUS data. Second, the original BUA and SOS values measured by
the QUS were not available for all participants in BUA (n = 596) and SOS (n = 600) compared to SI (n
= 827), due to different registration settings of the measuring device. Finally, the QUS method is a
practical device, but is not yet accepted as a standard measurement method in children [45].
Nevertheless, using the radiation-free QUS could increase the participation ratio in a child population,
which is necessary in this kind of research.
18
Conclusion
The present findings support the hypothesis that birth weight, a proxy indicator of genetic intrauterine
environmental factors, may have long-term impact on bone health and may be associated with the risk
of osteoporosis much later in life. As a result, this study points towards the importance of a normal
birth weight even in healthy children (including preschool children). Public health strategies should
insist also on the importance of a normal birth weight as a basis for prevention of chronic diseases
later in life. Guaranteeing optimal birth weight helps attaining maximal peak bone mass and could
even prevent osteoporosis later in life. Further research could investigate whether the findings of this
study are consistent in large study samples when using the QUS method as well.

19
Acknowledgment
This work was done as part of the IDEFICS Study (http://www.idefics.eu). We gratefully
acknowledge the financial support of the European Community within the Sixth RTD Framework
Programme Contract No. 016181 (FOOD). The authors also wish to thank the IDEFICS children and
their parents who generously volunteered and participated in this project. Isabelle Sioen is financially
supported by the Research Foundation - Flanders (Grant n°: 1.2.683.11.N.00). The information in this
document reflects the authors’ view and is provided as is.

20
Reference List
[1] Holroyd C, Cooper C, Dennison E. Epidemiology of osteoporosis. Best Pract Res Clin
Endocrinol Metab 2008;22:671-85.
[2] Melton LJ, Cooper C. Magnitude and Impact of Osteoporosis and Fractures. In: Marcus R,
Feldman D, Kelsey J, editors. Osteoporosis. San Diego: Academic Press; 2001; p. 557-67.
[3] Genant HK, Cooper C, Poor G, Reid I, Ehrlich G, Kanis J et al. Interim report and
recommendations of the World Health Organization Task-Force for Osteoporosis. Osteoporos
Int 1999;10:259-64.
[4] Specker BL, Namgung R, Tsang RC. Bone Mineral Acquisition in Utero, during Infancy and
throughout Childhood. In: Marcus R, Feldman D, Kelsey J, editors. Osteoporosis. San Diego:
Academic Press; 2001; p. 599-620.
[5] Rizzoli R, Bianchi ML, Garabedian M, McKay HA, Moreno LA. Maximizing bone mineral
mass gain during growth for the prevention of fractures in the adolescents and the elderly.
Bone 2010;46:294-305.
[6] Gracia-Marco L, Vicente-Rodriguez G, Casajus JA, Molnar D, Castillo MJ, Moreno LA.
Effect of fitness and physical activity on bone mass in adolescents: the HELENA Study. Eur J
Appl Physiol 2011;111:2671-80.
[7] Gracia-Marco L, Ortega FB, Casajus JA, Sioen I, Widhalm K, Beghin L et al. Socioeconomic
Status and Bone Mass in Spanish Adolescents. The HELENA Study. J Adolesc Health
2012;50:484-90.
[8] Gracia-Marco L, Ortega FB, Jimenez-Pavon D, Rodriguez G, Castillo MJ, Vicente-Rodriguez
G et al. Adiposity and bone health in Spanish adolescents. The HELENA study. Osteoporos
Int 2012;23:937-47.
[9] Rizzoli R, Bonjour JP, Ferrari SL. Osteoporosis, genetics and hormones. J Mol Endocrinol
2001;26:79-94.
[10] Suda T, Ueno Y, Fujii K, Shinki T. Vitamin D and bone. J Cell Biochem 2003;88:259-66.
[11] Saggese G, Baroncelli GI, Bertelloni S. Puberty and bone development. Best Pract Res Clin
Endocrinol Metab 2002;16:53-64.
[12] Seeman E. Effects of Tobacco and Alcohol Use on Bone. In: Marcus R, Feldman D, Kelsey J,
editors. Osteoporosis. San Diego: Academic Press; 2001; p. 771-94.
[13] Baird J, Kurshid MA, Kim M, Harvey N, Dennison E, Cooper C. Does birthweight predict
bone mass in adulthood? A systematic review and meta-analysis. Osteoporos Int
2011;22:1323-34.
[14] Dennison EM, Syddall HE, Sayer AA, Gilbody HJ, Cooper C. Birth weight and weight at 1
year are independent determinants of bone mass in the seventh decade: the Hertfordshire
cohort study. Pediatr Res 2005;57:582-6.
[15] Oliver H, Jameson KA, Sayer AA, Cooper C, Dennison EM. Growth in early life predicts
bone strength in late adulthood: the Hertfordshire Cohort Study. Bone 2007;41:400-5.
21
[16] Schlussel MM, Dos S, V, Kac G. Birth weight and adult bone mass: a systematic literature
review. Osteoporos Int 2010;21:1981-91.
[17] Yarbrough DE, Barrett-Connor E, Morton DJ. Birth weight as a predictor of adult bone mass
in postmenopausal women: the Rancho Bernardo Study. Osteoporos Int 2000;11:626-30.
[18] Ganpule A, Yajnik CS, Fall CH, Rao S, Fisher DJ, Kanade A et al. Bone mass in Indian
children--relationships to maternal nutritional status and diet during pregnancy: the Pune
Maternal Nutrition Study. J Clin Endocrinol Metab 2006;91:2994-3001.
[19] Jones G, Dwyer T. Birth weight, birth length, and bone density in prepubertal children:
evidence for an association that may be mediated by genetic factors. Calcif Tissue Int
2000;67:304-8.
[20] Macdonald-Wallis C, Tobias JH, Smith GD, Lawlor DA. Relation of maternal prepregnancy
body mass index with offspring bone mass in childhood: is there evidence for an intrauterine
effect? Am J Clin Nutr 2010;92:872-80.
[21] Micklesfield LK, Levitt NS, Carstens MT, Dhansay MA, Norris SA, Lambert EV. Early life
and current determinants of bone in South African children of mixed ancestral origin. Ann
Hum Biol 2007;34:647-55.
[22] Steer CD, Tobias JH. Insights into the programming of bone development from the Avon
Longitudinal Study of Parents and Children (ALSPAC). Am J Clin Nutr 2011:1S-4S.
[23] Vidulich L, Norris SA, Cameron N, Pettifor JM. Infant programming of bone size and bone
mass in 10-year-old black and white South African children. Paediatr Perinat Epidemiol
2007;21:354-62.
[24] Micklesfield L, Levitt N, Dhansay M, Norris S, van der Merwe L, Lambert E. Maternal and
early life influences on calcaneal ultrasound parameters and metacarpal morphometry in 7- to
9-year-old children. J Bone Miner Metab 2006;24:235-42.
[25] Binkley TL, Berry R, Specker BL. Methods for measurement of pediatric bone. Rev Endocr
Metab Disord 2008;9:95-106.
[26] Baroncelli GI. Quantitative ultrasound methods to assess bone mineral status in children:
technical characteristics, performance, and clinical application. Pediatr Res 2008;63:220-8.
[27] Ahrens W, Bammann K, Siani A, Buchecker K, De HS, Iacoviello L et al. The IDEFICS
cohort: design, characteristics and participation in the baseline survey. Int J Obes (Lond)
2011;35 Suppl 1:S3-15.
[28] Ahrens W, Bammann K, De HS, Halford J, Palou A, Pigeot I et al. Understanding and
preventing childhood obesity and related disorders--IDEFICS: a European multilevel
epidemiological approach. Nutr Metab Cardiovasc Dis 2006;16:302-8.
[29] Bammann K, Peplies J, Sjostrom M, Lissner L, Ahrens W, De HS et al. Assessment of diet,
physical activity and biological, social and environmental factors in a multi-centre European
project on diet-and lifestyle-related disorderds in children (IDEFICS). J Public Health
2006:279-89.
[30] Bammann K, Peplies J, Pigeot I, Ahrens W. [IDEFICS: a multicenter European project on
diet- and lifestyle-related disorders in children]. Med Klin (Munich) 2007;102:230-5.

22
[31] Jaworski M, Lebiedowski M, Lorenc RS, Trempe J. Ultrasound Bone-Measurement in
Pediatric Subjects. Calcified Tissue Int 1995;56:368-71.
[32] Economos CD, Sacheck JM, Wacker W, Shea K, Naumova EN. Precision of Lunar Achilles
plus bone quality measurements: time dependency and multiple machine use in field studies.
British Journal of Radiology 2007;80:919-25.
[33] Tyrrell VJ, Richards G, Hofman P, Gillies GF, Robinson E, Cutfield WS. Foot-to-foot
bioelectrical impedance analysis: a valuable tool for the measurement of body composition in
children. Int J Obes Relat Metab Disord 2001;25:273-8.
[34] WHO consultation on Obesity. Obesity: preventing and managing the global epidemic. 894.
2000. Geneva, World Health Organization. WHO Technical Report Series.
[35] Cole TJ, Freeman JV, Preece MA. British 1990 growth reference centiles for weight, height,
body mass index and head circumference fitted by maximum penalized likelihood. Stat Med
1998;17:407-29.
[36] Marfell-Jones M, Olds T, Stewart A, Carter L. International standards for anthropometric
assessment. Potchefstroom, South Africa: International Society for the Advancement of
Kinanthropometry (ISAK); 2006.
[37] Liao XP, Zhang WL, He J, Sun JH, Huang P. Bone measurements of infants in the first 3
months of life by quantitative ultrasound: the influence of gestational age, season, and
postnatal age. Pediatr Radiol 2005;35:847-53.
[38] Ay L, Jaddoe VWV, Hofman A, Moll HA, Raat H, Steegers EAP et al. Foetal and postnatal
growth and bone mass at 6 months: the Generation R Study. Clin Endocrinol 2011;74:181-90.
[39] Schoenau E, Saggese G, Peter F, Baroncelli GI, Shaw NJ, Crabtree NJ et al. From bone
biology to bone analysis. Horm Res 2004;61:257-69.
[40] Alwis G, Rosengren B, Nilsson JA, Stenevi-Lundgren S, Sundberg M, Sernbo I et al.
Normative calcaneal quantitative ultrasound data as an estimation of skeletal development in
Swedish children and adolescents. Calcified Tissue Int 2010;87:493-506.
[41] Mughal MZ, Langton CM, Utretch G, Morrison J, Specker BL. Comparison between broad-
band ultrasound attenuation of the calcaneum and total body bone mineral density in children.
Acta Paediatr 1996;85:663-5.
[42] Goh SY, Aragon JM, Lee YS, Loke KY. Normative data for quantitative calcaneal ultrasound
in Asian children. Ann Acad Med Singapore 2011;40:74-6.
[43] Lee M, Nahhas RW, Choh AC, Demerath EW, Duren DL, Chumlea WC et al. Longitudinal
changes in calcaneal quantitative ultrasound measures during childhood. Osteoporos Int
2011;22:2295-305.
[44] Falcini F, Bindi G, Ermini M, Galluzzi F, Poggi G, Rossi S et al. Comparison of quantitative
calcaneal ultrasound and dual energy X-ray absorptiometry in the evaluation of osteoporotic
risk in children with chronic rheumatic diseases. Calcified Tissue Int 2000;67:19-23.
[45] Specker BL, Schoenau E. Quantitative bone analysis in children: current methods and
recommendations. J Pediatr 2005;146:726-31.

For Peer Review
Influence of birth weight on calcaneal bone stiffness in
Belgian pre-adolescent children
Journal: Calcified Tissue International
Manuscript ID: CTI-12-0141
Manuscript Type: Original Study
Date Submitted by the Author: 09-May-2012
Complete List of Authors: Michels, Nathalie; Ghent University, Public Health Gracia-Marco, Luis Herrmann, Diana Eiben, Gabriele De Henauw, Stefaan; Ghent University, Public Health Sioen, Isabelle; Ghent University, Public Health
Keywords: Bone Density Technology: Ultrasound, birth weight, pre-adolescent children
Calcified Tissue International

Samenvatting in het Nederlands
Doel: Het doel van deze studie was het onderzoeken van de relatie tussen geboortegewicht en
botstijfheid ter hoogte van de hiel in een grote steekproef gezonde Belgische pre-adolescente kinderen.
Methoden: De participanten zijn 827 kinderen (3.6–11.2 j, 51.6% jongens) van de Belgische cohorte
van de Europese IDEFICS studie. Het geboortegewicht was verkregen via een vragenlijst ingevuld
door de ouders. De ultrasone botmetingen (QUS) werden uitgevoerd met behulp van het Lunar
Achilles toestel om de parameters Broadband Ultrasound Attenuation (BUA), Speed of Sound (SOS)
en de Stiffness Index (SI) te bepalen.
Resultaten: Het gemiddelde geboortegewicht was 3435.7 ± 512.0 g voor jongens en 3256.9 ± 471.1g
voor meisjes. Het gemiddelde van de ultrasone hielmeting was gelijk aan 89.6 ± 24.0 (23.3 tot 153.9)
dB/MHz voor BUA, 1621.4 ± 49.6 (1516.3 tot 1776.5) m/sec voor SOS en 92.8 ± 15.6 (49.0 tot 163.0)
voor SI. Geboortegewicht was significant positief geassocieerd met BUA (r = 0.128; p = 0.002) en
significant negatief met SOS (r = -0.157; p < 0.001). De associaties bleven na correctie voor leeftijd en
geslacht in de regressie analyses, maar verdwenen na correctie voor antropometrische covariaten.
Conclusie: Onze bevindingen suggereren dat geboortegewicht, als een ruwe indicator voor de
genetische en omgevingsinvloeden tijdens het intra-uteriene leven, wordt geassocieerd met BUA en
SOS bij pre-adolescente kinderen en kan daardoor ook het risico op osteoporose op latere leeftijd
beïnvloeden. Verdere studies met behulp van QUS zijn nodig om de consistentie van de resultaten van
deze studie te onderzoeken.


UNIVERSITEIT GENT
Faculteit Geneeskunde en Gezondheidswetenschappen
Academiejaar 2011-2012
Influence of birth weight on calcaneal bone stiffness
in Belgian pre-adolescent children
Additional Report
Masterproef voorgelegd tot het behalen van de graad van
Master in de Verpleegkunde en de Vroedkunde
Door Karen Van den Bussche
Promotor: dr. Isabelle Sioen
Co-promotor: Nathalie Michels
Table of Contents
Introduction ............................................................................................................................................. 1
Review of the literature ........................................................................................................................... 5
Methodology ....................................................................................................................................... 5
Introduction on bone measurement techniques ................................................................................... 5
Results of the literature review ............................................................................................................ 6
Relation between birth weight and bone health ............................................................................... 7
Other factors influencing bone health in children ......................................................................... 17
Additional analyses and results ............................................................................................................. 19
Covariate analysis.............................................................................................................................. 19
Stepwise multiple regression ............................................................................................................. 21
Additional points of discussion ............................................................................................................. 25
Strengths and limitations ................................................................................................................... 26
Conclusion of this additional report ...................................................................................................... 27
Choice of journal ................................................................................................................................... 28
Reference List........................................................................................................................................ 29
Appendix ............................................................................................................................................... 33

1
Introduction
Osteoporosis is one of the most widespread, costly and debilitating diseases in Europe [1, 2]. It affects
more than 75 million people in Europe, Japan and the USA and causes a large amount of fractures in
elderly. An estimated 3 million hip fractures is expected by 2025. The burden of the disease arises
from the associated factors, which are influenced by the severity of bone loss and the risk of falling.
The total cost of osteoporosis is very high but difficult to calculate because there are different types of
costs: e.g. the costs of acute hospital care, loss of working days for family carers, long-term care and
medication [3]. The World Health Organization (WHO) defined osteoporosis as a progressive
systemic skeletal disease that is characterized by low bone mass and microarchitectural deterioration
of bone tissue, with a consequent increase in bone fragility and in fracture risk [4]. Two major factors
determining the low bone mass are the gain of bone and the loss of bone. The gain of bone or the
‘peak bone mass’ is the amount of bone tissue present at the end of skeletal maturation, mainly gained
in the first two decades of life. The mass of bone tissue at any time during adult life is the difference
between the amount accumulated at maturity and that lost with ageing [3]. Therefore there is a
significant interest in exploring ways to increase peak bone mass. The amount of peak bone mass is
determined by heredity, calcium and vitamin D intake through nutrition, hormones, physical activity,
other lifestyle factors (e.g. tobacco and alcohol use) or impaired by various disorders (e.g. delayed
puberty and anorexia nervosa) [3, 5-9]. The second major determinant of low bone mass is the loss of
bone. The beginning of substantial bone loss is different for men (around 65 years) compared to
women (around 50 years). Endocrine factors (mainly estrogen) are necessary for maximizing peak
bone mass, but also for maintaining it. Besides that, physical activity and nutritional factors such as
deficiencies in calcium, vitamin D and protein showed an association with accelerated bone loss or
deficient skeletal growth [3, 10].
Osteoporosis is a silent epidemic whose foundation lies in the early years of childhood, but its
manifestation lies later in life. Prevention should begin early and the question occurs if prevention
should start before new life [11]. Recent studies investigated early determinants of osteoporosis of

2
which birth weight is one of them. Birth weight is determined by the duration of the pregnancy, ‘the
gestational age’, and the prenatal growth rate. These determinants are influenced by genetic factors
(e.g. ethnicity), the health of the mother (e.g. alcohol or tobacco use), environmental factors,
socioeconomic status, fetal abnormalities (e.g. congenital diseases) and finally multiple births [12].
At this stage, several studies have shown associations between birth weight and adult bone mass [13-
17]. It is uncertain whether that influence of birth weight is already visible in childhood. Seven studies
with varying sample sizes (from 64 till 6876) investigated the influence of birth weight on bone health
in children of the same age as in this study, between six and ten years old. Most of these studies
analyzed different bone sites with dual energy X-ray absorptiometry (DXA) [18-23] and one study
used quantitative ultrasound (QUS) within this age group [24]. The last-mentioned study explored
bone health in 109 South-African children and used correlation analysis, without taking covariates into
account. Summarized, literature on this subject in this pre-adolescent age group is hard to compare and
inconclusive. Moreover, no literature is available for children at pre-school age. Besides the studies
investigating bone health in primary school children, other studies investigating bone health in babies
and adolescents have been carried out. Two studies explored the influence of birth weight on bone
health in three and six months old babies with one study using DXA in 252 Dutch children [25] and
the other study used QUS in 542 Chinese children [26]. The latter found a correlation between birth
weight and bone health in children born appropriate for gestational age. Eight studies investigated the
influence of birth weight on adolescents and young adults with varying sample sizes (from 40 till 496)
[27-33]. The studies were conducted around the world and all used the DXA measurement technique.
Summarized, at this moment no conclusive research consists about the relationship between birth
weight and bone health assessed by QUS in healthy children. Generally, no recent studies
investigating the influence of birth weight on bone health in young Belgian children are available. To
provide more in depth knowledge on the relation between birth weight and bone health in young
children, this study investigated a large sample of healthy Belgian pre-school and primary school
children.

3
The main purpose of this research is to further investigate the influence of birth weight as an
independent variable on bone strength assessed by calcaneal bone stiffness in a large sample of healthy
children at prepubertal age.
To achieve this goal, a quantitative approach based on the data of the follow-up survey of the Belgian
cohort of the EU 6th Framework Programme IDEFICS (Identification and prevention of Dietary- and
lifestyle-induced health EFfects In Children and infantS; www.idefics.eu) was used. This unique,
longitudinal study investigates factors influencing health, growth and development of European
children with emphasis on obesity and its co-morbid conditions. To determine the bone strength in
these children, QUS was used in this study, an easy to use, radiation free, portable and cost-effective
tool [34]. Two associated parameters were determined. First parameter is the Speed of Sound (SOS)
that reflects the stiffness of a material by the ratio of the traversed distance to the transit time and is
expressed as meter per second (m/sec). Second parameter is the Broadband Ultrasound Attenuation
(BUA) that reflects the absorption of sound waves and is expressed as decibels per megahertz
(dB/MHz). The more complex the bone structure, the more sound waves will be absorbed. The
Stiffness Index (SI) is a third, derived, parameter and is calculated by a linear combination of BUA
and SOS. These three QUS parameters are related to trabecular bone, the most metabolic active bone
tissue, with a higher variation rate compared to cortical bone tissue. QUS can be measured at different
sites (e.g. at the phalangeal or the tibia) of which the calcaneus is the most popular site since it consists
almost entirely of trabecular bone [34, 35]. As previously cited, the number of studies using QUS to
investigate the relationship between birth weight and bone strength in pre- and primary school children
are limited [24].
For this study a thorough research of the literature was performed to determine the lack of evidence on
the relationship between birth weight and bone health in children. Next, the research question was
analyzed using quantitative statistical methods with the analysis of potential covariates and
subsequently testing those results in various multiple regression models. The data used in this study

4
was not collected by the author because the data was already gathered in 2009 – 2010. Since it is very
important to gain experience in all areas of scientific research through the master’s thesis, the author
participated in data collection of the same children two years later. In the following survey of the
Belgian IDEFICS cohort, the author took several measurements in the pre-school and primary school
children: blood collection, blood handling, measurements of the heel bones with QUS and the whole
body scans with DXA.
This master’s thesis consists of two large parts: a scientific article and an additional report. The latter
is presented here and contains four parts. First a thorough review of the literature about the influence
of birth weight on bone health in children and adolescents is presented. In addition an introduction on
bone measurement techniques is given with the comparison of the three main bone measurement
techniques. Second, additional analyses and results are given including the analysis of covariates and
multiple regression analysis. Pre-final multiple regression models are presented in this additional
report while the final models are presented in the scientific article. Additional points of discussion and
the conclusion of this additional report are respectively the third and fourth part of this master’s thesis.

5
Review of the literature
Methodology
The search for relevant literature was based on the following research question: ‘What is the influence
of birth weight on bone mass in children and adolescents?’ The databases PubMed, ISI Web of
Knowledge, the Cochrane Library and Google Scholar were searched. According to pre-established
keywords and after reading title and abstract, 140 articles were found in the Cochrane Library (n =
11), Google scholar (n = 33), PubMed (n = 63), Web of Science (n = 24) and by hand searches (n = 9).
However, the articles needed to fulfill the following criteria. The subjects had to be defined as healthy
children who were born at term and who had no (congenital) diseases or conditions that may affect
bone metabolism. The ancestral origin of the subjects did not matter. All articles written in English
were eligible. The studies must have been published in the last ten years, because of the importance to
use the most recent measurement techniques. After analyzing for the following inclusion criteria, 17
articles remained. After evaluating the quality [36, 37], each of these 17 articles was included.
Introduction on bone measurement techniques
In order to make the literature review comprehensive for those who are not familiar with bone
measurement techniques, a small introduction is included here before presenting the results of the
literature review. Most of the adult bone mass is gained in childhood and experts believe that
optimizing bone mass early in life has a great importance. First there would be an influence on
fractures in childhood and second it would have a deal in the delay of developing osteoporosis later in
life. To measure bone health, three different techniques are commonly used.
The first and most used technique is the dual energy X-ray absorptiometry (DXA). Many bone sites
can be measured such as the total body, the spine, several hip regions (total hip, femoral neck) and the
forearm. The measurements result in four parameters: bone area (BA), bone mineral content (BMC),
areal bone mineral density (aBMD) and derived bone mineral apparent density (BMAD). DXA has
three main advantages: the low cost, minimal radiation exposure and the fact that this technique is
relatively fast. A few disadvantages are present as well: DXA cannot separate cortical and trabecular

6
bone, no measures of bone geometry can be given and the bone size will influence aBMD. The reason
is the two-dimensional image of a DXA measurement compared with a pQCT measurement that adds
a third dimension. A second technique is the peripheral quantitative computed tomography
(pQCT) which can measure the tibia and the radius as bone sites. It differs from DXA in its parameters
whereby bone geometry and bone strength (CSMI, BSI, pSSI) can be measured, as well as BMC and
volumetric density (vBMD). pQCT measures true vBMD and can differentiate bone tissue (cortical vs.
trabecular) because it measures the bone in three dimensions. There is also a minimal radiation
exposure. The disadvantages are the underestimation of cortical vBMD when cortical shell thickness is
small (<2 mm). Another disadvantage is the fact that repeated measurements in longitudinal studies
are difficult due to variations in longitudinal bone growth rates. A third technique is the quantitative
ultrasound (QUS). Four possible bone sites can be measured: the calcaneus, the tibia, the radius and
the phalanx (hand). QUS results in two possible parameters: Speed of Sound (m/sec) (SOS) and
Broadband Ultrasound Attenuation (dB/MHz) (BUA). Three very important advantages are the low
cost, the portability of the scanning device and the non-existing radiation exposure. One disadvantage
is the influence of bone size (cortical thickness) on SOS [38, 39].
Results of the literature review
The first part of this literature review handles about the influence of birth weight on bone mass in
children of all ages. Because childhood is a quite long period, we distinguish the following sub-
periods: infancy (from birth till ± 12 year), adolescence (from ±13 till ±18 year) and young adulthood
(from ±18 till ±22 year) [40]. Within this literature review, the results were divided into two parts:
prepuberty and postpuberty as puberty is marked by specific hormonal changes possibly influencing
bone growth and development. The prepuberty contains the infancy: only two articles were found
from birth till one year, the other studies consider subjects between the range of six to ten years old.
The postpuberty contains the adolescence and young adulthood. The last life stage is included here
because of the wide age range of the subjects in some articles that would otherwise be excluded (e.g.
from 16 till 20 year [41]). In the second part, a short overview is given of other factors influencing
bone health in children.

7
Relation between birth weight and bone health
1. Bone mass at prepubertal age
1.1. From birth till one year
Two studies investigated the influence of birth weight on bone health at a very young age. The
researchers of the generation R study, Ay et al., found associations between birth weight and bone
parameters after adjusting for gender, age and gestational age at birth in 6 months old children [25].
Positive associations between birth weight and total body bone mineral density (BMD) (β = 0.002
(95% CI = 0.001, 0.003), p < 0.01) and total body BMC (β = 0.02 (95% CI = 0.01, 0.02), p < 0.01)
were found [25]. Liao et al. studied 542 infants divided into three groups according to birth weight (<
1,500g, n = 11; 1,500 – 2,500g, n = 60; > 2,500 g, n = 86). SOS of the tibia of the infants with a birth
weight of < 1,500 g was significantly lower than SOS in infants with birth weight of > 2,500 g (p <
0.042) [26]. However, no significant differences were found among the three groups after accounting
for the influences of gestational age and birth season. Moreover, Liao et al. found a positive
correlation between birth weight and SOS measured from the tibia (r = 0.232; p < 0.015) in children
appropriate for gestational age (AGA). This significant correlation was not found in children small or
large for gestational age (SGA or LGA) [26].
Table 1: Two studies on the relation between birth weight and bone health in children between birth
and one year of age, sorted alphabetically
Author Sample Method Results
Ay et al. (2010) n = 252
6 months old
The Netherlands
DXA: BMD – BMC –
BMAD
- Total body
- Lumbar spine
Regression (adj. for gender,
gestational age and age)
+ total body BMD
+ total body BMC
○ lumbar spine
Liao et al. (2005) n = 542
3 months old
China
QUS: SOS (m/sec)
- Tibia
Correlation
+ SOS tibia for AGA
○ SOS tibia for SGA – LGA
+ : the results show a significant and positive relationship; - : the results show a significant and inverse
relationship; ○ : no relationship was found

8
1.2. From 6 till 10 years
Seven studies that examined children between the ages of 6 and 10 years were found.
Steer & Tobias found significant positive associations between birth weight and bone mass obtained
in total body scans of English children after adjusting for gestational age, gender and current age of the
child: BMD (β = 0,292 (95% CI = 0.241, 0.343), p < 0.001, r = 0.134), bone area (BA) (β = 0.518
(95% CI = 0.468, 0.567), p < 0.001, r = 0.240) and bone mineral content (BMC) (β = 0.459 (95% CI =
0.409, 0.509), p < 0.001, r = 0.213), with r being the partial correlation [22]. An inverse association
between birth weight and area adjusted BMC (aBMC) was seen (β = - 0,216 (95% CI = - 0.268, -
0.136), p < 0.001, r = 0.097). A second model takes shared genetic factors into account by adjusting
for parental height and weight. Similar, but attenuated, positive associations were found in BMD (β =
0,137 (95% CI = 0.074, 0.200), p < 0.001, r = 0.064), BA (β = 0.0.282 (95% CI = 0.225, 0.340), p <
0.001, r = 0.140) and BMC (β = 0.242 (95% CI = 0.183, 0.300), p < 0.001, r = 0.120). The inverse
relationship between birth weight and aBMC persisted (β = - 0,159 (95% CI = - 0.225, - 0.092), p <
0.001, r = 0.070). But in a third model that adjusted for height and weight in nine year old children, an
inverse association was observed in aBMC and in BMD. The researchers suggest that birth weight had
a negative influence on bone mass after bone and body size were considered [22]. Macdonald-Wallis
et al. found significant positive correlations between birth weight and bone measurements for total
body (BMC, BA and BMD) and birth weight and bone measurements at the spine (BMC, BA and
BMD) without adjusting for confounders: total body BMC (r = 0.197, p < 0.0001), total body BA (r =
0.216; p < 0.001), total body BMD (r = 0.139; p < 0.001), spine BMC (r = 0.158; p < 0.001), spine
BMD (r = 0.095; p < 0.001) and spine BA (r = 0.185; p < 0.001). An inverse significant relationship
was found in total body aBMC (r = - 0.065; p < 0.001) whereby no significant relationship was found
in spine aBMC (r = -0.017; p NS) [20]. Jones & Dwyer examined the correlation between growth
variables at birth and bone density in prepubertal Australian children. Significant positive correlations
between birth weight and BMD femoral neck (r = 0.26; p < 0.0001) and bone mineral apparent density
(BMAD) femoral neck (r = 0.11; p = 0.04) were found. But no correlations were found with BMD
lumbar spine (r = 0.09; p = 0.22) and BMAD lumbar spine (r = -0.07; p = 0.22). In addition, the
researchers conducted multivariate regression analyses. Firstly, BMD and BMAD were adjusted for

9
gender and growth variables with only BMD showing significant associations (femoral neck β = 0.11;
p = 0.041 and lumbar spine β = 0.12; p = 0.041). Femoral neck and lumbar spine BMAD showed no
significant associations. Second, the researchers added environmental factors (breastfeeding, maternal
smoking, sports participation, sunlight exposure and calcium intake) as confounders in a subsequent
model. The positive associations that were found in the first model remained significant at the femoral
neck BMD (β = 0.12; p = 0.033) and the lumbar spine BMD (β = 0.13; p = 0.029). Thirdly, the study
added maternal bone density as an additional confounder, but no significant associations were found
[19].
The research of Ganpule et al. did not take place in a Western country like the three studies above,
but examined subjects from a developing country, India. The focus of this study was the influence of
the maternal nutritional status and diet during pregnancy on bone mass in offspring, but analysis using
body size and bone mass measurements (DXA), without adjusting for covariates, took place as well.
They found a positive association between birth weight and all bone outcomes (p < 0.001) [18].
The three other studies took place in South-Africa using subjects of mixed ancestral origin [21, 23, 24,
24]. Vidulich et al. measured BA and BMC of the total body, femoral neck and lumbar spine in black
and white South African children. After categorizing birth weight into tertiles, an ANCOVA analysis
was used to determine differences in means of bone parameters. Significant differences were only seen
in boys, not in girls. In black boys, total body BA (p < 0.001) and BMC (p < 0.001), femoral neck BA
(p < 0.05) and BMC (p < 0.001), lumbar spine BA (p < 0.001) and BMC (p < 0.001) were
significantly different between the birth weight tertiles, while in white boys, total body BA (p < 0.001)
and BMC (p < 0.001), femoral neck BA (p < 0.01) and BMC (p < 0.001), lumbar spine BA (p < 0.05)
and BMC (p < 0.01) differed. For black and white girls no significant differences in the bone
parameters were found. Multiple regression analysis was performed to calculate the predictive power
of birth weight. After adjusting BA and BMC for many variables on which BA and BMC in children
are dependent (e.g. race, gender and age), birth weight was not a significant predictor of total body BA
and BMC, femoral neck BA and BMC and lumbar spine BA and BMC. However, when BMC was
additionally corrected for BA, birth weight became predictive for femoral neck BMC (β = 0.07 ± 0.03;

10
p < 0.05). The researchers concluded that low birth weight and small size at 1 year resulted in smaller
bones and/or bones of lower BMC at the femoral neck [23]. Both studies by Micklesfield et al.
investigated subjects of mixed ancestral origin from a working class community in South-Africa.
Using QUS in the first study, neither BUA nor SOS were significantly correlated with any of the early
life parameters, including birth weight, gestational age or whether the child was breastfed or not [24].
Using DXA in the smallest birth cohort (n = 64), Micklesfield et al. did not found significant
correlations between birth weight and total body BMC with DXA (r = 0.25; p NS) [21].
Table 2: Seven studies on the relation between birth weight and bone health in children between 6 and
10 years old, sorted alphabetically
Author Sample Method Results
Ganpule et al. (2006) n = 698
6 yrs.
India
DXA: BMD – BMC
- Total body
- Total spine
Correlation
+ for all parameters
Jones & Dwyer
(2000)
n = 330
8 yrs.
Australia
DXA: BMC – BMD –
BMAD
- Lumbar spine
- Femoral neck
Correlation
+ BMD – BMAD f.n.
○ BMD – BMAD l.s.
Regression (adj. for growth/
gender/environmental factors)
+ BMD f.n. & l.s.
○ BMD f.n. & l.s. after add. adj.
for maternal bone density
○ BMAD f.n. & l.s.
Macdonald-Wallis et
al. (2010)
n = 6876
9 yrs.
UK
DXA: BMC – BMD –
BA – aBMC
- Total body minus
head
- Spine bone
Correlation
+ t.b. BMC – BMD – BA
+ spine BMC – BMD – BA
- t.b. aBMC
○ spine aBMC
Micklesfield et al.
(2006)
n = 109
7 – 9 yrs.
South-Africa
QUS: BUA (dB/MHz) –
SOS (m/sec)
- Both calcanei
Correlation
○ BUA – SOS
Micklesfield et al.
(2007)
n = 64
9 yrs.
South-Africa
DXA: BMC
- Total body
Correlation
○ BMC
Steer & Tobias
(2011)
n = 6876
9 yrs.
UK
DXA: BMD – BMC –
BA – aBMC
- Total body
Regression (adj. gestation,
gender & age)
+ BMD – BMC – BA
- aBMC
+. adj. weight & height parents
+ BMD – BMC – BA
- aBMC
+ adj. height and weight child
○ BMC – BA
- BMD – aBMC

11
Vidulich et al.
(2007)
n = 476
10 yrs.
South-Africa
DXA: BA – BMC
- Total body
- Femoral neck
- Lumbar spine
Ancova (age)
+ black and white boys for all
○ black and white girls for all
Regression analysis (Adj. for
bone age, gender, race, SES,
height & weight)
○ BA & BMC f.n. – l.s. – t.b.
○ BMC t.b. – l.s. (+ adj. for BA)
+ BMC f.n. (+ adj. for BA)
+ : the results show a significant and positive relationship; - : the results show a significant and inverse
relationship; ○ : no relationship was found. T.b. total body; f.n. femoral neck; l.s. lumbar spine; adj.
adjusted for; UK: United Kingdom
2. Bone mass at postpubertal age
Eight studies investigated the relation between birth weight and bone health in subjects between 13
and 23 years old.
The study of de Bono et al. was performed in Gambia and had one main interest: the influence of birth
weight on bone mass in adolescents. The division in bone mass parameters that is used in the study of
de Bono et al. was applied in the following chapters to report also the results of the seven other
studies. de Bono et al. divided the investigated bone parameters into four different segments (2.1)
pQCT bone area, (2.2) DXA bone area, (2.3) DXA and pQCT-derived BMC and (2.4) pQCT and
DXA-derived bone density. Importantly, de Bono et al. performed measurements on both cortical
(compact bone tissue, situated in the outer layer) and trabecular sites (porous bone tissue, situated in
the interior of the bone), a seldom researched combination [27].
2.1. The results from pQCT bone area
Using pQCT measurements for BA at cortical sites, de Bono et al. found that birth weight was a
significant predictor of total cross-sectional area (CSA) at the tibial (β = 0.33; p < 0.05) and radial
shaft (β = 0.47; p < 0.01) in males in unadjusted models. The association remained significant after
adjustment for current height, weight and age (β = 0.35; p < 0.01 and β = 0.29; p < 0.05). Birth weight
was a significant positive predictor of medullary CSA but not of cortical CSA at both the tibial shaft (β
= 0.90; p < 0.01) and the radial shaft (β = 0.87; p < 0.001) in males. These relationships were
independent of age at the radius and independent of weight at the tibia (β = 0.93; p < 0.01 and β =
0.70; p < 0.01 respectively). In females, birth weight was not a significant independent predictor of

12
total, cortical or medullary CSA at any site. Using pQCT measurements for BA at trabecular sites,
birth weight was a significant positive predictor of total CSA at the distal tibia (β = 0.49; p < 0.01 and
β adj. = 0.31; p < 0.05) and radius (β = 0.61; p < 0.001 and β adj. = 0.46; p < 0.01) in females with and
without corrections for confounders. In males significance was only found in unadjusted models
(distal tibia β = 0.23; p < 0.05) [27]. The Finnish study of Wang et al. is the second study that used
the pQCT technique. Correlation coefficients between bone traits and weight at birth were explored.
Influence of birth weight on bone strength index (BSI) was significant for the tibia (r = 0.23; p ≤ 0.05)
but not significant for the radius (r = 0.06; p NS). Bone total cross-sectional area was significant for
both the tibia (r = 0.21; p ≤ 0.05) and the radius (r = 0.18; p ≤ 0.05) in unadjusted analyses [41].
Jensen et al. investigated in a third, three-step, analysis the relationship between birth weight and BA
with adjusting for height but no significant association was observed (β = 0.03; 95% CI (-0.17, 0.23);
p = 0.76) [31].
2.2. The results from DXA measurements of bone area
de Bono et al. investigated bone area using DXA in Gambian adolescents. Birth weight was a
significant positive predictor of bone area at the radial shaft in both males (β = 0.27; p < 0.01) and
females (β = 0.21; p < 0.05), in unadjusted and adjusted models. The significant positive results from
the pQCT measurements agree with DXA findings at the ultra-distal radius (males β = 0.27; p < 0.01
and females β = 0.31; p < 0.001) in unadjusted models. After adjusting only ultradistal radius BA in
females remained significant (β = 0.22; p < 0.001). At other DXA sites significant positive
associations were found in the spine BA in males (β = 0.25; p < 0.05), femoral neck in both males (β =
0.26; p < 0.01) and females (β = 0.34; p < 0.001), total body BA in both males (β = 0.23; p < 0.01) and
females (β = 0.20; p < 0.05) and total hip BA in both males (β = 0.16; p < 0.05) and females (β = 0.33;
p < 0.001) in the unadjusted models. After adjusting, only radial shaft BA in males (β adj. = 0.18; p <
0.05) and females (β adj. = 0.21; p < 0.05), femoral neck BA in males (β adj. = 0.20; p < 0.05) and
females (β adj. = 0.34; p < 0.001) and total hip BA in females (β adj. = 0.22; p < 0.05) remained
significant [27].

13
Among males, Schlüssel et al. found significant positive associations between birth weight tertiles and
bone area at the spine (p < 0.001), femoral neck (p < 0.001) and proximal femur (p < 0.001) in linear
regression. Among females, BA tended to be greater at the spine (p = 0.024), femoral neck (p = 0.017)
and proximal femur (p = 0.028) for those in the highest birth weight tertile. The association between
birth weight and BA was explored in multiple linear regression models with adjusting for gender,
gestational age, skin color and lifestyle variables. Bone area at the spine was not associated but the
femoral neck (β = 0.06; SE = 0.03; p = 0.046) and the proximal femur (β = 0.81; SE = 0.25; p = 0.001)
were. Wang et al. found significant correlations for the total body (r = 0.19; p ≤ 0.05), lumbar spine (r
= 0.16; p ≤ 0.05) and the femoral neck (r = 0.18; p ≤ 0.05) without adjusting for confounders [33]. The
Danish study of Mølgaard et al. did not found significant correlation coefficients after adjusting for
gender between birth weight and total body BA (r = 0.14 p = 0.16), while the lumbar spine BA was
significant (r = 0.35; p < 0.001) [32]. El Hage et al. found a significant positive correlation between
birth weight and bone mineral area in adolescent girls (r = 0.46; p < 0.01) [42].
2.3. The results of DXA and pQCT-derived BMC
Birth weight did not predict pQCT-derived BMC at any site in males (cortical and trabecular BMC)
but it did predict the cortical BMC of the radial shaft in females in both models (β = 0.40; p < 0.05 and
β adj. = 0.33; p < 0.05) in the research of de Bono et al. [27]. These findings were consistent with
DXA-derived BMC at corresponding sites in females (β = 0.30; p < 0.05 and β adj. = 0.28; p < 0.05).
The trabecular BMC at the distal radius was significant in females (β = 0.53; p < 0.05) but did not
remain significant after adjusting. At other DXA sites, no significant relationships with birth weight
were found in males (e.g. total body β = 0.15; p NS) but the femoral neck BMC in females was
significant in both models (β = 0.47; p < 0.05 and β adj. = 0.40; p < 0.05) [27]. Unlike de Bono et al.,
El Hage et al. found at the on hand significant associations between birth weight and total body BMC
(β = 162.6; SE = 45.3; p < 0.01) after adjusting for weight and maturation index and at the other a
significant correlation between BMC and birth weight (r = 0.58; p < 0.001) [42]. Among males,
Schlüssel et al. found significant differences between birth weight in tertiles and BMC at all three
studied bone sites among males: spinal (p < 0.001), femoral neck (p = 0.008) and proximal femur (p =

14
0.003). Among females, a significant difference was found between birth weight in tertiles and BMC
at the spine (p = 0.044). In multiple linear regression models, the association between birth weight and
BMC was explored with adjusting for gender, gestational age, skin color and lifestyle variables. BMC
at the spine was not associated with birth weight, but significant associations were found in the
femoral neck BMC (β = 0.15; SE = 0.06; p = 0.014) and proximal femur BMC (β = 1.39; SE = 0.49; p
= 0.005) [33]. The Danish study of Jensen et al. examined the association between birth weight and
BMC as well. Significant associations were found for total body BMC (β = 0.24, 95% CI (0.04-0.45);
p = 0.02) and lumbar spine BMC (β = 0.30; 95% CI (0.13, 0.48); p = 0.001). After correction for
adolescent height and weight, no associations remained significant. Adjusting for other confounders
such as BMI, smoking habits, physical activity and calcium intake did not alter the results. In a
second, size-adjusted, model birth weight was not significantly associated with birth weight (β = -
0.002; 95% CI (-0.08, 0.08); p = 0.97). In a third, three-step, analysis BMC was adjusted for BA and
showed a significant negative association with birth weight (β = - 0.27; 95% CI (-0.45, -0.09); p =
0.004) [31]. Wang et al. examined correlation coefficients between bone traits and BMC without
adjusting for confounders. Significant correlations were found in BMC of the total body (r = 0.17; p ≤
0.05), lumbar spine (r = 0.13; p ≤ 0.05) and of the femoral neck (r = 0.10; p ≤ 0.05) [41]. Mølgaard et
al. found no significant correlation between birth weight and total body BMC (r = 0.073 p = 0.47) and
lumbar spine BMC (r = 0.20; p = 0.048) after adjusting for gender [32]. The Japanese study of Saito et
al. used both Pearson’s correlation and stepwise multiple regression analysis to investigate birth
weight and BMC. Significant correlation coefficients were found for lumbar spine BMC (r = 0.30; p <
0.01), femoral neck (r = 0.25; p < 0.05) and total hip (r = 0.32; p < 0.01). With the multiple regression
analysis the researchers tried to find the best model predicting BMC. Both BMC lumbar spine (β =
3.48, SE = 1.72, R² = 0.042, p = 0.0474) and the total hip (β = 2.25, SE = 1.05, R²=0.039, p = 0.0352)
were significantly associated with birth weight [28].
2.4. The results of bone density (BMD, vBMD, aBMD and BA adjusted BMC)
de Bono et al. found that birth weight was a significant negative predictor of pQCT-derived vBMD of
one cortical site (tibial shaft β = - 0.01; p<0.05) and both trabecular sites in adjusted models (distal

15
tibia β = - 0.27; p < 0.05 and distal radius β = -0.34; p < 0.05) in males. In contrast, birth weight was
not a significant predictor of vBMD at any site in females and of aBMD or BA adjusted BMC at the
majority of sites in males and females in both adjusted and unadjusted models. Only in the β adjusted
aBMD of the radius in males (β = -0.33; p < 0.05) was found significant [27]. In multiple linear
regression analysis, El Hage et al. found a significant association between birth weight and total body
BMD (β = 0.042; SE = 0.001; p < 0.01) after controlling for weight [42]. Among males, Schlüssel et
al. found a significant association between birth weight in BMD at the spine site (p = 0.015) but not at
the femoral neck (p = 0.160) or the proximal femur (p = 0.205). Among females, no significant
associations with BMD were found at the spine (p = 0.332), the femoral neck (p = 0.799) or the
proximal femur (p = 0.999). In multiple linear regression models, the association between birth weight
and BMD was explored after adjusting for gender, gestational age, skin color and lifestyle variables
whereby no significant associations were found between birth weight and the three bone sites [33].
One of the two Danish studies, Jensen et al., examined the association between birth weight and
BMC. Significant associations were found for lumbar spine BMD (β = 0.16, 95% CI (0.004, 0.31); p =
0.04), but not for total body BMD (p = 0.41). After correction for adolescent height and weight, no
association remained significant [31]. The second Danish study, Mølgaard et al., did not found
significant associations between birth weight and total body BMD (r = 0.000; p = 0.998) and lumbar
spine BMD (r = -0.036; p = 0.72) after adjusting for gender [32]. Leunissen et al. used multiple
regression analysis and did not found significant influences of birth weight on the four models on total
body BMD: model A was adjusted for age, gender, birth length, height and birth weight (β = –0.38, p
= 0.471), model B added weight (β = –0.24, p = 0.607), model C added fat mass and lean body mass
(β = –0.66, p = 0.145) and model D adjusted for delta weight and height during childhood (β = 1.17, p
= 0.068). A significant inverse association between birth weight and BMD lumbar spine was found in
three out of four models: model A (β = –1.8, p = 0.026), model B (β = –1.65, p = 0.037) and model C
(β = –2.11, p = 0.007) [29]. Using Pearson’s correlation, Saito et al. found that birth weight was
significantly correlated with femoral neck (r = 0.23; p < 0.05), but not with BMD lumbar spine (r =
0.21; p NS) and the total hip (r = 0.15; p NS) [28]. El Hage et al. found no significant correlation
coefficients between birth weight and BMAD in adolescent females (r = 0.14; p NS) [42].

16
Table 3: Eight studies on the relation between birth weight and bone health in children between 13 till
23 years old, sorted alphabetically
Author Sample Method Results
de Bono et
al. (2010)
n = 120
17 – 21 yrs.
Gambia
DXA: BA – BMC –
aBMD – BA adj BMC
- Lumbar spine
- Femoral neck
- Total body
- Total hip
- Radial shaft
pQCT: CSA – BMC –
vBMD
- Radial shaft
- Tibial shaft
DXA (adj.= current weight, height & age)
+ BA (unadjusted males and females)
Except: ○ BA l.s. (females)
○ BA (adjusted males)
Except:+ BA r.s – f.n. (males)
+ BA (adjusted females)
Except: ○ l.s. – t.b. (females)
○ BMC (adj. & unadj. males and females)
Except: + r.s. – f.n. (females)
○ aBMD – BA adj BMC (adj. & unadj.
males and females)
Except: + aBMD r.s. (adj. males)
pQCT cortical sites
○ CSA t.s. – r. s. (adj. & unadj. females)
Except: + cortical r.s. (unadj. females)
+ total & medullary CSA t.s. – r.s. (adj. &
unadj. males)
○ cortical CSA t.s. – r.s. (adj. & unadj.
males)
○ BMC all (adj. & unadj. males)
○ BMC t.s. (adj. & unadj. females)
+ BMC r.s. (adj. & unadj. females)
- vBMD t.s. (adj. males)
○ vBMD t.s. (adj. & unadj. females)
pQCT trabecular sites
○ CSA d.t. – d.r. (adj. & unadj. males)
Except: + total CSA d.t. (unadj.)
+ CSA d.t. – d.r. (adj. & unadj. females)
○ BMC all (adj. & unadj. males and
females)
Except: + d.r. (unadj. females)
○ vBMD all (adj. and unadj. females)
- vBMD all (adj. & unadj. males)
Except : ○ vBMD d.t. (unadj. males)
El Hage et
al. (2010)
n = 40
13 – 20 yrs.
All females
Lebanon
DXA: BMC – BMD –
BMA – BMAD
- Total body
+ BMC (regression and correlation)
+ BMD (regression and correlation)
○ BMAD (correlation)
+ BMA (correlation)
Jensen et al.
(2008)
n = 123
16 – 19 yrs.
Denmark
DXA: BMC – BMD
- Total body
- Lumbar spine
Regression analysis
+ BMC t.b. – l.s.
○ after correction
+ BMD l.s.
○ after correction
Size-adjusted model
○ BMC
Three-step analysis
○ BA adj for height
- BMC adj for BA

17
Leunissen et
al. (2008)
n = 312
18 – 24 yrs.
The
Netherlands
DXA: BMD
- Lumbar spine
- Total body
4 models – regression analysis
○ BMD t.b. (all models)
- BMD l.s. model A – B – C
○ BMD l.s. model D
Mølgaard et
al. (2011)
n = 109
17 yrs.
Demark
DXA: BMC – BA – BMD
- Total body
- Lumbar spine
○ BA t.b.
+ BA l.s.
○ BMC l.s. – t.b.
○ BMD t.b. – l.s.
Saito et al.
(2005)
n = 86
18 – 21 yrs.
Japan
DXA: BMC – BMD
- Lumbar spine
- Left hip
Correlation
+ BMC l.s. – f.n. – total hip
+ BMD f.n.
○ BMD l.s. – total hip
Regression analysis
+ BMC l.s. – total hip
Schlüssel et
al. (2010)
n = 496
23 yrs.
Brazil
DXA: BMC – BMD – BA
- Lumbar spine
- Proximal femur
- Femoral neck
Linear regression (birth tertiles)
+ BMC/BA l.s. - p.f. – f.n. (males)
+ BMD spine (males)
+ BMC/BMD spine (females)
+ BA l.s. – p.f. – f.n. (highest birth weight
tertile) (females)
Multiple regression (with adj.)
+ BA f.n. – p.f.
○ BA spine
+ BMC spine – f.n. – p.f.
○ BMD spine – f.n. – p.f.
Wang et al.
(2010)
n = 236
16 – 20 yrs.
All females
Finland
DXA: BA – BMC
- Total body
- Femoral neck
- Lumbar spine
pQCT: bone strength
index (BSI) – CSA
- Radius
- Tibia
DXA
+ BA t.b. – l.s. – f.n.
+ BMC t.b. – l.s. – f.n.
pQCT
+ BSI tibia
○ BSI radius
+ CSA radius – tibia
+ : the results show a significant and positive relationship; - : the results show a significant and inverse
relationship; ○ : no relationship was found. L.s. lumbar spine; t.b. total body; f.n. femoral neck; p.f.
proximal femur; r.s. radial shaft; d.t. distal tibia; d.r. distal radius.
Other factors influencing bone health in children
In the studies examining the relationship between birth weight and bone health, many other variables
were investigated as well, since their influence on one of both dependent variables. These variables
can be split in characteristics of the child and parental characteristics.
1. Characteristics of the children
Most studies have focused on growth related factors. Nine studies investigated the influence of current
height and weight (at the time of the bone measurements) on bone health [18-22, 24, 28, 42, 43].

18
Second, weight gain or catch-up growth in weight in the postnatal period was investigated by six
researchers. Nevertheless, results are difficult to compare by differences in the period of measured
weight gain [19, 25, 28, 29, 33, 43]. Yet, not only weight gain but also height gain can be considered:
the influence of delta height on lumbar spine BMD and total body BMD was recently studied [29].
Apart from birth weight, also birth length or crown-heel length at birth has been investigated [18, 29,
41, 44]. Moreover, the influence of weight and length, at different ages, on bone density has been
frequently studied. Weight and length at one till six months was measured and tested for associations
with bone health [19, 25, 41]. Most often, the age of one year was taken to measure the weight and
length [23, 31, 32]. Finally, some less obviously growth variables were studied such as skeletal age
[43], fetal growth [25, 31], growth hormone [31] and gestational age [18, 20, 25, 26, 44]. Apart from
growth, also fat mass, BMI, ponderal index [21, 24, 25, 29, 42, 43], season of birth [26] and physical
activity [21, 24, 28] have been examined on their effect on bone density.
Other studies confirm the influence of other factors on bone health in children: the nutrition of the
child (e.g. calcium intake), genetic factors, hormonal influences and lifestyle factors such as tobacco
smoking and weight-bearing exercise [7, 45-47].
2. Parental characteristics
This part enumerates behavioral, environmental and socio-economic factors of parents that can
contribute to the bone health in offspring.
- Nutritional status or diet such as calcium intake during pregnancy [18, 21, 22].
- Duration and exclusivity of breastfeeding [18, 21, 25, 32].
- Parity, the number of times a mother has given birth [18, 20, 24].
- Body characteristics of the parents such as maternal and paternal height, weight, BMI and bone
density [18, 20, 22, 25, 41].
- Background ultraviolet B exposure during pregnancy and of the child [22].
- Maternal smoking during pregnancy [21, 24].
- Alcohol consumption during pregnancy [21, 24].
- The influence of housing density [21, 24].

19
Additional analyses and results
Covariate analysis
Through combining potential covariates found in (e.g.) the literature and the existing covariates
available in our study, thorough univariate analyses were performed. The covariates were divided into
two main groups: on the one hand covariates with influence on the dependent continuous variable
birth weight and on the other covariates with influence on the dependent continuous variables BUA,
SOS and SI. In relation to a dichotomous variable, an independent T-test was used in normally
distributed variables and a Mann-Whitney U test in non-normally distributed variables. The analysis
between categorical variables and the dependent variables were performed using an F-test (ANOVA)
in normally distributed variables and a Kruskal-Wallis test in non-normally distributed variables.
Finally correlation analysis (Pearson) was used to explore the relation between two continuous
variables, a covariate and one of the four dependent variables. The influence of the covariates on the
dependent variables was calculated for the total group as for boys and girls separately. P-values ≤ 0.2
were considered as potential influential variables and included in further analyses. Appendix 1
contains the results of the univariate analyses whereby the influence of the covariates on (1) birth
weight and (2) BUA, SOS and SI is presented separately.
For the dependent variable birth weight, the covariates were divided into three groups: factors related
to the pregnancy (e.g. alcohol or tobacco use), shared genetic factors (e.g. height of the mother and
father, income category) and factors related to the child (e.g. gender of the child, season of birth).
Appendix 1 (1. Birth weight) shows the results of the analyses between birth weight and twenty-one
covariates. Eighteen variables showed an influence on birth weight (p ≤ 0.2). Several factors related to
the pregnancy such as smoking of the mother, delivery by caesarian section, mother’s gained weight
during pregnancy and the age of the mother at time of delivered influenced birth weight for total group
and boys and girls separately. All shared genetic factors showed an influence on birth weight except
the BMI of the father (both as a continuous or categorical variable). All factors related to the child, the
number of weeks born too early, the gender and season of birth, revealed significant influences and
were considered influential covariates.

20
As shown in appendix 1 (2.1 Broadband Ultrasound Attenuation) thirty-one variables were
investigated and categorized into three groups: factors related to the birth (e.g. birth weight, birth
length, breastfeeding), other variables (current age of the child, hours of sleep, physical activity) and
factors related to anthropometry or body composition (e.g. height, skinfold, fat-free mass of the child).
Twenty-four variables showed an influence on the bone health parameter BUA. Three factors related
to the birth (gender of the child, birth weight and birth length) did significantly influence BUA. Of the
‘other variables’ the age and the number of hours of sleep were influential covariates. Finally all
anthropometric variables, such as current height, weight, waist, BMI, skinfolds and (%) fat-free mass,
were positively correlated with BUA.
Mainly inverse associations were found between the tested covariates and SOS due to the nature of
this dependent variable. Appendix 1 (2.2 Speed of Sound) shows the same thirty-one variables as in
BUA and were tested for the dependent variable SOS. In accordance to BUA, the covariates birth
weight, birth length, current age of the child, the number of hours of sleep and all factors related to
anthropometry and body composition variables (e.g. height, weight and skinfolds) were significantly
associated with SOS. In contrast to the results of BUA, gender (t = 0.094; p = 0.925 for total group)
and % fat-free mass (r = 0.041; p = 0.316 for total group) did not influence SOS in univariate analyses.
The same thirty-one variables, as used in the analyses with the other bone health parameters SOS and
BUA, were analyzed to assess the influence on the third bone health parameter SI. In appendix 1 (2.3
Stiffness Index) the results of the univariate analyses between the covariates and SI are presented. In
general fewer variables showed associations with the calculated parameter SI. Similar associations
were found for gender and the current age of the child in the first two categories compared to SOS and
BUA. Within the category on factors related to anthropometry or body composition, only a few
variables showed significant results: current height, current weight, log-transformed tricipital skinfold
thickness, fat-free mass and % fat-free mass.

21
Stepwise multiple regression
The tested covariates in univariate analyses with an influence on a dependent variable (birth weight,
BUA, SOS or SI) were listed and used in further analyses. First, several different models with the
influential covariates were tested in multiple regression analyses. Second, more specific pre-final
models were tested for each dependent variable whereby the results are explained below. Finally, all
these previous analyses resulted in final models tested in stepwise multiple regression analyses whose
results are discussed in the scientific article. In all analyses adjustments for age and gender were made.
Table 1 shows five models that were tested for the relationship between birth weight and BUA. The
covariates FFM, %FFM, weight z-score and height z-score were added separately or together,
depending on the model, with the ENTER-method. In general the adjusted R square of all models was
relatively high (between 0.251 and 0.352). Model 1 and model 3 showed problems with
multicollinearity whereby a tolerance measure of ≥0.4 was accepted. A relationship was found
between birth weight and BUA with age as a significant predictor in model 4. Models 2, 4 and 5
showed an influence of age in contrast with the absence of influence of the variable gender. The
anthropometric variables %FFM, height z-score and weight z-score gave, depending on the model,
significant results. Summarized, only models 2, 3 and 5 could be interpreted whereby the influence of
age, %FFM, weight z-score and height z-score are important. This knowledge was used to design five
final and concrete models to use in the scientific article. The influence of birth weight on SOS was
analyzed with two different models in multiple regression analysis and the results are shown in table 2.
Besides age and gender, weight z-score and height z-score were added separately or together
depending on the model. The adjusted R square was 0.359 in model 1 and 0.366 in model 2. No
problem with multicollinearity was observed. Both weight z-score and height z-score proved to be
significant predictors of SOS. With this result, four final models were used in the scientific article.
Five similar models as within the parameter BUA were analyzed for the last bone health parameter SI.
The covariates FFM, %FFM, weight z-score and height z-score were used separately or together, with
the ENTER-method. Overall the adjusted R square was low (between 0.028 and 0.033). Model 1 and 3
could not be interpreted due to the problem of multicollinearity. Apart from age, only %FFM was a
significant predictor of SI. This resulted in three final models used in the scientific article.

22
Table 1. Results of multiple regression analyses using calcaneal BUA (n = 596) as a dependent
variable and various other variables as independent variables
Confounders (ENTER)
Model 1
- Birth weight
- Age
- Gender
- FFM
- Weight z-
score
Model 2
- Birth weight
- Age
- Gender
- % FFM
- Weight z-
score
Model 3
- Birth weight
- Age
- Gender
- % FFM
- Weight z-
score
- Height z-
score
Model 4
- Birth weight
- Age
- Gender
- % FFM
Model 5
- Birth weight
- Age
- Gender
- Weight z-
score
- Height z-
score
Model summary
Durbin-watson
1.927
Adj R square
0.344
ANOVA
F = 63.400
p < 0.001
Durbin-watson
1.924
Adj R square
0.351
ANOVA
F = 65.338
p < 0.001
Durbin-watson
1.929
Adj R square
0.352
ANOVA
F = 54.795
p < 0.001
Durbin-watson
1.912
Adj R square
0.251
ANOVA
F = 50.801
p < 0.001
Durbin-watson
1.939
Adj R square
0.346
ANOVA
F = 64.048
p < 0.001
Predictors
Birth weight
- t = 0.951
- p = 0.342
Age
- t = 4.329
- p < 0.001
Gender
- t = -0.131
- p = 0.896
FFM
- t = 2.629
- p = 0.009
Weight z-score
- t = 3.716
- p < 0.001
Birth weight
- t = 0.957
- p = 0.339
Age
- t = 14.682
- p < 0.001
Gender
- t = -0.007
- p = 0.994
%FFM
- t = 3.645
- p < 0.001
Weight z-score
- t = 9.597
- p < 0.001
Birth weight
- t = 0.876
- p = 0.382
Age
- t = 14.708
- p < 0.001
Gender
- t = -0.164
- p = 0.870
%FFM
- t = 2.517
- p = 0.012
Weight z-score
- t = 4.529
- p < 0.001
Height z-score
- t = 1.303
- p = 0.193
Birth weight
- t = 3.282
- p = 0.001
Age
- t = 13.590
- p < 0.001
Gender
- t = -0.754
- p = 0.451
%FFM
- t = 0.351
- p = 0.726
Birth weight
- t = 0.944
- p = 0.346
Age
- t = 14.934
- p < 0.001
Gender
- t = -1.123
- p = 0.262
Weight z-score
- t = 3.760
- p < 0.001
Height z-score
- t = 2.936
- p = 0.003
Collinearity statistics (tolerance measure ≥0.4 = acceptable)
Age
0.197
FFM
0.149
Weight z-score
0.393
All acceptable Weight z-score
0.280
Height z-score
0.316
All acceptable All acceptable
BUA: Broadband Ultrasound Attenuation; FFM: fat-free mass (lean mass); %FFM: percentage fat-free
mass (lean mass); P-values < 0.05 are indicated in bold

23
Table 2. Results of multiple regression analyses using calcaneal SOS (n = 600) as a dependent variable
and various other variables as independent variables
Confounders (ENTER)
Model 1
- Birth weight
- Age
- Gender
- Weight z-score
Model 2
- Birth weight
- Age
- Gender
- Weight z-score
- Height z-score
Model summary
Durbin-watson
2.102
Adj R square
0.359
ANOVA
F = 84.845
p < 0.001
Durbin-watson
2.095
Adj R square
0.366
ANOVA
F = 70.054
p < 0.001
Predictors
Birth weight
- t = -1.794
- p = 0.073
Age
- t = -14.225
- p < 0.001
Gender
- t = -0.727
- p = 0.468
Weight z-score
- t = -11.241
- p < 0.001
Birth weight
- t = -1.568
- p = 0.117
Age
- t = -14.204
- p < 0.001
Gender
- t = -0.933
- p = 0.351
Weight z-score
- t = -5.579
- p < 0.001
Height z-score
- t = -2.701
- p = 0.007
Collinearity statistics (tolerance measure ≥0.4 = acceptable)
All acceptable All acceptable
SOS: Speed of Sound; P-values < 0.05 are indicated in bold

24
Table 3. Results of multiple regression analyses using calcaneal SI (n = 827) as a dependent variable
and various other variables as independent variables
Confounders (ENTER)
Model 1
- Birth weight
- Age
- Gender
- FFM
- Weight z-
score
Model 2
- Birth weight
- Age
- Gender
- % FFM
- Weight z-
score
Model 3
- Birth weight
- Age
- Gender
- % FFM
- Weight z-
score
- Height z-
score
Model 4
- Birth weight
- Age
- Gender
- % FFM
Model 5
- Birth weight
- Age
- Gender
- Z-score
weight
- Height z-
score
Model summary
Durbin-watson
1.330
Adj R square
0.030
ANOVA
F = 6.112
p < 0.001
Durbin-watson
1.323
Adj R square
0.033
ANOVA
F = 6.641
p < 0.001
Durbin-watson
1.322
Adj R square
0.033
ANOVA
F = 5.619
p < 0.001
Durbin-watson
1.310
Adj R square
0.032
ANOVA
F = 7.864
p < 0.001
Durbin-watson
1.333
Adj R square
0.028
ANOVA
F = 5.696
p < 0.001
Predictors
Birth weight
- t = -1.140
- p = 0.254
Age
- t = 0.843
- p = 0.400
Gender
- t = -0.788
- p = 0.431
FFM
- t = 1.502
- p = 0.134
Weight z-score
- t = -0.824
- p = 0.410
Birth weight
- t = -1.187
- p = 0.235
Age
- t = 4.737
- p < 0.001
Gender
- t = -0.657
- p = 0.511
%FFM
- t = 2.193
- p = 0.029
Weight z-score
- t = 1.311
- p = 0.190
Birth weight
- t = -1.137
- p = 0.256
Age
- t = 4.686
- p < 0.001
Gender
- t = -0.507
- p = 0.612
%FFM
- t = 2.241
- p = 0.025
Weight z-score
- t = 1.353
- p = 0.177
Height z-score
- t = -0.729
- p = 0.466
Birth weight
- t = -0.858
- p = 0.391
Age
- t = 4.761
- p < 0.001
Gender
- t = -0.801
- p = 0.423
%FFM
- t = 1.835
- p = 0.067
Birth weight
- t = -1.089
- p = 0.276
Age
- t = 4.916
- p < 0.001
Gender
- t = -1.624
- p = 0.105
Weight z-score
- t = -0.054
- p = 0.957
Height z-score
- t = 0.536
- p = 0.592
Collinearity statistics
(tolerance measure ≥0.4 = acceptable)
Age
- 0.195
FFM
- 0.143
Weight z-score
- 0.374
All acceptable Weight z-score
- 0.267
Height z-score
- 0.309
All acceptable All acceptable
SI: Stiffness Index; FFM: fat-free mass (lean mass); %FFM: percentage fat-free mass (lean mass); P-
values < 0.05 are indicated in bold

25
Additional points of discussion
A thorough and extensive discussion of this research can be found in the scientific article. The
following paragraphs discuss (1) a brief summary of the main results of this additional report and (2)
additional discussion points including some (3) additional strengths and limitations.
This study investigated the relationship between birth weight and bone strength assessed as calcaneal
BUA, SOS and SI-values measured by QUS in 827 healthy children between 3 and 11 years old. The
main findings of the analyses within this additional report are the existence of many variables that
influence birth weight on the one hand and bone health parameters on the other. Those covariates were
taken into account when analyzing the influence of birth weight on bone health. Gender and age were
defined as confounders and included in all analyses. Pre-final multiple regression analysis showed that
age, %FFM, weight z-score and height z-score act as predictors of bone health assessed by QUS. The
final models are discussed in the scientific article.
Three out of the seven studies investigating the influence of birth weight on bone health in primary
school children adjusted for potential covariates in multiple regression analysis. Steer & Tobias used
three different models. First, adjusting for gestational age, gender and current age of the child gave
similar significant results as this research. After additionally adjusting for parental height and weight,
the relationship persisted, what is in contrast to this study. The researchers additionally adjusted for
current height and weight in a third model whereby the relationship decreased but was still significant
with exception of BMC and bone area [22]. Jones & Dwyer used three models with different
covariates. The researchers started immediately with the adjustment for gender and growth variables
together in a first model whereby a significant influence was found for BMD but not for BMAD.
Similar results as in the first model were obtained after additionally correcting for environmental
factors (e.g. breastfeeding and maternal smoking). In a third model maternal BMD was added, but no
associations remained significant [19]. This is in line with the findings of this study whereby the
association decline or disappear when adding several covariates. The third study that took covariates
into account used two models to analyze a large number of variables at once [23]. Vidulich et al.
adjusted in a first model for the variables bone age, gender, race, SES, current height and weight. No

26
significant associations between birth weight and bone health were found. This finding is in line with
the third model of Jones & Dwyer and the results of this research. After additionally correcting BMC
for bone area (BA), a significant relation between birth weight and BMC femoral neck in 8 year olds
was shown.
Summarized, our research using the radiation-free QUS gave similar results as literature using bone
health parameters assessed by DXA: an association between birth weight and bone health parameters
after correcting for age and sex, but less or no association after correcting for additional confounders
(mainly anthropometric characteristics of the child).
Strengths and limitations
The strength of this study is the availability of a large representative population-based sample of both
Belgian pre-school and primary school boys and girls. The possibility of testing a large battery of
covariates lies in the fact that data on early life factors, environmental and family factors, QUS
measurements and anthropometric measurements were complete for all 827 children. The parental
questionnaire consisted of many variables from information on breastfeeding till the height, weight
and BMI of the parents. Hence the possibility to analyze many models in multivariate regression
analyses.
First important limitation that should be mentioned here again, is the absence of an exact gestational
age per child as this could be an important potential confounder [18, 20, 25, 26]. Besides the
drawbacks mentioned in the research article, some minor limitations can be added. First, exact data
that shows whether the participant is part of a twin or triplet, if they did not all participated in the
study, is missing. Known twins or triplets were excluded, but there is a small chance that other twins
or triplets stayed unnoticed. Second, birth weight was obtained through a parental questionnaire and
the accuracy of this information can be questioned. Overall, these minor flaws will not have much
influence on the results of this study.

27
Conclusion of this additional report
The overall conclusion of this research is written in the scientific article. The conclusion of this
additional report is formulated in the next section. Osteoporosis is a silent epidemic whereby at the
one hand many factors determine the gain of bone early in life linked with the foundation of the
disease and at the other the bone loss later in life linked with the manifestation of the disease. The
present findings support the importance of attaining maximal peak bone mass in healthy children and
adolescents to prevent osteoporosis later in life. In general very few studies investigated the influence
of birth weight on bone health, as a determinant of osteoporosis later in life, in pre-school and primary
school children. This study points towards the importance of a normal birth weight even in healthy
children (including preschool children). Many variables proved to be of influence on bone health and
were used in analyses to purify the relation between birth weight and bone strength assessed by QUS.
Public health strategies should insist also on the importance of an optimal birth weight, through the
mothers’ health and environmental factors, which could positively influence chronic diseases (e.g.
osteoporosis) later in life. Further research could investigate if the findings of this study are consistent
in large study samples when using the QUS method and purifying for potential covariates in statistical
analyses.

28
Choice of journal
Since this master’s thesis is written as a combination of a scientific article and an additional report, a
scientific journal for submission of the article had to be chosen. Possible journals with their impact
factor and scope are presented in appendix 2. Firstly, the journals related to bone metabolism are listed
since that is the main focus variable of this study. Three studies had a relative high impact factor and a
few studies had a strong clinical focus. The journals Calcified Tissue International and Metabolism –
clinical and experimental were preferred. Second, journals related to pediatrics are listed. One journal
has a high impact factor and a few articles have a less relevant scope. The journals European journal
of pediatrics and Child: care, health and development were preferred. Thirdly, a category ‘other’ is
presented with one article related to epidemiological research. In agreement with the promotor of this
master’s thesis, dr. Isabelle Sioen, it was decided to submit the scientific article to Calcified Tissue
International for its focus on bone in many facets. The confirmation of the submission is attached to
the scientific article.

29
Reference List
[1] Holroyd C, Cooper C, Dennison E. Epidemiology of osteoporosis. Best Pract Res Clin
Endocrinol Metab 2008;22:671-85.
[2] Melton LJ, Cooper C. Magnitude and Impact of Osteoporosis and Fractures. In: Marcus R,
Feldman D, Kelsey J, editors. Osteoporosis. San Diego: Academic Press; 2001; p. 557-67.
[3] Prevention and management of osteoporosis. World Health Organ Tech Rep Ser
2003;921:1-164, back.
[4] Genant HK, Cooper C, Poor G, Reid I, Ehrlich G, Kanis J et al. Interim report and
recommendations of the World Health Organization Task-Force for Osteoporosis.
Osteoporos Int 1999;10:259-64.
[5] Rizzoli R, Bonjour JP, Ferrari SL. Osteoporosis, genetics and hormones. J Mol Endocrinol
2001;26:79-94.
[6] Suda T, Ueno Y, Fujii K, Shinki T. Vitamin D and bone. J Cell Biochem 2003;88:259-66.
[7] Saggese G, Baroncelli GI, Bertelloni S. Puberty and bone development. Best Pract Res Clin
Endocrinol Metab 2002;16:53-64.
[8] Beck BR, Shaw J, Snow CM. Physical Activity and Osteoporosis. In: Marcus R, Feldman
D, Kelsey J, editors. Osteoporosis. San Diego: Academic Press; 2001; p. 701-20.
[9] Seeman E. Effects of Tobacco and Alcohol Use on Bone. In: Marcus R, Feldman D, Kelsey
J, editors. Osteoporosis. San Diego: Academic Press; 2001; p. 771-94.
[10] Uusi-Rasi K, Kannus P, Sievanen H. Physical Activity in Prevention of Osteoporosis and
Associated Fractures. In: Marcus R, Feldman D, Kelsey J, editors. Osteoporosis. San Diego:
Academic Press; 2001; p. 837-59.
[11] Bonjour J. Invest in jour bones. How diet, life styles and genetics affect bone development
in young people. Nyon: International Osteoporosis Foundation; 2001.
[12] de Beaufort AJ, van Goudoever JB, van Kaam AHLC. Praktische Kindergeneeskunde
Neonatologie. Houtem: Bohn Stafleu van Loghum; 2007.
[13] Baird J, Kurshid MA, Kim M, Harvey N, Dennison E, Cooper C. Does birthweight predict
bone mass in adulthood? A systematic review and meta-analysis. Osteoporos Int
2011;22:1323-34.
[14] Dennison EM, Syddall HE, Sayer AA, Gilbody HJ, Cooper C. Birth weight and weight at 1
year are independent determinants of bone mass in the seventh decade: the Hertfordshire
cohort study. Pediatr Res 2005;57:582-6.
[15] Oliver H, Jameson KA, Sayer AA, Cooper C, Dennison EM. Growth in early life predicts
bone strength in late adulthood: the Hertfordshire Cohort Study. Bone 2007;41:400-5.
[16] Schlussel MM, Dos S, V, Kac G. Birth weight and adult bone mass: a systematic literature
review. Osteoporos Int 2010;21:1981-91.

30
[17] Yarbrough DE, Barrett-Connor E, Morton DJ. Birth weight as a predictor of adult bone
mass in postmenopausal women: the Rancho Bernardo Study. Osteoporos Int 2000;11:626-
30.
[18] Ganpule A, Yajnik CS, Fall CH, Rao S, Fisher DJ, Kanade A et al. Bone mass in Indian
children--relationships to maternal nutritional status and diet during pregnancy: the Pune
Maternal Nutrition Study. J Clin Endocrinol Metab 2006;91:2994-3001.
[19] Jones G, Dwyer T. Birth weight, birth length, and bone density in prepubertal children:
evidence for an association that may be mediated by genetic factors. Calcif Tissue Int
2000;67:304-8.
[20] Macdonald-Wallis C, Tobias JH, Smith GD, Lawlor DA. Relation of maternal prepregnancy
body mass index with offspring bone mass in childhood: is there evidence for an intrauterine
effect? Am J Clin Nutr 2010;92:872-80.
[21] Micklesfield LK, Levitt NS, Carstens MT, Dhansay MA, Norris SA, Lambert EV. Early life
and current determinants of bone in South African children of mixed ancestral origin. Ann
Hum Biol 2007;34:647-55.
[22] Steer CD, Tobias JH. Insights into the programming of bone development from the Avon
Longitudinal Study of Parents and Children (ALSPAC). Am J Clin Nutr 2011:1S-4S.
[23] Vidulich L, Norris SA, Cameron N, Pettifor JM. Infant programming of bone size and bone
mass in 10-year-old black and white South African children. Paediatr Perinat Epidemiol
2007;21:354-62.
[24] Micklesfield L, Levitt N, Dhansay M, Norris S, van der Merwe L, Lambert E. Maternal and
early life influences on calcaneal ultrasound parameters and metacarpal morphometry in 7-
to 9-year-old children. J Bone Miner Metab 2006;24:235-42.
[25] Ay L, Jaddoe VWV, Hofman A, Moll HA, Raat H, Steegers EAP et al. Foetal and postnatal
growth and bone mass at 6 months: the Generation R Study. Clin Endocrinol 2011;74:181-
90.
[26] Liao XP, Zhang WL, He J, Sun JH, Huang P. Bone measurements of infants in the first 3
months of life by quantitative ultrasound: the influence of gestational age, season, and
postnatal age. Pediatr Radiol 2005;35:847-53.
[27] de Bono S., Schoenmakers I, Ceesay M, Mendy M, Laskey MA, Cole TJ et al. Birth weight
predicts bone size in young adulthood at cortical sites in men and trabecular sites in women
from The Gambia. Bone 2010;46:1316-21.
[28] Saito T, Nakamura K, Okuda Y, Nashimoto M, Yamamoto N, Yamamoto M. Weight gain
in childhood and bone mass in female college students. J Bone Miner Metab 2005;23:69-75.
[29] Leunissen RW, Stijnen T, Hokken-Koelega AC. Influence of birth size on body composition
in early adulthood: the programming factors for growth and metabolism (PROGRAM)-
study. Clin Endocrinol (Oxf) 2009;70:245-51.
[30] El Hage R., Moussa E, Hammoud A, Dandachi G, Jacob C. Birth weight is an independent
determinant of whole body bone mineral content and bone mineral density in a group of
Lebanese adolescent girls. J Bone Miner Metab 2010;28:360-3.

31
[31] Jensen RB, Vielwerth S, Frystyk J, Veldhuis J, Larsen T, Molgaard C et al. Fetal growth
velocity, size in early life and adolescence, and prediction of bone mass: association to the
GH-IGF axis. J Bone Miner Res 2008;23:439-46.
[32] Molgaard C, Larnkjaer A, Mark AB, Michaelsen KF. Are early growth and nutrition related
to bone health in adolescence? The Copenhagen Cohort Study of infant nutrition and
growth. Am J Clin Nutr 2011;94:1865S-9S.
[33] Schlussel MM, de Castro JA, Kac G, da Silva AA, Cardoso VC, Bettiol H et al. Birth weight
and bone mass in young adults from Brazil. Bone 2010;46:957-63.
[34] Binkley TL, Berry R, Specker BL. Methods for measurement of pediatric bone. Rev Endocr
Metab Disord 2008;9:95-106.
[35] Baroncelli GI. Quantitative ultrasound methods to assess bone mineral status in children:
technical characteristics, performance, and clinical application. Pediatr Res 2008;63:220-8.
[36] Sackett DL, Rosenberg WM, Gray JA, Haynes RB, Richardson WS. Evidence based
medicine: what it is and what it isn't. 1996. Clin Orthop Relat Res 2007;455:3-5.
[37] Assendelft WJ, Scholten RJ, van Eijk JT, Bouter LM. [The practice of systematic reviews.
III. Evaluation of methodological quality of research studies]. Ned Tijdschr Geneeskd
1999;143:714-9.
[38] Binkley TL, Berry R, Specker BL. Methods for measurement of pediatric bone. Rev Endocr
Metab Disord 2008;9:95-106.
[39] Baroncelli GI. Quantitative ultrasound methods to assess bone mineral status in children:
technical characteristics, performance, and clinical application. Pediatr Res 2008;63:220-8.
[40] Doreleijers T, Crone E, Jansen L. Biologische ontwikkeling. In: van Aken Marcel, Slot
Wim, editors. Psychologie van de adolescentie. Baarn/Utrecht/Zutphen: ThiemeMeulenhoff;
2010; p. 39-49.
[41] Wang Q, Alen M, Lyytikainen A, Xu L, Tylavsky FA, Kujala UM et al. Familial
resemblance and diversity in bone mass and strength in the population are established during
the first year of postnatal life. J Bone Miner Res 2010;25:1512-20.
[42] El Hage R., Moussa E, Hammoud A, Dandachi G, Jacob C. Birth weight is an independent
determinant of whole body bone mineral content and bone mineral density in a group of
Lebanese adolescent girls. J Bone Miner Metab 2010;28:360-3.
[43] Cameron N, Pettifor J, De WT, Norris S. The relationship of rapid weight gain in infancy to
obesity and skeletal maturity in childhood. Obes Res 2003;11:457-60.
[44] Breukhoven PE, Leunissen RW, de Kort SW, Willemsen RH, Hokken-Koelega AC. Preterm
birth does not affect bone mineral density in young adults. Eur J Endocrinol 2011;164:133-
8.
[45] Ralston SH. Genetic determinants of osteoporosis. Curr Opin Rheumatol 2005;17:475-9.
[46] Rodda Christine. Nutritional Aspects of Disease Affecting the Skeleton. In: Gibney Michael
J., Elia Marinos, Ljungqvist Olle, Dowsett Julie, editors. Clinical Nutrition. Oxford:
Blackwell Science; 2005; p. 294-311.

32
[47] Gracia-Marco L, Vicente-Rodriguez G, Casajus JA, Molnar D, Castillo MJ, Moreno LA.
Effect of fitness and physical activity on bone mass in adolescents: the HELENA Study. Eur
J Appl Physiol 2011;111:2671-80.

33
Appendix
Appendix 1: Analyses of covariates on birth weight, BUA, SOS and SI.
Appendix 2: List of possible scientific journals.

34
Appendix 1: Univariate analyses of covariates on birth weight, BUA, SOS and SI1.
1. On birth weight
Covariates Total group Boys Girls Test
1.1. Pregnancy
Smoking mother
dichotomous (0 and 1)
Dicho_tobacco_pregnancy
t = 2.858
p = 0.004
t = 1.515
p =0.131
t = 2.975
p =0.003
Indep.
T-test
n = 743 n = 387 n = 356
Smoking mother
gradations (0 to 3)
Grad_tobacco_pregnancy
F = 3.118
p = 0.026
F = 1.533
p = 0.217
F = 3.287
p = 0.021
F-test
(ANOVA)
n = 743 n = 387 n = 356
Drinking mother
dichotomous (0 and 1)
Dicho_alcohol_pregnancy
Levene = sign.
p = 0.11
T-test
t = -1.226
p = 0.221
Levene = sign.
p = 0.021
T-test
t = -0.981
p = 0.327
t = -0.673
p = 0.501
Indep.
T-test
n = 742 n = 382 n = 360
Non-Param test
(Mann-Whitney U Test)
Dichot. alcohol mother
p = 0.397 p = 0.423 p = 0.829 NP test
n = 742 n = 382 n = 360
Drinking mother
gradations (0 to 3)
Grad_alcohol_pregnancy
Levene = sign
p = 0.008
Levene = sign
p = 0.035
F = 1.008
p = 0.366
F-test
(ANOVA)
n = 742 n = 382 n = 360
Non-Param test (Kruskal-Wallis
Test) Drinking mother gradations
p = 0.200 p = 0.634 p = 0.267 NP test
n = 742 n = 382 n = 360
C-section
Pregnancy – C-section done
c_section (1 and 2)
Levene = sign.
p = 0.001
T-test
t = -2.854
Levene = sign.
p = 0.001
T-test
t = -2.386
t = -1.556
p = 0.120
Indep.
T-test
1 marked when p ≤ 0.200

35
p = 0.005 p = 0.019
n = 818 n = 421 n = 397
Non-Param test
(Mann-Whitney U Test)
C-section
p = 0.007 p = 0.044 p = 0.088 NP test
n = 818 n = 421 n = 397
Mother’s gained weight
Preg_w_up
r = 0.138
p < 0.001
r = 0.123
p = 0.014
r = 0.166
p = 0.001
Correlate
n = 776 n = 399 n = 377
Age mother at time of delivery
age_birth
r = 0.100
p =0.005
r = 0.114
p = 0.021
r = 0.076
p = 0.136
Correlate
n = 801 n = 414 n = 387
1.2. Shared genetic factors
Height mother
Height_m
r = 0.155
p < 0.001
r = 0.117
p = 0.017
r = 0.208
p < 0.001
Correlate
n = 801 n = 418 n = 383
Height father
Height_f
r = 0.117
p = 0.002
r = 0.125
p = 0.016
r = 0.119
p = 0.031
Correlate
n = 698 n = 368 n = 330
Weight mother
Weight_m
r = 0.161
p < 0.001
r = 0.166
p = 0.001
r = 0.155
p = 0.002
Correlate
n = 789 n = 409 n = 380
Weight father
Weight_f
r = 0.072
p = 0.060
r = 0.102
p = 0.051
r = 0.016
p = 0.774
Correlate
n = 686 n = 363 n = 323
BMI mother
Continuous
r = 0.098
p = 0.006
r = 0.120
p = 0.016
r = 0.065
p = 0.208
Correlate
n = 789 n = 409 n = 380
BMI mother (In 4 groups)
cat_BMI_mother
F = 2.608
p = 0.051
F = 1.912
p = 0.127
F = 1.764
p = 0.154
F-test
(ANOVA)
n = 788 n = 408 n = 380
BMI father
Continuous
r = 0.006
p = 0.883
r = 0.024
p = 0.649
r = -0.045
p = 0.417
Correlate
n = 680 n = 358 n = 322
BMI father (In 4 groups)
cat_BMI_father
F = 0.330
p = 0.804
F = 0.259
p = 0.855
F = 0.074
p = 0.974
F-test
(ANOVA)

36
n = 680 n = 357 n = 321
ISCED parents
Isced_max
F = 2.747
p = 0.018
F = 3.785
p = 0.005
F = 1.414
p = 0.218
F-test
(ANOVA)
n = 782 n = 400 n = 382
Income category
Income_cat
F = 3.054
p = 0.016
F = 3.914
p = 0.004
F = 1.018
p = 0.398
F-test
(ANOVA)
n = 674 n = 349 n = 325
Non-Param test
Kruskal_Wallis test
Income_cat
p = 0.017 p = 0.006 p = 0.269 NP test
n = 674 n = 349 n = 325
1.3. Child
Weeks born too early
Weeksearly
r = -0.560
p < 0.001
r = -0.572
p < 0.001
r = -0.548
p < 0.001
Correlate
n = 328 n = 176 n = 152
Weeks born too early (with
missing = 0) All_weeks_early
r = -0.470
p < 0.001
r = -0.476
p < 0.001
r = -0.482
p < 0.001
Correlate
n = 827 n = 427 n = 400
Gender
Sex_child
t = 5.218
p < 0.001
/ / Indep.
T-test
n = 827 / /
Season_birth F = 2.945
p = 0.032
F = 1.995
p = 0.114
F = 1.659
p = 0.175
F-test
(ANOVA)
n = 827 n = 427 n = 400

37
2. On QUS parameters
2.1. Broadband Ultrasound Attenuation (dB/MHz)
Covariates Total group Boys Girls Test
2.1.1. Birth
Gender
Sex_child
t = 1.845
p = 0.066
/ / Indep.
T-test
n = 596 / /
Birth weight
Birth_w
r = 0.128
p = 0.002
r = 0.129
p = 0.026
r = 0.102
p = 0.077
Correlate
n = 596 n = 297 n = 299
Birth length
Birth_h
r = 0.156
p < 0.001
r = 0.173
p = 0.003
r = 0.121
p = 0.037
Correlate
n = 593 n = 295 n = 298
Birth season
Season_birth
F = 0.073
p = 0.975
F = 0.255
p = 0.858
F = 0.289
p = 0.833
F-test
(ANOVA)
n = 596 n = 297 n = 299
Weeks born too early
Weeksearly
r = -0.005
p = 0.941
r = 0.027
p = 0.770
r = -0.045
p = 0.633
Correlate
n = 237 n = 121 n = 116
Weeks born too early (with missing
values = 0) All_weeks_early
r = -0.022
p = 0.598
r = -0.030
p = 0.608
r = -0.011
p = 0.853
Correlate
n = 596 n = 297 n = 299
Breastfeeding
Months_exclusive_breastfeeding
r = -0.021
p = 0.718
r = 0.009
p = 0.916
r = -0.057
p = 0.488
Correlate
n = 290 n = 142 n = 148
2.1.2. Other variables
Age children
Age
r = 0.489
p < 0.001
r = 0.449
p < 0.001
r = 0.533
p < 0.001
Correlate
n = 596 n = 297 n = 299
Physical activity (Average count per
minute) Avg_cpm
r = -0.050
p = 0.367
r = -0.072
p = 0.357
r = -0.059
p = 0.460
Correlate
n = 329 n = 168 n = 161
Hours of sleep
Sleep_hour
r = -0.212
p < 0.001
r = -0.184
p = 0.013
r = -0.233
p = 0.003
Correlate

38
n = 350 n = 184 n = 166
Calcium
CA_U
r = 0.049
p = 0.375
r = -0.001
p = 0.993
r = 0.088
p = 0.258
Correlate
n = 336 n = 169 n = 167
Phosphate
NANP
r = 0.058
p = 0.287
r = 0.037
p = 0.629
r = 0.060
p = 0.440
Correlate
n = 336 n = 169 n = 167
2.1.3. Anthropometry – body composition
Current height (Cole)
Height_score_cole
r = 0.303
p < 0.001
r = 0.320
p < 0.001
r = 0.279
p < 0.001
Correlate
n = 596 n = 297 n = 299
Current height
height
r = 0.574
p < 0.001
r = 0.540
p < 0.001
r = 0.609
p < 0.001
Correlate
n = 596 n = 297 n = 299
Current height (categories)
Height_cat
Levene = sign.
p = 0.037
Levene = sign.
p = 0.003
F = 1.753
p = 0.175
F-test
(ANOVA)
n = 596 n = 297 n = 299
Non-Param Test (Kruskal-Wallis
test) Height_cat
p = 0.003 p = 0.041 p = 0.098 NP test
n = 596 n = 297 n = 299
Current weight (Cole)
Weight_score_cole
r = 0.293
p < 0.001
r = 0.316
p < 0.001
r = 0.278
p < 0.001
Correlate
n = 596 n = 297 n = 299
Current weight
weight
r = 0.527
p < 0.001
r = 0.173
p = 0.003
r = 0.558
p < 0.001
Correlate
n = 596 n = 295 n = 299
Waist (categories)
Waist_cat_CDC
F = 3.151
p = 0.005
F = 1.059
p = 0.387
F = 3.157
p = 0.005
F-test
(ANOVA)
n = 595 n = 296 n = 299
Non-Param Test (Kruskal-Wallis
test) Waist_cat_CDC
p = 0.008 p = 0.202 p = 0.015 NP test
n = 595 n = 296 n = 299
Waist (Cole)
Waist_score_cole
r = 0.236
p < 0.001
r = 0.238
p < 0.001
r = 0.248
p < 0.001
Correlate
n = 595 n = 296 n = 299
BMI F = 1.636 F = 0.763 F = 1.565 F-test

39
IOTF grade p = 0.148 p = 0.550 p = 0.170 (ANOVA)
n = 596 n = 297 n = 299
BMI (z-score)
Bmi_score_cole
r = 0.163
p < 0.001
r = 0.177
p = 0.002
r = 0.161
p = 0.005
Correlate
n = 596 n = 297 n = 299
Triceps
Fat_tric
r = 0.135
p = 0.001
r = 0.095
p = 0.105
r = 0.283
p < 0.001
Correlate
n = 591 n = 296 n = 295
Subscapular
Fat_scap
r = 0.135
p = 0.001
r = 0.163
p = 0.005
r = 0.176
p = 0.002
Correlate
n = 593 n = 296 n = 297
Sum Triceps & Subscapular
SUMfat_tric_scap
r = 0.145
p < 0.001
r = 0.137
p = 0.018
r = 0.223
p < 0.001
Correlate
n = 590 n = 295 n = 295
Waist/hip ratio
Waist_to_hip
r = -0.170
p < 0.001
r = -0.261
p < 0.001
r = -0.112
p = 0.053
Correlate
n = 595 n = 296 n = 299
Triceps log
Triceps_log
r = 0.117
p = 0.005
r = 0.082
p = 0.158
r = 0.228
p < 0.001
Correlate
n = 591 n = 296 n = 295
Subscapular log
Scapular_log
r = 0.146
p < 0.001
r = 0.187
p = 0.001
r = 0.177
p = 0.002
Correlate
n = 593 n = 296 n = 297
Sum Triceps & Subscapular log
SUMfat_tric_scap_log
r = 0.139
p = 0.001
r = 0.142
p = 0.015
r = 0.217
p < 0.001
Correlate
n = 590 n = 295 n = 295
Waist/hip ratio log
Waist_to_hip_log
r = -0.171
p < 0.001
r = -0.260
p < 0.001
r = -0.115
p = 0.048
Correlate
n = 595 n = 296 n = 299
Fat-free mass (lean mass)
FFM
r = 0.570
p < 0.001
r = 0.560
p < 0.001
r = 0.580
p < 0.001
Correlate
n = 595 n = 297 n = 298
% Fat-free mass (lean mass)
FFM_P
r = 0.083
p = 0.043
r = 0.118
p = 0.042
r = 0.038
p = 0.510
Correlate
n = 595 n = 297 n = 298

40
2.2. Speed of Sound (m/sec)
Covariates Total group Boys Girls Test
2.2.1. Birth
Gender
Sex_child
t = -0.094
p = 0.925
/ / Indep.
T-test
n = 600 / /
Birth weight
Birth_w
r = -0.157
p < 0.001
r = -0.160
p = 0.005
r = -0.158
p = 0.006
Correlate
n = 600 n = 301 n = 299
Birth length
Birth_h
r = -0.151
p < 0.001
r = -0.159
p = 0.006
r = -0.151
p = 0.009
Correlate
n = 597 n = 299 n = 298
Birth season
Season_birth
Levene = sign.
p = 0.013
F = 0.727
p = 0.537
Levene = sign.
p = 0.047
F-test
(ANOVA)
n = 600 n = 301 n = 299
Weeks born too early
Weeksearly
r = -0.028
p = 0.669
r = -0.052
p = 0.563
r = -0.007
p = 0.945
Correlate
n = 240 n = 124 n = 116
Weeks born too early (with missing
values = 0)
All_weeks_early
r = 0.046
p = 0.256
r = 0.013
p = 0.828
r = 0.079
p = 0.171
Correlate
n = 600 n = 301 n = 299
Breastfeeding
Months_exclusive_
breastfeeding
r = -0.027
p = 0.645
r = -0.126
p = 0.134
r = 0.074
p = 0.372
Correlate
n = 292 n = 144 n = 148
2.2.2. Other variables
Age children
Age
r = -0.451
p < 0.001
r = -0.476
p < 0.001
r = -0.430
p < 0.001
Correlate
n = 600 n = 301 n = 299
Physical activity (Average count per
minute) Avg_cpm
r = -0.002
p = 0.965
r = 0.003
p = 0.964
r = -0.026
p = 0.744
Correlate
n = 332 n = 171 n = 161
Hours of sleep
Sleep_hour
r = 0.164
p = 0.002
r = 0.210
p = 0.004
r = 0.110
p = 0.160
Correlate

41
n = 354 n = 188 n = 166
Calcium
CA_U
r = -0.007
p = 0.891
r = -0.021
p = 0.788
r = 0.005
p = 0.953
Correlate
n = 338 n = 171 n = 167
Phosphate
NANP
r = -0.056
p = 0.308
r = -0.052
p = 0.501
r = -0.061
p = 0.433
Correlate
n = 338 n =171 n = 167
2.2.3. Anthropometry – body composition
Current height (Cole)
Height_score_cole
r = -0.356
p < 0.001
r = -0.421
p < 0.001
r = -0.299
p < 0.001
Correlate
n = 600 n = 301 n = 299
Current height
height
r = -0.571
p < 0.001
r = -0.615
p < 0.001
r = -0.533
p < 0.001
Correlate
n = 600 n = 301 n = 299
Current height (categories)
Height_cat
Levene sign.
(p < 0.001)
Levene sign.
(p < 0.001)
F = 1.406
p = 0.034
F-test
(ANOVA)
n = 600 n = 301 n = 299
Non-Param Test (Kruskal-Wallis
test) Height_cat
p < 0.001 p < 0.001 p = 0.012 NP test
n = 600 n = 301 n = 299
Current weight (Cole)
Weight_score_cole
r = -0.377
p < 0.001
r = -0.462
p < 0.001
r = -0.310
p < 0.001
Correlate
n = 600 n = 301 n = 299
Current weight
weight
r = -0.574
p < 0.001
r = -0.630
p < 0.001
r = -0.525
p < 0.001
Correlate
n = 600 n = 301 n = 299
Waist (categories)
Waist_cat_CDC
F = 5.241
p < 0.001
F = 4.748
p < 0.001
F = 1.663
p = 0.130
F-test
(ANOVA)
n = 599 n = 300 n = 299
Non-Param Test (Kruskal-Wallis
test) Waist_cat_CDC
p < 0.001 p < 0.001 p = 0.021 NP test
n = 599 n = 300 n = 299
Waist (Cole)
Waist_score_cole
r = -0.343
p < 0.001
r = -0.458
p < 0.001
r = -0.267
p < 0.001
Correlate
n = 599 n = 300 n = 299
BMI F = 5.929 F = 4.253 F = 2.894 F-test

42
IOTF grade p < 0.001 p = 0.002 p = 0.014 (ANOVA)
n = 600 n = 301 n = 299
BMI (z-score)
Bmi_score_cole
r = -0.257
p < 0.001
r = -0.328
p < 0.001
r = -0.207
p < 0.001
Correlate
n = 600 n = 301 n = 299
Triceps
Fat_tric
r = -0.259
p < 0.001
r = -0.307
p < 0.001
r = -0.266
p < 0.001
Correlate
n = 595 n = 300 n = 297
Subscapular
Fat_scap
r = -0.216
p < 0.001
r = -0.332
p <0.001
r = -0.188
p = 0.001
Correlate
n = 597 n = 300 n = 297
Sum Triceps & Subscapular
SUMfat_tric_scap
r = -0.257
p < 0.001
r = -0.351
p < 0.001
r = -0.246
p < 0.001
Correlate
n = 594 n = 299 n = 295
Waist/hip ratio
Waist_to_hip
r = 0.161
p < 0.001
r = 0.284
p < 0.001
r = 0.077
p = 0.186
Correlate
n = 599 n = 300 n = 299
Triceps log
Triceps_log
r = -0.254
p < 0.001
r = -0.301
p < 0.001
r = -0.256
p < 0.001
Correlate
n = 595 n = 300 n = 295
Subscapular log
Scapular_log
r = -0.257
p < 0.001
r = -0.373
p < 0.001
r = -0.209
p < 0.001
Correlate
n = 597 n = 300 n = 297
Sum Triceps & Subscapular log
SUMfat_tric_scap_log
r = -0.273
p < 0.001
r = -0.367
p < 0.001
r = -0.250
p < 0.001
Correlate
n = 594 n = 299 n = 295
Waist/hip ratio log
Waist_to_hip_log
r = 0.163
p < 0.001
r = 0.286
p < 0.001
r = 0.079
p = 0.173
Correlate
n = 599 n = 300 n = 299
Fat-free mass (lean mass)
FFM
r = -0.552
p < 0.001
r = -0.633
p < 0.001
r = -0.502
p < 0.001
Correlate
n = 599 n = 301 n = 298
% Fat-free mass (lean mass)
FFM_P
r = 0.041
p = 0.316
r = 0.073
p = 0.208
r = 0.038
p = 0.517
Correlate
n = 599 n = 301 n = 298

43
2.3. Stiffness Index
Covariates Total group Boys Girls Test
2.3.1. Birth
Gender
Sex_child
t = 1.661
p = 0.097
/ / Indep.
T-test
n = 827 / /
Birth weight
Birth_w
r = -0.024
p = 0.496
r = -0.017
p = 0.729
r = -0.055
p = 0.271
Correlate
n = 827 n = 427 n = 400
Birth length
Birth_h
r = 0.003
p = 0.926
r = 0.025
p = 0.610
r = -0.040
p = 0.422
Correlate
n = 823 n = 425 n = 398
Birth season
Season_birth
F = 1.982
p = 0.115
F = 1.171
p = 0.320
F = 2.528
p = 0.057
F-test
(ANOVA)
n = 827 n = 427 n = 400
Weeks born too early
Weeksearly
r = -0.021
p = 0.703
r = -0.15
p = 0.847
r = -0.032
p = 0.699
Correlate
n = 328 n = 176 n = 152
Weeks born too early (with missing
values = 0) All_weeks_early
r = 0.016
p = 0.649
r = -0.25
p = 0.604
r = 0.061
p = 0.226
Correlate
n = 827 n = 427 n = 400
Breastfeeding
Months_exclusive_breastfeeding
r = 0.029
p = 0.560
r = -0.003
p = 0.968
r = 0.074
p = 0.297
Correlate
n = 395 n = 194 n = 201
2.3.2. Other variables
Age children
Age
r = 0.171
p < 0.001
r = 0.187
p < 0.001
r = 0.151
p = 0.003
Correlate
n = 827 n = 427 n = 400
Physical activity (average
count/min) Avg_cpm
r = 0.014
p = 0.749
r = 0.015
p = 0.808
r = -0.009
p = 0.889
Correlate
n = 490 n = 257 n = 233
Hours of sleep
Sleep_hour
r = -0.122
p = 0.017
r = -0.117
p = 0.094
r = -0.126
p = 0.097
Correlate
n = 382 n = 207 n = 175
Calcium r = 0.035 r = -0.007 r = 0.074 Correlate

44
CA_U p = 0.435 p = 0.914 p = 0.251
n = 506 n = 265 n = 241
Phosphate
NANP
r = -0.010
p = 0.820
r = -0.038
p = 0.541
r = 0.003
p = 0.962
Correlate
n = 506 n = 265 n = 241
2.3.3. Anthropometry – body composition
Current height (Cole)
Height_score_cole
r = 0.016
p = 0.649
r = 0.015
p = 0.753
r = 0.011
p = 0.822
Correlate
n = 827 n = 427 n = 400
Current height
height
r = 0.153
p < 0.001
r = 0.165
p = 0.001
r = 0.134
p = 0.007
Correlate
n = 827 n = 427 n = 400
Current height (categories)
Height_cat
Levene = sign. F = 0.349
p = 0.705
F = 0.698
p = 0.498
F-test
(ANOVA)
n = 827 n = 427 n = 400
Non-Param Test (Kruskal-Wallis
test) Height_cat
p = 0.577 p = 0.719 p = 0.429 NP test
n = 827 n = 427 n = 400
Current weight (Cole)
Weight_score_cole
r = 0.005
p = 0.879
r = 0.012
p = 0.808
r = -0.002
p = 0.971
Correlate
n = 827 n = 427 n = 400
Current weight
weight
r = 0.111
p = 0.001
r = 0.129
p = 0.008
r = 0.092
p = 0.067
Correlate
n = 827 n = 427 n = 400
Waist (categories)
Waist_cat_CDC
F = 0.632
p = 0.705
F = 0.523
p = 0.791
F = 0.822
p = 0.554
F-test
(ANOVA)
n = 824 n = 425 n = 399
Non-Param Test (Kruskal-Wallis
test) Waist_cat_CDC
p = 0.529 p = 0.527 p = 0.724 NP test
n = 824 n = 425 n = 399
Waist (Cole)
Waist_score_cole
r = 0.005
p = 0.879
r = -0.002
p = 0.962
r = 0.014
p = 0.782
Correlate
n = 824 n = 425 n = 399
BMI
IOTF grade
F = 0.290
p = 0.919
F = 0.714
p = 0.582
F = 0.400
p = 0.849
F-test
(ANOVA)
n = 827 n = 427 n = 400

45
BMI (z-score)
Bmi_score_cole
r = -0.014
p = 0.686
r = -0.007
p = 0.892
r = -0.019
p = 0.702
Correlate
n = 827 n = 427 n = 400
Triceps
Fat_tric
r = -0.042
p = 0.234
r = -0.049
p = 0.311
r = -0.006
p = 0.905
Correlate
n = 820 n = 426 n = 394
Subscapular
Fat_scap
r = -0.006
p = 0.863
r = 0.002
p = 0.960
r = 0.015
p = 0.764
Correlate
n = 819 n = 426 n = 393
Sum Triceps & Subscapular
SUMfat_tric_scap
r = -0.027
p = 0.450
r = -0.028
p = 0.570
r = 0.005
p = 0.920
Correlate
n = 815 n = 425 n = 390
Waist/hip ratio
Waist_to_hip
r = -0.014
p = 0.694
r = -0.012
p = 0.810
r = -0.024
p = 0.630
Correlate
n = 824 n = 425 n = 399
Triceps log
Triceps_log
r = -0.060
p = 0.084
r = -0.073
p = 0.131
r = -0.015
p = 0.764
Correlate
n = 820 n = 426 n = 394
Subscapular log
Scapular_log
r = -0.030
p = 0.396
r = -0.015
p = 0.765
r = -0.010
p = 0.837
Correlate
n = 819 n = 426 n = 393
Sum Triceps & Subscapular log
SUMfat_tric_scap_log
r = -0.048
p = 0.169
r = -0.048
p = 0.323
r = -0.013
p = 0.799
Correlate
n = 815 n = 425 n = 390
Waist/hip ratio log
Waist_to_hip_log
r = -0.010
p = 0.777
r = -0.004
p = 0.930
r = -0.024
p = 0.632
Correlate
n = 824 n = 425 n = 417
Fat-free mass (lean mass)
FFM
r = 0.164
p < 0.001
r = 0.181
p < 0.001
r = 0.128
p = 0.010
Correlate
n = 824 n = 427 n = 397
% Fat-free mass (lean mass)
FFM_P
r = 0.094
p = 0.007
r = 0.129
p = 0.008
r = 0.057
p = 0.261
Correlate
n = 824 n = 427 n = 397

46
Appendix 2: List of possible scientific journals.
Name Impact-
factor Scope
Bone
Journal of bone and
mineral research
7.059
too high
The biology and physiology of bone, hormones that regulate
bone and mineral metabolism, and the pathophysiology and
treatment of disorders of bone and mineral metabolism.
Osteoporosis
international
4.859
too high
- The diagnosis, prevention, treatment and management of
osteoporosis and other metabolic bone diseases.
- While focusing on clinical research, the Journal will also
accept submissions on more basic aspects of research,
where they are considered by the editors to be relevant to
the human disease spectrum.
Bone 4.601
too high
- Cell and molecular biology of bone cells
- Bone and bone disease; trauma and stress
- Therapeutic agents; physical studies of calcium and bone
- Radiology of bone; metabolism of bone matrix and
mineral ; mechanisms of normal and disordered
calcification
Clinical studies/pathology
Calcified Tissue
International
2.759 - Structure and function of bone
- Connective tissues and cells, ion transport, and
metabolism of hormones, nutrition, mineralized tissue
ultrastructure, molecular biology, and research on humans
which reveal important facets of the skeleton or bear
upon bone and mineral metabolism
Journal of bone and
mineral metabolism
2.238 - Relevant issues in bone and mineral research.
- The journal is aimed at researchers and clinicians
dedicated to improvements in research, development,
and patient-care in the fields of bone and mineral
metabolism.
Clinical focus
Metabolism –
clinical and
experimental
2.538 Studies in humans, animal and cellular models. Work with
strong translational potential is prioritized. incl.:
- Energy Expenditure and Obesity
- Metabolic Syndrome and Diabetes
- Nutrition, Exercise, and the Environment
- Genetics, Proteomics, and Metabolomics
- Carbohydrate, Lipid, and Protein Metabolism
- Endocrinology and Hypertension
- Mineral and Bone Metabolism
- Cardiovascular Diseases and Malignancies
Journal of
osteoporisis
/ Open-access
Clinical
endocrinology
A number of
articles from the
literature review
were published in
this journal.
3.323 - Papers and reviews which focus on the clinical aspects of
endocrinology, incl. the clinical application of molecular
endocrinology.
- Essential reading not only for those engaged in
endocrinological research but also for those involved
primarily in clinical practice
Apparently not only clinical studies.

47
Child
Pediatrics 5.391
too high
- Original Research Articles, Clinical and Laboratory
Observations (case reports), reviews of Medical Progress
in pediatrics and related fields, Grand Rounds
(clinicopathologic conferences [CPC] or didactic
discussions), Invited Commentaries, Special Articles,
Association of Medical School Pediatric Department
Chairs, Inc. (AMSPDC) commentaries, Insights, Letters
to the Editor, and Supplements.
- Related fields such as nutrition, surgery, dentistry, public
health, child health services, human genetics, basic
sciences, psychology, psychiatry, education, sociology,
and nursing.
Academic pediatrics 2.597 - To strengthen the research and educational base of
academic general pediatrics.
- Leadership in pediatric education, research, patient care
and advocacy. Content areas include pediatric education,
emergency medicine, injury, abuse, behavioral pediatrics,
holistic medicine, child health services and health policy
and the environment.
- Research relating to the quality of child health care,
health care policy and the organization of child health
services.
Less relevant
European journal of
pediatrics
1.644 - Covering the field of pediatrics in all its aspects
- Original papers, reviews, research letters, and letters
- Subject areas: cardiology, dermatology, endocrinology,
gastroenterology, growth and development, hematology
and oncology, immunology and allergology, infectious
diseases, intensive care medicine, medical genetics and
metabolic diseases, neonatology, nephrology and urology,
neuropediatrics, nutrition, pneumology, preventive
pediatrics and epidemiology, and psychology.
Relevant
Child: care, health
and development
1.308 - All aspects of the health and development of children and young people (quantitative and qualitative research)
- From all disciplines working in child health and child
development.
- A forum for discussion of global child health issues and
are happy to publish both primary research and
systematic reviews.
We welcome submissions concerned with:
- The health of children and young people
- Physical, psychomotor, emotional and social
development
- Social and environmental factors, including the
family, affecting health and development
- Evaluation of specific interventions for children
- Government policies and the organization of services
Relevant
Journal of pediatrics
and child health
1.221 - All aspects of hospital/community paediatrics and
neonatology
- Emphasis: clear, concise presentation of information of
direct clinical relevance to both hospital and

48
community-based paediatricians.
- Focused primarily on the Asia Pacific region, the Journal
attracts readers and contributors from more than 30
countries.
Clinical pediatrics 0.896 A peer-reviewed monthly journal, is a must read for the busy
pediatrician. CLP contains state-of-the-art, accurate, concise
and down-to earth information on practical, everyday child
care topics whether they are clinical, scientific, behavioral,
educational, or ethical.
Less relevant
Pediatrics
international
0.755 - Japan Pediatric Society,
- Improvement of child health delivery for the benefit of
children everywhere through facilitation of the sharing
ideas, experiences and achievements.
No clear description
Journal of Child
Health Care
0.673 - Journal of Child Health Care is a professionally focused,
peer reviewed journal which addresses child health issues
from a multi-disciplinary perspective.
- Critical understanding of the neonate, child and
adolescent in health and illness.
- Children = ‘as a part of the community in which we live
and considers health issues arising from it.’
Other
Paediatric and
Perinatal
Epidemiology
An article from
the literature review
was published in this
journal.
1.928 Crosses the boundaries between the epidemiologist and the
paediatrician, obstetrician or specialist in child health,
ensuring that important paediatric and perinatal studies reach
those clinicians for whom the results are especially relevant.
Epidemiological aspect